Exhibit 99.1
Exhibit 99.1
LAND ACKNOWLEDGEMENT
We acknowledge that Manitoba is located on the Treaty Territories and ancestral lands of the Anishinaabeg, Anishininewuk, Dakota Oyate, Denesuline and Nehethowuk Nations.
We acknowledge Manitoba is located on the National Homeland of the Red River Métis.
We acknowledge northern Manitoba includes lands that were and are the ancestral lands of the Inuit.
PROVINCE OF MANITOBA ANNUAL REPORT
AND PUBLIC ACCOUNTS
MARCH 31, 2026


Her Honour the Honourable Anita R. Neville, P.C., O.M.
Lieutenant-Governor of the Province of Manitoba
May It Please Your Honour:
I have the privilege of presenting, for the information of Your Honour, the Annual Report of the Province of Manitoba for the year ended March 31, 2026. This document completes the government’s accountability reporting for the year. The Report includes a review of the year’s results relative to the government’s budget. It also contains statistics and indicators of the financial health of the Province.
Included in this Annual Report are the year-end review, management’s financial statement discussion and analysis, the summary financial statements and the statutory reporting required in the Public Accounts.
Original signed by
Honourable Adrien Sala
Minister of Finance
Office of the Minister of Finance
September 2026
TABLE OF CONTENTS
6
Where Does My Money Go?
Revenue and Expenses at a Glance
7
Introduction to the Annual Report
15
Budget Outcomes and Strategic
Infrastructure Investments
16
Budget Outcomes
26
Strategic Infrastructure Investments
29
Public Accounts of Manitoba
31
Introduction to the Public Accounts of Manitoba
32
Financial Statement Discussion and Analysis
41
Variance Analysis and Assessment of
Significant Trends
57
Summary Financial Statements
133
Information Provided Under Statutory
Requirement
245
Glossary of Key Terms
REVENUE AND EXPENSES AT A GLANCE

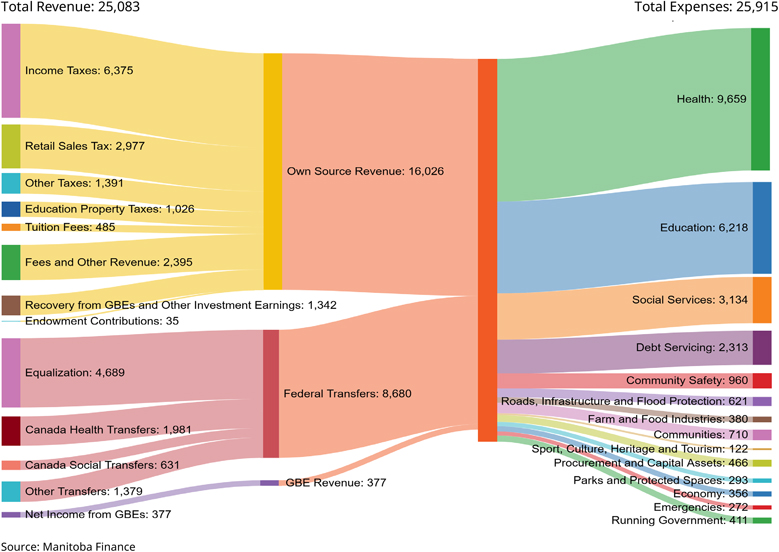
The Manitoba government manages more than $25 billion of revenue, including both own-source revenue and federal transfers that support departments and other reporting entities.
As shown below, provincial revenue is received from 13 different sources and allocated to departments, their agencies and other government-funded entities. In 2025/26, expenses exceeded revenue by over $800 million.
Health care represents the largest share of provincial spending, accounting for approximately 37 per cent (or about $10 billion) of total expenses.
Manitoba’s provincial net debt, defined as total liabilities minus financial assets, was $36.5 billion in 2025/26. The annual debt servicing costs are $2.3 billion.
Manitoba Revenue and Expenses, 2025/26
($ millions)
6 PROVINCE OF MANITOBA ANNUAL REPORT AND PUBLIC ACCOUNTS 2026
INTRODUCTION TO THE ANNUAL REPORT
Manitoba’s Annual Report and Public Accounts, for the fiscal year ending March 31, 2026, reflects the net financial result of the year’s operations for the Manitoba government. The government reporting entity includes government departments, other reporting entities, government business enterprises and partnerships.
2025/26 Financial Results Explained:
Fiscal Position
For the year ending March 31, 2026, the government is reporting a summary deficit of $832 million which is in line with Budget 2025. This represents a year-over-year decrease of $284 million, or 25.4 per cent, compared to the previous year’s restated deficit of $1,116 million.
Total summary revenue is $27 million above budget. This increase is primarily driven by a $558 million increase in taxation revenue, an $80 million increase in recovery from government business enterprises and other investment earnings, a $35 million increase in endowment contributions and a $33 million increase in fees and other revenue. These increases are partially offset by a $629 million decrease in net income from government business enterprises and a
$250 million decrease in federal transfers. Budget 2025 included a $200 million revenue contingency which lessened the impact of the decreases.
Total summary expenses are $65 million higher than budget. Higher-than-planned spending in Emergency expenditures and Health, Seniors and Long-Term Care, along with year-end adjustments resulting in over expenditures in Environment and Climate Change, Families and Advanced Education and Training, are partially offset by lower expenditures across most other departments. The largest expenditure reductions are in Agriculture and Municipal and Northern Relations which are offset by corresponding decreases in revenue.
Government net debt, defined as total liabilities minus financial assets, is a key indicator of fiscal sustainability. Changes in net debt reflect changes in the deficit as well as capital investments and asset retirement obligations. Net debt is $39 million higher than budget. Manitoba’s net debt-to-GDP ratio is 36.4 per cent, a decrease of 0.5 percentage points from the budget estimate of 36.9 per cent.
Debt servicing costs are $24 million below budget, totalling $2,313 million.
| At a Glance: Financial Results |
($ millions) | |||||||||||||||||||
| 2026 | 2025 | Change from | ||||||||||||||||||
| |
Budget Restated |
|
Actual | Restated | Budget | 2025 | ||||||||||||||
| Revenue |
25,056 | 25,083 | 24,377 | 27 | 706 | |||||||||||||||
| Expenses |
23,513 | 23,602 | 23,177 | 89 | 425 | |||||||||||||||
| Debt servicing |
2,337 | 2,313 | 2,316 | (24) | (3) | |||||||||||||||
| Operating surplus (deficit) |
(794) | (832) | (1,116) | (38) | 284 | |||||||||||||||
| Net debt |
36,500 | 36,539 | 35,158 | 39 | 1,381 | |||||||||||||||
| Net debt to GDP |
36.9% | 36.4% | 36.6% | (0.5) | (0.2) | |||||||||||||||
INTRODUCTION TO THE ANNUAL REPORT 7
2025/26 Financial Results Explained: Economic Factors
Budget 2025 included a downside tariff scenario, which forecasted that GDP could decline by $3.6 billion, or 3.8 per cent. In light of global trade tensions, Manitoba’s economy proved resilient, particularly in the labour market.
The Manitoba economy demonstrated resilience through the 2025/26 fiscal year despite a challenging global environment. Continued strength in the labour market supported economic activity, while uncertainty related to international trade, U.S. tariffs, and the conflict in the Middle East weighed on business confidence and the economic outlook. Although growth was softer than anticipated in Budget 2025, Manitoba’s diverse economic base continued to provide some stability amid elevated external risks.
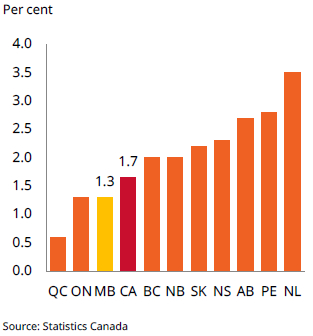
After adjusting for inflation, Manitoba’s real gross domestic product (GDP) at basic prices expanded by 1.3 per cent in 2025, below Canada’s average of 1.7 per cent. Real GDP growth in 2025 was below the expectation of 1.7 per cent forecasted in Budget 2025. Manitoba’s nominal GDP growth is now estimated at 4.3 per cent for 2025, up from the 3.6 per cent projected in Budget 2025. The stronger nominal GDP outlook more than offsets the softer expectation for real economic growth.
Annual Growth in Real Gross Domestic Product at Basic Prices, 2025
Manitoba’s economic growth in 2025 was supported by broad-based gains across most industries, with both goods-producing and service-producing sectors contributing to overall growth. The agriculture, forestry, fishing, and hunting industry recorded the strongest growth, increasing by 8.8 per cent following a decline in 2024. This rebound likely reflects improved crop production levels following weaker conditions in the previous year. The construction industry also recorded robust growth (+5.2 per cent), mainly driven by public-sector capital investments. Furthermore, retail trade increased 2.6 per cent from the previous year, reflecting ongoing consumer spending activity. On the other hand, utilities recorded the largest decline among all industries, falling by 6.0 per cent in 2025, and marking a third consecutive annual decrease. This decline is consistent with Manitoba Hydro’s reported challenges related to below-average water conditions that have reduced export sales and increased the demand for imported power. The manufacturing industry also declined by 3.5 per cent, reflecting continued trade-related uncertainty amid a volatile global economic environment. Nevertheless, growth across most industries supported Manitoba’s overall economic expansion in 2025.
8 PROVINCE OF MANITOBA ANNUAL REPORT AND PUBLIC ACCOUNTS 2026
Annual Growth in Real Gross Domestic Product at Basic Prices by Industry, Manitoba, 2025
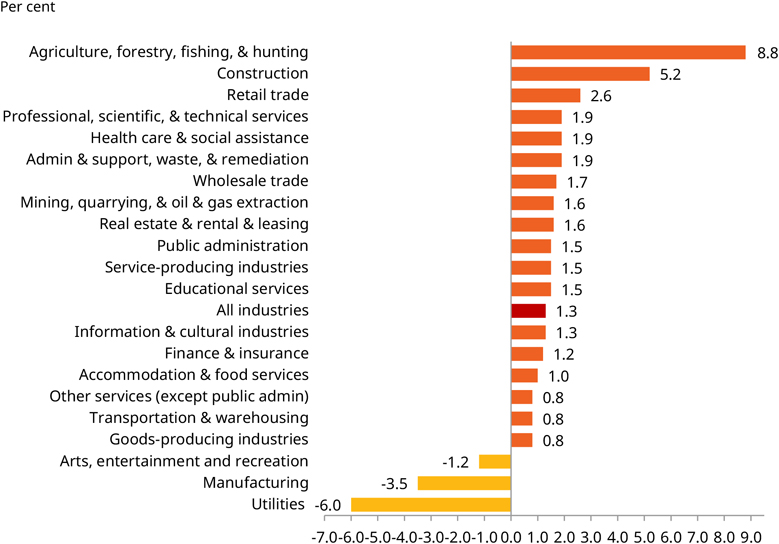
Source: Statistics Canada
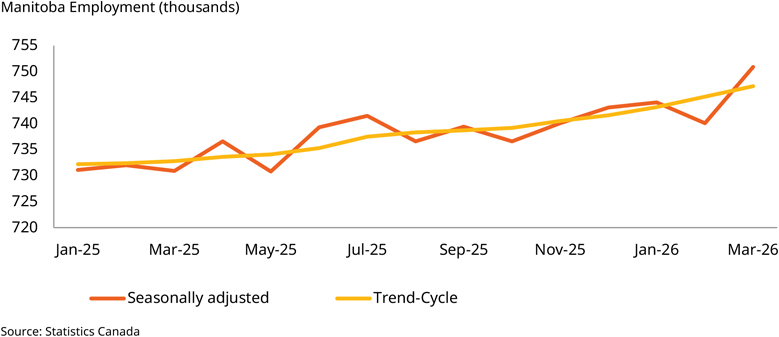
Employment in Manitoba increased by 1.6 per cent in 2025. While this figure is slightly below the 1.7 per cent growth forecasted in Budget 2025, the trend-cycle indicates continued employment gains throughout the 2025/26 fiscal year. Manitoba’s unemployment rate was 5.9 per cent for 2025, slightly higher than the 5.8 per cent forecasted in Budget
2025, but third lowest among Canadian provinces and lower than Canada’s average of 6.8 per cent. Employee earnings continued to increase. Manitoba’s average weekly earnings increased by 2.5 per cent in 2025, after rising by 3.6 per cent in 2024. From January 2026 to March 2026, the average hourly wage rate was up by 1.4 per cent from the same period in 2025.
INTRODUCTION TO THE ANNUAL REPORT 9
Manitoba Employment, Seasonally Adjusted & Trend-Cycle
March 2025 to March 2026
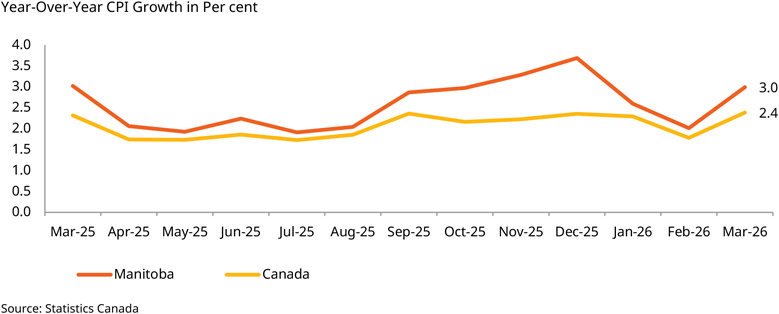
Consumer inflation, as measured by Statistics Canada’s all-items consumer price index (CPI), rose by 2.7 per cent on average in 2025 – higher than the 2.0 per cent forecasted in Budget 2025, and above the Canadian average of 2.1 per cent, though still within the Bank of Canada’s (BoC) target range of 1.0 to 3.0 per cent. Manitoba’s relatively higher inflation was partially attributable to higher property taxes and other special charges, driven by municipalities and school divisions, which increased in October 2025 due to higher sewer charges associated with wastewater treatment infrastructure upgrades and increases in garbage collection fees in Winnipeg. Temporary factors
also influenced inflation developments through late 2025 and into early 2026. Notably, the federal GST/HST holiday lowered consumer prices for a variety of items between December 2024 and February 2025, which subsequently contributed to higher year-over-year inflation between December 2025 and February 2026 through a base effect. Additionally, energy prices became more volatile in early 2026 amid escalating conflict in the Middle East, placing upward pressure on gasoline prices and contributing to broader inflationary pressures across Canada.
Consumer Price Index, All-Items, Manitoba & Canada, March 2025 to March 2026
10 PROVINCE OF MANITOBA ANNUAL REPORT AND PUBLIC ACCOUNTS 2026
Against this backdrop, the BoC continued its monetary easing cycle at the beginning of the year, lowering the overnight rate to 2.75 per cent in March 2025. While uncertainty surrounding U.S. trade policy increased, inflation remained close to the BoC’s 2.0 per cent target, leading the BoC to hold the policy rate through the spring and summer of 2025. Additional quarter-point reductions in September and October brought the policy rate to 2.25 per cent, where it remained through the end of the 2025/26 fiscal year. The BoC indicated that it was balancing downside risks to economic growth against upward inflationary pressures arising from tariffs, supply-chain disruptions, and geopolitical developments. At the same time, the BoC emphasized its commitment to maintaining price stability.
2025/26 Financial Results Explained: Revenue
Overall, revenue is $27 million higher than budget. The increase is driven by increases in taxation revenue, recovery from government business enterprises (GBEs) and other investment earnings, endowment contributions, and fees and other revenue partially offset by a decrease in net income from GBEs due to the negative year-end result for Manitoba Hydro and a net decrease in federal transfers.
| Key Changes to 2025/26 |
||||
| Revenue |
($ | millions) | ||
| Summary budget – revenue |
25,056 | |||
| Taxation revenue |
||||
| Individual income tax |
217 | |||
| Corporation income tax |
124 | |||
| Other taxes |
217 | |||
| Total changes in taxation revenue |
558 | |||
| Fees and other revenue |
33 | |||
| Federal transfers |
(250) | |||
| Government business enterprises (GBEs) |
(629) | |||
| Endowment contributions |
35 | |||
| Recovery from GBEs and other investment earnings |
80 | |||
| Contingency |
200 | |||
| Net increase in revenue |
27 | |||
| 2025/26 revenue |
25,083 | |||
Individual income tax revenue is $217 million, or 4.4 per cent, higher than budget due to higher tax assessments from the Canada Revenue Agency (CRA) for the 2025 tax year relative to the estimates used for Budget 2025 and a positive prior year adjustment.
Corporation income tax revenue is $124 million, or 11.6 per cent, higher than budget due to an improvement in CRA 2025 corporate tax assessments relative to estimates used for Budget 2025.
Other taxes is $217 million, or 4.2 per cent higher than budget, primarily due to higher retail sales tax reflecting strong household spending on services, higher corporations taxes due to stronger profitability in the mining sector, higher education property taxes, higher fuel taxes reflecting stronger household fuel consumption, higher health and education levy revenues due to stronger compensation growth, and higher vaping tax revenues.
Fees and other revenue is $33 million, or 1.2 per cent, higher than budget largely due to an increase in pharmaceutical rebates and non-insured patient revenue and recoveries in the health sector partially offset by a decrease in Manitoba Agricultural Services Corporation revenue.
INTRODUCTION TO THE ANNUAL REPORT 11
Federal transfers are $250 million, or 2.8 per cent, lower than budget mostly due to a decrease in revenue related to the Early Learning and Child Care and the Investing in Canada Infrastructure Program bilateral agreements.
Net income from government business enterprises is $629 million, or 62.5 per cent, lower than budget mainly reflecting a decline in net income from Manitoba Hydro.
Manitoba Hydro-Electric Board reported a net loss of $446 million, a decrease of $666 million from budget, primarily due to the drought conditions causing low reservoir storage levels, coupled with precipitation levels among the lowest on record during the summer months, resulting in lower export revenues and higher fuel and power purchase costs. Domestic electric revenue was also lower than budget due to lower consumption. Domestic gas revenue was lower
than budget due to the cancellation of the Federal Carbon Charge during the year.
Manitoba Public Insurance Corporation reported net income of $56 million, an increase of $47 million from budget. The increase is primarily due to higher volume of basic insurance policies in force, partially offset by lower commercial insurance demand, lower investment income and higher corporate operating expenses.
Manitoba Liquor and Lotteries Corporation reported net income of $724 million, a decrease of $13 million from budget. The decrease is primarily due to softening video lottery performance consistent with other jurisdictions and decreases in liquor sales driven by lower per capita consumption, offset by higher revenues from cannabis, casinos and online gaming.
The following table summarizes the results of the GBEs:
| Net Income from Government Business Enterprises (GBEs) |
($ millions) | |||||||||||
| 2025/26 Budget |
2025/26 Actual |
2024/25 Actual |
||||||||||
| Manitoba Liquor and Lotteries Corporation |
737 | 724 | 730 | |||||||||
| Deposit Guarantee Corporation of Manitoba |
40 | 43 | 39 | |||||||||
| Manitoba Hydro-Electric Board |
220 | (446) | (63) | |||||||||
| Manitoba Public Insurance Corporation |
9 | 56 | (19) | |||||||||
| Total net income from GBEs |
1,006 | 377 | 687 | |||||||||
Recovery from GBEs and other investment earnings are $80 million over budget due to higher than anticipated investment earnings.
2025/26 Financial Results Explained: Expenses
Expenses are $65 million above budget. Higher-than-planned spending in emergency expenditures and Health, Seniors and Long-Term Care, along with year-end adjustments resulting in over expenditures in Environment and Climate Change, Families and Advanced Education and Training is partially offset by lower expenditures across most other departments.
To accommodate the increased expenses in the health sector and emergency expenditures related to the wildfire response, a special warrant was issued in December followed by a second special warrant in
February. The special warrants provided $250 million in additional operating expenditure authority for Manitoba Health, Seniors and Long-Term Care and $350 million in additional operating expenditure authority for enabling appropriations to accommodate costs related to wildfires. The over expenditures in Environment and Climate Change, Families and Advanced Education and Training were caused by year-end adjustments and did not require additional expenditure authority.
12 PROVINCE OF MANITOBA ANNUAL REPORT AND PUBLIC ACCOUNTS 2026
| Additional Expenditure Authority |
($ | millions) | ||
| Health, Seniors and Long-Term Care |
250 | |||
| Enabling appropriations |
350 | |||
| Total additional expenditure authority |
600 | |||
| Key Changes to 2025/26 Expenses |
($ | millions) | ||
| Summary budget - expenses |
25,850 | |||
| Expense variances: |
||||
| Emergency expenditures |
222 | |||
| Families |
99 | |||
| Environment and Climate Change |
77 | |||
| Health, Seniors and Long-Term Care |
65 | |||
| Advanced Education and Training |
46 | |||
| Agriculture |
(170) | |||
| Municipal and Northern Relations |
(83) | |||
| Enabling appropriations |
(74) | |||
| Justice |
(34) | |||
| Tax credits |
(28) | |||
| Debt servicing |
(24) | |||
| Other net changes |
(31) | |||
| Net increase in expenses |
65 | |||
| 2025/26 expenses |
25,915 | |||
Emergency expenditures’ variance of $222 million over budget is almost entirely due to costs of responding to the 2025 wildfire season, which was one of the most severe in the province’s history, with 445 fires burning over 2.38 million hectares resulting in one of Manitoba’s largest-ever evacuation operations. Note that the $222 million does not include $54 million in wildfire-related costs incurred by Natural Resources and Indigenous Futures, for a total response cost of $321 million.
| Summary of Manitoba’s Response to Unprecedented Wildfires in 2025 |
($ | millions) | ||
| Emergency expenditures: |
||||
| Wildfire suppression |
175 | |||
| Evacuee related costs |
80 | |||
| Disaster Financial Assistance (DFA) program and other operating costs |
12 | |||
| Subtotal emergency expenditures wildfire costs* |
267 | |||
| Natural Resources and |
||||
| Indigenous Futures: |
||||
| Manitoba Wildfire Service |
40 | |||
| Wildfire suppression |
14 | |||
| Subtotal Natural Resources and |
||||
| Indigenous Futures wildfire costs |
54 | |||
| Total cost of Manitoba’s 2025 wildfire response |
321 | |||
*Emergency expenditures include $5 million of non-wildfire related costs bringing the total emergency expenditure for the year to $272 million.
Families variance of $99 million over budget is primarily due to one-time year-end adjustments.
Environment and Climate Change’s variance of $77 million over budget is mainly due to provisions for one-time year-end adjustments.
Several factors contributed to the $65 million increase in Health, Seniors and Long-Term Care expenses compared to budget including over-expenditures in fee-for-service physician remuneration and price and volume increases in Pharmacare.
Advanced Education and Training’s variance of $46 million over budget is primarily due to pension valuation adjustments offset by lower expenses attributed to underfilled positions and the wind up of Manitoba Institute of Trades and Technology.
Agriculture’s variance of $170 million under budget reflects lower insurance indemnities resulting from reduced AgriInsurance claim volumes and favourable growing conditions in most parts of the province.
INTRODUCTION TO THE ANNUAL REPORT 13
This was offset by a reduction in federal revenue and fees and other revenue.
Municipal and Northern Relations’ variance of $83 million under budget is primarily due to project delays in the Investing in Canada Infrastructure Program caused by supply chain issues and labour shortages. This is fully offset by a decrease in federal revenue.
Justice’s variance of $34 million under budget is mainly due to the reduced impacts of contingent liabilities.
Tax credits are $28 million under budget related to the Film and Video Production Tax Credit due to a decrease in projected sector activity.
Debt servicing costs are $24 million under budget largely due to lower interest rates.
Budget 2025 set aside $596 million in enabling appropriations, including $556 million in internal service adjustments, contingencies and limited-term funding and $40 million in the green and carbon reduction fund. Throughout the year, $488 million of authority for internal service adjustments, contingencies and limited-term funding were allocated to departments as required. Contingencies funded from this appropriation included almost $200 million related to 2025/26 salary increases as a result of the settlement of several collective agreements. Other contingencies funded from this appropriation included approximately $100 million to support increased demand in public services such as mental health and addictions treatments, correctional facilities and social services programs, nearly $40 million for projects approved under the strategic economic initiatives fund, over $25 million for the business and home security rebate program and other various policing and security initiatives, $19 million to support Arctic Gateway capital improvements to the Hudson Bay Railway, $18 million for IT modernization investments including the government’s enterprise resource planning (ERP) system, and $11 million for landfill search efforts.
2025/26 Financial Results Explained: Accounting Matters
The Summary Financial Statements are prepared in accordance with Canadian Public Sector Accounting Standards (PSAS).
The government did not adopt any new accounting standards during 2025/26. Effective April 1, 2025, the government adopted new accounting policies for endowment funds and portfolio investments. These changes have been applied retroactively, and comparative figures have been restated to conform to the new accounting policies.
Under the new accounting policy, endowment contributions are recognized as revenue in the year they are received or receivable. Investment income earned on endowment funds that is subject to externally imposed restrictions is deferred until the related expenditures are incurred or the donor-imposed stipulations are met.
Portfolio investments are now measured either at fair value or at cost, depending on the nature of the investment and the government’s investment strategy. Investments quoted in an active market, or managed on a fair value basis, are measured at fair value, with unrealized gains and losses recognized in the Consolidated Statement of Remeasurement Gains and Losses. All other portfolio investments continue to be measured at cost or amortized cost using the effective interest method.
14 PROVINCE OF MANITOBA ANNUAL REPORT AND PUBLIC ACCOUNTS 2026
Rebuilding Health Care
| • | With government support, Assiniboine College is establishing 20-seat programs in Combined Laboratory X-Ray Technology and Medical Laboratory Technology, with first intakes anticipated in September 2027, following completion of capital upgrades. |
| • | With government support, University College of the North (UCN) expanded its offering of health-care aide seats, including in a community site in Northern Manitoba. By actively publicizing the expanded program, UCN seeks to fill its 130 seats and support the demand for direct personal care and daily living support to seniors, individuals with disabilities, and other patients in hospitals, personal care homes, and community settings, helping people maintain their health, dignity, and independence close to home. |
| • | By fall 2025, government support permitted UCN to deliver its new Primary Care Paramedic diploma program, the first in Northern Manitoba, to students in both Thompson and The Pas. UCN’s active student outreach promises to attract more students to fill the 16-seat program capacity at each campus. The two-year program provides students with the knowledge and hands-on training required to deliver emergency medical care and strengthens and improves access to emergency services in Northern Manitoba. |
| • | Government continues to provide ongoing funding to support previously approved health training expansions, including 25 nurse practitioner, 10 occupational therapy, 10 physical therapy, 15 physician assistant, and 30 Undergraduate Medical Education seats, all of which are now in place and contributing to increased health-care training capacity. |
| • | In 2025/26, the Manitoba government provided $10 million in capital funding toward the construction of the Bannatyne Building at the University of Manitoba as part of a $40 million |
| multi-year commitment to support expanded physician and allied health training capacity. This investment supports the infrastructure required to sustain the expanded Undergraduate Medical Education program, which increased capacity by 30 seats to 140 students annually. |
| • | Additional Institutional Safety Officers (ISOs) have been introduced across the health system to provide advanced security services in support of staff, patients, and visitors, including in Thompson. ISOs receive extensive training to respond to a wide range of security needs. |
| • | Government invested $47 million to support opening 97 new fully staffed beds in the health-care system, reducing strain on our hospitals and helping to move patients from the ER to more appropriate levels of care sooner. This includes 60 acute care beds, 10 new critical care beds and 27 new transitional care beds. |
| • | Construction of the Lac du Bonnet Personal Care Home progressed during 2025/26, with $17.1 million spent on construction activities and key project milestones achieved, as development of the new facility continued toward completion. |
| • | The $55 million budget commitment for diagnostic and surgical services across the province was fulfilled. |
| • | Manitoba advanced key health workforce priorities through nurse-to-patient ratio legislation, elimination of mandatory overtime for nurses, and implementation planning. The Provincial Travel Nurse Team is supporting high-need communities while retaining nurses in the public system. Work continues to improve primary care access and strengthen recruitment and retention of physicians, nurses, paramedics, health-care aides and diagnostic professionals through expanded rural training, targeted |
16 PROVINCE OF MANITOBA ANNUAL REPORT AND PUBLIC ACCOUNTS 2026
| recruitment, financial supports, incentives, and international recruitment efforts. |
| • | The screening age for breast cancer was lowered to age 45 in December 2025. The BreastCheck expansion was largely underspent in 2025/26 as funding was flowed partway through the year. |
| • | In 2025/26, the Provincial Electronic Medical Record (EMR) Program expended $56 million to advance electronic medical record implementation and digital tools across Manitoba, supporting more coordinated and streamlined patient care throughout the province. |
| • | Significant progress was made on the new Neepawa Hospital in 2025/26, with $107 million spent on construction activities as work continued in support of the province’s commitment to deliver a new hospital for the community and surrounding region. |
| • | Effective April 15, 2025, the Manitoba Enhanced Pharmacare Program provides eligible Manitoba residents with no cost coverage of most medications for birth control, diabetes, HIV prevention and treatment and hormone replacement therapy. Federal funding for National Pharmacare has been provided to Manitoba in support of no cost coverage of diabetes and birth control medications. |
| • | Manitoba Health, Seniors and Long-Term Care continued to advance key health infrastructure projects across the province: |
| o | Work progressed in 2025/26 on the Victoria Hospital Emergency Department (ED) redevelopment and the Manitoba Menopause Clinic. Planning and design for the ED were completed, and construction commenced in March 2026. Planning for the Manitoba Menopause Clinic also advanced, including the selection of a clinic location. |
| o | In 2025/26, planning and design development advanced for the Children’s Hospital Emergency Department renovation project at the Health Sciences Centre Winnipeg, in partnership with the |
| Children’s Hospital Foundation of Manitoba. Supporting future renovations are aimed at reducing wait times, improving patient flow, and enhancing patient care and safety. |
| o | Development of the Health Care Centre of Excellence as part of the Portage Place redevelopment advanced during 2025/26. Planning and design activities progressed and site preparation work, including the dismantling of the east end of the former Portage Place mall, was completed to support construction of the new health-care tower. |
| o | The Park Manor Personal Care Home project in Transcona advanced during 2025/26, with planning, pre-design, and design development activities progressing to support the start of construction and delivery of the new facility. |
| o | Planning and design activities for the Arborg Personal Care Home advanced during 2025/26. Work focused on refining the project scope and updating designs to support future construction and project implementation. |
| o | Work to begin the design of a new CancerCare Manitoba facility in Winnipeg progressed during 2025/26, including site selection and the initiation of project planning activities to support future development and address growing demand for cancer services. |
| o | Planning and design activities for E.M Crowe (Eriksdale) Emergency Room reopening were completed. Work focused on refining the project scope and updating designs to support future construction and project implementation. |
BUDGET OUTCOMES AND STRATEGIC INFRASTRUCTURE INVESTMENTS 17
Lowering Costs for Manitobans
| • | The Manitoba government continued the agricultural Crown land rent freeze for the 2025 growing season, maintaining rates at $3.66 per animal unit month — the lowest in Western Canada. The freeze provided financial stability for cattle producers during a challenging year, supporting the sustainability and viability of family ranches across the province. |
| • | Manitoba implemented an increase to the Renters Affordability Tax Credit for the 2026 tax year to $625 (from $575 in 2025) with up to an additional $357 for low-income seniors via the Seniors Top-Up. |
| • | Manitoba Finance provided $469 million in 2025/26 including $437 million for advance payments and $32 million for tax credits to homeowners for reducing their payments on property taxes. |
| • | Manitoba Student Aid is helping more students reach their goal of accessing post-secondary education. The number of students receiving financial assistance through the Manitoba Student Aid program for the 2025/26 program year increased by 3.7 per cent compared to 2024/25. The number of students who received a loan, grant, or bursary in 2024/25 (as of Annual Report) was 22,387. This increased to 23,209 for 2025/26. |
| • | In 2025/26, Manitoba Student Aid received a $25 million budget increase for a total provincial loan budget of $120.5 million. In the 2025/26 fiscal year, Manitoba Student Aid disbursed $109.5 million in funding through provincial student loans, as well as $23.7 million in bursaries to help more Manitobans afford post-secondary education, achieve their goals and find rewarding careers. |
| • | Aligning with its commitment to protect and invest in our parks and keep them public and affordable for families to enjoy, Manitoba offered free access to provincial parks for the fiscal year. |
| • | Manitoba expanded $10-a-day child care to school-age children on non-school days, saving families up to $788 per child. |
| • | Manitoba Hydro froze the electric rate for calendar year 2025, resulting in approximately $40 million in savings for 556,000 residential customers and 76,000 commercial and industrial customers. |
| • | To reduce barriers to work for EIA recipients, Manitoba Families increased the earnings exemption rate from $200 to $500 of net monthly earnings plus 30 per cent of additional earnings. This increases the available income of recipients who work, and can help them to maintain stable employment, housing, and health, in turn putting them on a path towards increased independence from income assistance programs. |
To support EIA recipients facing additional barriers to employment, the department updated the gift exemption to a maximum of $100 per month for gifts of a recurring or non-recurring nature per household member, up to $400. This reduces administrative burden as recipients are not required to provide details about gifts up to this amount. It also creates conditions through which recipients have access to more income.
EIA completed further changes to the Adult Education policy. Program staff now automatically approve adult education as an acceptable employment measure for participants under 30 years old who do not have a grade 12 diploma or equivalent. If participants choose to attend an adult education program, this will meet their work expectations under EIA. This policy change will support young adults in receipt of EIA to increase their educational attainment so they can move towards sustainable employment.
Healthier Families and Safer Communities
| • | In 2025/26, 13 full-time mental health workers were hired for community mobilization programs representing $1.118 million of the total allocation to support community mobilization programs and strengthen services for adults and youth. |
| • | In 2025/26, Manitoba Justice provided provincial funding to the RCMP under the Provincial Police |
18 PROVINCE OF MANITOBA ANNUAL REPORT AND PUBLIC ACCOUNTS 2026
Service Agreement for “D” Division. The funding supported the delivery of provincial policing services and operational requirements across Manitoba, including support for the RCMP’s Emergency Response Team and Operational Communication Centre.
Actual RCMP expenditures in 2025/26 were approximately $28 million higher than in prior years, reflecting increased funding requirements associated with the delivery of policing services and operational demands across the province.
| • | Manitoba Justice provided funding to the City of Winnipeg in 2025/26 to support the Downtown Safety Foot Patrol initiative, which enhances police presence and safety in the downtown area. |
| • | Manitoba Justice invested $500,000 in 2025/26 for an action plan to enhance safety and community wellbeing in downtown Winnipeg over the summer, supporting the Downtown Community Safety Partnership and other initiatives. |
| • | Nineteen new positions at the Manitoba Youth Centre are being filled — with 17 completing the process and hired by March 31, 2026. The $450,000 budget has been used to increase and enhance services to the youth at the centre. The Correctional Services Division of Manitoba Justice has been working with external agencies to provide youth with bank accounts, as well as City of Winnipeg passes upon release. |
| • | A Youth Summit was held on February 27, 2026 for approximately 250 students across a variety of school divisions. The objective was to inspire youth through a variety of workshops, panels, and activities with a focus on hearing their perspectives on how Manitoba can foster healthier and safer communities for youth. |
| • | Manitoba Supports for Persons with Disabilities is an income assistance program designed for low-income Manitobans living with severe and prolonged disabilities. A defining feature of the program is that the basic needs portion of benefits must be indexed annually to the March Consumer |
| Price Index for Manitoba, per the Disability Support Regulation. |
Regulatory amendments were conducted to implement the indexation of basic needs, which were increased by $16.92 per month per eligible adult beginning in July.
| • | As of March 31, 2026, the Electric Vehicle rebate program, which has delivered 5,372 approved and mailed rebates totalling over $20 million since inception, has accounted for approximately 23,100 tonnes of carbon dioxide equivalent in annual emission reductions for this fiscal year. |
| • | Families increased expenditures by $25.8 million to Community Living disABILITY Services from the previous year to support Manitobans living with an intellectual disability and their families. This investment strengthened the capacity of community agencies to deliver person-centred supports, enabling individuals to live in community settings and access residential, day, transportation and respite services. |
| • | Families provided $4.7 million to Community Living disABILITY Services to support the ongoing residential and community-based supports required for individuals who transitioned from the Manitoba Developmental Centre. This funding ensured continuity of care, supported community integration, and aligned with the province’s goal of deinstitutionalization and inclusive living. |
| • | Government invested in provincial parks through the implementation of more than $26 million in capital projects including for campground and washroom upgrades, water and wastewater treatment facility upgrades, new playgrounds, waste management initiatives, and key projects such as the development of a new comfort camping program. |
| • | In 2025/26, Environment and Climate Change distributed nearly $410,000 in grant funding to seven organizations helping to preserve Manitoba’s aquatic ecosystems and biodiversity through Aquatic Invasive Species (AIS) response and prevention. This included enhanced resources |
BUDGET OUTCOMES AND STRATEGIC INFRASTRUCTURE INVESTMENTS 19
| to help partners to support Manitoba’s AIS prevention and response priorities. |
| • | Government committed $7.3 million in Municipal Operating Grant funding and $650,000 in the One Manitoba Growth Revenue Fund, distributed among First Nations and Northern Affairs Communities (NACs). Of the NACs’ allocation, $1.5 million was distributed on a per capita basis to support local administration and operations, and $1.0 million for the Northern Roads and Bridges Program. An additional $1.17 million supported infrastructure renewal and communities’ priorities, wildfire and flooding related emergency expenditures, feasibility studies, solid waste management, and regulatory compliance requirements. |
| • | Manitoba continued its on-going commitment to provide predictable funding to municipalities through the Strategic Municipal Investment Fund. In 2025/26, Manitoba provided the City of Winnipeg with $146.6 million in municipal operating funding, a $6 million increase from the $140.6 million provided in 2024/25. The increase consisted of an inflationary increase in the Municipal Operating Grant and annualization of funding for the Waverley West Fire Station of $3.4 million. Manitoba also maintained the Winnipeg Strategic Infrastructure Basket at $93.9 million to support strategic capital projects across the city. |
| • | Government fully distributed $11.3 million in 2025/26 operating and maintenance funding to Northern Affairs Communities to support local administration, maintenance of critical infrastructure, and delivery of essential municipal services. In addition, the department fully allocated $3.8 million in capital funding to priority projects that support regulatory compliance in solid waste, water and wastewater infrastructure, and the installation of backup generators for water treatment plants. |
| • | Manitoba continues to work collaboratively with all levels of government to ensure that the North End Water Pollution Control Centre is completed to support new residential, commercial, and industrial processing capacity, as well as to remove |
| harmful contaminants from our water systems, including Lake Winnipeg. In 2025/26, Manitoba provided $30.8 million towards Phase 2 project implementation. |
| • | The Keystone Centre in Brandon has received 2025/26 provincial operating and capital funding totalling $1.775 million. |
| • | Budget 2025 introduced the One Manitoba Growth Revenue Fund, providing $12.4 million in new unconditional funding in 2025/26 for municipalities and Northern Affairs Communities to support core municipal services and local priorities. |
| • | The 2025/26 From the Ground Up – Safe Healthy Communities for ALL Program (FGP) committed up to $13.51 million, which included up to $12.29 million in approved funding for 208 projects under its application-based component and up to $1.22 million in approved funding for its Strategic Partnerships component. In 2025/26, the FGP Program paid out $13.47 million in grant funding. |
| • | The 2025/26 Urban/Hometown Green Team (GT) Program approved up to $7.6 million in funding for 614 projects. In 2025/26, the GT Program paid out $6.9 million in grant funding. |
| • | Manitoba continues to strengthen the arts and culture sector through targeted investments that support organizational sustainability and growth. In 2025/26, the Manitoba government provided the Manitoba Arts Council (MAC) with $13.95 million in funding, including an additional $250,000 for the Looking Forward program. Delivered in partnership with The Winnipeg Foundation, the program supports strategic planning, collaboration, and long-term sustainability for arts organizations. |
| • | In its first year, the program approved 21 projects and awarded $348,000 in grants. MAC fully distributed Manitoba’s $250,000 contribution in 2025/26. Under the agreement, The Winnipeg Foundation also contributed $250,000, of which $113,729 had been recognized and expended on program administration and grant delivery costs as of March 31, 2026. |
20 PROVINCE OF MANITOBA ANNUAL REPORT AND PUBLIC ACCOUNTS 2026
| • | Government provided over $1.26 million in support to 53 community and cultural festivals across the province including Northern Manitoba Trappers’ Festival, Manitoba Stampede and Exhibition, Folklorama, the Manito Ahbee Festival and Festival du Voyageur. |
| • | In 2025/26, $8.56 million in operating support was provided to public libraries through the Public Library Operating Support Grant. Funding included $3.27 million for the Winnipeg Public Library and $5.29 million for rural, northern and bilingual libraries. These investments supported expanded service hours, helped address critical staffing needs and enabled libraries to sustain and enhance services for Manitobans. |
| • | Manitoba opened or committed almost 11,800 new child-care spaces for children ages 0-6 and over 5,500 school-age spaces, totalling nearly 17,300 new child-care spaces throughout the province since the start of the Canada-Wide Early Learning and Child Care Agreement in 2021/22. |
| • | Government invested $30 million in permanent funding for the Universal School Food Program, including $22 million to school divisions and approximately $8 million to community organizations supporting nutrition programs for children and youth. In 2025, Nello’s Law amended The Public Schools Act to require all schools to provide free nutrition programs, grounded in principles of access, accommodation, equality, local delivery, and quality. |
| • | Government announced an additional $59.2 million investment in K-12 education for the 2025/26 school year, representing a 3.4 per cent increase in overall funding. The $59.2 million additional investment in K-12 education for the 2025/26 school year (Sept./25-June/26) represents $69.54 million in 2025/26 fiscal year (April/25-March/26). |
| • | Government invested $164.22 million in 2025/26 to design and construct new schools, additions and infrastructure renewal projects supporting enrolment growth and safe, modern learning environments. An additional $8.41 million |
| supported early learning and child-care expansion. In September 2025, three new schools opened: two K-8 schools in Sage Creek and one K-4 school in Steinbach. Construction continued for a new school and major additions in Seven Oaks, Brandon and Pembina Trails. |
| • | Government spent $73 million towards Your Way Home. Using this funding, Manitoba Housing, Addictions and Homelessness housed over 1,200 people, including 190 directly from encampments. The department also provided $7.65 million to support supportive housing for people exiting encampments, $5.3 million to support mobile Housing First teams for people experiencing homelessness and $2.2 million to support the creation of 96 new units of housing with supports. |
| • | In 2025/26, Manitoba Housing’s sponsor-managed portfolio received $2.7 million, resulting in the completion of 241 previously vacant units. Manitoba Housing’s direct-managed portfolio received $2.7 million, resulting in the completion of 224 previously vacant units. |
| • | In 2025/26, the Government invested in new housing supply to support the creation of up to 396 new social and affordable housing units and 88 congregate beds. The Department also fully expended its $78 million Modernization and Improvement and $44.8 million Repair and Maintenance budgets in 2025/26. |
| • | Government provided more than $8.4 million for wraparound support services. Support varied from residential care facilities to enhance care and prevent closure due to lack of funding, new social housing, and transitional housing which is still in progress. Funding for transitional housing was reallocated to support broader implementation of supportive housing programs within Manitoba Housing. |
| • | In 2025/26, planning continued to initiate supervised consumption services at 366 Henry Avenue. Funding supported program development for a temporary urgent public health need site (UPHNS) and full-scale supervised |
BUDGET OUTCOMES AND STRATEGIC INFRASTRUCTURE INVESTMENTS 21
| consumption site. Manitoba has moved forward with issuing its own exception for the UPHNS. |
| • | Manitoba Housing, Addictions and Homelessness advanced the development and implementation of a suicide prevention strategy. Actions are being identified through evidence-based reviews, cross-departmental engagement, community engagement, and guidance from the Suicide Prevention Advisory Group. |
Funding supported facilitation and community engagement across Manitoba. In-person engagements occurred in 15 communities in rural, urban, northern, remote and First Nations regions with approximately 800 participants. Engagements were delayed due to wildfires. The department also continued to fund early actions such as training development, peer support and school-based prevention efforts.
Growing our Economy
| • | Manitoba invested $138.5 million in Business Risk Management programs in 2025/26. Manitoba Agricultural Services Corporation (MASC) insured $4.54 billion in liability through AgriInsurance covering 9.9 million acres and over 7,100 farm operations, issuing $96.4 million in indemnities to Manitoba producers facing production shortages and quality losses. Additionally, $15.9 million in compensation, cost shared with the federal government, was paid for crop and livestock losses caused by wildlife under the Wildlife Damage Compensation Program. Manitoba Agriculture contributed an estimated $51.9 million towards AgriStability and AgriInvest combined for 2025/26 to help producers manage operations. |
| • | The Manitoba government expanded access to agricultural services with the opening of new MASC Service Centres in the communities of Shoal Lake and Virden. Since September 2025, farmers in Westman have been accessing insurance, lending and other agricultural services closer to home. |
| • | In 2025/26, Manitoba Agriculture invested almost $2.8 million to support research through the Agriculture Innovation Hub (AIH). AIH funds collaborative research and innovation projects |
| that advance Manitoba’s agricultural productivity, sustainability and value-added growth. In 2025/26, 36 basic and applied research projects were approved for funding through the Sustainable Canadian Agricultural Partnership and the AIH, representing an ongoing commitment of almost $5 million in combined federal and provincial funding to further research and innovation. |
| • | In 2025/26, Manitoba Agriculture provided $3.4 million in combined federal and provincial funding through the Sustainable Agriculture Manitoba program under the Sustainable Canadian Agricultural Partnership, supporting 158 projects that advance beneficial management practices to improve soil, water, air, and biodiversity outcomes while enhancing the sustainability and competitiveness of Manitoba agriculture. |
| • | MASC administers the Farmland School Tax Rebate program. For 2025/26, the program paid out an estimated $23 million in rebates to farm property owners, helping producers lower their operating costs. |
| • | In 2025/26, Manitoba Agriculture provided $540,000 in grant funding to 26 Veterinary Services Districts to support the operation of rural veterinary clinics and strengthen the recruitment and retention of veterinarians. This funding helped maintain access to essential veterinary services for livestock, poultry, and companion animals, supporting animal health, producer resilience, and rural communities across Manitoba. |
| • | Health and Post-Secondary Education Tax Levies thresholds were increased effective January 1, 2026. It is estimated this will benefit 900 employers with annual savings of $8.4 million, including fully exempting approximately 150 Manitoba employers from the tax. |
| • | In 2023/24, the Manitoba government increased the annual allocation of Manitoba seats at the Western College of Veterinary Medicine from 15 to 20. The five new seats are targeted towards rural-based practice. Manitoba Advanced Education and Training disbursed $8.3 million in 2025/26 to the |
22 PROVINCE OF MANITOBA ANNUAL REPORT AND PUBLIC ACCOUNTS 2026
| college as part of its obligations under the inter-provincial training agreement. 2025/26 was the third year of the expansion’s implementation, resulting in 75 total seats across all four years of the Doctor of Veterinary Medicine program at the college. Expansion will reach maturity in 2026/27. |
| • | Manitoba Business, Mining, Trade and Job Creation promoted careers in skilled trades to the next generation through Skills Canada Manitoba programming, reaching 9,076 students in 432 schools across Manitoba. |
| • | Manitoba Business, Mining, Trade and Job Creation delivered a range of employment services to 30,091 Manitoba job seekers. These included services offered at 12 department-led Manitoba Jobs and Skills Development Centres and through partnerships with community organizations across Manitoba. These services help ensure Manitobans have access to the career guidance and skills training needed to secure good jobs. Clients served included 7,545 Indigenous Manitobans, 13,950 young people under 30, 11,070 immigrants, and 4,706 persons with disabilities. |
| • | Government strengthened economic diversity and created the conditions for growth for Manitoba businesses by launching the Trade Growth Investment Financing program, which aims to support fixed asset and productivity enhancing investments by Manitoba businesses. |
| • | In 2025/26, the Export Support Program was doubled and $754,681 in funding was provided to support 80 Manitoba businesses to participate in 140 unique trade shows to help them expand the export of their products and services into new and more diversified markets. |
| • | In 2025/26, Manitoba invested an additional $2.5 million into the Manitoba Mineral Development Fund to support mining projects that accelerate early mineral exploration activities, create Indigenous partnerships, increase job opportunities, and stimulate investment in northern Manitoba. |
| • | The government provided $2 million to support the development of a low-emission magnesium processing facility at the Minago mine owned by Norway House Cree Nation, the first 100 per cent fully First Nation-owned critical minerals project in Canada. |
| • | Manitoba launched the Economic Development Strategy, a comprehensive roadmap that will guide government efforts to make life more affordable for families by enhancing productivity, strengthening the private sector, driving sustained growth, creating higher-paying jobs, and keeping more young people building their future in the province. |
| • | In 2025/26, Workplace Safety and Health (WSH) increased the number of WSH Officer positions from 52 to 56. It contributed to enhancing WSH’s capacity to conduct more workplace inspections to ensure improved compliance across Manitoba. |
| • | In 2025/26, The Workplace Safety and Health Act and regulation have been amended to strengthen worker protections, including promoting psychologically safe workplaces, authorizing a new penalty for failing to report a serious incident to WSH, enhancing medical surveillance authorities, enhancing protections from asbestos exposure for workers and the public, requiring large construction sites to provide hot water for handwashing, and mandating that employers provide free menstrual products. |
| • | In 2025/26, Travel Manitoba increased its marketing spending from $8.3 million to $11.9 million to support initiatives that encourage Manitobans to explore their own province, attract out-of-province visitors, and grow Indigenous tourism. Following the 2025 summer wildfires, Travel Manitoba allocated $1.35 million in the Wildfire Resilience Assistance Program, which provides eligible tourism operators with value protection equipment, FireSmart training, and tailored wildfire risk assessments. More than $700,000 was provided to Indigenous Tourism Manitoba to support operations, Indigenous tour guide training, and business development. |
BUDGET OUTCOMES AND STRATEGIC INFRASTRUCTURE INVESTMENTS 23
| • | Budget 2025 committed $36.4 million over two years for the Port of Churchill and the Hudson Bay Railway. Government fulfilled its year one 2025/26 commitment and expended $17.2 million. |
| • | The Manitoba government provided a one-time $450,000 investment to CentrePort Canada Inc. |
| • | Manitoba Transportation and Infrastructure advanced key transportation infrastructure projects across the province, improving trade corridors, road safety, flood protection infrastructure, and transportation connections for communities, investing $792 million in 2025/26. Key projects include: |
| o | PTH 1E Twinning |
| o | PTH 75 Surfacing |
| o | PTH 1 & 5 Interchange |
| o | Outlet Channels |
| o | Rivers Dam |
| o | Emerson Pump Station |
| o | Wasagamack Airport |
| o | PTH 100 & St. Mary’s Interchange |
| o | PTH 100 & PTH 3(McGillivray) Interchange |
| o | Cooks Creek Bridge |
| o | Fish Creek Bridge |
| o | PTH 5 Surfacing |
| o | PTH 83 Surfacing |
| o | Main Drain Bridge |
During the year, the department completed several major design and construction milestones, opened the new St. Mary’s Interchange to traffic, advanced key flood mitigation projects, completed highway surfacing projects, and continued Indigenous and public engagement.
| • | Significant rehabilitation work on the Souris River structure was completed on budget in the fall of 2025, helping to maintain a safe and reliable transportation network. |
| • | Construction of the new 24/7 Headingley weigh scale and traffic inspection station along with associated roadworks was substantially completed in 2025/26. The facility became operational in March 2026. Investments in inspection stations and enforcement tools help keep highways safe |
| for all road users while protecting Manitoba’s transportation infrastructure for the long term. |
| • | In 2025/26, the government continued to advance Indigenous-led economic development across Manitoba by supporting initiatives that strengthen business growth, workforce participation, community capacity, and long-term economic prosperity. The government worked with Indigenous partners to advance projects through key planning, development, and implementation stages, helping to create sustainable economic opportunities for Indigenous communities and businesses. |
| • | Manitoba and Canada partnered to deliver the largest wage increase to date for front-line early childhood education professionals in the province. The 2025/26 wage grid prioritized front-line educators, providing increases of up to $5 per hour, depending on certification level and the size of the child-care centre. The Manitoba government also delivered on its mandate commitment for a comprehensive workforce strategy, released in November 2025. |
A Government that Works for You
| • | The Manitoba government continues to modernize access to health services through ongoing implementation of the secure plastic health cards and launching the new online Health Card Registration System Portal, making it easier for Manitobans to manage their health coverage information while improving the accuracy and security of health records. By replacing paper-based cards with durable plastic cards and launching the online self-service option, the government is reducing administrative barriers, improving service response times, and making health services more accessible for Manitobans. In 2025/26, the Manitoba government issued 19,856 digital health cards since the launch on January 12, 2026, and 604,790 plastic health cards. As of March 31, 2026, a total of 662,790 plastic health cards had been mailed since the initiative began on January 15, 2025. |
24 PROVINCE OF MANITOBA ANNUAL REPORT AND PUBLIC ACCOUNTS 2026
| • | The Manitoba government continued to advance key digital modernization initiatives in 2025/26, including the Fisheries Management System, Animal Welfare Case Management System, Birth and Death Registration Modernization, Spatial Data Infrastructure, and Veterinary Diagnostic System. Planning, development, and implementation work continued across these initiatives during the year as they progress toward future completion and launch. These projects remain underway, with work continuing to bring the new digital systems and services into operation. |
| • | The Manitoba government continued to modernize licensing services through the implementation of a new Manitoba-based digital platform to manage hunting, angling, forestry, park vehicle, and snowmobile permits. The new solution is intended to provide a more accessible online experience while supporting efficient and reliable licensing services for Manitobans. In 2025/26, the new platform was launched and transitioned into live service, making the new licensing system available to Manitobans. |
| • | The Manitoba government modernized wildfire management by implementing new cloud-based fire mapping and weather information applications. In 2025/26, the project was completed and transitioned to operations, replacing outdated systems with modern tools that provide 24/7 access to wildfire, weather, and resource information during Manitoba’s wildfire season. |
| • | Manitoba’s multi-year ERP modernization program continues to progress and has delivered benefits through the implementation of technology designed to improve contract management and the public sector employee learning management system within the government. The program will continue to modernize back-office functions within the public service, including major technology and process changes which will streamline human resources, payroll, finance, logistics and procurement functions for the province. The project achieved all |
| major milestones and the full implementation is currently on schedule. |
Protecting Manitobans from Tariffs
| • | The Tariff Response Hotline responded to 320 inquiries, helping local companies navigate the impact of new trade policies and tariff challenges. |
| • | The government collaborated with other provinces and actively participated in Canada–United States-Mexico Agreement (CUSMA) consultations to protect and grow Manitoba’s economic interests, while diversifying export markets and advancing international partnerships. Industry engagement sessions were held across all sectors to prepare for CUSMA discussions. |
| • | Manitoba signed new economic co-operation agreements with the governments of New Brunswick, Saskatchewan, British Columbia, and Prince Edward Island, to remove interprovincial trade barriers, create new opportunities, and increase labour mobility. |
| • | Government promoted Manitoba’s critical mineral opportunities by hosting trade show booths at two major energy conferences: Williston Basin Petroleum Conference and GeoConvention and two major mining conferences; AME Roundup and Prospectors & Developers Association of Canada, and delivered technical presentations at various geoscience conferences and co-chaired sessions at Central Canada Mineral Exploration Conventions and Geological Association of Canada-Mineralogical Association of Canada. |
| • | In response to U.S. tariffs, the government allowed the deferral of paying amounts due under retail sales tax and health and post- secondary education tax levy returns without interest and penalty. This measure, originally for a three-month period, was extended to six months (October 2025 tax returns), relieving financial pressures for participating Manitoba businesses. |
BUDGET OUTCOMES AND STRATEGIC INFRASTRUCTURE INVESTMENTS 25
STRATEGIC INFRASTRUCTURE INVESTMENTS
Strategic infrastructure reporting contains Manitoba’s capital investments at the summary government level, including direct investment by government in its own assets and other operating entities’ assets, grants to municipalities, annual maintenance of infrastructure, capital loans, investments by Crown corporations, and self-funded capital investments by other reporting entities. Manitoba Hydro’s capital investments, along with those of other Crown corporations, are included in the presentation of strategic infrastructure to provide a complete picture of public-sector capital investments.
Manitoba’s net tangible capital assets have a net book value of $18.4 billion, excluding Crown corporations that report their capital asset value in their annual reports. The province’s capital program is driven by the cost of maintaining physical assets in a state of good repair to support the delivery of government services, while investing in new infrastructure to support future needs.
In 2025/26, strategic infrastructure investments were just under $3.5 billion. This amounts to an overall increase of $375 million in capital spending in 2025/26, compared to 2024/25. There were increased investments in buildings, equipment and technology, transportation infrastructure, and Crown corporations:
| • | Capital investments in health facilities were $676 million, which includes capital grants. |
| • | Capital investments in Manitoba’s highways and airport infrastructure totaled $504 million. |
| • | Capital investments in child care, K-12 schools and post-secondary institutions totaled $330 million. |
| • | Capital investments in housing totaled $115 million which includes $25 million in capital grants. |
| • | Capital investments in Manitoba Hydro infrastructure totaled $881 million. |
Notable variances for the 2025/26 fiscal year as shown on the following page included:
| • | Child care, schools, and advanced education – Variance is mainly due to extended timelines for project execution for child-care capital. |
| • | Other departments and other reporting entities – Variance is mainly due to unused funds held for contingencies. |
| • | Highways and airport infrastructure – Variance is mainly due to favourable tender results in the bidding process, and construction delays mainly due to longer stakeholder engagement, permitting and land acquisition process. |
| • | Manitoba Public Insurance – The majority of the variance is due to a pause and subsequent cancellation of Project Nova. |
26 PROVINCE OF MANITOBA ANNUAL REPORT AND PUBLIC ACCOUNTS 2026
| Strategic Infrastructure Investments |
||||||||||||
| ($ millions) |
||||||||||||
| Budget 2025 Restated 1 |
2025/26 Actual |
2024/25 Actual |
||||||||||
| Buildings, equipment and technology |
||||||||||||
| Health |
679 | 676 | 720 | |||||||||
| Child care, schools, and advanced education |
474 | 330 | 366 | |||||||||
| Housing |
90 | 90 | 81 | |||||||||
| Other departments and other reporting entities |
167 | 128 | 79 | |||||||||
| Specialized and service vehicles 2 |
120 | 110 | 44 | |||||||||
| Information technology |
137 | 137 | 69 | |||||||||
|
|
|
|||||||||||
| 1,667 | 1,471 | 1,359 | ||||||||||
| Transportation infrastructure |
||||||||||||
| Highways and airport infrastructure |
530 | 504 | 480 | |||||||||
| Water infrastructure |
63 | 64 | 52 | |||||||||
| Transportation equipment and facilities |
11 | 15 | 8 | |||||||||
| Maintenance and preservation |
206 | 209 | 224 | |||||||||
|
|
|
|||||||||||
| 810 | 792 | 764 | ||||||||||
| Capital grants |
||||||||||||
| Social and affordable housing grants |
25 | 25 | 6 | |||||||||
| Municipal grants |
168 | 168 | 168 | |||||||||
| Northern Affairs Communities |
4 | 4 | 4 | |||||||||
|
|
|
|||||||||||
| 197 | 197 | 178 | ||||||||||
| Crown Corporations |
||||||||||||
| Efficiency Manitoba |
62 | 60 | 57 | |||||||||
| Manitoba Liquor and Lotteries Corporation |
68 | 68 | 36 | |||||||||
| Manitoba Public Insurance Corporation |
49 | 18 | 25 | |||||||||
| Manitoba Hydro |
881 | 881 | 693 | |||||||||
|
|
|
|||||||||||
| 1,060 | 1,027 | 811 | ||||||||||
|
|
|
|||||||||||
| Total Strategic Infrastructure Investment |
3,734 | 3,487 | 3,112 | |||||||||
Note: For presentation purposes, some category headings and capital groupings have been revised.
1 Budget restated includes internal service adjustments, $20 million special warrant for capital projects, $29 million capital grants for health projects, and $10 million for IT projects.
2 2024/25 actuals include $4.3 million deposit for the purchase of water bomber aircrafts.
BUDGET OUTCOMES AND STRATEGIC INFRASTRUCTURE INVESTMENTS 27

PUBLIC ACCOUNTS OF MANITOBA
TABLE OF CONTENTS
| Introduction to the Public Accounts of Manitoba |
31 | |||
| Financial Statement Discussion and Analysis |
32 | |||
| Risks and Uncertainties |
38 | |||
| Variance Analysis and Assessment of Significant Trends Operating Surplus (Deficit) |
41 | |||
| Revenue Analysis |
42 | |||
| Expense Analysis |
45 | |||
| Financial Assets |
51 | |||
| Liabilities |
52 | |||
| Net Debt and Accumulated Deficit |
52 | |||
| Non-Financial Assets Including Tangible Capital Assets |
53 | |||
INTRODUCTION TO THE PUBLIC ACCOUNTS OF MANITOBA
Nature of the Public Accounts
The Public Accounts of Manitoba are prepared annually by statutory requirement in accordance with subsection 65(1) of The Financial Administration Act, which is Chapter F55 of the Continuing Consolidation of the Statutes of Manitoba. The Public Accounts reflect the summary financial position of the government and the operating results for the fiscal year of the government, which ends on March 31.
The information contained in the report originates from two sources:
| • | the summarized financial information presented in the accounts of Manitoba, maintained by the Provincial Comptroller; and |
| • | the detailed records maintained by departments, government organizations, government business enterprises, and government business partnerships. |
Each department and public sector organization is responsible for reconciling its accounts to the control accounts of the Provincial Comptroller, and for maintaining detailed records of the transactions in their accounts.
Format of the Public Accounts of Manitoba
The Public Accounts of Manitoba consist of the Financial Statement Discussion and Analysis, the audited Summary Financial Statements of the government, financial reports on the Rainy Day Fund, and other statutory financial reports.
FINANCIAL STATEMENT DISCUSSION AND ANALYSIS
This section provides a written commentary on the summary financial statements, plus additional information on the financial and economic performance of the provincial government. The financial information contained in the Financial Statement Discussion and Analysis section is taken
from the March 31, 2026 summary financial statements.
SUMMARY FINANCIAL STATEMENTS
These audited statements, prepared using Chartered Professional Accountants of Canada (CPA) Public Sector Accounting Standards, disclose the financial impact of the government’s activities. Only the government’s summary financial statements provide the key information on the financial activities of the entire government. The summary financial statements include the financial results of the 124 different agencies and accounts the government uses to deliver its goods and services. The government reporting entity (GRE) includes government departments, business enterprises, business partnerships, and organizations, such as regional health authorities, school divisions, universities and colleges. The departments and entities comprising the GRE are disclosed in Schedule 8 of the summary financial statements.
The summary financial statements also provide the following information about government’s financial activities:
| • | the government’s financial position as at March 31 each year |
| • | the results of its operations for the year |
| • | what revenue it brought in and what it spent (e.g., annual surplus or deficit) |
| • | how much it borrowed, repaid or refinanced |
| • | how it obtained and used its funds |
INFORMATION PROVIDED UNDER STATUTORY REQUIREMENTS
This section includes audited reports on information other than financial statements, including the Rainy Day Fund and other reports specified in The Financial Administration Act, The Fiscal Responsibility and Taxpayer Protection Act, and The Northern Affairs Act. The Public Accounts of Manitoba are available online at: www.manitoba.ca/governmentfinances.
PUBLIC ACCOUNTS OF MANITOBA 31
FINANCIAL STATEMENT DISCUSSION AND ANALYSIS
The Public Sector Accounting Board (PSAB) of the Chartered Professional Accountants of Canada (CPA Canada), through a statement of recommended practices, suggests several financial indicators to help assess a government’s financial condition. There are no established public sector benchmarks for these indicators. The indicators, expressed as ratios or trends, provide a picture of what has occurred over a period of years to facilitate comparisons and assist in the assessment of the government’s financial health in the context of the current economic and financial environment. The recommended indicators are grouped into three categories:
1) Sustainability – measures a government’s ability to maintain its programs without the need to increase its borrowings.
2) Flexibility – measures a government’s ability to respond to rising financial commitments by either expanding its revenue or increasing its borrowings.
3) Vulnerability – indicates how much a government relies on revenue sources beyond its direct control or influence, both domestically and internationally.
The Financial Statement Discussion and Analysis reflects the results of the Province of Manitoba, which have been impacted by several macroeconomic headwinds, including slowing economic growth, and inflation pressures. To get a broader perspective of the current fiscal situation of the Province of Manitoba, readers are encouraged to find additional information in the province’s Quarterly Reports for 2026/27.
Source of Data and its Limitations
The financial indicators in this report use key financial information from the audited summary financial statements. Economic information is obtained from Statistics Canada and the Manitoba Bureau of Statistics. Comparative data presented is not adjusted for inflation.
Comparative results are restated to conform to any changes in accounting policy or presentation adopted in the current fiscal year. The financial indicators in this section present the results in the same format as presented in the Public Accounts of Manitoba.
The Government’s 2025/26 Financial Condition
This section describes the government’s financial health using CPA Canada’s three indicator categories of sustainability, flexibility, and vulnerability. The section also describes each category and the related indicators. For each indicator, it provides financial data for Manitoba and highlights key trends.
Sustainability
As noted, sustainability measures the ability of a government to meet its existing program commitments and creditor requirements without increasing its borrowings or tax burden.
Looking at trends for the following five indicators provides useful insight into the sustainability of a government’s revenue-raising and spending practices:
| • | Net Debt as a Percentage of Provincial GDP – the relationship between a government’s net debt and the income in the economy |
| • | Net Debt-to-Total Annual Revenue – the extent to which future revenues are required to pay for past transactions or events |
| • | Net Debt per Capita – the relationship between a government’s net debt and its population is widely considered to be the best measure for cross-jurisdictional review of government and financial health; represents the net debt amount that is attributed to each Manitoba resident |
| • | Annual Operating Surplus (Deficit) – the extent to which a government is spending within its means |
| • | Annual Operating Surplus (Deficit)-to-Provincial GDP – the relationship between a government’s operating surplus (deficit) and the provincial economy |
NET DEBT AS A PERCENTAGE OF PROVINCIAL GDP
The government manages its revenue-raising and spending practices with due regard to the provincial economy. Looking at net debt and provincial GDP provides insights into these practices.
32 PROVINCE OF MANITOBA ANNUAL REPORT AND PUBLIC ACCOUNTS 2026
Net Debt
Net debt is the difference between a government’s total liabilities and total financial assets. It provides a measure of the future revenue required to pay for past transactions and events. Net debt as a percentage of provincial GDP measures the level of future financial obligations placed on the economy by a government’s cumulative spending and revenue-raising practices. It provides a measure of how much debt a government is carrying, relative to the government’s annual economic output.
Investment in capital improvements, replacement of deteriorating tangible capital assets, such as transportation infrastructure, and an operating deficit, offset by remeasurement gains and other adjustments, resulted in increased net debt.
Overall, the net debt of the government increased by $1,381 million in fiscal year 2025/26, primarily reflecting an operating deficit of $832 million, $1,163 million in net acquisition of tangible capital assets, and a $112 million increase related to the changes in other non-financial assets; offset by $726 million remeasurement gains and other adjustments.
Changes in GDP must be taken into account to determine capacity to support debt. GDP is a measure of the value of the goods and services produced in the province during a given year. The GDP indicates the size of the provincial economy. The provincial economy grew steadily from $79.3 billion in 2021/22 to $100.3 billion in 2025/26, representing 26.5 per cent growth over the five-year period. The Manitoba Consumer Price Index (CPI) rose 2.7 per cent in 2025 (2024 – 1.1 per cent).
Graph 1 shows that the net debt to GDP ratio as of March 31, 2026 decreased to 36.4 per cent from the prior year’s 36.6 per cent. Although net debt increased during the year, the ratio decreased slightly as GDP grew more quickly than net debt.
Graph 1
Net Debt as a Percentage of Provincial GDP
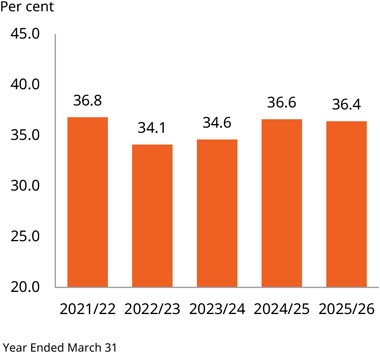
Net debt for 2025/26 included a gain in other comprehensive income (OCI) loss of $215 million, recorded by GBEs. OCI represents unrealized gains or losses calculated at a point in time and can have a significant impact on the measurement of net debt. OCI is measured as the change in “mark-to-market” valuations, interest rates, and foreign exchange rates at year end, representing a one-day snapshot of the change in value when compared to the same day in the previous year.
Managing net debt while maintaining or increasing necessary investment in capital, including infrastructure, is a challenge faced by all provinces and territories in Canada.
NET DEBT-TO-TOTAL ANNUAL REVENUE
Net debt is the amount that current and past generations have accumulated through annual deficits and tangible capital investments. These amounts remain an obligation for future generations to fund through annual surpluses, or to continue to carry as debt. It results when a government’s total liabilities exceed total financial assets. A trend of increasing net debt-to-total annual revenue would indicate that an increasing amount of time will be needed to eliminate net debt.
PUBLIC ACCOUNTS OF MANITOBA 33
Net debt-to-total annual revenue in 2025/26 was 145.7 per cent (2024/25 – 144.2 per cent). The increase is attributable to the increase in net debt.
Graph 2 shows the five-year historical trend of net debt-to-total annual revenue. In recent years, this measure has stabilized. In 2022/23, the restated net debt-to-total annual revenue was at its five-year low of 134.9 per cent. This increased to a restated 147.7 per cent in 2023/24 due to the government’s investment in the health sector and recent macroeconomic headwinds. Since then, the ratio has remained relatively stable, decreasing to a restated 144.2 per cent in 2024/25 and increasing to 145.7 per cent in
Graph 2
Net Debt-to-Total Annual Revenue
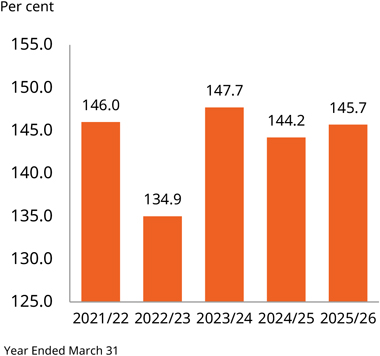
NET DEBT PER CAPITA
Net debt per capita is a measurement of the value of a government’s net debt expressed in terms of the amount attributable to each citizen under the government’s jurisdiction. It is commonly calculated using net debt divided by the population of the province.
Net debt per capita provides an indication of how much the government is leveraged. Net debt per capita is often used to comment on the effectiveness of a government’s current fiscal policy. However, the net debt to GDP ratio provides a more complete picture of a government’s actual fiscal health. Graph 3 shows the historical trend of net debt per capita.
Graph 3
Net Debt Per Capita
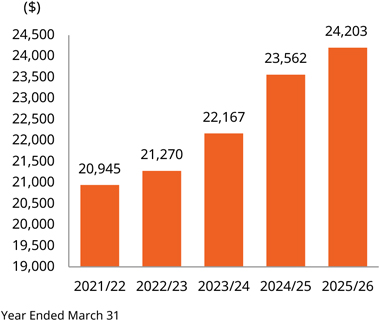
Net debt per capita has ranged from $20,945 in 2021/22 to $24,203 in 2025/26. The net debt per capita increased sharply from 2023/24 to 2024/25, primarily because of increased investment in the health sector. The increased investment in the health sector continued into 2025/26 along with increased investment in Manitoba Hydro.
ANNUAL OPERATING SURPLUS (DEFICIT)
An annual operating surplus helps the government maintain its services and provides an opportunity to lower its borrowing needs. Annual operating deficits can impact a government’s ability to deliver services and can lead to increased borrowing requirements.
The annual surplus (deficit) shows the extent to which a government generates revenue greater (less) than its operating expenses in one fiscal year.
For the fiscal year ended March 31, 2026, Manitoba had budgeted a deficit of $794 million. Primarily due to one-time year-end adjustments, offset by increases in total revenue, the government recorded a deficit of $832 million, which was $38 million higher than the fiscal year’s budgeted deficit.
34 PROVINCE OF MANITOBA ANNUAL REPORT AND PUBLIC ACCOUNTS 2026
ANNUAL OPERATING SURPLUS (DEFICIT)-TO-PROVINCIAL GDP
The ratio of operating surplus (deficit)-to-provincial GDP measures the difference between revenue and expenses expressed as a percentage of GDP. It is a measure of a government’s ability to meet its financing needs and to ensure proper management of public finances.
Table 1 shows the five-year trend in annual revenue, expenses, operating surplus (deficit) and operating surplus (deficit)-to-provincial GDP.
The annual operating surplus (deficit)-to-provincial GDP improved in 2025/26 as strong tax revenues helped to outpace expenses.
Table 1
| Annual Operating Surplus (Deficit) |
($ | millions) | ||||||||||||||||||
| 2021/22 Restated |
2022/23 Restated |
2023/24 Restated |
2024/25 Restated |
2025/26 Actual |
||||||||||||||||
| Total revenue |
19,973 | 22,283 | 21,813 | 24,377 | 25,083 | |||||||||||||||
| Total expenses |
20,694 | 21,885 | 23,763 | 25,493 | 25,915 | |||||||||||||||
| Operating surplus (deficit) |
(721) | 398 | (1,950) | (1,116) | (832) | |||||||||||||||
| Annual operating surplus (deficit) to provincial GDP |
(0.9%) | 0.5% | (2.1%) | (1.2%) | (0.8%) | |||||||||||||||
Flexibility
Flexibility is the degree to which a government can increase financial resources to respond to rising commitments, either by expanding its revenue or by increasing its net debt.
Public Sector Accounting Board has recommended a number of financial indicators that assess a government’s flexibility. The following indicators are considered applicable to provide insight into the Manitoba government’s flexibility:
| • | Public Debt Charges to Total Revenue – the extent to which borrowing decisions constrain a government’s ability to meet financial and service commitments |
| • | Own-Source Revenue to Provincial GDP – the extent to which a government is taking income out of the economy through taxation and user fees |
PUBLIC DEBT CHARGES TO TOTAL REVENUE
The amount of public debt charges as a percentage of total revenue shows the extent to which a government must use revenue to pay for interest costs rather than to pay for services. The ratio shows how much of every dollar of a government’s revenue is needed to pay interest. A lower ratio of interest costs, as a percentage of revenue, means a government uses a smaller proportion of its revenue to pay for interest costs.
Graph 4 shows that in 2024/25, the government used 9.5 cents of every taxpayer’s dollar to pay interest. In 2025/26, this cost was 9.2 cents per dollar, a decrease from the prior period.
Graph 4
Public Debt Charges to Total Annual Revenue
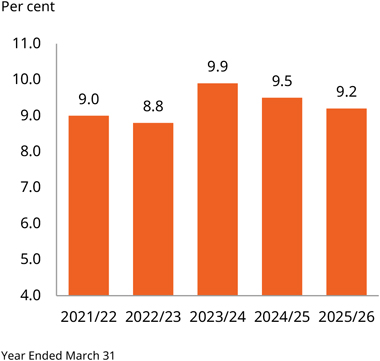
PUBLIC ACCOUNTS OF MANITOBA 35
OWN-SOURCE REVENUE TO PROVINCIAL GDP
A government’s own-source revenue, as a percentage of provincial GDP, shows how much revenue a government raises through its provincial economy via taxation and fees. Own-source revenue does not include the net income from GBEs, given the semi-autonomous nature of their operations. Their revenues are not derived from taxation or fees, but from the supply of products or services.
A higher own-source revenue as a percentage of GDP ratio means that a government is placing higher demands on its provincial economy, indicating that its demands are outpacing growth in the economy.
During 2021/22 to 2025/26, the government’s own-source revenue generally increased, except during 2023/24, when it decreased by $117 million to $14,189 million. In 2025/26, own-source revenue increased by $441 million over the prior year to $16,026 million.
For 2025/26, the main contributors to the net increase in own-source revenue from the prior year were:
| • | Income Taxes increased by $817 million, or 14.7 per cent. |
| • | Other Taxes increased by $493 million, or 10.1 per cent. Notable items in this category include: |
| o | Retail Sales Tax increased by $153 million, or 5.4 per cent. |
| o | Education Property Taxes increased by $193 million, or 23.2 per cent. |
| o | Fuel Taxes increased by $221 million, reflecting the impact of the temporary fuel tax holiday in the prior year. |
| • | Fees and Other Revenue (including tobacco settlement revenue) decreased by $748 million, or 20.6 per cent. This is primarily attributed to tobacco settlement revenue decreasing by $846 million as no additional revenue related to the March 2025 tobacco settlement had been recognized during the year. |
| • | Recovery from government business enterprises and Other Investment Earnings decreased by $129 million or 8.8 per cent. |
Graph 5 shows the five-year historic trend of own-source revenue to provincial GDP. GDP increased from $79.3 billion in 2021/22 to $100.3 billion in 2025/26. Own-source revenue increased by $2,637 million over the same period, from $13,389 million in 2021/22 to $16,026 million in 2025/26. The ratio of own-source revenue to provincial GDP decreased to 16 per cent in 2025/26 from 16.2 per cent in 2024/25.
Graph 5
Own-Source Revenue to Provincial GDP
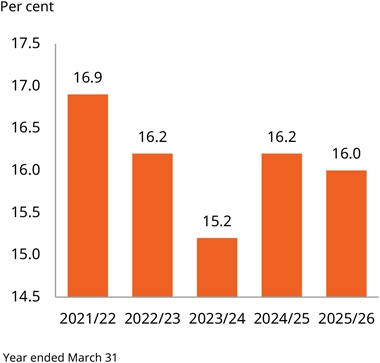
Changes in outside sources of revenue due to capital projects and other one-time or non-operational programs do not indicate a material increase in a government’s revenue vulnerability.
36 PROVINCE OF MANITOBA ANNUAL REPORT AND PUBLIC ACCOUNTS 2026
Vulnerability
Vulnerability is the degree to which a government is dependent upon, and therefore, vulnerable to fluctuations in sources of revenue outside of its direct control or influence. A high degree of dependency may indicate a government is reliant on outside sources to deliver programs and services at the current level and quality.
Manitoba received $123 million, or 9.8 per cent more, in federal cost-shared targeted program revenue in 2025/26, compared to 2024/25, primarily due to higher shared cost and other transfers.
Total federal transfers, including Equalization, Canada Health Transfers, Canada Social Transfers, and shared cost and other transfers, increased by $575 million, or 7.1 per cent, from 2024/25.
FEDERAL TRANSFERS TO TOTAL REVENUE
The ratio of federal transfers to total revenue indicates the vulnerability of governments to changes in transfer support from the Government of Canada.
Graph 6 shows that the ratio of major federal transfers to total provincial revenue increased from a historical low of 25.4 per cent in 2018/19 to 34.6 per cent in 2025/26. Manitoba experienced a decline in federal transfers as a share of total revenue between 2012/13 and 2015/16. However, transfers to Manitoba, including those for targeted program delivery, have generally increased since 2019/20 and have remained above the 15-year average of 28.6 per cent since 2023/24. The ratio in 2025/26 is higher than the previous year’s restated ratio of 33.2 per cent.
Graph 6
Federal Transfers to Total Revenue*
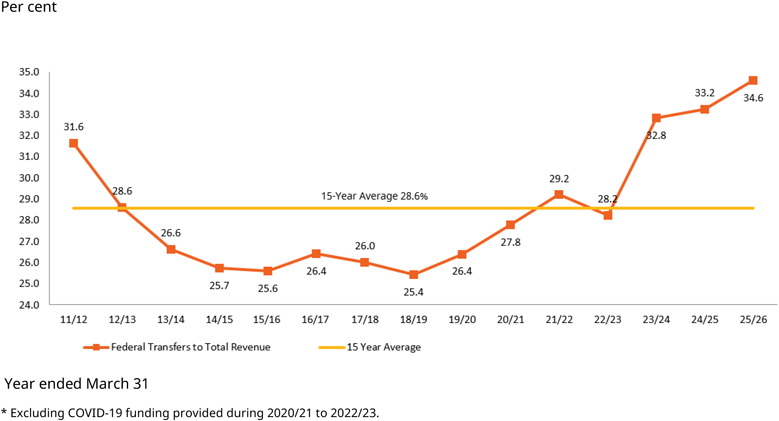
PUBLIC ACCOUNTS OF MANITOBA 37
RISKS AND UNCERTAINTIES
The Manitoba economy, as measured by GDP, has grown at an average rate of 1.9 per cent in real terms and 4.3 per cent in nominal values from 2023 to 2025. These rates have matched the national growth for both real and nominal figures and are near the average for the past 10 years. In 2026, growth is
projected to slow due to several economic developments that provide new risks and uncertainties to Manitoba revenue and expenses. The Manitoba Economic Activity Index, which is closely correlated with nominal GDP, slowed in the first months of 2026 but has started to gain momentum in recent months.
Manitoba Economic Activity Index
12-Month Moving Average
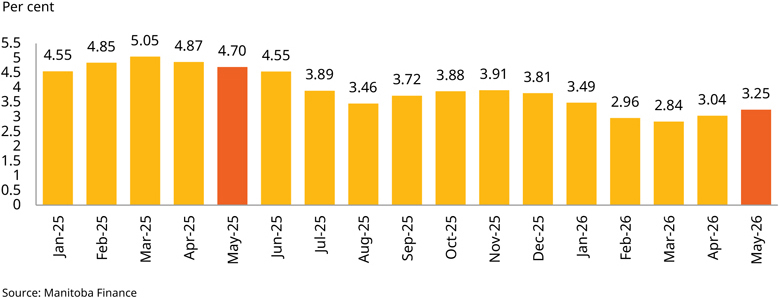
The current tariffs that the United States (U.S.) has levied on imports from Canada continue to pose a threat to the Manitoba economy since exports from the province are now more expensive for U.S. businesses and consumers.
International exports of goods to the U.S. (excluding pharmaceuticals) dropped 2.5 per cent in 2025 and have remained subdued in 2026. At the same time, exports to non-U.S. countries advanced 7.6 per cent in 2025 as producers began to diversify their markets.
Manitoba International Exports
12-Month Moving Average
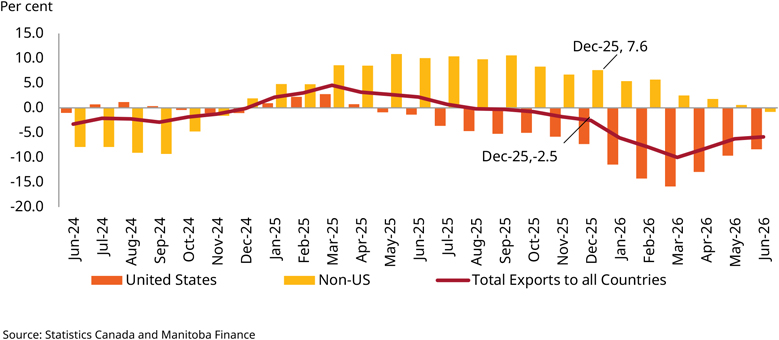
38 PROVINCE OF MANITOBA ANNUAL REPORT AND PUBLIC ACCOUNTS 2026
With the overall decrease in shipments abroad, nominal GDP growth is projected to moderate from 4.3 per cent in 2025 to 4.1 per cent in 2026, according to a Manitoba Finance survey of economic forecasts. The effects of the trade disruptions have so far remained muted due to the ongoing conditions of the Canada-United States-Mexico (CUSMA) trade agreement that covers nearly 90 per cent of exports to the U.S. Market diversification to other countries, as well as to other provinces and territories, have continued to advance the economy. Other positive impacts include reduced intra-provincial trade barriers and an increase in domestic tourism. At the same time, current negotiations to update CUSMA are a further potential risk to provincial exports, particularly for manufacturers and agricultural producers.
Extreme weather events continue to pose a risk to the economy. The 2025 wildfire season was the worst in three decades. The fires had direct economic impacts on communities, jobs, local industries, and increased government emergency expenditures. The drought conditions also had a strong negative impact on Manitoba Hydro revenues, particularly for exports of electricity.
Flooding in the spring of 2026 has caused a loss of infrastructure and housing, further adding to the stress on provincial finances. Wet conditions may improve Manitoba Hydro revenues but dampen crop production in 2026.
Global conflicts continue to destabilize the economy and add risks to the Manitoba outlook. The conflict in Iran has increased oil prices and fractured supply
chains. Inflationary pressures have surged as a result. The Russia and Ukraine conflict remains unresolved, further adding to possible risks to the economy and society.
In Canada, immigration restrictions on non-permanent residents have slowed population growth. While easing pressures on housing, the change in policy may cause labour shortages for certain occupations. It has also had a significant impact on post-secondary institutions in the province by reducing the number of international students.
Manitoba had the lowest unemployment rate at 5.5 per cent year-to-date in Canada and will need to continue to find workers within the province, or from other regions, to keep up with strong employment growth (1.9 per cent year-to-date). Economic upheaval from other events could upend this growth and reduce personal income tax revenues.
Retail sales advanced 4.1 per cent in 2025 but have slowed in the first months of 2026 reaching a year-to-date growth rate of 3.5 per cent as of June. Slow population growth along with economic uncertainty have kept spending restrained. A sluggish national economy along with other economic uncertainties pose risks to household spending and sales tax revenue.
At the same time, interest rates stabilized in October 2025 as the Bank of Canada rate has been held at 2.25 per cent since then. The easing of monetary conditions provided an improved outlook for investment and competitiveness, as well as debt financing for all sectors in the economy, including households, corporations and government.
Bank of Canada Policy Rate, January 2025 to July 2026
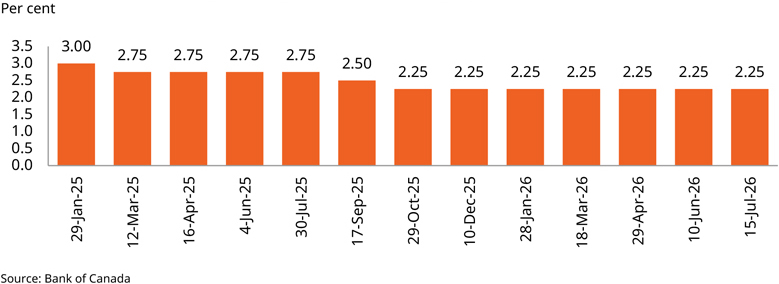
PUBLIC ACCOUNTS OF MANITOBA 39
Forecast reductions in nominal GDP growth in the coming years may slow the pace of tax revenue growth. While the government typically sets aside revenue contingencies to help mitigate potential shortfalls, fiscal pressures remain elevated, underscoring the importance of cautious financial planning and revenue diversification.
The government’s overall exposure to risks and uncertainties arises from many variables which it does not directly control. These include:
| • | Volatility in economic factors such as inflation, interest rates and commodity prices |
| • | Geopolitical tensions and their repercussions to the global economy |
| • | Trade barriers including tariffs on imports and exports |
| • | Extreme weather events |
| • | Tax reforms in other jurisdictions that can materially shift tax planning and tax competitiveness |
| • | Changes in federal transfers |
| • | Unforeseen delays with planned capital investment due to environmental or other obligations |
| • | The financial performance of Crown corporations, especially Manitoba Hydro |
| • | Outcomes from litigation, arbitration, and negotiations with third parties |
| • | Utilization rates for government services such as health care, child and family services, or employment assistance |
| • | Changes in accounting standards |
| Key Fiscal Sensitivities |
($ millions) | |||
| Variable |
Increase of: | Annual Fiscal Impact | ||
| Nominal GDP |
One percentage point |
$162 | ||
| Debt |
$500 million | ($21) | ||
40 PROVINCE OF MANITOBA ANNUAL REPORT AND PUBLIC ACCOUNTS 2026
VARIANCE ANALYSIS AND ASSESSMENT OF SIGNIFICANT TRENDS OPERATING SURPLUS (DEFICIT)
| ($ millions) |
||||||||||||||||||||
| Variance |
||||||||||||||||||||
| 2025/26 Budget |
2025/26 Actual |
2024/25 Restated |
2025/26 vs 2024/25 Actual |
2025/26 Actual to Budget |
||||||||||||||||
| REVENUE |
||||||||||||||||||||
| Income taxes |
6,034 | 6,375 | 5,558 | 817 | 341 | |||||||||||||||
| Other taxes |
5,177 | 5,394 | 4,901 | 493 | 217 | |||||||||||||||
| Fees and other revenue |
2,847 | 2,880 | 3,628 | (748) | 33 | |||||||||||||||
| Endowment contributions |
- | 35 | 27 | 8 | 35 | |||||||||||||||
| Recovery from government business enterprises and other investment earnings |
1,262 | 1,342 | 1,471 | (129) | 80 | |||||||||||||||
| Contingency |
(200) | - | - | - | 200 | |||||||||||||||
| Total own-source revenue |
15,120 | 16,026 | 15,585 | 441 | 906 | |||||||||||||||
| Government business enterprises |
1,006 | 377 | 687 | (310) | (629) | |||||||||||||||
| Federal transfers |
8,930 | 8,680 | 8,105 | 575 | (250) | |||||||||||||||
| Total revenue |
25,056 | 25,083 | 24,377 | 706 | 27 | |||||||||||||||
| EXPENSES |
||||||||||||||||||||
| Legislative Assembly |
65 | 63 | 59 | 4 | (2) | |||||||||||||||
| Executive Council |
6 | 5 | 5 | - | (1) | |||||||||||||||
| Advanced Education and Training |
2,028 | 2,074 | 1,888 | 186 | 46 | |||||||||||||||
| Agriculture |
550 | 380 | 505 | (125) | (170) | |||||||||||||||
| Business, Mining, Trade and Job Creation |
189 | 171 | 184 | (13) | (18) | |||||||||||||||
| Education and Early Childhood Learning |
4,143 | 4,144 | 3,914 | 230 | 1 | |||||||||||||||
| Environment and Climate Change |
216 | 293 | 273 | 20 | 77 | |||||||||||||||
| Families |
2,184 | 2,283 | 2,847 | (564) | 99 | |||||||||||||||
| Finance |
100 | 100 | 109 | (9) | - | |||||||||||||||
| Health, Seniors and Long-Term Care |
9,594 | 9,659 | 9,047 | 612 | 65 | |||||||||||||||
| Housing, Addictions and Homelessness |
869 | 851 | 778 | 73 | (18) | |||||||||||||||
| Innovation and New Technology |
211 | 196 | 156 | 40 | (15) | |||||||||||||||
| Justice |
994 | 960 | 907 | 53 | (34) | |||||||||||||||
| Labour and Immigration |
41 | 39 | 34 | 5 | (2) | |||||||||||||||
| Municipal and Northern Relations |
793 | 710 | 642 | 68 | (83) | |||||||||||||||
| Natural Resources and Indigenous Futures |
152 | 146 | 138 | 8 | (6) | |||||||||||||||
| Public Service Commission |
32 | 31 | 33 | (2) | (1) | |||||||||||||||
| Public Service Delivery |
244 | 270 | 320 | (50) | 26 | |||||||||||||||
| Sport, Culture, Heritage and Tourism |
122 | 122 | 116 | 6 | - | |||||||||||||||
| Transportation and Infrastructure |
616 | 621 | 576 | 45 | 5 | |||||||||||||||
| Enabling appropriations |
108 | 34 | 34 | - | (74) | |||||||||||||||
| Emergency expenditures |
50 | 272 | 30 | 242 | 222 | |||||||||||||||
| Tax credits |
206 | 178 | 157 | 21 | (28) | |||||||||||||||
| Debt servicing |
2,337 | 2,313 | 2,316 | (3) | (24) | |||||||||||||||
| Tobacco settlement |
- | - | 425 | (425) | - | |||||||||||||||
| Total expenses |
25,850 | 25,915 | 25,493 | 422 | 65 | |||||||||||||||
| Operating surplus (deficit) |
(794) | (832) | (1,116) | 284 | (38) | |||||||||||||||
PUBLIC ACCOUNTS OF MANITOBA 41
The government ended the year 2025/26 with a deficit of $832 million, which is $38 million higher than the budgeted deficit of $794 million. Total revenue was $25,083 million and total expenses were $25,915 million. Revenue was $27 million higher than budget, while expenses were $65 million higher than budget.
REVENUE ANALYSIS
The most significant factors causing the revenue variances from the 2025/26 budget are:
| • | Income taxes were $341 million or 5.7 per cent higher than budget, including $217 million or 4.4 per cent higher individual income taxes and $124 million or 11.6 per cent higher corporation income taxes in comparison to the budgeted amount. Variances for both individual and corporation income tax reflect higher year-to-date assessments from the Canada Revenue Agency (CRA) at year-end in comparison to the information available at the time when Budget 2025 was prepared. The variance for individual income tax also includes a positive prior year adjustment. |
| • | Other taxes were $217 million, or 4.2 per cent higher than budget, primarily due to higher retail sales tax reflecting strong household spending on services, higher corporations taxes due to stronger profitability in the mining sector, higher education property taxes, higher fuel taxes reflecting stronger household fuel consumption, higher health and education levy revenues due to stronger compensation growth, and higher vaping tax revenues. |
| • | Fees and other revenue were $33 million or 1.2 per cent higher than budget largely due to an increase in pharmaceutical rebates and non-insured patient revenue and recoveries in the health sector partially offset by a decrease in Manitoba Agricultural Services Corporation revenue. |
| • | Endowment contributions were $35 million higher than budget, as this balance was recognized as part of revenue starting in fiscal year 2025/26 and thus, not considered for Budget 2025. |
| • | Recovery from government business enterprises and other investment earnings was $80 million, or 6.3 per cent higher than budget, primarily |
| reflecting higher than anticipated investment earnings. |
| • | Net income from government business enterprises was $629 million or 62.5 per cent less than the budget of $1,006 million. |
| o | Manitoba Hydro-Electric Board reported a net loss of $446 million, a decrease of $666 million from budget. The decrease was primarily due to drought conditions causing low reservoir storage levels, coupled with precipitation levels among the lowest on record during the summer months, resulting in lower export revenues and higher fuel and power purchase costs. Domestic electric revenue was also lower than budget due to lower consumption. Domestic gas revenue was also lower than budget due to the cancellation of the Federal Carbon Charge during the year. |
| o | Manitoba Public Insurance Corporation reported net income of $56 million, an increase of $47 million above budget. The increase was primarily due to higher volume of basic insurance policies in force, partially offset by lower commercial insurance demand, lower investment income, and higher corporate operating expenses. |
| o | Manitoba Liquor and Lotteries Corporation reported net income of $724 million, a decrease of $13 million. Actual results reflected softening video lottery performance consistent with other jurisdictions and decreases in liquor sales driven by lower per capita consumption, offset by higher revenues from cannabis, casinos and online gaming. |
| • | Federal government transfers were $250 million, or 2.8 per cent lower than budget, primarily due to lower shared cost and other transfers, including delays in expenditures under the Canada-Manitoba Canada-Wide Early Learning and Child Care Agreement related to post-secondary institutions and public school division capital projects. It is also due to delays attributed to the Investing in Canada Infrastructure Program (ICIP) due to supply and labour shortages. |
42 PROVINCE OF MANITOBA ANNUAL REPORT AND PUBLIC ACCOUNTS 2026
Revenue trend analysis provides users with information about significant changes in revenue over time and between sources, enabling users to evaluate
past performance and assess potential implications for the future.
The following section outlines the revenue trends in Manitoba.
| Revenue Trend Analysis by Source |
($ millions) | |||||||||||||||||||
| 2021/22 Restated |
2022/23 Restated |
2023/24 Restated |
2024/25 Restated |
2025/26 Actual |
||||||||||||||||
| Income taxes |
5,245 | 5,794 | 5,369 | 5,558 | 6,375 | |||||||||||||||
| Retail sales tax |
2,387 | 2,597 | 2,703 | 2,824 | 2,977 | |||||||||||||||
| Fuel taxes |
323 | 323 | 238 | 92 | 313 | |||||||||||||||
| Levy for health and education |
385 | 415 | 431 | 440 | 478 | |||||||||||||||
| Education property tax |
728 | 733 | 698 | 833 | 1,026 | |||||||||||||||
| Other taxes |
662 | 717 | 646 | 712 | 600 | |||||||||||||||
| Fees and other revenue |
2,479 | 2,512 | 2,690 | 3,628 | 2,880 | |||||||||||||||
| Federal transfers |
6,263 | 6,470 | 7,160 | 8,105 | 8,680 | |||||||||||||||
| Net income from government business enterprises |
321 | 1,507 | 464 | 687 | 377 | |||||||||||||||
| Endowment contributions |
29 | 25 | 21 | 27 | 35 | |||||||||||||||
| Recovery from government business enterprises and other investment earnings |
1,151 | 1,190 | 1,393 | 1,471 | 1,342 | |||||||||||||||
| Total revenue |
19,973 | 22,283 | 21,813 | 24,377 | 25,083 | |||||||||||||||
PUBLIC ACCOUNTS OF MANITOBA 43
The following chart illustrates the government’s main revenue sources for 2025/26. The majority of revenue, at 63.9 per cent, was generated by Manitoba’s own sources.
Sources of Revenue for the Year Ended March 31, 2026
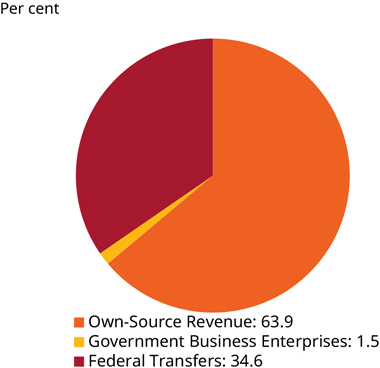
Total revenue in 2025/26 was $25,083 million, an increase of $706 million, or 2.9 per cent, from 2024/25.
The most significant factors causing the revenue variances from the previous year are:
| • | Income taxes were $6,375 million, an increase of $817 million, or 14.7 per cent from 2024/25. This was primarily due to higher individual income tax revenue, reflecting year-over-year increases in GDP and employment income, which increased the taxable income base. The increase was partially offset by lower corporation income tax revenue, as 2024/25 included a positive prior-year adjustment. |
| • | Other taxes were $5,394 million, an increase of $493 million, or 10.1 per cent from 2024/25. This was primarily due to higher fuel taxes following the end of the fuel tax holiday on January 1, 2025, higher education property taxes reflecting higher education levies by school divisions, higher retail sales tax reflecting strong household spending, higher health and education levy due to increases in wages and salaries, and higher vaping tax |
| revenues. These increases were partially offset by lower corporations taxes. |
| • | Fees and other revenue, including tobacco settlement revenue, decreased by $748 million, or 20.6 per cent from 2024/25. This decrease was primarily due to the non-recurring $846 million tobacco settlement revenue recognized in 2024/25, partially offset by a $98 million increase in other revenue in 2025/26, which was primarily due to an increase in pharmaceutical rebates and non-insured patient revenue and recoveries in the health sector partially offset by a decrease in Manitoba Agricultural Services Corporation revenue. |
| • | Federal transfers were $8,680 million, an increase of $575 million, or 7.1 per cent from 2024/25. This increase included higher Equalization transfers due to legislated annual growth in the national Equalization envelope and an increase in Manitoba’s formula-based share, higher Canada Health Transfer revenue due to growth in the national Canada Health Transfer envelope and Manitoba’s per capita share, higher Canada Social Transfer revenue, and increased federal support for Early Learning and Child Care programs. |
| • | Net income from government business enterprises was $377 million, a decrease of $310 million or 45.1 per cent from 2024/25. The decrease was primarily due to Manitoba Hydro-Electric Board reporting a higher net loss in 2025/26, partially offset by improved results from Manitoba Public Insurance Corporation. |
| o | Manitoba Hydro-Electric Board’s net loss increased by $383 million compared to 2024/25, primarily due to the continued drought conditions resulting in some of the lowest water levels on record in Manitoba. |
| o | Manitoba Public Insurance Corporation reported net income of $56 million in 2025/26, compared to a net loss of $19 million in 2024/25. The increase was primarily due to higher volume of basic insurance policies in place, increased average premiums per policy, and normalization of expenses after one-time year-end adjustments in 2024/25. |
44 PROVINCE OF MANITOBA ANNUAL REPORT AND PUBLIC ACCOUNTS 2026
| • | Recovery from government business enterprises and other investment earnings decreased by $129 million or 8.8 per cent from 2024/25, primarily due to lower interest rates. |
EXPENSE ANALYSIS
Analysis of expenses helps users understand the impact of the government’s spending on the economy, the government’s overall allocation and use of resources, and the cost of government programs.
Total expenses in 2025/26 were $25,915 million, an increase of $65 million above the 2025/26 budget. The most significant factors causing the expense variances from the 2025/26 budget are:
| • | Emergency Expenditures were $222 million above budget primarily due to wildfire-related emergency response expenditures. |
| • | Families expenses were $99 million or 4.5 per cent higher than budget due to one-time year-end adjustments. |
| • | Environment and Climate Change expenses were $77 million, or 35.6 per cent higher than budget, primarily due to provisions for one-time year-end adjustments. |
| • | Health, Seniors and Long-Term Care expenses were $65 million, or 0.7 per cent higher than budget, primarily due to higher fee-for-service and Pharmacare costs. |
| • | Advanced Education and Training expenses were $46 million or 2.3 per cent higher than budget. This is attributed to pension valuation adjustments offset by lower expenses due to underfilled positions and the wind-up of the Manitoba Institute of Trades and Technology. |
| • | Agriculture expenses were $170 million, or 30.9 per cent below budget, primarily due to lower insurance indemnities resulting from reduced AgriInsurance claim volumes and favourable growing conditions in most parts of the province. |
| • | Municipal and Northern Relations expenses were $83 million, or 10.5 per cent below budget, primarily due to project delays in the Investing in Canada Infrastructure Program caused by supply chain issues and contractor/labour shortages. |
| • | Enabling Appropriations were $74 million, or 68.5 per cent lower than budget, mainly due to lower than anticipated expenditures on various environmental innovation projects, internal service adjustments, and other contingencies. |
| • | Justice expenses were $34 million, or 3.4 per cent lower than budget. This is attributed to the reduced impacts of contingent liabilities. |
| • | Tax credits were $28 million or 13.6 per cent lower than budget. This is attributed to lower disbursements for the Film and Video Production Tax Credit due to changes in projected sector activity after the budget period as well as delays on claims of large productions. |
PUBLIC ACCOUNTS OF MANITOBA 45
Expense by Function
Expense by function analysis provides a summary of the major areas of government spending, and changes in spending from the previous year.
Expense Trend Analysis by Function
| ($ millions) | ||||||||
| 2024/25 Restated |
2025/26 Actual |
|||||||
| Legislative Assembly |
59 | 63 | ||||||
| Executive Council |
5 | 5 | ||||||
| Advanced Education and Training |
1,888 | 2,074 | ||||||
| Agriculture |
505 | 380 | ||||||
| Business, Mining, Trade and Job Creation |
184 | 171 | ||||||
| Education and Early Childhood Learning |
3,914 | 4,144 | ||||||
| Environment and Climate Change |
273 | 293 | ||||||
| Families |
2,847 | 2,283 | ||||||
| Finance |
109 | 100 | ||||||
| Health, Seniors and Long-Term Care |
9,047 | 9,659 | ||||||
| Housing, Addictions and Homelessness |
778 | 851 | ||||||
| Innovation and New Technology |
156 | 196 | ||||||
| Justice |
907 | 960 | ||||||
| Labour and Immigration |
34 | 39 | ||||||
| Municipal and Northern Relations |
642 | 710 | ||||||
| Natural Resources and Indigenous Futures |
138 | 146 | ||||||
| Public Service Commission |
33 | 31 | ||||||
| Public Service Delivery |
320 | 270 | ||||||
| Sport, Culture, Heritage and Tourism |
116 | 122 | ||||||
| Transportation and Infrastructure |
576 | 621 | ||||||
| Enabling appropriations |
34 | 34 | ||||||
| Emergency expenditures |
30 | 272 | ||||||
| Tax credits |
157 | 178 | ||||||
| Debt servicing |
2,316 | 2,313 | ||||||
| Tobacco settlement |
425 | - | ||||||
| Total expenses by function |
25,493 | 25,915 | ||||||
Total expenses were $25,915 million in 2025/26, an increase of $422 million, or 1.7 per cent, over the 2024/25 restated amounts. The most significant factors that contributed to the variances were:
| • | Health, Seniors and Long-Term Care expenses increased by $612 million, or 6.8 per cent, primarily due to increased funding to health authorities, including acute care, long-term care and home care. The increase was primarily due to wage increases related to collective agreements, higher fee-for-service physician costs driven by increased |
| price and service volumes, increased price and volume for Pharmacare, and higher financing costs. |
| • | Emergency Expenditures increased by $242 million, primarily due to wildfire-related emergency response expenditures. |
| • | Education and Early Childhood Learning expenses increased by $230 million, or 5.9 per cent, primarily due to higher school division salary and operating |
46 PROVINCE OF MANITOBA ANNUAL REPORT AND PUBLIC ACCOUNTS 2026
| costs, and increased costs for Early Learning and Child Care programs under the Canada-Manitoba Early Learning and Child Care Agreements. |
| • | Advanced Education and Training expenses increased by $186 million, or 9.9 per cent. This is primarily attributed to one-time adjustments for pension valuation as well as general salary increases, partially offset by reduced expenses from the wind-up of the Manitoba Institute of Trades and Technology. |
| • | Housing, Addictions and Homelessness expenses increased by $73 million, or 9.4 per cent, primarily due to increased Manitoba Housing operating expenditures, including increased homelessness spending, increased funding to health authorities for mental health services, and higher psychiatric services costs. |
| • | Municipal and Northern Relations expenses increased by $68 million, or 10.6 per cent, primarily due to increased grant funding distribution for the Investing in Canada Infrastructure Program and additional one-time grant funding provided to various organizations. |
| • | Innovation and New Technology expenses increased by $40 million, or 25.6 per cent, primarily due to increased expenditures for the ERP modernization project, including systems implementation costs and SAP software maintenance. |
| • | Justice expenses increased by $53 million, or 5.8 per cent, primarily due to fewer vacancies as well as higher expenditures on public safety initiatives offset by one-time year-end adjustments. |
| • | Transportation and Infrastructure expenses increased by $45 million, or 7.8 per cent, primarily due to grant funding for Hudson Bay Railway and CentrePort Canada as well as amortization from new capital assets purchased during the year, partially offset by lower expenditures in other program areas. |
| • | Tax Credits increased by $21 million or 13.4 per cent. This is attributed to increased claims for the Renters Affordability Tax Credit as well as an increase in the corresponding benefit amount. |
| • | Families expenses decreased by $564 million, or 19.8 per cent, primarily attributed to normalization of expenditures after 2024/25 one-time adjustments, and the closure of the Manitoba Developmental Centre in 2024/25. These decreases were partially offset by higher expenditures in Child and Youth Services, mainly due to increased funding for Child and Family Services Authorities, higher basic maintenance rates, investments supporting the transition to Indigenous service delivery, and a year-end adjustment for 2025/26. |
| • | Tobacco settlement expenses decreased by $425 million, as the tobacco settlement expense recognized in 2024/25 was a one-time adjustment related to the March 2025 tobacco settlement. |
| • | Agriculture expenses decreased by $125 million, or 24.8 per cent, primarily due to lower insurance indemnities resulting from reduced AgriInsurance claim volumes and favourable growing conditions in most parts of the province. |
| • | Public Service Delivery expenses decreased by $50 million, or 15.6 per cent, primarily due to lower Materials Distribution Agency expenditures related to prior-year write-offs which impacted the prior year comparatives and grants transactions. |
PUBLIC ACCOUNTS OF MANITOBA 47
The following chart illustrates the government’s spending by function. The departments of Health, Seniors and Long-Term Care, Education and Early Childhood Learning, Families, Advanced Education and Training, and Justice represented 73.8 per cent of the total government operating expenses.
Expense by Function
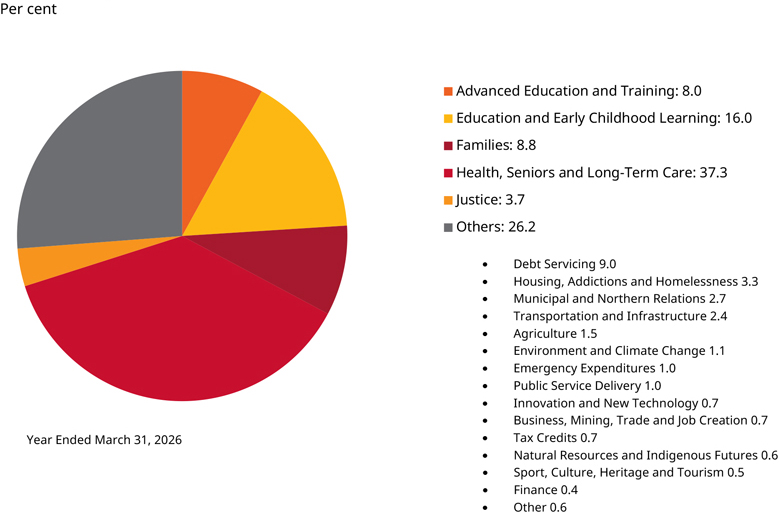
Program expenses, which represent total expenses excluding the cost of debt servicing, increased from 2024/25, primarily due to increased spending in Health, Seniors and Long-Term Care, Education and Early Childhood Learning, Emergency expenditures, Advanced Education and Training, Justice, Housing, Addictions and Homelessness, Transportation and Infrastructure and Municipal and Northern Relations. These increases were partially offset by lower expenses in Families, Agriculture, Tobacco settlement, and Public Service Delivery.
In 2025/26, total expenses as a percentage of GDP amounted to 25.8 per cent, compared to 26.5 per cent in 2024/25, while program expenses amounted to 23.5 per cent of GDP, compared to 24.1 per cent in 2024/25.
Total expenses as a percentage of total revenue were 103.3 per cent in 2025/26, compared to 104.6 per cent in 2024/25. An expense ratio of more than 100 per cent means that expenses have exceeded revenue, resulting in a deficit. A ratio of less than 100 per cent indicates that revenue exceeds expenses, resulting in a surplus.
48 PROVINCE OF MANITOBA ANNUAL REPORT AND PUBLIC ACCOUNTS 2026
Expense by Type
Expense trend analysis by type provides a summary of government spending by type and highlights changes in spending over time.
| Expense Trend Analysis by Type | ||||||||||||||||||||
| 2021/22 Restated |
2022/23 Restated |
($ millions) 2023/24 Restated |
2024/25 Restated |
2025/26 Actual |
||||||||||||||||
| Personnel services |
9,041 | 9,215 | 9,865 | 10,583 | 11,337 | |||||||||||||||
| Grants/transfer payments |
2,768 | 3,948 | 2,376 | 2,054 | 2,382 | |||||||||||||||
| Supplies and services |
2,406 | 2,500 | 2,751 | 2,959 | 3,344 | |||||||||||||||
| Social assistance related |
1,982 | 1,722 | 1,868 | 1,937 | 1,859 | |||||||||||||||
| Other operating |
1,874 | 1,695 | 3,881 | 4,740 | 3,734 | |||||||||||||||
| Debt servicing |
1,804 | 1,963 | 2,156 | 2,316 | 2,313 | |||||||||||||||
| Amortization |
819 | 842 | 866 | 904 | 946 | |||||||||||||||
| Total expenses by type |
20,694 | 21,885 | 23,763 | 25,493 | 25,915 | |||||||||||||||
| Overall allocation of spending by type was generally consistent compared with 2024/25 results. The following shows the movement in expense types compared to last year:
• Personnel services, the government’s largest expense, as a percentage of total expenses increased to 43.7 per cent in 2025/26 (2024/25 – 41.5 per cent).
• Supplies and services represented 12.9 per cent of total expenses (2024/25 – 11.6 per cent), grants/transfer payments represented 9.2 per cent (2024/25 – 8.1 per cent), social assistance related expenses represented 7.2 per cent (2024/25 – 7.6 per cent), and other operating expenses represented 14.4 per cent (2024/25 – 18.6 per cent). |
PUBLIC ACCOUNTS OF MANITOBA 49
Expense by Segment
Expense by segment analysis provides a secondary review of how the government’s expenses are categorized and the area that commands the most support.
| Expense Trend Analysis by Segment | ||||||||||||||||||||
| 2021/22 Restated |
2022/23 Restated |
($ millions) 2023/24 Restated |
2024/25 Restated |
2025/26 Actual |
||||||||||||||||
| Health |
7,758 | 7,972 | 9,078 | 9,594 | 10,285 | |||||||||||||||
| Education and economic development |
5,224 | 5,688 | 5,764 | 6,151 | 6,544 | |||||||||||||||
| Social services |
2,470 | 2,692 | 2,985 | 3,346 | 2,823 | |||||||||||||||
| Community and resource development |
1,936 | 1,884 | 2,098 | 2,204 | 2,214 | |||||||||||||||
| Justice and other expenditures |
2,050 | 2,289 | 2,288 | 2,660 | 2,503 | |||||||||||||||
| General government (Note a) |
1,725 | 2,032 | 1,953 | 2,511 | 2,312 | |||||||||||||||
| Adjustments (Note b) |
(469) | (672) | (403) | (973) | (766) | |||||||||||||||
| Total expenses by segment |
20,694 | 21,885 | 23,763 | 25,493 | 25,915 | |||||||||||||||
Note a: The general government category includes revenue from sources that cannot be attributed to a particular sector. It also includes expenses related to emergency services and disaster assistance.
Note b: Consolidation adjustments are necessary to conform sectors to government accounting policies and to eliminate transactions between sectors.
Expenses have increased by $5,221 million, or 25.2 per cent, over the past five years.
Over the past five years, Health averaged 37.9 per cent of the government’s overall expenses, Education and Economic Development averaged 25.0 per cent, Social Services averaged 12.2 per cent, Community and Resource Development averaged 8.8 per cent, and Justice and Other Expenditures averaged 10.0 per cent. The expense allocation by segment has remained relatively stable when comparing year-over-year fluctuations.
50 PROVINCE OF MANITOBA ANNUAL REPORT AND PUBLIC ACCOUNTS 2026
FINANCIAL ASSETS
An analysis of financial assets provides users with information regarding the amount of resources a government can convert to cash, if required, to discharge existing liabilities or to finance future operations.
| Financial Assets Trend Analysis | ||||||||||||||||||||
| 2021/22 Restated |
2022/23 Restated |
($ millions) 2023/24 Restated |
2024/25 Restated |
2025/26 Actual |
||||||||||||||||
| Cash and cash equivalents |
3,407 | 2,746 | 4,287 | 4,722 | 4,644 | |||||||||||||||
| Amounts receivable and advances |
2,333 | 2,541 | 2,467 | 2,710 | 2,833 | |||||||||||||||
| Inventories for resale |
17 | 15 | 14 | 12 | 14 | |||||||||||||||
| Due from Manitoba Hydro-Electric Board |
24,587 | 24,421 | 24,428 | 24,831 | 26,039 | |||||||||||||||
| Derivative financial instruments |
- | 2,055 | 2,304 | 2,223 | 2,435 | |||||||||||||||
| Portfolio investments – non-endowed |
3,133 | 4,229 | 4,150 | 4,211 | 3,795 | |||||||||||||||
| Loans and advances |
1,438 | 1,549 | 1,575 | 1,638 | 1,715 | |||||||||||||||
| Equity in government business enterprises |
3,870 | 4,678 | 4,481 | 4,391 | 4,259 | |||||||||||||||
| Equity in government business partnerships |
20 | 20 | 20 | 24 | 24 | |||||||||||||||
| Total financial assets |
38,805 | 42,254 | 43,725 | 44,762 | 45,758 | |||||||||||||||
Financial assets increased by $996 million, or 2.2 per cent, from 2024/25. This was primarily due to an increase of $1,208 million, or 4.9 per cent, in amounts due from Manitoba Hydro-Electric Board, an increase of $212 million, or 9.5 per cent, in derivative financial instruments, an increase of $123 million or 4.5 per cent in amounts receivable and an increase of $77 million, or 4.7 per cent, in loans and advances. This was partially offset by a $416 million, or 9.9 per cent, decrease in non-endowed portfolio investments, a $132 million, or 3.0 per cent decrease in equity in government business enterprises, and a $78 million, or 1.7 per cent decrease in cash and cash equivalents.
PUBLIC ACCOUNTS OF MANITOBA 51
LIABILITIES
An analysis of liabilities provides users with information to understand and assess the demands on financial assets. Liabilities consist of debt or obligations owing, to be repaid with cash or other assets.
Total liabilities in 2025/26 increased by $2,377 million, or 3.0 per cent, in comparison to total liabilities in 2024/25. This is primarily due to an increase of $1,259 million, or 5.1 per cent in borrowings on behalf of the Manitoba Hydro-Electric Board, an increase of $1,125
million, or 2.9 per cent in Taxpayer-supported debt, an increase of $311 million, or 3.3 per cent, in accounts payable, accrued charges, provisions and unearned revenue, an increase of $187 million, or 5.0 per cent in pension liabilities, and an increase of $84 million, or 9.4 per cent in asset retirement obligations. These increases were partially offset by a $589 million, or 22.0 per cent decrease in derivative financial instruments.
| Liabilities Trend Analysis | ||||||||||||||||||||
| 2021/22 Restated |
2022/23 Restated |
($ millions) 2023/24 Restated |
2024/25 Restated |
2025/26 Actual |
||||||||||||||||
| Taxpayer-supported debt |
32,398 | 33,098 | 36,223 | 38,364 | 39,489 | |||||||||||||||
| Borrowings on behalf of Manitoba Hydro-Electric Board |
24,587 | 24,421 | 24,398 | 24,925 | 26,184 | |||||||||||||||
| Accounts payable, accrued charges, provisions and unearned revenue |
6,603 | 7,518 | 8,433 | 9,318 | 9,629 | |||||||||||||||
| Derivative financial instruments |
2,874 | 2,479 | 2,677 | 2,088 | ||||||||||||||||
| Asset retirement obligations |
884 | 811 | 806 | 891 | 975 | |||||||||||||||
| Pension liability |
3,487 | 3,597 | 3,599 | 3,745 | 3,932 | |||||||||||||||
| Total liabilities |
67,959 | 72,319 | 75,938 | 79,920 | 82,297 | |||||||||||||||
Pension Liability
The government uses a diversified, conservative investment approach to mitigate the risks associated with market volatility affecting pension assets. The value of plan assets is determined using a moving average fair value method. Under this method, fair value is the underlying basis, with any excess (shortfall) of investment returns over (below) the expected long-term rate being amortized over a five-year period. When actual experience varies from actuarial estimates, for both the accrued benefit obligation and plan assets, the difference is amortized over the expected average remaining service life of the related employee group.
This method of accounting for the accrued benefit obligation and pension assets is consistent with Canadian public sector accounting standards and allows the government to smooth gains and losses over several years.
NET DEBT AND ACCUMULATED DEFICIT
Net debt is the difference between the government’s liabilities and financial assets. It represents the amount of liabilities to be funded from future revenue and taxation. Operating deficits, investments in tangible capital assets, and increases in other non-financial assets all increase net debt. Net debt is decreased by operating surplus or decreases in the value of net tangible capital assets and other non-financial assets.
Net debt increased to $36,539 million in 2025/26 (2024/25 - $35,158 million).
The main reasons for the 2025/26 increase in net debt were:
| • | 2025/26 operating deficit of $832 million |
| • | Net acquisition of tangible capital assets of $1,163 million |
| • | Increase of $112 million related to changes in non-financial assets |
| • | Offset by remeasurement gains and other adjustments of $726 million |
52 PROVINCE OF MANITOBA ANNUAL REPORT AND PUBLIC ACCOUNTS 2026
Net debt of $36,539 million as of March 31, 2026 is higher than the budgeted amount of $36,500 million by $39 million. The total accumulated deficit increased by $106 million, or 0.6 per cent, from 2024/25.
| Net Debt and Accumulated Deficit Trend Analysis | ||||||||||||||||||||
| 2021/22 Restated |
2022/23 Restated |
($ millions) 2023/24 Restated |
2024/25 Restated |
2025/26 Actual |
||||||||||||||||
| Financial assets |
38,805 | 42,254 | 43,725 | 44,762 | 45,758 | |||||||||||||||
| Less: liabilities |
(67,959) | (72,319) | (75,938) | (79,920) | (82,297) | |||||||||||||||
| Total net debt |
(29,154) | (30,065) | (32,213) | (35,158) | (36,539) | |||||||||||||||
| Non-financial assets |
16,023 | 16,393 | 17,397 | 18,474 | 19,749 | |||||||||||||||
| Total accumulated deficit |
(13,131) | (13,672) | (14,816) | (16,684) | (16,790) | |||||||||||||||
NON-FINANCIAL ASSETS INCLUDING TANGIBLE CAPITAL ASSETS
An analysis of non-financial assets provides users with information to assess changes in the government’s infrastructure and long-term non-financial assets.
| Non-Financial Assets Trend Analysis | ||||||||||||||||||||
| 2021/22 Restated |
2022/23 Restated |
($ millions) 2023/24 Restated |
2024/25 Restated |
2025/26 Actual |
||||||||||||||||
| Tangible capital assets |
14,764 | 15,167 | 16,182 | 17,206 | 18,369 | |||||||||||||||
| Portfolio investments - endowed |
830 | 847 | 928 | 1,021 | 1,123 | |||||||||||||||
| Prepaid expenses |
87 | 97 | 107 | 121 | 141 | |||||||||||||||
| Inventories |
342 | 282 | 180 | 126 | 116 | |||||||||||||||
| Total non-financial assets |
16,023 | 16,393 | 17,397 | 18,474 | 19,749 | |||||||||||||||
Non-financial assets typically represent resources a government can use in the future to provide services, the majority of which are using tangible capital assets. The management of non-financial assets has a direct impact on the level and quality of services a government can provide to its citizens.
As of March 31, 2026, the government’s non-financial assets balance was $1,275 million, or 6.9 per cent, higher than the 2024/25 balance. The majority of the government’s non-financial assets are tangible capital assets. The net book value of tangible capital assets increased by $1,163 million over the 2024/25 balance.
Total gross tangible capital asset additions for 2025/26 were $2,118 million (2024/25 – $1,961 million). Additions include investments in health and education facilities and other land-based infrastructure such as roads, bridges, water control structures, and parks.
An analysis of tangible capital assets helps users understand the government’s ability to provide services in future periods.
PUBLIC ACCOUNTS OF MANITOBA 53
| Tangible Capital Assets Trend Analysis | ||||||||||||||||||||
| 2021/22 Restated |
2022/23 Restated |
($ millions) 2023/24 Restated |
2024/25 Restated |
2025/26 Actual |
||||||||||||||||
| Land |
319 | 324 | 370 | 377 | 395 | |||||||||||||||
| Building and leasehold improvements |
6,790 | 6,609 | 6,760 | 6,924 | 7,501 | |||||||||||||||
| Vehicles and equipment |
711 | 715 | 741 | 726 | 750 | |||||||||||||||
| Computer hardware and software |
322 | 443 | 385 | 390 | 270 | |||||||||||||||
| Assets under construction |
727 | 927 | 1,502 | 2,383 | 2,684 | |||||||||||||||
| Infrastructure |
5,895 | 6,149 | 6,424 | 6,406 | 6,769 | |||||||||||||||
| Total tangible capital assets |
14,764 | 15,167 | 16,182 | 17,206 | 18,369 | |||||||||||||||
Government capitalizes the gross cost of its tangible capital assets. Recoveries from other governments, related to capital projects, are recognized as revenue in the year the capital asset is purchased or constructed. Crown land transferred to the government is not reported in the financial statements as a tangible capital asset.
The total cost of tangible capital assets has increased steadily from $26.5 billion in 2021/22 to $33.8 billion in 2025/26, demonstrating that the government has more assets available to provide services in future periods.
Similarly, the net book value of tangible capital assets, which is the remaining value of the assets on the Consolidated Statement of Financial Position, has risen from $14.8 billion in 2021/22 to $18.4 billion in 2025/26.
The following chart illustrates the total net book value of all tangible capital assets from 2021/22 to 2025/26.
Tangible Capital Assets Net Book Value
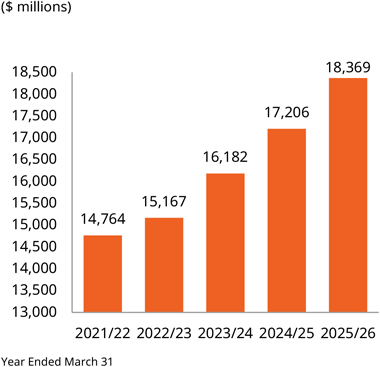
54 PROVINCE OF MANITOBA ANNUAL REPORT AND PUBLIC ACCOUNTS 2026
Infrastructure assets include roads, bridges, water control structures, and parks.
The following chart illustrates tangible capital assets by class and includes the related accumulated amortization as of March 31, 2026.
Tangible Capital Assets
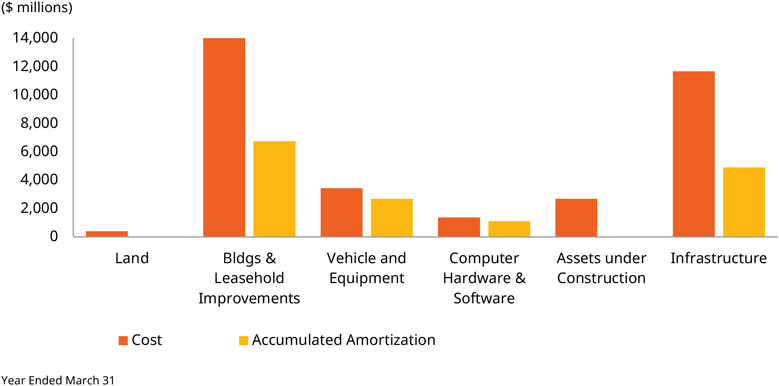
PUBLIC ACCOUNTS OF MANITOBA 55
SUMMARY FINANCIAL STATEMENTS
TABLE OF CONTENTS
| Statement of Responsibility |
59 | |||
| Auditor’s Report |
61 | |||
| Consolidated Statement of Financial Position |
67 | |||
| Consolidated Statement of Operations |
68 | |||
| Consolidated Statement of Accumulated Operating Deficit |
70 | |||
| Consolidated Statement of Remeasurement Gains and Losses |
71 | |||
| Consolidated Statement of Change in Net Debt |
72 | |||
| Consolidated Statement of Cash Flow |
73 | |||
| Notes to the Summary Financial Statements |
74 | |||
| Schedule 1 - Consolidated Statement of Amounts Receivable |
117 | |||
| Schedule 2 - Consolidated Statement of Loans and Advances |
118 | |||
| Schedule 3 - Government Business Enterprises, Schedule of Consolidated Operating Results and Financial Position |
119 | |||
| Schedule 4 - Consolidated Statement of Public Debt |
121 | |||
| Schedule 5 - Consolidated Statement of Accounts Payable, Accrued Charges, Provisions and Unearned Revenue |
123 | |||
| Schedule 6 - Consolidated Statement of Pension Liability |
124 | |||
| Schedule 7 - Consolidated Statement of Tangible Capital Assets |
126 | |||
| Schedule 8 - Government Organizations, Components and Business Enterprises Comprising the Government Reporting Entity |
127 | |||
| Schedule 9 - Consolidated Statement of Operations by Sector |
129 | |||
| Schedule 10 - Restated Budget |
131 | |||

Office of the Provincial Comptroller
www.manitoba.ca
STATEMENT OF RESPONSIBILITY
The summary financial statements are prepared under the direction of the Minister of Finance in accordance with the stated accounting policies of the Government reporting entity and include summary statements of financial position, revenue and expense, accumulated deficit, remeasurement gains and losses, change in net debt, cash flow, notes and schedules integral to the statements. Together, they present fairly, in all material respects, the financial position of the Government as at March 31, 2026, and the results of its operations, its remeasurement gains and losses, the changes in its net debt, and its cash flows for the year then ended in accordance with Canadian public sector accounting standards.
The Government is responsible for the integrity and objectivity of the summary financial statements. In the preparation of these statements, estimates are sometimes necessary because a precise determination of certain assets, liabilities, revenues and expenses is dependent on future events. The Government believes such estimates have been based on careful judgements and have been properly reflected in the summary financial statements.
The Government fulfills its accounting and reporting responsibilities, through the Office of the Provincial Comptroller, by maintaining systems of financial management and internal control. The systems are continually enhanced and modified to provide timely and accurate information, to safeguard and control the Government’s assets, and to ensure all transactions are in accordance with The Financial Administration Act.
The Auditor General expresses an independent opinion on these financial statements. His report, stating the scope of his audit and opinion, appears on the following page.
These financial statements are tabled in the Legislature. They are referred to the Standing Committee on Public Accounts, which reports to the Legislature on the results of its examination together with any recommendations it may have with respect to the financial statements and accompanying audit opinion.
On behalf of the Government of the Province of Manitoba approved by:
Original signed by
Salman Tariq
Acting Provincial Comptroller
September 11, 2026

INDEPENDENT AUDITOR’S REPORT
To the Legislative Assembly of the Province of Manitoba
Opinion
We have audited the consolidated financial statements of the Province of Manitoba (the Province), which comprise the consolidated statement of financial position as at March 31, 2026, and the consolidated statement of operations, consolidated statement of accumulated operating deficit, consolidated statement of remeasurement gains and losses, consolidated statement of changes in net debt and consolidated statement of cash flow for the year then ended, and notes to the consolidated financial statements, including a summary of significant accounting policies (the Summary Financial Statements).
In our opinion, the accompanying consolidated Summary Financial Statements present fairly, in all material respects, the consolidated financial position of the Province as at March 31, 2026, and the consolidated statement of operations, consolidated statement of accumulated operating deficit, consolidated remeasurement gains and losses, consolidated changes in net debt, and consolidated cash flow for the year then ended in accordance with Canadian public sector accounting standards (PSAS).
Basis for opinion
We conducted our audit in accordance with Canadian generally accepted auditing standards. Our responsibilities under those standards are further described in the Auditor’s responsibilities for the audit of the Summary Financial Statements section of our report. We are independent of the Province in accordance with the ethical requirements in Canada that are relevant to our audit of the Summary Financial Statements, and we have fulfilled our other ethical responsibilities in accordance with these requirements. We believe that the audit evidence we have obtained is sufficient and appropriate to provide a basis for our opinion.
Key audit matters
Key audit matters are those matters that, in our professional judgment, were of most significance in our audit of the Summary Financial Statements for the current period. These matters were addressed in the context of our audit of the Summary Financial Statements as a whole, and in forming our auditor’s opinion thereon, and we do not provide a separate opinion on these matters.
Office: 204. 945.3790 | 500-330 Portage Avenue | Winnipeg, Manitoba R3C 0C4 | oag.mb.ca

|
Key audit matters |
||
|
Corporate and personal income tax revenues
Overview Corporate and personal income tax are major sources of revenues for the Province, at $1.2 billion and $5.2 billion respectively in the 2026 fiscal year.
The Province estimates provincial tax revenue generated between January and March 2026 by considering economic forecasts and modelling. For revenue from April to December 2025, the estimate is based on Canada Revenue Agency tax assessment data received to date.
Related financial statement disclosures Note 1 - Significant Accounting Policies; Note 1 D. – Measurement Uncertainty Schedule 1 - Consolidated Statement of Amounts Receivable Schedule 5 – Consolidated Statement of Accounts Payable, Accrued Charges, Provisions and Unearned Revenue
Why this is a key audit matter. Corporate and personal income tax revenues are estimates involving significant management judgment and estimation uncertainty.
Income tax revenue in a fiscal year is derived from management’s estimates of tax for two separate calendar years. For the year ended March 31, 2026, the Province recorded nine months of revenue for the 2025 calendar year and three months of revenue for the 2026 calendar year. The Canada Revenue Agency will not finalize its assessments for either of these years until after the financial statements for the year ended March 31, 2026, have been issued. Uncertainty exists due to differences that may arise between final tax assessments and initial economic estimates.
|
How the matter was addressed during the audit:
● We obtained an understanding of the systems and controls over the process of recording and estimating these tax revenues.
● We engaged an independent economist to assist in evaluating the reasonableness and completeness of the Province’s economic forecast model, including management’s key assumptions, as well as the reliability and appropriateness of the underlying data used by the Province.
● We reviewed the Province’s retrospective analysis comparing previous actual results to managements’ estimates using the current model.
● We tested the accuracy of management’s calculations supporting the estimate.
● We reviewed the Province’s accounting adjustments made to its economic forecasts. |
|
Key audit matters |
||
|
Contingent legal liabilities
Overview Contingent liabilities represent potential future obligations that may impact the Province’s financial position, depending on the outcome of future events outside the Province’s control. The Province has recognized approximately $1.5 billion in contingent liabilities as at March 31, 2026 related to its involvement in several legal cases. Contingent liabilities must be recorded in the financial statements when management deems it likely the expected outcome will result in a liability, and the amount of the liability can be reasonably estimated.
Related financial statement disclosures Note 1 D. – Measurement Uncertainty Note 8 – Contingencies A. Contingent liabilities Schedule 5 – Consolidated Statement of Accounts Payable, Accrued Charges, Provisions and Unearned Revenue (included in “Other Accrued Charges” total)
Why this is a key audit matter.
Recognition of contingent legal liabilities is a key audit matter due to the significant judgment required to assess the likelihood of future confirming events, and the inherent complexity of the estimation methodologies used.
There is uncertainty related to the potential settlement costs used in the estimates and the inherent subjectivity when using a range of costs to determine the best estimate.
Estimates may need to be continuously revised and refined because of ongoing activity in each case, recent and prior settlements, appeals or agreements and decisions made by the court.
|
How the matter was addressed during the audit:
● We reviewed management’s legal claims assessments and the related correspondence from the Province’s legal counsel.
● We assessed the reasonableness of management’s significant judgments made in evaluating the likelihood of legal claims and estimating the related liabilities.
● We evaluated management’s calculations and assumptions used in estimating the liabilities.
● We obtained confirmation from the Province’s legal counsel, to assess the completeness and valuation of legal claims. | |
Other information
The Province is responsible for the other information. The other information comprises the Province of Manitoba Annual Report and Public Accounts (the Annual Report) (but does not include the Summary Financial Statements and our auditor’s report thereon), which we obtained prior to the date of this auditor’s report.
Our opinion on the Summary Financial Statements does not cover the other information and we will not express any form of assurance conclusion thereon.
In connection with our audit of the Summary Financial Statements, our responsibility is to read the other information identified above and, in doing so, consider whether the other information is materially inconsistent with the Summary Financial Statements, or our knowledge obtained in the audit or otherwise appears to be materially misstated.
We obtained the Annual Report prior to the date of this auditor’s report. If, based on the work we have performed, we conclude that there is a material misstatement of this other information, we are required to report that fact. We have nothing to report in this regard.
Responsibilities of management and those charged with governance for the Summary Financial Statements
Management is responsible for the preparation and fair presentation of the Summary Financial Statements in accordance with PSAS, and for such internal control as management determines is necessary to enable the preparation of Summary Financial Statements that are free from material misstatement, whether due to fraud or error.
In preparing the Summary Financial Statements, management is responsible for assessing the Province’s ability to continue as a going concern, disclosing, as applicable, matters related to going concern and using the going concern basis of accounting unless an intention exists to liquidate the Province or to cease operations, or there is no realistic alternative but to do so.
Those charged with governance are responsible for overseeing the Province’s financial reporting process. With respect to the Province, those charged with governance refers to the Minister of Finance.
Auditor’s responsibilities for the audit of the Summary Financial Statements
Our objectives are to obtain reasonable assurance about whether the Summary Financial Statements as a whole are free from material misstatement, whether due to fraud or error, and to issue an auditor’s report that includes our opinion. Reasonable assurance is a high level of assurance but is not a guarantee that an audit conducted in accordance with Canadian generally accepted auditing standards will always detect a material misstatement when it exists. Misstatements can arise from fraud or error and are considered material if, individually or in the aggregate, they could reasonably be expected to influence the economic decisions of users taken on the basis of these Summary Financial Statements.
As part of an audit in accordance with Canadian generally accepted auditing standards, we exercise professional judgment and maintain professional skepticism throughout the audit. We also:
| ● | Identify and assess the risks of material misstatement of the Summary Financial Statements, whether due to fraud or error, design and perform audit procedures responsive to those risks, and obtain audit evidence that is sufficient and appropriate to provide a basis for our opinion. The risk of not detecting a material misstatement resulting from fraud is higher than for one resulting from error, as fraud may involve collusion, forgery, intentional omissions, misrepresentations, or the override of internal control. |
| ● | Obtain an understanding of internal control relevant to the audit in order to design audit procedures that are appropriate in the circumstances, but not for the purpose of expressing an opinion on the effectiveness of the Province’s internal control. |
| ● | Evaluate the appropriateness of accounting policies used and the reasonableness of accounting estimates and related disclosures made by management. |
| ● | Conclude on the appropriateness of management’s use of the going concern basis of accounting and, based on the audit evidence obtained, whether a material uncertainty exists related to events or conditions that may cast significant doubt on the Province’s ability to continue as a going concern. If we conclude that a material uncertainty exists, we are required to draw attention in our auditor’s report to the related disclosures in the Summary Financial Statements or, if such disclosures are inadequate, to modify our opinion. Our conclusions are based on the audit evidence obtained up to the date of our auditor’s report. However, future events or conditions may cause the Province to cease to continue as a going concern. |
| ● | Evaluate the overall presentation, structure, and content of the Summary Financial Statements, including the disclosures, and whether the Summary Financial Statements represent the underlying transactions and events in a manner that achieves fair presentation. |
| ● | Obtain sufficient appropriate audit evidence regarding the financial information of the entities or business activities within the Province to express an opinion on the Summary Financial Statements. We are responsible for the direction, supervision and performance of the group audit. We remain solely responsible for our audit opinion. |
We communicate with those charged with governance regarding, among other matters, the planned scope and timing of the audit and significant audit findings, including any significant deficiencies in internal control that we identify during our audit.
We also provide those charged with governance with a statement that we have complied with relevant ethical requirements regarding independence, and to communicate with them all relationships and other matters that may reasonably be thought to bear on our independence, and where applicable, related safeguards.
From the matters communicated with those charged with governance, we determine those matters that were of most significance in the audit of the Summary Financial Statements of the current period and are therefore the key audit matters. We describe these matters in our auditor’s report unless law or regulation precludes public disclosure about the matter or when, in extremely rare circumstances, we determine that a matter should not be communicated in our report because the adverse consequences of doing so would reasonably be expected to outweigh the public interest benefits of such communication.
Original signed by
Tyson Shtykalo, FCPA, FCA
Auditor General
Winnipeg, Manitoba
September 11, 2026
SUMMARY FINANCIAL STATEMENTS
CONSOLIDATED STATEMENT OF FINANCIAL POSITION
As at March 31, 2026
| ($ millions)
| ||||||||||
| SCHEDULE
|
2026
Actual |
2025
Restated | ||||||||
| FINANCIAL ASSETS | ||||||||||
| Cash and cash equivalents | 4,644 | 4,722 | ||||||||
| 1 | Amounts receivable | 2,833 | 2,710 | |||||||
| Inventories for resale | 14 | 12 | ||||||||
| 2 | Due from Manitoba Hydro-Electric Board (Note 14) | 26,039 | 24,831 | |||||||
| Derivative financial instruments (Note 3) | 2,435 | 2,223 | ||||||||
| Portfolio investments - non-endowed (Note 2 and 4) | 3,795 | 4,211 | ||||||||
| 2 | Loans and advances | 1,715 | 1,638 | |||||||
| 3 | Equity in government business enterprises (Note 5) | 4,259 | 4,391 | |||||||
| Equity in government business partnerships (Note 6) | 24 | 24 | ||||||||
|
|
|
|
|
|
| |||||
| Total Financial Assets | 45,758 | 44,762 | ||||||||
|
|
|
|
|
|
| |||||
| LIABILITIES | ||||||||||
| 4 | Taxpayer-supported debt | 39,489 | 38,364 | |||||||
| 4 | Borrowings on behalf of Manitoba Hydro-Electric Board | 26,184 | 24,925 | |||||||
| 5 | Accounts payable, accrued charges, provisions and unearned revenue | 9,629 | 9,318 | |||||||
| Derivative financial instruments (Note 3) | 2,088 | 2,677 | ||||||||
| Asset retirement obligations (Note 13) | 975 | 891 | ||||||||
| 6 | Pension liability (Note 7) | 3,932 | 3,745 | |||||||
|
|
|
|
|
|
| |||||
| Total Liabilities | 82,297 | 79,920 | ||||||||
|
|
|
|
|
|
| |||||
| NET DEBT | (36,539 | ) | (35,158 | ) | ||||||
|
|
|
|
|
|
| |||||
| NON-FINANCIAL ASSETS | ||||||||||
| Inventories held for use | 116 | 126 | ||||||||
| Portfolio investments - endowed (Note 2 and 4) | 1,123 | 1,021 | ||||||||
| Prepaid expenses | 141 | 121 | ||||||||
| 7 | Tangible capital assets | 18,369 | 17,206 | |||||||
|
|
|
|
|
|
| |||||
| Total Non-Financial Assets | 19,749 | 18,474 | ||||||||
|
|
|
|
|
|
| |||||
| ACCUMULATED DEFICIT | (16,790 | ) | (16,684 | ) | ||||||
|
|
|
|
|
|
| |||||
| Accumulated deficit is comprised of: | ||||||||||
| Accumulated deficit - operating | (16,666 | ) | (15,834 | ) | ||||||
| Accumulated remeasurement losses | (124 | ) | (850 | ) | ||||||
|
|
|
|
|
|
| |||||
| (16,790 | ) | (16,684 | ) | |||||||
|
|
|
|
|
|
| |||||
The accompanying notes and schedules are an integral part of these financial statements.
| SUMMARY FINANCIAL STATEMENTS | 67 |
SUMMARY FINANCIAL STATEMENTS
CONSOLIDATED STATEMENT OF OPERATIONS
For the Year Ended March 31, 2026
| ($ millions) | ||||||||||||
| 2026 | 2026 | 2025 | ||||||||||
| Budget | Actual | Restated | ||||||||||
| Restated1 | ||||||||||||
| REVENUE |
||||||||||||
| Income taxes: |
||||||||||||
| Corporation income tax |
1,072 | 1,196 | 1,293 | |||||||||
| Individual income tax |
4,962 | 5,179 | 4,265 | |||||||||
| Other taxes: |
||||||||||||
| Corporations taxes |
274 | 306 | 444 | |||||||||
| Fuel taxes |
297 | 313 | 92 | |||||||||
| Land transfer tax |
150 | 162 | 139 | |||||||||
| Levy for health and education |
462 | 478 | 440 | |||||||||
| Retail sales tax |
2,932 | 2,977 | 2,824 | |||||||||
| Tobacco tax |
98 | 98 | 109 | |||||||||
| Other taxes |
18 | 34 | 20 | |||||||||
| Education property taxes |
946 | 1,026 | 833 | |||||||||
| Fees and other revenue: |
||||||||||||
| Fines and costs and other legal |
63 | 57 | 78 | |||||||||
| Minerals and petroleum |
25 | 18 | 21 | |||||||||
| Automobile and motor carrier licences and fees |
180 | 183 | 182 | |||||||||
| Parks: Forestry and other conservation |
45 | 45 | 51 | |||||||||
| Water power rentals |
62 | 43 | 54 | |||||||||
| Service fees and other miscellaneous charges |
1,969 | 2,049 | 1,887 | |||||||||
| Tuition fees |
503 | 485 | 509 | |||||||||
| Tobacco settlement (Note 20) |
- | - | 846 | |||||||||
| Federal transfers: |
||||||||||||
| Equalization |
4,689 | 4,689 | 4,352 | |||||||||
| Canada Health Transfers |
1,974 | 1,981 | 1,885 | |||||||||
| Canada Social Transfers |
629 | 631 | 612 | |||||||||
| Shared cost and other transfers |
1,638 | 1,379 | 1,256 | |||||||||
| Endowment contributions (Note 2 and 4) |
- | 35 | 27 | |||||||||
| Net income from government business enterprises (Schedule 3) |
1,006 | 377 | 687 | |||||||||
| Recovery from government business enterprises and other investment earnings |
1,262 | 1,342 | 1,471 | |||||||||
| Contingency |
(200) | - | - | |||||||||
|
|
|
|
|
|
|
|
| |||||
| Total Revenue (Schedule 9) |
25,056 | 25,083 | 24,377 | |||||||||
|
|
|
|
|
|
|
|
| |||||
| 68 | PROVINCE OF MANITOBA ANNUAL REPORT AND PUBLIC ACCOUNTS 2026 |
SUMMARY FINANCIAL STATEMENTS
CONSOLIDATED STATEMENT OF OPERATIONS (CONTINUED)
For the Year Ended March 31, 2026
| ($ millions) | ||||||||||||
| 2026 | 2026 | 2025 | ||||||||||
| Budget | Actual | Restated | ||||||||||
| Restated1 | ||||||||||||
| Total Revenue carried forward |
25,056 | 25,083 | 24,377 | |||||||||
|
|
|
|
|
|
|
|||||||
| EXPENSES |
||||||||||||
| Legislative Assembly |
65 | 63 | 59 | |||||||||
| Executive Council |
6 | 5 | 5 | |||||||||
| Advanced Education and Training |
2,028 | 2,074 | 1,888 | |||||||||
| Agriculture |
550 | 380 | 505 | |||||||||
| Business, Mining, Trade and Job Creation |
189 | 171 | 184 | |||||||||
| Education and Early Childhood Learning |
4,143 | 4,144 | 3,914 | |||||||||
| Environment and Climate Change |
216 | 293 | 273 | |||||||||
| Families |
2,184 | 2,283 | 2,847 | |||||||||
| Finance |
100 | 100 | 109 | |||||||||
| Health, Seniors and Long-Term Care |
9,594 | 9,659 | 9,047 | |||||||||
| Housing, Addictions and Homelessness |
869 | 851 | 778 | |||||||||
| Innovation and New Technology |
211 | 196 | 156 | |||||||||
| Justice |
994 | 960 | 907 | |||||||||
| Labour and Immigration |
41 | 39 | 34 | |||||||||
| Municipal and Northern Relations |
793 | 710 | 642 | |||||||||
| Natural Resources and Indigenous Futures |
152 | 146 | 138 | |||||||||
| Public Service Commission |
32 | 31 | 33 | |||||||||
| Public Service Delivery |
244 | 270 | 320 | |||||||||
| Sport, Culture, Heritage and Tourism |
122 | 122 | 116 | |||||||||
| Transportation and Infrastructure |
616 | 621 | 576 | |||||||||
| Enabling appropriations |
108 | 34 | 34 | |||||||||
| Emergency expenditures |
50 | 272 | 30 | |||||||||
| Tax credits |
206 | 178 | 157 | |||||||||
| Debt servicing |
2,337 | 2,313 | 2,316 | |||||||||
| Tobacco settlement (Note 20) |
- | - | 425 | |||||||||
|
|
|
|
|
|
|
|||||||
| Total Expenses (Schedule 9) |
25,850 | 25,915 | 25,493 | |||||||||
|
|
|
|
|
|
|
|||||||
| OPERATING SURPLUS (DEFICIT) FOR THE YEAR |
(794) | (832) | (1,116) | |||||||||
|
|
|
|
|
|
|
|||||||
Note 1:
The restated amounts are taken from Budget 2025 as presented to the Legislative Assembly on March 20, 2025 and restated for comparability to the current year results. Please refer to Schedule 10 and Note 22 for further details.
The accompanying notes and schedules are an integral part of these financial statements.
| SUMMARY FINANCIAL STATEMENTS | 69 |
SUMMARY FINANCIAL STATEMENTS
CONSOLIDATED STATEMENT OF ACCUMULATED OPERATING DEFICIT
For the Year Ended March 31, 2026
| ($ millions)
|
||||||||
| 2026
Actual |
2025
Restated |
|||||||
| Opening operating accumulated deficit, as previously reported |
(16,475) | (15,326) | ||||||
| Transfer to remeasurement gains and losses (Note 2) |
(105) | (105) | ||||||
| Transfer of revaluation reserve (Schedule 3) |
3 | 3 | ||||||
| Recognition of portfolio investments - endowed (Note 2) |
743 | 710 | ||||||
|
|
|
|
|
|||||
| Opening operating accumulated deficit, as restated |
(15,834) | (14,718) | ||||||
| Operating deficit for the year |
(832) | (1,116) | ||||||
|
|
|
|
|
|||||
| Ending operating accumulated deficit |
(16,666) | (15,834) | ||||||
|
|
|
|
|
|||||
The accompanying notes and schedules are an integral part of these financial statements.
| 70 | PROVINCE OF MANITOBA ANNUAL REPORT AND PUBLIC ACCOUNTS 2026 |
SUMMARY FINANCIAL STATEMENTS
CONSOLIDATED STATEMENT OF REMEASUREMENT GAINS AND LOSSES
For the Year Ended March 31, 2026
| ($ millions)
|
||||||||
| 2026
Actual |
2025
Restated |
|||||||
| Accumulated remeasurement gains (losses), beginning of year, before other comprehensive income |
(580) | 25 | ||||||
| Unrealized gains (losses) attributable to: |
||||||||
| Foreign exchange |
(234) | (389) | ||||||
| Derivatives |
831 | (271) | ||||||
| Portfolio investments: |
||||||||
| Quoted in an active market |
15 | 19 | ||||||
| Designated to fair value |
98 | 100 | ||||||
|
|
|
|
|
|||||
| Total unrealized gains (losses) |
710 | (541) | ||||||
|
|
|
|
|
|||||
| Reclassified to consolidated statement of operations: |
||||||||
| Foreign exchange |
(23) | 202 | ||||||
| Derivatives |
13 | (202) | ||||||
| Portfolio investments: |
||||||||
| Quoted in an active market |
(100) | (25) | ||||||
| Designated to fair value |
(86) | (39) | ||||||
|
|
|
|
|
|||||
| Total reclassified to the statement of operations |
(196) | (64) | ||||||
|
|
|
|
|
|||||
| Accumulated remeasurement losses, end of year, before other comprehensive income |
(66) | (580) | ||||||
|
|
|
|
|
|||||
| Accumulated other comprehensive loss, beginning of year |
(270) | (221) | ||||||
| Other comprehensive income (loss) (Schedule 3) |
215 | (46) | ||||||
| Transfer of revaluation reserve (Schedule 3) |
(3) | (3) | ||||||
|
|
|
|
|
|||||
| Accumulated other comprehensive loss, end of year |
(58) | (270) | ||||||
|
|
|
|
|
|||||
| Accumulated remeasurement losses, end of year |
(124) | (850) | ||||||
|
|
|
|
|
|||||
The accompanying notes and schedules are an integral part of these financial statements.
| SUMMARY FINANCIAL STATEMENTS | 71 |
SUMMARY FINANCIAL STATEMENTS
CONSOLIDATED STATEMENT OF CHANGE IN NET DEBT
For the Year Ended March 31, 2026
| ($ millions) | ||||||||||||
| 2026 | 2026 | 2025 | ||||||||||
| Budget | Actual | Restated | ||||||||||
| Operating deficit for the year |
(794) | (832) | (1,116) | |||||||||
|
|
|
|
|
|
|
|||||||
| Tangible capital assets (Schedule 7) |
||||||||||||
| Acquisition of tangible capital assets |
(2,163) | (2,118) | (1,961) | |||||||||
| Amortization of tangible capital assets |
929 | 946 | 904 | |||||||||
| Disposal of tangible capital assets at net book value |
- | 9 | 33 | |||||||||
|
|
|
|
|
|
|
|||||||
| Net acquisition of tangible capital assets |
(1,234) | (1,163) | (1,024) | |||||||||
|
|
|
|
|
|
|
|||||||
| Other non-financial assets |
||||||||||||
| Decrease in inventories |
- | 10 | 54 | |||||||||
| Increase in portfolio investments - endowed (Note 2) |
- | (102) | (93) | |||||||||
| Increase in prepaid expenses |
- | (20) | (14) | |||||||||
|
|
|
|
|
|
|
|||||||
| Net acquisition of other non-financial assets |
- | (112) | (53) | |||||||||
|
|
|
|
|
|
|
|||||||
| Increase in net debt from operations |
(2,028) | (2,107) | (2,193) | |||||||||
|
|
|
|
|
|
|
|||||||
| Net remeasurement gains (losses) and other adjustments |
- | 726 | (649) | |||||||||
|
|
|
|
|
|
|
|||||||
| Increase in net debt |
(2,028) | (1,381) | (2,842) | |||||||||
|
|
|
|
|
|
|
|||||||
| Net debt, beginning of year, as previously reported |
(34,472) | (35,261) | (32,316) | |||||||||
|
|
|
|
|
|
|
|||||||
| Portfolio investments - endowed and non-endowed (Note 2) |
- | 103 | 103 | |||||||||
|
|
|
|
|
|
|
|||||||
| Net debt, beginning of year, as restated |
(34,472) | (35,158) | (32,213) | |||||||||
|
|
|
|
|
|
|
|||||||
| Net debt, end of year |
(36,500) | (36,539) | (35,158) | |||||||||
|
|
|
|
|
|
|
|||||||
The accompanying notes and schedules are an integral part of these financial statements.
| 72 | PROVINCE OF MANITOBA ANNUAL REPORT AND PUBLIC ACCOUNTS 2026 |
SUMMARY FINANCIAL STATEMENTS
CONSOLIDATED STATEMENT OF CASH FLOW
For the Year Ended March 31, 2026
| 2026 | 2025 | |||||||
| Actual | Restated | |||||||
| Cash and cash equivalents provided by (used in) |
||||||||
| Operating Activities |
||||||||
| Operating deficit for the year |
(832) | (1,116) | ||||||
| Non-cash items: |
||||||||
| Amortization of tangible capital assets |
946 | 904 | ||||||
| Amortization of debt discounts and debt premiums |
(15) | (29) | ||||||
| Loss/(gain) on disposal of tangible capital assets |
(12) | 33 | ||||||
| Valuation allowance |
60 | 325 | ||||||
| Accretion expenses |
37 | 34 | ||||||
|
|
|
|
|
|||||
| 1,016 | 1,267 | |||||||
| Increase (decreases) to: |
||||||||
| Amounts receivable |
(168) | (568) | ||||||
| Inventories |
8 | 56 | ||||||
| Prepaids |
(20) | (14) | ||||||
| Changes in equity in government business enterprises and government business partnerships |
132 | 39 | ||||||
| Accounts payable, accrued charges, provisions and unearned revenue |
222 | 876 | ||||||
| Pension liability |
187 | 146 | ||||||
|
|
|
|
|
|||||
| Cash provided by operating activities |
545 | 686 | ||||||
|
|
|
|
|
|||||
| Capital Activities |
||||||||
| Acquisition of tangible capital assets |
(1,959) | (1,896) | ||||||
| Sales proceeds of tangible capital assets |
5 | - | ||||||
| Asset retirement obligations remediation |
(5) | (5) | ||||||
|
|
|
|
|
|||||
| Cash used in capital activities |
(1,959) | (1,901) | ||||||
|
|
|
|
|
|||||
| Investing Activities |
||||||||
| Loans issued |
(3,992) | (1,554) | ||||||
| Loans repaid |
2,635 | 1,142 | ||||||
| Investments purchased |
(2,753) | (4,423) | ||||||
| Investments sold or matured |
3,325 | 3,673 | ||||||
| Net increase in investments of other government organizations |
(139) | (54) | ||||||
|
|
|
|
|
|||||
| Cash used in investing activities |
(924) | (1,216) | ||||||
|
|
|
|
|
|||||
| Financing Activities |
||||||||
| Debt issued |
6,879 | 6,826 | ||||||
| Debt redeemed |
(4,619) | (3,960) | ||||||
|
|
|
|
|
|||||
| Cash provided by financing activities |
2,260 | 2,866 | ||||||
|
|
|
|
|
|||||
| (Decrease) increase in cash and cash equivalents |
(78) | 435 | ||||||
| Cash and cash equivalents, beginning of year |
4,722 | 4,287 | ||||||
|
|
|
|
|
|||||
| Cash and cash equivalents, end of year |
4,644 | 4,722 | ||||||
|
|
|
|
|
|||||
| Supplementary information: |
||||||||
| Interest received |
1,351 | 1,455 | ||||||
| Interest paid |
2,351 | 2,359 | ||||||
The accompanying notes and schedules are an integral part of these financial statements.
| SUMMARY FINANCIAL STATEMENTS | 73 |
NOTES TO THE SUMMARY FINANCIAL STATEMENTS
For the Year Ended March 31, 2026
| 1. | SIGNIFICANT ACCOUNTING POLICIES |
| A. | GENERAL BASIS OF ACCOUNTING |
The summary financial statements have been prepared by the Manitoba government (government) in accordance with Canadian public sector accounting standards (PSAS) for governments recommended by the Public Sector Accounting Board (PSAB).
| B. | THE GOVERNMENT REPORTING ENTITY |
These financial statements report the activities of the Consolidated Funds as defined in the Financial Administration Act combined with the organizations that are controlled by the government.
Various government components, government organizations (GOs), government business enterprises (GBEs), partnerships, and business partnerships (BPs) comprising the government reporting entity (GRE) are listed in Schedule 8 to the summary financial statements.
To be considered a part of the GRE, an organization must be controlled by the government or under the shared control of the government. Control, as defined by PSAB, is the power to govern the financial and operating policies of another organization with expected benefits or the risk of loss to the government from the other organization’s activities.
The not-for-profit personal care homes are individual corporations operated by their own boards of directors. The personal care homes are included in the GRE. The nature of the relationship between the government and not-for-profit personal care homes is such that control over their assets has been determined to exist for accounting purposes only and not for legal purposes.
| C. | BASIS OF CONSOLIDATION |
GOs, except for GBEs and BPs, are consolidated after adjusting their accounting policies to a basis consistent with the accounting policies of the GRE, as outlined in note 1E of the significant accounting policies. Inter-entity accounts and transactions are eliminated upon consolidation, except for retail sales tax. Where the fiscal year end dates of the GOs are different from those of the GRE, and their transactions significantly affect the financial statements, their financial results are updated to March 31.
GBEs, whose principal activity is carrying on a business, maintain their accounts in accordance with International Financial Reporting Standards (IFRS), which are considered appropriate to their individual objectives and circumstances. They derive most of their revenue from sources outside the GRE. They are reported in these summary financial statements using the modified equity method of accounting. Under the modified equity method, the original investment of the government, in GBEs, is initially recorded at cost and adjusted annually to include the net income or losses and other net equity changes of these enterprises, without adjusting their accounting policies to a basis consistent with that of the GRE.
The financial results of GBEs are not updated to March 31, where their fiscal year end is different from that of the GRE, except when transactions, which would significantly affect the summary financial statements, occur during the intervening period. Inter-entity accounts and transactions with GBEs are not eliminated. Significant transactions with GBEs are disclosed in Note 14. Supplementary financial information describing the financial position and results of operations of these enterprises is presented in Schedule 3 to the summary financial statements.
74 PROVINCE OF MANITOBA ANNUAL REPORT AND PUBLIC ACCOUNTS 2026
The characteristics of a BP are like a GBE except the organization is a partnership under shared control, rather than a government organization under the control of the province. BPs are accounted for in the summary financial statements using the modified equity method. The government accrues its share of the BP’s net income or losses, and other net equity changes, without adjusting the BP’s accounting policies to a basis consistent with that of the GRE. The government’s share of the assets, liabilities, and results of operations for its BP is presented in Note 6 to the summary financial statements.
| D. | MEASUREMENT UNCERTAINTY |
Estimates are used to accrue revenues and expenses in circumstances where the actual accrued revenues and expenses are unknown at the time the financial statements are prepared. Uncertainty in the determination of the amount at which an item is recognized in the financial statements is known as measurement uncertainty. Such uncertainty exists when there is a variance between the recognized amount and another reasonable amount, as there is whenever estimates are used.
Measurement uncertainty in these financial statements exists in the accrual of individual and corporate income taxes, Canada Health Transfer and Canada Social Transfer entitlements, and accrual for federal shared cost programs.
The uncertainty arises from possible differences between the estimates for the economic factors used in calculating the accruals and actual economic results. The amount of income tax attributable to the year can change because of reassessments in subsequent years. In addition, the lag time in receiving economic information and subsequent revisions to the tax data could also lead to notable changes in reporting.
The valuation of derivatives at fair value affects the Consolidated Statement of Financial Position and Consolidated Statement of Remeasurement Gains and Losses. The calculation of fair value is complex and uses mathematical models that are subject to a variety of inputs and assumptions. Therefore, measurement uncertainty exists in the valuation and completeness of both derivatives and embedded derivatives.
Measurement uncertainty also includes accruals for pension obligations and asset retirement obligations, accrual for retroactive wages, accruals for the remediation of contaminated sites, allowances for doubtful accounts, receivables and loans and advances, unearned revenue for outstanding performance obligations under PS 3400 revenue, accruals for liabilities valued through actuarial valuations, such as long-term disability, severance, sick pay obligations, workers compensation claims, and provision for losses on guarantees.
Uncertainty related to accruals for pension obligations arises because actual results may differ significantly from the government’s best estimates of expected results based on variables such as earnings on pension investments, salary increases and the life expectancy of pensioners. Results for asset retirement obligations may differ due to undiscovered hazardous materials, cost estimations, discount rates and uncertainty as to the dates the remediation will be undertaken.
Uncertainty related to the accrual of retroactive wages arises because actual wage settlements may differ significantly from the final collective agreements. The estimate for the accrual of retroactive wages is based on the government’s best estimate of the public service’s salary increases that may be negotiated or determined through arbitration.
Uncertainty related to the accrual of the remediation of contaminated sites exists because the remediation activities, methods and the extent of contamination may differ significantly from the government’s original assessment of the site and proposed remediation plans.
There is also measurement uncertainty related to the allowance for doubtful receivables, and loans and advances because the estimation could be different from the actual collectability due to various factors such as changes in economic conditions.
SUMMARY FINANCIAL STATEMENTS 75
Legal contingent liability contains significant measurement uncertainty due to the nature of legal cases, which are subject to factors that are not controlled by the government. Depending on legal proceedings and court decisions, results could be materially different from the estimations at the reporting dates.
In March 2025, the Ontario Superior Court of Justice approved a $32.5 billion tobacco settlement, of which $24.7 billion is payable to the Provinces and Territories. Manitoba’s share is approximately 4.53 per cent, which equals $1.1 billion to be paid in the future estimated 20-year settlement period. There is significant measurement uncertainty in the estimated revenue and receivable. More information is included in Note 20.
| E. | BASIS OF SPECIFIC ACCOUNTING POLICIES |
| i. | Gross Accounting Concept |
Assets and liabilities are presented at their gross amount and are not netted against each other.
Revenues and expenses are recorded as gross amounts with the following exceptions:
| a) | Refunds of revenue are treated as reductions of current year revenue. |
| b) | Decreases in valuation allowances are treated as reductions to current year expense. |
| ii. | Revenue |
| 1) | Government transfers |
Transfer payments from the Government of Canada include all accruals determined for current year entitlements that have been authorized by March 31, for which any eligibility criteria have been met and that can be reasonably estimated. A liability is recorded to the extent that a transfer gives rise to an obligation that meets the definition of a liability in accordance with the criteria in PS 3200 Liabilities.
| 2) | Taxes |
Tax revenues are recognized in the period in which they occur and when they are authorized by legislation, or the ability to assess and collect the tax has been provided through legislative convention. Reported tax revenues include estimated revenues for the current period, adjustments between the estimated revenues of previous tax years and actual amounts, and revenues from reassessments relating to prior tax years. Reported amounts do not include estimates of some unreported taxes or the impact of future reassessments.
Revenues from individual and corporation income tax are accrued in the year earned based upon estimates made by Manitoba Finance using statistical models. Personal Income Tax (PIT) and Corporation Income Tax (CIT) revenues for the period are accrued based on an estimate of current year tax assessments, plus late-arriving assessments, and reassessments for the 2025 tax year, prorated from the Federal Department of Finance’s Tax Sharing Statements and an estimate for the 2026 tax year based on Manitoba Finance’s economic forecasts.
PIT and CIT revenues are recorded at estimated amounts after considering adjustments for tax concessions and other adjustments from the income tax system. Transfers made through the tax system are recognized as expenses.
Revenues from other taxes are accrued in the year earned and are recorded net of tax concessions and other adjustments. Transfers made through the tax system are recognized as expenses.
76 PROVINCE OF MANITOBA ANNUAL REPORT AND PUBLIC ACCOUNTS 2026
| 3) | Fees and other revenue |
Exchange transactions are transactions with performance obligations. A performance obligation is a promise to provide a distinct good or service or series of distinct goods or services to a payor for consideration. The government recognizes revenue when the performance obligations are satisfied, and the payor obtains control of the asset or benefits from the service provided.
Non-exchange transactions are transactions or events where there is no direct transfer of goods or services to a payor. The government receives an increase in economic resources for which the payor does not receive any direct goods or services in return. Revenue from non-exchange transactions is recognized when the province has the authority and identifies a past transaction or event that gives rise to an asset.
Revenue from product sales is recognized when the significant rewards of ownership of the products have been passed to the buyer, usually on the delivery of products.
Revenue from contracts with customers is recognized at an amount equal to the transaction price allocated to the specific distinct performance obligation when the performance obligation is satisfied. Revenue from contracts with customers is evaluated and separated into distinct performance obligations when there is a distinct good or service to be transferred in the future.
The government assesses its revenue arrangements against specific criteria to determine if it is acting as a principal or agent. The government is the principal if it has primary responsibility for the delivery of the goods and services. As the principal, the government sets the amounts charged and bears the inventory and credit risk from the buyer. Consideration from the buyer is recognized as revenue and is measured on a gross basis.
| 4) | Externally restricted assets |
Externally restricted inflows are recognized as revenue in the period in which expenses are incurred for the purposes specified. Externally restricted inflows received before the expenses are incurred are reported as liabilities.
Premiums paid by the producers and the province to the AgriInsurance program at Manitoba Agricultural Services Corporation (MASC) are considered externally restricted inflows and are recorded as unearned revenue and not brought into revenue until required. Externally restricted premiums can only be used for:
| a) | indemnities payable under the contracts of the fund |
| b) | premiums and other amounts payable for reinsurance |
| c) | interest on funds borrowed for the fund |
| d) | annual revenue from the production insurance program to the Production Insurance Trust Fund |
| e) | additional amounts from the surplus of the fund to the Production Insurance Trust Fund as MASC may contribute under the Production Insurance Trust agreement |
Externally restricted funds also include unspent grants, non-endowed donations, investment income, rental fees and other restricted inflows.
| 5) | Endowment contributions |
Endowment funds are externally restricted contributions that are subject to a restriction of access, as donors usually require the principal to be maintained in perpetuity. These resources are generally not available to discharge liabilities or finance general government operations and are therefore classified as non-financial assets. The endowment contributions are recognized as revenue in the year they are received or receivable.
SUMMARY FINANCIAL STATEMENTS 77
| 6) | Investment income on endowment funds |
Investment income earned on endowment funds is usually subject to a restriction of use and is deferred until the related expenditures are incurred or donor stipulations are met, at which time it is recognized as revenue.
| iii. | Expenses |
| 1) | Accrual Accounting |
All expenses incurred for goods or services received are recorded on an accrual basis. Expenses include provisional amounts recorded in anticipation of costs, which are quantifiable and have been identified as obligations.
| 2) | Government transfers |
Government transfers are recognized as expenses in the period in which the transfer is authorized, any eligibility criteria are met, and the amounts can be estimated.
| iv. | Financial Instruments |
The government classifies its financial instruments as either fair value, cost, or amortized cost.
The government’s accounting policy for each category is as follows:
| 1) | Fair value |
This category includes derivatives and equity instruments quoted in an active market and certain designated portfolio investments at fair value by the GRE. Financial instruments in the fair value category are initially recognized at cost and subsequently carried at fair value. Unrealized changes in fair value on unrestricted investments are recognized in the Consolidated Statement of Remeasurement Gains and Losses until they are realized. When realized, they are transferred to the Consolidated Statement of Operations.
Where a decline in fair value of the financial asset is determined to be other than temporary, the amount of the loss is recognized in the Consolidated Statement of Operations.
Premiums and discounts on derivatives are amortized to public debt expense on the same basis as the underlying debt instrument. The unamortized portion is included in the derivative assets or liabilities to offset the accumulated remeasurement gains or losses.
Transaction costs related to financial instruments in the fair value category are expensed as incurred.
| 2) | Cost or amortized cost |
This category includes cash and cash equivalents, accounts receivable, accounts payable, public debt and portfolio investments that are not designated at fair value. They are initially recognized at cost and subsequently carried at amortized cost using the effective interest rate method, less any impairment losses on financial assets, except for donated financial assets, which are initially recognized at fair value.
Transaction costs related to financial instruments in the amortized cost category, including syndicate fees related to the issuance of debentures, are added to the carrying value of the instrument.
78 PROVINCE OF MANITOBA ANNUAL REPORT AND PUBLIC ACCOUNTS 2026
Write downs on financial assets in the cost or amortized cost category are recognized when the amount of a loss is known with sufficient precision, and there is no realistic prospect of recovery. Financial assets, the decline of which is other than temporary are written down to net recoverable value with the loss being recognized in the Consolidated Statement of Operations.
| v. | Foreign Currency Translation |
The government’s foreign currency risk is reflected in its financial statements. Monetary assets and liabilities, denominated in a foreign currency, are translated at the year end rate of exchange. Revenue and expense arising from a foreign currency transaction are translated into Canadian dollars at exchange rates approximating those in effect at the transaction date.
At each financial statement date, monetary assets, and liabilities, must be adjusted to reflect the exchange rate in effect at that date. Unrealized foreign exchange gains or losses that arise prior to settlement are recognized in the Consolidated Statement of Remeasurement Gains and Losses.
In the period of settlement, the cumulative amount of foreign exchange gains and losses is removed from the Consolidated Statement of Remeasurement Gains and Losses and is recognized in the Consolidated Statement of Operations.
| vi. | Financial Assets |
| 1) | Accounts receivable |
Accounts receivables are recorded at their full expected amount. A valuation allowance is recorded when collection of the receivable is considered doubtful.
| 2) | Loans and advances |
Loans and advances are recorded at cost and subsequently carried at amortized cost using the effective interest rate method. A valuation allowance is recorded to reduce the value of the assets to their estimated realizable value. Loans with significant concessionary terms would be considered a grant and expensed in the Consolidated Statement of Operations. Valuation allowances are made when collection is considered doubtful. Premiums that may arise from the early repayment of loans or advances are reflected as unearned and are amortized monthly to debt servicing expense over the term of the loan or advance. The government stops accruing interest on loans and advances when the amount is considered uncollectable.
| 3) | Portfolio investments |
Portfolio investments are measured at fair value, cost or amortized cost based on their characteristics and the government’s investment strategy. Portfolio investments quoted in an active market, or managed on a fair value basis, are recognized at fair value. All other portfolio investments are recognized at cost or amortized cost using the effective interest method.
Unrealized gains and losses on portfolio investments measured at fair value are recognized in the Consolidated Statement of Remeasurement Gains and Losses. Upon settlement, the cumulative gain or loss is reclassified from the Consolidated Statement of Remeasurement Gains and Losses to the Consolidated Statement of Operations.
Transaction costs are expensed for portfolio investments measured at fair value and capitalized for those measured at cost or amortized cost.
Discounts or premiums arising on the purchase of fixed income securities are amortized over the life of the investments using the effective interest method.
SUMMARY FINANCIAL STATEMENTS 79
Portfolio investments denominated in a foreign currency are translated to the Canadian dollar equivalent at the exchange rate in effect on March 31. Changes in the value of portfolio investments due to foreign currency changes are recognized in the Consolidated Statement of Remeasurement Gains and Losses until the gain or loss is realized and reclassified to the Consolidated Statement of Operations.
Investment income on portfolio investments, denominated in a foreign currency, including interest income, and realized gains or losses on the sale of unrestricted investments, are translated to Canadian dollar equivalents at the exchange rate in effect at the date of the transaction.
Portfolio investments measured at amortized cost are assessed for impairment, and any write-down is recognized in the Consolidated Statement of Operations.
| 4) | Inventories for resale |
Inventories held for resale are recorded at the lower of cost and net realizable value.
Inventory for resale includes land under development. Land under development includes the cost of land and all costs related to land improvements. Land improvements also include development, site preparation, architectural engineering, surveying, fencing, landscaping, and infrastructure for electrical, roads and underground works.
Land held for future development or sale is valued at the lower of cost or appraised value, adjusted for estimated disposal purchase price and related acquisition costs.
| vii. | Liabilities |
Liabilities are present obligations to outside parties, including GBEs, because of transactions and events occurring prior to the year end. The settlement of the liabilities will result in the future transfer or use of assets or other forms of settlement. Liabilities are recorded at the estimated amount payable.
| 1) | Public debt |
Public debt represents the direct debt obligations of Manitoba government. Public debt includes borrowings for government operating purposes, the acquisition of tangible capital assets, and lending to public sector entities within the GRE. Public debt is shown at amortized cost, net of the government debt held as provincial investments. Discounts or premiums, and commissions incurred at the time of the issue of debt are amortized monthly to debt servicing expense using the effective interest rate method. Foreign borrowings are translated at the exchange rate in effect on March 31. The unrealized foreign exchange gains and losses are recorded in the Consolidated Statement of Remeasurement Gains and Losses.
Public debt is reported under two categories:
| a) | Taxpayer-supported debt includes direct debt used for government operating and capital purposes including the debt of an entity that is fully consolidated in the summary financial statements. |
| b) | Borrowings on behalf of Manitoba Hydro-Electric Board (Manitoba Hydro) debt include the debt borrowed by the government on behalf of Manitoba Hydro. Manitoba Hydro fully funds their operations and debt through the sale of goods and services at commercial rates to buyers that are outside the GRE. |
80 PROVINCE OF MANITOBA ANNUAL REPORT AND PUBLIC ACCOUNTS 2026
| 2) | Pension liability |
The government accounts for employee pension plans by recognizing a liability and an expense in the reporting period in which the employee has provided service using the accrued benefit actuarial cost method, except as disclosed in Note 7. The value of plan assets is determined using a moving average fair value method. Under this method, fair value is the underlying basis, with any excess (or shortfall) of investment returns over (or below) the expected long-term rate being amortized over a five-year period. When actual experience varies from actuarial estimates, for both the accrued benefit obligation and plan assets, the difference is amortized over the expected average remaining service life of the related employee group. Past service costs from plan amendments are recognized in full as expenses in the year of the amendment.
| 3) | Employee future benefits |
The government recognizes the cost of accumulating benefits in the periods the employee provides service. For benefits that do not vest or accumulate, a liability is recognized when the event that obligates the government to pay benefits occurs. Liabilities for severance, non-vesting sick pay, long-term disability income plan and workers compensation claims are based upon actuarial calculations.
The periodic actuarial valuations of these liabilities may determine that adjustments are needed to the actuarial calculations because actual experience is different from that expected and/or because of changes in the actuarial assumptions used. The resulting actuarial gains or losses for the severance liability are amortized over the expected average remaining service life of the related employee group. Actuarial gains and losses for the Long-Term Disability Income Plan and the workers compensation claims are recognized as they arise. The liability is included under employee future benefits.
The government accrues a liability for vacation pay and accumulating non-vesting sick pay benefits. The liability for accumulating non-vesting sick pay benefits is based upon a review of past experience. A liability is extrapolated upon the expected future utilization of current accumulated benefits. The liability is recognized under salaries and benefits.
| 4) | Guarantees |
Guarantees by the government are made through specific agreements or legislation to repay promissory notes, bank loans, lines of credit, mortgages, and other securities. The provision for losses on guaranteed loans is determined by a review of individual guarantees. A provision for losses on these guarantees is recorded when it is likely that a loss will occur. The amount of the loss provision represents the government’s best estimate of probable claims against the guarantees. Where circumstances indicate the likelihood of claims arising, provisions are established for those loan guarantees.
| 5) | Liability for contaminated sites |
The government recognizes a liability for remediation of contaminated sites when the following criteria have been met:
| a) | There is evidence that contamination exceeds an environmental standard. |
| b) | The government is directly responsible or accepts responsibility for the contamination. |
| c) | It is expected that future economic benefits will be given up and a reasonable estimate of the amount can be made. |
SUMMARY FINANCIAL STATEMENTS 81
| d) | In cases where the government’s responsibility is not determinable, a contingent liability may be disclosed. |
The liability reflects the government’s best estimate of the amount required to remediate the site to the current minimum standard of use prior to contamination, as of the financial statement date. The liability is determined on a site-by-site basis. Third party recoveries related to a contaminated site are recorded as an asset, provided they can be appropriately measured and estimated with economic benefits expected to be obtained. Recoveries are not netted against the liability. Contingent recoveries are only disclosed. Recorded liabilities are adjusted each year for the passage of time, new obligations, changes in management estimates, and actual remediation costs incurred. The government measures the liability using present value techniques when cash flows are expected to occur over extended future periods.
| 6) | Asset retirement obligations |
An asset retirement obligation (ARO) is a legal obligation related to the retirement of a tangible capital asset. The retirement of a tangible capital asset is the permanent removal of an asset from service. This encompasses the sale, abandonment, or disposal in some other matter but not its temporary idling.
Upon recognition of a liability for an ARO, the government recognizes an asset retirement cost by increasing the carrying amount of the related tangible capital asset. The government allocates the asset retirement cost to expense in a rational or systematic manner over the remaining useful life of the tangible capital asset.
An ARO may exist in connection with a fully amortized tangible capital asset. The cost of an ARO is amortized over the revised estimated remaining useful life of the asset. An ARO related to a tangible capital asset no longer in productive use is expensed given there is no period of future benefit from the tangible capital asset. An ARO related to an asset that is not recognized is also expensed as there is no cost basis for the underlying asset to which retirement cost can be attached.
An ARO is initially measured as of the date the legal obligation was incurred. Management’s best estimate is based on the amount required to retire tangible capital assets and subsequently remeasured considering any new information and the appropriateness of assumptions used. A present value technique is used to determine the amount of the obligation at the financial reporting date. The liability is adjusted for the passage of time using the discount rate and is recognized as accretion expense in the Consolidated Statement of Operations.
| 7) | Public Private Partnership Arrangements |
The government enters into Public Private Partnership (P3) arrangements to procure public infrastructure through long-term contracts with private sector partners.
The government accounts for P3 arrangements in accordance with Public Sector Accounting Standard PS 3160, P3. Infrastructure acquired or constructed under a P3 arrangement is recognized as a tangible capital asset when the government controls the underlying infrastructure and the recognition criteria in Section PS 3150, Tangible Capital Assets, are met.
During the construction phase, infrastructure assets and the related financial liabilities are recognized as construction progresses. The cost of the infrastructure includes construction costs and other directly attributable costs incurred in accordance with the contractual arrangement. Financial liabilities arising from P3 arrangements are measured using the financial liability model
82 PROVINCE OF MANITOBA ANNUAL REPORT AND PUBLIC ACCOUNTS 2026
prescribed by PS 3160. Financing charges associated with the financial liability are recognized over the term of the arrangement in accordance with PS 3160.
Significant estimates used in accounting for P3 arrangements include the measurement of construction progress, estimated project costs and financing arrangements. These estimates are reviewed annually and updated as additional information becomes available.
The government reviews all significant P3 arrangements annually to determine whether changes in contractual terms affect the recognition or measurement of the related assets and liabilities.
| viii. | Non-Financial Assets |
| 1) | Recognition and measurement |
In the public sector, recognition and measurement of tangible capital assets and other non-financial assets are based on their future service potential. Such assets do not generate future net cash inflows. Therefore, these assets will not provide resources to discharge the liabilities of the government. For non-financial assets, the future economic benefit consists of their capacity to render service to fulfill the government’s objectives.
| 2) | Inventories |
Inventories held for resale are classified as non-financial assets if it is anticipated that the sale will not be completed within one year of the reporting date. Inventories held for use are classified as non-financial assets. Inventories for distribution at no charge are recorded at the lower of cost or current replacement cost.
| 3) | Prepaid expenses |
Prepaid expenses are payments for goods or services that will provide economic benefits in future periods. The prepaid amount is recognized as an expense in the year the goods or services are used or consumed.
| 4) | Tangible capital assets |
The cost of tangible capital assets purchased includes the purchase price as well as costs such as installation costs, design and engineering fees, survey, site preparation costs, and other costs incurred to put the asset into service. The cost of tangible capital assets constructed by the government includes all direct construction costs such as materials, labour, design, installation, engineering, architectural fees, survey and site preparation costs. It also includes overhead costs directly attributable to the construction activity such as licenses, inspection fees, indirect labour costs, and amortization expense of any equipment which was used in the construction project. Any carrying cost associated with the development and construction of tangible capital assets are included in the cost of the asset, provided the cost exceeds $20 million and development time exceeds one year.
Certain assets, which have historical or cultural value, including works of art, historical documents as well as historical and cultural artifacts, are not recognized as tangible capital assets because a reasonable estimate of the future benefits associated with such property cannot be made. Economic resources such as Crown land, mineral rights, timber rights, fish, and wildlife, meet the definition of an asset. However, they are not recognized in the summary financial statements because an appropriate basis of measurement and a reasonable estimate of the amount involved cannot be made, or PSAS prohibits its recognition.
SUMMARY FINANCIAL STATEMENTS 83
Tangible capital assets are amortized on a straight-line basis over their estimated useful lives as follows:
| General Tangible Assets |
||||
| Land |
Indefinite | |||
| Buildings and leasehold improvements |
||||
| Buildings |
10 to 60 years | |||
| Leasehold improvements |
Life of lease | |||
| Vehicles and equipment |
||||
| Vehicles |
3 to 10 years | |||
| Aircraft and vessels |
5 to 24 years | |||
| Machinery, equipment and furniture |
3 to 20 years | |||
| Maintenance and road construction equipment |
11 to 15 years | |||
| Computer hardware and software licenses |
3 to 15 years | |||
| Infrastructure Assets |
||||
| Land |
Indefinite | |||
| Land improvements |
10 to 30 years | |||
| Transportation |
||||
| Bridges and structures |
40 to 75 years | |||
| Provincial highways, roads and airstrips |
10 to 40 years | |||
| Dams and water management structures |
40 to 100 years | |||
One half of the annual amortization is charged in the year of acquisition and in the year of disposal. Assets under construction are not amortized until the asset is put into service.
| 5) | Endowment funds |
Endowment funds represent externally restricted resources that are required to be maintained in perpetuity and are not available to discharge existing financial liabilities or finance general government operations. Accordingly, endowment funds are classified as non-financial assets.
Endowment funds are measured at fair value, cost or amortized cost consistent with the measurement of the underlying portfolio investments. Changes in fair value of endowment funds are recognized as unrealized gains or losses in the Consolidated Statement of Remeasurement Gains and Losses.
Donors provide contributions that are invested in various financial instruments and place restrictions on their contributions to the endowment funds of other reporting entities (OREs). Usually, one such restriction is that the original contribution should not be spent. Endowment agreements may also require that a portion of investment income be used to offset the eroding effect of inflation or preserve the original value.
84 PROVINCE OF MANITOBA ANNUAL REPORT AND PUBLIC ACCOUNTS 2026
| ix. | Classification by Sector |
The government reports operational results under the following segments. Refer to Schedule 9:
| a) | Health |
| b) | Education and Economic Development |
| c) | Social Services |
| d) | Community and Resource Development |
| e) | Justice and Other Expenditures |
| f) | General Government |
The entities and departments included in each segment are identified in Schedule 8 to the summary financial statements.
The Health segment includes provincial health-care programs and all health-related entities and services delivered within the health system.
The Education and Economic Development segment includes all education – elementary, secondary, and post-secondary services, as well as the pension-related expenses associated with public schools and post-secondary institutions. It includes employment and training programs. It also includes other education services such as skills, trades, and workplace-based training programs and the advancement of economic development opportunities aligned with labour market needs.
The Social Services segment includes all services related to employment and income support for individuals in need as well as a comprehensive range of social services and financial assistance programs provided to Manitobans throughout the province. The sector also contains the management and administration of housing policies and benefits for low to moderate income renters and homeowners, as well as other social services delivered by community organizations on mental health promotion, harm reduction and addictions treatment and recovery.
The Community and Resource Development segment includes the promotion, development, and conservation of the province’s natural resources. It also includes the operation and maintenance of transportation systems such as highway infrastructure and other government infrastructure.
The Justice and Other Expenditures segment includes general administration, finance, executive, legislature, cultural and sport-related activities. The sector contains criminal and civil legal services and programs that protect the rights of Manitobans.
The General Government segment is comprised of activities that cannot be allocated to the specific sectors noted above. It also includes federal revenues and expenses related to emergency services and disaster assistance. Inter-segment transfers between sectors are measured at the exchange amount.
| x. | Future Changes in Accounting Standards |
Effective April 1, 2026, the government will adopt the new Conceptual Framework for Financial Reporting in the Public Sector (Conceptual Framework) and PS 1202 Financial Statement Presentation. PS 1202 is also known as the new reporting model. The impact on the consolidated financial statements is currently being assessed.
The Conceptual Framework prescribes the nature, function and limits of financial accounting and reporting. It is the foundation on which PSAS are developed and professional judgment is applied. It will replace the conceptual aspects of PS 1000 Financial Statement Concepts and PS 1100 Financial Statement Objectives.
SUMMARY FINANCIAL STATEMENTS 85
This standard sets out general and specific requirements for the presentation of information in public sector financial statements, based on the concepts within the Conceptual Framework.
| 2. | ADOPTION OF NEW ACCOUNTING STANDARDS, CHANGES IN ACCOUNTING POLICIES AND RESTATEMENT OF PRIOR PERIOD FIGURES |
| A. | ADOPTION OF NEW ACCOUNTING STANDARDS |
The government did not implement any new accounting standards in 2025/26.
| B. | CHANGE IN ACCOUNTING POLICIES |
Effective April 1, 2025, the government adopted a new accounting policy for endowment funds and portfolio investments. The change in accounting policy for endowment funds and portfolio investments has been applied retroactively, and comparative figures have been restated to conform to the new accounting policies.
| i. | Endowment Funds |
In prior years, endowment funds held by other reporting entities were disclosed as amounts held in trust and were not recognized in the summary financial statements.
Effective April 1, 2025, endowment funds held by other reporting entities are now recognized in the summary financial statements as non-financial assets. The principal is externally restricted, required to be maintained in perpetuity, and is not available to discharge existing financial liabilities or finance general government operations. Endowment funds are measured at fair value, cost or amortized cost, as appropriate. Unrealized gains and losses on endowment funds measured at fair value are recognized in the Consolidated Statement of Remeasurement Gains and Losses.
In prior years, endowment contributions and investment income earned on endowment funds were not recognized in the summary financial statements.
Effective April 1, 2025, endowment contributions are recognized as revenue in the year they are received or receivable. Investment income earned on endowment funds subject to external restrictions of use is deferred until the related expenditures are incurred or donor stipulations are met.
| ii. | Portfolio Investments |
In prior years, the government did not designate any of its portfolio investments to fair value. Only derivatives and equity instruments quoted in an active market were measured at fair value.
Effective April 1, 2025, portfolio investments are now measured at fair value, cost or amortized cost based on their characteristics and the government’s investment strategy. Investments quoted in an active market or managed on a fair value basis are measured at fair value, with unrealized gains and losses recognized in the Consolidated Statement of Remeasurement Gains and Losses. All other portfolio investments continue to be measured at cost or amortized cost using the effective interest method.
| C. | RESTATEMENT OF PRIOR PERIOD FIGURES |
| i. | Endowment Funds Recognized as Non-Financial Assets |
Endowment funds held by other reporting entities are recognized in the summary financial statements and classified as non-financial assets measured at fair value, cost, or amortized cost, as determined by the other reporting entities. Endowment contributions are now recognized as revenue in the year received or receivable. Unrealized gains or losses on endowment funds measured at fair value are now included in the Consolidated Statement of Remeasurement Gains and Losses.
86 PROVINCE OF MANITOBA ANNUAL REPORT AND PUBLIC ACCOUNTS 2026
| ii. | Portfolio Investments Measured at Fair Value |
Portfolio investments have been reclassified and remeasured based on whether they are managed at fair value, cost or amortized cost in accordance with the revised accounting policy.
Certain portfolio investments previously measured at cost or amortized cost are now measured at fair value, resulting in recognition of unrealized gains and losses.
| Consolidated Statement of Financial Position ($ millions) |
||||||||||||
| Previously 2025 |
Adjustments | Restated March 31, 2025 |
||||||||||
| Portfolio investments – non-endowed |
4,076 | 135 | 4,211 | |||||||||
| Other financial assets |
40,552 | (1)* | 40,551 | |||||||||
| Taxpayer-supported debt |
38,355 | 9 | 38,364 | |||||||||
| Accounts payable, accrued charges, provisions and unearned revenue |
9,295 | 23 | 9,318 | |||||||||
| Other liabilities |
32,239 | (1)* | 32,238 | |||||||||
| Net debt |
(35,261) | 103 | (35,158) | |||||||||
| Portfolio investments – endowed |
- | 1,021 | 1,021 | |||||||||
| Other non-financial assets |
17,453 | - | 17,453 | |||||||||
| Accumulated deficit |
(17,808) | 1,124 | (16,684) | |||||||||
| Accumulated deficit comprises of: |
||||||||||||
| Accumulated deficit – operating |
(16,475) | 641 | (15,834) | |||||||||
| Accumulated remeasurement gains (losses) |
(1,333) | 483 | (850) | |||||||||
| Accumulated deficit |
(17,808) | 1,124 | (16,684) | |||||||||
* Includes $1 million unrelated to the change in accounting policy for portfolio investments.
| Consolidated Statement of Operations | ||||||||||||
| ($ millions) | ||||||||||||
| Previously Reported March 31, 2025 |
Adjustments | Restated March 31, 2025 |
||||||||||
| Endowment contributions |
- | 27 | 27 | |||||||||
| Recovery from government business enterprises and other investment earnings |
1,465 | 6 | 1,471 | |||||||||
| Other revenue |
22,879 | - | 22,879 | |||||||||
| Expenses |
25,493 | - | 25,493 | |||||||||
| Operating deficit for the year |
(1,149) | 33 | (1,116) | |||||||||
SUMMARY FINANCIAL STATEMENTS 87
| Consolidated Statement of Remeasurement Gains and Losses |
| ($ millions) | ||||||||||||
| Previously 2025 |
Adjustments | Restated March 31, 2025 |
||||||||||
| Accumulated remeasurement gains (losses), |
(301) | 326* | 25 | |||||||||
| Unrealized gains (losses) attributable to: |
||||||||||||
| Foreign exchange |
(391) | 2 | (389) | |||||||||
| Derivatives |
(272) | 1 | (271) | |||||||||
| Portfolio investments: |
||||||||||||
| Quoted in an active market |
(101) | 120 | 19 | |||||||||
| Designated to fair value |
- | 100 | 100 | |||||||||
| Total unrealized gains (losses) |
(764) | 223 | (541) | |||||||||
| Reclassified to consolidated statement of operations: |
||||||||||||
| Portfolio investments: |
||||||||||||
| Quoted in an active market |
(2) | (23) | (25) | |||||||||
| Designated to fair value |
- | (39) | (39) | |||||||||
| Total reclassified to the statement of operations |
(2) | (62) | (64) | |||||||||
| Accumulated other comprehensive income (loss) |
(266) | (4)* | (270) | |||||||||
| Accumulated remeasurement gains
(losses), |
(1,333) | 483 | (850) | |||||||||
*The adjustments include $3 million to accumulated remeasurement gains (losses) at the beginning of the year due to revaluation reserve and $(4) million to accumulated other comprehensive income (loss) for transfer of revaluation reserve, which are all unrelated to the change in accounting policy for portfolio investments.
| Consolidated Statement of Change in Net Debt | ||||||||||||
| ($ millions) | ||||||||||||
| Previously March 31, 2025 |
Adjustments | Restated March 31, 2025 |
||||||||||
| Operating deficit for the year |
(1,149) | 33 | (1,116) | |||||||||
| Net acquisition of tangible capital assets |
(1,024) | - | (1,024) | |||||||||
| Net acquisition of other non-financial assets |
40 | (93) | (53) | |||||||||
| Net remeasurement gains (losses) and other adjustments |
(812) | 163 | (649) | |||||||||
| Increase in net debt |
(2,945) | 103 | (2,842) | |||||||||
| Net debt, beginning of year |
(32,316) | - | (32,316) | |||||||||
| Net debt, end of year |
(35,261) | 103 | (35,158) | |||||||||
88 PROVINCE OF MANITOBA ANNUAL REPORT AND PUBLIC ACCOUNTS 2026
| iii. | Classification Adjustments |
The following classification adjustments were made to Schedule 9 – Consolidated Statement of Operations by Sector:
| a) | A grant of $177 million related to the Education Property Tax Credit was paid to school divisions. Of this amount, $101 million was inadvertently recorded within the Education and Economic Development segment, resulting in grant expense being overstated and other operating expense being understated. The remaining $76 million was recorded within the Justice segment as other operating expense instead of grant expense. |
| b) | Revenue of $27 million earned from other government reporting entities was inadvertently eliminated against grant and transfer payments rather than supplies and services. The amount has been reclassified to correctly reflect the elimination against supplies and services within the adjustments column of the schedule. |
| c) | Inter-segment eliminations of $39 million in personnel services and $30 million in other operating expenses were previously recorded outside the Social Services segment. These amounts have been reclassified to the appropriate entities within the Social Services segment. |
| d) | A $14 million grant related to the Education and Economic Development segment was previously eliminated within the Global Adjustments segment. The elimination has been reclassified to the Education and Economic Development segment. |
| e) | Net income of $4 million from a government business partnership was previously recognized within the Global Adjustments segment. The amount has been reclassified to the Community and Resource Development segment. |
These adjustments relate only to the classification of expenses in schedule 9 and had no impact on total expenses or the consolidated statement of operations.
| 3. | FINANCIAL INSTRUMENTS CLASSIFICATION |
The following table provides cost and fair value information of financial instruments by category. The maximum exposure to credit risk would be the carrying value as shown below.
| ($ millions) | ||||||||||||||||
| Fair Value |
Cost/ Cost |
2026 Total |
2025 Total |
|||||||||||||
| Cash and cash equivalents |
- | 4,644 | 4,644 | 4,722 | ||||||||||||
| Amounts receivable |
- | 753 | 753 | 1,017 | ||||||||||||
| Due from Manitoba Hydro-Electric Board |
- | 26,039 | 26,039 | 24,831 | ||||||||||||
| Portfolio investments – non-endowed |
1,284 | 2,511 | 3,795 | 4,211 | ||||||||||||
| Loans and advances |
- | 1,715 | 1,715 | 1,638 | ||||||||||||
| Derivative financial assets |
2,435 | - | 2,435 | 2,223 | ||||||||||||
| Taxpayer-supported debt |
- | (39,489) | (39,489) | (38,364) | ||||||||||||
| Borrowings on behalf of Manitoba Hydro-Electric Board |
- | (26,184) | (26,184) | (24,925) | ||||||||||||
| Accounts payable |
- | (5,837) | (5,837) | (5,774) | ||||||||||||
| Derivative financial liabilities |
(2,088) | - | (2,088) | (2,677) | ||||||||||||
SUMMARY FINANCIAL STATEMENTS 89
| 4. | PORTFOLIO INVESTMENTS |
Portfolio investments represent investments held by the government and other reporting entities to generate investment income and support long-term funding objectives. The portfolio consists of investments measured at fair value, cost or amortized cost, in accordance with the accounting policies described in Note 1. Comparative information has been restated to reflect the change in accounting policy described in Note 2.
| ($ millions) |
||||||||
| 2026 Actual |
2025 Restated |
|||||||
| Portfolio investments – non-endowed |
3,795 | 4,211 | ||||||
| Portfolio investments – endowed |
1,123 | 1,021 | ||||||
| Total |
4,918 | 5,232 | ||||||
The composition of portfolio investments is as follows:
| ($ millions) | ||||||||||||||||||||||||
| Level 1 | Level 2 | Level 3 | Cost/ Cost |
2026 Actual |
2025 Restated |
|||||||||||||||||||
| Guaranteed investment certificates |
633 | 35 | - | 26 | 694 | 559 | ||||||||||||||||||
| Bonds – Government of Canada, provincial, municipal |
- | 167 | - | 2,051 | 2,218 | 2,867 | ||||||||||||||||||
| Bonds – Corporate |
2 | 135 | - | 417 | 554 | 429 | ||||||||||||||||||
| Equity investments |
163 | 972 | 19 | 5 | 1,159 | 1,032 | ||||||||||||||||||
| Other |
14 | 86 | 176 | 17 | 293 | 345 | ||||||||||||||||||
| Total |
812 | 1,395 | 195 | 2,516 | 4,918 | 5,232 | ||||||||||||||||||
Financial instruments that are measured after initial recognition at fair value are grouped into Levels 1 to 3 based on the degree to which the fair value is observable:
| • | Level 1 fair value measurements are those derived from quoted prices (unadjusted) in active markets for identical assets or liabilities using the last bid price. |
| • | Level 2 fair value measurements are those derived from inputs other than quoted prices included within Level 1 that are observable for the asset or liability, either directly (i.e., as prices) or indirectly (i.e., derived from prices). |
| • | Level 3 fair value measurements are those derived from valuation techniques that include inputs for the asset or liability that are not based on observable market data (unobservable inputs). |
The fair value of investments held at cost or amortized cost is $2,433 million (2025 – $2,983 million). During the year, there were no transfers between Level 1, Level 2 and Level 3 investments (2025 – nil).
The changes in fair value of Level 3 investments are summarized below:
| ($ millions) | ||||||||
| 2026 Actual |
2025 Restated |
|||||||
| Balance at the beginning of year |
179 | 145 | ||||||
| Purchases |
9 | 15 | ||||||
| Disposals and maturities |
(4) | (2) | ||||||
| Unrealized gains |
11 | 21 | ||||||
| Balance at the end of year |
195 | 179 | ||||||
90 PROVINCE OF MANITOBA ANNUAL REPORT AND PUBLIC ACCOUNTS 2026
| A. | PORTFOLIO INVESTMENTS – NON-ENDOWED |
| ($ millions) | ||||||||
| 2026 Actual |
2025 Restated |
|||||||
| Sinking fund |
949 | 940 | ||||||
| Other investments |
2,846 | 3,271 | ||||||
| Portfolio investments – non-endowed |
3,795 | 4,211 | ||||||
| B. | SINKING FUNDS |
Section 60 of The Financial Administration Act authorizes the Minister of Finance to provide for the creation and management of sinking funds for the orderly retirement of debt. The government manages its cash flow through investment purchases and sales, and by purchasing its own debt for sinking fund investments.
The government’s sinking fund currently provides for the repurchase of foreign debt and the pre-funding of maturing debt issues. The sinking fund is invested principally in securities issued or guaranteed by federal and provincial governments. Sinking funds are invested in fixed income securities as follows:
| ($ millions) | ||||||||
| 2026 Actual |
2025 Actual |
|||||||
| Sinking fund |
962 | 951 | ||||||
| Less: Uninvested portion of sinking funds held in cash and cash equivalents |
(13) | (11) | ||||||
| Total sinking funds held in portfolio investments |
949 | 940 | ||||||
| ($ millions) | ||||||||
| 2026 | 2025 | |||||||
| Actual | Actual | |||||||
| Government of Canada, direct and guaranteed |
68 | 76 | ||||||
| Provincial, direct and guaranteed |
621 | 660 | ||||||
| Municipal |
201 | 155 | ||||||
| Corporate |
59 | 49 | ||||||
| Total sinking funds held in portfolio investments |
949 | 940 | ||||||
| C. | OTHER INVESTMENTS |
| ($ millions) | ||||||||
| 2026 Actual |
2025 Restated |
|||||||
| Guaranteed investment certificates |
676 | 554 | ||||||
| Bonds – Government of Canada, provincial and municipal |
1,208 | 1,859 | ||||||
| Bonds – Corporate |
447 | 331 | ||||||
| Equity investments |
401 | 386 | ||||||
| Other |
114 | 141 | ||||||
| Total other investments non-endowed |
2,846 | 3,271 | ||||||
SUMMARY FINANCIAL STATEMENTS 91
| D. | PORTFOLIO INVESTMENTS – ENDOWED |
| ($ millions) | ||||||||
| 2026 Actual |
2025 Restated |
|||||||
| Balance at the beginning of year |
1,021 | 928 | ||||||
| Endowment contributions |
35 | 27 | ||||||
| Investment income |
15 | 10 | ||||||
| Transfers |
17 | 3 | ||||||
| Remeasurement gains |
34 | 60 | ||||||
| Other |
1 | (7) | ||||||
| Balance at the end of year |
1,123 | 1,021 | ||||||
| E. | INVESTMENT INCOME |
Investment revenue earned on non-endowed portfolio investment during the year consisted of $31 million (2025 – $31 million) from sinking funds and $170 million (2025 – $181 million) from other investments.
| 5. | EQUITY IN GOVERNMENT BUSINESS ENTERPRISES |
The GBEs that are included in the summary financial statements are listed in Schedule 8 and are classified as follows:
| Category | Definition | |
| Utility |
An enterprise that provides public utility services for a fee; category includes Manitoba Hydro-Electric Board | |
| Insurance |
An enterprise that provides insurance coverage services to the public for a fee; category includes Manitoba Public Insurance Corporation and Deposit Guarantee Corporation of Manitoba | |
| Finance |
An enterprise that provides regulatory control and is revenue generating or an enterprise that uses economy of scale to deliver goods and services to the public; category includes Manitoba Liquor and Lotteries Corporation | |
The operating results and financial position of each GBE category are reported in Schedule 3 to the summary financial statements. The year end of each GBE is as follows:
| a) Manitoba Hydro-Electric Board |
March31, 2026 | |
| b) Manitoba Public Insurance Corporation |
March31, 2026 | |
| c) Manitoba Liquor and Lotteries Corporation |
March31, 2026 | |
| d) Deposit Guarantee Corporation of Manitoba |
December31, 2025 |
Part of the equity of GBEs is restricted for use by provincial legislation and thereby is not available to discharge government liabilities or to finance other government programs.
92 PROVINCE OF MANITOBA ANNUAL REPORT AND PUBLIC ACCOUNTS 2026
The equity in GBEs is comprised of:
| ($ millions) | ||||||||
| 2026 Actual |
2025 Restated |
|||||||
| Restricted Equity in government business enterprises |
||||||||
| Deposit Guarantee Corporation of Manitoba |
597 | 543 | ||||||
| Manitoba Hydro-Electric Board |
2,850 | 3,117 | ||||||
| Manitoba Public Insurance Corporation |
795 | 714 | ||||||
| 4,242 | 4,374 | |||||||
| Unrestricted Equity in government business enterprises |
||||||||
| Manitoba Liquor and Lotteries Corporation |
5 | 5 | ||||||
| Manitoba Public Insurance Corporation |
12 | 12 | ||||||
| 17 | 17 | |||||||
| Equity in government business enterprises |
4,259 | 4,391 | ||||||
| 6. | EQUITY IN BUSINESS PARTNERSHIP |
North Portage Development Corporation (NPDC) is a business partnership that is owned equally by the Government of Canada, the Province of Manitoba, and the City of Winnipeg. The mission of NPDC is to act as a catalyst, encouraging activities for people downtown through public and private partnerships and to work to ensure financial self-sufficiency. NPDC is responsible for the continuing renewal and stewardship of two sites in Winnipeg’s downtown: the North Portage area and The Forks. NPDC is involved in certain business and core activities regarding the ownership, development, and management of its two sites that include land investment properties and public amenities.
The province’s share of the equity on March 31, 2026, is $24 million (2025 – $24 million). The province’s share of the operating results for the year ended March 31, 2026, is nil (2025 – $4 million) and is included in fees and other revenues.
The condensed supplementary financial information of NPDC is as follows:
| ($ millions) | ||||||||
| 2026 Actual |
2025 Actual |
|||||||
| Property, plant and equipment and investment in properties and infrastructure enhancements |
59 | 56 | ||||||
| Investments and other assets |
33 | 28 | ||||||
| 92 | 84 | |||||||
| Deferred contributions from shareholders |
10 | 8 | ||||||
| Current and other liabilities |
10 | 4 | ||||||
| 20 | 12 | |||||||
| Net equity |
72 | 72 | ||||||
| 92 | 84 | |||||||
| Comprehensive income |
||||||||
| Revenue |
18 | 16 | ||||||
| Expenses |
(14) | (14) | ||||||
| Gain (loss) on disposal of infrastructure |
(1) | 14 | ||||||
| Operating income before amortization |
3 | 16 | ||||||
| Amortization |
(3) | (3) | ||||||
| Net income for the year |
– | 13 | ||||||
SUMMARY FINANCIAL STATEMENTS 93
| 7. | PENSION PLANS |
The government participates in various pension plans. The two primary plans in which the government directly participates are the Civil Service Superannuation Plan and the Teachers’ Pension Plan. As per the Acts that administer these plans, the government is responsible for 50 per cent of pension benefits earned by employees. The government’s pension liability reflects its share of the actuarial present values of pension benefits attributed to services rendered by employees and former employees, net of any plan assets which are set aside by the government in an irrevocable trust. As of March 31, 2026, the pension liability for the Civil Service Superannuation Plan was $1,173 million (2025 – $1,166 million) and the pension liability for the Teachers’ Pension Plan was $2,448 million (2025 – $2,379 million).
Other pension plans in which the government participates include the members of the Legislative Assembly Plan, the Legislative Assembly Pension Plan, the Judges’ Supplemental Pension Plan and the Winnipeg Child and Family Services Employee Benefits Retirement Plan. The government is responsible for any excess of accrued pension benefits over pension fund assets for these plans.
The government also includes several other pension plans in its pension liability. These other plans include post-secondary education pension plans and public school divisions’ pension plans. Post-secondary education pension plans include the University of Manitoba Pension Plans, the University of Winnipeg Pension Plan, and the Brandon University Retirement Plan. Public school divisions’ pension plans include the Winnipeg School Division Pension Fund for Employees Other than Teachers, Retirement Plan for non-Teaching Employees of the St. James-Assiniboia School Division, Retirement Plan for Employees of Frontier School Division and School, District of Mystery Lake Pension Plan. The government is responsible for any excess of accrued pension benefits over pension fund assets for these plans.
Employees in the health sector are members of the Healthcare Employees Pension Plan, a multi-employer defined benefit pension plan established between employees and participating boards. Because the government does not sponsor this plan, the accrued benefit liability of this plan is not recognized in these financial statements. The annual net benefit plan expense is the required contributions provided for employees’ services rendered during the year. During the year, the government expensed contributions to this plan of $270 million (2025 – $241 million). On December 31, 2025, the plan had an excess of net assets available for benefits over pension obligations of $2,771 million (December 31, 2024 – $2,423 million).
As of March 31, 2026, the total pension liability being reflected in the summary financial statements was $3,932 million (2025 – $3,745 million). Details related to the pension liability are provided in Schedule 6 to the summary financial statements. The following provides general information on the contributions and benefit formula of the various pension plans, which are included in this schedule.
| A. | CIVIL SERVICE SUPERANNUATION PLAN |
The Civil Service Superannuation Act (CSSA) established a defined benefit plan to provide benefits to employees of the Manitoba Public Service and to participating agencies of the government through the Civil Service Superannuation Fund (CSSF).
The lifetime pension calculation equals 2.0 per cent of a member’s best five-year average yearly pensionable earnings multiplied by pensionable service, minus 0.4 per cent of the average Canada Pension Plan (CPP) earnings multiplied by pensionable service since January 1, 1966.
The CSSA requires employees to contribute 8.0 per cent of pensionable earnings up to the CPP maximum pensionable earnings, and 9.0 per cent of pensionable earnings above the maximum. 89.8 per cent of employee contributions are used to fund basic benefits and 10.2 per cent of employee contributions are allocated to funding indexing benefits. The government funds 50 per cent of the monthly pension retirement benefits paid to retirees.
94 PROVINCE OF MANITOBA ANNUAL REPORT AND PUBLIC ACCOUNTS 2026
Indexing benefits are not guaranteed and are paid only to the extent that the indexing adjustment account in CSSF can finance one-half of the cost-of-living increases granted. The maximum annual adjustment is limited by legislation to two-thirds of the increase in the Consumer Price Index (CPI) for Canada.
Schedule 6 only reports the government’s conditional share of the net obligation. The estimated financial position of both the employee and employer components of the Civil Service Superannuation Plan is reported in the December 31, 2025, audited financial statements of CSSF. On December 31, 2025, after accounting for provincial pension assets held in trust and trust assets held in trust for GBEs, CSSF had an estimated accrued net obligation of $1,050 million (December 31, 2024 – $1,116 million).
This valuation is not on the same basis of reporting as the summary financial statements and does not include adjustments for unamortized actuarial gains or losses nor the impact of valuing assets on a market-related value basis as opposed to market value. This valuation also includes estimated net obligations related to GBEs, which are included in the summary financial statements on a modified equity basis, and other entities that are not part of the GRE.
| B. | TEACHERS’ PENSION PLAN |
The Teachers’ Pensions Act (TPA) established a defined benefit plan to provide pension benefits to teachers who have taught in public schools in Manitoba.
The lifetime pension calculation is based upon 2.0 per cent of a member’s average salary of the best five of the final 12 years of service (best seven prior to July 1, 1980) multiplied by pensionable service, minus the years of service multiplied by 0.6 per cent of the annual salary up to the yearly maximum pensionable earnings. The pension amount is subject to a maximum of 70 per cent of the average annual salary used above.
The TPA requires teachers to contribute 8.8 per cent of pensionable earnings up to the CPP maximum pensionable earnings, and 10.4 per cent of pensionable earnings above the maximum of teachers’ contributions. 83.1 per cent of teachers’ contributions are used to fund basic benefits and 16.9 per cent are allocated for funding indexing benefits.
The cost-of-living adjustment (COLA) is limited to the lesser of the maximum percentage the Pension Adjustment Account (PAA) can support, and the full increase in CPI. COLA can never be negative.
The independent plan actuary determined that there was an actuarial surplus in the PAA of $52.6 million available to support COLA of 1.60 per cent effective July 1, 2025. Since the relevant increase in CPI for 2024 was 1.83 per cent, the COLA was not impacted by the 100 per cent CPI cap.
Schedule 6 only reports the government’s conditional share of the net obligation. The estimated financial position of both the employee and employer components of the Teachers’ Pension Plan is reported in the December 31, 2025, audited financial statements of Teachers’ Retirement Allowances Fund (Fund). On December 31, 2025, after accounting for provincial pension assets held in trust, the Fund had an estimated accrued net obligation of $288 million (December 31, 2024 – $587 million). This valuation is not on the same basis of reporting as the summary financial statements and does not include adjustments for unamortized actuarial gains or losses nor the impact of valuing assets on a market-related value basis as opposed to market value.
| C. | OTHER GOVERNMENT PLANS |
| i. | Members of the Legislative Assembly Plan |
The pension plan for Members of the Legislative Assembly (MLAs) is established and governed by The Legislative Assembly Act (LAA).
SUMMARY FINANCIAL STATEMENTS 95
For MLAs elected prior to the dissolution of the Assembly of the 35th Legislature, the LAA provides for defined pension benefits based on years of service to April 1995. The calculation for defined pension benefits is equal to 3.0 per cent of the average annual indemnities and allowance for the last five years served as a member or all the years served; if less than five, multiplied by the number of years of pensionable service up to April 1995. These entitlements are fully indexed to cost of living increases.
For those MLAs elected after the 35th Legislature in April 1995, the LAA provides for matching contributions. Under the matching contributions provisions, MLAs may contribute up to 7.0 per cent of their remuneration toward a Registered Retirement Savings Plan (RRSP) of their choice. The government matches the member’s contributions on a current basis. Consequently, there is no liability for past service benefits under this component of the plan. If a member, while an active MLA, withdraws money from the RRSP while an active MLA, the government’s contribution would be refundable back to the government.
| ii. | Legislative Assembly Pension Plan |
The Members’ Retirement Benefits Regulation of The Legislative Assembly Act established a defined benefit plan, effective December 7, 2005, that provides pension benefits to eligible MLAs who elect to participate in the plan.
The pension benefits accumulate up to a maximum period of 35 years at 2.0 per cent per year of pensionable service based upon the average of the best five-year annual salaries, reduced by an amount equal to 0.25 per cent times the number of months before the member’s 60th birthday that the first pension payment is made. These entitlements are indexed to two-thirds of cost-of-living increases.
Active members must contribute 9.0 per cent of their earned salary to the plan. The government makes contributions as necessary to ensure the pension fund has sufficient assets to cover the monthly pension payments to retirees as well as ensuring there are sufficient funds to cover any of the plan’s liabilities. Any surplus of plan assets over the pension obligation can be used by the government to reduce future contributions.
| iii. | Judges’ Supplemental Pension Plan |
Manitoba Provincial Court Judges and Masters are members of the Civil Service Superannuation Plan. However, they also receive enhanced pension benefits under the Manitoba Provincial Court Judges and Masters’ Supplemental Pension Plan. These supplemental pension benefits for judges are the difference between the total pension benefits for judges, including the amendments introduced by Judicial Compensation Committees, and the formula pension available under The Civil Service Superannuation Act (CSSA) as previously described in Note 7A.
The supplemental pension is based upon an accrual rate of 3.0 per cent for each year of service, as a judge, up to a maximum of 23.33 years, reduced by the pension provided under the CSSA. The combined total of the Judges’ Supplemental Pension and Civil Service Superannuation Pension is subject to a maximum of 70 per cent of earnings. These enhanced benefits are entirely funded by the government.
| iv. | Winnipeg Child and Family Services Employee Benefits Retirement Plan |
Established effective December 29, 2003, the Winnipeg Child and Family Services Employee Benefits Retirement Plan applies to employees of the former Winnipeg Child and Family Services Agency, who transferred to the Department of Families.
The lifetime pension calculation equals 1.4 per cent of the member’s highest average pensionable earnings up to the CPP maximum and 2.0 per cent of any excess earnings multiplied by pensionable service. The lifetime pension is subject to an overall maximum of the member’s number of years of contributory service, multiplied by the lesser of $1,722 or such greater amount permitted under the Income Tax Act; and 2.0 per cent of the member’s highest average indexed compensation in any three non-overlapping periods of
96 PROVINCE OF MANITOBA ANNUAL REPORT AND PUBLIC ACCOUNTS 2026
12 consecutive months. Indexing payments are subject to approval by the Trustees and increases in the Consumer Price Index.
Members are required to contribute 4.5 per cent of pensionable earnings up to the CPP maximum and 6.0 per cent on pensionable earnings over the maximum. The plan has not had any active members since March 31, 2020.
| D. | OTHER PENSION PLANS |
| i. | Post-Secondary |
| 1) | University of Manitoba Pension Plan |
The University of Manitoba administers The University of Manitoba Pension Plan (1993) and The University of Manitoba GFT Pension Plan (1986). These are trusteed pension plans. The trustees are responsible for the custody of the plans’ assets and issuance of annual financial statements. The University of Manitoba Pension Plan (1993) is a money purchase plan with a defined benefit minimum. The funding for the plan requires a matching contribution from the university and the employees. The plan is not indexed. Plan members contribute at a rate of 9.0 per cent of salary less an adjustment for the Canada Pension Plan during the year.
The employer contribution made by the university for fiscal 2026 included $5 million (2025 – $5 million) in additional contributions as advised by the Manitoba Pension Commission with respect to current service costs in excess of matching contribution of active members and the university, and an annual additional special payment for 15 years until the going concern deficit is eliminated.
Retirement benefits are calculated by using the greater of the two methods: Formula and Plan Annuity. For each year of pensionable service, formula benefit equals 2.0 per cent of the average best five-year salary, less 0.7 per cent of the average best five-year salary under the yearly maximum pensionable earnings in the year of retirement, to a maximum of 1/9 of the pension plan’s money purchase limit. The benefit is reduced by 0.25 per cent for each month between the actual pension commencement date and the age of 65 years. Plan Annuity benefit is based on contribution account balance, age at retirement, and the annuity factor determined by the plan actuary.
The unamortized net actuarial gains (losses) were determined based on the 2024 actuarial valuation and the extrapolation for accounting purposes is being amortized over a period of 10 years (equal to expected average remaining service life) starting in the year following the year of respective annual actuarial gains or losses arise.
The University of Manitoba GFT Pension Plan (1986) is a defined contribution pension plan. Therefore, there is no requirement for an actuarial valuation of this plan.
| 2) | University of Winnipeg Pension Plan |
The University of Winnipeg administers the University of Winnipeg Pension Plan (UWPP), which is comprised of a defined benefit segment and a defined contribution segment. The assets of the plan are held in trust by independent custodians. The defined benefit segment of the UWPP was closed to new members effective January 1, 2001. After this date, members join the defined contribution plan.
The UWPP was established as a contributory defined benefit pension plan on September 1, 1972, and covers all eligible employees of the university except those who are members of the United Church of Canada Pension Plan. The funding for the plan requires a matching contribution from the university and the employees. Annual pension benefits equal 2.0 per cent of the final five-year average earnings multiplied by the years of pensionable service, less 0.6 per cent of CPP average
SUMMARY FINANCIAL STATEMENTS 97
earnings for each year of pensionable service. The pension benefit is subject to a plan benefit maximum limit of $1,722 per year of pensionable service. In December 2024, the plan had a going-concern deficiency of $2 million, which the university is addressing by making annual payments of $203,000 until the deficiency is eliminated.
Since December 31, 2000, when the defined contribution segment of the plan was introduced, approximately one-quarter of the eligible members converted to that plan. The obligation for pension benefits under the defined contribution segment of the plan will always be equal to net assets in each member’s account. Therefore, no surplus or deficiency arises from fluctuations in the investment market.
| 3) | Brandon University Retirement Plan |
Brandon University administers the Brandon University Retirement Plan, which is a trustee pension plan. The trustees are responsible for the custody of the plan’s assets and issuance of annual financial statements.
The Brandon University Retirement Plan is a final average contributory defined benefit pension plan established on April 1, 1974, for the benefit of the employees of Brandon University. The funding for the plan requires a matching contribution from the university and the employees.
Employees are required to contribute 8.0 per cent of pensionable earnings less 1.8 per cent of pensionable earnings for which Canada Pension Plan (CPP) contributions are required. Effective January 1, 2025, employees are required to contribute 8.0 per cent of pensionable earnings. Pensionable earnings are subject to an annual limit related to the maximum benefit accrual in a year.
Annual pension equals 2.0 per cent of the final five-year average earnings multiplied by the years of pensionable service, less 0.4 per cent of CPP average earnings for each year of pensionable service. The pension benefit is subject to a plan benefit maximum limit of $1,722 per year of pensionable service for members retired on or before April 1, 2009, and $1,975 for those retiring between April 1, 2009, and April 1, 2023.
The plan will continue to be subject to the going-concern funding provisions of the Manitoba Pension Benefits Act and Regulations. The university will be required to fund the matching contributions, as well as the actuarial cost of the defined benefits more than the matching costs. The latest going concern valuation was completed as of December 2024.
| ii. | Public School Divisions |
| 1) | The Winnipeg School Division Pension Fund for Employees Other Than Teachers |
The Winnipeg School Division Pension Fund for Employees Other Than Teachers is a defined benefit pension plan for employees that meet specified employment conditions. The fund was created by By-law 196 of the Winnipeg School Division (replaced by By-law 1017 on January 1, 1992) and is subject to the applicable regulations.
The pension benefits calculation is based on an amount equal to 1.6 per cent of a member’s average pensionable salary and 2.0 per cent of a member’s average salary over the pensionable salary, multiplied by a member’s years of pensionable service. The average salary is determined by averaging the best five years of employment salary in the last 12 years of service.
Employee contributions equal 8.1 per cent of pensionable salary and 9.5 per cent of the earnings more than pensionable salary up to the yearly maximum pensionable earnings, effective January
98 PROVINCE OF MANITOBA ANNUAL REPORT AND PUBLIC ACCOUNTS 2026
1, 2014. The Winnipeg School Division matches employee contributions and pays an additional 12.4 per cent of employee contributions. As a result, employer contributions equal approximately 112.4 per cent of employee contributions.
| 2) | Retirement Plan for Non-Teaching Employees of the St. James-Assiniboia School Division |
The St. James-Assiniboia School Division Retirement Plan for Non-Teaching Employees is a defined benefit pension plan, established on January 1, 1978, that is subject to the applicable regulations.
The pension benefits calculation is based on an amount equal to 1.4 per cent of a member’s average employment earnings below CPP earnings and 2.0 per cent of a member’s employment earnings more than the CPP earnings, multiplied by a member’s years of contributory service. The average employment earnings are determined by averaging the best six years of employment earnings in the last 12 years of service. Effective July 1, 2014, employee contributions were equal to 8.2 per cent of CPP earnings and 9.8 per cent of the employment earnings more than CPP earnings. The St. James-Assiniboia School Division matches employee contributions.
| 3) | Retirement Plan for Employees of Frontier School Division |
The Frontier School Division Retirement Plan is a defined benefit pension plan for non-teaching employees.
The pension benefit is based on an amount equal to 2.0 per cent of a member’s best average earnings, multiplied by a member’s years of credited service. The average employment earnings are determined by averaging the best five years of employment earnings.
Effective July 1, 2014, employee contributions equal 9.0 per cent of CPP earnings, with the Frontier School Division matching employee contributions. The Frontier School Division is responsible for the balance of the pension cost, of which a portion can be financed by an allocation from pension surplus.
| 4) | School District of Mystery Lake Pension Plan |
The School District of Mystery Lake Pension Plan is a defined benefit plan. The school district shall contribute, in accordance with the terms of the collective agreements, such amounts as necessary to provide the future service pension for all members and to amortize any unfunded liability or a solvency deficiency in the plan. If the school district’s contributions are not sufficient, the legislation permits the board of trustees to amend the plan to reduce future accrued pension benefits to meet the required legislated funding requirements.
Effective July 1, 2013, employees contribute 5.0 per cent of gross earnings. Prior to July 1, 2013, employees did not make contributions to the plan. The plan provides that if the defined benefit pension exceeds the plan annuity, the difference is paid from the plan.
The pension benefits are calculated based on a rate per month per year of service. The current rate for maintenance workers is $81.10 per month per year of service. For clerical workers, the pension benefit is $70.60 per month per year of service.
| E. | GOVERNMENT BUSINESS ENTERPRISES |
Manitoba Hydro-Electric Board, Manitoba Liquor and Lotteries Corporation and Manitoba Public Insurance Corporation are members of the CSSF. Effective April 1, 2014, Manitoba Liquor and Lotteries Corporation became a matching employer. As a result, they no longer recognize a pension liability in their statements. The net pension liabilities for the other GBEs are disclosed in Schedule 3.
SUMMARY FINANCIAL STATEMENTS 99
| 8. | CONTINGENCIES |
| A. | CONTINGENT LIABILITIES |
| i. | Legal Actions |
The government is named in various legal actions and has recognized $1.5 billion (2025 – $1.4 billion) for potential liabilities as of March 31, 2026. Estimations for significant cases might change from year-to-year during the legal process. No provision has been made on March 31, 2026, in the accounts where the final results are uncertain, or where the results are likely, but the amount of the liability cannot be reasonably estimated.
| ii. | Canadian Blood Services |
All provincial and territorial governments of Canada, except Quebec, are members of, and provide funding to, Canadian Blood Services (CBS), which operates the Canadian blood system. The March 31, 2025, audited consolidated financial statements of CBS indicate that CBS has two wholly owned captive insurance companies to provide for the contingent liabilities for risks related to operations of the blood system: CBS Insurance Company Limited (CBSI) and Canadian Blood Services Captive Insurance Company Limited (CBSE). Together, these captive insurance companies provide Canadian Blood Services with comprehensive blood risk insurance covering losses up to $1 billion. The primary policy held by CBSI has provided coverage up to $300 million, with the secondary policy held by CBSE providing coverage up to $700 million.
CBSI provides insurance coverage up to $300 million with respect to risks associated with the operation of the blood system. The related assets of CBSI as of March 31, 2025, total $577 million (2024 – $543 million). Based upon the above, the government’s share of the provision for future claims as of March 31, 2025, is offset with designated assets, which at that date exceed the provision.
CBS and CBSE have entered into an agreement wherein the members have agreed to provide insurance coverage for all amounts payable by CBSE under the terms of the excess policy up to $700 million more than the $300 million provided by CBSI. No payment shall be made under CBSE until the limit of the liability under the primary policy in CBSI has been exhausted. The members have agreed to contribute their pro-rata share of the required capital of $700 million. The members have each issued an indemnity to CBSE on their pro-rata share of the $700 million, calculated based on their respective populations. Given current populations, Manitoba’s maximum potential liability under its indemnity to CBSE is approximately $32 million. The government is not aware of any proceedings that could lead to a claim against it under the indemnity given to CBSE.
| iii. | Treaty Land Entitlement Obligations |
The Manitoba government’s obligations under the treaty land entitlement agreements require Manitoba to transfer administration and control of up to 1,144,331 acres of Crown Land (Selections) and up to 282,123 acres of Manitoba interests in Other Land (Acquisitions) to Canada to enable Canada to fulfil its obligations under the treaties between Canada and the First Nations of Manitoba. As of March 31, 2026, Manitoba Entitlement First Nations have collectively selected and acquired approximately 1,055,801 acres of Crown Land and Other Land. As of March 31, 2026, Manitoba has transferred administration and control of 702,220 acres of Crown Land and 19,374 acres of Manitoba interests in Other Land to Canada for reserve creation. The Crown Land and Manitoba interests in Other Land have been transferred in accordance with paragraph 11 of the Natural Resources Transfer Agreement (Schedule to Constitution Act, 1930). The transfers include mines, minerals and other interests impliedly reserved under The Crown Lands Act, as well as all other interests of Manitoba in the lands.
100 PROVINCE OF MANITOBA ANNUAL REPORT AND PUBLIC ACCOUNTS 2026
| iv. | Government Business Enterprises Contingencies |
Significant contingencies for government business enterprises include:
Manitoba Hydro has a mitigation program in place to address past, present and ongoing adverse impacts arising from all past hydro-electric developments (prior to the Wuskwatim Generating Station), particularly for Indigenous people residing or engaged in resource harvesting in the project areas. In recognition of future mitigation payments, Manitoba Hydro has recorded a liability of $180 million (2025 – $187 million). Manitoba Hydro has also recognized a provision of $30 million (2025 – $29 million) for certain mitigation related obligations arising from ongoing adverse effects of past hydro-electric development. There are other mitigation issues, the outcomes of which are not determinable at this time.
| v. | Other Reporting Entities Contingencies |
Significant contingencies for other reporting entities include:
The University of Manitoba has a 7.14 per cent (2025 – 7.14 per cent) interest in TRIUMF Inc. which operates a national laboratory for particle and nuclear physics. The facility is funded by the federal government, and the university makes no direct financial contributions.
The members of TRIUMF Inc. and the Canadian Nuclear Safety Commission (CNSC) approved a decommissioning plan which requires all members to be severally responsible for their share of the decommissioning costs which were estimated at $85,500 as of March 31, 2026, as well as provide financial covenants to the CNSC for the amount of these costs. While there are no current intentions to decommission the facilities and the facilities are estimated to have an indefinite useful life, the university’s share of the unfunded decommissioning costs as at March 31, 2026, is estimated at $5.1 million (2025 – $5.1 million). TRIUMF Inc. has put in place a plan for funding the cost of decommissioning which does not require any payments from the members. The member universities have indemnified the University of British Columbia (UBC) against any liabilities incurred by TRIUMF Inc., under the terms of the lease between TRIUMF Inc. and UBC.
| B. | LOAN GUARANTEES |
The government has guaranteed the repayment of debt, promissory notes, bank loans, lines of credit, mortgages and securities held by others. Debt guaranteed by the government is guaranteed, as to principal and interest, until the debt is matured or redeemed. The authorized limits and the outstanding guarantees are summarized as follows:
| ($ millions) | ||||||||||||
| Authorized Limit |
2026 Actual |
2025 Restated |
||||||||||
| Manitoba Agricultural Services Corporation (Note i) |
- | 38 | 45 | |||||||||
| The Manitoba Housing and Renewal Corporation (Note ii) |
20 | 1 | 1 | |||||||||
| Manitoba Student Aid Program |
20 | - | - | |||||||||
| The University of Winnipeg (Note iii) |
46 | 45 | 21 | |||||||||
| Manitoba Development Corporation (Note iv) |
15 | 15 | - | |||||||||
| Total guarantees outstanding |
101 | 99 | 67 | |||||||||
A provision for future losses on guarantees for $6 million (2025 – $5 million) has been recorded in the accounts.
SUMMARY FINANCIAL STATEMENTS 101
Note i. Manitoba Agricultural Services Corporation
The Manitoba Agricultural Services Corporation has guaranteed loans under the following programs:
| Program
|
General Terms and Conditions
| |||
| Operating Credit Guarantees for Agriculture |
Each participating lending institution is guaranteed up to 25 per cent of the maximum amount advanced, up to a maximum loan of $0.7 million for individuals and $1 million for partnerships, corporations, and co-operatives. | |||
| Manitoba Livestock Associations Loan Guarantees |
Each association’s lending institution is guaranteed 25 per cent of their loaned amount, up to a maximum loan of $12 million per association. | |||
| Diversification Loan Guarantees |
Guarantees are based on 25 per cent of the original principal amount of each individual loan, with no maximum loan amount. | |||
|
|
Rural Entrepreneur Assistance Program |
Each participating lender is guaranteed up to 80 per cent of the loan made to small rural non-agricultural business to a maximum guarantee of $0.2 million. This program was discontinued as of April 1, 2019, with outstanding guarantees in run-off status. |
Note ii. The Manitoba Housing and Renewal Corporation
The Manitoba Housing and Renewal Corporation has authority to guarantee the repayment of various mortgages and issue various letters of credit, which guarantee the terms and conditions of land development agreements and construction contracts, up to $20 million. On March 31, 2026, outstanding guarantees under this authority were $1 million (2025 – $1 million).
Note iii. The University of Winnipeg
University of Winnipeg’s controlled entity, University of Winnipeg Community Renewal Corporation (UWCRC) guarantees specific debts of UWCRC 2.0, a related but uncontrolled corporation, and its controlled entity. On March 31, 2026, the UWCRC guaranteed a CMHC insured housing loan for up to $45 million for the construction of the 308 Colony Joint Venture. The amount owing on this facility as at March 31, 2026 was $44 million (2025 – $21 million). The guarantee will expire once construction on the project is complete and after the lease-up and stabilization is complete.
The university guarantees the term loan of 10014438 Manitoba Association Inc. in the amount of $1 million which matures on July 25, 2028.
Note iv. Manitoba Development Corporation
Manitoba Development Corporation guaranteed a loan with an authorized limit and outstanding exposure of $15 million at March 31, 2026. The guarantee was terminated by the parties effective May 11, 2026.
| C. | GUARANTEES RELATED TO GOVERNMENT BUSINESS ENTERPRISES |
As of March 31, 2026, Manitoba Hydro has outstanding Manitoba Hydro-Electric Board bonds amounting to $109 million (2025 – $109 million). These bonds carry fixed coupon rates that range from 4.05 per cent to 7.10 per cent. The government guarantees $60 million (2025 – $60 million) of these outstanding bonds.
102 PROVINCE OF MANITOBA ANNUAL REPORT AND PUBLIC ACCOUNTS 2026
Manitoba Hydro provides guarantees to counterparties for natural gas purchases. On March 31, 2026, there was an outstanding guarantee totaling $40 million (2025 – $40 million) which matures October 31, 2027. Letters of credit for $101 million (2025 – $78 million) have been issued for construction and energy-related transactions with maturities until 2049.
The government provided approval to Manitoba Hydro to issue up to $500 million of promissory notes and $250 million of credit facilities for a total of $750 million. As at March 31, 2026, there were $461 million (2025 – $461 million) of promissory notes and Hydro issued-bonds outstanding and $101 million (2025 – $78 million) credit facilities were utilized for a total of $562 million (2025 – $539 million).
The Deposit Guarantee Corporation of Manitoba (Corporation) has guaranteed $41.2 billion in credit union deposits at the end of December 31, 2025 (December 31, 2024 – $40.8 billion). Based upon its ongoing monitoring procedures, the Corporation has concluded that a provision for such contingencies does not need to be established at this time.
| 9. | CONTRACTUAL OBLIGATIONS |
The government has entered into multi-year contracts and agreements for the delivery of services and the acquisition or construction of assets. These contractual obligations will become liabilities in the future when the terms of the contracts are met. The following represents the amounts required to satisfy the contractual obligations by the year that it is anticipated that the terms of the contract will be met, as of March 31:
| ($millions) | ||||||||||||||||||||||||||||
| 2027 | 2028 | 2029 | 2030 | 2031 | 2032 and thereafter |
Total | ||||||||||||||||||||||
| Government organizations and components |
||||||||||||||||||||||||||||
| Service contracts |
727 | 356 | 137 | 116 | 54 | 144 | 1,534 | |||||||||||||||||||||
| Rental of capital assets |
108 | 84 | 72 | 64 | 60 | 333 | 721 | |||||||||||||||||||||
| Acquisition or construction of capital assets |
583 | 320 | 143 | 106 | 160 | 124 | 1,436 | |||||||||||||||||||||
| Other contracts |
220 | 38 | 40 | 4 | - | - | 302 | |||||||||||||||||||||
| Government business enterprises |
140 | 115 | 37 | 17 | 10 | 16 | 335 | |||||||||||||||||||||
| Total |
1,778 | 913 | 429 | 307 | 284 | 617 | 4,328 | |||||||||||||||||||||
Included in the contractual obligations for the acquisition or construction of capital assets are commitments relating to approximately $57 million of Shared Health directed capital expenditures under the Health Care Centre of Excellence Public Private Partnership. These expenditures include tenant equipment, digital shared services and other tenant-controlled capital assets. As at March 31, 2026, approximately $1 million had been incurred and recognized by Shared Health as assets under construction. The remaining contractual commitment of approximately $56 million will be funded by the government over the remaining construction period in accordance with the approved project funding plan.
Other significant obligations not included in the table are:
HEALTH CARE CENTRE OF EXCELLENCE PUBLIC PRIVATE PARTNERSHIP
The government has entered into contractual commitments relating to the design, construction, financing and lease of the Health Care Centre of Excellence under a Public Private Partnership (P3) arrangement. The estimated total project cost is approximately $543 million, comprising approximately $486 million of forecast developer project costs.
SUMMARY FINANCIAL STATEMENTS 103
As at March 31, 2026, approximately $86 million had been recognized as infrastructure asset under construction in the summary financial statements. Accordingly, approximately $457 million of the estimated total project costs remained to be incurred at March 31, 2026, including the remaining Shared Health directed capital expenditures and developer financed construction costs.
Upon substantial completion of the project, currently expected in 2028, Shared Health will commence lease payments under a 35-year lease agreement. The lease payments will be determined in accordance with the contractual formula set out in the lease agreement and will depend on the final allowable development costs and financing structure of the arrangement. As these amounts are not yet sufficiently determinable, future lease payment amounts and a capital repayment schedule have not been presented.
Additional information regarding the P3 arrangement, including its significant contractual terms and the rights and obligations of the parties, is provided in Note 21 – Public Private Partnership Arrangements.
GOVERNMENT ORGANIZATIONS
Government organizations (GOs) have entered contractual arrangements related to construction projects, capital assets, equipment, and lease totaling $438 million (2025 – $498 million), and details relating to the settlement year cannot be reasonably estimated.
GOVERNMENT BUSINESS ENTERPRISES CONTRACTUAL OBLIGATIONS
Manitoba Hydro has energy purchase commitments of $1,361 million (2025 – $1,534 million) that relate to future purchases of wind, natural gas (including transportation and storage contracts) and electricity.
Commitments are primarily for transmission right access that expire in 2041, wind and solar purchases that expire in 2040 and natural gas purchases that expire in 2040. In addition, other outstanding commitments principally for construction are approximately $2,800 million (2025 – $2,126 million).
Manitoba Liquor and Lotteries Corporation has purchase commitments of $1 million (2025 – $3.9 million) related to property and equipment and intangible assets.
| 10. | DEBT SERVICING |
Public debt servicing costs of $2,313 million (2025 – $2,316 million) includes interest expense on Manitoba Hydro-Electric Board debt of $905 million (2025 – $881 million). Public debt servicing cost also includes interest on provincial debt held as investments of $6 million (2025 – $5 million). GBEs public debt servicing costs of $1,084 million (2025 – $1,092 million) are reported in Schedule 3.
| 11. | AMOUNTS HELD IN TRUST |
Amounts held in trust are assets over which the Manitoba Legislature has no power of appropriation. These amounts are not included in the summary financial statements because the government has no control over the amounts and administers them according to trust or other agreed-upon arrangements.
104 PROVINCE OF MANITOBA ANNUAL REPORT AND PUBLIC ACCOUNTS 2026
As of March 31, 2026, amounts held in trust were as follows:
| ($ millions)
|
||||||||||||
| Valuation Method
|
2026 Actual
|
2025 Restated
|
||||||||||
| Public Guardian and Trustee of Manitoba |
various | 450 | 396 | |||||||||
| Public Service Group Insurance Fund |
market | 357 | 327 | |||||||||
| Manitoba Development Corporation |
cost | 3 | 4 | |||||||||
| Other fiduciary trust |
various | 102 | 91 | |||||||||
| Custodial trust held by departments |
various | 33 | 32 | |||||||||
| The Suitor’s Money Act |
cost | 13 | 13 | |||||||||
| Total |
958 | 863 | ||||||||||
The Public Guardian and Trustee of Manitoba administers the estates and trusts of persons with intellectual disabilities, deceased persons and infants. The estates and trusts under administration are in the form of bonds, equities, real estate, mortgages and other securities.
The Public Service Group Insurance Fund is administered by the Civil Service Superannuation Board. It includes three plans to provide life insurance, accidental death and disablement insurance and dependents insurance for eligible employees and retired employees (and their eligible dependents) of Manitoba government and most of its agencies and boards. These funds are in the form of cash, cash equivalents and equities.
Manitoba Development Corporation administers funds from the Business Investor Stream of the Provincial Nominee Program. These funds are invested in the form of cash, cash equivalents, bonds and investments.
Other Fiduciary Trust funds are interest-bearing deposits which are pooled with the government’s investments to earn a market rate of interest. Government departments also hold custodial trust funds in the form of bonds and other securities.
| 12. | RISK MANAGEMENT AND THE USE OF DERIVATIVE FINANCIAL INSTRUMENTS |
During the normal course of business, the government is exposed to several financial risks including credit, liquidity and market risk. Market risk results from fluctuations in foreign currency and interest rates.
The government employs various risk management strategies and operates within fixed risk exposure limits to ensure exposure to risk is managed in a prudent and cost-effective manner. Varieties of strategies are used including the use of derivative financial instruments (derivatives).
Derivatives are financial contracts, the value of which is derived from the underlying instruments. The government uses derivatives to hedge and mitigate foreign exchange and interest rate risk. The government does not use derivatives for speculative purposes.
Since derivatives are utilized for risk management purposes, it is not the practice of the government to terminate derivative contracts before maturity and realize gains or losses on early terminations. On occasion, loans and advances clients prepay loans that have swapped contracts attached to them. The client is required to pay a penalty that offsets the government’s cost to unwind the associated swap.
| A. | CREDIT RISK |
Credit risk is the likelihood of one party to a financial instrument failing to discharge an obligation and causing financial loss to the counterparty. The financial instruments that potentially subject the government
SUMMARY FINANCIAL STATEMENTS 105
to credit risk consist of cash and cash equivalents, amounts receivable, due from Manitoba Hydro-Electric Board, derivative financial assets, portfolio investments and loans and advances. The government had $99 million (2025 – $67 million) in loan guarantees outstanding.
The government’s maximum exposure to credit risk is as follows:
|
|
|
($millions)
|
| |||||||
| 2026 Actual
|
2025 Restated
|
|||||||||
| Cash and cash equivalents | 4,644 | 4,722 | ||||||||
| Amounts receivable | 2,833 | 2,710 | ||||||||
| Due from Manitoba Hydro-Electric Board | 26,039 | 24,831 | ||||||||
| Derivative financial assets | 2,435 | 2,223 | ||||||||
| Portfolio investments – non-endowed | 3,795 | 4,211 | ||||||||
| Loans and advances | 1,715 | 1,638 | ||||||||
| Total | 41,461 | 40,335 | ||||||||
The government reviews balance and aging information to determine if a valuation allowance is necessary. The government’s exposure to credit risk on accounts receivable is disclosed in Schedule 1.
Credit risk is concentrated in agricultural loans and Manitoba student loans. The Manitoba Agricultural Services Corporation (MASC) board of directors is responsible for approving and monitoring tolerance of credit exposures. It does this through review and approval of the guidelines for lending and loan guarantee programs and by setting general limits on credit exposures to individual clients. MASC has comprehensive policy and procedures manuals in place for all lending programs. In general, MASC emphasizes responsible lending, which is comprised of a combination of adequate loan security and a client’s ability to pay. In total, MASC had $813 million (2025 – $817 million) in agricultural loans on March 31, 2026.
The government manages credit risk on investments through its investment policies. The primary objective is the preservation of principal. Funds are managed in a manner that ensures sufficient liquidity to meet all cash payments when due. Within the bounds of these two objectives, the funds are invested to achieve appropriate returns within the approved risk limits. Each fund is structured to diversify investments and reduce the risk of loss due to over-concentration of assets in a particular category or with a single issuer. Each issuer of the securities authorized for purchase must meet the minimum criteria, which is approved by the Risk Committee, for short- and long-term issuers.
| B. | COUNTERPARTY DEFAULT RISK |
Notional amounts of derivative contracts represent the contractual amounts to which a rate or price is applied for computing the cash flows to be exchanged. The notional amounts are used to determine the gains (losses) and fair value of the contracts and are a measure of the exposure to the asset class to which the contract relates. Notional values are $36 billion for interest rate swaps and $14 billion for cross currency swaps.
Fair values of the derivatives are the estimated amounts that the government would receive or pay, based on market factors, if the agreements were terminated on March 31, 2026. They are established by discounting the expected cash flows of the swap agreements using year end market interest and exchange rates. A positive (negative) fair value indicates that the government would receive (make) a payment if the agreements were terminated.
106 PROVINCE OF MANITOBA ANNUAL REPORT AND PUBLIC ACCOUNTS 2026
| ($millions) | ||||||||||||||||||||||||
| Notional | Market Value | |||||||||||||||||||||||
| Year of Maturity (fiscal) |
Interest Rate Swaps |
Cross- Currency Swaps |
Total | Interest Rate Swaps |
Cross- Swaps |
Total | ||||||||||||||||||
| 2027 |
1,042 | 1,394 | 2,436 | (12) | 35 | 23 | ||||||||||||||||||
| 2028 |
772 | 299 | 1,071 | 6 | (20) | (14) | ||||||||||||||||||
| 2029 |
911 | 1,514 | 2,425 | (10) | 109 | 99 | ||||||||||||||||||
| 2030-2034 |
6,442 | 2,034 | 8,476 | (39) | 15 | (24) | ||||||||||||||||||
| 2035-2039 |
10,456 | 5,060 | 15,516 | (254) | 105 | (149) | ||||||||||||||||||
| 2040-2044 |
6,610 | 2,176 | 8,786 | 124 | (287) | (163) | ||||||||||||||||||
| 2045-2049 |
5,356 | 351 | 5,707 | 702 | (138) | 564 | ||||||||||||||||||
| 2050-2054 |
2,002 | 662 | 2,664 | 91 | (168) | (77) | ||||||||||||||||||
| 2055-2059 |
1,173 | 238 | 1,411 | (14) | (8) | (22) | ||||||||||||||||||
| 2060- |
1,471 | - | 1,471 | 109 | - | 109 | ||||||||||||||||||
| Total |
36,235 | 13,728 | 49,963 | 703 | (357) | 346 | ||||||||||||||||||
The data used for this analysis above and on the tables below reconciles to the March 31, 2026, Derivative Valuation using the Bloomberg Multi-Asset Risk System. The Bloomberg Multi-Asset Risk System is used by the Treasury Division. Treasury does not include derivative from Shared Health with a notional value of $18 million (2025 – $19 million); St.Amant Inc. notional value $18 million (2025 – $19 million); Winnipeg Regional Health Authority notional value $10 million (2025 – nil) and Seven Oaks School Division notional value $11 million (2025 – $12 million). The market value of these derivatives is less than 1 million.
The government only enters into International Swaps and Derivative Association master agreements (ISDAs) with counterparties that meet strict investment grade credit rating requirements. The counterparties have all signed ISDAs with the government and continue to meet strict investment grade credit rating requirements. Risk of adverse financial impacts from derivative counterparty exposures is mitigated through the use of derivative counterparty exposure limits, which are regularly measured and monitored. The government does not have equity-based or credit risk derivatives.
Credit Support Annexes (CSAs) are negotiated with derivative counterparties. These CSAs mitigate risk by requiring collateralization of counterparty exposure under specified credit events. The government has no collateral on derivatives. On March 31, 2026, 100 per cent (2025 – 100 per cent) of the notional value of the government’s derivative financial instrument contracts is held by counterparties with an S&P Global Ratings credit rating of A or better.
| Derivative Exposure (CAD) by Credit Rating | ($ millions) | |||||||
| Credit Rating | Notional | Market Value | ||||||
| Aa1/AA- |
5,123 | (183) | ||||||
| Aa2/A+ |
44,827 | 531 | ||||||
| Aa3/A+ |
13 | (2) | ||||||
| C. | LIQUIDITY RISK |
Liquidity risk is the risk that funds are not available when required to discharge the liabilities of the government and its agencies as they become due. The government takes active approaches to address liquidity risk through its borrowing strategy, cash flow forecasting and modelling, cash reserves and credit facilities. The government has internal control processes and contingency plans for managing liquidity risk. Schedule 4 provides a summary of the contractual maturities for borrowings.
SUMMARY FINANCIAL STATEMENTS 107
The government’s exposure to liquidity risk is related to accounts payable and accrued liabilities such as salaries and benefits. The government manages its cash flow through investment purchases and sales, and by purchasing its own debt for sinking fund investments.
The government prepares cash flows for periods between one week and 12 months. The government ensures funding needs are available six months ahead of funding requirements. Additional funds can be accessed through the issuance of Manitoba Treasury Bills, promissory notes, access to uncommitted revolving credit facilities with Canadian banks, and liquidation of securities in the Manitoba government Sinking Fund.
| D. | MARKET RISK |
Market risk is the risk that the fair value or future cash flows of a financial instrument will fluctuate because of changes in market prices. The government is exposed to three types of market risk: foreign exchange risk, interest rate risk and refinancing risk. The government continually monitors its exposure to these risks and uses derivative contracts to manage these risks.
| E. | FOREIGN EXCHANGE RISK |
Foreign exchange risk is the risk of loss or higher costs when liabilities or assets are held in a foreign currency. The government’s most significant exposure to foreign currency risk exposure is the issuance of debt in a foreign currency. Foreign currency risk also arises from securities held in pooled investment funds and are denominated in currencies other than Canadian dollars.
The following table illustrates the derivative exposure by currency:
| ($millions) |
||||||||
| Currency | Notional | Market Value | ||||||
| Canadian Dollars |
36,235 | 702 | ||||||
| US Dollars |
4,391 | 155 | ||||||
| Australian Dollars |
1,535 | (66) | ||||||
| Swiss Franc |
1,413 | 285 | ||||||
| European Euros |
5,500 | (501) | ||||||
| Hong Kong Dollars |
185 | (4) | ||||||
| Japanese Yen |
196 | (112) | ||||||
| New Zealand Dollars |
283 | (16) | ||||||
| Swedish Krona |
225 | (97) | ||||||
The carrying value of foreign currency debt in the Consolidated Statement of Financial Position is impacted by fluctuations in foreign exchange rates, and correspondingly the carrying value of foreign currency derivatives. Throughout the life of a debt instrument denominated in a foreign currency and associated derivative, the remeasurements are not perfectly offsetting and create volatility in the Consolidated Statement of Financial Position and in the Consolidated Statement of Remeasurement Gains and Losses. This volatility is never realized in the Consolidated Statement of Operations as hedging derivatives are not terminated prior to maturity. Change in the foreign debt due to foreign currency fluctuation is equal to the change in carrying value of the associated derivative immediately prior to maturity.
The government does not assume unhedged foreign currency risks on its debt issuance, but it does hold USD debt on behalf of Manitoba Hydro. Manitoba Hydro accepts the risk and cost of servicing any foreign currency issued on its behalf.
108 PROVINCE OF MANITOBA ANNUAL REPORT AND PUBLIC ACCOUNTS 2026
Manitoba Hydro has $900 million (2025 – $1,474 million) of U.S. debt not hedged by derivatives. Manitoba Hydro has exposure to U.S. dollar foreign exchange fluctuations primarily through the sale and purchase of electricity and fuel in the U.S. This exposure is managed through a long-term natural hedge between U.S. dollar cash inflows from export revenues and U.S. dollar cash outflows for long-term debt coupon and principal payments. Bridging temporary timing differences between inflows and outflows to future years’ U.S. dollar requirements, Manitoba Hydro also utilizes derivative foreign exchange forward contracts as required.
| F. | INTEREST RATE RISK |
Interest rate risk is the risk of loss or higher costs associated with adverse fluctuations in interest rates. Derivatives are used to provide financial stability by reducing the impact of interest rate volatility and the floating interest rate fixed and floating mix of its debt portfolio.
A rise in interest rates means a drop in the fair value of interest-bearing securities held as portfolio investments or increased debt servicing cost when issuing variable rate debt.
After considering derivatives used to manage interest rate risk, investments and eliminating the debt incurred on behalf of Manitoba Hydro, the structure of the debt as of March 31, 2026, was 88 per cent at fixed rates and 12 per cent at floating rates (2025 – 90 per cent at fixed rates and 10 per cent at floating rates). A 1.0 per cent (100 basis points) movement in interest rates on the 12 per cent floating rate debt for an entire year would increase debt servicing costs by $46 million (2025 – $33 million) when issuing variable rate debt.
| G. | REFINANCING RISK |
The orderly retirement of future debt obligations, without incurring undue refinancing risk is important in terms of managing both future interest costs and accessing required funding in future years. To this end, the government will use its best efforts to smooth out debt maturities from less than one year to greater than 30 years. The government also identifies bond buy-back opportunities, whereby excess cash can be used to buy back outstanding debt, thus reducing refinancing risk and future liquidity risk.
13. ASSET RETIREMENT OBLIGATIONS
The asset retirement obligations represent management’s best estimate of the present value of the costs that are expected to be incurred for the remediation of hazardous materials present in some of the province’s buildings, equipment, and landfills. The presence of asbestos is not a current health hazard, and there is no requirement to remove asbestos in these buildings if the asbestos is contained and does not pose a public health risk. There is however a legal obligation to incur remediation costs.
| ($millions) | ||||||||
| 2026 Actual |
2025 Restated |
|||||||
| Asset retirement obligations, beginning of year |
891 | 806 | ||||||
| Change in assumptions |
48 | 52 | ||||||
| Additions |
4 | 4 | ||||||
| Liabilities settled during the period |
(5) | (5) | ||||||
| Accretion expense |
37 | 34 | ||||||
| Asset retirement obligations, end of year |
975 | 891 | ||||||
SUMMARY FINANCIAL STATEMENTS 109
The discount rate used to determine the present value of the obligations ranged from 3.2 per cent to 5.54 per cent. The discount rate is based on the government’s cost of borrowing.
On March 31, 2026, the undiscounted asset retirement obligations were $2,121 million (2025 – $1,958 million). These obligations are expected to be settled between 2027 and 2084.
The asset retirement obligations relate to buildings, equipment and landfills. The government estimated the nature and extent of hazardous materials in its buildings based on the potential square metres, and the average cost per square metre, to remove and dispose of the hazardous materials. The estimates are based on assessments provided by third-party and internal experts. During the year, some GOs changed the discount rate, and the impact is reflected in the change in assumptions.
Manitoba Hydro recognizes an asset retirement obligation for the removal and disposal of PCB-contaminated fluid in equipment. The asset retirement obligation had been fulfilled during the year (2025 – estimated undiscounted cash flows required to settle the obligation was $7 million with a discount rate of 2.46 per cent).
| 14. | SIGNIFICANT TRANSACTIONS WITH GOVERNMENT BUSINESS ENTERPRISES |
Transactions with GBEs are not eliminated for purposes of summary reporting because they are reported in these summary financial statements using the modified equity method of accounting. These financial statements include the following transactions between the government and GBEs, which have not been eliminated:
| A. | ACCOUNTS RECEIVABLE AND LOANS AND ADVANCES |
Amounts receivable include receivables from GBEs as reported in Schedule 1 to the summary financial statements. Loans and advances to GBEs are reflected in Schedule 2 to the summary financial statements.
| B. | BORROWINGS ON BEHALF OF, AND AMOUNTS DUE FROM MANITOBA HYDRO-ELECTRIC BOARD |
The government issues debt and subsequently loans the funds to Manitoba Hydro. The government records the transfer of funds, in Canadian currency, as a loan receivable from Manitoba Hydro. The government pays the interest on the debt which is charged to the loan receivable. Payments on the debt by Manitoba Hydro are credited to the loan receivable.
The government enters derivative contracts to mitigate the risk against interest rate and foreign currency fluctuations.
The balance of the loan receivable on March 31, 2026, was $26,039 million (2025 – $24,831 million). For the year ended March 31, 2026, the government paid $905 million (2025 – $881 million) in interest on the Manitoba Hydro debt and received $905 million (2025 – $881 million) in interest payments from Manitoba Hydro.
| C. | INVESTMENTS |
MPI holds $356 million (2025 – $397 million) of provincial bonds and debentures with maturity dates ranging from 2026 to 2050 and interest rates ranging from 2.1 per cent to 6.3 per cent.
Manitoba Hydro holds $76 million (2025 – $81 million) of provincial bonds and debentures with maturity dates ranging from 2028 to 2033 and interest rates ranging from 1.5 per cent to 4.3 per cent.
The government holds $100 million (2025 – nil) of Manitoba Hydro bonds with maturity dates in April 2026 and an interest rate of 2.26 per cent.
110 PROVINCE OF MANITOBA ANNUAL REPORT AND PUBLIC ACCOUNTS 2026
| D. | WATER POWER RENTALS |
Water power rental fees charged to Manitoba Hydro for $43 million (2025 – $54 million) are included in the Consolidated Statement of Operations under the fees and other revenue category. Water power rental rates are authorized by subsection 48(3.2) of the Water Power Act. Rentals are paid to the government for the use of water resources in the operation of Manitoba Hydro’s hydro-electric generating stations.
| E. | FEES ON GOVERNMENT GUARANTEES |
Manitoba Hydro remitted $96 million (2025 – $118 million) to the government based on the amount of their debt that is guaranteed by the government. The fees are included in the Consolidated Statement of Operations under the Recovery from GBEs and other investment earnings category.
| F. | DRIVER LICENSING OPERATIONS |
The government, by agreement, paid $40 million (2025 – $40 million) to MPI for the management and administration of driver licensing. MPI, on behalf of the government, collected driver licensing fees totaling $30 million (2025 – $30 million) and motor vehicle registration fees totaling $183 million (2025 – $181 million).
The fees received by the government are included in the Consolidated Statement of Operations under the fees and other revenue category.
| G. | OTHER REVENUE |
Manitoba Liquor and Lotteries Corporation provided $5 million in funding to Shared Health for the year ended March 31, 2026 (2025 – $5 million) for addictions and problem gambling services programs. In addition, the Corporation provided $5 million (2025 – $5 million) in funding to the Liquor, Gaming and Cannabis Authority of Manitoba through the payment of annual license fees and levies.
Manitoba Hydro paid the government nil (2025 – $131 million) for corporation capital tax. Under the Budget Implementation and Tax Statutes Amendment Act, 2025, the corporation capital tax paid by crown corporations was eliminated. MPI paid the government $53 million (2025 – $49 million) for insurance premium tax. GBEs paid the government a combined total of $22 million (2025 – $20 million) for Levy for Health and Education.
Manitoba Hydro paid $78 million (2025 – $67 million) to Efficiency Manitoba Inc. for its operation. Efficiency Manitoba Inc., a Crown corporation established under the Efficiency Manitoba Act, is economically dependent on Manitoba Hydro for continued operations.
MPI paid Manitoba Health, Seniors and Long-Term Care $33 million (2025 – $26 million) to cover non-insured medical expenses.
These amounts are included in the Consolidated Statement of Operations under the fees and other revenue and other taxes categories.
SUMMARY FINANCIAL STATEMENTS 111
| 15. | EMPLOYEE FUTURE BENEFITS |
| ($ millions) | ||||||||
| 2026 Actual |
2025 Actual |
|||||||
| Severance |
546 | 511 | ||||||
| Long-term disability income plan |
49 | 45 | ||||||
| Workers’ compensation claims |
114 | 90 | ||||||
| Other |
94 | 92 | ||||||
| Total |
803 | 738 | ||||||
The severance liability is valued using discount rates that range from 3.9 per cent to 6.0 per cent and salary increase rates that range from 2.0 per cent to 11.0 per cent. Unamortized actuarial gains and losses are amortized over the estimated average remaining service life (EARSL). Periods range from five to 15.69 years. As of March 31, 2026, net unamortized losses were $45 million (2025 – unamortized gains $58 million).
The long-term disability income plan is valued using a discount rate of 4.0 per cent. Actuarial gains and losses are recognized as income as they occur.
Under section 73 of The Workers Compensation Act, employers are classified into five categories (Classes B to E). Employers in Classes B to E are individually assessed and are responsible for the costs of workers’ compensation claims incurred by their workers, as well as their share of the annual administrative costs of Manitoba’s workers compensation system. The Manitoba government is in Class C. The liability, as determined by the Workers Compensation Board of Manitoba, includes estimated costs for work-related injury benefits, compensation, long-latency disease and fatality claims, and related administration.
| 16. | EXPENSES IN EXCESS OF LEGISLATIVE AUTHORITY |
The budget estimates presented in the Consolidated Statement of Operations exclude $600 million in special warrants related to the departments. The original budget estimate amounts plus the $600 million in special warrants become the revised estimates, against which expenses in excess of legislative authority are determined. Based on the revised estimates, the following departments or expenditure lines were over-expended as at March 31, 2026:
| PART A – OPERATING EXPENSE:
|
($ millions) | |
| Environment and Climate Change |
87 | |
| Public Service Delivery |
40 | |
| Employee Pensions and Other Costs |
25 | |
| Justice |
7 | |
| Transportation and Infrastructure |
5 | |
| Finance |
2 | |
112 PROVINCE OF MANITOBA ANNUAL REPORT AND PUBLIC ACCOUNTS 2026
| 17. | LIABILITY FOR CONTAMINATED SITES |
The government reports environmental liabilities related to the management and remediation of contaminated sites where the province is obligated to incur such costs. A contaminated sites liability of $443 million (2025 – $363 million) has been recorded based on environmental assessments or estimations for those sites where an assessment has not been conducted.
As of March 31, 2026, the government has identified 489 sites which require remediation from contamination.
The government is responsible for the risk management and potential remediation of certain orphaned and abandoned mine sites that exist on Crown land. For most of these mine sites, the companies that caused the contamination no longer exist. The mining operations were primarily comprised of gold and other metals. The risk of contamination at these sites comes mainly from mine tailings and other contaminants that were left on site. The liability also includes sites associated with highway maintenance, airports, marines, landfills, sewage treatment facilities, commercial and industrial operations, parks and other protected areas.
The nature of contamination includes petroleum hydrocarbons, polyaromatic hydrocarbons, BTEX, toxic heavy metals, polychlorinated biphenyl and other organic contaminants. The sources of contamination include above ground and underground fuel storage tanks, fuel handling, pipelines, chemical storage, by-product waste, metal-based paint and the leaching of materials deposited in landfills. Sites often have multiple sources of contamination.
Where sites require ongoing remediation, monitoring or maintenance, all estimated future costs are discounted using the government’s weighted average cost of capital. Remediation at three sites requires the operation of water treatment systems until 2065. The amount of undiscounted expenditures for the future operation of the water treatment systems, which have been discounted at 4.0 per cent (2025 – 4.0 per cent) over the next 39 years, is $203 million (2025 – $194 million). The discount rate is based on the government’s cost of borrowing. The assumed rate of inflation is 2.0 per cent.
Manitoba Hydro reports environmental liabilities related to the natural gas segment and to past hydroelectric development. Manitoba Hydro has recorded a contaminated sites liability of $69 million as at March 31, 2026 (2025 – $83 million), which is expected to be settled by 2046. The amount of undiscounted future cash flows, which have been discounted using rates ranging from 3.03 per cent to 3.79 per cent (2025 – 2.55 per cent to 3.17 per cent), is $89 million (2025 – $101 million).
| 18. | RELATED PARTY DISCLOSURES |
A related party exists when one party could exercise control or shared control over the other. Related parties include key management personnel, their close family members and the entities they control or have shared control over. Related party disclosures do not include inter-entity transactions and balances that are eliminated on consolidation or those with entities accounted for under the modified equity method. Related party disclosures do not include restructuring transactions, disclosure of key management personnel compensation arrangements, expense allowances and other similar payments routinely paid in exchange for services rendered.
Related party transactions are disclosed if they occurred at a value different from that which would have been arrived at if the parties were unrelated and the transaction had a material effect on the summary financial statements.
For the year ended March 31, 2026, there were no material related party transactions or balances to disclose.
SUMMARY FINANCIAL STATEMENTS 113
| 19. | CONTRACTUAL RIGHTS |
The government is involved in various contracts and agreements arising in the ordinary course of business. This results in contractual rights to economic resources, leading to both assets and revenue in the future. The total amounts outstanding from these agreements on March 31, 2026, are as follows:
| ($ millions) | ||||||||||||||||||||||||||||
| 2027 | 2028 | 2029 | 2030 | 2031 | 2032 and thereafter |
Total | ||||||||||||||||||||||
| Federal transfers – capital |
359 | 300 | 151 | 58 | 38 | 75 | 981 | |||||||||||||||||||||
| Federal transfers – operating |
698 | 627 | 544 | 482 | 413 | 10 | 2,774 | |||||||||||||||||||||
| Lease and rental agreements |
79 | 76 | 75 | 74 | 72 | 126 | 502 | |||||||||||||||||||||
| Other |
20 | 21 | 21 | 20 | 20 | 250 | 352 | |||||||||||||||||||||
| Total |
1,156 | 1,024 | 791 | 634 | 543 | 461 | 4,609 | |||||||||||||||||||||
Under subsection 22(4) of The Manitoba Liquor and Lotteries Corporation Act, the government is entitled to receive the net revenue from the Manitoba Liquor and Lotteries Corporation. The future amounts to be received are unknown, so they have not been included in the table above. These contractual rights could be significant.
The contractual rights for waterpower rentals included in lease and rental agreements have been estimated using the current year’s revenue for the next six years. This contract has no expiration date and amounts beyond 2032 may be significant.
The government is also entitled to receive investment revenue from various investments held in irrevocable trusts by Winnipeg Foundation. The amount of revenue, when known, is included for the next six years.
Manitoba Hydro has dependable export sales contracts to U.S. and Canada totaling approximately $6.3 billion expiring in 2052/53. Dependable sales are export contracts sourced from Manitoba Hydro’s hydraulic energy available during lowest water conditions.
| 20. | TOBACCO SETTLEMENT |
In March 2025, the Ontario Superior Court of Justice approved a $32.5 billion settlement agreement in Canada under the Companies’ Creditors Arrangement Act arising from litigation against three major tobacco companies for health-care-related costs.
Under the terms of the settlement, $24.7 billion is payable to the Provinces and Territories with an upfront payment of $6.5 billion. Manitoba’s share of the Provinces and Territories portion is approximately 4.53 per cent, which represents $1.1 billion including an upfront payment of $293 million and the balance to be paid annually over an estimated 20-year settlement period. The upfront payment was received during 2025/26.
Revenue of nil (2024/25 – $846 million) was recognized in 2025/26. The settlement revenue was recognized in the prior year based on the present value of estimated future payments. A discount rate reflective of Manitoba’s cost of borrowing was used. Future annual payments are contingent on the profitability of the tobacco companies from the sale of tobacco products and therefore subject to variability and uncertainty. In addition, only five-year estimated cash flow information was provided at the time of the preparation. There is significant uncertainty over the amount and timing of these future payments, as a result an allowance for doubtful accounts in the amount of $396 million continues to be recognized, representing the net present value of estimated future
114 PROVINCE OF MANITOBA ANNUAL REPORT AND PUBLIC ACCOUNTS 2026
years payments beyond year six. Net impact on the government’s Consolidated Statement of Operations was nil (2025 – $421 million):
| ($ millions) | ||||||||
| 2026 Actual |
2025 Actual |
|||||||
| Revenue |
- | 846 | ||||||
| Expenses |
||||||||
| Bad debt expense |
- | 396 | ||||||
| Legal fees |
- | 29 | ||||||
| Total expenses |
- | 425 | ||||||
| Net impact |
- | 421 | ||||||
There is inherent uncertainty regarding the amount and timing of future payments. An annual reassessment will be conducted using updated financial and operational information from the tobacco companies. Adjustments to the carrying value of the tobacco settlement receivable and the related allowance for doubtful accounts may be material.
| 21. | PUBLIC PRIVATE PARTNERSHIP ARRANGEMENTS |
The Health Care Centre of Excellence (HCCE) redevelopment project represents the government’s first Public Private Partnership (P3) arrangement accounted for under PS 3160, P3. The arrangement is being disclosed in the summary financial statements for the first time in 2025/26.
The government has a P3 arrangement with TN HCCE Limited Partnership for the design, construction, financing and delivery of the True North Health Care Centre of Excellence redevelopment project located at Portage Place in Winnipeg. The project is being delivered under a Design-Build-Finance-Lease arrangement. Upon completion of construction, Shared Health will lease, occupy and operate the completed health-care facility.
The current estimated total project cost is approximately $543 million, comprising approximately $486 million of forecast developer project costs and approximately $57 million of Shared Health directed capital costs relating primarily to tenant equipment, digital shared services and other tenant-controlled capital assets. These Shared Health directed costs form part of the overall project but are funded separately by the government and recognized by Shared Health as the related assets are acquired.
Construction of the facility was ongoing on March 31, 2026. As at March 31, 2026, approximately $85 million of project costs had been incurred by the developer. In addition, approximately $1 million of Shared Health directed capital costs had been funded by the government and recorded by Shared Health as assets under construction. As Shared Health is fully consolidated in the summary financial statements, these costs are included in the government’s infrastructure asset under construction balance. Accordingly, approximately $86 million relating to the HCCE project was included in infrastructure asset under construction at March 31, 2026. Additional information on tangible capital assets is provided in Schedule 7 – Consolidated Statement of Tangible Capital Assets.
Construction of the facility is expected to be substantially completed in 2028, with the lease expected to commence on November 1, 2028. The initial lease term is 35 years, with one option to renew for an additional 15 years. Lease payments will be determined in accordance with the contractual formula set out in the lease agreement and will depend on the final allowable development costs and True North’s actual financing structure. As the project remains under construction, the final allowable development costs and financing structure have
SUMMARY FINANCIAL STATEMENTS 115
not yet been determined. Consequently, the amount of future lease payments and related capital repayment requirements cannot be reliably determined at March 31, 2026 and have not been quantified in these financial statements.
Under the arrangement, TN HCCE Limited Partnership is responsible for the design, financing and construction of the facility. The government is responsible for funding Shared Health directed capital costs and making contractual lease payments over the lease term. Shared Health will lease, occupy and operate the completed facility. The government retains responsibility for monitoring compliance with contractual performance requirements throughout the construction and operating periods.
There were no significant amendments to the P3 arrangement during the year. As the project progresses and additional information regarding final project costs, the financing structure and future contractual payments become available, the government will update the related measurements and disclosures.
Additional information regarding the government’s contractual commitments under this arrangement is provided in Note 9 – Contractual Obligations.
| 22. | RESTATED BUDGET |
The restated budget presented on the Consolidated Statement of Operations is taken from Budget 2025 as presented to the Legislative Assembly on March 20, 2025, and restated for comparability to the current year results. Refer to Schedule 10 for further details. The restated amounts do not include authorizations granted in the special warrants of $600 million.
| 23. | COMPARATIVE FIGURES |
On June 4, 2025, the government announced organizational changes that resulted in the transfer of certain duties and functions between departments, including the transfer of responsibilities related to Research Manitoba from the Department of Advanced Education and Training to the Department of Innovation and New Technology. As a result, certain budgeted amounts have been reclassified to be presented on the same basis as the current year. This reclassification has no impact on total budgeted revenue, total budgeted expenses, or the operating surplus/(deficit).
116 PROVINCE OF MANITOBA ANNUAL REPORT AND PUBLIC ACCOUNTS 2026
SUMMARY FINANCIAL STATEMENTS
SCHEDULE 1 - CONSOLIDATED STATEMENT OF AMOUNTS RECEIVABLE
As at March 31, 2026
| ($ millions) | ||||||||
| |
2026 Actual |
|
|
2025 Actual |
| |||
| TAXATION: Income taxes |
377 | 149 | ||||||
| Retail sales tax |
353 | 316 | ||||||
| Other taxes |
204 | 191 | ||||||
|
|
|
|
|
|
| |||
| 934 | 656 | |||||||
|
|
|
|
|
|
| |||
| GOVERNMENT OF CANADA AND OTHER GOVERNMENTS: |
||||||||
| Government of Canada shared cost programs/agreements |
630 | 590 | ||||||
| Other |
451 | 385 | ||||||
|
|
|
|
|
|
| |||
| 1,081 | 975 | |||||||
|
|
|
|
|
|
| |||
| OTHER: |
||||||||
| Health and social services |
490 | 421 | ||||||
| Government business enterprises and other |
65 | 62 | ||||||
| Sundry departmental revenue |
253 | 252 | ||||||
| Other |
335 | 332 | ||||||
| Tobacco settlement |
553 | 846 | ||||||
|
|
|
|
|
|
| |||
| 1,696 | 1,913 | |||||||
|
|
|
|
|
|
| |||
| 3,711 | 3,544 | |||||||
| Less: Allowances (Note a) |
878 | 834 | ||||||
|
|
|
|
|
|
| |||
| Total Amounts Receivable |
2,833 | 2,710 | ||||||
|
|
|
|
|
|
| |||
Note a: The allowances includes $396 million established for tobacco settlement.
See Note 20 for more details.
SUMMARY FINANCIAL STATEMENTS 117
SUMMARY FINANCIAL STATEMENTS
SCHEDULE 2 - CONSOLIDATED STATEMENT OF LOANS AND ADVANCES
As at March 31, 2026
| ($ millions) | ||||||||
| |
2026 Actual |
|
|
2025 Actual |
| |||
| GOVERNMENT BUSINESS ENTERPRISES: |
||||||||
| Manitoba Hydro-Electric Board (Note a) |
26,039 | 24,831 | ||||||
| Manitoba Liquor and Lotteries Corporation (Note b) |
304 | 293 | ||||||
|
|
|
|
|
|
| |||
| 26,343 | 25,124 | |||||||
| Less: Debt incurred for and repayable by the Manitoba Hydro-Electric Board |
26,039 | 24,831 | ||||||
|
|
|
|
|
|
| |||
| 304 | 293 | |||||||
|
|
|
|
|
|
| |||
| OTHER: |
||||||||
| Loans and mortgages (Note c) |
959 | 958 | ||||||
| Stadium loan (Note d) |
137 | 137 | ||||||
| Manitoba student loans (Note e) |
475 | 409 | ||||||
| Family services agencies (Note f) |
24 | 24 | ||||||
| University of Manitoba Properties (Note g) |
45 | 41 | ||||||
| Other |
34 | 32 | ||||||
|
|
|
|
|
|
| |||
| 1,674 | 1,601 | |||||||
|
|
|
|
|
|
| |||
| TOTAL LOANS AND ADVANCES |
1,978 | 1,894 | ||||||
| Less: Valuation allowance |
263 | 256 | ||||||
|
|
|
|
|
|
| |||
| NET LOANS AND ADVANCES |
1,715 | 1,638 | ||||||
|
|
|
|
|
|
| |||
The government business enterprises loans and advances portfolio is due in
varying annual amounts to the year 2120, bearing interest at either:
| i) | Fixed with rates ranging from 1.25% to 11.32%; or |
|||||||||
| ii) | Floating Canadian - Canadian Overnight Repo Rate Average (CORRA) or Canada Prime Rate setting, established daily, or in response to adjustments in the Bank of Canada overnight rate, with the lowest rate currently set at 2.55% and the highest set at 3.70% as at March 31, 2026. |
| ||||||||
| Note a: | Loan receivable from Manitoba Hydro is $26,111 million net of $72 other adjustment related to carrying value of dual currency bonds, transaction costs and debt discounts and premiums. |
| ||||||||
| Note b: | Loan receivable from Manitoba Liquor and Lotteries Corporation is $304 million, consisting of a $265 million term loan, bearing interest ranging from 1.75% to 5.10%, repayable in monthly principal instalments with maturities ranging from March 31, 2027 to December 31, 2064; a $34 million demand loan bearing interest at Royal Bank Prime Rate less 0.75%; and a $5 million legacy loan balance payable to the province. |
| ||||||||
| Note c: | ||||||||||
| i) | Agricultural direct lending and special assistance program mortgages, due in varying annual amounts to August 1, 2051, bearing interest at rates ranging from 2.375% to 7.875%. Loans receivable are secured by tangible assets consisting predominantly of land, followed by buildings, livestock and other types of assets. The estimated value of such of tangibles securities as of the most recent valuation date is $1.5 billion (2025 - $1.4 billion). |
827 | 828 | |||||||
| ii) | Loans and mortgages receivable bear interest at various rates between 0% and 12.50% (2025 - 0% and 12.50%) with maturities at various dates to 2053. The loans and mortgages receivable for Federal/Provincial Housing Programs, Market Rental Programs, Community Residences and Affordable Rental Housing are secured by a mortgage on the underlying property. |
31 | 36 | |||||||
| iii) | Business development assistance loans, due in varying annual amounts to the year 2040, bearing interest at rates ranging from 0.0% to 5.9%. When possible, the Corporation obtains various forms of security on The Manitoba Industrial Opportunities Program loans with priority ranking subject to any prior existing charges. |
73 | 72 | |||||||
| iv) | Business Loan Program - Interest rates applied range from 5.69% to 7.15% (2025 - 4.50% to 8.15%). Fisheries Loans Program - Interest rates applied to all fisheries loans are 7.7% (2025 - 8.7%). |
28 | 22 | |||||||
|
|
|
|||||||||
| 959 | 958 | |||||||||
|
|
|
|||||||||
| Note d: | Stadium loan to Triple B Stadium Inc., bearing interest at 4.65%; and issued in two phases, with Phase 1 due in varying annual amounts to 2038. Phase 2 is in abeyance indefinitely and no payments are required. |
| Note e: | Student loans, interest-free and not repayable until 6 months past the completion of studies, due 114 to 174 months after that time. |
| Note f: | Advances to provide family services agencies with prepayment of fee for service charges, to be repaid when no longer required, bearing no interest. |
| Note g: | University of Manitoba has a loan agreement with UM Properties related to the development of the Southwood lands. The loan is for $33 million with an accrued interest of $12 million at March 31, 2026, totalling $45M and represents prepaid rent under a 140-year Master Head Lease of the Southwood lands to UM Properties. The loan receivable is due in full and payable on the last day of the Completion Period. The loan receivable is secured by a secured promissory note and a debenture for the 140-year leasehold interest of UM Properties in the Southwood lands, improvements comprising the Southwood lands, and to be the second registered security position, subject to any priority and postponement agreement entered into by the University and a third-party lender secured by UM Properties. |
118 PROVINCE OF MANITOBA ANNUAL REPORT AND PUBLIC ACCOUNTS 2026
SUMMARY FINANCIAL STATEMENTS
SCHEDULE 3 - GOVERNMENT BUSINESS ENTERPRISES, SCHEDULE OF CONSOLIDATED OPERATING RESULTS AND FINANCIAL POSITION
For the Year Ended March 31, 2026
| ($ millions) | TOTAL | TOTAL | ||||||||||||||||||
| UTILITY | INSURANCE | FINANCE | 2026 | 2025 | ||||||||||||||||
| CHANGES IN EQUITY | Actual | Restated | ||||||||||||||||||
| Results from Operations: |
||||||||||||||||||||
| Revenue from operations |
3,066 | 1,977 | 1,804 | 6,847 | 7,244 | |||||||||||||||
|
|
|
|
|
|
|
|
|
|
|
|
|
|
|
| ||||||
| Expenses from operations |
2,441 | 1,878 | 1,067 | 5,386 | 5,465 | |||||||||||||||
| Debt servicing |
1,071 | - | 13 | 1,084 | 1,092 | |||||||||||||||
|
|
|
|
|
|
|
|
|
|
|
|
|
|
|
| ||||||
| Total expenses |
3,512 | 1,878 | 1,080 | 6,470 | 6,557 | |||||||||||||||
|
|
|
|
|
|
|
|
|
|
|
|
|
|
|
| ||||||
| Net income (loss) |
(446 | ) | 99 | 724 | 377 | 687 | ||||||||||||||
| Other comprehensive income (loss) |
179 | 36 | - | 215 | (46 | ) | ||||||||||||||
|
|
|
|
|
|
|
|
|
|
|
|
|
|
|
| ||||||
| Total comprehensive income (loss) |
(267 | ) | 135 | 724 | 592 | 641 | ||||||||||||||
| Transfers to the Government |
- | - | (724 | ) | (724 | ) | (730 | ) | ||||||||||||
|
|
|
|
|
|
|
|
|
|
|
|
|
|
|
| ||||||
| Net increase (decrease) in equity in government business enterprises |
(267 | ) | 135 | - | (132 | ) | (89 | ) | ||||||||||||
|
|
|
|
|
|
|
|
|
|
|
|
|
|
|
| ||||||
| FINANCIAL POSITION |
||||||||||||||||||||
| Assets: |
| |||||||||||||||||||
| Cash and cash equivalents |
1,569 | 222 | 43 | 1,834 | 1,315 | |||||||||||||||
| Amounts receivable |
577 | 171 | 57 | 805 | 810 | |||||||||||||||
| Portfolio investments: Due from Government and government organizations |
76 | 363 | - | 439 | 491 | |||||||||||||||
| Due from others |
198 | 3,892 | - | 4,090 | 3,930 | |||||||||||||||
| Capital assets |
27,168 | 177 | 373 | 27,718 | 27,397 | |||||||||||||||
| Other assets |
3,489 | 99 | 139 | 3,727 | 3,602 | |||||||||||||||
|
|
|
|
|
|
|
|
|
|
|
|
|
|
|
| ||||||
| Total assets |
33,077 | 4,924 | 612 | 38,613 | 37,545 | |||||||||||||||
|
|
|
|
|
|
|
|
|
|
|
|
|
|
|
| ||||||
| Liabilities: |
| |||||||||||||||||||
| Accounts payable, accrued liabilities and deferred revenue |
3,621 | 209 | 243 | 4,073 | 3,937 | |||||||||||||||
| Long-term debt: Owing to Government |
26,111 | - | 304 | 26,415 | 25,188 | |||||||||||||||
| Other borrowings, discounts and deferred transaction costs |
36 | 7 | 60 | 103 | 123 | |||||||||||||||
| Net pension obligations |
418 | 428 | - | 846 | 957 | |||||||||||||||
| Future cost of existing claims |
- | 2,876 | - | 2,876 | 2,906 | |||||||||||||||
|
|
|
|
|
|
|
|
|
|
|
|
|
|
|
| ||||||
| Total liabilities |
30,186 | 3,520 | 607 | 34,313 | 33,111 | |||||||||||||||
|
|
|
|
|
|
|
|
|
|
|
|
|
|
|
| ||||||
| Equity: |
| |||||||||||||||||||
| Non-controlling interests |
41 | - | - | 41 | 43 | |||||||||||||||
| Equity in government business enterprises |
2,850 | 1,404 | 5 | 4,259 | 4,391 | |||||||||||||||
|
|
|
|
|
|
|
|
|
|
|
|
|
|
|
| ||||||
| Total equity |
2,891 | 1,404 | 5 | 4,300 | 4,434 | |||||||||||||||
|
|
|
|
|
|
|
|
|
|
|
|
|
|
|
| ||||||
| Total liabilities and equity |
33,077 | 4,924 | 612 | 38,613 | 37,545 | |||||||||||||||
|
|
|
|
|
|
|
|
|
|
|
|
|
|
|
| ||||||
| EQUITY COMPRISED OF: |
| |||||||||||||||||||
| Retained earnings |
2,969 | 1,340 | 5 | 4,314 | 4,658 | |||||||||||||||
| Transfer of revaluation reserve |
- | 3 | - | 3 | 3 | |||||||||||||||
|
|
|
|
|
|
|
|
|
|
|
|
|
|
|
| ||||||
| Retained earnings, restated |
2,969 | 1,343 | 5 | 4,317 | 4,661 | |||||||||||||||
|
|
|
|
|
|
|
|
|
|
|
|
|
|
|
| ||||||
| Accumulated other comprehensive income (loss) |
(119 | ) | 64 | - | (55 | ) | (267 | ) | ||||||||||||
| Transfer of revaluation reserve |
- | (3 | ) | - | (3 | ) | (3 | ) | ||||||||||||
|
|
|
|
|
|
|
|
|
|
|
|
|
|
|
| ||||||
| Accumulated other comprehensive income (loss), restated |
(119 | ) | 61 | - | (58 | ) | (270 | ) | ||||||||||||
|
|
|
|
|
|
|
|
|
|
|
|
|
|
|
| ||||||
| Equity in government business enterprises |
2,850 | 1,404 | 5 | 4,259 | 4,391 | |||||||||||||||
|
|
|
|
|
|
|
|
|
|
|
|
|
|
|
| ||||||
SUMMARY FINANCIAL STATEMENTS 119
SUMMARY FINANCIAL STATEMENTS
SCHEDULE 3 - GOVERNMENT BUSINESS ENTERPRISES, SCHEDULE OF CONSOLIDATED OPERATING RESULTS AND FINANCIAL POSITION
(CONTINUED)
For the Year Ended March 31, 2026
Note: For government business enterprises whose fiscal year end is prior to March 31, the amounts reflected are as at their fiscal year end.
Manitoba Hydro Non-Controlling Interests
Manitoba Hydro has entered into the WPLP with Taskinigahp Power Corporation (TPC) to carry on the business of developing, owning and operating the Wuskwatim Generating Station. TPC is owned beneficially by Nisichawayasihk Cree Nation (NCN). The generating station and associated transmission assets were placed into service during the 2012-13 year.
The 33% ownership interest of TPC in the WPLP of $41 million (2025 - $43 million) is represented as a non-controlling interest within the equity section of the consolidated statement of financial position of Manitoba Hydro. TPC’s portion of the net loss of the WPLP during 2025–26 is $2 million (2025 - $3 million).
As at March 31, 2026, Manitoba Hydro has provided advances to TPC of $88 million (2025 - $88 million). In addition, Manitoba Hydro provides advances on future WPLP distributions to NCN. As at March 31, 2026, Manitoba Hydro has provided advances to NCN of $8 million (2025 - $8 million). The advances plus interest are repayable by TPC through its share of distributions from the WPLP. In exchange for forgiveness of the advances and interest, TPC has the option to put all their units back to Manitoba Hydro at any time up to June 29, 2062. The value of the put option at March 31, 2026 is $226 million.
120 PROVINCE OF MANITOBA ANNUAL REPORT AND PUBLIC ACCOUNTS 2026
SUMMARY FINANCIAL STATEMENTS
SCHEDULE 4 - CONSOLIDATED STATEMENT OF PUBLIC DEBT
As at March 31, 2026
| ($ millions) | ||||||||||||||||||||||||||||
| Canada | Promissory Notes | |||||||||||||||||||||||||||
| Pension | Loans | and | ||||||||||||||||||||||||||
| Bonds and Debentures | Plan | Payable | Treasury Bills | Totals | ||||||||||||||||||||||||
| 2026 | 2025 | |||||||||||||||||||||||||||
| Fiscal Year of Maturity | CAD | US | CAD | CAD | CAD | Actual | Restated | |||||||||||||||||||||
| 2026 |
- | - | - | - | - | - | 6,611 | |||||||||||||||||||||
| 2027 |
2,662 | 342 | - | - | 2,900 | 5,904 | 3,015 | |||||||||||||||||||||
| 2028 |
1,799 | - | - | - | - | 1,799 | 1,799 | |||||||||||||||||||||
| 2029 |
3,564 | 558 | - | - | - | 4,122 | 4,139 | |||||||||||||||||||||
| 2030 |
2,529 | - | - | - | - | 2,529 | 2,529 | |||||||||||||||||||||
| 2031 |
2,708 | - | - | - | - | 2,708 | 2,708 | |||||||||||||||||||||
|
|
|
|
|
|
|
|
|
|
|
|
|
|
|
|
|
|
|
|
|
| ||||||||
| 2026-2031 |
13,262 | 900 | - | - | 2,900 | 17,062 | 20,801 | |||||||||||||||||||||
|
|
|
|
|
|
|
|
|
|
|
|
|
|
|
|
|
|
|
|
|
| ||||||||
| 2032-2036 |
15,961 | - | - | - | - | 15,961 | 12,332 | |||||||||||||||||||||
| 2037-2046 |
10,811 | - | 477 | - | - | 11,288 | 10,885 | |||||||||||||||||||||
| 2047-2076 |
20,281 | - | - | - | - | 20,281 | 18,680 | |||||||||||||||||||||
| 2077-2125 |
650 | - | - | - | - | 650 | 650 | |||||||||||||||||||||
| 2032-2125 |
47,703 | - | 477 | - | - | 48,180 | 42,547 | |||||||||||||||||||||
| Government organizations |
238 | - | - | 160 | - | 398 | 442 | |||||||||||||||||||||
|
|
|
|
|
|
|
|
|
|
|
|
|
|
|
|
|
|
|
|
|
| ||||||||
| Total borrowings |
61,203 | 900 | 477 | 160 | 2,900 | 65,640 | 63,790 | |||||||||||||||||||||
|
|
|
|
|
|
|
|
|
|
|
|
|
|
|
|
|
|
|
|
|
| ||||||||
| Reduced by: |
||||||||||||||||||||||||||||
| Unamortized debt discounts and debt issue costs |
(543 | ) | (543 | ) | ||||||||||||||||||||||||
| Unamortized debt discounts and debt issue costs (Manitoba Hydro) |
(72 | ) | (52 | ) | ||||||||||||||||||||||||
| Unamortized debt premiums |
263 | 280 | ||||||||||||||||||||||||||
| Province of Manitoba debt issues held as investments in sinking funds and in cash and cash equivalents |
(465 | ) | (804 | ) | ||||||||||||||||||||||||
| Unrealized remeasurement foreign exchange (gains) losses |
850 | 618 | ||||||||||||||||||||||||||
|
|
|
|
|
|
| |||||||||||||||||||||||
| 65,673 | 63,289 | |||||||||||||||||||||||||||
|
|
|
|
|
|
| |||||||||||||||||||||||
| Public debt is comprised of: |
||||||||||||||||||||||||||||
| Taxpayer-supported debt |
39,489 | 38,364 | ||||||||||||||||||||||||||
| Borrowings on behalf of Manitoba Hydro-Electric Board |
26,184 | 24,925 | ||||||||||||||||||||||||||
|
|
|
|
|
|
| |||||||||||||||||||||||
| 65,673 | 63,289 | |||||||||||||||||||||||||||
|
|
|
|
|
|
| |||||||||||||||||||||||
SUMMARY FINANCIAL STATEMENTS 121
SUMMARY FINANCIAL STATEMENTS
SCHEDULE 4 - CONSOLIDATED STATEMENT OF PUBLIC DEBT (CONTINUED)
As at March 31, 2026
| ($ millions) | ||||||||
| March 31, 2026 | March 31, 2025 | |||||||
| CAD$ Valuation | CAD$ Valuation | |||||||
| (Note a) | (Note a) | |||||||
| Total borrowings payable in: |
||||||||
| Canadian dollars |
51,361 | 50,333 | ||||||
| Foreign issues hedged to Canadian dollars |
13,412 | 11,482 | ||||||
| U.S. dollars |
558 | 575 | ||||||
| Issues hedged to U.S. dollars |
342 | 899 | ||||||
|
|
|
|
|
|||||
| Total borrowings |
65,673 | 63,289 | ||||||
|
|
|
|
|
|||||
Note a: The hedges are derivative contracts which include swaps and forward foreign exchange contracts.
Note b: The Canadian dollar valuation is calculated using the foreign currency exchange rates in effect at each March 31 adjusted for any forward foreign exchange contracts entered into for settlement after year-end.
Note c: Interest rates on these borrowings fall into one of two categories:
| i) | Fixed with rates ranging from 1.81% to 10.68%. |
ii) Floating Canadian - Canadian Overnight Repo Rate Average (CORRA) setting, established daily, with the lowest rate currently set at 2.38% and the highest set at 4.03% as at March 31, 2026.
Total public debt servicing includes foreign currency denominated debt that is fully hedged by converting the foreign currency payments into Canadian dollars. These currency hedges are used to mitigate the impact of future exchange rate fluctuations on the Province’s borrowing costs. These hedging instruments are reported as derivative financial instruments in Note 12 - Risk Management. The currency translation on the hedged debt resulted in an accumulated foreign exchange loss of $850 million as at March 31, 2026.
Total public debt also includes USD denominated debt that has not been hedged to Canadian dollars. The currency translation on the un-hedged USD debt resulted in an unrealized foreign exchange loss of $89 million as at March 31, 2026.
The currency translation on the hedged and unhedged debt resulted in a cumulative unrealized loss of $939 million as at March 31, 2026.
122 PROVINCE OF MANITOBA ANNUAL REPORT AND PUBLIC ACCOUNTS 2026
SUMMARY FINANCIAL STATEMENTS
SCHEDULE 5 - CONSOLIDATED STATEMENT OF ACCOUNTS PAYABLE, ACCRUED CHARGES, PROVISIONS AND UNEARNED REVENUE
As at March 31, 2026
| ($ millions) | ||||||||
| 2026 | 2025 | |||||||
| Actual | Restated | |||||||
| ACCOUNTS PAYABLE |
2,401 | 2,520 | ||||||
|
|
|
|
|
|||||
| ACCRUED CHARGES: |
||||||||
| Interest |
257 | 258 | ||||||
| Disaster financial assistance |
60 | 88 | ||||||
| Liability for contaminated sites (Note 17) |
443 | 363 | ||||||
| Salaries and benefits |
1,334 | 1,236 | ||||||
| Employee future benefits (Note 15) |
803 | 738 | ||||||
| Tobacco settlement legal fees |
4 | 29 | ||||||
| Obligations under Public Private Partnership arrangements (Note 21) |
85 | - | ||||||
| Other |
1,841 | 1,731 | ||||||
|
|
|
|
|
|||||
| 4,827 | 4,443 | |||||||
|
|
|
|
|
|||||
| PROVISION FOR FUTURE LOSSES (Note 8) |
6 | 5 | ||||||
|
|
|
|
|
|||||
| UNEARNED REVENUE |
||||||||
| University of Manitoba and Other Universities (Note a) |
889 | 682 | ||||||
| Manitoba Agricultural Services Corporation (Note b) |
1,038 | 814 | ||||||
| Personal income tax |
- | 451 | ||||||
| Other |
468 | 403 | ||||||
|
|
|
|
|
|||||
| 2,395 | 2,350 | |||||||
|
|
|
|
|
|||||
| Total Accounts Payable, Accrued Charges, Provisions and Unearned Revenue |
9,629 | 9,318 | ||||||
|
|
|
|
|
|||||
| Note a: | Represents various types of operating and capital revenue, including future session tuition fees, revenue associated with goods that have not yet been provided or services that have not yet been substantially rendered, unspent externally restricted grants, non-endowed donations, investment income, and deferred rental fees associated with the lease of the Southwood lands to UM Properties Inc. | |
| Note b: | Represents restricted assets and revenues for recognition of AgriInsurance premiums. The revenue for the AgriInsurance program will be recognized when the restricted assets are used for the specified purpose under the Canadian Agricultural Partnership agreement and the AgriInsurance Regulation. | |
SUMMARY FINANCIAL STATEMENTS 123
SUMMARY FINANCIAL STATEMENTS
SCHEDULE 6 - CONSOLIDATED STATEMENT OF PENSION LIABILITY
As at March 31, 2026
| ($ millions) | ||||||||||||||||||||||||||||
| Civil
Service
Superannuation
Plan |
Teachers’
Pension
Plan |
Post-
Secondary
Education
Plans |
Public
School
Division
Plans |
Other
Plans |
Total
2026 |
Total
2025 |
||||||||||||||||||||||
| (Note a) | (Note a) | (Note a) | ||||||||||||||||||||||||||
| ACCRUED BENEFIT OBLIGATION |
||||||||||||||||||||||||||||
| Obligation at beginning of year |
3,557 | 5,129 | 1,881 | 721 | 175 | 11,463 | 11,076 | |||||||||||||||||||||
| Current service costs |
87 | 138 | 91 | 27 | 6 | 349 | 335 | |||||||||||||||||||||
| Interest cost on benefit obligation |
210 | 304 | 102 | 36 | 9 | 661 | 638 | |||||||||||||||||||||
| Change in actuarial (gains) losses and reserves |
98 | - | 40 | 4 | (6 | ) | 136 | 38 | ||||||||||||||||||||
| Plan amendment |
- | - | - | - | 2 | 2 | 6 | |||||||||||||||||||||
| Benefits paid |
(209 | ) | (278 | ) | (136 | ) | (38 | ) | (9 | ) | (670 | ) | (630 | ) | ||||||||||||||
|
|
|
|
|
|
|
|
|
|
|
|
|
|
|
|||||||||||||||
| Obligation at end of year |
3,743 | 5,293 | 1,978 | 750 | 177 | 11,941 | 11,463 | |||||||||||||||||||||
|
|
|
|
|
|
|
|
|
|
|
|
|
|
|
|||||||||||||||
| PLAN ASSETS |
||||||||||||||||||||||||||||
| Plan assets at beginning of year |
2,768 | 3,383 | 1,971 | 813 | 66 | 9,001 | 8,215 | |||||||||||||||||||||
| Employer contributions |
115 | 148 | 48 | 16 | 7 | 334 | 324 | |||||||||||||||||||||
| Employee contributions |
- | - | 41 | 14 | 1 | 56 | 50 | |||||||||||||||||||||
| Transfer of plan assets |
- | - | 1 | - | - | 1 | - | |||||||||||||||||||||
| Plan asset contributions |
- | - | - | - | - | - | - | |||||||||||||||||||||
| Benefits paid |
(209 | ) | (278 | ) | (136 | ) | (38 | ) | (9 | ) | (670 | ) | (630 | ) | ||||||||||||||
| Expected return on plan assets |
154 | 183 | 117 | 43 | 3 | 500 | 469 | |||||||||||||||||||||
| Experience gains (losses) |
150 | 143 | 104 | 26 | 7 | 430 | 573 | |||||||||||||||||||||
|
|
|
|
|
|
|
|
|
|
|
|
|
|
|
|||||||||||||||
| Market value of plan assets |
2,978 | 3,579 | 2,146 | 874 | 75 | 9,652 | 9,001 | |||||||||||||||||||||
| Deferred investment losses (gains) |
(238 | ) | (286 | ) | (155 | ) | (51 | ) | (5 | ) | (735 | ) | (539 | ) | ||||||||||||||
|
|
|
|
|
|
|
|
|
|
|
|
|
|
|
|||||||||||||||
| Market related value of plan assets |
2,740 | 3,293 | 1,991 | 823 | 70 | 8,917 | 8,462 | |||||||||||||||||||||
|
|
|
|
|
|
|
|
|
|
|
|
|
|
|
|||||||||||||||
| PENSION LIABILITY |
||||||||||||||||||||||||||||
| Plan deficit (surplus) |
1,003 | 2,000 | (13 | ) | (73 | ) | 107 | 3,024 | 3,001 | |||||||||||||||||||
| Unamortized actuarial gains (losses) |
170 | 448 | (2 | ) | 41 | 3 | 660 | 643 | ||||||||||||||||||||
| Surplus adjustments (Note b) |
- | - | 152 | 96 | - | 248 | 101 | |||||||||||||||||||||
|
|
|
|
|
|
|
|
|
|
|
|
|
|
|
|||||||||||||||
| Pension liability |
1,173 | 2,448 | 137 | 64 | 110 | 3,932 | 3,745 | |||||||||||||||||||||
|
|
|
|
|
|
|
|
|
|
|
|
|
|
|
|||||||||||||||
| PENSION EXPENSE |
||||||||||||||||||||||||||||
| Defined benefit pension plan expense: |
||||||||||||||||||||||||||||
| Current service cost |
87 | 138 | 91 | 27 | 6 | 349 | 335 | |||||||||||||||||||||
| Interest cost on benefit obligation |
210 | 304 | 102 | 36 | 9 | 661 | 638 | |||||||||||||||||||||
| Return on plan assets |
(154 | ) | (183 | ) | (117 | ) | (43 | ) | (3 | ) | (500 | ) | (469 | ) | ||||||||||||||
| Employee contributions |
- | - | (42 | ) | (14 | ) | (1 | ) | (57 | ) | (50 | ) | ||||||||||||||||
| Amortization of actuarial (gains) losses |
(20 | ) | (42 | ) | (20 | ) | - | - | (82 | ) | (46 | ) | ||||||||||||||||
| Plan amendment |
- | - | - | - | 2 | 2 | 6 | |||||||||||||||||||||
| Change in surplus adjustments |
- | - | 126 | 21 | - | 147 | 59 | |||||||||||||||||||||
|
|
|
|
|
|
|
|
|
|
|
|
|
|
|
|||||||||||||||
| Defined benefit pension plan expense |
123 | 217 | 140 | 27 | 13 | 520 | 473 | |||||||||||||||||||||
|
|
|
|
|
|
|
|
|
|
|
|
|
|
|
|||||||||||||||
| Defined contribution pension plan expense |
- | - | 8 | 38 | 271 | 317 | 281 | |||||||||||||||||||||
|
|
|
|
|
|
|
|
|
|
|
|
|
|
|
|||||||||||||||
124 PROVINCE OF MANITOBA ANNUAL REPORT AND PUBLIC ACCOUNTS 2026
SUMMARY FINANCIAL STATEMENTS
SCHEDULE 6 - CONSOLIDATED STATEMENT OF PENSION LIABILITY (CONTINUED)
As at March 31, 2026
| Civil Service Superannuation |
Teachers’ Pension Plan |
Post- Secondary Education Plans |
Public School Division Plans |
Other Plans |
Total 2026 |
Total 2025 |
||||||||||||||||||||||
| MEMBER DATA |
||||||||||||||||||||||||||||
| Defined benefit pension plan |
||||||||||||||||||||||||||||
| Number of active and deferred members |
20,500 | 24,600 | 6,000 | 5,800 | 200 | 57,100 | 55,400 | |||||||||||||||||||||
| Number of pensioners |
18,500 | 17,200 | 3,000 | 2,600 | 300 | 41,600 | 41,000 | |||||||||||||||||||||
|
|
|
|
|
|
|
|
|
|
|
|
|
|
|
|||||||||||||||
| Total number of plan members |
39,000 | 41,800 | 9,000 | 8,400 | 500 | 98,700 | 96,400 | |||||||||||||||||||||
|
|
|
|
|
|
|
|
|
|
|
|
|
|
|
|||||||||||||||
| ACTUARIAL ASSUMPTIONS |
||||||||||||||||||||||||||||
| Discount rate on accrued benefits |
5.50% | 6.00% | 5.45% - 5.70% | 4.50% - 5.50% | 4.00% - 5.50% | |||||||||||||||||||||||
| Expected long-term rate of return |
6.00% | 6.00% | 5.45% - 6.45% | 4.50% - 5.50% | 3.50% - 5.50% | |||||||||||||||||||||||
| Inflation |
2.00% | 2.00% | 2.00% - 2.50% | 2.00% - 2.00% | 0.00% - 2.00% | |||||||||||||||||||||||
| Real rate of return |
4.00% | 4.00% | 3.00% - 3.70% | 2.50% - 3.50% | 2.00% - 4.70% | |||||||||||||||||||||||
| Rate of salary increase |
3.75% | 3.00% | 2.75% - 3.00% | 2.50% - 3.50% | 0.00% - 3.50% | |||||||||||||||||||||||
| Latest valuation |
(Note c) | (Note c) | (Note c) | (Note c) | (Note c) | |||||||||||||||||||||||
|
|
Note a: |
Post-Secondary Education plans include the University of Manitoba Pension Plans, the University of Winnipeg Pension Plan and the Brandon University Retirement Plan. | ||
|
|
|
Public School Division plans include the Winnipeg School Division Pension Fund for Employees Other Than Teachers, Retirement Plan for Non- Teaching Employees of the St. James-Assiniboia School Division, Retirement Plan for Employees of Frontier School Division and The School District of Mystery Lake No. 2355 Pension Plan. | ||
|
|
|
Other plans include the Members of Legislative Assembly Pension Plan, the Legislative Assembly Pension Plan, the Judges’ Supplemental Pension Plan, and the Winnipeg Child and Family Services Employee Benefits Retirement Plan. | ||
|
|
Note b: |
For those plans that the Government is unable to access surplus funds within the plan, adjustments are made to record an allowance against these surplus amounts. These pension surplus allowances represent the excess of the adjusted benefit asset over the employers” share of the expected future benefit. | ||
| Note C: |
The latest actuarial valuation report dates and the estimated average remaining service life (EARSL), in years, are as follows: |
| Valuation Date | EARSL | |||||||||
| - Civil Service Superannuation Plan |
Dec-24 | 8.4 | ||||||||
| - Teachers’ Retirement Allowance Plan |
Jan-24 | 12.9 | ||||||||
| - University of Manitoba Pension Plans |
Dec-24 | 10.0 | ||||||||
| - University of Winnipeg Pension Plan |
Dec-24 | 4.3 | ||||||||
| - Brandon University Retirement Plan |
Dec-24 | 10.0 | ||||||||
| - Winnipeg School Division Pension Fund for Employees |
Dec-24 | 11.3 | ||||||||
| - Retirement Plan for Non-Teaching Employees of the |
Dec-24 | 16.0 | ||||||||
| - Retirement Plan for Employees of Frontier School Division |
Dec-24 | 13.1 | ||||||||
| - School District of Mystery Lake |
Jun-24 | 15.6 | ||||||||
| - Members of Legislative Assembly Pension Plan |
Mar-25 | 0.0 | ||||||||
| - Legislative Assembly Pension Plan |
Dec-24 | 11.8 | ||||||||
| - Judges’ Supplemental Pension Plan |
Mar-25 | 6.4 | ||||||||
| - Winnipeg Child and Family Services |
Dec-24 | 0.0 | ||||||||
SUMMARY FINANCIAL STATEMENTS 125
SUMMARY FINANCIAL STATEMENTS
SCHEDULE 7 - CONSOLIDATED STATEMENT OF TANGIBLE CAPITAL ASSETS
As at March 31, 2026
| General Capital Assets | ($ millions)
|
Infrastructure | Total | |||||||||||||||||||||||||||||||||||||||||||||
|
Land |
Buildings and |
Vehicles and Equipment |
Computer Hardware and Software |
Assets Under Construction (Note a) |
Land and Land Improvements |
Transportation | Dams and Water Management Structures |
Assets Under |
2026 Actual |
2025 Actual |
||||||||||||||||||||||||||||||||||||||
| and b) | ||||||||||||||||||||||||||||||||||||||||||||||||
| Cost |
||||||||||||||||||||||||||||||||||||||||||||||||
| Opening cost |
377 | 13,199 | 3,315 | 1,487 | 2.383 | 880 | 9,173 | 853 | 139 | 31,806 | 29,966 | |||||||||||||||||||||||||||||||||||||
| Opening reclassifications |
- | 192 | (65 | ) | (108 | ) | 2 | 6 | - | (16 | ) | 5 | 16 | 3 | ||||||||||||||||||||||||||||||||||
|
|
|
|
|
|
|
|
|
|
|
|
|
|
|
|
|
|
|
|
|
|
|
|||||||||||||||||||||||||||
| Adjusted opening balance |
377 | 13,391 | 3,250 | 1,379 | 2,385 | 886 | 9,173 | 837 | 144 | 31,822 | 29,969 | |||||||||||||||||||||||||||||||||||||
|
|
|
|
|
|
|
|
|
|
|
|
|
|
|
|
|
|
|
|
|
|
|
|||||||||||||||||||||||||||
| Add: |
||||||||||||||||||||||||||||||||||||||||||||||||
| Additions during the year |
18 | 568 | 176 | 16 | 433 | 74 | 370 | 3 | 460 | 2,118 | 1,961 | |||||||||||||||||||||||||||||||||||||
| Less: |
||||||||||||||||||||||||||||||||||||||||||||||||
| Disposals and write downs |
- | (3 | ) | (36 | ) | (28 | ) | - | (5 | ) | (77 | ) | (2 | ) | - | (151 | ) | (124 | ) | |||||||||||||||||||||||||||||
| Settlements and reclassifications |
- | 289 | 38 | 5 | (134 | ) | 2 | 218 | 9 | (427 | ) | - | - | |||||||||||||||||||||||||||||||||||
|
|
|
|
|
|
|
|
|
|
|
|
|
|
|
|
|
|
|
|
|
|
|
|||||||||||||||||||||||||||
| Closing cost |
395 | 14,245 | 3,428 | 1,372 | 2.684 | 957 | 9,684 | 847 | 177 | 33,789 | 31,806 | |||||||||||||||||||||||||||||||||||||
|
|
|
|
|
|
|
|
|
|
|
|
|
|
|
|
|
|
|
|
|
|
|
|||||||||||||||||||||||||||
| Accumulated amortization |
||||||||||||||||||||||||||||||||||||||||||||||||
| Opening accumulated amortization |
- | 6,275 | 2,589 | 1,097 | - | 219 | 4,190 | 230 | - | 14,600 | 13,784 | |||||||||||||||||||||||||||||||||||||
| Opening reclassifications |
- | 111 | (62 | ) | (46 | ) | - | 24 | - | (11 | ) | - | 16 | 8 | ||||||||||||||||||||||||||||||||||
|
|
|
|
|
|
|
|
|
|
|
|
|
|
|
|
|
|
|
|
|
|
|
|||||||||||||||||||||||||||
| Adjusted opening balance |
- | 6,386 | 2,527 | 1,051 | - | 243 | 4,190 | 219 | - | 14,616 | 13,792 | |||||||||||||||||||||||||||||||||||||
|
|
|
|
|
|
|
|
|
|
|
|
|
|
|
|
|
|
|
|
|
|
|
|||||||||||||||||||||||||||
| Add: |
||||||||||||||||||||||||||||||||||||||||||||||||
| Amortization |
- | 366 | 183 | 74 | - | 14 | 295 | 14 | - | 946 | 904 | |||||||||||||||||||||||||||||||||||||
| Less: |
||||||||||||||||||||||||||||||||||||||||||||||||
| Accumulated amortization on disposals and write downs |
- | (2 | ) | (38 | ) | (23 | ) | - | - | (77 | ) | (2 | ) | - | (142 | ) | (96 | ) | ||||||||||||||||||||||||||||||
| Reclassifications |
- | (6 | ) | 6 | - | - | - | - | - | - | - | - | ||||||||||||||||||||||||||||||||||||
|
|
|
|
|
|
|
|
|
|
|
|
|
|
|
|
|
|
|
|
|
|
|
|||||||||||||||||||||||||||
| Closing accumulated amortization |
- | 6,744 | 2,678 | 1,102 | - | 257 | 4.408 | 231 | - | 15,420 | 14,600 | |||||||||||||||||||||||||||||||||||||
|
|
|
|
|
|
|
|
|
|
|
|
|
|
|
|
|
|
|
|
|
|
|
|||||||||||||||||||||||||||
| Net book value of tangible capital assets (Note b) |
395 | 7,501 | 750 | 270 | 2,684 | 700 | 5,276 | 616 | 177 | 18,369 | 17,206 | |||||||||||||||||||||||||||||||||||||
|
|
|
|
|
|
|
|
|
|
|
|
|
|
|
|
|
|
|
|
|
|
|
|||||||||||||||||||||||||||
Note a: During the year the government capitalized $29 million of interest relating to assets under construction (2025 - $29 million).
Note b: Included in Infrastructure Assets Under Construction is approximately $86 million (2025 – nil) relating to the Health Care Centre of Excellence under a Public Private Partnership project.
Note c: The net book value of tangible capital assets of $18,369 million includes $229 million related to asset retirement obligations.
126 PROVINCE OF MANITOBA ANNUAL REPORT AND PUBLIC ACCOUNTS 2026
SUMMARY FINANCIAL STATEMENTS
SCHEDULE 8 - GOVERNMENT ORGANIZATIONS, COMPONENTS AND BUSINESS ENTERPRISES COMPRISING THE GOVERNMENT REPORTING ENTITY
|
HEALTH |
EDUCATION AND ECONOMIC DEVELOPMENT | |
| Health, Seniors and Long-Term Care |
Advanced Education and Training | |
| CancerCare Manitoba |
Assiniboine College | |
| Not-for-Profit Personal Care Homes and Community Health Agencies |
Brandon University | |
| 3885136 Manitoba Association Inc. (operating as Calvary Place |
Manitoba Institute of Trades and Technology | |
| Personal Care Home) |
Red River College Polytechnic | |
| Actionmarguerite (Saint-Boniface) (Saint-Vital) and (St. Joseph) |
The University of Winnipeg | |
| Bethania Mennonite Personal Care Home, Inc. |
Université de Saint-Boniface | |
| Clinique Youville Clinic Inc. |
University College of The North | |
| Donwood Manor Personal Care Home Inc. |
University of Manitoba | |
| Eden Mental Health Centre |
||
| Fred Douglas Personal Care Home |
Education and Early Childhood Learning | |
| Holy Family Home, Inc. |
Public School Divisions | |
| Hope Centre Health Care Inc. |
Beautiful Plains School Division | |
| Klinic, Inc. o/a Klinic Community Health |
Border Land School Division | |
| LHC Personal Care Home Inc. |
Brandon School Division | |
| Luther Home Corporation |
Division scolaire franco-manitobaine | |
| MFL Occupational Health and Safety Centre Inc. |
Evergreen School Division | |
| Main Street Project, Inc. |
Flin Flon School Division | |
| Meadowood Manor (operating as Manitoba Baptist Home |
Fort La Bosse School Division | |
| Frontier School Division | ||
| Menno Home for the Aged Inc. (Personal Care Home Division) |
Garden Valley School Division | |
| Mount Carmel Clinic |
Hanover School Division | |
| Nine Circles Community Health Centre Inc. |
Interlake School Division | |
| Niverville Heritage PCH Inc. |
Kelsey School Division | |
| NorWest Co-op Community Health Centre, Inc. |
Lakeshore School Division | |
| Odd Fellows and Rebekahs Care Homes Inc. Golden Links Lodge |
Lord Selkirk School Division | |
| Park Manor Care Inc. |
Louis Riel School Division | |
| Pembina Place Mennonite Personal Care Home Inc. |
Mountain View School Division | |
| Prairie View Lodge Inc. |
Mystery Lake School District | |
| Rest Haven Nursing Home Inc. |
Park West School Division | |
| Rock Lake Health District |
Pembina Trails School Division | |
| Salem Home Inc. |
Pine Creek School Division | |
| Sexuality Education Resource Centre Manitoba, Inc. |
Portage la Prairie School Division | |
| Southeast Personal Care Home Inc. |
Prairie Rose School Division | |
| Tabor Home Inc. |
Prairie Spirit School Division | |
| The Convalescent Home of Winnipeg |
Red River Valley School Division | |
| The Saul and Claribel Simkin Centre Personal Care Home Inc. |
River East Transcona School Division | |
| Villa Youville Inc. - Nursing |
Rolling River School Division | |
| West Park Manor Personal Care Home Inc. |
Seine River School Division | |
| Women’s Health Clinic Inc. |
Seven Oaks School Division | |
| Regional Health Authorities (including controlled organizations) |
Southwest Horizon School Division | |
| Interlake-Eastern Regional Health Authority |
St James-Assiniboia School Division | |
| Northern Regional Health Authority |
Sunrise School Division | |
| Prairie Mountain Health |
Swan Valley School Division | |
| Southern Health-Santé Sud |
Turtle Mountain School Division | |
| Winnipeg Regional Health Authority |
Turtle River School Division | |
| Rehabilitation Centre for Children, Inc. |
Western School Division | |
| St.Amant Inc. |
School District of Whiteshell | |
| Shared Health |
Winnipeg School Division | |
Housing, Addictions and Homelessness (Note a)
SUMMARY FINANCIAL STATEMENTS 127
SUMMARY FINANCIAL STATEMENTS
SCHEDULE 8 - GOVERNMENT ORGANIZATIONS, COMPONENTS AND BUSINESS ENTERPRISES COMPRISING THE GOVERNMENT REPORTING ENTITY (CONTINUED)
EDUCATION AND ECONOMIC DEVELOPMENT (continued)
Business, Mining, Trade and Job Creation (Note b)
Manitoba Development Corporation
Rural Manitoba Economic Development Corporation
Winnipeg Economic Development & Tourism (Note c)
SOCIAL SERVICES
Families
General Child and Family Services Authority
Housing, Addictions and Homelessness (Note a)
The Manitoba Housing and Renewal Corporation
COMMUNITY AND RESOURCE DEVELOPMENT
Agriculture
Manitoba Agricultural Services Corporation
Environment and Climate Change
Efficiency Manitoba Inc.
Manitoba Hazardous Waste Management Corporation
Quarry Rehabilitation Reserve Fund
Transportation and Infrastructure
Municipal and Northern Relations
North Portage Development Corporation (Note d)
The Manitoba Water Services Board
Natural Resources and Indigenous Futures
Communities Economic Development Fund
GENERAL GOVERNMENT
Public Debt
JUSTICE AND OTHER EXPENDITURES
Public Service Commission
Employee Pensions and Other Costs
Executive Council
Legislative Assembly
Tax Credits
Public Service Delivery
Entrepreneurship Manitoba
Materials Distribution Agency
The Public Guardian and Trustee of Manitoba
Innovation and New Technology
Manitoba Education, Research and Learning
Information Networks
Research Manitoba
Finance
Insurance Council of Manitoba
Manitoba Financial Services Agency
Pension Asset Fund
Justice
Legal Aid Manitoba
Liquor, Gaming and Cannabis Authority of Manitoba
Manitoba Law Reform Commission
Labour and Immigration
Sport, Culture, Heritage and Tourism
Centre culturel franco-manitobain
Manitoba Arts Council
Manitoba Centennial Centre Corporation
Manitoba Combative Sports Commission
Manitoba Film & Sound Recording
Development Corporation
Sport Manitoba Inc.
Travel Manitoba
SPECIAL ACCOUNTS, not attached to a Sector or
Department
Rainy Day Fund (Note e)
GOVERNMENT BUSINESS ENTERPRISES: (Schedule 3)
Utility:
Manitoba Hydro-Electric Board (Note f)
Insurance:
Deposit Guarantee Corporation of Manitoba (Note f)
Manitoba Public Insurance Corporation (Note g)
Finance:
Manitoba Liquor and Lotteries Corporation (Note h)
Notes:
a. Funding to the health system from the department is included in Health Sector
b. Abandonment Reserve Fund and Mining Rehabilitation Reserve Fund were dissolved in 2025/26
c. Winnipeg Economic Development & Tourism is a government partnership
d. North Portage Development Corporation is a government business partnership
e. Fiscal Stabilization Account
f. Reports to Minister of Finance
g. Reports to Minister of Justice
h. Reports to Minister of Municipal and Northern Relations
128 PROVINCE OF MANITOBA ANNUAL REPORT AND PUBLIC ACCOUNTS 2026
SUMMARY FINANCIAL STATEMENTS
SCHEDULE 9 - CONSOLIDATED STATEMENT OF OPERATIONS BY SECTOR
For the Year Ended March 31, 2026
| ($ millions) | ||||||||||||||||||||||||||||||||
| Education and | Community and | |||||||||||||||||||||||||||||||
| Health | Economic Development | Social Services | Resource Development | |||||||||||||||||||||||||||||
| 2026 | 2025 | 2026 | 2025 | 2026 | 2025 | 2026 | 2025 | |||||||||||||||||||||||||
| Actual | Restated | Actual | Restated | Actual | Restated | Actual | Restated | |||||||||||||||||||||||||
| REVENUE |
||||||||||||||||||||||||||||||||
| Income taxes |
– | – | – | – | – | – | – | – | ||||||||||||||||||||||||
| Other taxes |
– | – | 1,050 | 854 | – | – | – | – | ||||||||||||||||||||||||
| Fees and other revenue |
882 | 693 | 1,057 | 1,014 | 126 | 102 | 566 | 605 | ||||||||||||||||||||||||
| Federal transfers |
2,262 | 2,100 | 613 | 520 | 121 | 120 | 248 | 303 | ||||||||||||||||||||||||
| Contributions from entities within the government reporting entity |
106 | 105 | 592 | 718 | – | – | – | 3 | ||||||||||||||||||||||||
| Recovery from government business enterprises and other investment earnings |
19 | 14 | 128 | 145 | 6 | 8 | 29 | 39 | ||||||||||||||||||||||||
| Endowment contributions |
– | – | 35 | 27 | – | – | – | – | ||||||||||||||||||||||||
|
|
|
|
|
|
|
|
|
|
|
|
|
|
|
|
|
|||||||||||||||||
| TOTAL REVENUE |
3,269 | 2,912 | 3,475 | 3,278 | 253 | 230 | 843 | 950 | ||||||||||||||||||||||||
|
|
|
|
|
|
|
|
|
|
|
|
|
|
|
|
|
|||||||||||||||||
| EXPENSE |
||||||||||||||||||||||||||||||||
| Personnel services |
5,640 | 5,247 | 4,262 | 3,994 | 231 | 226 | 344 | 315 | ||||||||||||||||||||||||
| Grants/transfer payments |
429 | 355 | 687 | 586 | 319 | 324 | 912 | 787 | ||||||||||||||||||||||||
| Supplies and services |
1,441 | 1,363 | 667 | 659 | 218 | 189 | 265 | 237 | ||||||||||||||||||||||||
| Social assistance related |
– | – | 97 | 118 | 1,605 | 1,520 | 140 | 292 | ||||||||||||||||||||||||
| Other operating (Note c) |
2,445 | 2,322 | 482 | 461 | 346 | 985 | 182 | 217 | ||||||||||||||||||||||||
| Debt servicing |
114 | 89 | 127 | 126 | 31 | 32 | 31 | 31 | ||||||||||||||||||||||||
| Amortization |
216 | 218 | 222 | 207 | 73 | 70 | 340 | 325 | ||||||||||||||||||||||||
|
|
|
|
|
|
|
|
|
|
|
|
|
|
|
|
|
|||||||||||||||||
| TOTAL EXPENSE |
10,285 | 9,594 | 6,544 | 6,151 | 2,823 | 3,346 | 2,214 | 2,204 | ||||||||||||||||||||||||
|
|
|
|
|
|
|
|
|
|
|
|
|
|
|
|
|
|||||||||||||||||
| OPERATING SURPLUS (DEFICIT) |
(7,016 | ) | (6,682 | ) | (3,069 | ) | (2,873 | ) | (2,570 | ) | (3,116 | ) | (1,371 | ) | (1,254 | ) | ||||||||||||||||
|
|
|
|
|
|
|
|
|
|
|
|
|
|
|
|
|
|||||||||||||||||
SUMMARY FINANCIAL STATEMENTS 129
SUMMARY FINANCIAL STATEMENTS
SCHEDULE 9 - CONSOLIDATED STATEMENT OF OPERATIONS BY SECTOR (CONTINUED)
For the Year Ended March 31, 2026
| ($ millions) | ||||||||||||||||||||||||||||||||
| Justice and | General Government | Adjustments | ||||||||||||||||||||||||||||||
| Other Expenditures | (Note a) | (Note b) | Total | |||||||||||||||||||||||||||||
| 2026 | 2025 | 2026 | 2025 | 2026 | 2025 | 2026 | 2025 | |||||||||||||||||||||||||
| Actual | Restated | Actual | Restated | Actual | Restated | Actual | Restated | |||||||||||||||||||||||||
| REVENUE |
||||||||||||||||||||||||||||||||
| Income taxes |
- | - | 6,375 | 5,558 | - | - | 6,375 | 5,558 | ||||||||||||||||||||||||
| Other taxes |
- | - | 4,368 | 4,068 | (24 | ) | (21 | ) | 5,394 | 4,901 | ||||||||||||||||||||||
| Fees and other revenue |
286 | 484 | 5 | 846 | (42 | ) | (116 | ) | 2,880 | 3,628 | ||||||||||||||||||||||
| Federal transfers |
61 | 63 | 5,375 | 4,999 | - | - | 8,680 | 8,105 | ||||||||||||||||||||||||
| Contributions from entities within the government reporting entity |
2 | 10 | 377 | 687 | (700 | ) | (836 | ) | 377 | 687 | ||||||||||||||||||||||
| Recovery from government business enterprises and other investment earnings |
7 | 9 | 1,153 | 1,256 | - | - | 1,342 | 1,471 | ||||||||||||||||||||||||
| Endowment contributions |
- | - | - | - | - | - | 35 | 27 | ||||||||||||||||||||||||
|
|
|
|
|
|
|
|
|
|
|
|
|
|
|
|
|
|||||||||||||||||
| TOTAL REVENUE |
356 | 566 | 17,653 | 17,414 | (766 | ) | (973 | ) | 25,083 | 24,377 | ||||||||||||||||||||||
|
|
|
|
|
|
|
|
|
|
|
|
|
|
|
|
|
|||||||||||||||||
| EXPENSE |
||||||||||||||||||||||||||||||||
| Personnel services |
826 | 770 | 14 | 10 | 20 | 21 | 11,337 | 10,583 | ||||||||||||||||||||||||
| Grants/transfer payments |
765 | 900 | 43 | 2 | (773 | ) | (900 | ) | 2,382 | 2,054 | ||||||||||||||||||||||
| Supplies and services |
668 | 582 | 116 | 34 | (31 | ) | (105 | ) | 3,344 | 2,959 | ||||||||||||||||||||||
| Social assistance related |
9 | 7 | 8 | - | - | - | 1,859 | 1,937 | ||||||||||||||||||||||||
| Other operating (Note c) |
137 | 309 | 124 | 434 | 18 | 12 | 3,734 | 4,740 | ||||||||||||||||||||||||
| Debt servicing |
3 | 7 | 2,007 | 2,031 | - | - | 2,313 | 2,316 | ||||||||||||||||||||||||
| Amortization |
95 | 85 | - | - | - | (1 | ) | 946 | 904 | |||||||||||||||||||||||
|
|
|
|
|
|
|
|
|
|
|
|
|
|
|
|
|
|||||||||||||||||
| TOTAL EXPENSE |
2,503 | 2,660 | 2,312 | 2,511 | (766 | ) | (973 | ) | 25,915 | 25,493 | ||||||||||||||||||||||
|
|
|
|
|
|
|
|
|
|
|
|
|
|
|
|
|
|||||||||||||||||
| OPERATING SURPLUS (DEFICIT) |
(2,147 | ) | (2,094 | ) | 15,341 | 14,903 | - | - | (832 | ) | (1,116 | ) | ||||||||||||||||||||
|
|
|
|
|
|
|
|
|
|
|
|
|
|
|
|
|
|||||||||||||||||
Note a: The general government category includes revenue from sources that cannot be attributed to a particular sector. It also includes federal revenues and expenses related to emergency services and disaster assistance.
Note b: Consolidation adjustments are necessary to conform sectors to government accounting policies and to eliminate transactions between sectors.
Note c: Other operating includes transportation, communication and minor capital expenses.
130 PROVINCE OF MANITOBA ANNUAL REPORT AND PUBLIC ACCOUNTS 2026
SUMMARY FINANCIAL STATEMENTS
SCHEDULE 10 - RESTATED BUDGET
For the Year Ended March 31, 2026
| ($ millions) | ||||||||||||||||
| Adjustments | ||||||||||||||||
| Note a | Note b | Restated | ||||||||||||||
|
|
|
|||||||||||||||
| TOTAL REVENUE |
25,056 | - | - | 25,056 | ||||||||||||
|
|
|
|||||||||||||||
| EXPENSES |
||||||||||||||||
| Legislative Assembly |
65 | - | - | 65 | ||||||||||||
| Executive Council |
4 | 2 | - | 6 | ||||||||||||
| Advanced Education and Training |
2,042 | - | (14 | ) | 2,028 | |||||||||||
| Agriculture |
550 | - | - | 550 | ||||||||||||
| Business, Mining, Trade and Job Creation |
184 | 5 | - | 189 | ||||||||||||
| Education and Early Childhood Learning |
4,143 | - | - | 4,143 | ||||||||||||
| Environment and Climate Change |
210 | 6 | - | 216 | ||||||||||||
| Families |
2,140 | 44 | - | 2,184 | ||||||||||||
| Finance |
82 | 18 | - | 100 | ||||||||||||
| Health, Seniors and Long-Term Care |
9,383 | 211 | - | 9,594 | ||||||||||||
| Housing, Addictions and Homelessness |
854 | 15 | - | 869 | ||||||||||||
| Innovation and New Technology |
179 | 18 | 14 | 211 | ||||||||||||
| Justice |
903 | 91 | - | 994 | ||||||||||||
| Labour and Immigration |
40 | 1 | - | 41 | ||||||||||||
| Municipal and Northern Relations |
767 | 26 | - | 793 | ||||||||||||
| Natural Resources and Indigenous Futures |
148 | 4 | - | 152 | ||||||||||||
| Public Service Commission |
32 | - | - | 32 | ||||||||||||
| Public Service Delivery |
237 | 7 | - | 244 | ||||||||||||
| Sport, Culture, Heritage and Tourism |
106 | 16 | - | 122 | ||||||||||||
| Transportation and Infrastructure |
592 | 24 | - | 616 | ||||||||||||
| Enabling appropriations |
596 | (488 | ) | - | 108 | |||||||||||
| Emergency expenditures |
50 | - | - | 50 | ||||||||||||
| Tax credits |
206 | - | - | 206 | ||||||||||||
| Debt servicing |
2,337 | - | - | 2,337 | ||||||||||||
|
|
|
|||||||||||||||
| TOTAL EXPENSES |
25,850 | - | - | 25,850 | ||||||||||||
|
|
|
|||||||||||||||
| OPERATING SURPLUS (DEFICIT) FOR THE YEAR |
(794 | ) | - | - | (794 | ) | ||||||||||
|
|
|
|||||||||||||||
Note a: In addition to government ministries, separate “service headings” exist to provide expenditure authority for programs that are delivered by a number of ministries, where it is desirable to know the total amount allocated to the program, or where the allocation to various ministries is not known at the time of printing the budget. In some cases funding is allocated, as required, from enabling appropriations to ministries by the Minister of Finance under authority granted by section 33 of The Financial Administration Act. These allocations have no impact to the total budgeted revenue, expenses and operating surplus/(deficit).
Note b: On June 4, 2025, the Manitoba government approved organizational changes through Order in Council
No. 131/2025. As a result, certain duties and functions were transferred between departments, including the transfer of responsibilities related to Research Manitoba from the department of Advanced Education and Training to the department of Innovation and New Technology, effective immediately. For presentation consistency, related budgeted amounts have been reclassified/restated between departments where applicable. This restatement has no impact on the total budgeted revenue, total budgeted expenses, or the operating surplus/(deficit).
SUMMARY FINANCIAL STATEMENTS 131