Exhibit 99.2
| Strategic Acquisition of Pilot Water Solutions September 24th, 2026 |
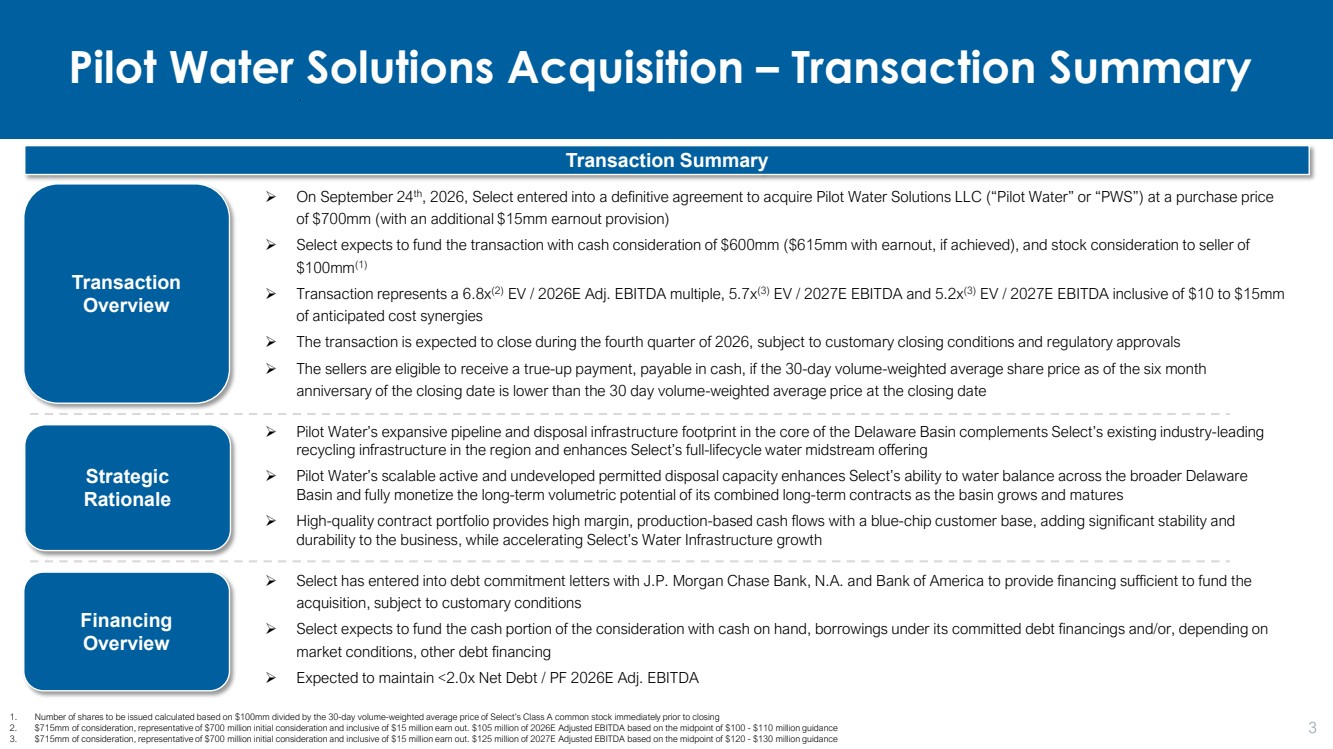
| 2 Disclaimer Statement Cautionary Statement Regarding Forward Looking Statements This presentation, including the oral statements made in connection herewith, has been prepared on a confidential basis solely for informational purposes. This presentation contains general information about the activities of Select Water Solutions, Inc. (“Select” or the “Company”) that does not purport to be complete. This presentation contains preliminary information only, is subject to change at any time, and should not be assumed to be complete or to constitute all the information necessary to make an informed decision regarding the Company. This presentation contains certain statements and information that may constitute “forward-looking statements” within the meaning of Section 27A of the Securities Act of 1933, as amended, and Section 21E of the Securities Exchange Act of 1934, as amended. All statements, other than statements of historical fact, regarding the Company’s strategy, future operations, financial position, estimated revenues and losses, projected costs, prospects, plans and objectives of Select’s management are forward-looking statements. When used in this presentation, the words “could,” “believe,” “anticipate,” “intend,” “estimate,” “expect,” “project,” “may,” “preliminary,” “forecast,” and similar expressions or variations are intended to identify forward-looking statements, although not all forward-looking statements contain such identifying words. These forward-looking statements are based on current expectations and assumptions of Select’s management about future events and are based on currently available information as to the outcome and timing of future events. Although we believe that the expectations reflected in, and the assumptions or bases underlying, our forward-looking statements are reasonable under the circumstances, we can give no assurance that such expectations will prove to be correct. Such statements are not guarantees of future performance or events and are subject to known and unknown risks and uncertainties that could cause our actual results, events or financial positions to differ materially from those included within or implied by such forward-looking statements. Accordingly, investors should not place undue reliance on forward-looking statements as a prediction of actual results. Each forward-looking statement in this presentation speaks only as of the date of this presentation. Except as required by applicable law, Select disclaims any intention or obligation to revise or update any forward-looking statements or other information contained in this presentation, whether as a result of new information, future events, or otherwise. Factors that could cause our actual results to differ materially from the results contemplated by such forward-looking statements include, but are not limited to, the factors discussed or referenced in the “Risk Factors” section of our Annual Report on Form 10-K and our other filings with the U.S. Securities and Exchange Commission (the “SEC”). There may be other factors of which Select is currently unaware or deems immaterial that may cause its actual results to differ materially from the forward-looking statements. No representations or warranties, express or implied, are made by the Company or any of its directors, officers, employees, advisors, agents, or affiliates (collectively, the “Relevant Parties”) as to the accuracy, adequacy, timeliness, completeness, or reasonableness of any information contained herein or any subsequent oral or written information, and none of the Relevant Parties will have any liability to any person with respect to any use of, or reliance upon, such information. The information contained in this presentation has not been independently verified, and nothing herein is, or shall be relied upon as, a representation or warranty with respect to past or future facts or results or any other matter. Prospective investors are solely responsible for conducting their own diligence, investigations, and independent analysis of the Company and should obtain independent advice from appropriate sources in making any investment decision. Industry and Market Data This presentation has been prepared by Select and includes market data and other statistical information from third-party sources, including independent industry publications, government publications or other published independent sources. Although Select believes these third-party sources are reliable as of their respective dates, the Company has not independently verified the accuracy or completeness of this information. Some data is also based on the Company’s good faith estimates, which are derived from its review of internal sources as well as the third-party sources described above. This data involves a number of assumptions and limitations, and you are cautioned not to give undue weight to such estimates. While the Company is not aware of any misstatements regarding the industry and market data presented in this presentation, such data involve risks and uncertainties and are subject to change based on various factors, including those factors discussed under “Cautionary Statement Regarding Forward Looking Statements” above. No Solicitation and No Offer This presentation and any oral statements made in connection with this presentation shall neither constitute an offer to sell or the solicitation of an offer to buy any securities of the Company, nor shall there be any sale of securities of the Company in any state or jurisdiction in which such offer, solicitation, or sale would be unlawful prior to registration or qualification under the securities laws of such state or jurisdiction. Any such offer or solicitation can only be made by way of an effective registration statement in accordance with applicable securities laws. This presentation should not be considered as a recommendation that any investor should subscribe for or purchase any securities. Additional Information and Where to Find It For additional information regarding Select, please see our Annual Report on Form 10-K, Quarterly Reports on Form 10-Q and any recent Current Reports on Form 8- K, which are available at no charge at the SEC’s website at http://www.sec.gov and our website at https://investors.selectwater.com/sec-filings. In addition, documents will also be available for free from the Company by contacting the Company at 1233 W Loop S, Suite 1400, Houston, TX 77027 or (713) 235-9500. The contents of the websites referenced in this presentation are not incorporated herein by reference. Non-GAAP Financial Measures EBITDA, Adjusted EBITDA, EBITDA margin, Adjusted EBITDA margin, Net Debt, gross profit before depreciation and amortization (“D&A”) and gross margin before D&A are not financial measures presented in accordance with GAAP. We define EBITDA as net income/(loss), plus interest expense, income taxes and depreciation & amortization. We define Adjusted EBITDA as EBITDA plus/(minus) loss/(income) from discontinued operations, plus any impairment and abandonment charges or asset write-offs pursuant to GAAP, plus non-cash losses on the sale of assets or subsidiaries, non-recurring compensation expense, non-cash compensation expense, and non-recurring or unusual expenses or charges, including severance expenses, transaction costs, or facilities-related exit and disposal-related expenditures, plus/(minus) foreign currency losses/(gains), plus/(minus)losses/(gains) on unconsolidated entities and plus tax receivable agreements expense, less bargain purchase gains from business combinations. We define EBITDA margin and Adjusted EBITDA margin as EBITDA and Adjusted EBITDA divided by revenue, respectively. We define Net Debt as Total Debt minus Total Cash. We define gross profit before D&A as revenue less cost of revenue, excluding cost of sales D&A expense. We define gross margin before D&A as gross profit before D&A divided by revenue. EBITDA, Adjusted EBITDA, EBITDA margin, Adjusted EBITDA margin, Net Debt, gross profit before D&A and gross margin before D&A are supplemental non-GAAP financial measures that we believe provide useful information to external users of our financial statements, such as industry analysts, investors, lenders and rating agencies, because they allow them to compare our operating performance on a consistent basis across periods by removing the effects of our capital structure (such as varying levels of interest expense), asset base (such as depreciation and amortization) and non-recurring items outside the control of our management team. We present EBITDA, Adjusted EBITDA, EBITDA margin, Adjusted EBITDA margin, Net Debt, gross profit before D&A and gross margin before D&A because we believe they provide useful information to our investors and market participants regarding the factors and trends affecting our business in addition to measures calculated under GAAP. Net income is the GAAP measure most directly comparable to EBITDA and Adjusted EBITDA. Gross profit is the GAAP measure most directly comparable to gross profit before D&A. Total Debt is the GAAP measure most directly comparable to Net Debt. Our non-GAAP financial measures should not be considered as alternatives to the most directly comparable GAAP financial measures. Each of these non-GAAP financial measures has important limitations as an analytical tool due to exclusion of some but not all items that affect the most directly comparable GAAP financial measures. You should not consider EBITDA, Adjusted EBITDA, Net Debt or gross profit before D&A in isolation or as substitutes for an analysis of our results as reported under GAAP. Because EBITDA, Adjusted EBITDA, Net Debt and gross profit before D&A may be defined differently by other companies in our industry, our definitions of these non-GAAP financial measures may not be comparable to similarly titled measures of other companies, thereby diminishing their utility. For further discussion, please see our Annual Report on Form 10-K and our latest Quarterly Report on Form 10-Q. For a reconciliation of these non-GAAP measures presented on a historical basis, please see the tables in the Appendix at the end of this presentation. For forward-looking non-GAAP measures, we are unable to provide a reconciliation to the most comparable GAAP financial measure because the information needed to reconcile these measures is dependent on future events, many of which are outside management’s control. Additionally, estimating such GAAP measures and providing a meaningful reconciliation consistent with our accounting policies for future periods is extremely difficult and requires a level of precision that is unavailable for these future periods and cannot be accomplished without unreasonable effort. |
| Pilot Water Solutions Acquisition – Transaction Summary 3 Transaction Overview Financing Overview Transaction Summary Strategic Rationale On September 24th, 2026, Select entered into a definitive agreement to acquire Pilot Water Solutions LLC (“Pilot Water” or “PWS”) at a purchase price of $700mm (with an additional $15mm earnout provision) Select expects to fund the transaction with cash consideration of $600mm ($615mm with earnout, if achieved), and stock consideration to seller of $100mm(1) Transaction represents a 6.8x(2) EV / 2026E Adj. EBITDA multiple, 5.7x(3) EV / 2027E EBITDA and 5.2x(3) EV / 2027E EBITDA inclusive of $10 to $15mm of anticipated cost synergies The transaction is expected to close during the fourth quarter of 2026, subject to customary closing conditions and regulatory approvals The sellers are eligible to receive a true-up payment, payable in cash, if the 30-day volume-weighted average share price as of the six month anniversary of the closing date is lower than the 30 day volume-weighted average price at the closing date Pilot Water’s expansive pipeline and disposal infrastructure footprint in the core of the Delaware Basin complements Select’s existing industry-leading recycling infrastructure in the region and enhances Select’s full-lifecycle water midstream offering Pilot Water’s scalable active and undeveloped permitted disposal capacity enhances Select’s ability to water balance across the broader Delaware Basin and fully monetize the long-term volumetric potential of its combined long-term contracts as the basin grows and matures High-quality contract portfolio provides high margin, production-based cash flows with a blue-chip customer base, adding significant stability and durability to the business, while accelerating Select’s Water Infrastructure growth Select has entered into debt commitment letters with J.P. Morgan Chase Bank, N.A. and Bank of America to provide financing sufficient to fund the acquisition, subject to customary conditions Select expects to fund the cash portion of the consideration with cash on hand, borrowings under its committed debt financings and/or, depending on market conditions, other debt financing Expected to maintain <2.0x Net Debt / PF 2026E Adj. EBITDA 1. Number of shares to be issued calculated based on $100mm divided by the 30-day volume-weighted average price of Select’s Class A common stock immediately prior to closing 2. $715mm of consideration, representative of $700 million initial consideration and inclusive of $15 million earn out. $105 million of 2026E Adjusted EBITDA based on the midpoint of $100 - $110 million guidance 3. $715mm of consideration, representative of $700 million initial consideration and inclusive of $15 million earn out. $125 million of 2027E Adjusted EBITDA based on the midpoint of $120 - $130 million guidance |
| $100mm - $110mm in 2026E Adj. EBITDA(1) and $120 - $130mm in 2027E EBITDA(1) 1. Net Debt, Adj. EBITDA and EBITDA are Non-GAAP financial measures. See Disclaimer Statement on page 2 for important disclosures regarding non-GAAP financial measures. 2. Based on results for the six months ended June 30,2026 Pilot Water Solutions – Key Highlights Unlocks Full Capabilities of Select’s Leading Integrated Recycling & Disposal Platform 4 ~480 Mbw/d of MVCs adds predictable, production-levered contracted cash flows ~306,000 dedicated acres and ~529,000 ROFR acres add long-term inventory ~850 Mbw/d(2) of 2026 YTD produced water volumes handled add volume scale, with an incremental 175,000 bpd MVC commencing in early 2027 2.7 MMbw/d of active permitted disposal capacity and 0.9 MMbw/d of permitted undeveloped disposal capacity Expands Select’s water infrastructure footprint while preserving a peer-leading leverage profile expected to remain at <2.0x Net Debt / on a Pro Forma basis(1) |
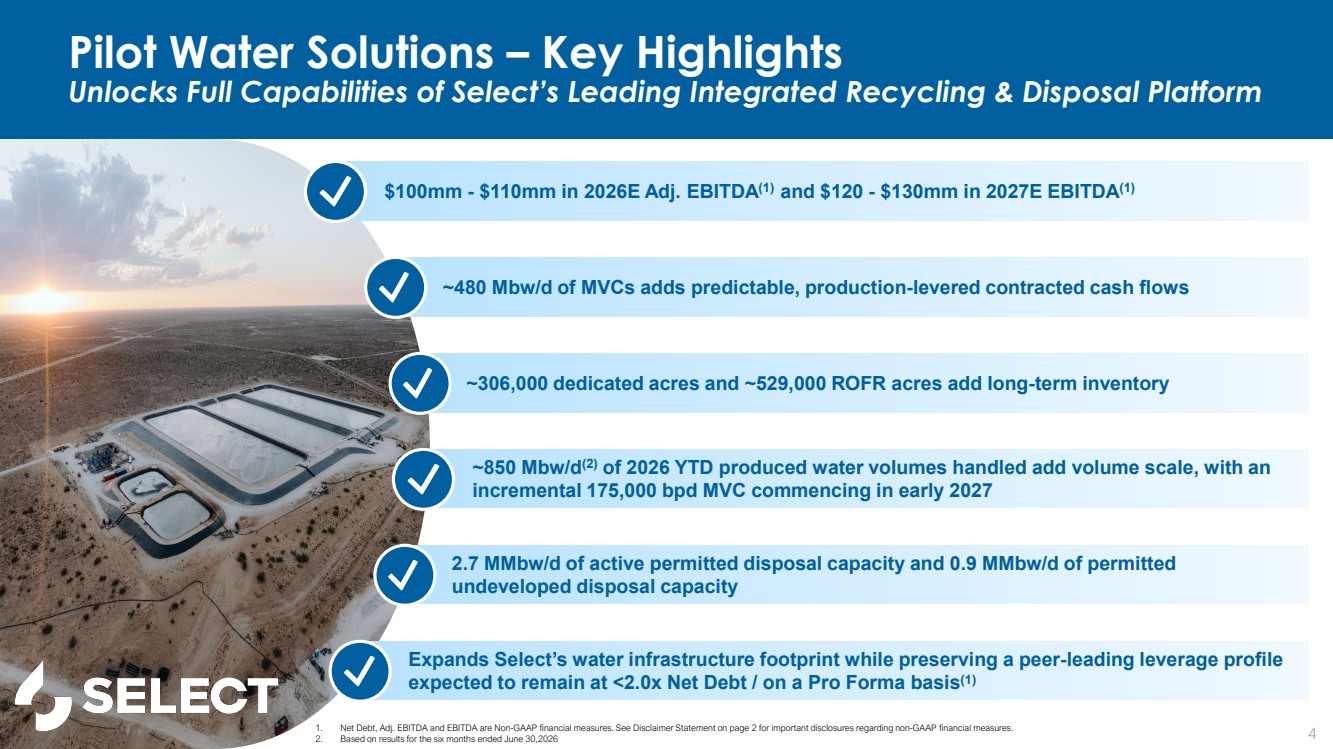
| Pilot Water Solutions – Company Overview Leading Water Midstream Provider to the Energy Industry in the Delaware Basin 5 Interruptible 17% MVC 42% Acreage Dedication 41% Water Infrastructure 100% Revenue by Contract Type(6) $250 – $270 million FY26E Revenue ~2.7 MMbw/d Disposal Capacity $100 – $110 million FY26E Adj. EBITDA(4) ~850 Mbw/d Average Produced Water Handling Volumes(1) 2,034 690 82% 436 44 5% 228 96 11% 25 16 2% 2,723 846 100% Disposal Capacity (Mbw/d) Average Produced Water Handling Volumes (Mbwp/d) % of Total PWS Disposal Volumes Gross Profit Before D&A Pilot Water provides critical produced water handling and disposal solutions services to oil and gas producers Core position strategically located in the premier Delaware Basin – the most prolific lower 48 shale oil basin Advantageous portfolio of both active and available permitted disposal capacity High margin, fee-based, growing cash flow supported by long-term, take-or-pay style contracts with top–tier producers Core Asset Overview Key Asset Statistics Delaware Eagle Ford Other Midland (3) (1) Top Five Customers (5) (2) New Mexico Texas Delaware Basin Primary PWS Operating Area Other PWS Operating Areas Other Operating Areas PWS Pipeline Active Disposal Permitted Undeveloped Disposal Active Recycling Facility 1. Based on results for the six months ended June 30, 2026. 2. Based on permitted disposal capacity 3. Other basins include East Texas, Rockies, and the Northeast 4. Adj. EBITDA is a Non-GAAP financial measure. See Disclaimer Statement on page 2 for important disclosures regarding non-GAAP financial measure 5. Top customers based on results for the twelve months ended June 30, 2026 6. Revenue mix representative of 2027 projections |
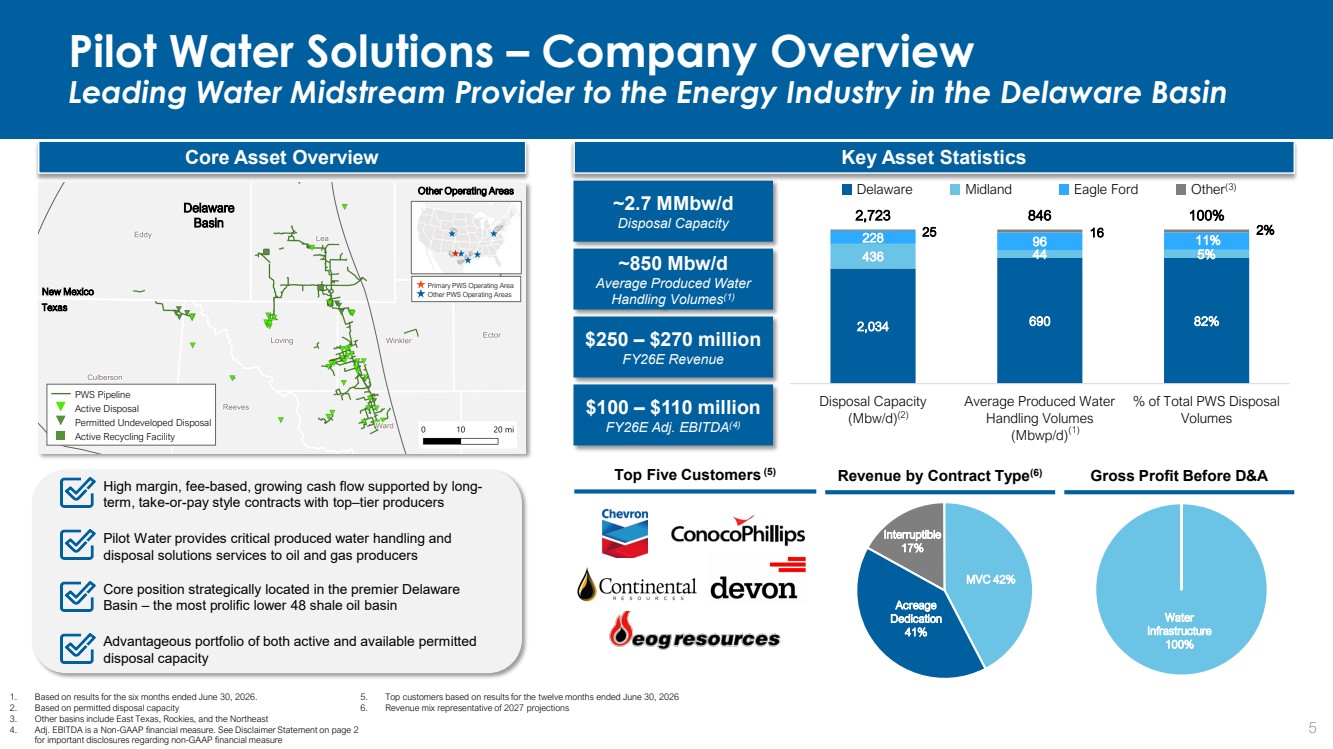
| Clear Line of Sight into Additional Near-Term Value Creation Opportunity with Pilot Water Assets 6 1 3 Recently signed MVC contract will provide ~$20mm of annualized EBITDA beginning in 2027 1 Select has identified ~$10 - $15mm of synergies we believe are actionable over the next 12-18 months 2 Reflects Select’s ability to commercialize available system capacity across the pro forma network with existing contracts, routing every barrel of produced water to its highest value outlet, and enhanced optionality around beneficial reuse and mineral extraction 3 (1) 1. Represents Select FY 2026 Pilot Water guidance. Adj. EBITDA is a Non-GAAP financial measure. See Disclaimer Statement on page 2 for important disclosures regarding non-GAAP financial measure Pilot Water Adj. EBITDA Bridge ($mm) Commentary 2 ~$20 ~$10 - $15 $100 - $110 $120 - $130 $135 - $145 2026E Adj. EBITDA 175k bpd MVC 2027E Adj. EBITDA Cost Synergies Pro Forma Adj. EBITDA Future Opportunity Future State |
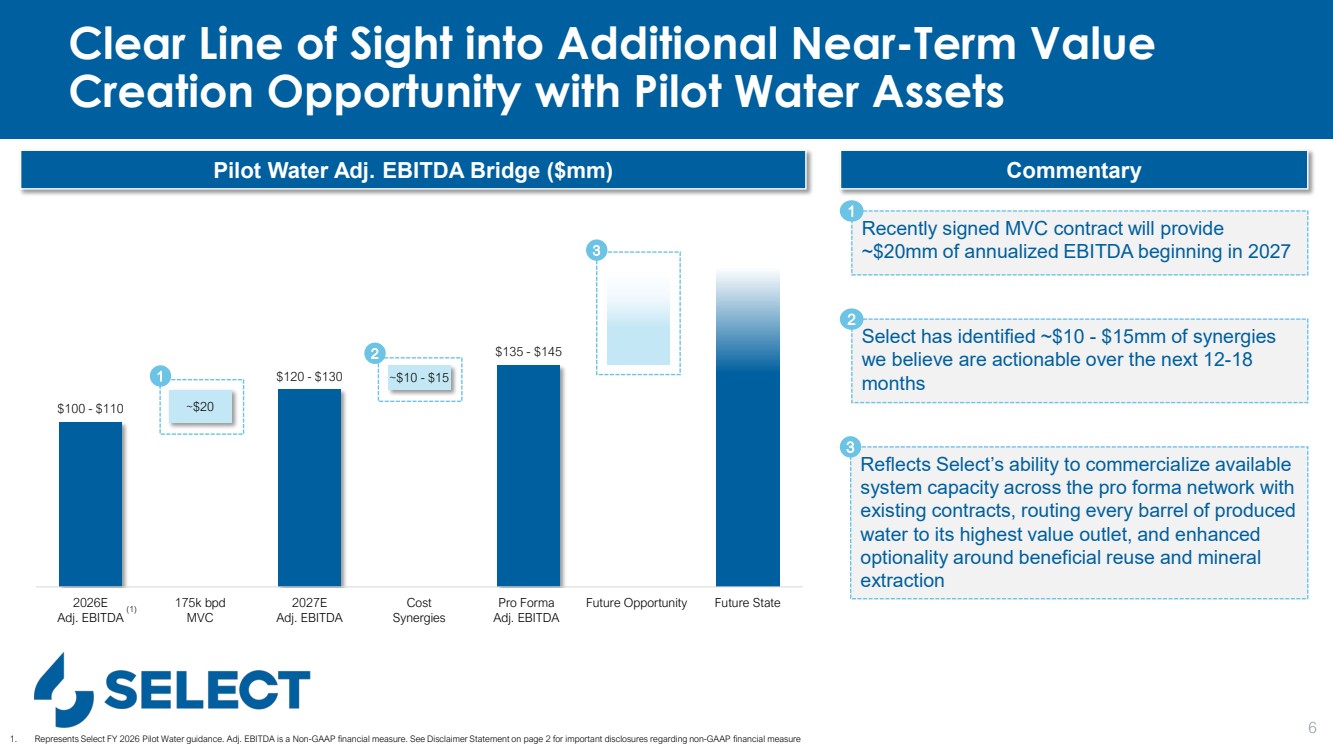
| $16 $19 $43 $92 $153 $169 $219 - $228 $339 - $363 2020 2021 2022 2023 2024 2025 2026E 2026E PF PWS Select Has Significantly Grown Water Infrastructure Through Organic Investment and Value-Accretive and Tactical Acquisitions 7 14 31 193 248 282 332 420 - 435 425 - 443 2020 2021 2022 2023 2024 2025 2026E 2026E PF PWS $35 $45 $125 $230 $291 $313 $392 - $407 $642 - $677 2020 2021 2022 2023 2024 2025 2026E 2026E PF PWS 12 50 83 96 138 136 141 - 146 436 - 451 2020 2021 2022 2023 2024 2025 2026E 2026E PF PWS Water Infrastructure Gross Profit Before D&A(1) (3) ($ in millions) Water Infrastructure Revenue ($ in millions) Produced Water Recycling Volumes (millions of barrels) Disposed Produced Water Volumes (millions of barrels) +50% CAGR(2) +53% CAGR(2) +76% CAGR(2) +51% CAGR(2) +65%(4) +57%(4) +2%(4) +209%(4) 1. Pro forma to include full year contribution of Pilot Water; 2025A and 1H26E Pilot Water metrics under diligence and subject to change 2. CAGR represents growth from 2020 through 2026E midpoint 3. Gross Profit before D&A is a Non-GAAP financial measure, see Disclaimer on page 2 for important disclosures regarding non-GAAP financial measures 4. Represent % increase from the midpoint of Select 2026E guidance and 2026E Pro Forma guidance |
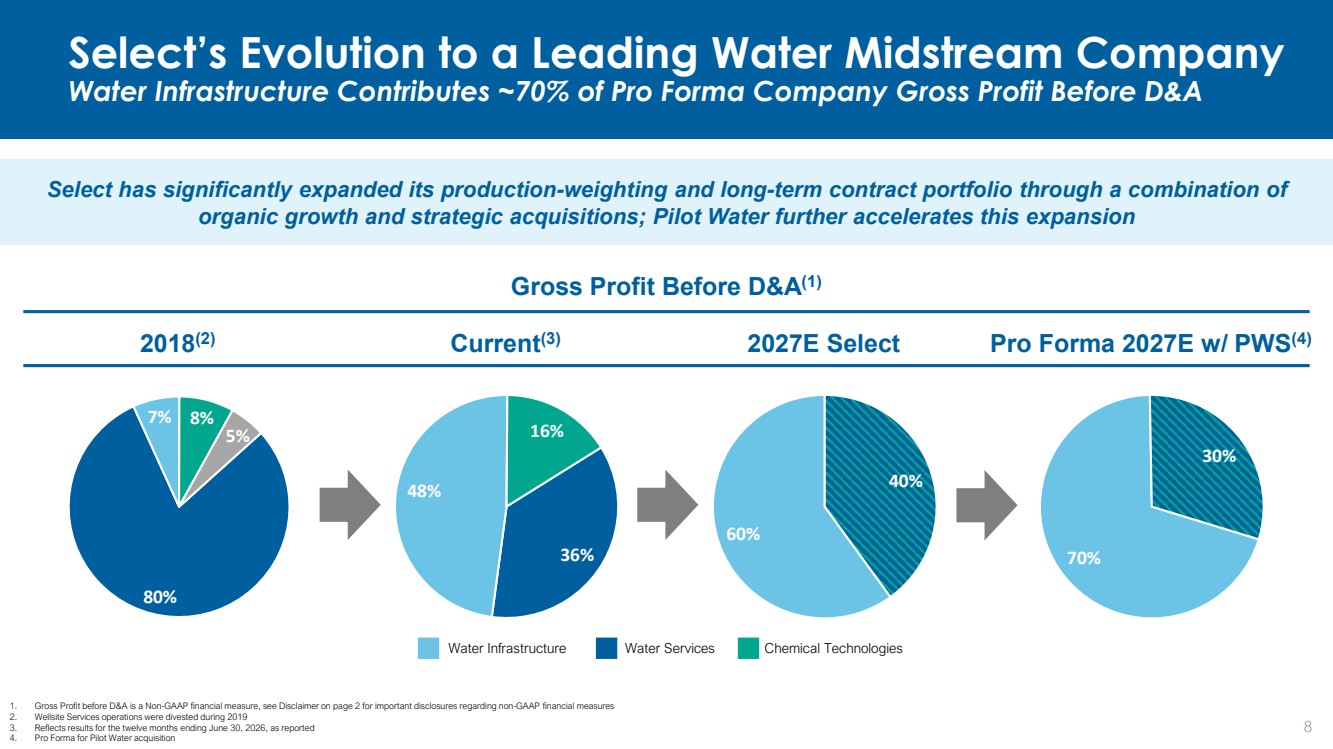
| Pro Forma 2027E w/ PWS(4) 60% 40% 36% 48% 16% 70% 30% 80% 7% 8% 5% Select’s Evolution to a Leading Water Midstream Company Water Infrastructure Contributes ~70% of Pro Forma Company Gross Profit Before D&A Gross Profit Before D&A(1) 2018(2) Current 2027E Select (3) Water Infrastructure Water Services Chemical Technologies 8 1. Gross Profit before D&A is a Non-GAAP financial measure, see Disclaimer on page 2 for important disclosures regarding non-GAAP financial measures 2. Wellsite Services operations were divested during 2019 3. Reflects results for the twelve months ending June 30, 2026, as reported 4. Pro Forma for Pilot Water acquisition Select has significantly expanded its production-weighting and long-term contract portfolio through a combination of organic growth and strategic acquisitions; Pilot Water further accelerates this expansion |
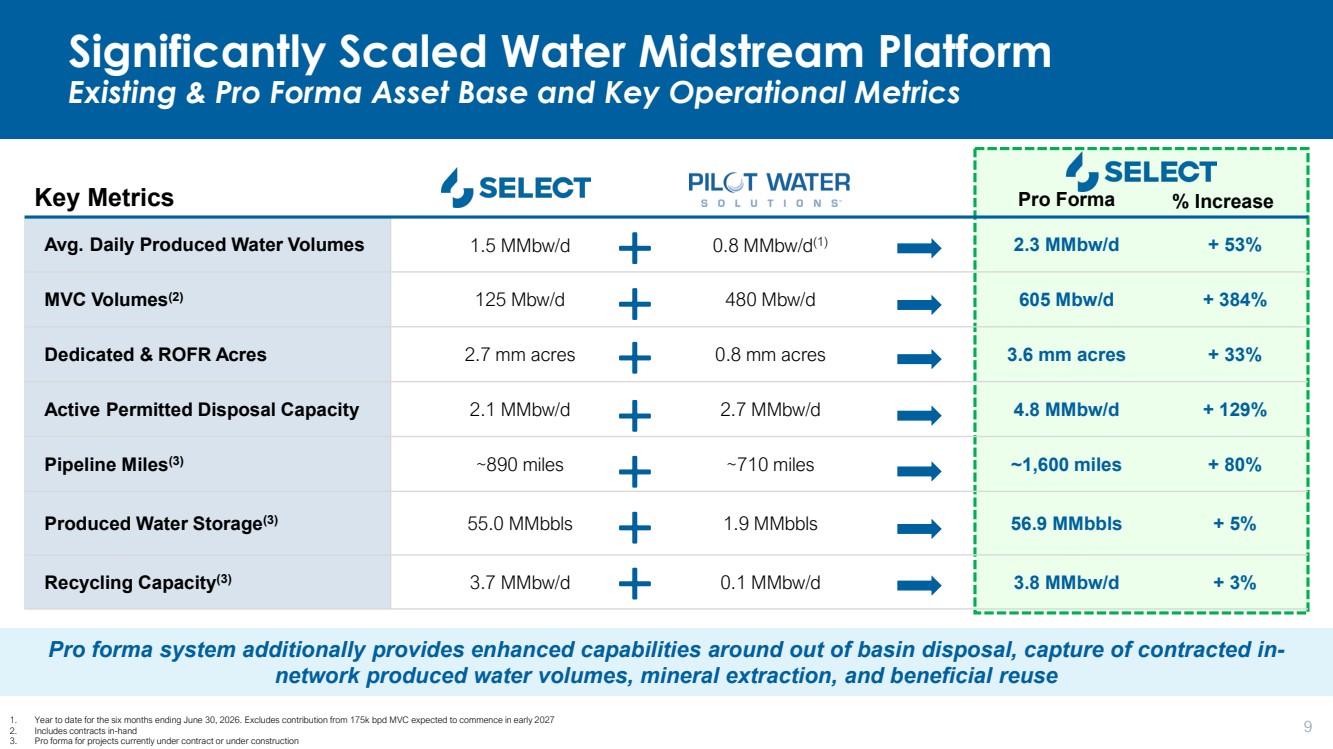
| Key Metrics Pro Forma % Increase Avg. Daily Produced Water Volumes 1.5 MMbw/d 0.8 MMbw/d(1) 2.3 MMbw/d + 53% MVC Volumes(2) 125 Mbw/d 480 Mbw/d 605 Mbw/d + 384% Dedicated & ROFR Acres 2.7 mm acres 0.8 mm acres 3.6 mm acres + 33% Active Permitted Disposal Capacity 2.1 MMbw/d 2.7 MMbw/d 4.8 MMbw/d + 129% Pipeline Miles(3) ~890 miles ~710 miles ~1,600 miles + 80% Produced Water Storage(3) 55.0 MMbbls 1.9 MMbbls 56.9 MMbbls + 5% Recycling Capacity(3) 3.7 MMbw/d 0.1 MMbw/d 3.8 MMbw/d + 3% Significantly Scaled Water Midstream Platform Existing & Pro Forma Asset Base and Key Operational Metrics 1. Year to date for the six months ending June 30, 2026. Excludes contribution from 175k bpd MVC expected to commence in early 2027 2. Includes contracts in-hand 3. Pro forma for projects currently under contract or under construction Pro forma system additionally provides enhanced capabilities around out of basin disposal, capture of contracted in-network produced water volumes, mineral extraction, and beneficial reuse 9 |
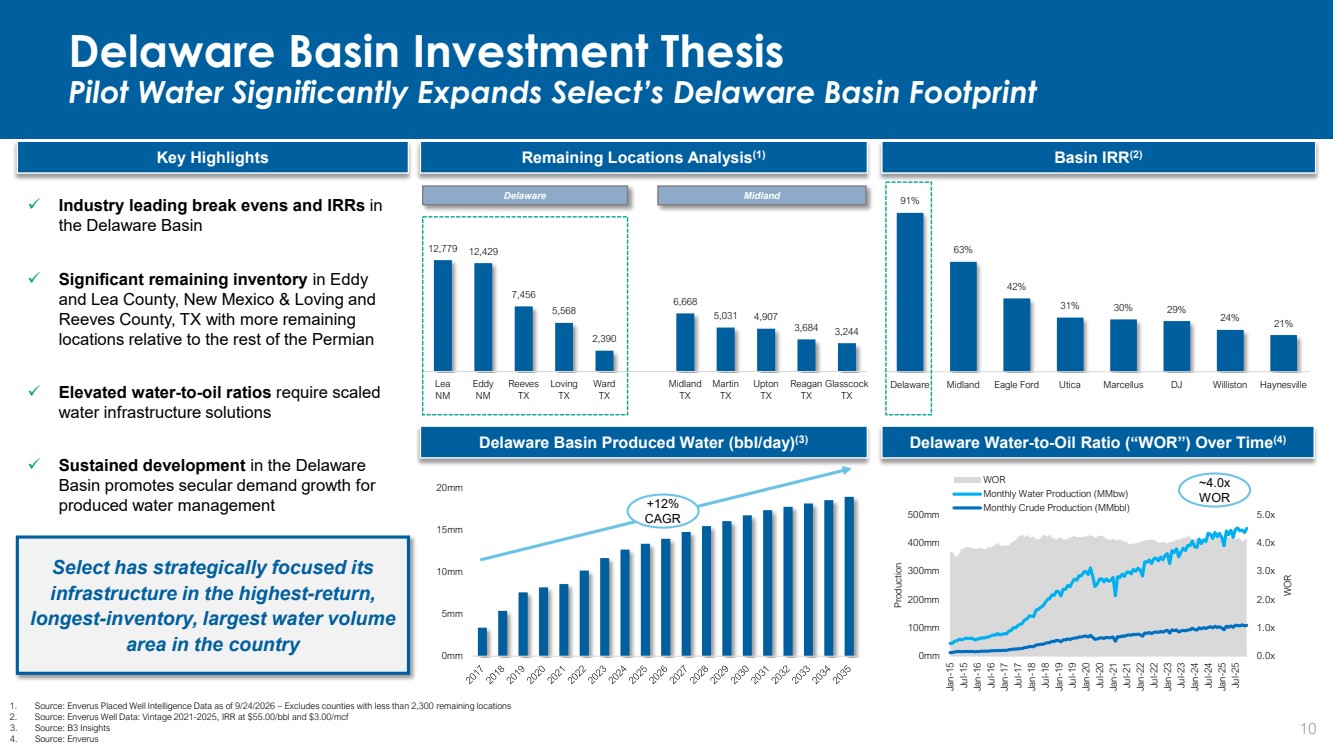
| 12,779 12,429 7,456 5,568 2,390 6,668 5,031 4,907 3,684 3,244 Lea NM Eddy NM Reeves TX Loving TX Ward TX Midland TX Martin TX Upton TX Reagan TX Glasscock TX 0mm 5mm 10mm 15mm 20mm 0.0x 1.0x 2.0x 3.0x 4.0x 5.0x 0mm 100mm 200mm 300mm 400mm 500mm Jan-15 Jul-15 Jan-16 Jul-16 Jan-17 Jul-17 Jan-18 Jul-18 Jan-19 Jul-19 Jan-20 Jul-20 Jan-21 Jul-21 Jan-22 Jul-22 Jan-23 Jul-23 Jan-24 Jul-24 Jan-25 Jul-25 WOR Production WOR Monthly Water Production (MMbw) Monthly Crude Production (MMbbl) Delaware Basin Investment Thesis Pilot Water Significantly Expands Select’s Delaware Basin Footprint Remaining Locations Analysis Key Highlights (1) Industry leading break evens and IRRs in the Delaware Basin Significant remaining inventory in Eddy and Lea County, New Mexico & Loving and Reeves County, TX with more remaining locations relative to the rest of the Permian Elevated water-to-oil ratios require scaled water infrastructure solutions Sustained development in the Delaware Basin promotes secular demand growth for produced water management Select has strategically focused its infrastructure in the highest-return, longest-inventory, largest water volume area in the country Delaware Basin Produced Water (bbl/day)(3) +12% CAGR 1. Source: Enverus Placed Well Intelligence Data as of 9/24/2026 – Excludes counties with less than 2,300 remaining locations 2. Source: Enverus Well Data: Vintage 2021-2025, IRR at $55.00/bbl and $3.00/mcf 3. Source: B3 Insights 4. Source: Enverus Basin IRR(2) Delaware Water-to-Oil Ratio (“WOR”) Over Time(4) 10 91% 63% 42% 31% 30% 29% 24% 21% Delaware Midland Eagle Ford Utica Marcellus DJ Williston Haynesville ~4.0x WOR Delaware Midland |
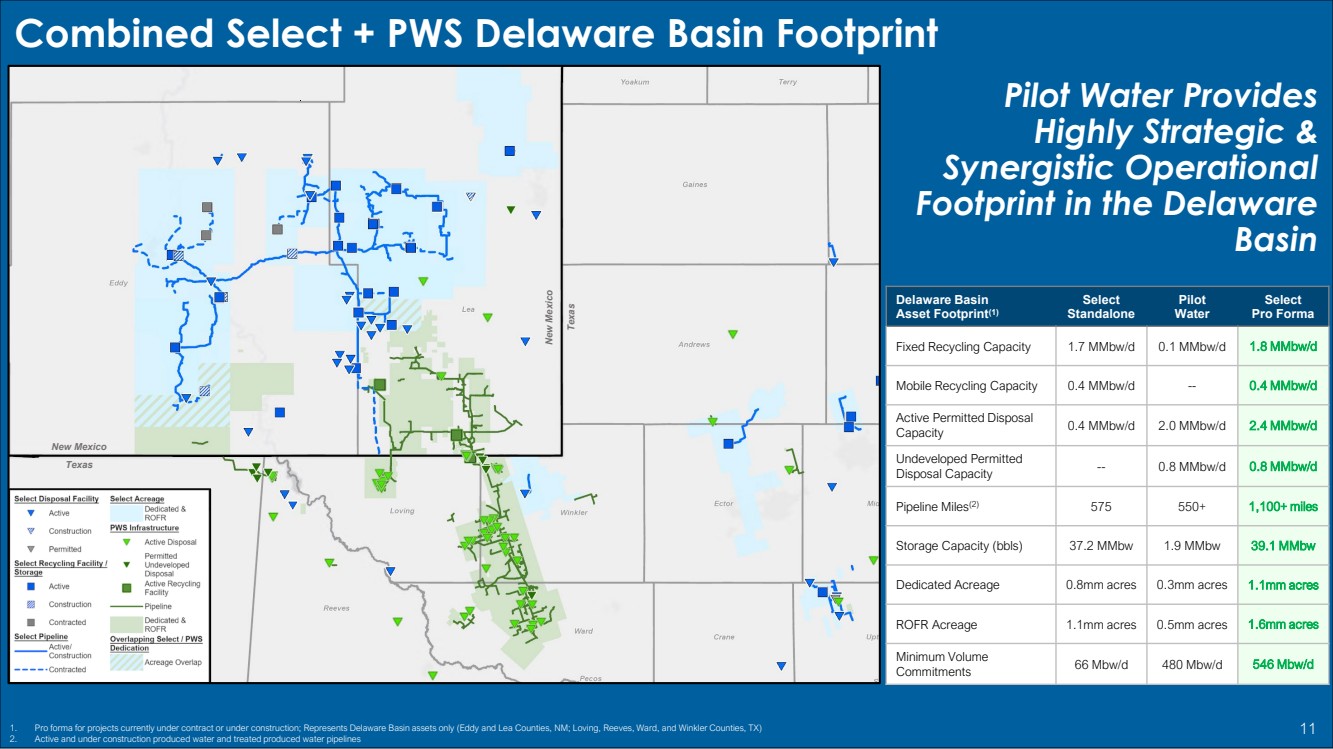
| Pilot Water Provides Highly Strategic & Synergistic Operational Footprint in the Delaware Basin Delaware Basin Asset Footprint(1) Select Standalone Pilot Water Select Pro Forma Fixed Recycling Capacity 1.7 MMbw/d 0.1 MMbw/d 1.8 MMbw/d Mobile Recycling Capacity 0.4 MMbw/d -- 0.4 MMbw/d Active Permitted Disposal Capacity 0.4 MMbw/d 2.0 MMbw/d 2.4 MMbw/d Undeveloped Permitted Disposal Capacity -- 0.8 MMbw/d 0.8 MMbw/d Pipeline Miles(2) 575 550+ 1,100+ miles Storage Capacity (bbls) 37.2 MMbw 1.9 MMbw 39.1 MMbw Dedicated Acreage 0.8mm acres 0.3mm acres 1.1mm acres ROFR Acreage 1.1mm acres 0.5mm acres 1.6mm acres Minimum Volume Commitments 66 Mbw/d 480 Mbw/d 546 Mbw/d 1. Pro forma for projects currently under contract or under construction; Represents Delaware Basin assets only (Eddy and Lea Counties, NM; Loving, Reeves, Ward, and Winkler Counties, TX) 2. Active and under construction produced water and treated produced water pipelines 11 New Mexico Texas New Mexico Texas Combined Select + PWS Delaware Basin Footprint |
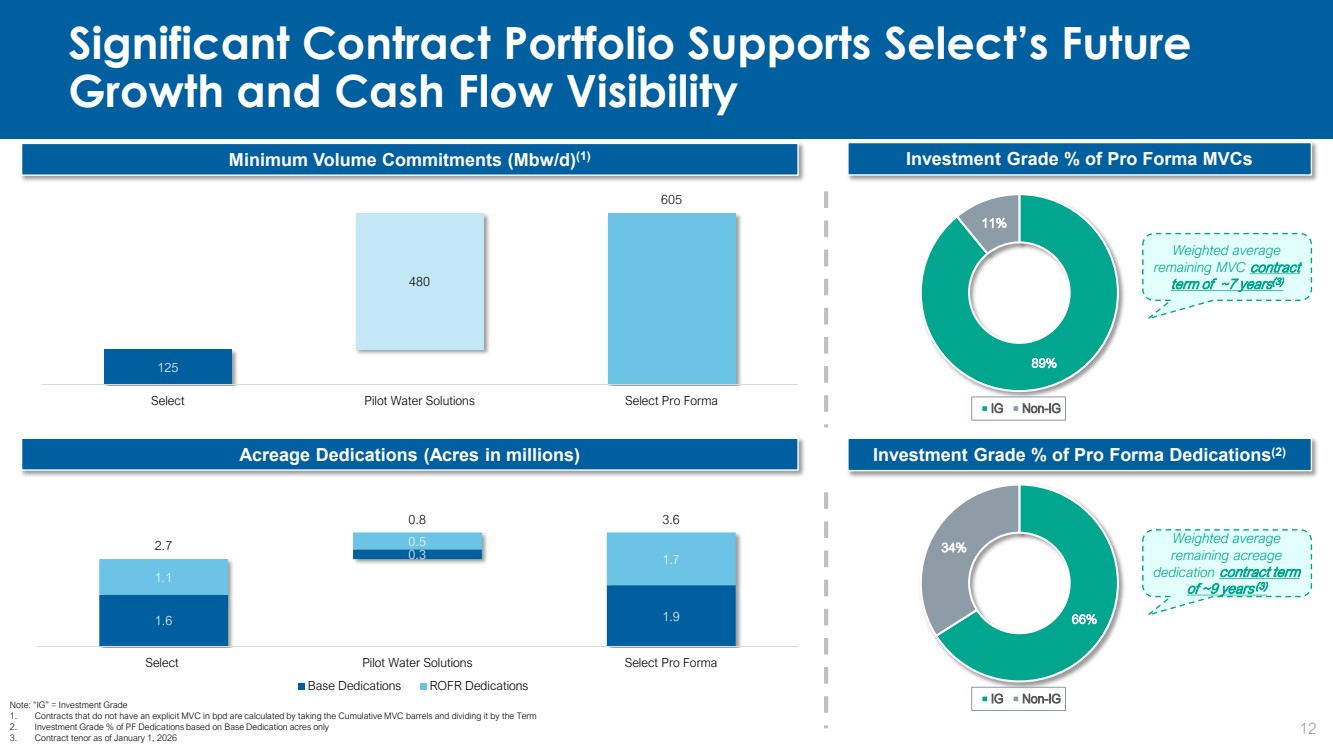
| 66% 34% IG Non-IG 89% 11% IG Non-IG 125 480 605 Select Pilot Water Solutions Select Pro Forma Significant Contract Portfolio Supports Select’s Future Growth and Cash Flow Visibility Minimum Volume Commitments (Mbw/d)(1) Acreage Dedications (Acres in millions) Note: “IG” = Investment Grade 1. Contracts that do not have an explicit MVC in bpd are calculated by taking the Cumulative MVC barrels and dividing it by the Term 2. Investment Grade % of PF Dedications based on Base Dedication acres only 3. Contract tenor as of January 1, 2026 Investment Grade % of Pro Forma Dedications(2) Investment Grade % of Pro Forma MVCs Weighted average remaining acreage dedication contract term of ~9 years (3) Weighted average remaining MVC contract term of ~7 years(3) 12 1.6 0.3 1.9 1.1 0.5 1.7 2.7 0.8 3.6 Select Pilot Water Solutions Select Pro Forma Base Dedications ROFR Dedications |
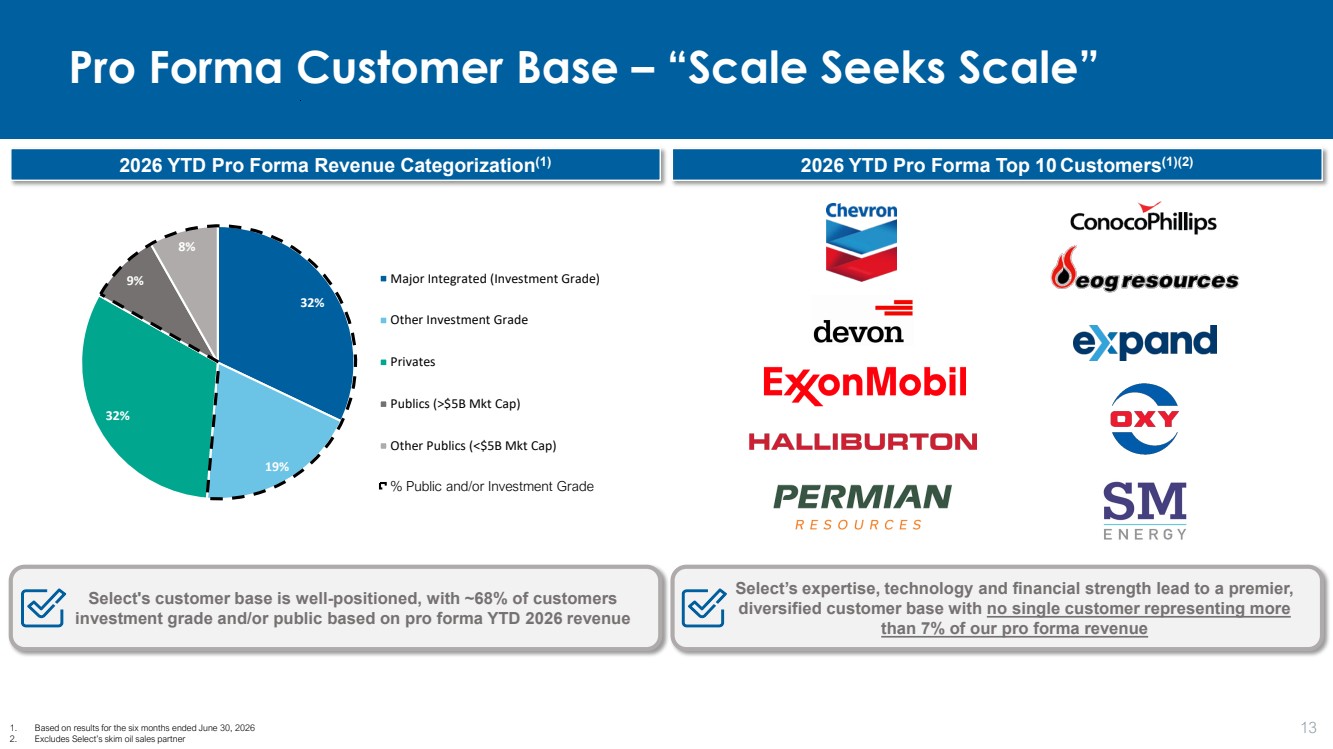
| 32% 19% 32% 9% 8% Major Integrated (Investment Grade) Other Investment Grade Privates Publics (>$5B Mkt Cap) Other Publics (<$5B Mkt Cap) Pro Forma Customer Base – “Scale Seeks Scale” 2026 YTD Pro Forma Revenue Categorization(1) 2026 YTD Pro Forma Top 10 Customers(1)(2) 1. Based on results for the six months ended June 30, 2026 13 2. Excludes Select’s skim oil sales partner % Public and/or Investment Grade Select's customer base is well-positioned, with ~68% of customers investment grade and/or public based on pro forma YTD 2026 revenue Select’s expertise, technology and financial strength lead to a premier, diversified customer base with no single customer representing more than 7% of our pro forma revenue |
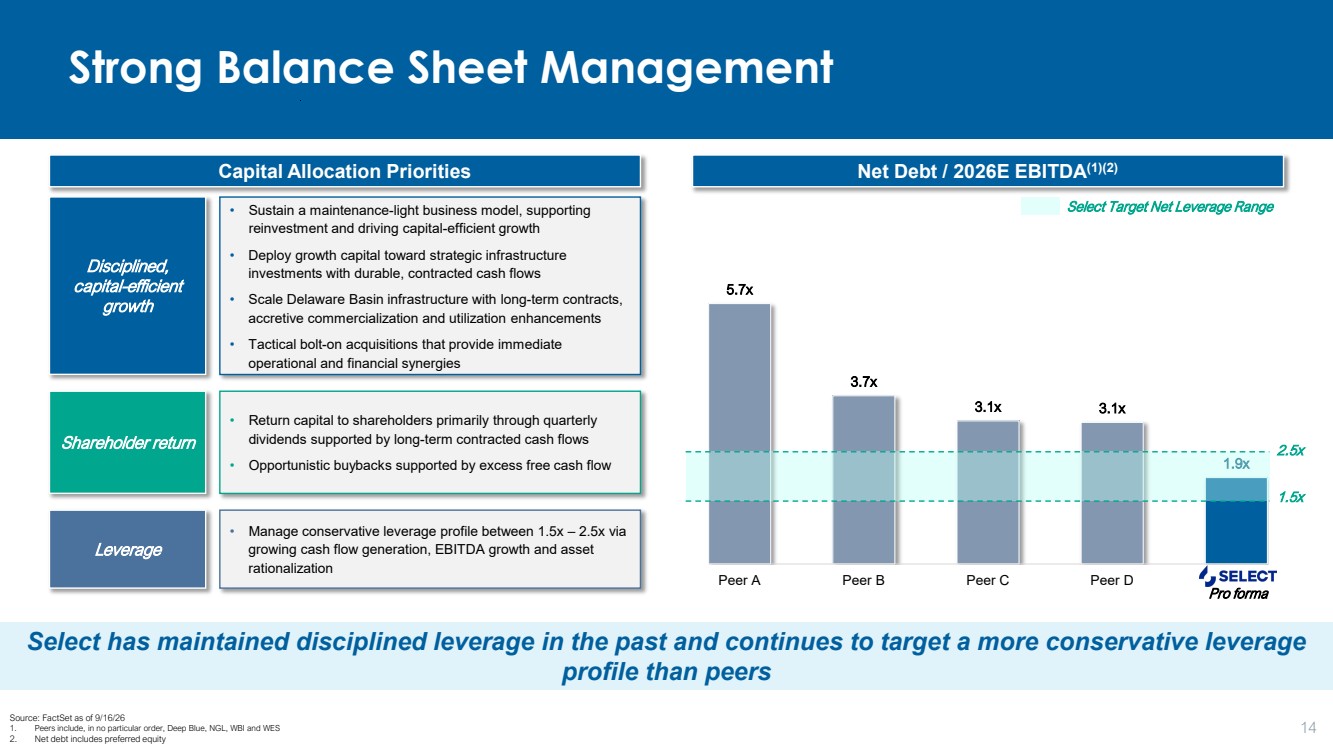
| Strong Balance Sheet Management Select has maintained disciplined leverage in the past and continues to target a more conservative leverage profile than peers Source: FactSet as of 9/16/26 1. Peers include, in no particular order, Deep Blue, NGL, WBI and WES 2. Net debt includes preferred equity 14 2.5x 1.5x Select Target Net Leverage Range 5.7x 3.7x 3.1x 3.1x 1.9x Peer A Peer B Peer C Peer D Capital Allocation Priorities Net Debt / 2026E EBITDA(1)(2) • Sustain a maintenance-light business model, supporting reinvestment and driving capital-efficient growth • Deploy growth capital toward strategic infrastructure investments with durable, contracted cash flows • Scale Delaware Basin infrastructure with long-term contracts, accretive commercialization and utilization enhancements • Tactical bolt-on acquisitions that provide immediate operational and financial synergies Disciplined, capital-efficient growth Shareholder return Leverage • Return capital to shareholders primarily through quarterly dividends supported by long-term contracted cash flows • Opportunistic buybacks supported by excess free cash flow • Manage conservative leverage profile between 1.5x – 2.5x via growing cash flow generation, EBITDA growth and asset rationalization Pro forma |