Pay vs Performance Disclosure
Jun. 28, 2026
USD ($)
Jun. 29, 2025
USD ($)
Jun. 30, 2024
USD ($)
Jun. 25, 2023
USD ($)
Jun. 26, 2022
USD ($)
Pay Versus Performance
The following disclosure has been prepared in accordance with the pay versus performance disclosure requirements set forth in Item 402(v) of Regulation S-K under the Exchange Act, which requires the presentation of certain information about the relationship between the compensation of our NEOs and our performance. Amounts reported as “Compensation Actually Paid” differ from the compensation amounts disclosed elsewhere in this proxy statement and do not reflect the value of the compensation actually received by the NEOs, including our CEO, who serves as our principal executive officer (“PEO”). For information about how our executive compensation program seeks to align pay with performance, please refer to “ – Executive Compensation and Other Information – Compensation Discussion and Analysis” beginning on page 28.
Pay Versus Performance
| Fiscal Year | Summary Compensation Table Total for PEO ($)(1) | Compensation Actually Paid to PEO ($)(1)(2) | Average Summary Compensation Table Total for Non-PEO Named Executive Officers ($)(1) | Average Compensation Actually Paid to Non-PEO Named Executive Officers ($)(1)(2) | Value of Initial Fixed $100 Investment Based On: (3) | Net Income ($ in thousands) | Non-GAAP Operating Income as a Percentage of Revenue (%)(5) | |||||||||||||||||||
| Total Shareholder Return ($) | Peer Group Total Shareholder Return ($)(4) | |||||||||||||||||||||||||
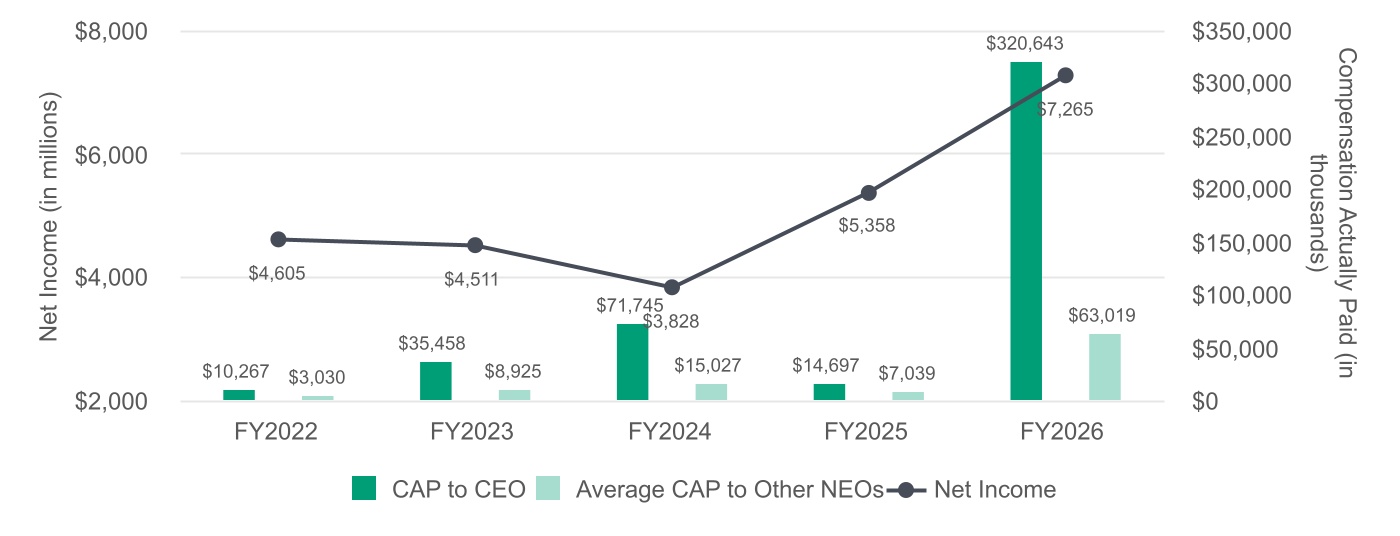
| 2026 | 40,354,475 | 320,642,970 | 8,781,071 | 63,019,272 | 633 | 430 | 7,265,396 | 35.8 | ||||||||||||||||||
2025 | 28,298,161 | 14,697,241 | 8,377,096 | 7,038,953 | 161 | 179 | 5,358,217 | 32.3 | ||||||||||||||||||
2024 | 30,135,041 | 71,745,236 | 6,933,795 | 15,027,121 | 175 | 175 | 3,827,772 | 30.3 | ||||||||||||||||||
| 2023 | 18,310,099 | 35,457,770 | 4,654,089 | 8,924,931 | 99 | 111 | 4,510,931 | 30.7 | ||||||||||||||||||
| 2022 | 16,941,156 | 10,266,747 | 4,179,804 | 3,029,959 | 72 | 85 | 4,605,286 | 31.3 | ||||||||||||||||||
•FY 2026: Douglas R. Bettinger, Seshasayee (Sesha) Varadarajan, Neil J. Fernandes, and Vahid Vahedi
•FY 2025: Douglas R. Bettinger, Patrick J. Lord, Ava A. Harter, and Seshasayee (Sesha) Varadarajan
•FY 2024: Douglas R. Bettinger, Patrick J. Lord, Seshasayee (Sesha) Varadarajan, and Vahid Vahedi
•FY 2023: Douglas R. Bettinger, Patrick J. Lord, Vahid Vahedi, and Seshasayee (Sesha) Varadarajan
•FY 2022: Douglas R. Bettinger, Patrick J. Lord, Vahid Vahedi, and Seshasayee (Sesha) Varadarajan
For purposes of these adjustments, the fair value of equity awards was determined as follows: (i) for service-based RSUs at fiscal year-end, using the closing price of the Company’s common stock on the last trading day preceding the fiscal year-end; (ii) for Market-based PRSUs at fiscal year-end, using a Monte Carlo simulation model with assumptions for expected volatility, risk-free interest rate, expected term and dividend yield determined as of the fiscal year-end; (iii) for service-based RSUs and Market-based PRSUs upon vesting, using the closing price of the Company’s common stock on the vesting date; (iv) for stock option awards at fiscal year-end, using a Black-Scholes option valuation model with assumptions for expected volatility, risk-free interest rate, expected term and dividend yield determined as of the fiscal year-end; and (v) for stock option awards upon vesting, using a Black-Scholes option valuation model with assumptions for expected volatility, risk-free interest rate, expected term and dividend yield determined as of the vesting date.
| CEO | |||||||||||||||||
| Adjustments | FY 2026 | FY 2025 | FY 2024 | FY 2023 | FY 2022 | ||||||||||||
| Summary Compensation Table (SCT) Total | 40,354,475 | 28,298,161 | 30,135,041 | 18,310,099 | 16,941,156 | ||||||||||||
| (Deduct): SCT “Stock Awards” column value | (33,539,410) | (24,101,123) | (19,847,946) | (11,291,907) | (10,079,176) | ||||||||||||
| (Deduct): SCT “Option Awards” column value | — | — | (6,261,433) | (3,643,192) | (2,669,527) | ||||||||||||
| Add: year-end fair value of equity awards granted in the fiscal year that are outstanding and unvested as of the fiscal year-end | 57,296,009 | 33,443,663 | 26,917,750 | 18,979,835 | 11,041,230 | ||||||||||||
| Add (Deduct): year-over-year change in fair value of equity awards granted in prior years that are outstanding and unvested as of the fiscal year-end | 187,848,957 | (7,464,817) | 30,177,855 | 7,625,472 | (7,109,304) | ||||||||||||
| Add: vesting date fair value of equity awards granted and vested in the fiscal year | — | — | — | — | — | ||||||||||||
| Add (Deduct): year-over-year change in fair value of equity awards granted in prior years that vested in the fiscal year | 68,682,939 | (15,478,643) | 10,623,969 | 5,477,463 | 2,142,368 | ||||||||||||
| (Deduct): fair value as of prior year-end of equity awards granted in prior years that failed to vest in the fiscal year | — | — | — | — | — | ||||||||||||
| Add: dollar value of dividends/earnings paid on equity awards in the fiscal year | — | — | — | — | — | ||||||||||||
| Compensation Actually Paid | 320,642,970 | 14,697,241 | 71,745,236 | 35,457,770 | 10,266,747 | ||||||||||||
For purposes of these adjustments, the fair value of equity awards was determined as follows: (i) for service-based RSUs at fiscal year-end, using the closing price of the Company’s common stock on the last trading day preceding the fiscal year-end; (ii) for Market-based PRSUs at fiscal year-end, using a Monte Carlo simulation model with assumptions for expected volatility, risk-free interest rate, expected term and dividend yield determined as of the fiscal year-end; (iii) for service-based RSUs and Market-based PRSUs upon vesting, using the closing price of the Company’s common stock on the vesting date; (iv) for stock option awards at fiscal year-end, using a Black-Scholes option valuation model with assumptions for expected volatility, risk-free interest rate, expected term and dividend yield determined as of the fiscal year-end; and (v) for stock option awards upon vesting, using a Black-Scholes option valuation model with assumptions for expected volatility, risk-free interest rate, expected term and dividend yield determined as of the vesting date.
| Other NEOs (Average) | |||||||||||||||||
| Adjustments | FY 2026 | FY 2025 | FY 2024 | FY 2023 | FY 2022 | ||||||||||||
| Summary Compensation Table (SCT) Total | 8,781,071 | 8,377,096 | 6,933,795 | 4,654,089 | 4,179,804 | ||||||||||||
| (Deduct): SCT “Stock Awards” column value | (6,626,107) | (6,574,519) | (4,371,479) | (2,709,589) | (2,122,367) | ||||||||||||
| (Deduct): SCT “Option Awards” column value | — | (129,498) | (1,160,663) | (737,158) | (510,227) | ||||||||||||
| Add: year-end fair value of equity awards granted in the fiscal year that are outstanding and unvested as of the fiscal year-end | 11,305,836 | 9,026,385 | 4,637,696 | 4,391,629 | 2,280,231 | ||||||||||||
| Add (Deduct): year-over-year change in fair value of equity awards granted in prior years that are outstanding and unvested as of the fiscal year-end | 36,511,493 | (1,313,954) | 6,531,859 | 1,681,231 | (1,644,600) | ||||||||||||
| Add: vesting date fair value of equity awards granted and vested in the fiscal year | — | 117,447 | — | — | — | ||||||||||||
| Add (Deduct): year-over-year change in fair value of equity awards granted in prior years that vested in the fiscal year | 13,046,979 | (2,464,004) | 2,455,913 | 1,644,729 | 847,118 | ||||||||||||
| (Deduct): fair value as of prior year-end of equity awards granted in prior years that failed to vest in the fiscal year | — | — | — | — | — | ||||||||||||
| Add: dollar value of dividends/earnings paid on equity awards in the fiscal year | — | — | — | — | — | ||||||||||||
| Compensation Actually Paid | 63,019,272 | 7,038,953 | 15,027,121 | 8,924,931 | 3,029,959 | ||||||||||||
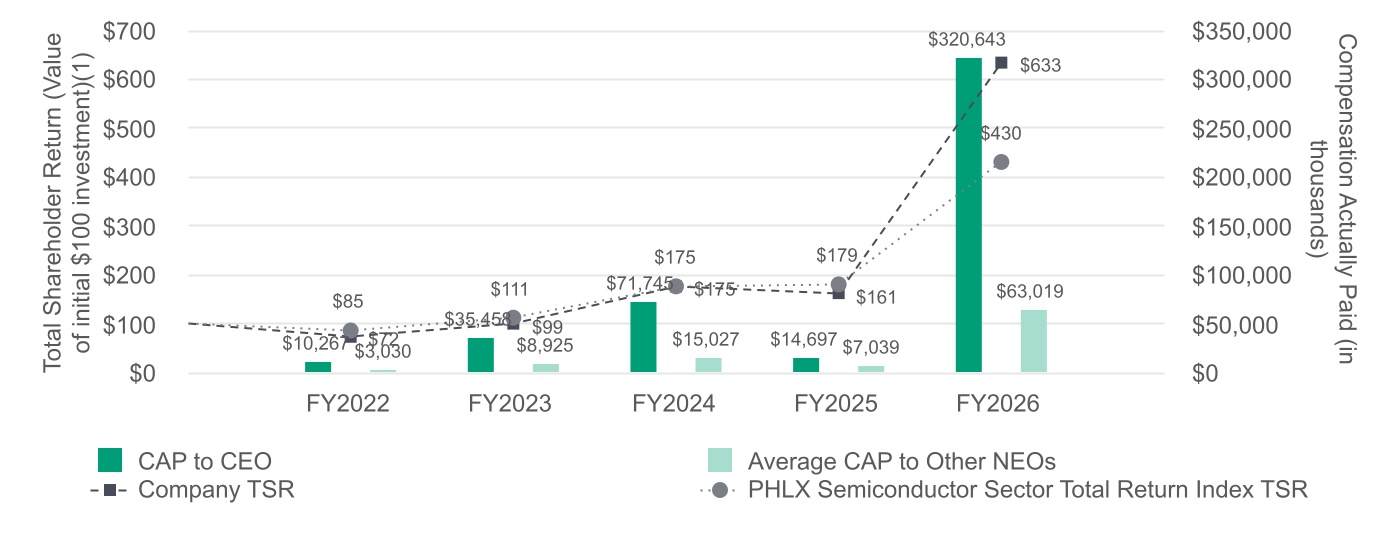
(1) Total shareholder return is calculated based on the value of an initial fixed investment of $100 on June 25, 2021 through the end of the listed fiscal year, and assuming dividends are reinvested.
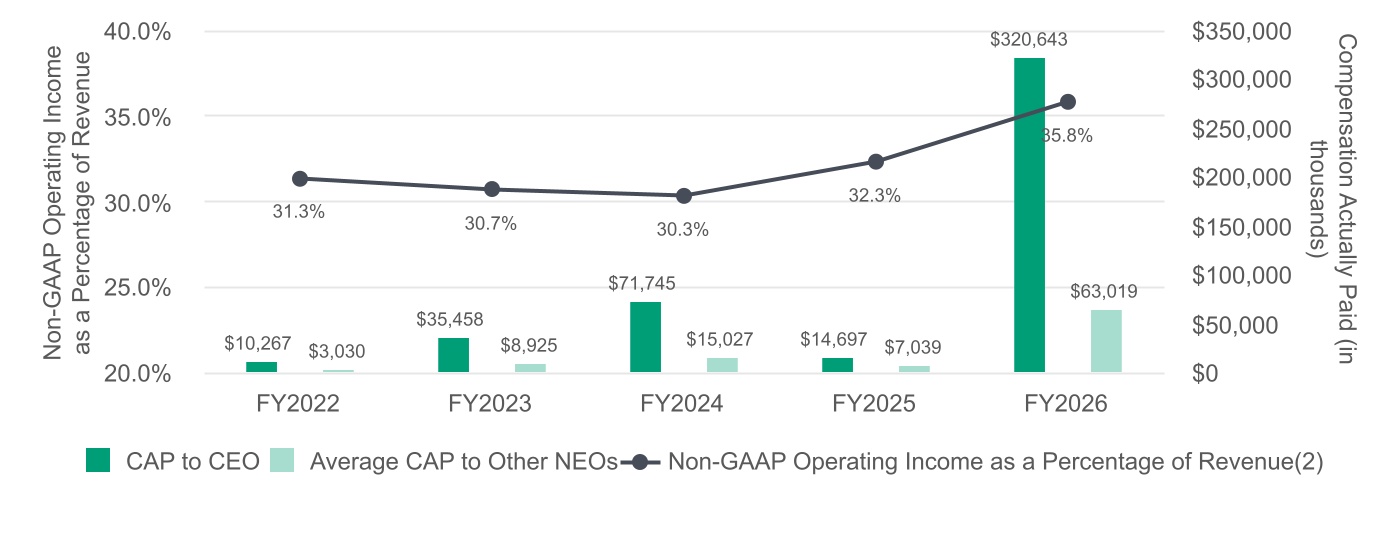
(2) Appendix A contains a reconciliation of non-GAAP operating income as a percentage of revenue to the results reported in our financial statements.
(1) Total shareholder return is calculated based on the value of an initial fixed investment of $100 on June 25, 2021 through the end of the listed fiscal year, and assuming dividends are reinvested.
| Non-GAAP operating income as a percentage of revenue (Company-Selected Measure) | ||
| Relative TSR (defined as the Company’s TSR relative to the TSR of the PHLX Semiconductor Sector Total Return Index) | ||
| Non-GAAP gross margin as a percentage of revenue | ||