Pay versus Performance Disclosure
The following tables and related disclosures provide information about (i) the “total compensation” of our CEO, and our other named executive officers (the “Other NEOs” or the “Non-CEO NEOs”) as presented in the Summary Compensation Table on page 22 of this proxy statement, (ii) the “compensation actually paid” to our CEO and our Other NEOs, as calculated pursuant to the SEC’s pay-versus-performance rules, (iii) certain financial performance measures, and (iv) the relationship of the “compensation actually paid” to those financial performance measures.
This disclosure has been prepared in accordance with Item 402(v) of Regulation S-K under the Securities Exchange Act of 1934, as amended, and does not necessarily reflect value actually realized by the executives or how our compensation committee evaluates compensation decisions in light of company or individual performance.
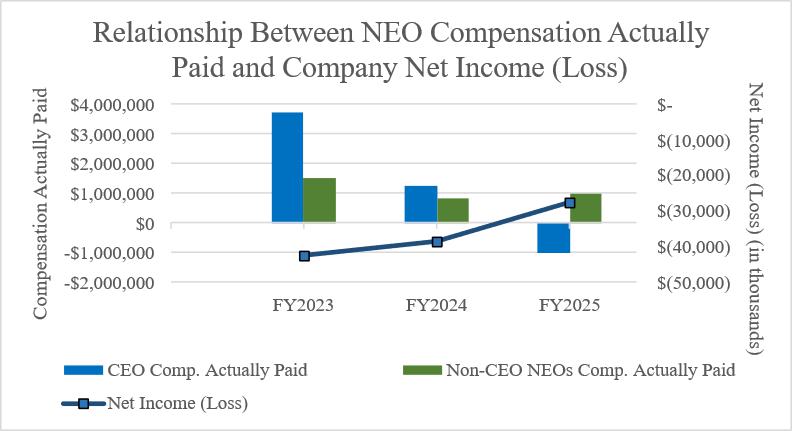
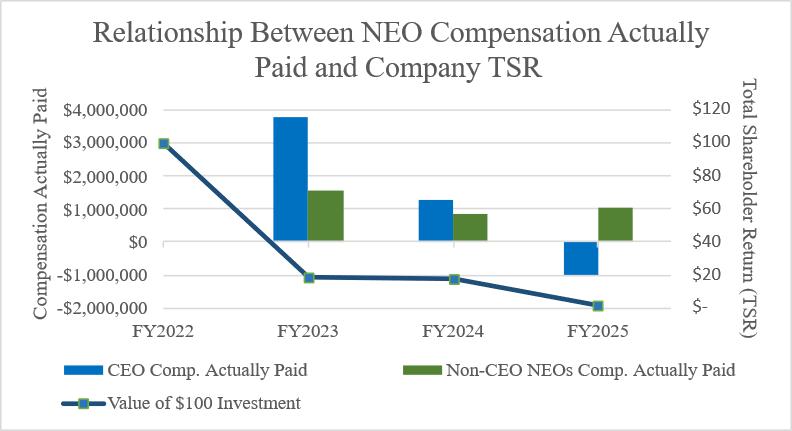
| Year | Summary Compensation Table Total for CEO(1) | Compensation Actually Paid to CEO(1)(2)(3) | Average Summary Compensation Table Total for Non-CEO NEOs(1) | Average Compensation Actually Paid to Non-CEO NEOs(1)(2)(3) | Value of Initial Fixed $100 Investment Based On Total Shareholder Return(4) | Net Income/(Loss) (in thousands) | ||||||||||||||||||
| 2025 | $ | 906,642 | $ | (1,005,143 | ) | $ | 2,417,573 | $ | 1,012,568 | $ | 0.56 | $ | (26,980 | ) | ||||||||||
| 2024 | $ | 1,491,187 | $ | 1,258,008 | $ | 935,119 | $ | 860,465 | $ | 6.94 | $ | (38,511 | ) | |||||||||||
| 2023 | $ | 8,342,714 | $ | 3,748,895 | $ | 2,933,365 | $ | 1,534,773 | $ | 2.06 | $ | (42,199 | ) | |||||||||||
| 1) | Todd Bazemore was appointed as Interim Chief Executive Officer on February 11, 2025 and was later appointed to Chief Executive Officer on August 29, 2025. He ceased to serve as Chief Executive Officer on November 21, 2025.The CEO for 2024 and 2023 is Mark Iwicki. The Non-CEO NEOs for whom the average compensation is presented in this table for 2025, 2024 and 2023 are Todd Bazemore, Kim Brazzell and Mary Reumuth. |
| 2) | The amounts shown as Compensation Actually Paid have been calculated in accordance with Item 402(v) of Regulation S-K and do not reflect compensation actually realized or received by the Company’s NEOs. These amounts reflect total compensation as set forth in the Summary Compensation Table for each year, adjusted as described in footnote 3 below. |
| 3) | Compensation Actually Paid reflects the exclusions and inclusions for the CEO and the Non-CEO NEOs set forth below. Amounts excluded, which are set forth in the “Minus Stock and Option Awards from SCT” columns below, represent the Stock Awards and Option Awards reported in the Stock Awards and Option Awards columns of the Summary Compensation Table for each applicable year. Amounts added back to determine Compensation Actually Paid are made up of the following components which are set forth in the table below, as applicable: (i) the fair value as of the end of the fiscal year of outstanding and unvested equity awards granted in that year; (ii) the change in fair value during the year of equity awards granted in prior years that remained outstanding and unvested at the end of the year; (iii) the fair value as of the vesting date of equity awards that were granted and vested in that year; and (iv) the change in fair value during the year through the vesting date of equity awards granted in prior years that vested during that year. The fair value at the end of the prior year of awards granted in any prior year that failed to meet applicable vesting conditions during the covered year are subtracted, although there were no such awards for the CEO or the Non-CEO NEOs in 2023, 2024 or 2025. Equity values are calculated in accordance with FASB ASC Topic 718. |
| Year | SCT Total for CEO | Minus Stock
and Option Awards from SCT | Plus Year-End Equity Value of Unvested Awards Granted During Year | Plus Change in Value of Unvested Awards Granted in Prior Years | Plus Value of Awards Granted and Vested During Year | Plus Change in Value of Prior Years’ Awards Vested During Year | Comp. Actually Paid to CEO | |||||||||||||||||||||
| 2025 | $ | 906,642 | $ | 793,880 | $ | 52,194 | $ | (876,536 | ) | $ | 102,062 | $ | (395,624 | ) | $ | (1,005,143 | ) | |||||||||||
| 2024 | $ | 1,491,187 | $ | 477,728 | $ | 373,194 | $ | (19,888 | ) | $ | 79,911 | $ | (188,668 | ) | $ | 1,258,008 | ||||||||||||
| 2023 | $ | 8,342,714 | $ | 7,329,278 | $ | 3,160,055 | $ | (15,793 | ) | $ | $ | (408,803 | ) | $ | 3,748,895 | |||||||||||||
| Year | Average
SCT Total for Other NEOs | Minus Average Stock and Option Awards from SCT | Plus Avg. Year-End Equity Value of Unvested Awards Granted During Year | Plus Avg. Change in Value of Unvested Awards Granted in Prior Years | Plus Avg. Value of Awards Granted and Vested During Year | Plus Avg. Change in Value of Prior Years’ Awards Vested During Year | Average
Comp. Actually Paid to Other NEOs | |||||||||||||||||||||
| 2025 | $ | 2,417,573 | $ | 1,349,679 | $ | 51,500 | $ | (186,820 | ) | $ | 126,320 | $ | (46,326 | ) | $ | 1,012,568 | ||||||||||||
| 2024 | $ | 935,119 | $ | 217,043 | $ | 169,553 | $ | (6,068 | ) | $ | 36,304 | $ | (57,400 | ) | $ | 860,465 | ||||||||||||
| 2023 | $ | 2,933,365 | $ | 2,211,832 | $ | 956,535 | $ | (5,732 | ) | $ | $ | (137,563 | ) | $ | 1,534,773 | |||||||||||||
For the equity values included in the above tables, the valuation assumptions used to calculate fair values of stock options were materially different from those disclosed at the time of the grant of the stock options. The assumptions used in determining fair value of the stock options that vested during 2023, 2024 and 2025, or that were outstanding as of December 31, 2023, December 31, 2024 or December 31, 2025, as applicable, are as follows:
| Options Vested During Year or Outstanding on December 31 of: | ||||||||||||
| 2025 | 2024 | 2023 | ||||||||||
| Expected Volatility | 102.65% - 185.84% | 103.47% - 114.24% | 105.29% - 111.91% | |||||||||
| Risk-Free Interest Rate | 3.45% - 4.38% | 3.51% - 4.77% | 3.32% - 4.24% | |||||||||
| Expected Dividend Yield | 0 | % | 0 | % | 0 | % | ||||||
| Expected Term (in years) | 0.08 - 10.00 | 8.48 - 9.92 | 6.00 - 9.00 | |||||||||
| 4) | Total Shareholder Return illustrates the value, as of the last day of the indicated fiscal year, of an investment of $100 in Kala common stock on December 31, 2022. |
The following chart sets forth the relationship between Compensation Actually Paid to our CEO, the average of Compensation Actually Paid to our Non-CEO NEOs, and the Company’s TSR over the fiscal three year period from 2023 through 2025.
Description of Relationship Between NEO Compensation Actually Paid and Net Income/(Loss)
The following chart sets forth the relationship between Compensation Actually Paid to our CEO, the average of Compensation Actually Paid to our Non-CEO NEOs, and the Company’s Net Income (Loss) over the fiscal three year period from 2023 through 2025.