Shareholder Report
Jul. 31, 2026
USD ($)
$ / shares
WHAT WERE THE FUND COSTS FOR THE LAST YEAR? (based on a hypothetical $10,000 investment)
|
Class Name
|
Costs of a $10,000 investment
|
Costs paid as a percentage of a $10,000 investment*
|
|
Advisor Class
|
$109
|
1.00%
|
HOW DID THE FUND PERFORM LAST YEAR AND WHAT AFFECTED ITS PERFORMANCE?
For the twelve months ended July 31, 2026, Advisor Class shares of Franklin Emerging Market Debt Opportunities Fund returned 17.30%. The Fund compares its performance to the JP Morgan EMBI Global Diversified Index, the JP Morgan EMBI Global Diversified ex-GCC Index, the JP Morgan GBI-EM Broad Diversified Index and the ICE BofA Emerging Market Corporate Plus (USD Hedged) Index, which returned 8.81%, 10.04%, 8.98% and 4.31%, respectively, for the same period.
PERFORMANCE HIGHLIGHTS
|
Top contributors to performance:
|
|
|
↑
|
An allocation to Venezuela was the largest contributor to Fund returns. Bond prices rallied in response to the U.S. operation to remove President Nicolás Maduro in January 2026. Optimism increased about greater macroeconomic stabilization and multilateral financing support, potentially opening a debt restructuring path.
|
|
↑
|
The completion of the debt restructuring of Ukraine’s gross domestic product-linked warrants in December 2025 supported Fund returns, with sentiment further boosted by Hungary’s election result in April 2026, which unlocked European Union funding while driving accession optimism.
|
|
↑
|
Exposure to a quasi-sovereign public healthcare entity supported returns after Ghana secured full bondholder support for the exchange of the outstanding 2026 senior secured bonds. The restructuring outcome was favorable, with holders receiving new Government of Ghana Eurobonds due in 2035 and 2037.
|
|
Top detractors from performance:
|
|
|
↓
|
Exposure to a Paraguayan-based corporate bond issuer detracted from returns. Bond prices came under pressure on concerns over tight liquidity due to upcoming amortizations.
|
|
↓
|
Although the Turkish authorities have been pursuing a strategy of managed real appreciation of the TRY, oil-driven inflation and rising political risk triggered international investor outflows.
|
|
↓
|
The Egyptian pound came under pressure due to heightened regional geopolitical risk, leading to a period of significant foreign capital outflows.
|
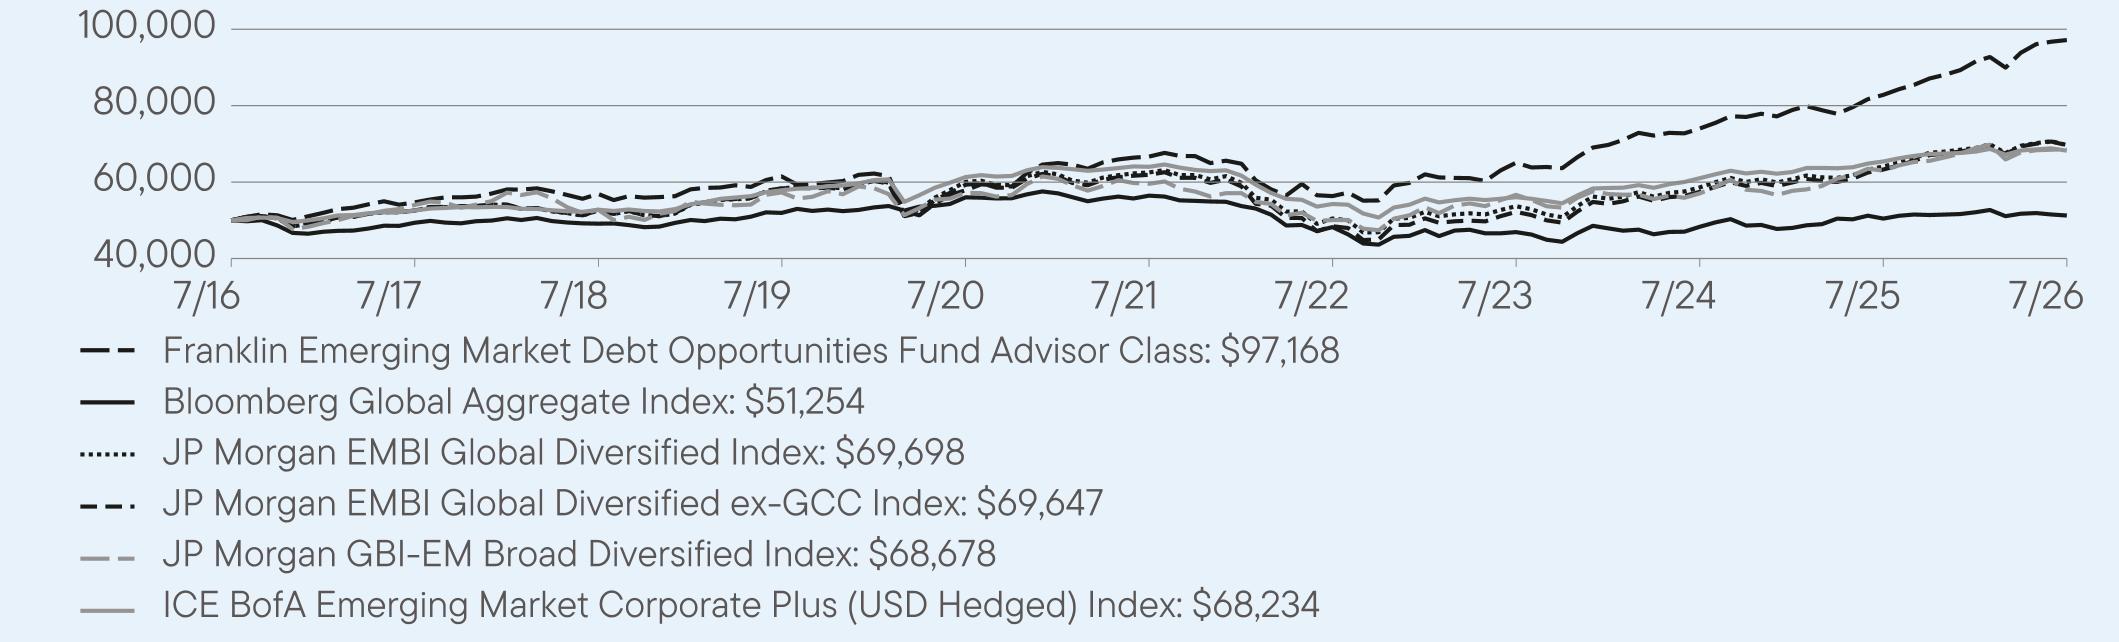
AVERAGE ANNUAL TOTAL RETURNS (%) Period Ended July 31, 2026
|
|
1 Year
|
5 Year
|
10 Year
|
|
Advisor Class
|
17.30
|
7.82
|
6.83
|
|
Bloomberg Global Aggregate Index
|
1.60
|
-1.91
|
0.25
|
|
JP Morgan EMBI Global Diversified Index
|
8.81
|
2.20
|
3.38
|
|
JP Morgan EMBI Global Diversified ex-GCC Index
|
10.04
|
2.38
|
3.37
|
|
JP Morgan GBI-EM Broad Diversified Index
|
8.98
|
2.89
|
3.23
|
|
ICE BofA Emerging Market Corporate Plus (USD Hedged) Index
|
4.31
|
1.28
|
3.16
|
For current month-end performance, please call Franklin Templeton at (800) 321-8563 or visit
https://www.franklintempleton.com/investments/options/mutual-funds.
https://www.franklintempleton.com/investments/options/mutual-funds.
Important data provider notices and terms available at www.franklintempletondatasources.com.
KEY FUND STATISTICS (as of July 31, 2026)
|
Total Net Assets
|
$161,843,360
|
|
Total Number of Portfolio Holdings (excludes derivatives, except purchased options, if any)
|
158
|
|
Total Management Fee Paid
|
$1,085,617
|
|
Portfolio Turnover Rate
|
40.43%
|
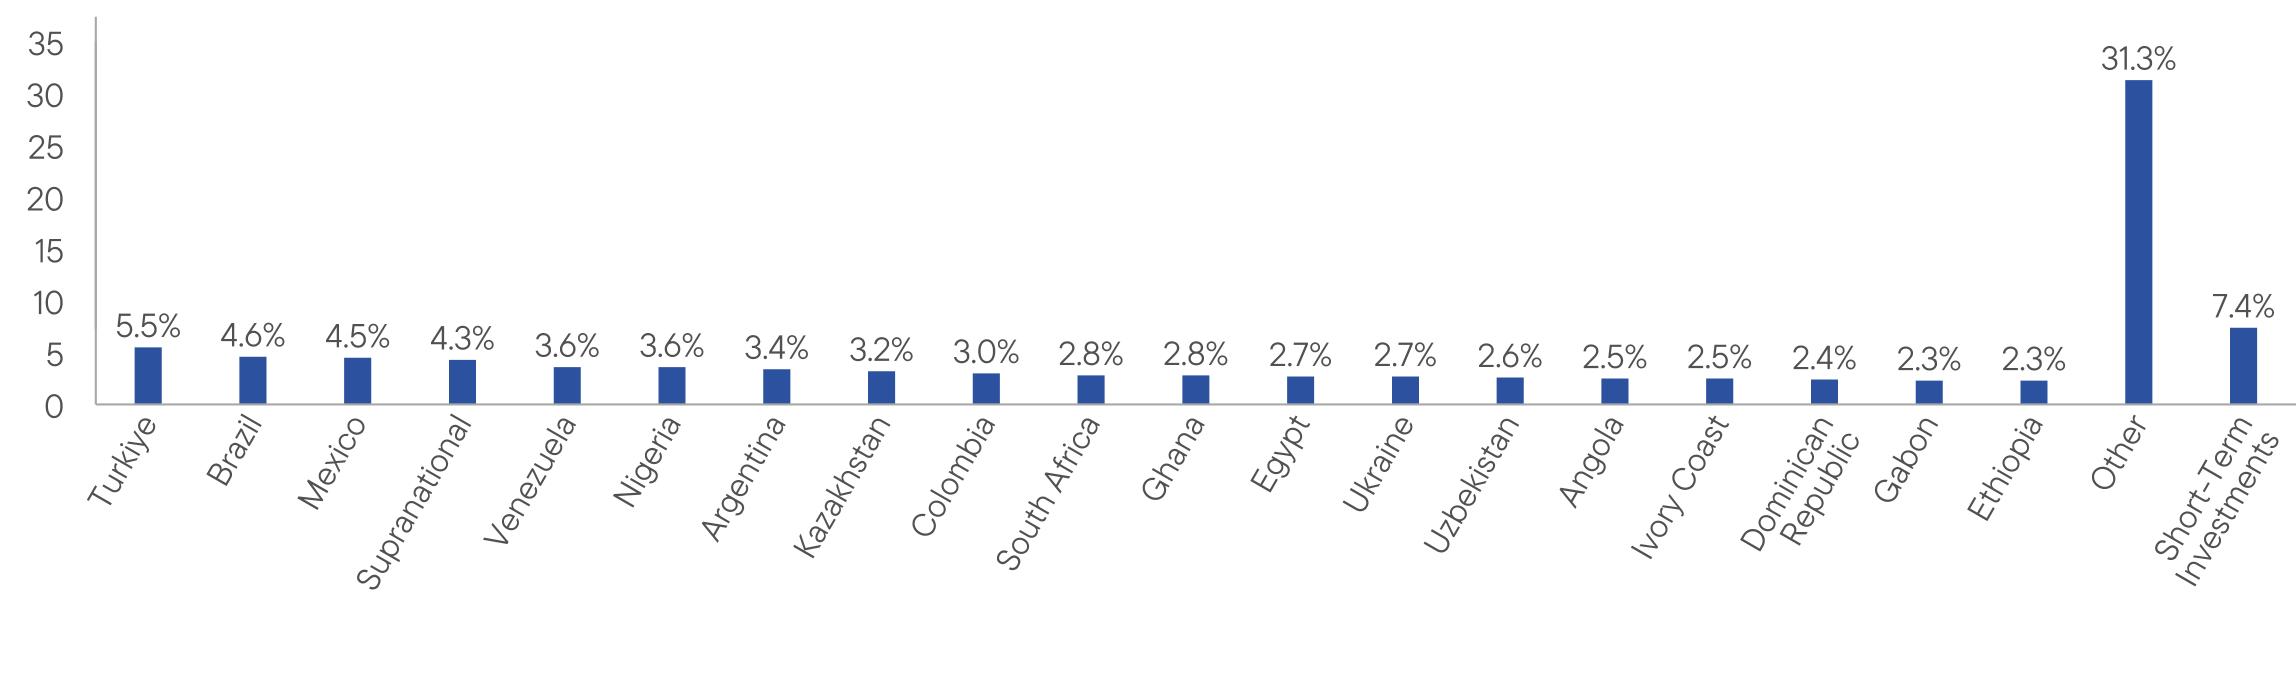
WHAT DID THE FUND INVEST IN? (as of July 31, 2026)
Portfolio Composition* (% of Total Investments)
WHAT WERE THE FUND COSTS FOR THE LAST YEAR? (based on a hypothetical $10,000 investment)
|
Class Name
|
Costs of a $10,000 investment
|
Costs paid as a percentage of a $10,000 investment*
|
|
Class A
|
$109
|
1.11%
|
HOW DID THE FUND PERFORM LAST YEAR AND WHAT AFFECTED ITS PERFORMANCE?
For the twelve months ended July 31, 2026, Class A shares of Franklin International Growth Fund returned -3.41%. The Fund compares its performance to the MSCI EAFE Index-NR, which returned 24.33% for the same period.
PERFORMANCE HIGHLIGHTS
|
Top contributors to performance:
|
|
|
↑
|
VAT Group outperformed as booming artificial intelligence (AI)-related semiconductor investment drove record demand for its vacuum valves, a critical component in advanced chip manufacturing. Investors were encouraged by surging orders, a record backlog, strong exposure to leading-edge fabs and expectations for sustained wafer-fab equipment spending into 2027.
|
|
↑
|
Nova, an Israel-based metrology solutions provider for the semiconductor industry, rose as the demand outlook remained strong for memory chips, advanced packaging, and processors to support data centers. The company’s results showed further market share gains and pointed to continued momentum.
|
|
↑
|
Inficon, a Switzerland-based provider of vacuum instrumentation for semiconductor and industrial markets, outperformed as the semiconductor upcycle accelerated, driven by AI infrastructure, leading-edge logic, and high-bandwidth memory investment. It’s stock responded positively to record orders, rapid profit growth, improving margins, and repeated upgrades to the company’s 2026 sales and earnings guidance.
|
|
Top detractors from performance:
|
|
|
↓
|
Germany-based live entertainment and ticketing services provider CTS Eventim weakened after a one-off contract loss, reiteration of conservative guidance and venue financing uncertainties clouded first-quarter earnings results. The longer-term backdrop suggests end markets continue to be strong, and the competitive environment remains stable.
|
|
↓
|
Cochlear, an Australia-based hearing implant maker, weighed on relative performance as investors digested market deterioration during the period. Checks showed implants increasingly discretionary amid macro pressure, U.S. and Middle East disruptions, tighter hospital and payer priorities, and evolving China policies.
|
|
↓
|
Interroll, a Swiss intralogistics equipment maker, curbed portfolio returns as delays in U.S. ecommerce orders weakened bookings and conversions, its European-skewed mix faced cautious sentiment and concerns increased about a vertical-conveyance acquisition.
|
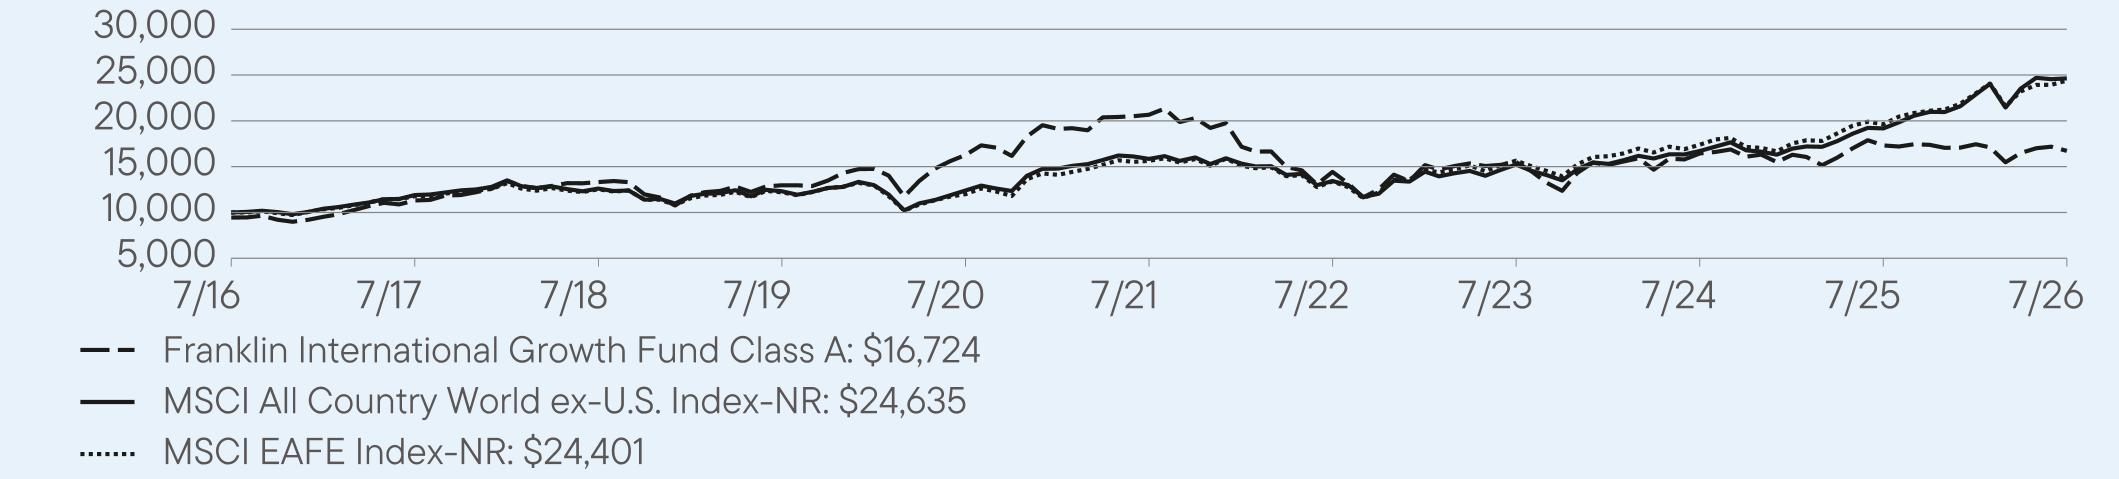
AVERAGE ANNUAL TOTAL RETURNS (%) Period Ended July 31, 2026
|
|
1 Year
|
5 Year
|
10 Year
|
|
Class A
|
-3.41
|
-4.15
|
5.87
|
|
Class A (with sales charge)
|
-8.71
|
-5.22
|
5.28
|
|
MSCI All Country World ex-U.S. Index-NR
|
28.46
|
9.22
|
9.44
|
|
MSCI EAFE Index-NR
|
24.33
|
9.31
|
9.33
|
For current month-end performance, please call Franklin Templeton at (800) DIAL BEN/342-5236 or visit
https://www.franklintempleton.com/investments/options/mutual-funds.
https://www.franklintempleton.com/investments/options/mutual-funds.
Important data provider notices and terms available at www.franklintempletondatasources.com.
KEY FUND STATISTICS (as of July 31, 2026)
|
Total Net Assets
|
$600,614,066
|
|
Total Number of Portfolio Holdings
|
34
|
|
Total Management Fee Paid
|
$4,752,321
|
|
Portfolio Turnover Rate
|
46.51%
|
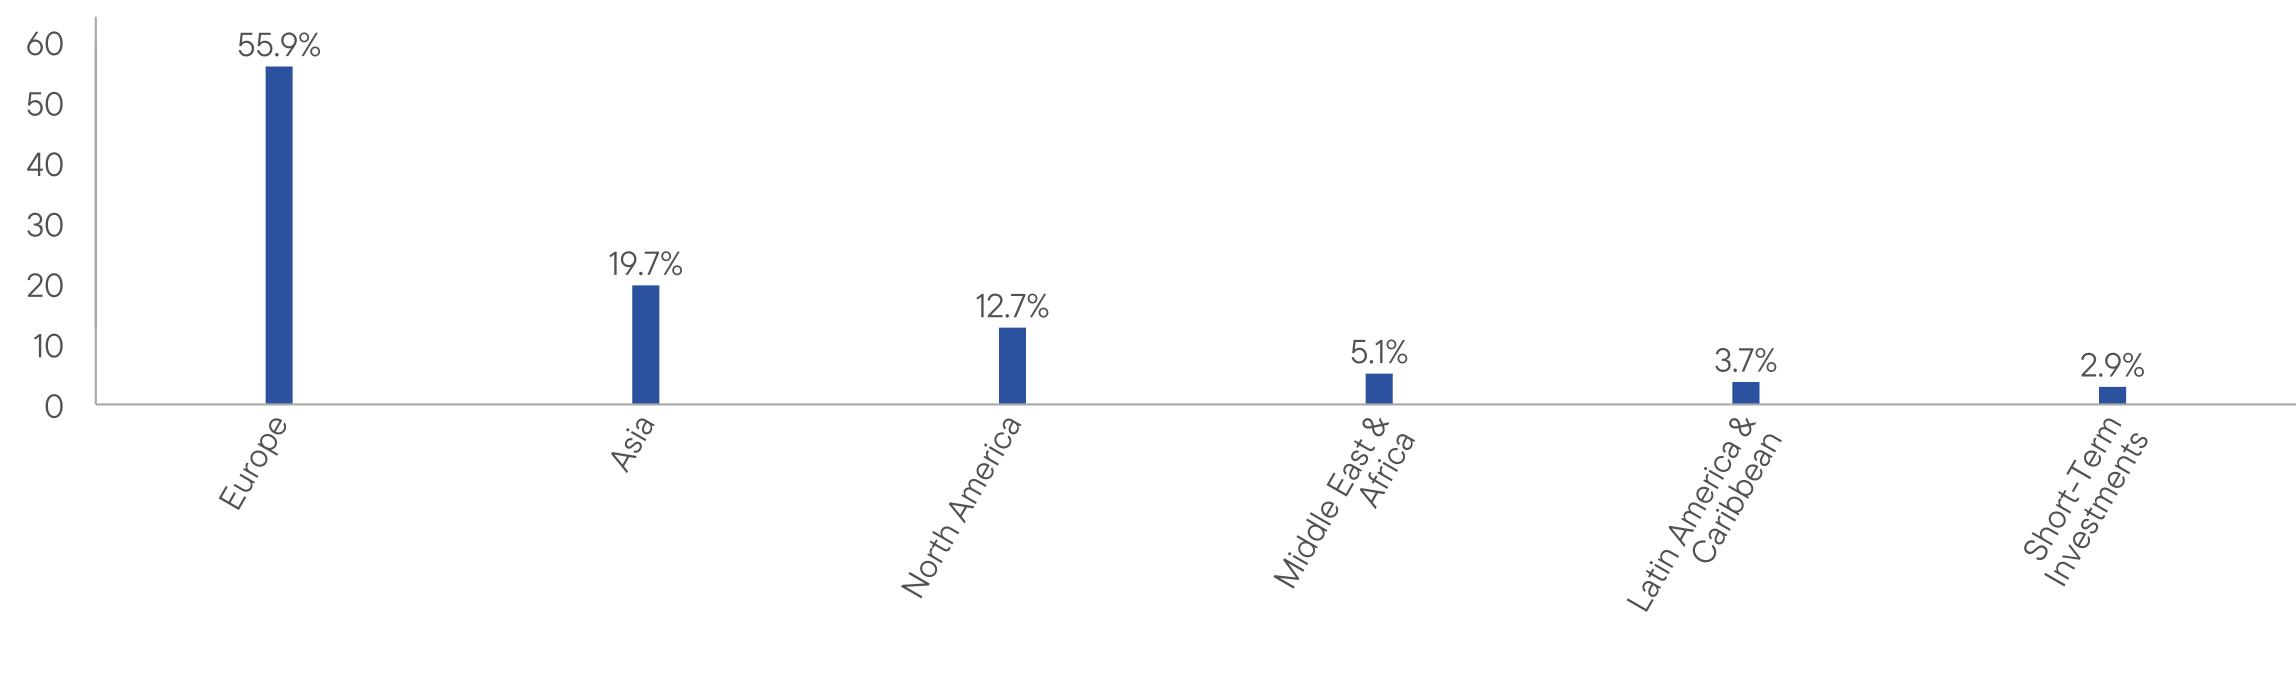
WHAT DID THE FUND INVEST IN? (as of July 31, 2026)
Portfolio Composition* (% of Total Investments)
WHAT WERE THE FUND COSTS FOR THE LAST YEAR? (based on a hypothetical $10,000 investment)
|
Class Name
|
Costs of a $10,000 investment
|
Costs paid as a percentage of a $10,000 investment*
|
|
Class C
|
$182
|
1.86%
|
HOW DID THE FUND PERFORM LAST YEAR AND WHAT AFFECTED ITS PERFORMANCE?
For the twelve months ended July 31, 2026, Class C shares of Franklin International Growth Fund returned -4.14%. The Fund compares its performance to the MSCI EAFE Index-NR, which returned 24.33% for the same period.
PERFORMANCE HIGHLIGHTS
|
Top contributors to performance:
|
|
|
↑
|
VAT Group outperformed as booming artificial intelligence (AI)-related semiconductor investment drove record demand for its vacuum valves, a critical component in advanced chip manufacturing. Investors were encouraged by surging orders, a record backlog, strong exposure to leading-edge fabs and expectations for sustained wafer-fab equipment spending into 2027.
|
|
↑
|
Nova, an Israel-based metrology solutions provider for the semiconductor industry, rose as the demand outlook remained strong for memory chips, advanced packaging, and processors to support data centers. The company’s results showed further market share gains and pointed to continued momentum.
|
|
↑
|
Inficon, a Switzerland-based provider of vacuum instrumentation for semiconductor and industrial markets, outperformed as the semiconductor upcycle accelerated, driven by AI infrastructure, leading-edge logic, and high-bandwidth memory investment. It’s stock responded positively to record orders, rapid profit growth, improving margins, and repeated upgrades to the company’s 2026 sales and earnings guidance.
|
|
Top detractors from performance:
|
|
|
↓
|
Germany-based live entertainment and ticketing services provider CTS Eventim weakened after a one-off contract loss, reiteration of conservative guidance and venue financing uncertainties clouded first-quarter earnings results. The longer-term backdrop suggests end markets continue to be strong, and the competitive environment remains stable.
|
|
↓
|
Cochlear, an Australia-based hearing implant maker, weighed on relative performance as investors digested market deterioration during the period. Checks showed implants increasingly discretionary amid macro pressure, U.S. and Middle East disruptions, tighter hospital and payer priorities, and evolving China policies.
|
|
↓
|
Interroll, a Swiss intralogistics equipment maker, curbed portfolio returns as delays in U.S. ecommerce orders weakened bookings and conversions, its European-skewed mix faced cautious sentiment and concerns increased about a vertical-conveyance acquisition.
|
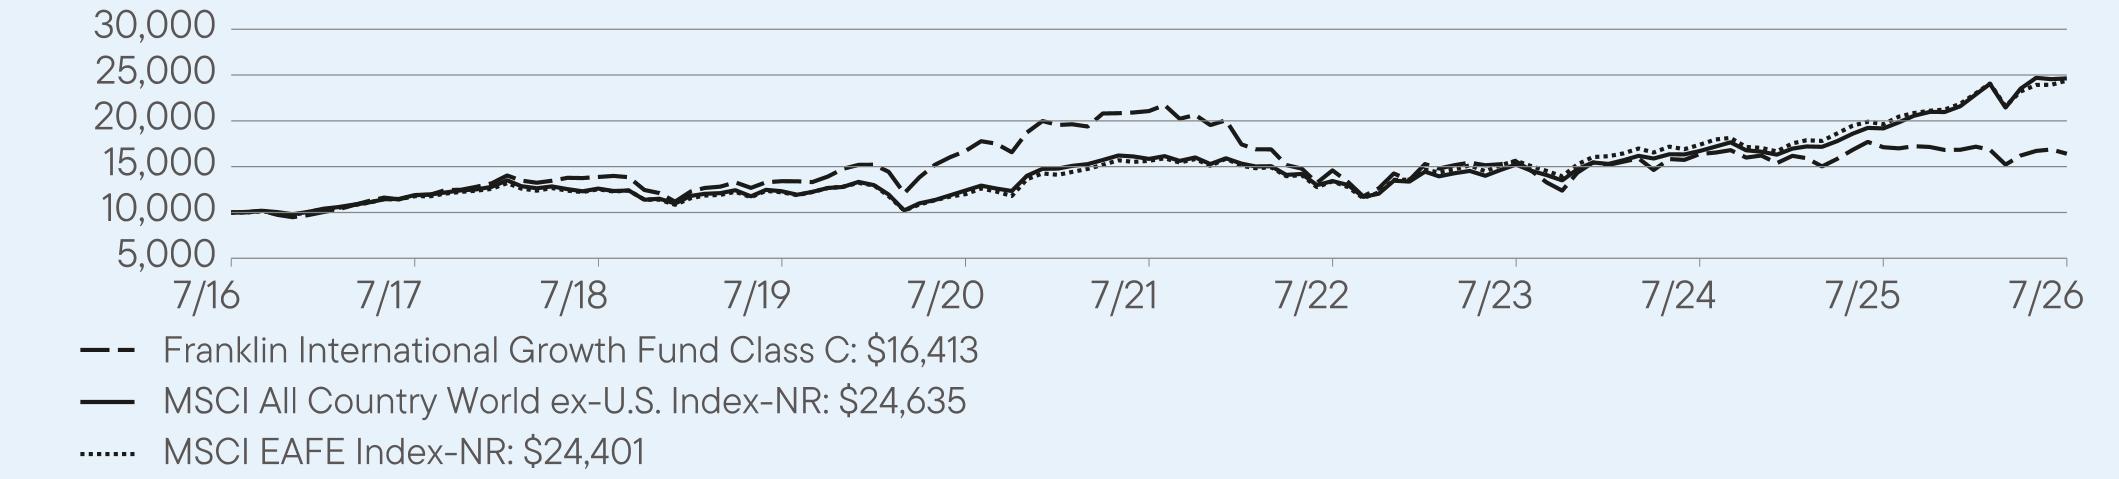
AVERAGE ANNUAL TOTAL RETURNS (%) Period Ended July 31, 2026
|
|
1 Year
|
5 Year
|
10 Year
|
|
Class C
|
-4.14
|
-4.87
|
5.08
|
|
Class C (with sales charge)
|
-5.07
|
-4.87
|
5.08
|
|
MSCI All Country World ex-U.S. Index-NR
|
28.46
|
9.22
|
9.44
|
|
MSCI EAFE Index-NR
|
24.33
|
9.31
|
9.33
|
For current month-end performance, please call Franklin Templeton at (800) DIAL BEN/342-5236 or visit
https://www.franklintempleton.com/investments/options/mutual-funds.
https://www.franklintempleton.com/investments/options/mutual-funds.
Important data provider notices and terms available at www.franklintempletondatasources.com.
KEY FUND STATISTICS (as of July 31, 2026)
|
Total Net Assets
|
$600,614,066
|
|
Total Number of Portfolio Holdings
|
34
|
|
Total Management Fee Paid
|
$4,752,321
|
|
Portfolio Turnover Rate
|
46.51%
|
WHAT DID THE FUND INVEST IN? (as of July 31, 2026)
Portfolio Composition* (% of Total Investments)
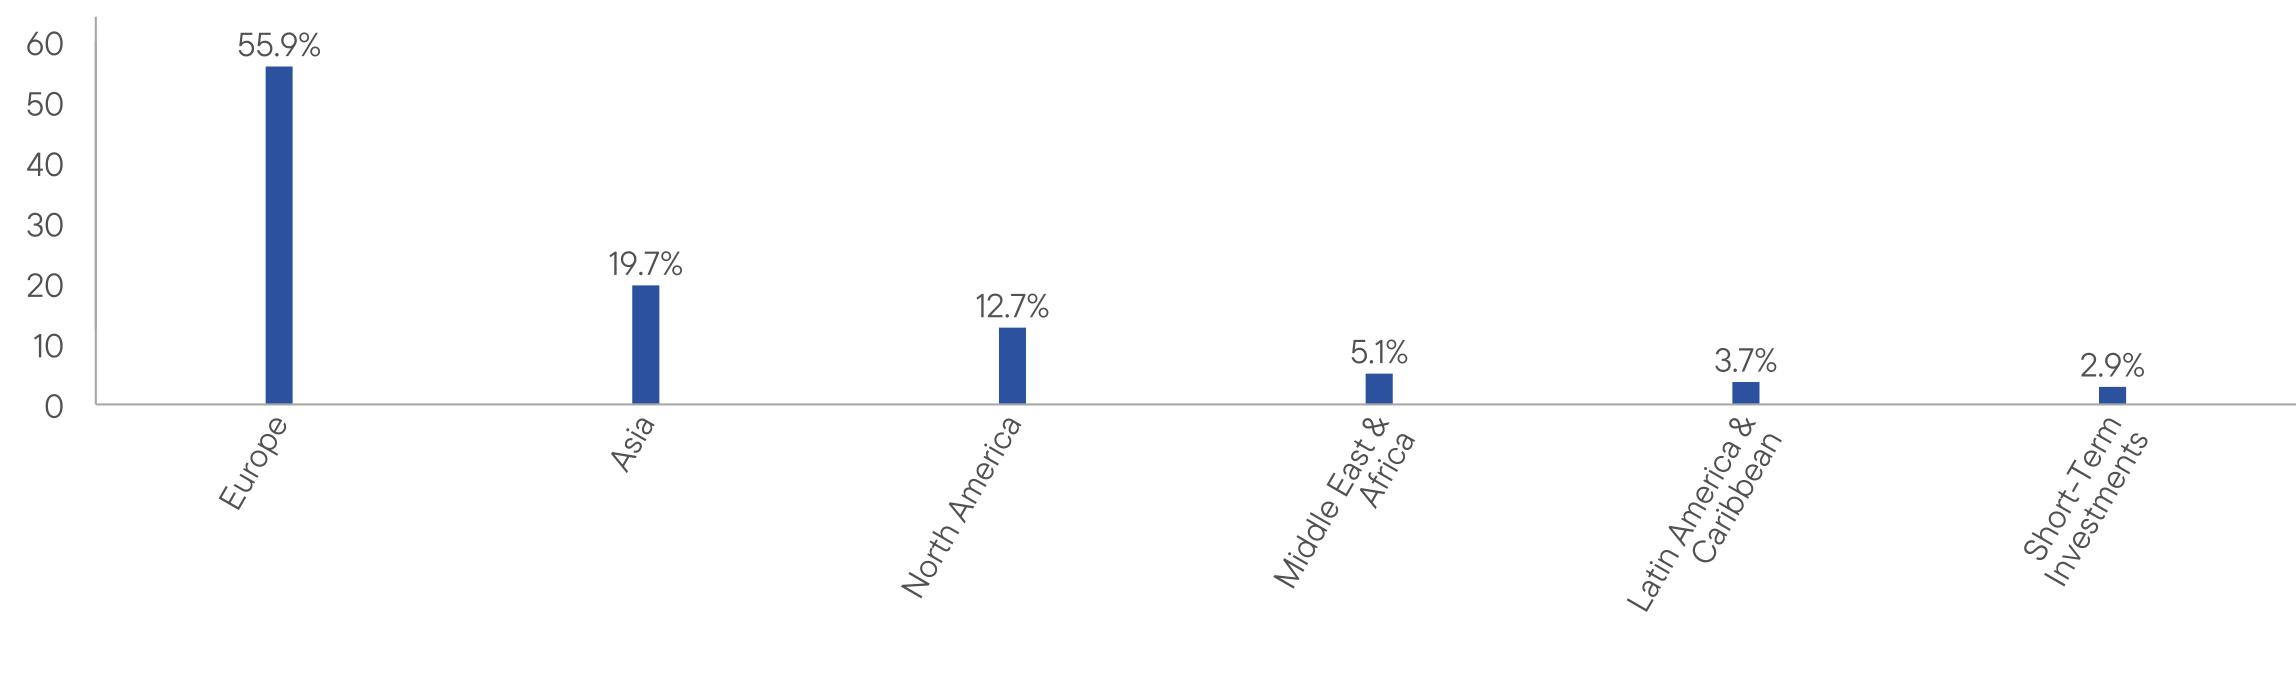
WHAT WERE THE FUND COSTS FOR THE LAST YEAR? (based on a hypothetical $10,000 investment)
|
Class Name
|
Costs of a $10,000 investment
|
Costs paid as a percentage of a $10,000 investment*
|
|
Class R
|
$134
|
1.36%
|
HOW DID THE FUND PERFORM LAST YEAR AND WHAT AFFECTED ITS PERFORMANCE?
For the twelve months ended July 31, 2026, Class R shares of Franklin International Growth Fund returned -3.67%. The Fund compares its performance to the MSCI EAFE Index-NR, which returned 24.33% for the same period.
PERFORMANCE HIGHLIGHTS
|
Top contributors to performance:
|
|
|
↑
|
VAT Group outperformed as booming artificial intelligence (AI)-related semiconductor investment drove record demand for its vacuum valves, a critical component in advanced chip manufacturing. Investors were encouraged by surging orders, a record backlog, strong exposure to leading-edge fabs and expectations for sustained wafer-fab equipment spending into 2027.
|
|
↑
|
Nova, an Israel-based metrology solutions provider for the semiconductor industry, rose as the demand outlook remained strong for memory chips, advanced packaging, and processors to support data centers. The company’s results showed further market share gains and pointed to continued momentum.
|
|
↑
|
Inficon, a Switzerland-based provider of vacuum instrumentation for semiconductor and industrial markets, outperformed as the semiconductor upcycle accelerated, driven by AI infrastructure, leading-edge logic, and high-bandwidth memory investment. It’s stock responded positively to record orders, rapid profit growth, improving margins, and repeated upgrades to the company’s 2026 sales and earnings guidance.
|
|
Top detractors from performance:
|
|
|
↓
|
Germany-based live entertainment and ticketing services provider CTS Eventim weakened after a one-off contract loss, reiteration of conservative guidance and venue financing uncertainties clouded first-quarter earnings results. The longer-term backdrop suggests end markets continue to be strong, and the competitive environment remains stable.
|
|
↓
|
Cochlear, an Australia-based hearing implant maker, weighed on relative performance as investors digested market deterioration during the period. Checks showed implants increasingly discretionary amid macro pressure, U.S. and Middle East disruptions, tighter hospital and payer priorities, and evolving China policies.
|
|
↓
|
Interroll, a Swiss intralogistics equipment maker, curbed portfolio returns as delays in U.S. ecommerce orders weakened bookings and conversions, its European-skewed mix faced cautious sentiment and concerns increased about a vertical-conveyance acquisition.
|
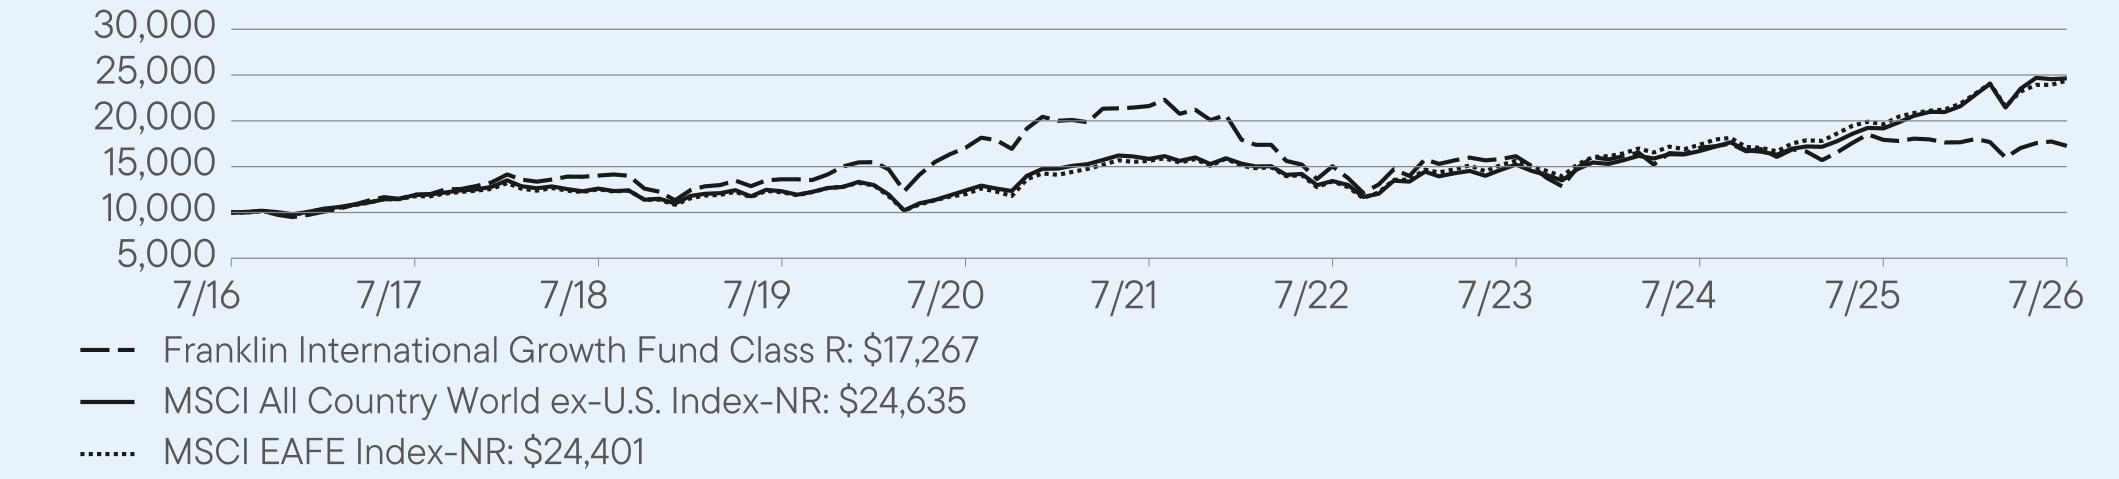
AVERAGE ANNUAL TOTAL RETURNS (%) Period Ended July 31, 2026
|
|
1 Year
|
5 Year
|
10 Year
|
|
Class R
|
-3.67
|
-4.39
|
5.61
|
|
MSCI All Country World ex-U.S. Index-NR
|
28.46
|
9.22
|
9.44
|
|
MSCI EAFE Index-NR
|
24.33
|
9.31
|
9.33
|
For current month-end performance, please call Franklin Templeton at (800) DIAL BEN/342-5236 or visit
https://www.franklintempleton.com/investments/options/mutual-funds.
https://www.franklintempleton.com/investments/options/mutual-funds.
Important data provider notices and terms available at www.franklintempletondatasources.com.
KEY FUND STATISTICS (as of July 31, 2026)
|
Total Net Assets
|
$600,614,066
|
|
Total Number of Portfolio Holdings
|
34
|
|
Total Management Fee Paid
|
$4,752,321
|
|
Portfolio Turnover Rate
|
46.51%
|
WHAT DID THE FUND INVEST IN? (as of July 31, 2026)
Portfolio Composition* (% of Total Investments)
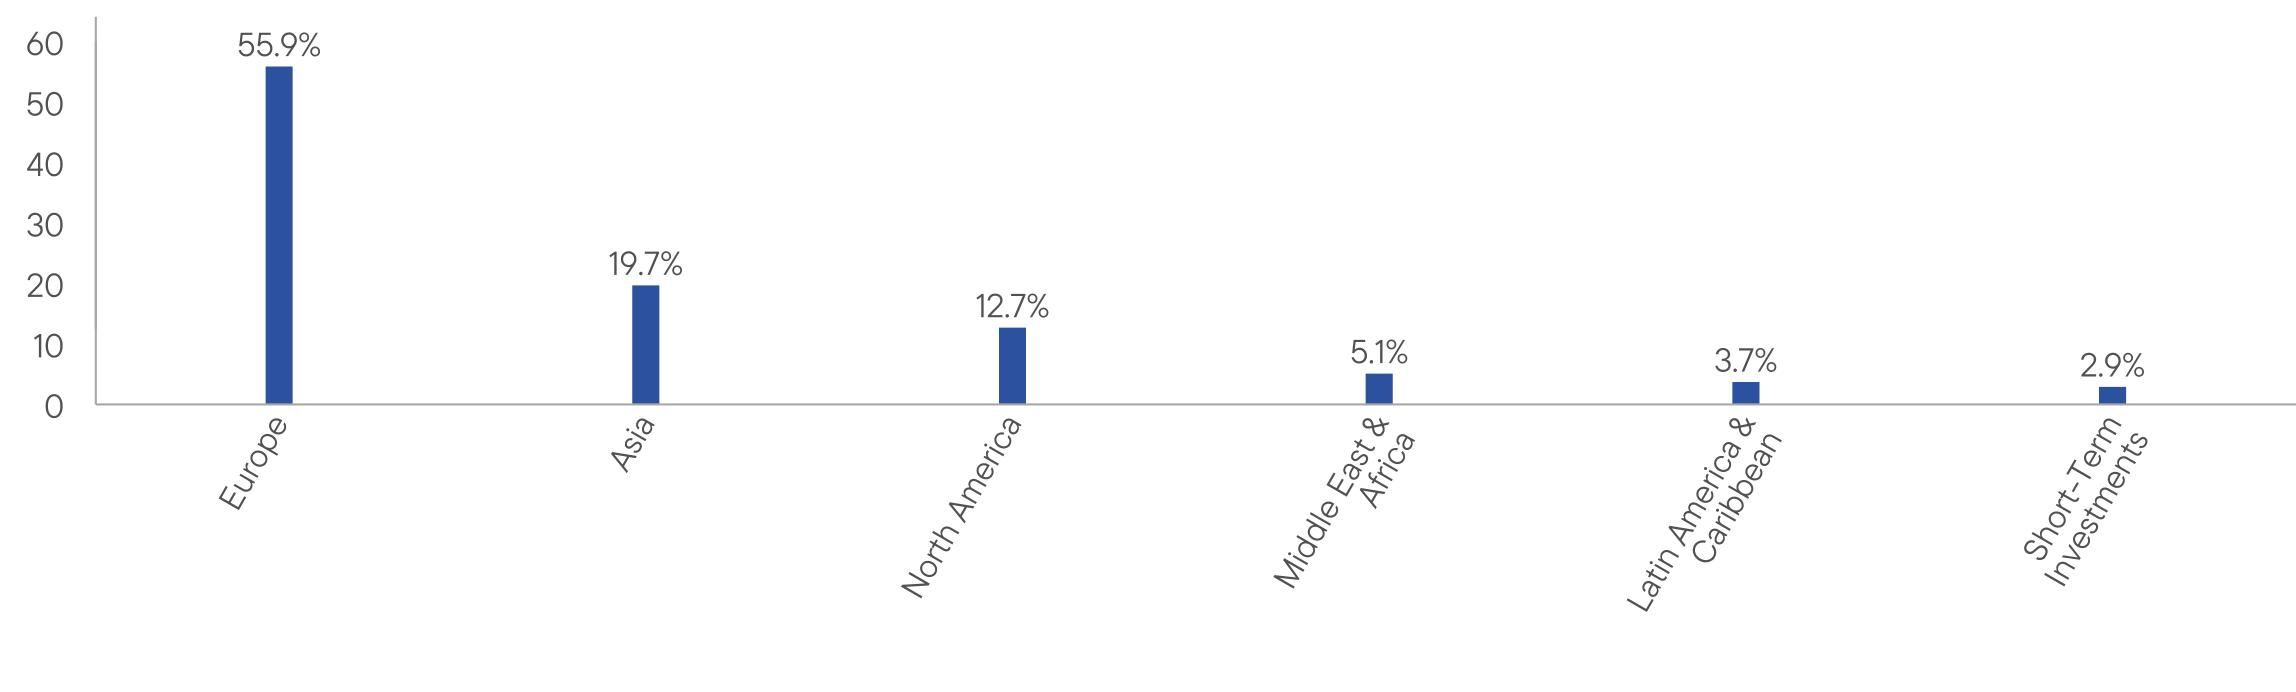
WHAT WERE THE FUND COSTS FOR THE LAST YEAR? (based on a hypothetical $10,000 investment)
|
Class Name
|
Costs of a $10,000 investment
|
Costs paid as a percentage of a $10,000 investment*
|
|
Class R6
|
$74
|
0.75%
|
HOW DID THE FUND PERFORM LAST YEAR AND WHAT AFFECTED ITS PERFORMANCE?
For the twelve months ended July 31, 2026, Class R6 shares of Franklin International Growth Fund returned -3.08%. The Fund compares its performance to the MSCI EAFE Index-NR, which returned 24.33% for the same period.
PERFORMANCE HIGHLIGHTS
|
Top contributors to performance:
|
|
|
↑
|
VAT Group outperformed as booming artificial intelligence (AI)-related semiconductor investment drove record demand for its vacuum valves, a critical component in advanced chip manufacturing. Investors were encouraged by surging orders, a record backlog, strong exposure to leading-edge fabs and expectations for sustained wafer-fab equipment spending into 2027.
|
|
↑
|
Nova, an Israel-based metrology solutions provider for the semiconductor industry, rose as the demand outlook remained strong for memory chips, advanced packaging, and processors to support data centers. The company’s results showed further market share gains and pointed to continued momentum.
|
|
↑
|
Inficon, a Switzerland-based provider of vacuum instrumentation for semiconductor and industrial markets, outperformed as the semiconductor upcycle accelerated, driven by AI infrastructure, leading-edge logic, and high-bandwidth memory investment. It’s stock responded positively to record orders, rapid profit growth, improving margins, and repeated upgrades to the company’s 2026 sales and earnings guidance.
|
|
Top detractors from performance:
|
|
|
↓
|
Germany-based live entertainment and ticketing services provider CTS Eventim weakened after a one-off contract loss, reiteration of conservative guidance and venue financing uncertainties clouded first-quarter earnings results. The longer-term backdrop suggests end markets continue to be strong, and the competitive environment remains stable.
|
|
↓
|
Cochlear, an Australia-based hearing implant maker, weighed on relative performance as investors digested market deterioration during the period. Checks showed implants increasingly discretionary amid macro pressure, U.S. and Middle East disruptions, tighter hospital and payer priorities, and evolving China policies.
|
|
↓
|
Interroll, a Swiss intralogistics equipment maker, curbed portfolio returns as delays in U.S. ecommerce orders weakened bookings and conversions, its European-skewed mix faced cautious sentiment and concerns increased about a vertical-conveyance acquisition.
|
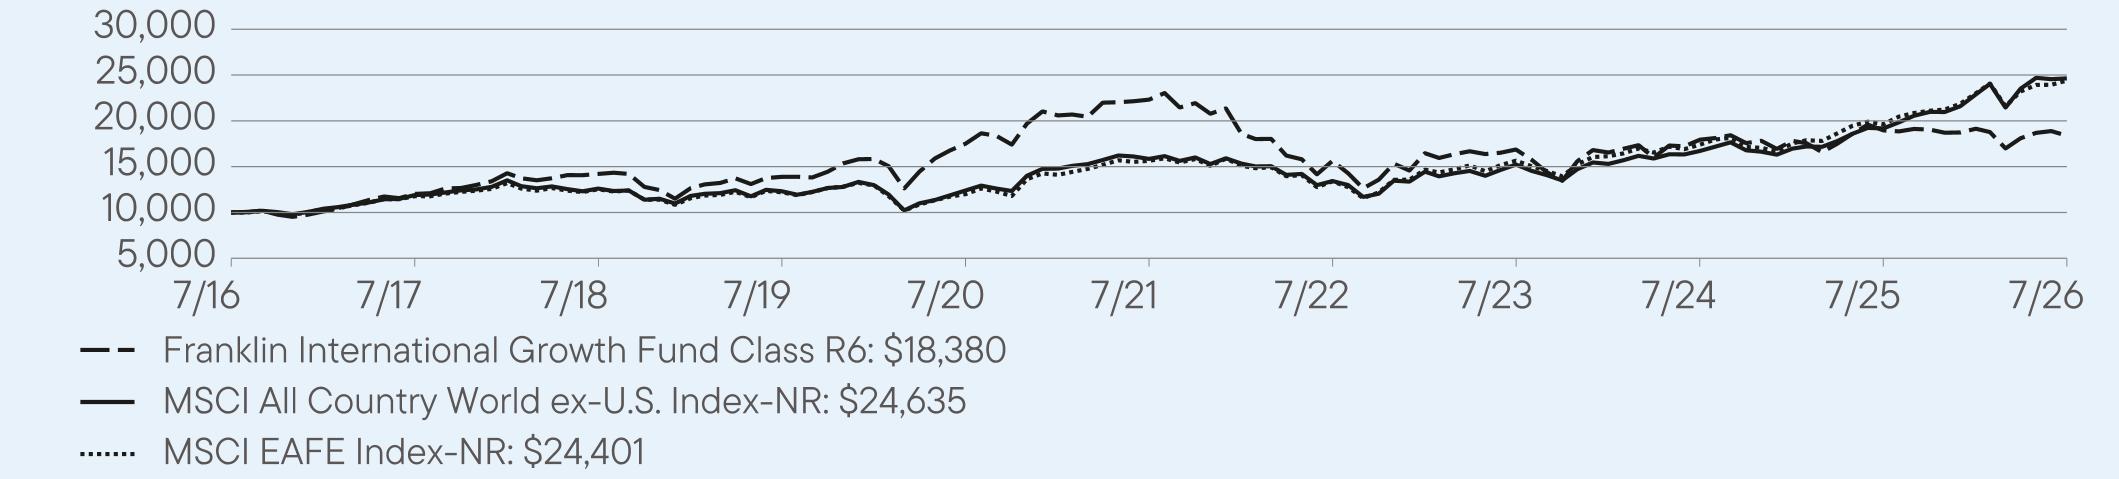
AVERAGE ANNUAL TOTAL RETURNS (%) Period Ended July 31, 2026
|
|
1 Year
|
5 Year
|
10 Year
|
|
Class R6
|
-3.08
|
-3.81
|
6.28
|
|
MSCI All Country World ex-U.S. Index-NR
|
28.46
|
9.22
|
9.44
|
|
MSCI EAFE Index-NR
|
24.33
|
9.31
|
9.33
|
For current month-end performance, please call Franklin Templeton at (800) DIAL BEN/342-5236 or visit
https://www.franklintempleton.com/investments/options/mutual-funds.
https://www.franklintempleton.com/investments/options/mutual-funds.
Important data provider notices and terms available at www.franklintempletondatasources.com.
KEY FUND STATISTICS (as of July 31, 2026)
|
Total Net Assets
|
$600,614,066
|
|
Total Number of Portfolio Holdings
|
34
|
|
Total Management Fee Paid
|
$4,752,321
|
|
Portfolio Turnover Rate
|
46.51%
|
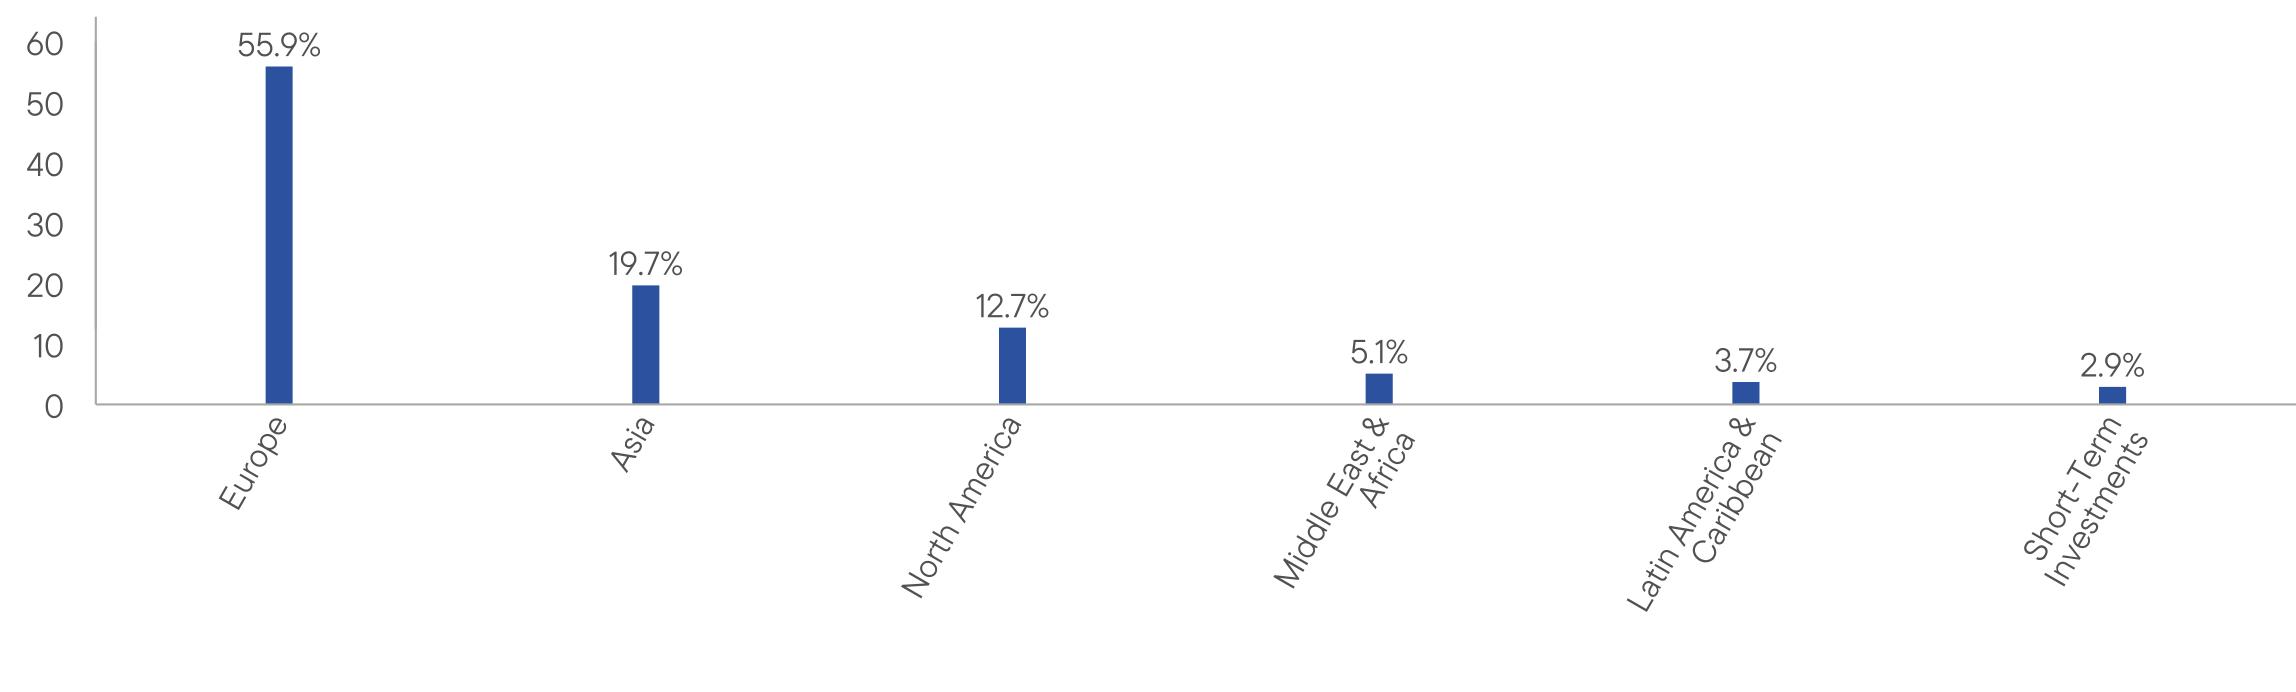
WHAT DID THE FUND INVEST IN? (as of July 31, 2026)
Portfolio Composition* (% of Total Investments)
WHAT WERE THE FUND COSTS FOR THE LAST YEAR? (based on a hypothetical $10,000 investment)
|
Class Name
|
Costs of a $10,000 investment
|
Costs paid as a percentage of a $10,000 investment*
|
|
Advisor Class
|
$85
|
0.86%
|
HOW DID THE FUND PERFORM LAST YEAR AND WHAT AFFECTED ITS PERFORMANCE?
For the twelve months ended July 31, 2026, Advisor Class shares of Franklin International Growth Fund returned -3.20%. The Fund compares its performance to the MSCI EAFE Index-NR, which returned 24.33% for the same period.
PERFORMANCE HIGHLIGHTS
|
Top contributors to performance:
|
|
|
↑
|
VAT Group outperformed as booming artificial intelligence (AI)-related semiconductor investment drove record demand for its vacuum valves, a critical component in advanced chip manufacturing. Investors were encouraged by surging orders, a record backlog, strong exposure to leading-edge fabs and expectations for sustained wafer-fab equipment spending into 2027.
|
|
↑
|
Nova, an Israel-based metrology solutions provider for the semiconductor industry, rose as the demand outlook remained strong for memory chips, advanced packaging, and processors to support data centers. The company’s results showed further market share gains and pointed to continued momentum.
|
|
↑
|
Inficon, a Switzerland-based provider of vacuum instrumentation for semiconductor and industrial markets, outperformed as the semiconductor upcycle accelerated, driven by AI infrastructure, leading-edge logic, and high-bandwidth memory investment. It’s stock responded positively to record orders, rapid profit growth, improving margins, and repeated upgrades to the company’s 2026 sales and earnings guidance.
|
|
Top detractors from performance:
|
|
|
↓
|
Germany-based live entertainment and ticketing services provider CTS Eventim weakened after a one-off contract loss, reiteration of conservative guidance and venue financing uncertainties clouded first-quarter earnings results. The longer-term backdrop suggests end markets continue to be strong, and the competitive environment remains stable.
|
|
↓
|
Cochlear, an Australia-based hearing implant maker, weighed on relative performance as investors digested market deterioration during the period. Checks showed implants increasingly discretionary amid macro pressure, U.S. and Middle East disruptions, tighter hospital and payer priorities, and evolving China policies.
|
|
↓
|
Interroll, a Swiss intralogistics equipment maker, curbed portfolio returns as delays in U.S. ecommerce orders weakened bookings and conversions, its European-skewed mix faced cautious sentiment and concerns increased about a vertical-conveyance acquisition.
|
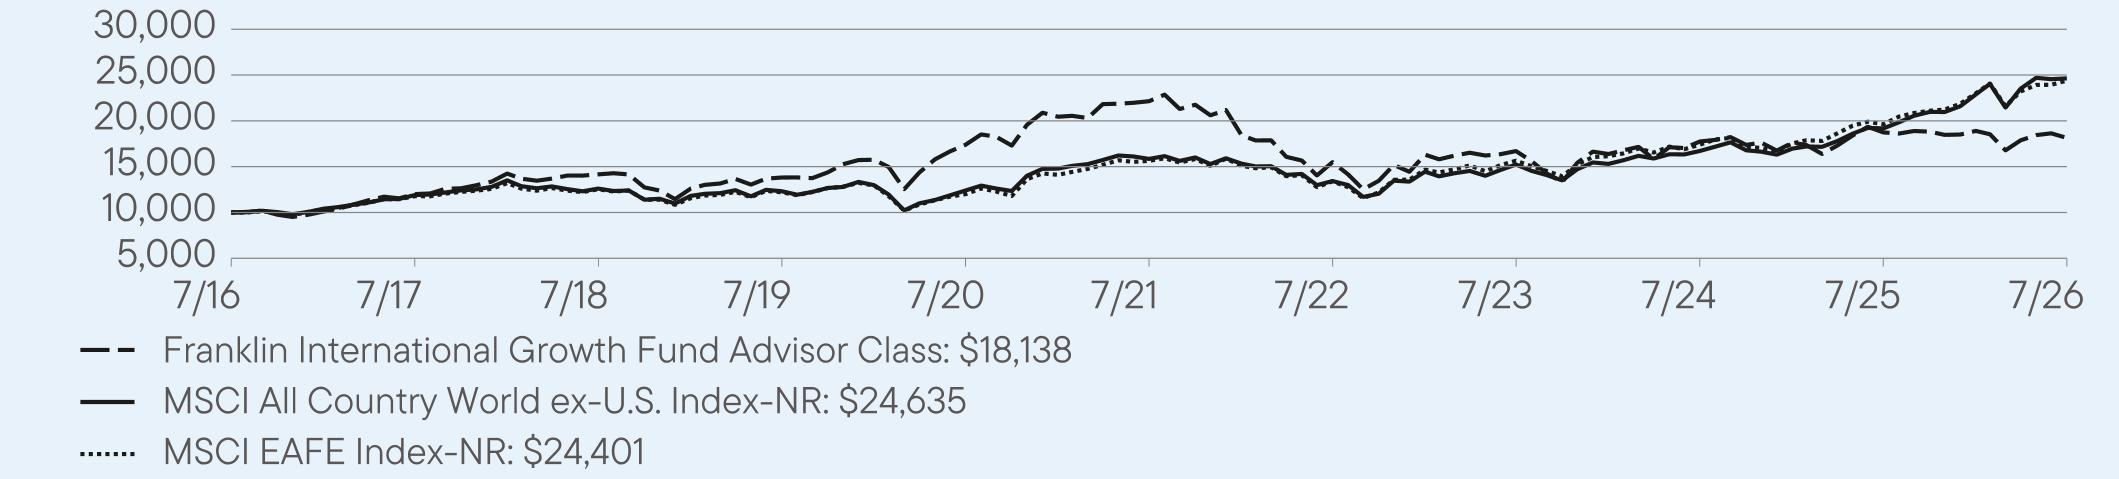
AVERAGE ANNUAL TOTAL RETURNS (%) Period Ended July 31, 2026
|
|
1 Year
|
5 Year
|
10 Year
|
|
Advisor Class
|
-3.20
|
-3.91
|
6.14
|
|
MSCI All Country World ex-U.S. Index-NR
|
28.46
|
9.22
|
9.44
|
|
MSCI EAFE Index-NR
|
24.33
|
9.31
|
9.33
|
For current month-end performance, please call Franklin Templeton at (800) DIAL BEN/342-5236 or visit
https://www.franklintempleton.com/investments/options/mutual-funds.
https://www.franklintempleton.com/investments/options/mutual-funds.
Important data provider notices and terms available at www.franklintempletondatasources.com.
KEY FUND STATISTICS (as of July 31, 2026)
|
Total Net Assets
|
$600,614,066
|
|
Total Number of Portfolio Holdings
|
34
|
|
Total Management Fee Paid
|
$4,752,321
|
|
Portfolio Turnover Rate
|
46.51%
|
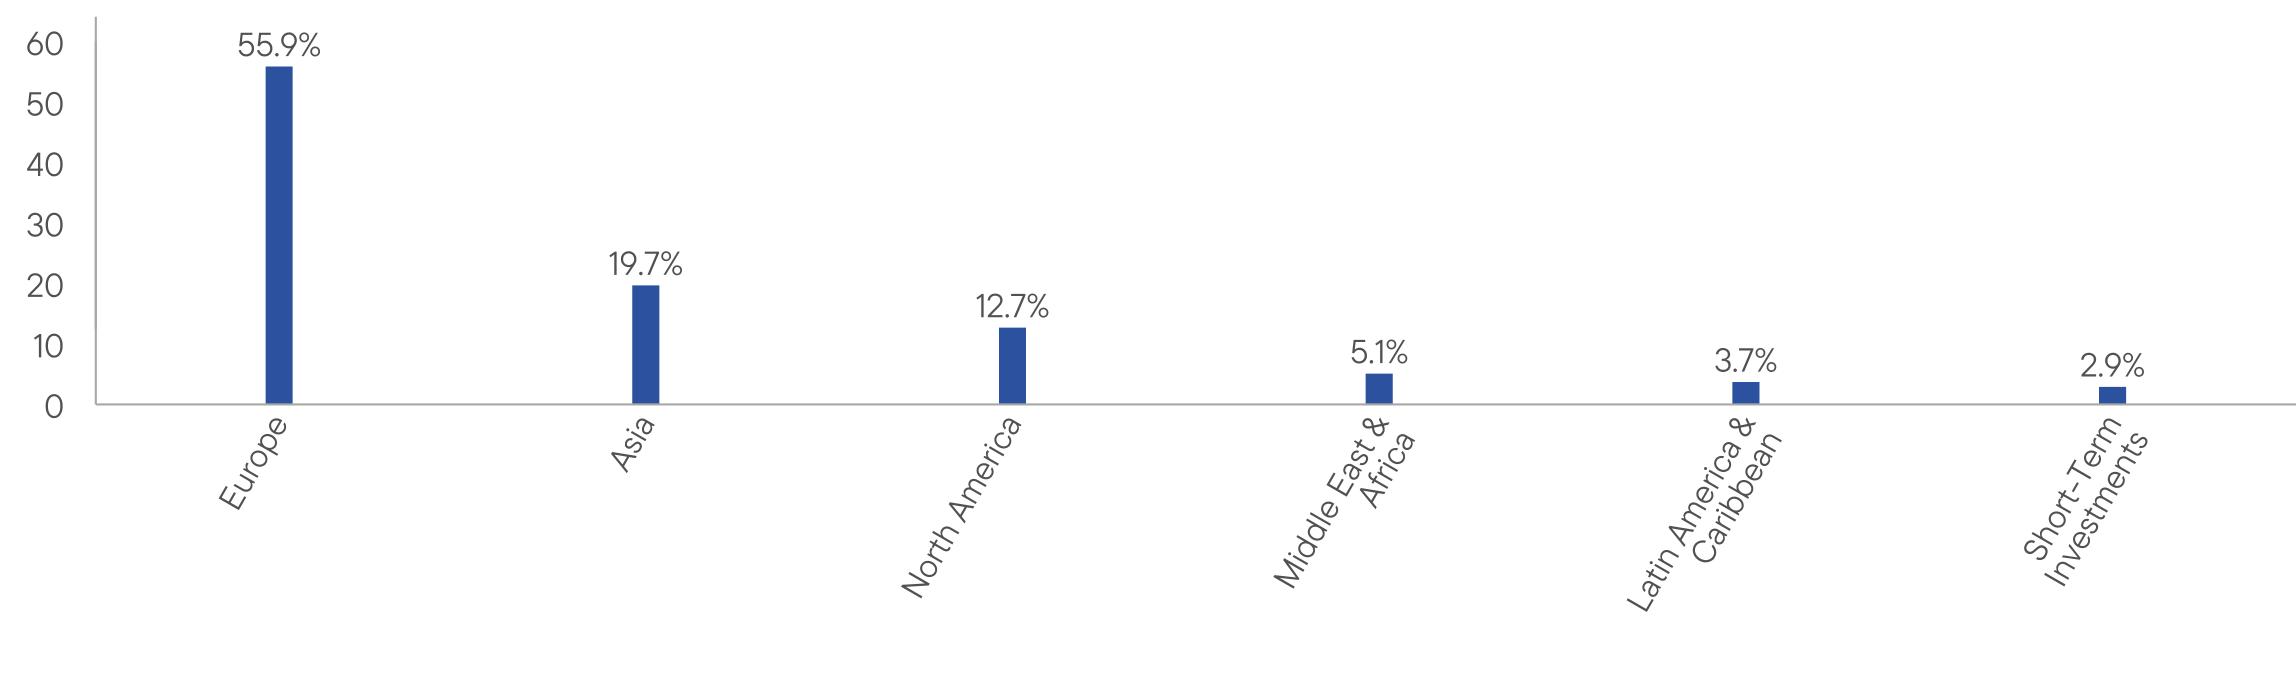
WHAT DID THE FUND INVEST IN? (as of July 31, 2026)
Portfolio Composition* (% of Total Investments)
| [1] |
|
||
| [2] |
|
||
| [3] |
|
||
| [4] |
|
||
| [5] |
|
||
| [6] |
|
||
| [7] |
|
||
| [8] |
|
||
| [9] |
|
||
| [10] |
|
||
| [11] |
|
||
| [12] |
|