The bar chart and performance table below show the variability of the Fund’s returns, which is some indication of the risks of investing in the Fund. The bar chart shows performance of the Fund’s Institutional Class shares for each full calendar year since the Fund’s inception. The performance table compares the performance of the Fund’s Institutional Class shares over time to the performance of a broad-based securities market index and a supplemental index. You should be aware that the Fund’s past performance (before and after taxes) may not be an indication of how the Fund will perform in the future. Updated performance information is available at no cost by calling 1-844-655-9371 or by visiting www.LGMCapitalmanagement.com.
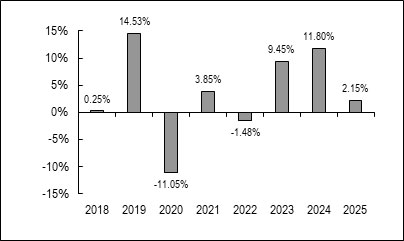
Best Quarter: |
1st Quarter 2019 | 7.51% |
| Worst Quarter: | 1st Quarter 2020 | (10.31)% |
The Fund’s Institutional Class year-to-date return as of the most recent quarter, which ended June 30, 2026, was 4.26%.
The adviser seeks to produce returns over a complete market cycle with lower volatility, or “beta” than the S&P 500 index. Volatility is a measure of how widely returns vary over a period of time. Beta is a measurement of market risk or volatility. A beta of 1 represents the volatility of the S&P 500 Index, against which other mutual funds and their betas are measured. A beta greater than 1 indicates a mutual funds tends to be more volatile than the S&P 500 Index, and a beta less than 1 means it tends to be less volatile than the S&P 500 Index.
For the year-ended June, 30, 2026, the beta of the Institutional Class was approximately 0.29 versus 1.0 for the S&P 500 Index.
Since inception (6/12/17) through June 30, 2026, the beta of the Institutional Class was approximately 0.24 versus 1.0 for the S&P 500 Index.
| One Year | Five Years | Since
Inception of the Fund (06-12-17) | |
| Institutional Class Return before taxes | 2.15% | 5.04% | 3.84% |
| Institutional Class Return after taxes on distributions | 2.00% | 4.95% | 2.98% |
| Institutional Class Return after taxes on distributions and sale of Fund shares | 1.27% | 3.90% | 2.60% |
| Index – S&P 500 Index* | 17.88% | 14.42% | 14.77% |
| Index – Bloomberg Global Aggregate Index** | 8.17% | (2.15)% | 0.71% |
| * | The S&P 500 Index is an unmanaged free-float capitalization-weighted index which measures the performance of 500 large-cap common stocks actively traded in the United States. Index returns assume reinvestment of dividends. Investors may not invest in the index directly; unlike the Fund’s returns, the index does not reflect any fees or expenses. |
| ** | The Bloomberg Global Aggregate Index is a multi-currency benchmark that includes investment grade debt from local currency markets worldwide. Index returns assume reinvestment of dividends. Investors may not invest in the index directly; unlike the Fund’s returns, the index does not reflect any fees or expenses. |
After-tax returns are calculated using the historical highest individual federal marginal income tax rates and do not reflect the impact of state and local taxes. Actual after-tax returns depend on an investor’s tax situation and may differ from those shown, and after-tax returns shown are not relevant to investors who hold their shares through tax-deferred arrangements, such as 401(k) plans or individual retirement accounts.