Pay vs Performance Disclosure - USD ($)
Jun. 30, 2026
Jun. 30, 2025
Jun. 30, 2024
Jun. 30, 2023
Jun. 30, 2022
Pay Versus Performance
Pay Versus Performance Table
The following table presents certain information regarding compensation paid to our CEO and our non-CEO NEOs, and certain measures of financial performance, for the five fiscal years ended June 30, 2026. The amounts shown below are calculated in accordance with Item 402(v) of Regulation S-K.
In this table, executive pay is presented in two ways: (1) total compensation as disclosed in the Summary Compensation Table (“SCT”) for the relevant year and (2) “compensation actually paid” for the same year. “Compensation actually paid,” calculated as required by SEC rules, reflects the adjustments to unvested and vested equity awards during the years shown in the table below, and does not reflect the actual amount of compensation earned by or paid to our CEO and our non-CEO NEOs during a relevant year. “Compensation actually paid” generally fluctuates due to increases or decreases in our stock price.
Value of Initial Fixed $100 Investment Based On: | |||||||||||||||||||||||||
Year | Summary Compensation Table Total for CEO ($)(1) | Compensation Actually Paid to CEO ($)(2) | Average Summary Compensation Table Total for non-CEO NEOs ($)(3) | Average Compensation Actually Paid to non-CEO NEOs ($)(2) | Company Total Shareholder Return ($)(4) | Peer Group Total Shareholder Return ($)(5) | Net Income/(Loss) (in thousands) ($)(6) | Adjusted Operating Income/(Loss) (in thousands) ($)(7) | |||||||||||||||||
2026 | 6,741,465 | (375,439)(8) | 1,750,126 | 478,463(8) | 130.48 | 555.03 | (2,580) | 5,521 | |||||||||||||||||
2025 | 3,069,459 | 5,451,521(9) | 1,344,893 | 1,519,008(9) | 128.67 | 275.78 | (29,462) | (31,442) | |||||||||||||||||
2024 | 4,097,287 | 6,022,997(10) | 1,333,387 | 1,855,787(10) | 94.57 | 188.79 | (24,976) | (29,562) | |||||||||||||||||
2023 | 2,401,993 | 2,020,843(11) | 842,893 | 783,207(11) | 56.10 | 134.53 | (52,361) | (37,335) | |||||||||||||||||
2022 | 3,459,103 | 278,978(12) | 1,147,962 | 329,134(12) | 48.19 | 87.88 | (63,900) | (68,894) | |||||||||||||||||
(1) | The amounts in this column are the amounts of total compensation reported for Mr. Hewitt for each corresponding year in the “Total” column of the Summary Compensation Table on page 35. |
(2) | In calculating the “compensation actually paid” (“CAP”) amounts reflected in these columns, the fair value or change in fair value, as applicable, of the equity award adjustments included in such calculations was computed in accordance with ASC718. The valuation assumptions used to calculate such fair values, such as assumed volatility and risk-free rate differ from those used at the time of grant due to the fluctuation in the stock price and the corresponding Monte Carlo Value simulations valued as of the corresponding dates in accordance with Item 402(v) of Regulation S-K. |
(3) | The amounts in this column represent the average amounts reported for our NEOs as a group (excluding Mr. Hewitt) in the “Total” column of the Summary Compensation Table in each applicable year. The names of our NEOs (excluding Mr. Hewitt) included for the purposes of calculating the average amounts in each applicable year are as follows: (i) for 2026, Ms. Austin and Messrs. Cavanah, Payne and Sheets; (ii) for 2025, Ms. Austin and Messrs. Cavanah, Montalbano, Payne, Rodgers and Updyke; (iii) for 2024, Messrs. Cavanah, Payne, Rodgers and Updyke; (iv) for 2023, Messrs. Cavanah, Payne, Rinehart, Rodgers and Updyke; and (v) for 2022, Messrs. Cavanah, Rinehart, Rodgers and Updyke. |
(4) | Our Company TSR reflected in this column for each applicable fiscal year is calculated based on a fixed investment of $100 at the applicable measurement point on the same cumulative basis as is used in Item 201(e) of Regulation S-K. |
(5) | Represents the weighted peer group TSR, weighted according to the respective company's stock market capitalization at the beginning of each period for which a return is indicated. The peer group used for this purpose is our fiscal 2024 Performance Peer Group, which included Argan Inc., Babcock and Wilcox Enterprises Inc., Concrete Pumping Holdings Inc., Dycom Industries Inc., EMCOR Group Inc., Granite Construction Inc., Great Lakes Dredge and Dock Corporation, IES Holdings Inc., KBR Inc., Limbach Holdings Inc., MasTec Inc., Mistras Group Inc., MYR Group Inc., NPK International Inc., NV5 Global Inc., NWPX Infrastructure Inc., Orion Group Holdings Inc., Primoris Services Corporation, Sterling Infrastructure Inc. and Team Inc. Our peer group changed from the prior year to continue to align with the relevant peer group for PSUs scheduled to vest in the current fiscal year. Compared to the fiscal 2024 Performance Peer Group, the prior year peer group also included AECOM and Quanta Services Inc. The weighted peer group TSR for our fiscal 2023 Performance Peer Group was $537.05 for 2026, $293.79 for 2025, $202.60 for 2024, $154.15 for 2023 and $102.42 for 2022. |
(6) | The amounts represent net income (loss) reflected in our audited GAAP financial statements for each applicable fiscal year. |
(7) | Adjusted operating income is the performance measure from the tabular list of most important measures shown on page 49, which, in our assessment, represents for fiscal 2026 the most important performance measure used to link compensation actually paid to our CEO and non-CEO NEOs to our performance. Adjusted operating income is defined in “Compensation Discussion & Analysis” - “Key Elements of Executive Compensation” - Annual/Short-Term Incentive Compensation” and is a non-GAAP financial measure. |
(8) | For fiscal 2026, the “compensation actually paid” to our CEO and the “average compensation actually paid” to our non-CEO NEOs reflect each of the following adjustments made to the total compensation amounts reported in the Summary Compensation Table for fiscal 2026, computed in accordance with Item 402(v) of Regulation S-K. |
CEO ($) | Average Non- CEO NEOs ($) | ||||||
Total Compensation Reported in 2026 SCT | 6,741,465 | 1,750,126 | |||||
Less: Grant Date Fair Value of Stock Awards Reported in the 2026 SCT | (3,981,443) | (995,235) | |||||
Plus: Year-End Fair Value of Awards Granted in 2026 that are Outstanding and Unvested | 1,155,231 | 638,074 | |||||
Plus: Change in Fair Value of Awards Granted in Prior Years that are Outstanding and Unvested | (3,957,980) | (695,203) | |||||
Plus: Vesting Date Fair Value of Awards Granted in 2026 that Vested in 2026 | — | — | |||||
Plus: Change in Fair Value of Awards Granted in Prior Years that Vested in 2026 | 385,170 | 87,377 | |||||
Less: Prior Year-End Fair Value of Awards Forfeited in 2026 | (717,882) | (306,676) | |||||
Total Adjustments | (7,116,904) | (1,271,663) | |||||
Compensation Actually Paid for Fiscal 2026 | (375,439) | 478,463 | |||||
(9) | For fiscal 2025, the “compensation actually paid” to our CEO and the “average compensation actually paid” to our non-CEO NEOs reflect each of the following adjustments made to the total compensation amounts reported in the Summary Compensation Table for fiscal 2025, computed in accordance with Item 402(v) of Regulation S-K. |
CEO ($) | Average Non- CEO NEOs ($) | ||||||
Total Compensation Reported in 2025 SCT | 3,069,459 | 1,344,893 | |||||
Less: Grant Date Fair Value of Stock Awards Reported in the 2025 SCT | (2,236,270) | (651,825) | |||||
Plus: Year-End Fair Value of Awards Granted in 2025 that are Outstanding and Unvested | 3,030,053 | 496,345 | |||||
Plus: Change in Fair Value of Awards Granted in Prior Years that are Outstanding and Unvested | 1,584,345 | 287,975 | |||||
Plus: Vesting Date Fair Value of Awards Granted in 2025 that Vested in 2025 | — | 109,891 | |||||
Plus: Change in Fair Value of Awards Granted in Prior Years that Vested in 2025 | 3,934 | 29,778 | |||||
Less: Prior Year-End Fair Value of Awards Forfeited in 2025 | — | (98,049) | |||||
Total Adjustments | 2,382,062 | 174,115 | |||||
Compensation Actually Paid for Fiscal 2025 | 5,451,521 | 1,519,008 | |||||
(10) | For fiscal year 2024, the “compensation actually paid” to our CEO and the “average compensation actually paid” to our non-CEO NEOs reflect each of the following adjustments made to the total compensation amounts reported in the Summary Compensation Table for fiscal year 2024, computed in accordance with Item 402(v) of Regulation S-K. |
CEO ($) | Average Non- CEO NEOs ($) | ||||||
Total Compensation Reported in 2024 SCT | 4,097,287 | 1,333,387 | |||||
Less: Grant Date Fair Value of Stock Awards Reported in the 2024 SCT | (3,264,777) | (860,535) | |||||
Plus: Year-End Fair Value of Awards Granted in 2024 that are Outstanding and Unvested | 3,755,118 | 996,258 | |||||
Plus: Change in Fair Value of Awards Granted in Prior Years that are Outstanding and Unvested | 1,275,932 | 333,477 | |||||
Plus: Vesting Date Fair Value of Awards Granted in 2024 that Vested in 2024 | — | — | |||||
Plus: Change in Fair Value of Awards Granted in Prior Years that Vested in 2024 | 159,437 | 53,200 | |||||
Less: Prior Year-End Fair Value of Awards Forfeited in 2024 | — | — | |||||
Total Adjustments | 1,925,710 | 522,400 | |||||
Compensation Actually Paid for Fiscal 2024 | 6,022,997 | 1,855,787 | |||||
(11) | For fiscal year 2023, the “compensation actually paid” to our CEO and the “average compensation actually paid” to our non-CEO NEOs reflect each of the following adjustments made to the total compensation amounts reported in the Summary Compensation Table for fiscal year 2023, computed in accordance with Item 402(v) of Regulation S-K. |
CEO ($) | Average Non- CEO NEOs ($) | ||||||
Total Compensation Reported in 2023 SCT | 2,401,993 | 842,893 | |||||
Less: Grant Date Fair Value of Stock Awards Reported in the 2023 SCT | (1,565,141) | (327,025) | |||||
Plus: Year-End Fair Value of Awards Granted in 2023 that are Outstanding and Unvested | 1,251,585 | 271,532 | |||||
Less: Change in Fair Value of Awards Granted in Prior Years that are Outstanding and Unvested | (108,735) | (8,994) | |||||
Plus: Vesting Date Fair Value of Awards Granted in 2023 that Vested in 2023 | — | — | |||||
Plus: Change in Fair Value of Awards Granted in Prior Years that Vested in 2023 | 41,141 | 12,179 | |||||
Less: Prior Year-End Fair Value of Awards Forfeited in 2023 | — | (7,378) | |||||
Total Adjustments | (381,150) | (59,686) | |||||
Compensation Actually Paid for Fiscal 2023 | 2,020,843 | 783,207 | |||||
(12) | For fiscal year 2022, the “compensation actually paid” to our CEO and the “average compensation actually paid” to our non-CEO NEOs reflect each of the following adjustments made to the total compensation amounts reported in the Summary Compensation Table for fiscal year 2022, computed in accordance with Item 402(v) of Regulation S-K. |
CEO ($) | Average Non- CEO NEOs ($) | ||||||
Total Compensation Reported in 2022 SCT | 3,459,103 | 1,147,962 | |||||
Less: Grant Date Fair Value of Stock Awards Reported in the 2022 SCT | (2,629,879) | (686,816) | |||||
Plus: Year-End Fair Value of Awards Granted in 2022 that are Outstanding and Unvested | 693,354 | 198,264 | |||||
Less: Change in Fair Value of Awards Granted in Prior Years that are Outstanding and Unvested | (1,272,727) | (337,568) | |||||
Plus: Vesting Date Fair Value of Awards Granted in 2022 that Vested in 2022 | — | — | |||||
Plus: Change in Fair Value of Awards Granted in Prior Years that Vested in 2022 | 29,127 | 7,292 | |||||
Less: Prior Year-End Fair Value of Awards Forfeited in 2022 | — | — | |||||
Total Adjustments | (3,180,125) | (818,828) | |||||
Compensation Actually Paid for Fiscal 2022 | 278,978 | 329,134 | |||||
(1) | The amounts in this column are the amounts of total compensation reported for Mr. Hewitt for each corresponding year in the “Total” column of the Summary Compensation Table on page 35. |
(3) | The amounts in this column represent the average amounts reported for our NEOs as a group (excluding Mr. Hewitt) in the “Total” column of the Summary Compensation Table in each applicable year. The names of our NEOs (excluding Mr. Hewitt) included for the purposes of calculating the average amounts in each applicable year are as follows: (i) for 2026, Ms. Austin and Messrs. Cavanah, Payne and Sheets; (ii) for 2025, Ms. Austin and Messrs. Cavanah, Montalbano, Payne, Rodgers and Updyke; (iii) for 2024, Messrs. Cavanah, Payne, Rodgers and Updyke; (iv) for 2023, Messrs. Cavanah, Payne, Rinehart, Rodgers and Updyke; and (v) for 2022, Messrs. Cavanah, Rinehart, Rodgers and Updyke. |
(5) | Represents the weighted peer group TSR, weighted according to the respective company's stock market capitalization at the beginning of each period for which a return is indicated. The peer group used for this purpose is our fiscal 2024 Performance Peer Group, which included Argan Inc., Babcock and Wilcox Enterprises Inc., Concrete Pumping Holdings Inc., Dycom Industries Inc., EMCOR Group Inc., Granite Construction Inc., Great Lakes Dredge and Dock Corporation, IES Holdings Inc., KBR Inc., Limbach Holdings Inc., MasTec Inc., Mistras Group Inc., MYR Group Inc., NPK International Inc., NV5 Global Inc., NWPX Infrastructure Inc., Orion Group Holdings Inc., Primoris Services Corporation, Sterling Infrastructure Inc. and Team Inc. Our peer group changed from the prior year to continue to align with the relevant peer group for PSUs scheduled to vest in the current fiscal year. Compared to the fiscal 2024 Performance Peer Group, the prior year peer group also included AECOM and Quanta Services Inc. The weighted peer group TSR for our fiscal 2023 Performance Peer Group was $537.05 for 2026, $293.79 for 2025, $202.60 for 2024, $154.15 for 2023 and $102.42 for 2022. |
(5) | Represents the weighted peer group TSR, weighted according to the respective company's stock market capitalization at the beginning of each period for which a return is indicated. The peer group used for this purpose is our fiscal 2024 Performance Peer Group, which included Argan Inc., Babcock and Wilcox Enterprises Inc., Concrete Pumping Holdings Inc., Dycom Industries Inc., EMCOR Group Inc., Granite Construction Inc., Great Lakes Dredge and Dock Corporation, IES Holdings Inc., KBR Inc., Limbach Holdings Inc., MasTec Inc., Mistras Group Inc., MYR Group Inc., NPK International Inc., NV5 Global Inc., NWPX Infrastructure Inc., Orion Group Holdings Inc., Primoris Services Corporation, Sterling Infrastructure Inc. and Team Inc. Our peer group changed from the prior year to continue to align with the relevant peer group for PSUs scheduled to vest in the current fiscal year. Compared to the fiscal 2024 Performance Peer Group, the prior year peer group also included AECOM and Quanta Services Inc. The weighted peer group TSR for our fiscal 2023 Performance Peer Group was $537.05 for 2026, $293.79 for 2025, $202.60 for 2024, $154.15 for 2023 and $102.42 for 2022. |
(8) | For fiscal 2026, the “compensation actually paid” to our CEO and the “average compensation actually paid” to our non-CEO NEOs reflect each of the following adjustments made to the total compensation amounts reported in the Summary Compensation Table for fiscal 2026, computed in accordance with Item 402(v) of Regulation S-K. |
CEO ($) | Average Non- CEO NEOs ($) | ||||||
Total Compensation Reported in 2026 SCT | 6,741,465 | 1,750,126 | |||||
Less: Grant Date Fair Value of Stock Awards Reported in the 2026 SCT | (3,981,443) | (995,235) | |||||
Plus: Year-End Fair Value of Awards Granted in 2026 that are Outstanding and Unvested | 1,155,231 | 638,074 | |||||
Plus: Change in Fair Value of Awards Granted in Prior Years that are Outstanding and Unvested | (3,957,980) | (695,203) | |||||
Plus: Vesting Date Fair Value of Awards Granted in 2026 that Vested in 2026 | — | — | |||||
Plus: Change in Fair Value of Awards Granted in Prior Years that Vested in 2026 | 385,170 | 87,377 | |||||
Less: Prior Year-End Fair Value of Awards Forfeited in 2026 | (717,882) | (306,676) | |||||
Total Adjustments | (7,116,904) | (1,271,663) | |||||
Compensation Actually Paid for Fiscal 2026 | (375,439) | 478,463 | |||||
(9) | For fiscal 2025, the “compensation actually paid” to our CEO and the “average compensation actually paid” to our non-CEO NEOs reflect each of the following adjustments made to the total compensation amounts reported in the Summary Compensation Table for fiscal 2025, computed in accordance with Item 402(v) of Regulation S-K. |
CEO ($) | Average Non- CEO NEOs ($) | ||||||
Total Compensation Reported in 2025 SCT | 3,069,459 | 1,344,893 | |||||
Less: Grant Date Fair Value of Stock Awards Reported in the 2025 SCT | (2,236,270) | (651,825) | |||||
Plus: Year-End Fair Value of Awards Granted in 2025 that are Outstanding and Unvested | 3,030,053 | 496,345 | |||||
Plus: Change in Fair Value of Awards Granted in Prior Years that are Outstanding and Unvested | 1,584,345 | 287,975 | |||||
Plus: Vesting Date Fair Value of Awards Granted in 2025 that Vested in 2025 | — | 109,891 | |||||
Plus: Change in Fair Value of Awards Granted in Prior Years that Vested in 2025 | 3,934 | 29,778 | |||||
Less: Prior Year-End Fair Value of Awards Forfeited in 2025 | — | (98,049) | |||||
Total Adjustments | 2,382,062 | 174,115 | |||||
Compensation Actually Paid for Fiscal 2025 | 5,451,521 | 1,519,008 | |||||
(10) | For fiscal year 2024, the “compensation actually paid” to our CEO and the “average compensation actually paid” to our non-CEO NEOs reflect each of the following adjustments made to the total compensation amounts reported in the Summary Compensation Table for fiscal year 2024, computed in accordance with Item 402(v) of Regulation S-K. |
CEO ($) | Average Non- CEO NEOs ($) | ||||||
Total Compensation Reported in 2024 SCT | 4,097,287 | 1,333,387 | |||||
Less: Grant Date Fair Value of Stock Awards Reported in the 2024 SCT | (3,264,777) | (860,535) | |||||
Plus: Year-End Fair Value of Awards Granted in 2024 that are Outstanding and Unvested | 3,755,118 | 996,258 | |||||
Plus: Change in Fair Value of Awards Granted in Prior Years that are Outstanding and Unvested | 1,275,932 | 333,477 | |||||
Plus: Vesting Date Fair Value of Awards Granted in 2024 that Vested in 2024 | — | — | |||||
Plus: Change in Fair Value of Awards Granted in Prior Years that Vested in 2024 | 159,437 | 53,200 | |||||
Less: Prior Year-End Fair Value of Awards Forfeited in 2024 | — | — | |||||
Total Adjustments | 1,925,710 | 522,400 | |||||
Compensation Actually Paid for Fiscal 2024 | 6,022,997 | 1,855,787 | |||||
(11) | For fiscal year 2023, the “compensation actually paid” to our CEO and the “average compensation actually paid” to our non-CEO NEOs reflect each of the following adjustments made to the total compensation amounts reported in the Summary Compensation Table for fiscal year 2023, computed in accordance with Item 402(v) of Regulation S-K. |
CEO ($) | Average Non- CEO NEOs ($) | ||||||
Total Compensation Reported in 2023 SCT | 2,401,993 | 842,893 | |||||
Less: Grant Date Fair Value of Stock Awards Reported in the 2023 SCT | (1,565,141) | (327,025) | |||||
Plus: Year-End Fair Value of Awards Granted in 2023 that are Outstanding and Unvested | 1,251,585 | 271,532 | |||||
Less: Change in Fair Value of Awards Granted in Prior Years that are Outstanding and Unvested | (108,735) | (8,994) | |||||
Plus: Vesting Date Fair Value of Awards Granted in 2023 that Vested in 2023 | — | — | |||||
Plus: Change in Fair Value of Awards Granted in Prior Years that Vested in 2023 | 41,141 | 12,179 | |||||
Less: Prior Year-End Fair Value of Awards Forfeited in 2023 | — | (7,378) | |||||
Total Adjustments | (381,150) | (59,686) | |||||
Compensation Actually Paid for Fiscal 2023 | 2,020,843 | 783,207 | |||||
(12) | For fiscal year 2022, the “compensation actually paid” to our CEO and the “average compensation actually paid” to our non-CEO NEOs reflect each of the following adjustments made to the total compensation amounts reported in the Summary Compensation Table for fiscal year 2022, computed in accordance with Item 402(v) of Regulation S-K. |
CEO ($) | Average Non- CEO NEOs ($) | ||||||
Total Compensation Reported in 2022 SCT | 3,459,103 | 1,147,962 | |||||
Less: Grant Date Fair Value of Stock Awards Reported in the 2022 SCT | (2,629,879) | (686,816) | |||||
Plus: Year-End Fair Value of Awards Granted in 2022 that are Outstanding and Unvested | 693,354 | 198,264 | |||||
Less: Change in Fair Value of Awards Granted in Prior Years that are Outstanding and Unvested | (1,272,727) | (337,568) | |||||
Plus: Vesting Date Fair Value of Awards Granted in 2022 that Vested in 2022 | — | — | |||||
Plus: Change in Fair Value of Awards Granted in Prior Years that Vested in 2022 | 29,127 | 7,292 | |||||
Less: Prior Year-End Fair Value of Awards Forfeited in 2022 | — | — | |||||
Total Adjustments | (3,180,125) | (818,828) | |||||
Compensation Actually Paid for Fiscal 2022 | 278,978 | 329,134 | |||||
(8) | For fiscal 2026, the “compensation actually paid” to our CEO and the “average compensation actually paid” to our non-CEO NEOs reflect each of the following adjustments made to the total compensation amounts reported in the Summary Compensation Table for fiscal 2026, computed in accordance with Item 402(v) of Regulation S-K. |
CEO ($) | Average Non- CEO NEOs ($) | ||||||
Total Compensation Reported in 2026 SCT | 6,741,465 | 1,750,126 | |||||
Less: Grant Date Fair Value of Stock Awards Reported in the 2026 SCT | (3,981,443) | (995,235) | |||||
Plus: Year-End Fair Value of Awards Granted in 2026 that are Outstanding and Unvested | 1,155,231 | 638,074 | |||||
Plus: Change in Fair Value of Awards Granted in Prior Years that are Outstanding and Unvested | (3,957,980) | (695,203) | |||||
Plus: Vesting Date Fair Value of Awards Granted in 2026 that Vested in 2026 | — | — | |||||
Plus: Change in Fair Value of Awards Granted in Prior Years that Vested in 2026 | 385,170 | 87,377 | |||||
Less: Prior Year-End Fair Value of Awards Forfeited in 2026 | (717,882) | (306,676) | |||||
Total Adjustments | (7,116,904) | (1,271,663) | |||||
Compensation Actually Paid for Fiscal 2026 | (375,439) | 478,463 | |||||
(9) | For fiscal 2025, the “compensation actually paid” to our CEO and the “average compensation actually paid” to our non-CEO NEOs reflect each of the following adjustments made to the total compensation amounts reported in the Summary Compensation Table for fiscal 2025, computed in accordance with Item 402(v) of Regulation S-K. |
CEO ($) | Average Non- CEO NEOs ($) | ||||||
Total Compensation Reported in 2025 SCT | 3,069,459 | 1,344,893 | |||||
Less: Grant Date Fair Value of Stock Awards Reported in the 2025 SCT | (2,236,270) | (651,825) | |||||
Plus: Year-End Fair Value of Awards Granted in 2025 that are Outstanding and Unvested | 3,030,053 | 496,345 | |||||
Plus: Change in Fair Value of Awards Granted in Prior Years that are Outstanding and Unvested | 1,584,345 | 287,975 | |||||
Plus: Vesting Date Fair Value of Awards Granted in 2025 that Vested in 2025 | — | 109,891 | |||||
Plus: Change in Fair Value of Awards Granted in Prior Years that Vested in 2025 | 3,934 | 29,778 | |||||
Less: Prior Year-End Fair Value of Awards Forfeited in 2025 | — | (98,049) | |||||
Total Adjustments | 2,382,062 | 174,115 | |||||
Compensation Actually Paid for Fiscal 2025 | 5,451,521 | 1,519,008 | |||||
(10) | For fiscal year 2024, the “compensation actually paid” to our CEO and the “average compensation actually paid” to our non-CEO NEOs reflect each of the following adjustments made to the total compensation amounts reported in the Summary Compensation Table for fiscal year 2024, computed in accordance with Item 402(v) of Regulation S-K. |
CEO ($) | Average Non- CEO NEOs ($) | ||||||
Total Compensation Reported in 2024 SCT | 4,097,287 | 1,333,387 | |||||
Less: Grant Date Fair Value of Stock Awards Reported in the 2024 SCT | (3,264,777) | (860,535) | |||||
Plus: Year-End Fair Value of Awards Granted in 2024 that are Outstanding and Unvested | 3,755,118 | 996,258 | |||||
Plus: Change in Fair Value of Awards Granted in Prior Years that are Outstanding and Unvested | 1,275,932 | 333,477 | |||||
Plus: Vesting Date Fair Value of Awards Granted in 2024 that Vested in 2024 | — | — | |||||
Plus: Change in Fair Value of Awards Granted in Prior Years that Vested in 2024 | 159,437 | 53,200 | |||||
Less: Prior Year-End Fair Value of Awards Forfeited in 2024 | — | — | |||||
Total Adjustments | 1,925,710 | 522,400 | |||||
Compensation Actually Paid for Fiscal 2024 | 6,022,997 | 1,855,787 | |||||
(11) | For fiscal year 2023, the “compensation actually paid” to our CEO and the “average compensation actually paid” to our non-CEO NEOs reflect each of the following adjustments made to the total compensation amounts reported in the Summary Compensation Table for fiscal year 2023, computed in accordance with Item 402(v) of Regulation S-K. |
CEO ($) | Average Non- CEO NEOs ($) | ||||||
Total Compensation Reported in 2023 SCT | 2,401,993 | 842,893 | |||||
Less: Grant Date Fair Value of Stock Awards Reported in the 2023 SCT | (1,565,141) | (327,025) | |||||
Plus: Year-End Fair Value of Awards Granted in 2023 that are Outstanding and Unvested | 1,251,585 | 271,532 | |||||
Less: Change in Fair Value of Awards Granted in Prior Years that are Outstanding and Unvested | (108,735) | (8,994) | |||||
Plus: Vesting Date Fair Value of Awards Granted in 2023 that Vested in 2023 | — | — | |||||
Plus: Change in Fair Value of Awards Granted in Prior Years that Vested in 2023 | 41,141 | 12,179 | |||||
Less: Prior Year-End Fair Value of Awards Forfeited in 2023 | — | (7,378) | |||||
Total Adjustments | (381,150) | (59,686) | |||||
Compensation Actually Paid for Fiscal 2023 | 2,020,843 | 783,207 | |||||
(12) | For fiscal year 2022, the “compensation actually paid” to our CEO and the “average compensation actually paid” to our non-CEO NEOs reflect each of the following adjustments made to the total compensation amounts reported in the Summary Compensation Table for fiscal year 2022, computed in accordance with Item 402(v) of Regulation S-K. |
CEO ($) | Average Non- CEO NEOs ($) | ||||||
Total Compensation Reported in 2022 SCT | 3,459,103 | 1,147,962 | |||||
Less: Grant Date Fair Value of Stock Awards Reported in the 2022 SCT | (2,629,879) | (686,816) | |||||
Plus: Year-End Fair Value of Awards Granted in 2022 that are Outstanding and Unvested | 693,354 | 198,264 | |||||
Less: Change in Fair Value of Awards Granted in Prior Years that are Outstanding and Unvested | (1,272,727) | (337,568) | |||||
Plus: Vesting Date Fair Value of Awards Granted in 2022 that Vested in 2022 | — | — | |||||
Plus: Change in Fair Value of Awards Granted in Prior Years that Vested in 2022 | 29,127 | 7,292 | |||||
Less: Prior Year-End Fair Value of Awards Forfeited in 2022 | — | — | |||||
Total Adjustments | (3,180,125) | (818,828) | |||||
Compensation Actually Paid for Fiscal 2022 | 278,978 | 329,134 | |||||
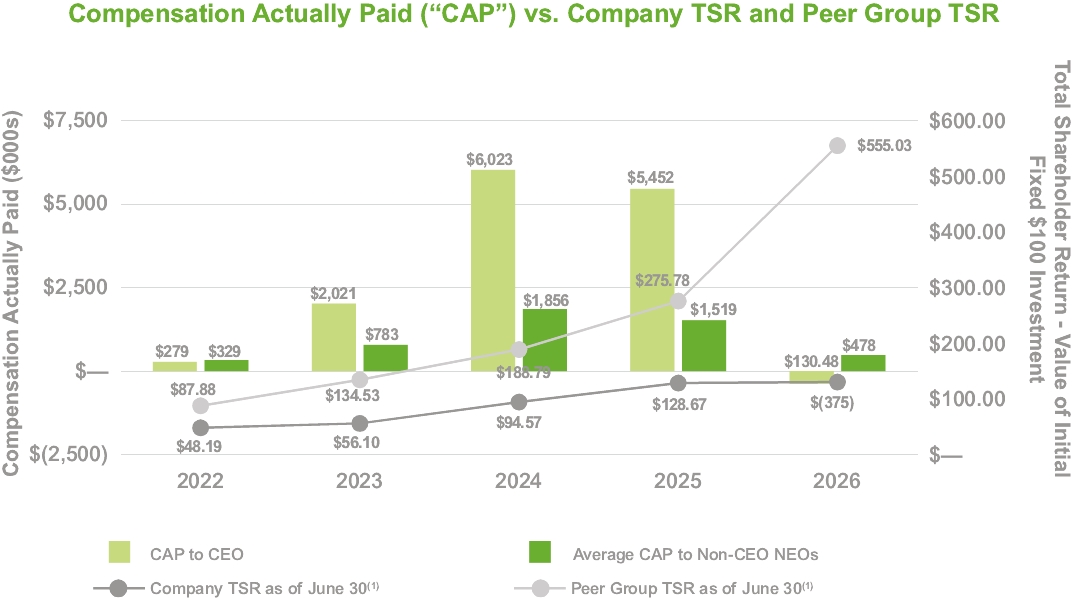
(1) | Cumulative TSR is calculated based on the value of an initial fixed investment of $100 on June 30, 2021. |
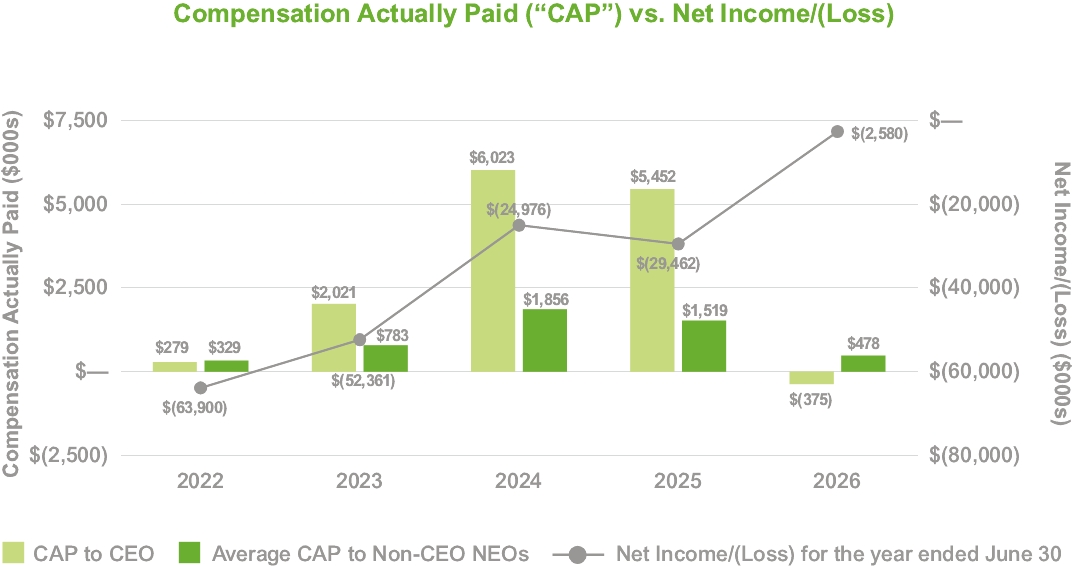
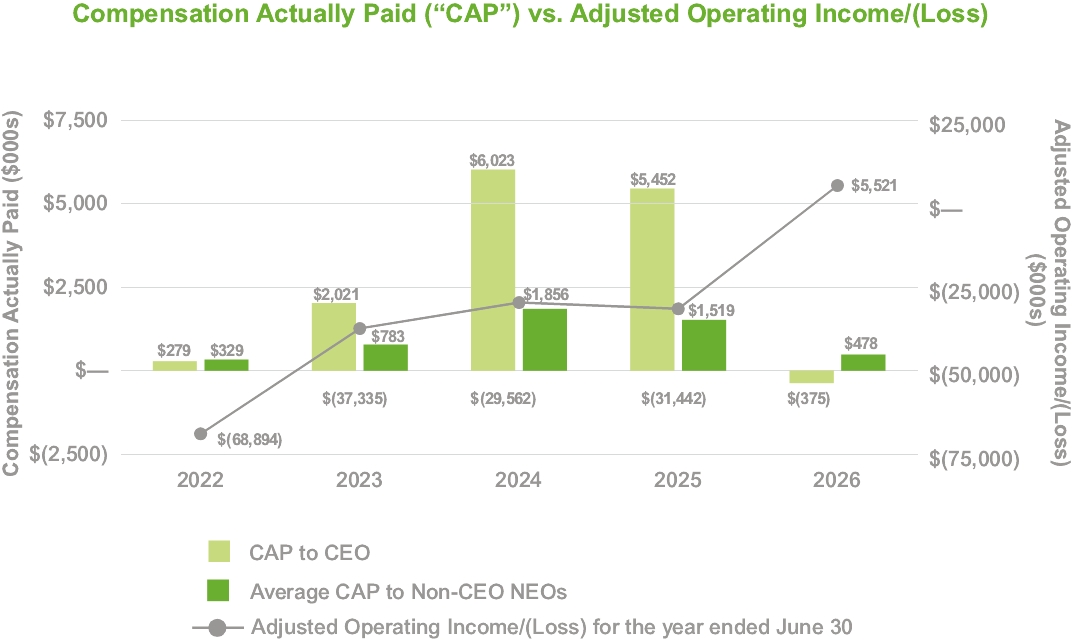
(1) | Cumulative TSR is calculated based on the value of an initial fixed investment of $100 on June 30, 2021. |
Tabular List of Company Performance Measures
The following table lists the performance measures that we believe represent the most important performance measures used to link compensation actually paid to our CEO and non-CEOs for fiscal 2026 to our performance:
Adjusted Operating Income |
Relative Total Shareholder Return |
Safety Performance |
(7) | Adjusted operating income is the performance measure from the tabular list of most important measures shown on page 49, which, in our assessment, represents for fiscal 2026 the most important performance measure used to link compensation actually paid to our CEO and non-CEO NEOs to our performance. Adjusted operating income is defined in “Compensation Discussion & Analysis” - “Key Elements of Executive Compensation” - Annual/Short-Term Incentive Compensation” and is a non-GAAP financial measure. |