
Sept. 2026 Conference Presentation
Forward-Looking Statements The information in this presentation highlights the key growth strategies, projections and certain assumptions for the company and its subsidiaries. Many of these highlighted statements and other statements not historical in nature are “forward-looking statements” within the meaning of Section 21E of the Securities Exchange Act of 1934, as amended. Forward-looking statements are generally identified with words like “believe,” “expect,” “target,” “project,” “may,” “could,” “would,” “approximately,” “possible,” “will,” “should,” “intend,” “plan,” “anticipate,” “commit,” "confident," “estimate,” “potential,” “ambitions,” “outlook,” or “continue,” the negative of these words, other terms of similar meaning or the use of future dates. Although the company believes that its expectations are expressed in good faith and based on reasonable assumptions, there is no assurance the company’s statements with respect to its EDGE initiatives, shareholder value creation, near-term market dynamics, expected long-term goals, expected backlog margin, acquisitions, financing plans, expected federal and state funding for infrastructure or other proposed strategies will be achieved. Please refer to assumptions contained in this presentation, as well as the various important factors listed in Part I, Item 1A - Risk Factors in the company’s most recent Form 10- K and subsequent filings with the Securities and Exchange Commission (SEC). Changes in such assumptions and factors could cause actual future results to differ materially from those expressed in the forward-looking statements. All forward-looking statements in this presentation are expressly qualified by such cautionary statements and by reference to the underlying assumptions. Undue reliance should not be placed on forward-looking statements, which speak only as of the date they are made. Except as required by law, the company does not undertake to update forward-looking statements, whether as a result of new information, future events or otherwise. Throughout this presentation, the company presents financial information prepared in accordance with GAAP, as well as EBITDA, EBITDA margin, Adjusted EBITDA, Adjusted EBITDA margin, as well as total segment measures, as applicable, which are considered non-GAAP financial measures. The use of these non-GAAP financial measures should not be construed as alternatives to net income (loss), net income (loss) margin, operating income (loss) or total debt, as applicable. Please refer to the "Non-GAAP Financial Measures" section contained in this document and our most recent filings with the SEC for additional information.
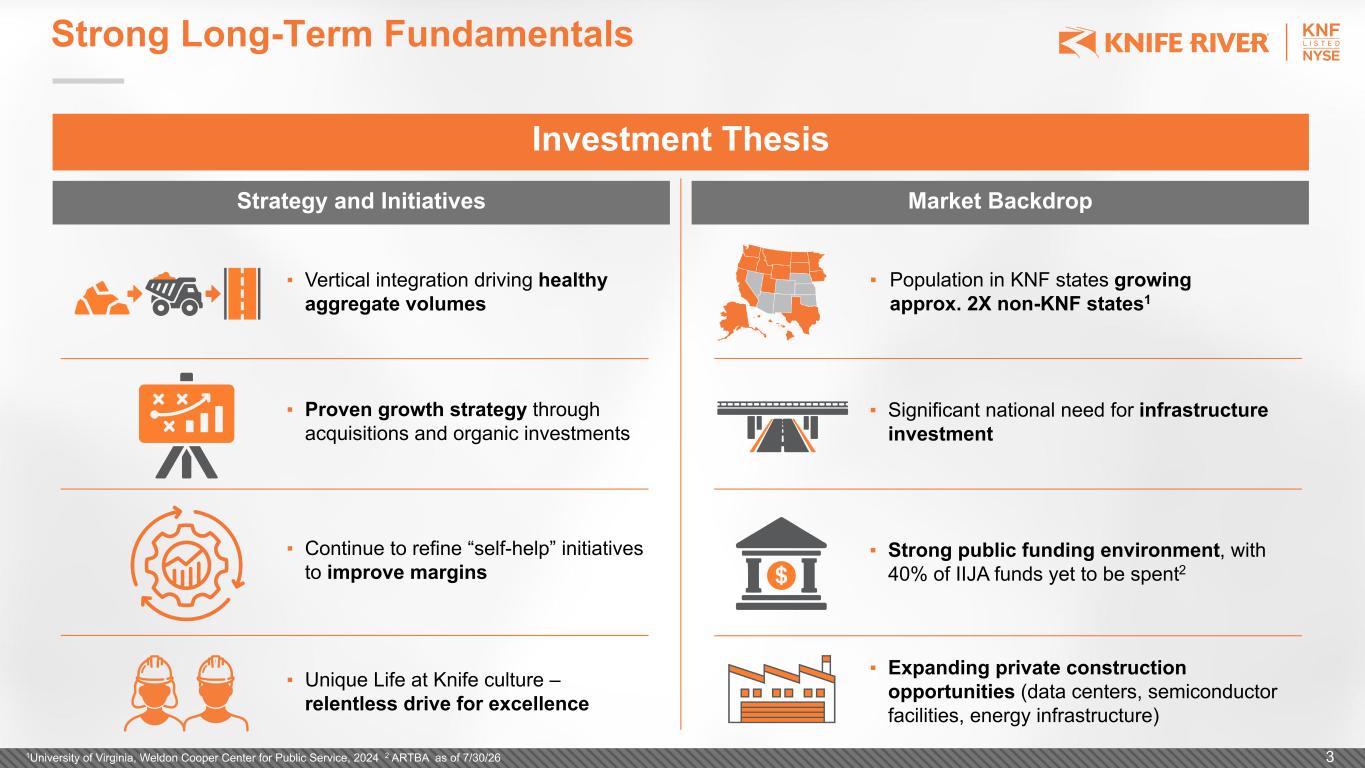
Strong Long-Term Fundamentals Investment Thesis ▪ Vertical integration driving healthy aggregate volumes ▪ Proven growth strategy through acquisitions and organic investments ▪ Continue to refine “self-help” initiatives to improve margins ▪ Unique Life at Knife culture – relentless drive for excellence ▪ Population in KNF states growing approx. 2X non-KNF states1 ▪ Significant national need for infrastructure investment ▪ Strong public funding environment, with 40% of IIJA funds yet to be spent2 ▪ Expanding private construction opportunities (data centers, semiconductor facilities, energy infrastructure) 1University of Virginia, Weldon Cooper Center for Public Service, 2024 2 ARTBA as of 7/30/26 3 Market BackdropStrategy and Initiatives
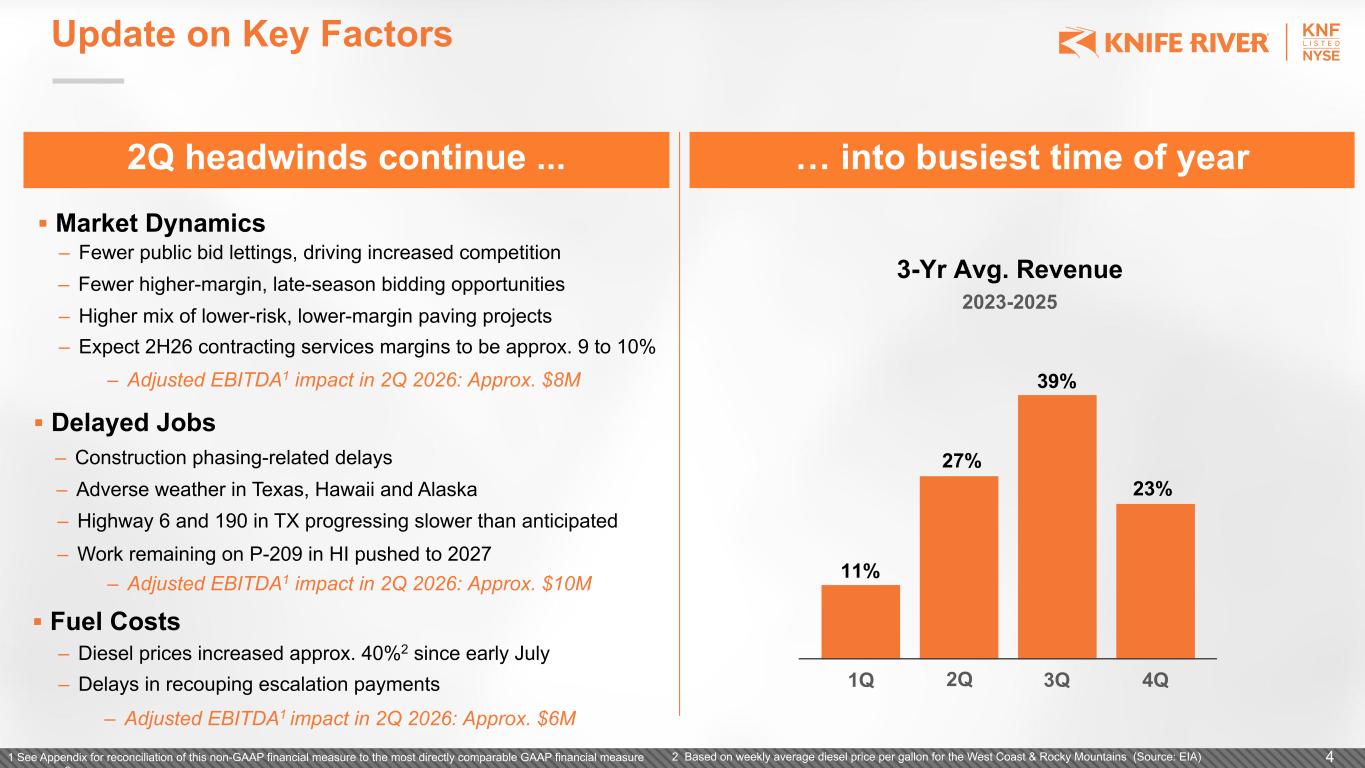
Update on Key Factors 2Q headwinds continue ... … into busiest time of year 3-Yr Avg. Revenue 2023-2025 1Q 2Q 3Q 4Q 11% 27% 39% 23% – Fewer public bid lettings, driving increased competition ▪ Market Dynamics – Expect 2H26 contracting services margins to be approx. 9 to 10% – Construction phasing-related delays ▪ Delayed Jobs – Highway 6 and 190 in TX progressing slower than anticipated – Adverse weather in Texas, Hawaii and Alaska ▪ Fuel Costs – Adjusted EBITDA1 impact in 2Q 2026: Approx. $8M – Adjusted EBITDA1 impact in 2Q 2026: Approx. $10M – Diesel prices increased approx. 40%2 since early July – Delays in recouping escalation payments – Adjusted EBITDA1 impact in 2Q 2026: Approx. $6M – Fewer higher-margin, late-season bidding opportunities – Higher mix of lower-risk, lower-margin paving projects – Work remaining on P-209 in HI pushed to 2027 2 Based on weekly average diesel price per gallon for the West Coast & Rocky Mountains (Source: EIA) 41 See Appendix for reconciliation of this non-GAAP financial measure to the most directly comparable GAAP financial measure measure. . 2
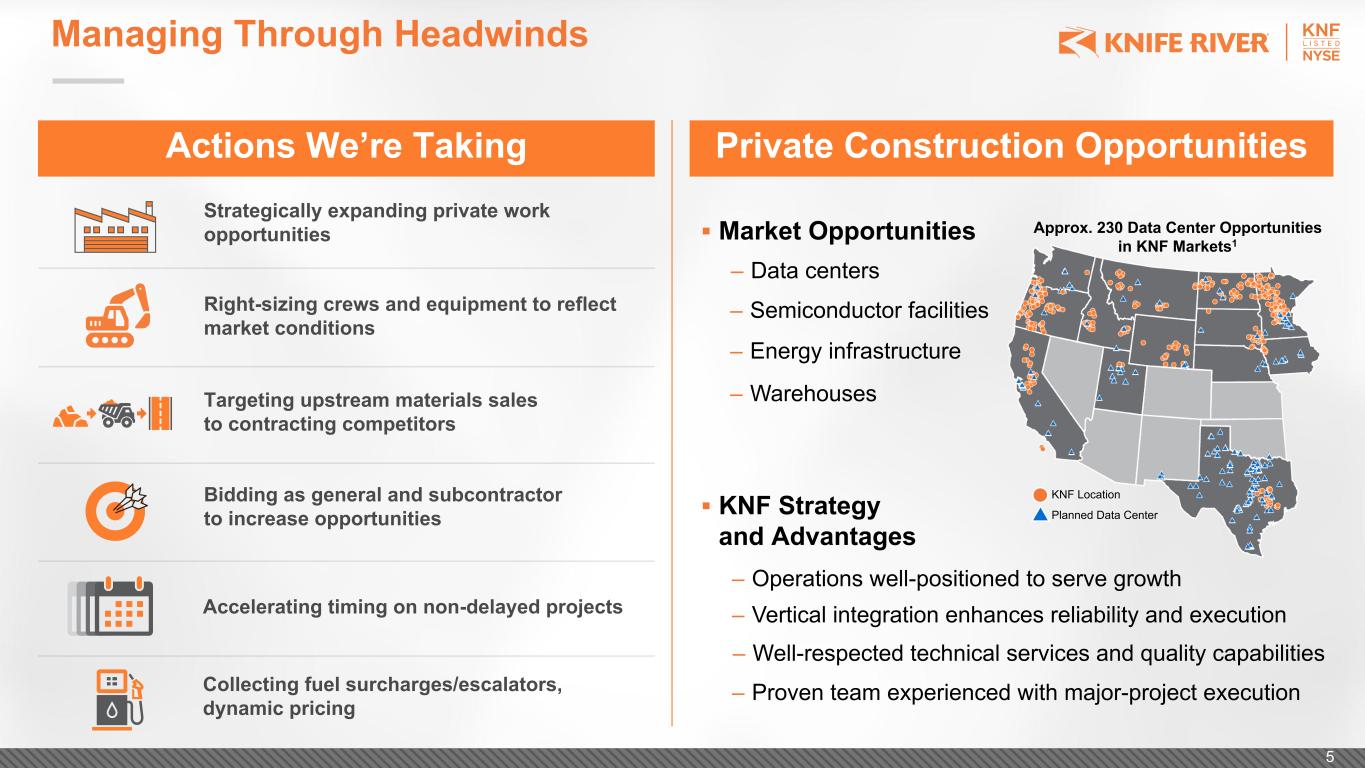
Managing Through Headwinds Right-sizing crews and equipment to reflect market conditions Targeting upstream materials sales to contracting competitors Strategically expanding private work opportunities Bidding as general and subcontractor to increase opportunities Actions We’re Taking Private Construction Opportunities Accelerating timing on non-delayed projects Collecting fuel surcharges/escalators, dynamic pricing ▪ Market Opportunities – Operations well-positioned to serve growth ▪ KNF Strategy and Advantages – Data centers – Semiconductor facilities – Energy infrastructure – Warehouses – Vertical integration enhances reliability and execution – Well-respected technical services and quality capabilities – Proven team experienced with major-project execution KNF Location Planned Data Center Approx. 230 Data Center Opportunities in KNF Markets1 5
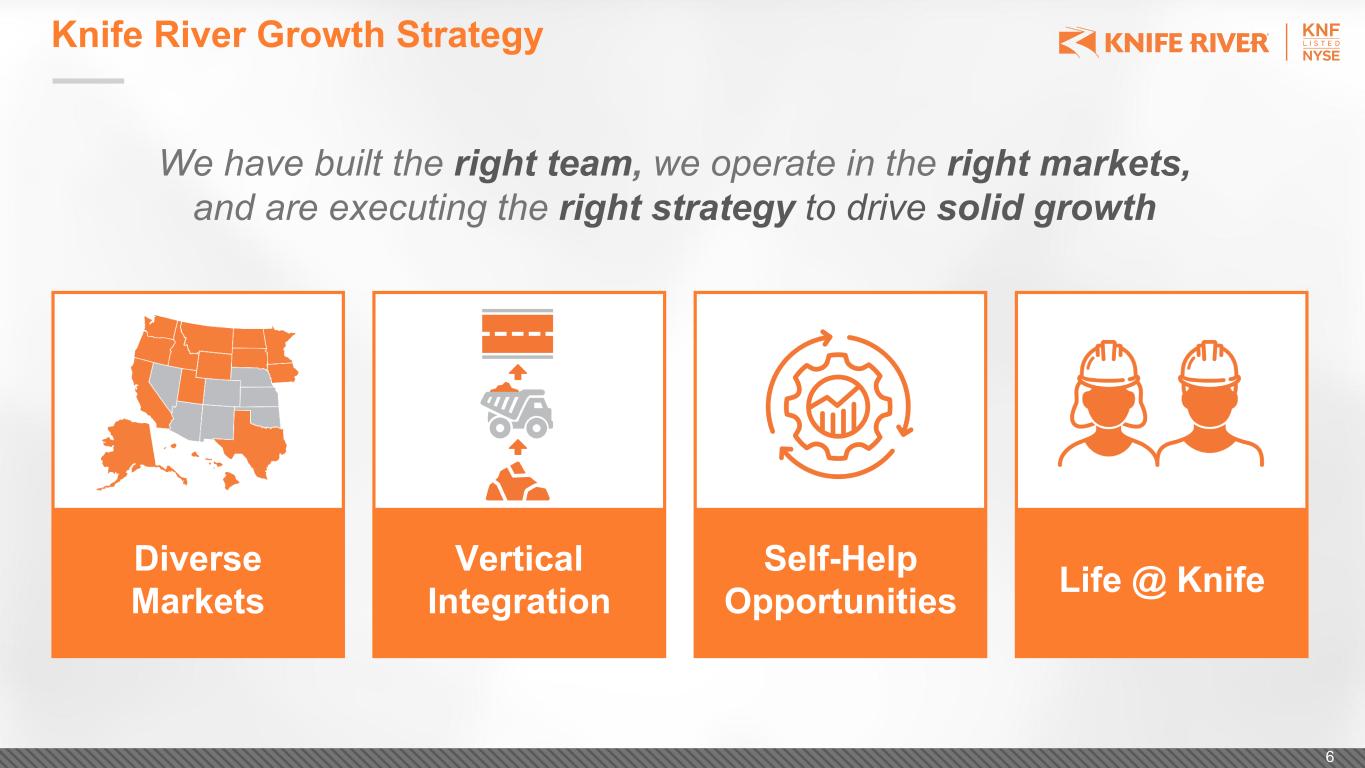
We have built the right team, we operate in the right markets, and are executing the right strategy to drive solid growth Diverse Markets Knife River Growth Strategy Vertical Integration Self-Help Opportunities Life @ Knife 6
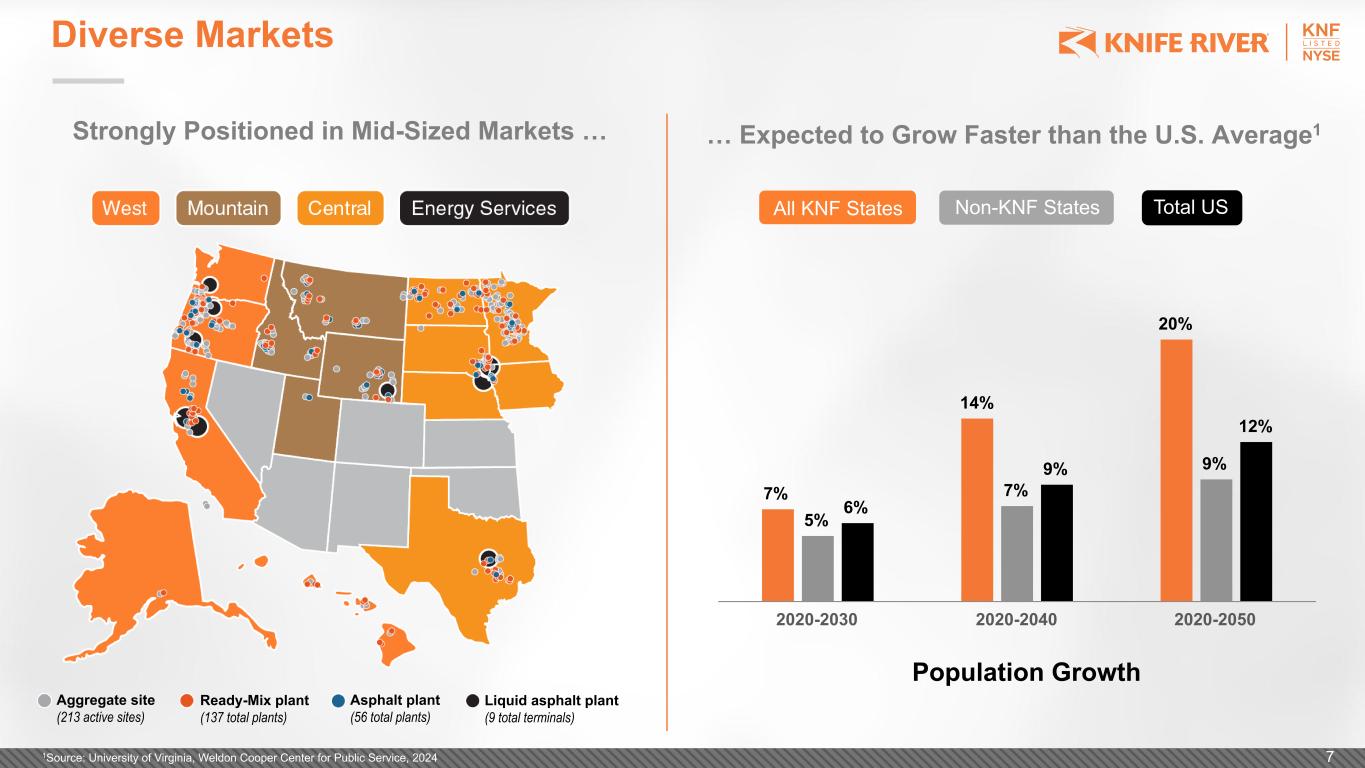
Diverse Markets Aggregate site (213 active sites) Ready-Mix plant (137 total plants) Asphalt plant (56 total plants) Liquid asphalt plant (9 total terminals) Strongly Positioned in Mid-Sized Markets … … Expected to Grow Faster than the U.S. Average1 1Source: University of Virginia, Weldon Cooper Center for Public Service, 2024 Population Growth Non-KNF States Total USAll KNF States 7 7% 14% 20% 5% 7% 9% 6% 9% 12% 2020-2030 2020-2040 2020-2050
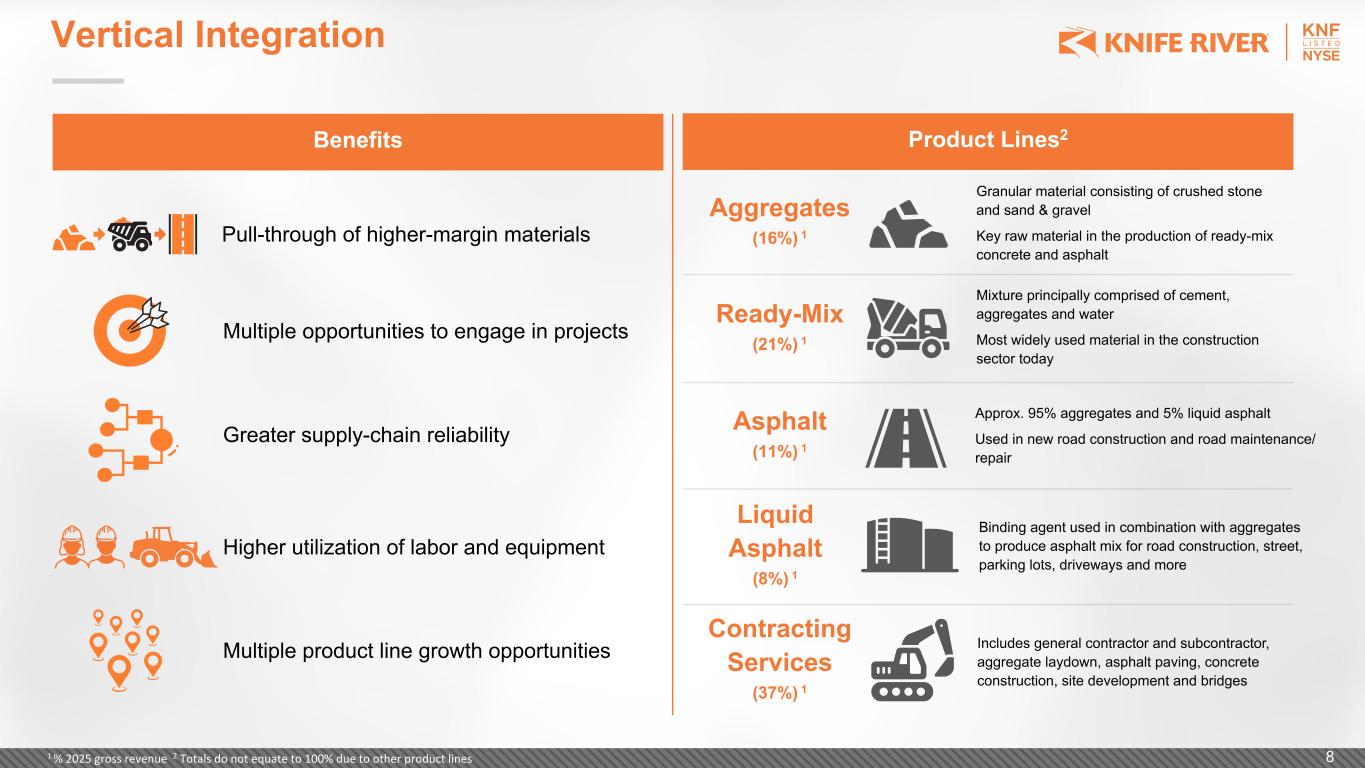
Product Lines2 Granular material consisting of crushed stone and sand & gravel Key raw material in the production of ready-mix concrete and asphalt Aggregates (16%) 1 Ready-Mix (21%) 1 Mixture principally comprised of cement, aggregates and water Most widely used material in the construction sector today Asphalt (11%) 1 Approx. 95% aggregates and 5% liquid asphalt Used in new road construction and road maintenance/ repair Includes general contractor and subcontractor, aggregate laydown, asphalt paving, concrete construction, site development and bridges 1 % 2025 gross revenue 2 Totals do not equate to 100% due to other product lines Vertical Integration Benefits Pull-through of higher-margin materials Multiple opportunities to engage in projects Greater supply-chain reliability Higher utilization of labor and equipment Multiple product line growth opportunities Contracting Services (37%) 1 Binding agent used in combination with aggregates to produce asphalt mix for road construction, street, parking lots, driveways and more Liquid Asphalt (8%) 1 8
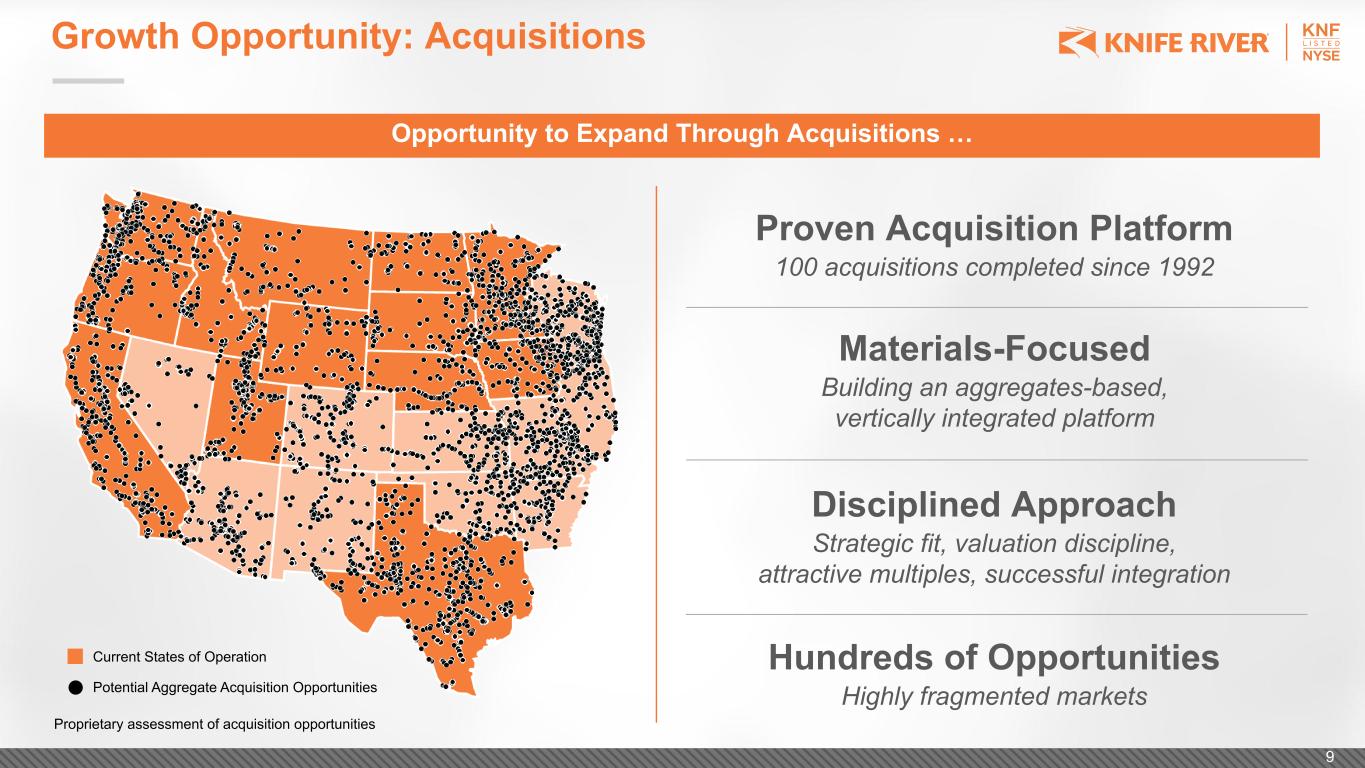
Growth Opportunity: Acquisitions Current States of Operation Potential Aggregate Acquisition Opportunities Proprietary assessment of acquisition opportunities 9 Opportunity to Expand Through Acquisitions … Materials-Focused Building an aggregates-based, vertically integrated platform Proven Acquisition Platform 100 acquisitions completed since 1992 Disciplined Approach Strategic fit, valuation discipline, attractive multiples, successful integration Hundreds of Opportunities Highly fragmented markets
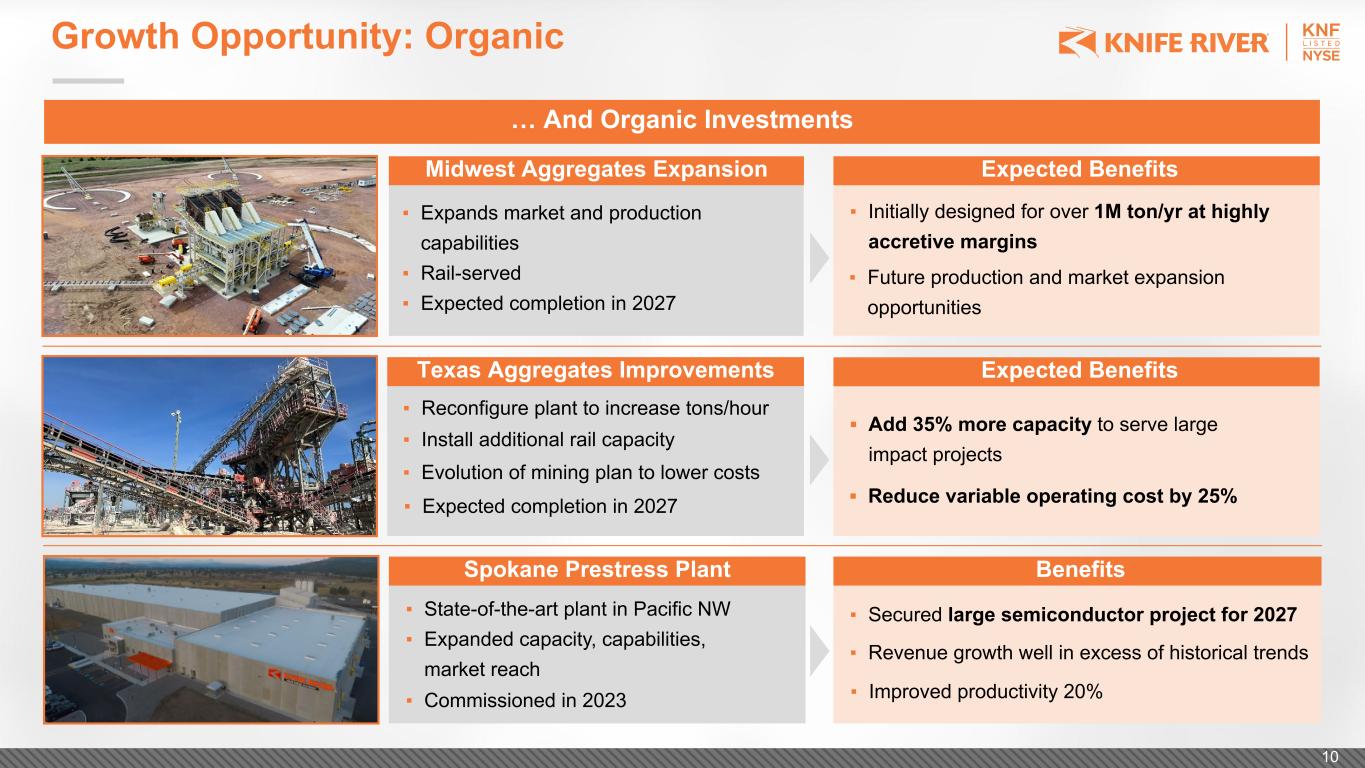
Growth Opportunity: Organic … And Organic Investments Midwest Aggregates Expansion Expected Benefits ▪ Expands market and production capabilities ▪ Rail-served ▪ Expected completion in 2027 ▪ Initially designed for over 1M ton/yr at highly accretive margins ▪ State-of-the-art plant in Pacific NW ▪ Expanded capacity, capabilities, market reach ▪ Secured large semiconductor project for 2027 ▪ Add 35% more capacity to serve large impact projects ▪ Revenue growth well in excess of historical trends Spokane Prestress Plant Texas Aggregates Improvements Benefits Expected Benefits ▪ Reconfigure plant to increase tons/hour ▪ Reduce variable operating cost by 25% ▪ Improved productivity 20%▪ Commissioned in 2023 ▪ Expected completion in 2027 ▪ Install additional rail capacity ▪ Evolution of mining plan to lower costs ▪ Future production and market expansion opportunities 10
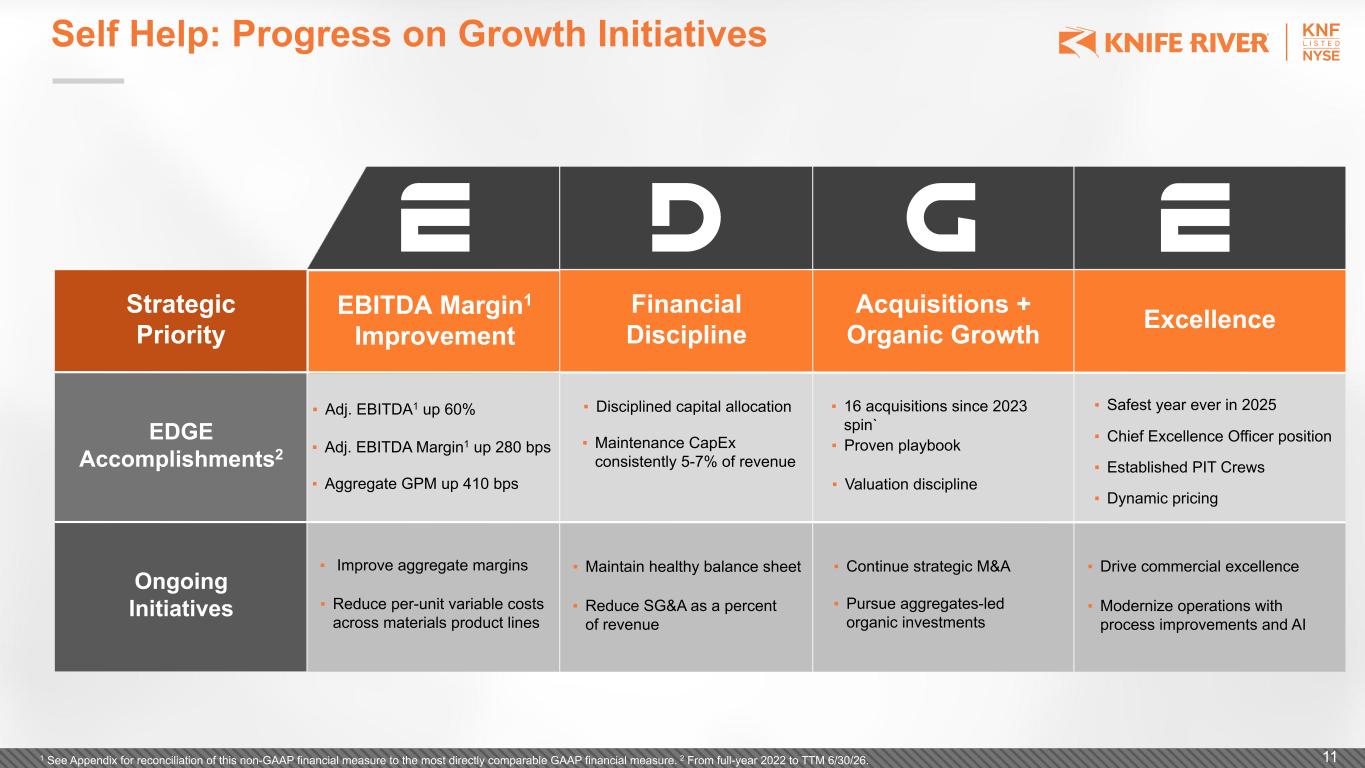
Ongoing Initiatives EDGE Accomplishments2 ExcellenceAcquisitions + Organic Growth Self Help: Progress on Growth Initiatives Financial Discipline ▪ Adj. EBITDA1 up 60% EBITDA Margin1 Improvement Strategic Priority ▪ Adj. EBITDA Margin1 up 280 bps ▪ Aggregate GPM up 410 bps ▪ Maintenance CapEx consistently 5-7% of revenue ▪ 16 acquisitions since 2023 spin` ▪ Proven playbook ▪ Chief Excellence Officer position ▪ Established PIT Crews ▪ Dynamic pricing ▪ Continue strategic M&A ▪ Pursue aggregates-led organic investments ▪ Modernize operations with process improvements and AI 1 See Appendix for reconciliation of this non-GAAP financial measure to the most directly comparable GAAP financial measure. 2 From full-year 2022 to TTM 6/30/26. ▪ Improve aggregate margins ▪ Reduce per-unit variable costs across materials product lines ▪ Reduce SG&A as a percent of revenue 11 ▪ Valuation discipline ▪ Disciplined capital allocation ▪ Maintain healthy balance sheet ▪ Drive commercial excellence ▪ Safest year ever in 2025
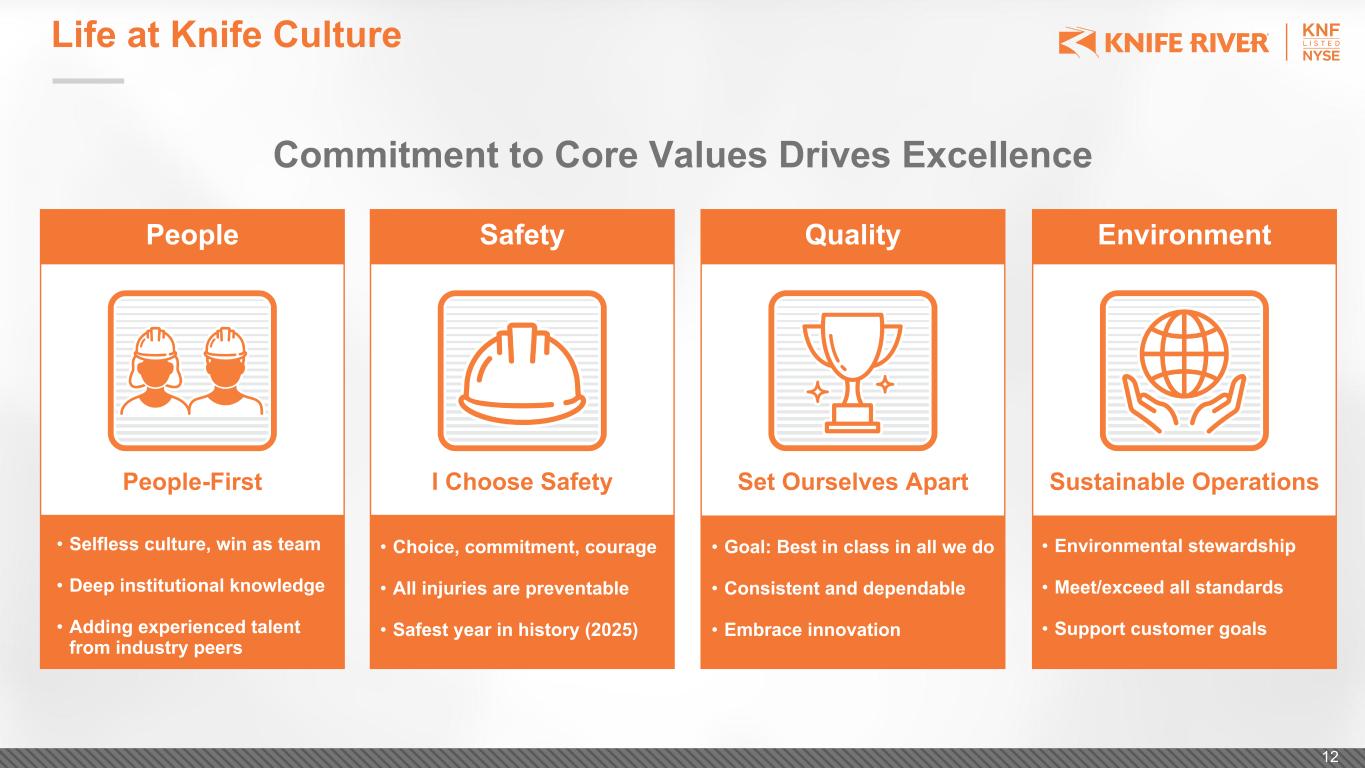
• Selfless culture, win as team • Deep institutional knowledge • Adding experienced talent from industry peers Life at Knife Culture People Safety Quality Environment Commitment to Core Values Drives Excellence • Choice, commitment, courage • All injuries are preventable • Safest year in history (2025) • Goal: Best in class in all we do • Consistent and dependable • Embrace innovation • Environmental stewardship • Meet/exceed all standards • Support customer goals People-First I Choose Safety Set Ourselves Apart Sustainable Operations 12
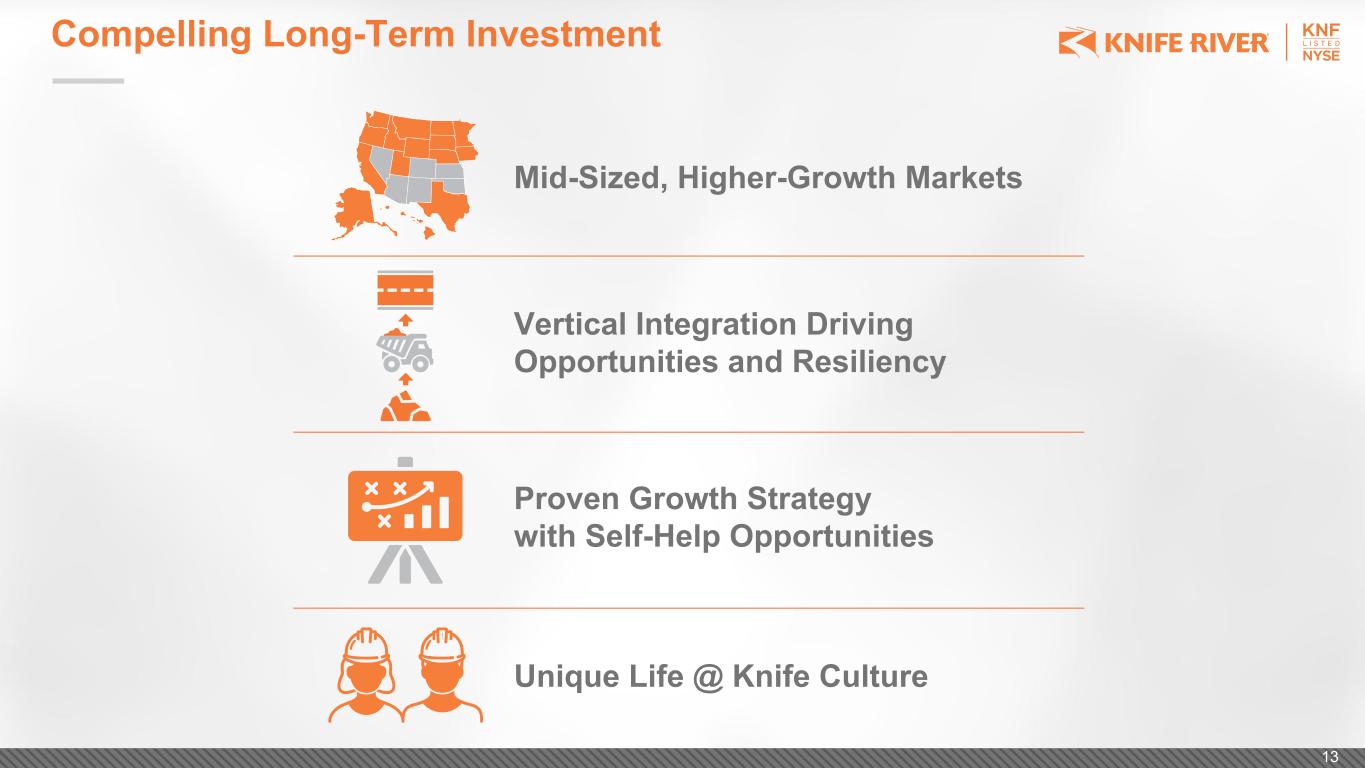
Compelling Long-Term Investment Mid-Sized, Higher-Growth Markets Proven Growth Strategy with Self-Help Opportunities Unique Life @ Knife Culture Vertical Integration Driving Opportunities and Resiliency 13
Appendix and Non-GAAP Financial Measures 14
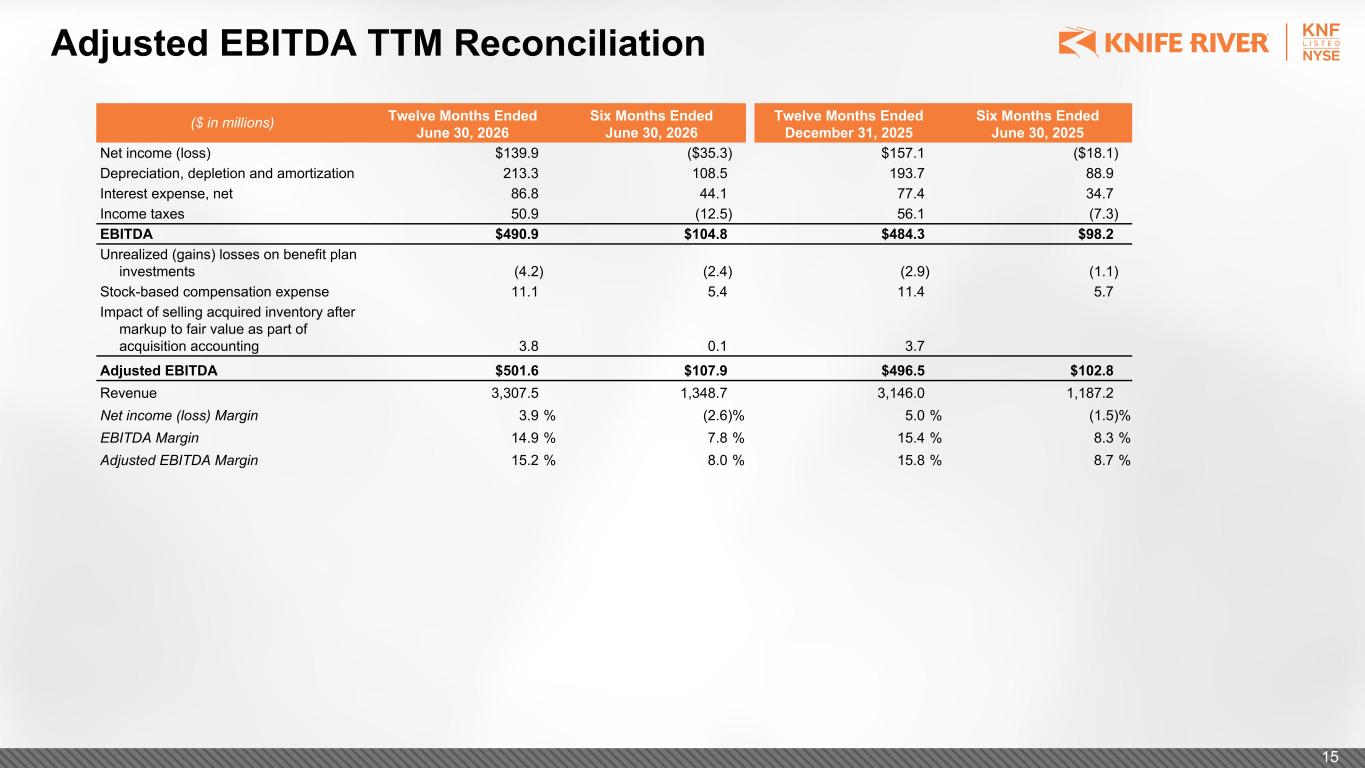
Adjusted EBITDA TTM Reconciliation ($ in millions) Twelve Months Ended June 30, 2026 Six Months Ended June 30, 2026 Twelve Months Ended December 31, 2025 Six Months Ended June 30, 2025 Net income (loss) $139.9 ($35.3) $157.1 ($18.1) Depreciation, depletion and amortization 213.3 108.5 193.7 88.9 Interest expense, net 86.8 44.1 77.4 34.7 Income taxes 50.9 (12.5) 56.1 (7.3) EBITDA $490.9 $104.8 $484.3 $98.2 Unrealized (gains) losses on benefit plan investments (4.2) (2.4) (2.9) (1.1) Stock-based compensation expense 11.1 5.4 11.4 5.7 Impact of selling acquired inventory after markup to fair value as part of acquisition accounting 3.8 0.1 3.7 Adjusted EBITDA $501.6 $107.9 $496.5 $102.8 Revenue 3,307.5 1,348.7 3,146.0 1,187.2 Net income (loss) Margin 3.9 % (2.6) % 5.0 % (1.5) % EBITDA Margin 14.9 % 7.8 % 15.4 % 8.3 % Adjusted EBITDA Margin 15.2 % 8.0 % 15.8 % 8.7 % 15
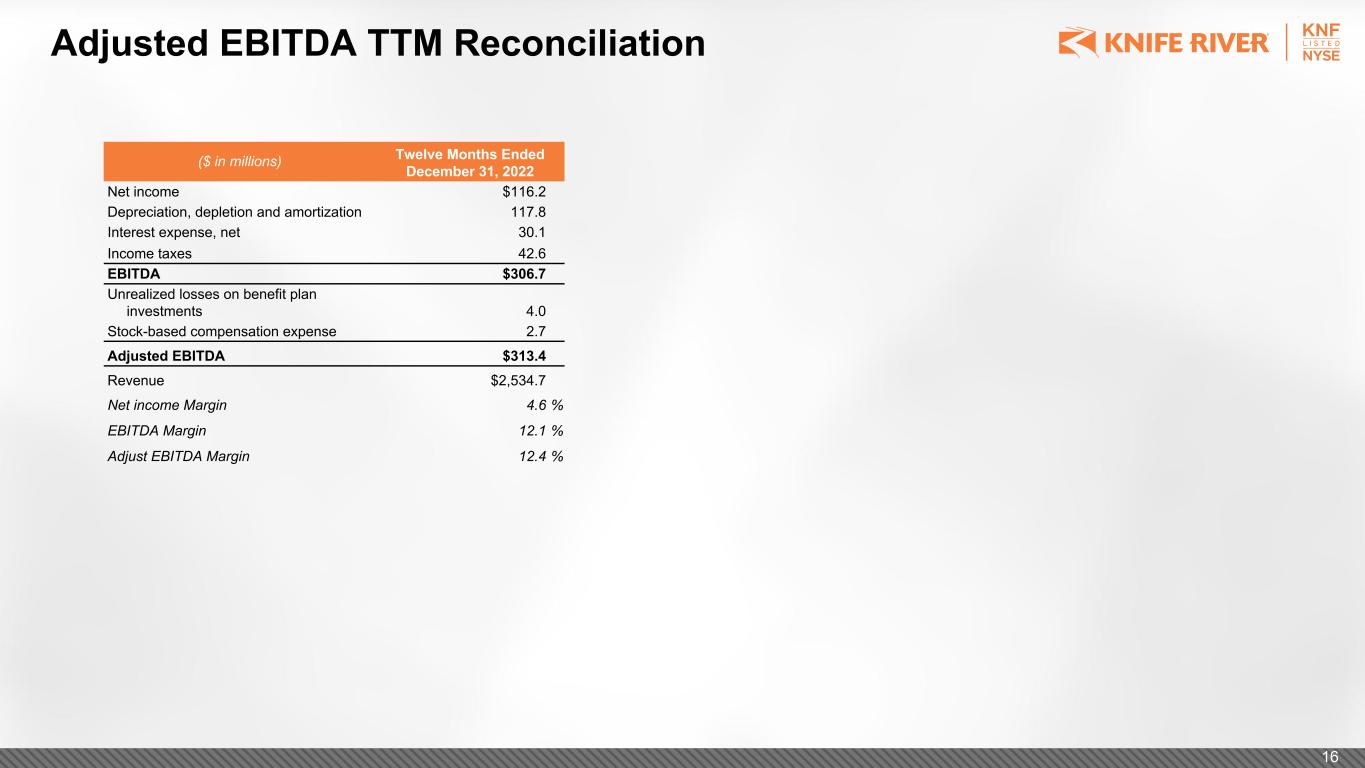
Adjusted EBITDA TTM Reconciliation ($ in millions) Twelve Months Ended December 31, 2022 Net income $116.2 Depreciation, depletion and amortization 117.8 Interest expense, net 30.1 Income taxes 42.6 EBITDA $306.7 Unrealized losses on benefit plan investments 4.0 Stock-based compensation expense 2.7 Adjusted EBITDA $313.4 Revenue $2,534.7 Net income Margin 4.6 % EBITDA Margin 12.1 % Adjust EBITDA Margin 12.4 % 16