On October 18, 2024, the Fund acquired the assets and assumed the liabilities of the Essential 40 Stock Fund, a series of the Trust (the “Predecessor Fund”), in a reorganization (the “Reorganization”). As a result of the Reorganization, the Fund adopted the performance and financial history of the Class I shares of the Predecessor Fund. The performance information provided below is that of the Class I shares of the Predecessor Fund for periods prior to October 18, 2024. The Fund has the same investment objective and strategies as the Predecessor Fund. Updated performance information is available at no cost by calling the Fund toll-free at 1-800-451-5493.
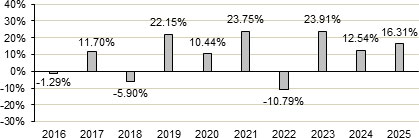
The calendar year-to-date return for the Fund’s Class I shares as of June 30, 2026 was 15.87%.
During the period shown in the bar chart, the best performance for a quarter was 15.96% (for the quarter ended June 30, 2020). The worst performance was -22.63% (for the quarter ended March 31, 2020).
| One Year |
Five Year |
Ten Years | |
| Essential 40 Stock ETF | |||
| Return Before Taxes | 16.31% | 12.36% | 9.62% |
| Return After Taxes on Distributions | 16.06% | 10.83% | 8.74% |
| Return After Taxes on Distributions and Sale of Fund Shares | 9.83% | 9.45% | 7.66% |
| S&P
500 Total Return Index (reflects no deduction for fees, expenses or taxes) |
17.88% | 14.42% | 14.82% |
| S&P
500 Equal Weight Total Return Index (reflects no deduction for fees, expenses or taxes) |
11.43% | 10.48% | 11.71% |
| Essential
40 Stock Index Total Return (reflects no deduction for fees, expenses or taxes) |
17.38% | 13.18% | 14.01% |
After-tax returns are based on the highest historical individual federal marginal income tax rates, and do not reflect the impact of state and local taxes; actual after-tax returns depend on an individual investor’s tax situation and may differ from those shown. If you own shares of the Fund in a tax-deferred account, such as an individual retirement account or a 401(k) plan, this information is not applicable to your investment. A higher after-tax return results when a capital loss occurs upon redemption and translates into an assumed tax deduction that benefits the shareholder.
The S&P 500 Total Return Index is an unmanaged market capitalization weighted index of 500 of the largest capitalized U.S. domiciled companies. Index returns assume reinvestment of dividends. Investors may not invest in the indexes directly; unlike the Fund’s returns, the indexes do not reflect any fees or expenses.
The S&P 500 Equal Weight Total Return Index is a stock market index that tracks the performance of the 500 largest companies in the United States, with each stock equally weighted regardless of market capitalization. The index is reviewed quarterly. Investors may not invest in the index directly; unlike the Fund’s returns, the index does not reflect any fees or expenses.
The Essential 40 Stock Index Total Return is a gross total return index of FSH Trading, LLC (“FSH”). The index is calculated and distributed by Solactive AG. The Essential 40 Stock Index™ Total Return, is an index of companies providing goods and services that are deemed essential to the American economy and way of life. Investors may not invest in the index directly; unlike the Fund’s returns, the index does not reflect any fees or expenses.