Pay vs Performance Disclosure
Jun. 30, 2026
USD ($)
Jun. 30, 2025
USD ($)
Jun. 30, 2024
USD ($)
Jun. 30, 2023
USD ($)
Jun. 30, 2022
USD ($)
PAY VERSUS PERFORMANCE TABLE
The following table sets forth information concerning the compensation of our NEOs for each of the fiscal years ended June 30, 2022, 2023, 2024, 2025 and 2026 and our financial performance for such fiscal year.
Year |
Summary Compensation Table Total for PEO(1) |
Compensation Actually Paid to PEO(1)(3) |
Average Summary Compensation Table for Non- PEO Named Executive Officers(2) |
Average Compensation Actually Paid to Non-PEO Named Executive Officers(2)(3) |
Value of Initial Fixed $100 Investment Based On: |
Net Income ($ in thousands) |
Free Cash Flow Margin(6) | |||||||||
Total Shareholder Return(4) |
Peer Group Total Shareholder Return(5) | |||||||||||||||
2026 |
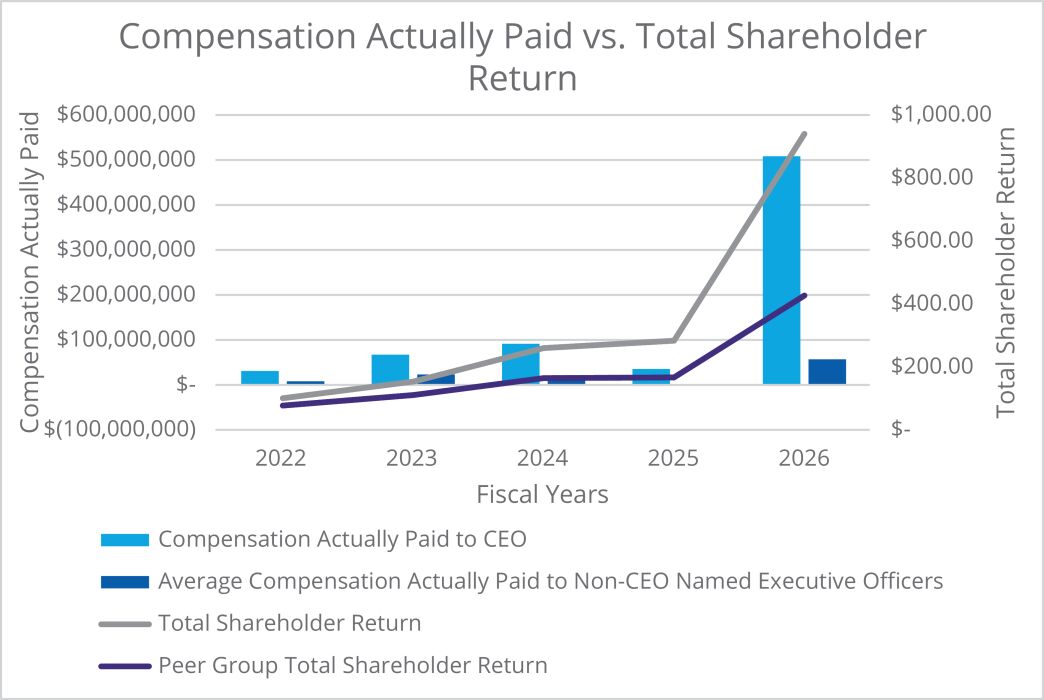
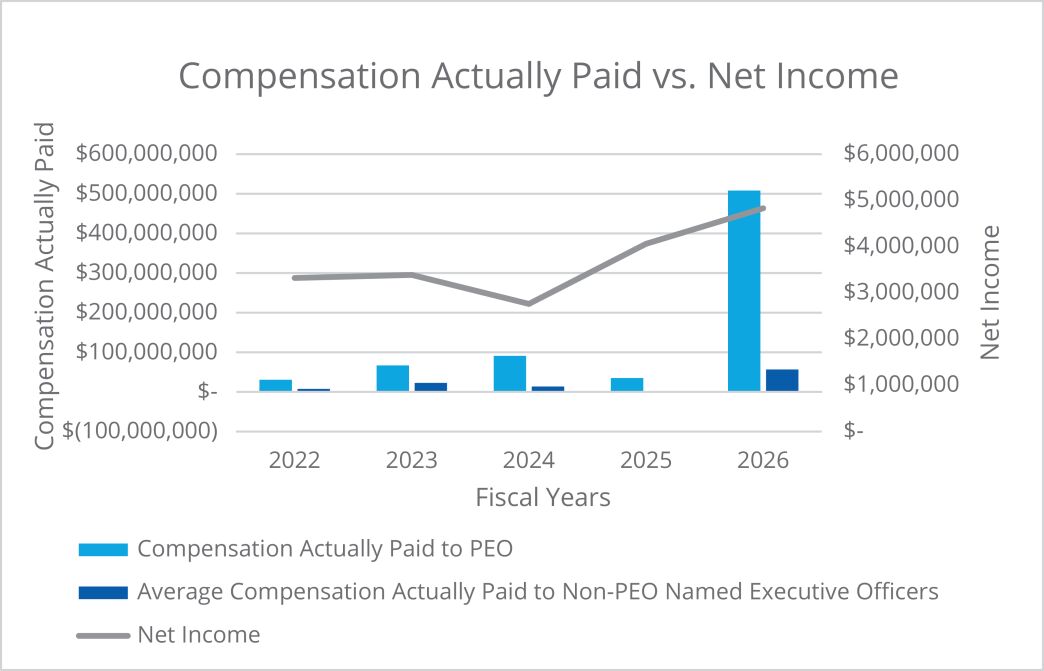
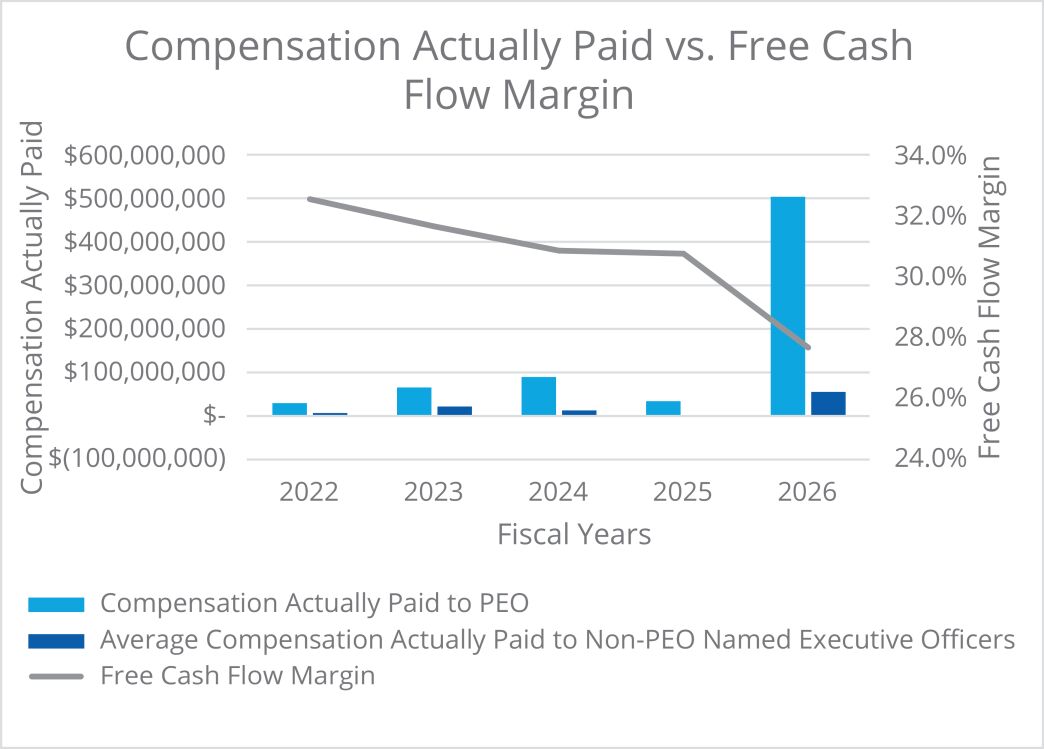
$29,954,476 | $507,945,072 | $7,115,793 | $56,314,498 | $939.21 | $425.88 | $4,830,771 | 27.7% | ||||||||
2025 |
$25,104,584 | $34,781,582 | $6,016,889 | $(383,111) | $489.42 | $277.82 | $4,061,643 | 30.8% | ||||||||
2024 |
$22,832,965 | $90,772,465 | $6,589,057 | $13,543,792 | $447.99 | $274.10 | $2,761,896 | 30.9% | ||||||||
2023 |
$26,644,359 | $66,578,359 | $8,534,115 | $22,630,489 | $264.61 | $183.98 | $3,387,351 | 31.7% | ||||||||
2022 |
$20,568,625 | $30,398,207 | $5,380,793 | $7,397,584 | $173.68 | $128.04 | $3,322,060 | 32.6% | ||||||||
(1) Amounts reported are for Richard Wallace, who served as our Chief Executive Officer during each of the applicable fiscal years.
(2) Our non-PEO named executive officers (our “Non-PEO Named Executive Officers”) were (a) Bren Higgins, Ahmad Khan, Brian Lorig and Mary Beth Wilkinson, for fiscal year 2026, (b) Bren Higgins, Ahmad Khan, Oreste Donzella, Brian Lorig and Mary Beth Wilkinson, for fiscal year 2025, (c) Bren Higgins, Ahmad Khan, Oreste Donzella and Brian Lorig, for fiscal year 2024, (d) Bren Higgins, Ahmad Khan, Oreste Donzella and Brian Lorig, for fiscal year 2023, and (e) Bren Higgins, Ahmad Khan, Oreste Donzella and Mary Beth Wilkinson, for fiscal year 2022.
(3) Amounts in these columns show the “Compensation Actually Paid,” as calculated in accordance with the specific methodology prescribed by the SEC. The table below provides the adjustments to the Summary Compensation Table total compensation to arrive at the Compensation Actually Paid to our CEO and the average Compensation Actually Paid to our Non-PEO Named Executive Officers for each of the required fiscal years.
| 2026 | 2025 | 2024 | 2023 | 2022 | ||||||||||||||||||||||||||||||||||||
| Adjustments to Reported Summary Compensation Table Total for CEO and Non-PEO Named Executive Officers |
PEO | Non-PEO Named Executive Officers (Average) |
PEO | Non-PEO Named Executive Officers (Average) |
PEO | Non-PEO Named Executive Officers (Average) |
PEO | Non-PEO Named Executive Officers (Average) |
PEO | Non-PEO Named Executive Officers (Average) |
||||||||||||||||||||||||||||||
Summary Compensation Table total amount for applicable fiscal year |
$ | 29,954,476 | $ | 7,115,793 | $ | 25,104,584 | $ | 6,016,889 | $22,832,965 | $6,589,057 | $26,644,359 | $ 8,534,115 | $20,568,625 | $5,380,793 | ||||||||||||||||||||||||||
Subtract the amounts reported under the Stock Awards column in the Summary Compensation Table for the applicable fiscal year |
$ | 23,473,887 | $ | 4,911,115 | $ | 20,147,371 | $ | 3,498,316 | $19,695,857 | $ 4,045,389 | $23,492,301 | $ 7,023,747 | $15,296,189 | $3,427,362 | ||||||||||||||||||||||||||
Add year-end fair value of equity awards granted during the applicable fiscal year that remain unvested as of applicable fiscal year end determined as of applicable fiscal year end |
$ | 124,242,817 | $ | 24,368,996 | $ | 38,187,226 | $ | 6,216,273 | $41,638,580 | $ 8,233,631 | $34,527,604 | $ 9,647,715 | $17,938,199 | $3,545,418 | ||||||||||||||||||||||||||
Add (subtract) year over year change in fair value of equity awards granted in prior years that remain outstanding and unvested as of applicable fiscal year end |
$ | 350,342,943 | $ | 18,152,723 | $ | 2,660,611 | $ | (3,554,393 | ) | $33,678,469 | $ (1,717,033 | ) | $24,635,303 | $ 8,777,513 | ($18,828,402 | ) | ($4,115,578 | ) | ||||||||||||||||||||||
Add (subtract) year over year change in fair value of equity awards granted in prior years that vested in the applicable fiscal year |
$ | 26,878,723 | $ | 11,588,101 | $ | (11,023,468 | ) | $ | (5,563,563 | ) | $12,318,309 | $ 4,483,525 | $ 4,263,394 | $ 2,694,893 | $26,015,974 | $6,014,313 | ||||||||||||||||||||||||
Total Adjustments |
$ | 477,990,596 | $ | 49,198,706 | $ | 9,676,998 | $ | (6,400,000 | ) | 67,939,500 | $ 6,954,735 | $39,934,000 | $14,096,374 | $ 9,829,582 | $2,016,791 | |||||||||||||||||||||||||
Compensation Actually Paid |
$ | 507,945,072 | $ | 56,314,498 | $ | 34,781,582 | $ | (383,111 | ) | $90,772,465 | $13,543,792 | $66,578,359 | $22,630,489 | $30,398,207 | $7,397,584 | |||||||||||||||||||||||||
For purposes of the foregoing adjustments, the fair value or change in fair value (as applicable) of equity awards was determined as follows: (i) for RSUs, the closing price of our Common Stock on the applicable fiscal year-end date, or, in the case of vesting dates, the closing price of our Common Stock on the applicable vesting date, in each case multiplied by the number of shares of our Common Stock underlying the award; and (ii) for unvested PRSUs (including EPS Awards), the same valuation methodology as the RSUs above, except that the year-end values are multiplied by the probability of achievement of the applicable performance objectives as of the applicable date.
(4) In accordance with Item 201(e) of Regulation S-K, our total shareholder return is calculated, for each fiscal year shown in the table above, as the cumulative total shareholder return on our Common Stock from June 30, 2021 (i.e., the last trading day of our 2021 fiscal year), through and including the last day of the applicable fiscal year, assuming a fixed investment of $100.
(5) Our peer group is comprised of the component companies of the Philadelphia Semiconductor Index (the “Peer Index”). Amounts reported in this column represent the cumulative total shareholder return of the Peer Index.
(6) Free cash flow margin equals our free cash flow divided by total revenues. Free cash flow equals net cash provided by operating activities less capital expenditures. Free cash flow margin over the applicable three-year period relative to our industry peer group for that same three-year period is used in determining the level at which the performance criteria under our annual PRSUs are satisfied, between 0%-200% of the target shares granted for the periods presented.
(3) Amounts in these columns show the “Compensation Actually Paid,” as calculated in accordance with the specific methodology prescribed by the SEC. The table below provides the adjustments to the Summary Compensation Table total compensation to arrive at the Compensation Actually Paid to our CEO and the average Compensation Actually Paid to our Non-PEO Named Executive Officers for each of the required fiscal years.
| 2026 | 2025 | 2024 | 2023 | 2022 | ||||||||||||||||||||||||||||||||||||
| Adjustments to Reported Summary Compensation Table Total for CEO and Non-PEO Named Executive Officers |
PEO | Non-PEO Named Executive Officers (Average) |
PEO | Non-PEO Named Executive Officers (Average) |
PEO | Non-PEO Named Executive Officers (Average) |
PEO | Non-PEO Named Executive Officers (Average) |
PEO | Non-PEO Named Executive Officers (Average) |
||||||||||||||||||||||||||||||
Summary Compensation Table total amount for applicable fiscal year |
$ | 29,954,476 | $ | 7,115,793 | $ | 25,104,584 | $ | 6,016,889 | $22,832,965 | $6,589,057 | $26,644,359 | $ 8,534,115 | $20,568,625 | $5,380,793 | ||||||||||||||||||||||||||
Subtract the amounts reported under the Stock Awards column in the Summary Compensation Table for the applicable fiscal year |
$ | 23,473,887 | $ | 4,911,115 | $ | 20,147,371 | $ | 3,498,316 | $19,695,857 | $ 4,045,389 | $23,492,301 | $ 7,023,747 | $15,296,189 | $3,427,362 | ||||||||||||||||||||||||||
Add year-end fair value of equity awards granted during the applicable fiscal year that remain unvested as of applicable fiscal year end determined as of applicable fiscal year end |
$ | 124,242,817 | $ | 24,368,996 | $ | 38,187,226 | $ | 6,216,273 | $41,638,580 | $ 8,233,631 | $34,527,604 | $ 9,647,715 | $17,938,199 | $3,545,418 | ||||||||||||||||||||||||||
Add (subtract) year over year change in fair value of equity awards granted in prior years that remain outstanding and unvested as of applicable fiscal year end |
$ | 350,342,943 | $ | 18,152,723 | $ | 2,660,611 | $ | (3,554,393 | ) | $33,678,469 | $ (1,717,033 | ) | $24,635,303 | $ 8,777,513 | ($18,828,402 | ) | ($4,115,578 | ) | ||||||||||||||||||||||
Add (subtract) year over year change in fair value of equity awards granted in prior years that vested in the applicable fiscal year |
$ | 26,878,723 | $ | 11,588,101 | $ | (11,023,468 | ) | $ | (5,563,563 | ) | $12,318,309 | $ 4,483,525 | $ 4,263,394 | $ 2,694,893 | $26,015,974 | $6,014,313 | ||||||||||||||||||||||||
Total Adjustments |
$ | 477,990,596 | $ | 49,198,706 | $ | 9,676,998 | $ | (6,400,000 | ) | 67,939,500 | $ 6,954,735 | $39,934,000 | $14,096,374 | $ 9,829,582 | $2,016,791 | |||||||||||||||||||||||||
Compensation Actually Paid |
$ | 507,945,072 | $ | 56,314,498 | $ | 34,781,582 | $ | (383,111 | ) | $90,772,465 | $13,543,792 | $66,578,359 | $22,630,489 | $30,398,207 | $7,397,584 | |||||||||||||||||||||||||
For purposes of the foregoing adjustments, the fair value or change in fair value (as applicable) of equity awards was determined as follows: (i) for RSUs, the closing price of our Common Stock on the applicable fiscal year-end date, or, in the case of vesting dates, the closing price of our Common Stock on the applicable vesting date, in each case multiplied by the number of shares of our Common Stock underlying the award; and (ii) for unvested PRSUs (including EPS Awards), the same valuation methodology as the RSUs above, except that the year-end values are multiplied by the probability of achievement of the applicable performance objectives as of the applicable date.
(3) Amounts in these columns show the “Compensation Actually Paid,” as calculated in accordance with the specific methodology prescribed by the SEC. The table below provides the adjustments to the Summary Compensation Table total compensation to arrive at the Compensation Actually Paid to our CEO and the average Compensation Actually Paid to our Non-PEO Named Executive Officers for each of the required fiscal years.
| 2026 | 2025 | 2024 | 2023 | 2022 | ||||||||||||||||||||||||||||||||||||
| Adjustments to Reported Summary Compensation Table Total for CEO and Non-PEO Named Executive Officers |
PEO | Non-PEO Named Executive Officers (Average) |
PEO | Non-PEO Named Executive Officers (Average) |
PEO | Non-PEO Named Executive Officers (Average) |
PEO | Non-PEO Named Executive Officers (Average) |
PEO | Non-PEO Named Executive Officers (Average) |
||||||||||||||||||||||||||||||
Summary Compensation Table total amount for applicable fiscal year |
$ | 29,954,476 | $ | 7,115,793 | $ | 25,104,584 | $ | 6,016,889 | $22,832,965 | $6,589,057 | $26,644,359 | $ 8,534,115 | $20,568,625 | $5,380,793 | ||||||||||||||||||||||||||
Subtract the amounts reported under the Stock Awards column in the Summary Compensation Table for the applicable fiscal year |
$ | 23,473,887 | $ | 4,911,115 | $ | 20,147,371 | $ | 3,498,316 | $19,695,857 | $ 4,045,389 | $23,492,301 | $ 7,023,747 | $15,296,189 | $3,427,362 | ||||||||||||||||||||||||||
Add year-end fair value of equity awards granted during the applicable fiscal year that remain unvested as of applicable fiscal year end determined as of applicable fiscal year end |
$ | 124,242,817 | $ | 24,368,996 | $ | 38,187,226 | $ | 6,216,273 | $41,638,580 | $ 8,233,631 | $34,527,604 | $ 9,647,715 | $17,938,199 | $3,545,418 | ||||||||||||||||||||||||||
Add (subtract) year over year change in fair value of equity awards granted in prior years that remain outstanding and unvested as of applicable fiscal year end |
$ | 350,342,943 | $ | 18,152,723 | $ | 2,660,611 | $ | (3,554,393 | ) | $33,678,469 | $ (1,717,033 | ) | $24,635,303 | $ 8,777,513 | ($18,828,402 | ) | ($4,115,578 | ) | ||||||||||||||||||||||
Add (subtract) year over year change in fair value of equity awards granted in prior years that vested in the applicable fiscal year |
$ | 26,878,723 | $ | 11,588,101 | $ | (11,023,468 | ) | $ | (5,563,563 | ) | $12,318,309 | $ 4,483,525 | $ 4,263,394 | $ 2,694,893 | $26,015,974 | $6,014,313 | ||||||||||||||||||||||||
Total Adjustments |
$ | 477,990,596 | $ | 49,198,706 | $ | 9,676,998 | $ | (6,400,000 | ) | 67,939,500 | $ 6,954,735 | $39,934,000 | $14,096,374 | $ 9,829,582 | $2,016,791 | |||||||||||||||||||||||||
Compensation Actually Paid |
$ | 507,945,072 | $ | 56,314,498 | $ | 34,781,582 | $ | (383,111 | ) | $90,772,465 | $13,543,792 | $66,578,359 | $22,630,489 | $30,398,207 | $7,397,584 | |||||||||||||||||||||||||
For purposes of the foregoing adjustments, the fair value or change in fair value (as applicable) of equity awards was determined as follows: (i) for RSUs, the closing price of our Common Stock on the applicable fiscal year-end date, or, in the case of vesting dates, the closing price of our Common Stock on the applicable vesting date, in each case multiplied by the number of shares of our Common Stock underlying the award; and (ii) for unvested PRSUs (including EPS Awards), the same valuation methodology as the RSUs above, except that the year-end values are multiplied by the probability of achievement of the applicable performance objectives as of the applicable date.
Tabular List – Relevant Financial Performance Measures
For fiscal year 2026, the following financial performance measures represented the three most important financial performance measures used by us to link Company performance to the compensation actually paid to our NEOs:
Financial Performance Measures |
Free cash flow margin |
Non-GAAP operating margin dollars |
Non-GAAP earnings per diluted share |