Shareholder Report
|
12 Months Ended |
|
Jul. 31, 2026
USD ($)
Holding
|
|---|
| Shareholder Report [Line Items] |
|
| Document Type |
N-CSR
|
| Amendment Flag |
false
|
| Registrant Name |
FIDELITY COVINGTON TRUST
|
| Entity Central Index Key |
0000945908
|
| Entity Investment Company Type |
N-1A
|
| Document Period End Date |
Jul. 31, 2026
|
| Shareholder Report Annual or Semi-Annual |
annual shareholder report
|
| C000131671 |
|
| Shareholder Report [Line Items] |
|
| Fund Name |
Fidelity<sup style="inset: 1.5px 0px 4px; box-sizing: border-box; color: rgb(255, 255, 255); display: inline; flex-wrap: nowrap; font-size: 18px; font-weight: 300; grid-area: auto; line-height: 0px; margin: 0px; overflow: visible; position: relative; text-align: left; text-align-last: auto; white-space-collapse: preserve-breaks;">®</sup> MSCI Communication Services Index ETF
|
| Trading Symbol |
FCOM
|
| Security Exchange Name |
NYSEArca
|
| Annual or Semi-Annual Statement [Text Block] |
This annual shareholder report contains important information about Fidelity® MSCI Communication Services Index ETF for the period of August 1, 2025 to July 31, 2026.
|
| Additional Information [Text Block] |
You can find additional information about the Fund at fundresearch.fidelity.com/prospectus/sec. You can also request this information by contacting us at 1-800-FIDELITY or by sending an e-mail to fidfunddocuments@fidelity.com.
|
| Additional Information Phone Number |
1-800-FIDELITY
|
| Additional Information Email |
<span style="box-sizing: border-box; color: rgb(0, 0, 0); display: inline; flex-wrap: nowrap; font-size: 10.6667px; font-weight: 400; grid-area: auto; line-height: 16px; margin: 0px; overflow: visible; text-align: left; text-align-last: auto; white-space-collapse: preserve-breaks;">fidfunddocuments@fidelity.com</span>
|
| Additional Information Website |
fundresearch.fidelity.com/prospectus/sec
|
| Expenses [Text Block] |
What were the Fund costs for the last year?(based on a hypothetical $10,000 investment) FUND COST (PREVIOUS YEAR)
Table Summary
Class |
Costs of a $10,000 investment |
Costs paid as a percentage of a $10,000 investment |
Fidelity® MSCI Communication Services Index ETF |
$8 |
0.08% | |
| Expenses Paid, Amount |
$ 8
|
| Expense Ratio, Percent |
0.08%
|
| Factors Affecting Performance [Text Block] |
What affected the Fund's performance this period?• U.S. stocks achieved a strong gain for the 12 months ending July 31, 2026, reflecting enthusiasm for artificial intelligence, strong corporate fundamentals, a resilient economy and, beginning in September, the Federal Reserve’s first interest-rate reductions since December 2024. • Against this backdrop, interactive media & services gained 19% and contributed most to the fund's performance for the fiscal year. Publishing stocks also helped, gaining 21%, while alternative carriers advanced 17%. Movies & entertainment (+1%) also contributed. • In contrast, interactive home entertainment returned about -25% and detracted most, followed by advertising, which returned roughly -36%. The wireless telecommunication services subindustry returned approximately -25%, and integrated telecommunication services (-3%) also hurt. Other detractors included the cable & satellite (-9%) and application software (-56%) subindustries. • Turning to individual stocks, the top contributor was Alphabet (+85%), from the interactive media & services subindustry. In movies & entertainment, Warner Bros Discovery (+98%) contributed. In integrated telecommunication services, Verizon Communications gained about 18% and contributed. In interactive home entertainment, Electronic Arts (+38%) helped. Lastly, EchoStar (+159%), a stock in the cable & satellite subindustry, also boosted the fund. • Conversely, the biggest detractor was Meta Platforms (-27%), from the interactive media & services subindustry. In interactive home entertainment, ROBLOX returned about -74% and hurt. Netflix (-41%), a stock in the movies & entertainment subindustry, detracted as well, as did Trade Desk (-81%), from the advertising subindustry. Lastly, T-Mobile US (-24%), from the wireless telecommunication services subindustry, also hurt the fund's performance. |
| Performance Past Does Not Indicate Future [Text] |
The Fund's past performance is not a good predictor of the Fund's future performance.
|
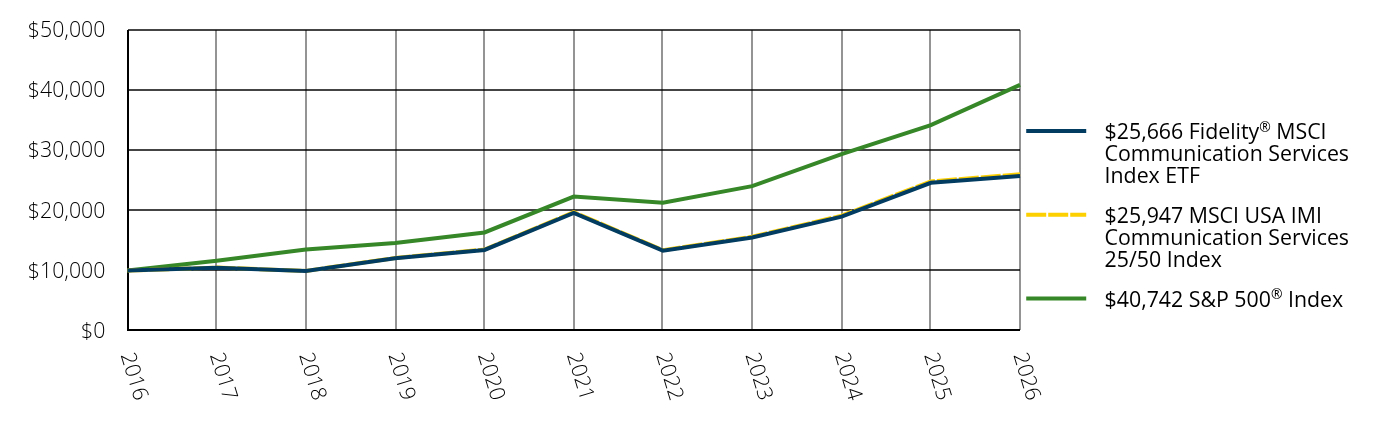
| Line Graph [Table Text Block] |
Table Summary
|
$25,666 Fidelity® MSCI Communication Services Index ETF |
$25,947 MSCI USA IMI Communication Services 25/50 Index |
$40,742 S&P 500® Index |
2016 |
$10,000 |
$10,000 |
$10,000 |
2017 |
$10,459 |
$10,483 |
$11,604 |
2018 |
$9,921 |
$9,943 |
$13,489 |
2019 |
$12,038 |
$12,081 |
$14,566 |
2020 |
$13,410 |
$13,475 |
$16,308 |
2021 |
$19,553 |
$19,665 |
$22,251 |
2022 |
$13,284 |
$13,371 |
$21,219 |
2023 |
$15,469 |
$15,585 |
$23,980 |
2024 |
$18,925 |
$19,087 |
$29,292 |
2025 |
$24,529 |
$24,762 |
$34,076 |
2026 |
$25,666 |
$25,947 |
$40,742 |
|
| Average Annual Return [Table Text Block] |
AVERAGE ANNUAL TOTAL RETURNS:
Table Summary
Fund |
1 Year |
5 Years |
10 Years |
Fidelity® MSCI Communication Services Index ETF - NAV |
4.63% |
5.59% |
9.88% |
MSCI USA IMI Communication Services 25/50 Index |
4.79% |
5.70% |
10.00% |
S&P 500® Index |
19.56% |
12.86% |
15.08% | Visit www.fidelity.com for more recent performance information. The Fund's past performance is not a good predictor of the Fund's future performance. The graph and table do not reflect the deduction of taxes that a shareholder would pay on fund distributions or redemption of fund shares. |
| No Deduction of Taxes [Text Block] |
The graph and table do not reflect the deduction of taxes that a shareholder would pay on fund distributions or redemption of fund shares.
|
| Updated Performance Information Location [Text Block] |
Visit www.fidelity.com for more recent performance information.
|
| AssetsNet |
$ 1,730,307,512
|
| Holdings Count | Holding |
93
|
| Advisory Fees Paid, Amount |
$ 1,495,602
|
| InvestmentCompanyPortfolioTurnover |
44.00%
|
| Additional Fund Statistics [Text Block] |
Table Summary
FUND STATISTICS |
Value |
Fund Size |
$1,730,307,512 |
Number of Holdings |
93 |
Portfolio Turnover |
44% |
Total Advisory Fee |
$1,495,602 | |
| Holdings [Text Block] |
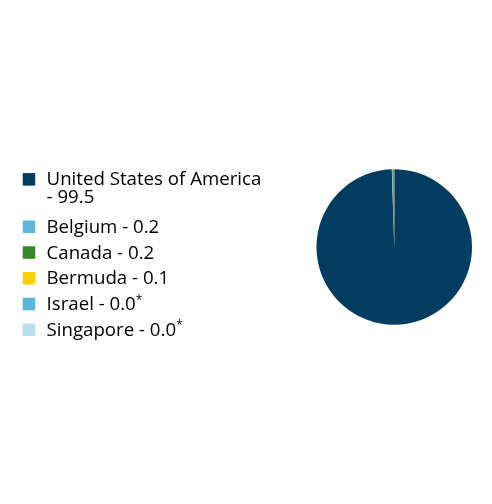
What did the Fund invest in? GEOGRAPHIC DIVERSIFICATION(% of Fund's net assets)
Table Summary
Value |
Value |
United States of America - |
99.5 |
Belgium - |
0.2 |
Canada - |
0.2 |
Bermuda - |
0.1 |
Israel - |
0.0Footnote Reference* |
Singapore - |
0.0Footnote Reference* |
| Footnote |
Description |
Footnote* |
Amount rounds to less than 0.1%. | What did the Fund invest in? TOP INDUSTRIES(% of Fund's net assets)
Table Summary
Interactive Media & Services |
47.4 |
Entertainment |
23.7 |
Diversified Telecommunication Services |
15.4 |
Media |
7.9 |
Wireless Telecommunication Services |
2.9 |
All Others |
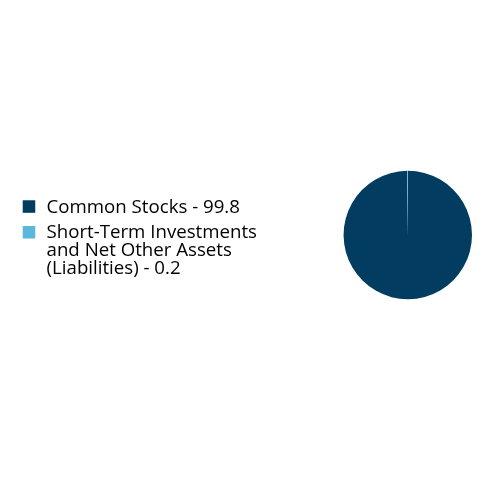
2.7 | ASSET ALLOCATION(% of Fund's net assets)
Table Summary
Value |
Value |
Common Stocks - |
99.8 |
Short-Term Investments and Net Other Assets (Liabilities) - |
0.2 | |
| Largest Holdings [Text Block] |
TOP HOLDINGS(% of Fund's net assets)
Table Summary
Meta Platforms, Inc., Class A |
20.1 |
Alphabet, Inc., Class A |
15.2 |
Alphabet, Inc., Class C |
8.6 |
Netflix, Inc. |
4.8 |
Verizon Communications, Inc. |
4.6 |
Walt Disney Co. |
4.1 |
AT&T, Inc. |
4.1 |
Comcast Corp., Class A |
2.8 |
T-Mobile U.S., Inc. |
2.7 |
Warner Bros Discovery, Inc. |
2.5 |
Total |
69.5 | |
| Material Fund Change [Text Block] |
|
| C000131662 |
|
| Shareholder Report [Line Items] |
|
| Fund Name |
Fidelity<sup style="inset: 1.5px 0px 4px; box-sizing: border-box; color: rgb(255, 255, 255); display: inline; flex-wrap: nowrap; font-size: 18px; font-weight: 300; grid-area: auto; line-height: 0px; margin: 0px; overflow: visible; position: relative; text-align: left; text-align-last: auto; white-space-collapse: preserve-breaks;">®</sup> MSCI Consumer Discretionary Index ETF
|
| Trading Symbol |
FDIS
|
| Security Exchange Name |
NYSEArca
|
| Annual or Semi-Annual Statement [Text Block] |
This annual shareholder report contains important information about Fidelity® MSCI Consumer Discretionary Index ETF for the period of August 1, 2025 to July 31, 2026.
|
| Additional Information [Text Block] |
You can find additional information about the Fund at fundresearch.fidelity.com/prospectus/sec. You can also request this information by contacting us at 1-800-FIDELITY or by sending an e-mail to fidfunddocuments@fidelity.com.
|
| Additional Information Phone Number |
1-800-FIDELITY
|
| Additional Information Email |
<span style="box-sizing: border-box; color: rgb(0, 0, 0); display: inline; flex-wrap: nowrap; font-size: 10.6667px; font-weight: 400; grid-area: auto; line-height: 16px; margin: 0px; overflow: visible; text-align: left; text-align-last: auto; white-space-collapse: preserve-breaks;">fidfunddocuments@fidelity.com</span>
|
| Additional Information Website |
fundresearch.fidelity.com/prospectus/sec
|
| Expenses [Text Block] |
What were the Fund costs for the last year?(based on a hypothetical $10,000 investment) FUND COST (PREVIOUS YEAR)
Table Summary
Class |
Costs of a $10,000 investment |
Costs paid as a percentage of a $10,000 investment |
Fidelity® MSCI Consumer Discretionary Index ETF |
$8 |
0.08% | |
| Expenses Paid, Amount |
$ 8
|
| Expense Ratio, Percent |
0.08%
|
| Factors Affecting Performance [Text Block] |
What affected the Fund's performance this period?• U.S. stocks achieved a strong gain for the 12 months ending July 31, 2026, reflecting enthusiasm for artificial intelligence, strong corporate fundamentals, a resilient economy and, beginning in September, the Federal Reserve’s first interest-rate reductions since December 2024. • Against this backdrop, broadline retail gained about 15% and contributed to the fund's performance for the fiscal year. Apparel retail, which gained roughly 39%, also helped, as did automobile manufacturers, which advanced 6%. The hotels, resorts & cruise lines subindustry rose approximately 8%, while apparel, accessories & luxury goods gained roughly 15%, and automotive parts & equipment advanced roughly 15%. • Conversely, casinos & gaming returned -24% and detracted, followed by footwear, which returned -27%. The home improvement retail subindustry returned -7%. Restaurants (-4%) also hurt. Automotive retail (-6%) and education services (-16%) hampered the fund's result. Other detractors included the other specialty retail (-8%) and distributors (-8%) subindustries. • Turning to individual stocks, the biggest contributor was Amazon.com (+16%), from the broadline retail subindustry. In apparel retail, Ross Stores (+85%) and TJX (+28%) contributed. In automobile manufacturers, General Motors gained 68% and boosted the fund. Lastly, Marriott International (+42%), a stock in the hotels, resorts & cruise lines subindustry, also contributed. • In contrast, the biggest detractor was NIKE (-43%), from the footwear subindustry. Flutter Entertainment (-65%), from the casinos & gaming subindustry, also detracted. MercadoLibre (-21%), from the broadline retail subindustry, hurt. In hotels, resorts & cruise lines, Booking Holdings (-12%) hurt the fund's performance. Lastly, in home improvement retail, Home Depot returned -7% and also hurt the fund. |
| Performance Past Does Not Indicate Future [Text] |
The Fund's past performance is not a good predictor of the Fund's future performance.
|
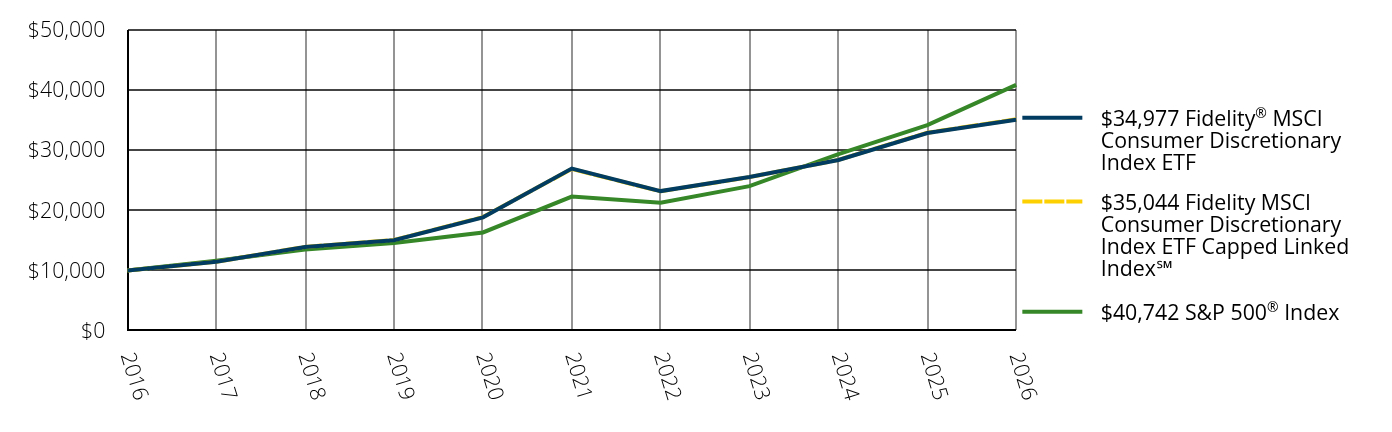
| Line Graph [Table Text Block] |
Table Summary
|
$34,977 Fidelity® MSCI Consumer Discretionary Index ETF |
$35,044 Fidelity MSCI Consumer Discretionary Index ETF Capped Linked Index℠ |
$40,742 S&P 500® Index |
2016 |
$10,000 |
$10,000 |
$10,000 |
2017 |
$11,442 |
$11,454 |
$11,604 |
2018 |
$13,886 |
$13,915 |
$13,489 |
2019 |
$15,018 |
$15,056 |
$14,566 |
2020 |
$18,812 |
$18,851 |
$16,308 |
2021 |
$26,892 |
$26,826 |
$22,251 |
2022 |
$23,156 |
$23,124 |
$21,219 |
2023 |
$25,482 |
$25,471 |
$23,980 |
2024 |
$28,310 |
$28,323 |
$29,292 |
2025 |
$32,768 |
$32,814 |
$34,076 |
2026 |
$34,977 |
$35,044 |
$40,742 |
|
| Average Annual Return [Table Text Block] |
AVERAGE ANNUAL TOTAL RETURNS:
Table Summary
Fund |
1 Year |
5 Years |
10 Years |
Fidelity® MSCI Consumer Discretionary Index ETF - NAV |
6.74% |
5.40% |
13.34% |
Fidelity MSCI Consumer Discretionary Index ETF Capped Linked Index℠ |
6.79% |
5.49% |
13.36% |
S&P 500® Index |
19.56% |
12.86% |
15.08% | Visit www.fidelity.com for more recent performance information. The Fund's past performance is not a good predictor of the Fund's future performance. The graph and table do not reflect the deduction of taxes that a shareholder would pay on fund distributions or redemption of fund shares. |
| No Deduction of Taxes [Text Block] |
The graph and table do not reflect the deduction of taxes that a shareholder would pay on fund distributions or redemption of fund shares.
|
| Updated Performance Information Location [Text Block] |
Visit www.fidelity.com for more recent performance information.
|
| AssetsNet |
$ 1,681,458,893
|
| Holdings Count | Holding |
245
|
| Advisory Fees Paid, Amount |
$ 1,523,964
|
| InvestmentCompanyPortfolioTurnover |
18.00%
|
| Additional Fund Statistics [Text Block] |
Table Summary
FUND STATISTICS |
Value |
Fund Size |
$1,681,458,893 |
Number of Holdings |
245 |
Portfolio Turnover |
18% |
Total Advisory Fee |
$1,523,964 | |
| Holdings [Text Block] |
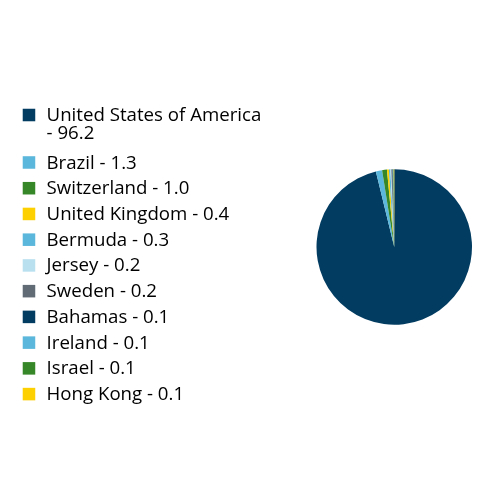
What did the Fund invest in? GEOGRAPHIC DIVERSIFICATION(% of Fund's net assets)
Table Summary
Value |
Value |
United States of America - |
96.2 |
Brazil - |
1.3 |
Switzerland - |
1.0 |
United Kingdom - |
0.4 |
Bermuda - |
0.3 |
Jersey - |
0.2 |
Sweden - |
0.2 |
Bahamas - |
0.1 |
Ireland - |
0.1 |
Israel - |
0.1 |
Hong Kong - |
0.1 | What did the Fund invest in? TOP INDUSTRIES(% of Fund's net assets)
Table Summary
Broadline Retail |
25.9 |
Hotels, Restaurants & Leisure |
22.3 |
Specialty Retail |
20.2 |
Automobiles |
15.9 |
Household Durables |
5.2 |
All Others |
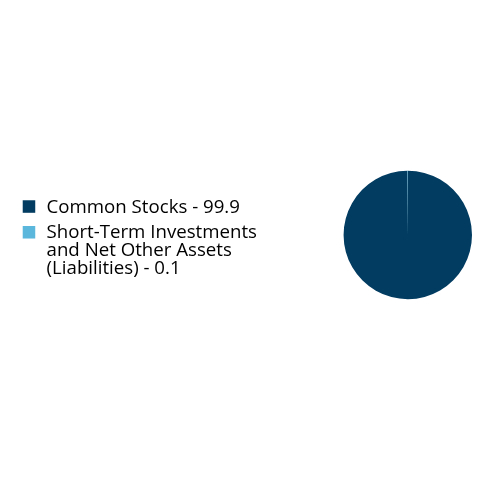
10.5 | ASSET ALLOCATION(% of Fund's net assets)
Table Summary
Value |
Value |
Common Stocks - |
99.9 |
Short-Term Investments and Net Other Assets (Liabilities) - |
0.1 | |
| Largest Holdings [Text Block] |
TOP HOLDINGS(% of Fund's net assets)
Table Summary
Amazon.com, Inc. |
23.0 |
Tesla, Inc. |
13.1 |
Home Depot, Inc. |
4.9 |
McDonald's Corp. |
2.9 |
TJX Cos., Inc. |
2.6 |
Booking Holdings, Inc. |
2.4 |
Starbucks Corp. |
1.8 |
Lowe's Cos., Inc. |
1.8 |
MercadoLibre, Inc. |
1.3 |
Marriott International, Inc., Class A |
1.3 |
Total |
55.1 | |
| Material Fund Change [Text Block] |
|
| C000131664 |
|
| Shareholder Report [Line Items] |
|
| Fund Name |
Fidelity<sup style="inset: 1.5px 0px 4px; box-sizing: border-box; color: rgb(255, 255, 255); display: inline; flex-wrap: nowrap; font-size: 18px; font-weight: 300; grid-area: auto; line-height: 0px; margin: 0px; overflow: visible; position: relative; text-align: left; text-align-last: auto; white-space-collapse: preserve-breaks;">®</sup> MSCI Consumer Staples Index ETF
|
| Trading Symbol |
FSTA
|
| Security Exchange Name |
NYSEArca
|
| Annual or Semi-Annual Statement [Text Block] |
This annual shareholder report contains important information about Fidelity® MSCI Consumer Staples Index ETF for the period of August 1, 2025 to July 31, 2026.
|
| Additional Information [Text Block] |
You can find additional information about the Fund at fundresearch.fidelity.com/prospectus/sec. You can also request this information by contacting us at 1-800-FIDELITY or by sending an e-mail to fidfunddocuments@fidelity.com.
|
| Additional Information Phone Number |
1-800-FIDELITY
|
| Additional Information Email |
<span style="box-sizing: border-box; color: rgb(0, 0, 0); display: inline; flex-wrap: nowrap; font-size: 10.6667px; font-weight: 400; grid-area: auto; line-height: 16px; margin: 0px; overflow: visible; text-align: left; text-align-last: auto; white-space-collapse: preserve-breaks;">fidfunddocuments@fidelity.com</span>
|
| Additional Information Website |
fundresearch.fidelity.com/prospectus/sec
|
| Expenses [Text Block] |
What were the Fund costs for the last year?(based on a hypothetical $10,000 investment) FUND COST (PREVIOUS YEAR)
Table Summary
Class |
Costs of a $10,000 investment |
Costs paid as a percentage of a $10,000 investment |
Fidelity® MSCI Consumer Staples Index ETF |
$8 |
0.08% | |
| Expenses Paid, Amount |
$ 8
|
| Expense Ratio, Percent |
0.08%
|
| Factors Affecting Performance [Text Block] |
What affected the Fund's performance this period?• U.S. stocks achieved a strong gain for the 12 months ending July 31, 2026, reflecting enthusiasm for artificial intelligence, strong corporate fundamentals, a resilient economy and, beginning in September, the Federal Reserve’s first interest-rate reductions since December 2024. • Against this backdrop, soft drinks & non-alcoholic beverages gained about 23% and contributed most to the fund's performance for the fiscal year. Consumer staples merchandise retail stocks also helped (+12%). Tobacco rose approximately 18%, food distributors gained 26%, and agricultural products & services advanced 34%. Other contributors included the household products (+1%), drug retail (+3%), health care services (+34%) and restaurants (0%) subindustries. • Conversely, packaged foods & meats returned -8% and detracted most. Personal care products (-16%) and distillers & vintners (-14%) also hurt. Other detractors included the food retail (-3%), brewers (-11%) and specialized finance (-2%) subindustries. • Turning to individual stocks, the biggest contributor was Coca-Cola (+33%), from the soft drinks & non-alcoholic beverages subindustry. From the same subindustry, Monster Beverage (+65%) helped. In consumer staples merchandise retail, Walmart (+15%) and Target (+50%) boosted the fund. Lastly, in tobacco, Philip Morris International gained roughly 22% and also boosted the fund. • In contrast, the biggest detractor was BellRing Brands (-78%), from the personal care products subindustry. Kroger (-15%) and Sprouts Farmers Market (-42%), within the food retail subindustry, hurt the fund's performance. General Mills (-22%), from the packaged foods & meats subindustry, hurt. Lastly, Constellation Brands, within the distillers & vintners subindustry, returned about -20% and also detracted. |
| Performance Past Does Not Indicate Future [Text] |
The Fund's past performance is not a good predictor of the Fund's future performance.
|
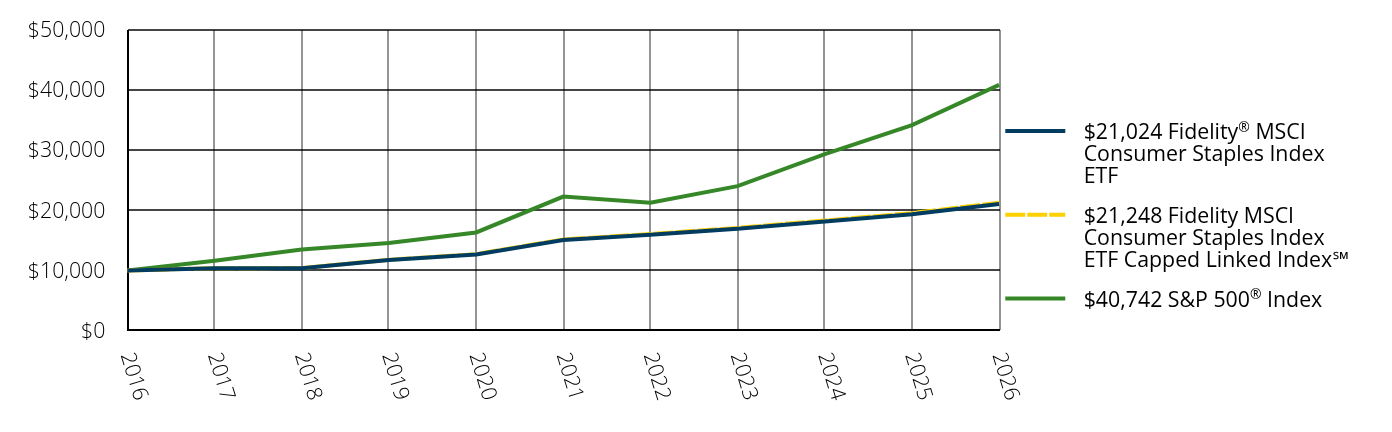
| Line Graph [Table Text Block] |
Table Summary
|
$21,024 Fidelity® MSCI Consumer Staples Index ETF |
$21,248 Fidelity MSCI Consumer Staples Index ETF Capped Linked Index℠ |
$40,742 S&P 500® Index |
2016 |
$10,000 |
$10,000 |
$10,000 |
2017 |
$10,383 |
$10,393 |
$11,604 |
2018 |
$10,377 |
$10,403 |
$13,489 |
2019 |
$11,742 |
$11,781 |
$14,566 |
2020 |
$12,651 |
$12,717 |
$16,308 |
2021 |
$15,065 |
$15,160 |
$22,251 |
2022 |
$15,938 |
$16,053 |
$21,219 |
2023 |
$16,926 |
$17,064 |
$23,980 |
2024 |
$18,124 |
$18,289 |
$29,292 |
2025 |
$19,316 |
$19,508 |
$34,076 |
2026 |
$21,024 |
$21,248 |
$40,742 |
|
| Average Annual Return [Table Text Block] |
AVERAGE ANNUAL TOTAL RETURNS:
Table Summary
Fund |
1 Year |
5 Years |
10 Years |
Fidelity® MSCI Consumer Staples Index ETF - NAV |
8.84% |
6.89% |
7.71% |
Fidelity MSCI Consumer Staples Index ETF Capped Linked Index℠ |
8.92% |
6.99% |
7.83% |
S&P 500® Index |
19.56% |
12.86% |
15.08% | Visit www.fidelity.com for more recent performance information. The Fund's past performance is not a good predictor of the Fund's future performance. The graph and table do not reflect the deduction of taxes that a shareholder would pay on fund distributions or redemption of fund shares. |
| No Deduction of Taxes [Text Block] |
The graph and table do not reflect the deduction of taxes that a shareholder would pay on fund distributions or redemption of fund shares.
|
| Updated Performance Information Location [Text Block] |
Visit www.fidelity.com for more recent performance information.
|
| AssetsNet |
$ 1,416,650,650
|
| Holdings Count | Holding |
96
|
| Advisory Fees Paid, Amount |
$ 1,152,540
|
| InvestmentCompanyPortfolioTurnover |
10.00%
|
| Additional Fund Statistics [Text Block] |
Table Summary
FUND STATISTICS |
Value |
Fund Size |
$1,416,650,650 |
Number of Holdings |
96 |
Portfolio Turnover |
10% |
Total Advisory Fee |
$1,152,540 | |
| Holdings [Text Block] |
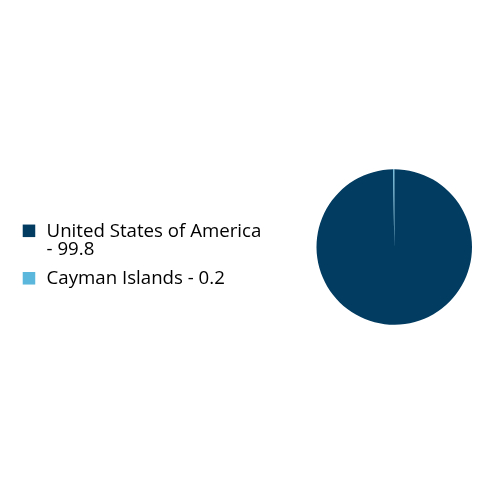
What did the Fund invest in? GEOGRAPHIC DIVERSIFICATION(% of Fund's net assets)
Table Summary
Value |
Value |
United States of America - |
99.8 |
Cayman Islands - |
0.2 | What did the Fund invest in? TOP INDUSTRIES(% of Fund's net assets)
Table Summary
Consumer Staples Distribution & Retail |
38.4 |
Beverages |
19.9 |
Household Products |
14.8 |
Food Products |
14.4 |
Tobacco |
8.6 |
All Others |
3.9 | ASSET ALLOCATION(% of Fund's net assets)
Table Summary
Value |
Value |
Common Stocks - |
99.7 |
Short-Term Investments and Net Other Assets (Liabilities) - |
0.3 | |
| Largest Holdings [Text Block] |
TOP HOLDINGS(% of Fund's net assets)
Table Summary
Walmart, Inc. |
13.5 |
Costco Wholesale Corp. |
11.4 |
Coca-Cola Co. |
8.5 |
Procter & Gamble Co. |
8.5 |
Philip Morris International, Inc. |
4.5 |
PepsiCo, Inc. |
4.2 |
Altria Group, Inc. |
3.7 |
Mondelez International, Inc., Class A |
2.6 |
Monster Beverage Corp. |
2.4 |
Colgate-Palmolive Co. |
2.3 |
Total |
61.6 | |
| Material Fund Change [Text Block] |
|
| C000131665 |
|
| Shareholder Report [Line Items] |
|
| Fund Name |
Fidelity<sup style="inset: 1.5px 0px 4px; box-sizing: border-box; color: rgb(255, 255, 255); display: inline; flex-wrap: nowrap; font-size: 18px; font-weight: 300; grid-area: auto; line-height: 0px; margin: 0px; overflow: visible; position: relative; text-align: left; text-align-last: auto; white-space-collapse: preserve-breaks;">®</sup> MSCI Energy Index ETF
|
| Trading Symbol |
FENY
|
| Security Exchange Name |
NYSEArca
|
| Annual or Semi-Annual Statement [Text Block] |
This annual shareholder report contains important information about Fidelity® MSCI Energy Index ETF for the period of August 1, 2025 to July 31, 2026.
|
| Additional Information [Text Block] |
You can find additional information about the Fund at fundresearch.fidelity.com/prospectus/sec. You can also request this information by contacting us at 1-800-FIDELITY or by sending an e-mail to fidfunddocuments@fidelity.com.
|
| Additional Information Phone Number |
1-800-FIDELITY
|
| Additional Information Email |
<span style="box-sizing: border-box; color: rgb(0, 0, 0); display: inline; flex-wrap: nowrap; font-size: 10.6667px; font-weight: 400; grid-area: auto; line-height: 16px; margin: 0px; overflow: visible; text-align: left; text-align-last: auto; white-space-collapse: preserve-breaks;">fidfunddocuments@fidelity.com</span>
|
| Additional Information Website |
fundresearch.fidelity.com/prospectus/sec
|
| Expenses [Text Block] |
What were the Fund costs for the last year?(based on a hypothetical $10,000 investment) FUND COST (PREVIOUS YEAR)
Table Summary
Class |
Costs of a $10,000 investment |
Costs paid as a percentage of a $10,000 investment |
Fidelity® MSCI Energy Index ETF |
$10 |
0.08% | |
| Expenses Paid, Amount |
$ 10
|
| Expense Ratio, Percent |
0.08%
|
| Factors Affecting Performance [Text Block] |
What affected the Fund's performance this period?• U.S. stocks achieved a strong gain for the 12 months ending July 31, 2026, reflecting enthusiasm for artificial intelligence, strong corporate fundamentals, a resilient economy and, beginning in September, the Federal Reserve’s first interest-rate reductions since December 2024. • Against this backdrop, integrated oil & gas gained roughly 40% and contributed most to the fund's performance for the fiscal year. Oil & gas refining & marketing stocks also helped, gaining 102%. The oil & gas exploration & production subindustry rose 26%. Oil & gas equipment & services (+53%) also contributed. Other contributors included the oil & gas storage & transportation (+26%), oil & gas drilling (+78%) and coal & consumable fuels (+5%) subindustries. • Turning to individual stocks, the top contributor was Exxon Mobil (+26%), from the integrated oil & gas subindustry. From the same subindustry, Chevron (+37%) and ExxonMobil Holdings (+15%) contributed. Lastly, in oil & gas refining & marketing, Valero Energy (+131%) and Marathon Petroleum (+88%) also boosted the fund. • Conversely, the biggest detractor was Expand Energy (-7%), from the oil & gas exploration & production subindustry. Within the same subindustry, Sable Offshore (-81%) and Comstock Resources (-24%) hindered the fund. In oil & gas storage & transportation, NextDecade (-39%) hurt the fund. Lastly, Centrus Energy (-22%), a stock in the coal & consumable fuels subindustry, also detracted. |
| Performance Past Does Not Indicate Future [Text] |
The Fund's past performance is not a good predictor of the Fund's future performance.
|
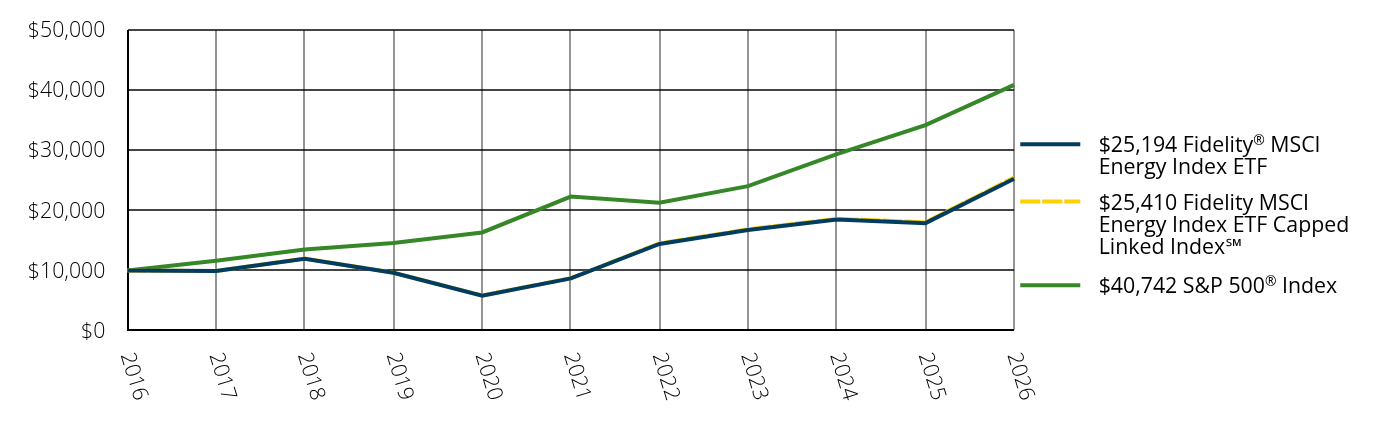
| Line Graph [Table Text Block] |
Table Summary
|
$25,194 Fidelity® MSCI Energy Index ETF |
$25,410 Fidelity MSCI Energy Index ETF Capped Linked Index℠ |
$40,742 S&P 500® Index |
2016 |
$10,000 |
$10,000 |
$10,000 |
2017 |
$9,908 |
$9,921 |
$11,604 |
2018 |
$11,941 |
$11,970 |
$13,489 |
2019 |
$9,623 |
$9,649 |
$14,566 |
2020 |
$5,842 |
$5,857 |
$16,308 |
2021 |
$8,693 |
$8,725 |
$22,251 |
2022 |
$14,404 |
$14,476 |
$21,219 |
2023 |
$16,723 |
$16,823 |
$23,980 |
2024 |
$18,437 |
$18,562 |
$29,292 |
2025 |
$17,849 |
$17,987 |
$34,076 |
2026 |
$25,194 |
$25,410 |
$40,742 |
|
| Average Annual Return [Table Text Block] |
AVERAGE ANNUAL TOTAL RETURNS:
Table Summary
Fund |
1 Year |
5 Years |
10 Years |
Fidelity® MSCI Energy Index ETF - NAV |
41.15% |
23.72% |
9.68% |
Fidelity MSCI Energy Index ETF Capped Linked Index℠ |
41.27% |
23.84% |
9.77% |
S&P 500® Index |
19.56% |
12.86% |
15.08% | Visit www.fidelity.com for more recent performance information. The Fund's past performance is not a good predictor of the Fund's future performance. The graph and table do not reflect the deduction of taxes that a shareholder would pay on fund distributions or redemption of fund shares. |
| No Deduction of Taxes [Text Block] |
The graph and table do not reflect the deduction of taxes that a shareholder would pay on fund distributions or redemption of fund shares.
|
| Updated Performance Information Location [Text Block] |
Visit www.fidelity.com for more recent performance information.
|
| AssetsNet |
$ 2,009,050,754
|
| Holdings Count | Holding |
103
|
| Advisory Fees Paid, Amount |
$ 1,345,286
|
| InvestmentCompanyPortfolioTurnover |
7.00%
|
| Additional Fund Statistics [Text Block] |
Table Summary
FUND STATISTICS |
Value |
Fund Size |
$2,009,050,754 |
Number of Holdings |
103 |
Portfolio Turnover |
7% |
Total Advisory Fee |
$1,345,286 | |
| Holdings [Text Block] |
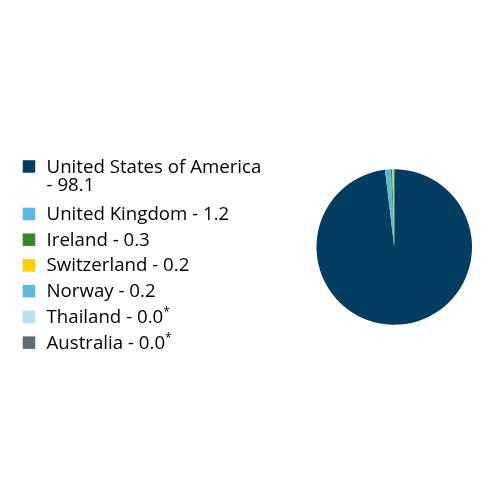
What did the Fund invest in? GEOGRAPHIC DIVERSIFICATION(% of Fund's net assets)
Table Summary
Value |
Value |
United States of America - |
98.1 |
United Kingdom - |
1.2 |
Ireland - |
0.3 |
Switzerland - |
0.2 |
Norway - |
0.2 |
Thailand - |
0.0Footnote Reference* |
Australia - |
0.0Footnote Reference* |
| Footnote |
Description |
Footnote* |
Amount rounds to less than 0.1%. | What did the Fund invest in? TOP INDUSTRIES(% of Fund's net assets)
Table Summary
Oil, Gas & Consumable Fuels |
88.1 |
Energy Equipment & Services |
11.6 |
All Others |
0.3 | ASSET ALLOCATION(% of Fund's net assets)
Table Summary
Value |
Value |
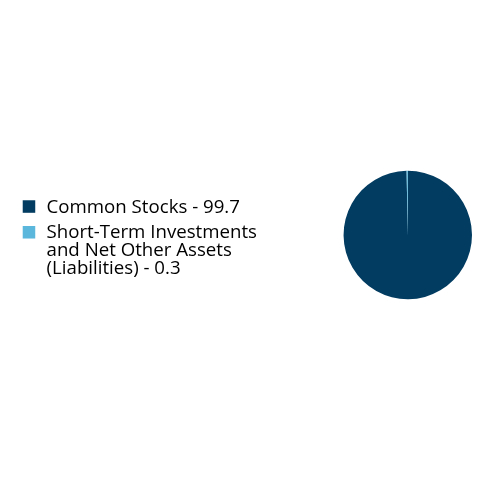
Common Stocks - |
99.7 |
Short-Term Investments and Net Other Assets (Liabilities) - |
0.3 | |
| Largest Holdings [Text Block] |
TOP HOLDINGS(% of Fund's net assets)
Table Summary
ExxonMobil Holdings Corp. |
22.0 |
Chevron Corp. |
14.4 |
ConocoPhillips |
5.9 |
Valero Energy Corp. |
3.8 |
Marathon Petroleum Corp. |
3.8 |
Williams Cos., Inc. |
3.4 |
Phillips 66 |
3.4 |
EOG Resources, Inc. |
3.2 |
SLB Ltd. |
2.9 |
Kinder Morgan, Inc. |
2.5 |
Total |
65.3 | |
| Material Fund Change [Text Block] |
|
| C000131666 |
|
| Shareholder Report [Line Items] |
|
| Fund Name |
Fidelity<sup style="inset: 1.5px 0px 4px; box-sizing: border-box; color: rgb(255, 255, 255); display: inline; flex-wrap: nowrap; font-size: 18px; font-weight: 300; grid-area: auto; line-height: 0px; margin: 0px; overflow: visible; position: relative; text-align: left; text-align-last: auto; white-space-collapse: preserve-breaks;">®</sup> MSCI Financials Index ETF
|
| Trading Symbol |
FNCL
|
| Security Exchange Name |
NYSEArca
|
| Annual or Semi-Annual Statement [Text Block] |
This annual shareholder report contains important information about Fidelity® MSCI Financials Index ETF for the period of August 1, 2025 to July 31, 2026.
|
| Additional Information [Text Block] |
You can find additional information about the Fund at fundresearch.fidelity.com/prospectus/sec. You can also request this information by contacting us at 1-800-FIDELITY or by sending an e-mail to fidfunddocuments@fidelity.com.
|
| Additional Information Phone Number |
1-800-FIDELITY
|
| Additional Information Email |
<span style="box-sizing: border-box; color: rgb(0, 0, 0); display: inline; flex-wrap: nowrap; font-size: 10.6667px; font-weight: 400; grid-area: auto; line-height: 16px; margin: 0px; overflow: visible; text-align: left; text-align-last: auto; white-space-collapse: preserve-breaks;">fidfunddocuments@fidelity.com</span>
|
| Additional Information Website |
fundresearch.fidelity.com/prospectus/sec
|
| Expenses [Text Block] |
What were the Fund costs for the last year?(based on a hypothetical $10,000 investment) FUND COST (PREVIOUS YEAR)
Table Summary
Class |
Costs of a $10,000 investment |
Costs paid as a percentage of a $10,000 investment |
Fidelity® MSCI Financials Index ETF |
$8 |
0.08% | |
| Expenses Paid, Amount |
$ 8
|
| Expense Ratio, Percent |
0.08%
|
| Factors Affecting Performance [Text Block] |
What affected the Fund's performance this period?• U.S. stocks achieved a strong gain for the 12 months ending July 31, 2026, reflecting enthusiasm for artificial intelligence, strong corporate fundamentals, a resilient economy and, beginning in September, the Federal Reserve’s first interest-rate reductions since December 2024. • Against this backdrop, diversified banks gained 26% and notably contributed to the fund's performance for the fiscal year. Investment banking & brokerage, which gained roughly 24%, also helped, as did regional banks, which advanced about 28%. The property & casualty insurance subindustry rose roughly 14%, while life & health insurance gained 31%. Other contributors included the reinsurance (+22%) and multi-line insurance (+26%) subindustries. • In contrast, financial exchanges & data returned -17% and notably detracted. Transaction & payment processing services (-3%) and insurance brokers (-8%) also hurt. Other detractors included the diversified financial services (-5%) subindustry. • Turning to individual stocks, the biggest contributor was JPMorgan Chase (+20%), from the diversified banks subindustry. Within the same subindustry, Bank of America (+32%) and Citigroup (+43%) also meaningfully contributed. Lastly, in investment banking & brokerage, Goldman Sachs Group (+44%) and Morgan Stanley (+50%) also added value. • Conversely, the biggest detractor was Coinbase Global (-63%), from the financial exchanges & data subindustry. From the same subindustry, S&P Global (-22%) hurt the fund's performance. In transaction & payment processing services, Fiserv returned -63% and hindered the fund. Lastly, in asset management & custody banks, Blackstone (-25%) and KKR (-32%) also hurt the fund. |
| Performance Past Does Not Indicate Future [Text] |
The Fund's past performance is not a good predictor of the Fund's future performance.
|
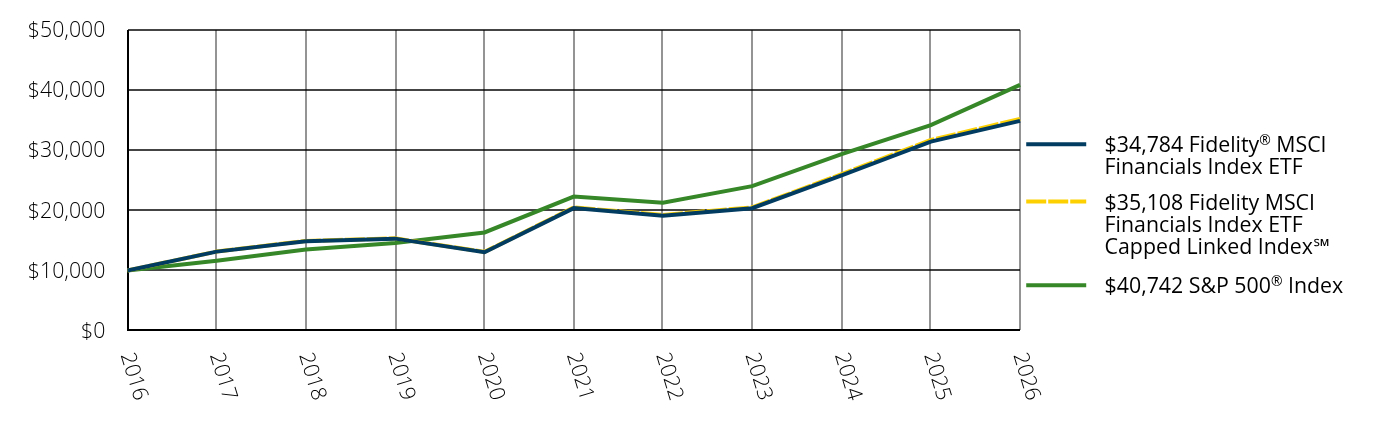
| Line Graph [Table Text Block] |
Table Summary
|
$34,784 Fidelity® MSCI Financials Index ETF |
$35,108 Fidelity MSCI Financials Index ETF Capped Linked Index℠ |
$40,742 S&P 500® Index |
2016 |
$10,000 |
$10,000 |
$10,000 |
2017 |
$13,129 |
$13,152 |
$11,604 |
2018 |
$14,866 |
$14,904 |
$13,489 |
2019 |
$15,282 |
$15,332 |
$14,566 |
2020 |
$13,024 |
$13,084 |
$16,308 |
2021 |
$20,336 |
$20,445 |
$22,251 |
2022 |
$19,094 |
$19,211 |
$21,219 |
2023 |
$20,324 |
$20,465 |
$23,980 |
2024 |
$25,757 |
$25,959 |
$29,292 |
2025 |
$31,342 |
$31,618 |
$34,076 |
2026 |
$34,784 |
$35,108 |
$40,742 |
|
| Average Annual Return [Table Text Block] |
AVERAGE ANNUAL TOTAL RETURNS:
Table Summary
Fund |
1 Year |
5 Years |
10 Years |
Fidelity® MSCI Financials Index ETF - NAV |
10.98% |
11.33% |
13.28% |
Fidelity MSCI Financials Index ETF Capped Linked Index℠ |
11.04% |
11.42% |
13.38% |
S&P 500® Index |
19.56% |
12.86% |
15.08% | Visit www.fidelity.com for more recent performance information. The Fund's past performance is not a good predictor of the Fund's future performance. The graph and table do not reflect the deduction of taxes that a shareholder would pay on fund distributions or redemption of fund shares. |
| No Deduction of Taxes [Text Block] |
The graph and table do not reflect the deduction of taxes that a shareholder would pay on fund distributions or redemption of fund shares.
|
| Updated Performance Information Location [Text Block] |
Visit www.fidelity.com for more recent performance information.
|
| AssetsNet |
$ 2,375,283,067
|
| Holdings Count | Holding |
388
|
| Advisory Fees Paid, Amount |
$ 1,940,644
|
| InvestmentCompanyPortfolioTurnover |
4.00%
|
| Additional Fund Statistics [Text Block] |
Table Summary
FUND STATISTICS |
Value |
Fund Size |
$2,375,283,067 |
Number of Holdings |
388 |
Portfolio Turnover |
4% |
Total Advisory Fee |
$1,940,644 | |
| Holdings [Text Block] |
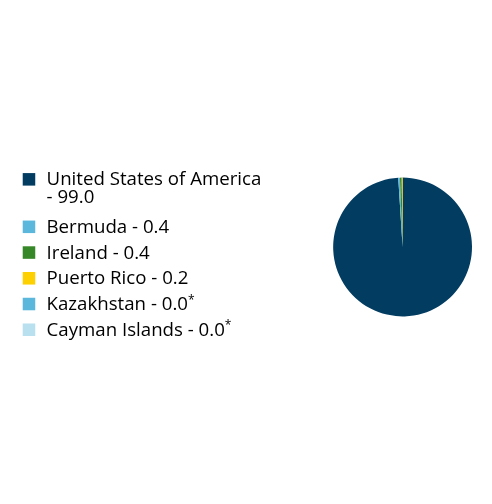
What did the Fund invest in? GEOGRAPHIC DIVERSIFICATION(% of Fund's net assets)
Table Summary
Value |
Value |
United States of America - |
99.0 |
Bermuda - |
0.4 |
Ireland - |
0.4 |
Puerto Rico - |
0.2 |
Kazakhstan - |
0.0Footnote Reference* |
Cayman Islands - |
0.0Footnote Reference* |
| Footnote |
Description |
Footnote* |
Amount rounds to less than 0.1%. | What did the Fund invest in? TOP INDUSTRIES(% of Fund's net assets)
Table Summary
Banks |
30.9 |
Capital Markets |
24.7 |
Financial Services |
24.4 |
Insurance |
14.5 |
Consumer Finance |
4.6 |
All Others |
0.9 | ASSET ALLOCATION(% of Fund's net assets)
Table Summary
Value |
Value |
Common Stocks - |
99.8 |
Short-Term Investments and Net Other Assets (Liabilities) - |
0.2 | |
| Largest Holdings [Text Block] |
TOP HOLDINGS(% of Fund's net assets)
Table Summary
JPMorgan Chase & Co. |
10.4 |
Berkshire Hathaway, Inc., Class B |
7.9 |
Visa, Inc., Class A |
6.8 |
Mastercard, Inc., Class A |
5.2 |
Bank of America Corp. |
4.7 |
Goldman Sachs Group, Inc. |
3.3 |
Wells Fargo & Co. |
2.9 |
Morgan Stanley |
2.8 |
Citigroup, Inc. |
2.5 |
American Express Co. |
2.0 |
Total |
48.5 | |
| Material Fund Change [Text Block] |
|
| C000131667 |
|
| Shareholder Report [Line Items] |
|
| Fund Name |
Fidelity<sup style="inset: 1.5px 0px 4px; box-sizing: border-box; color: rgb(255, 255, 255); display: inline; flex-wrap: nowrap; font-size: 18px; font-weight: 300; grid-area: auto; line-height: 0px; margin: 0px; overflow: visible; position: relative; text-align: left; text-align-last: auto; white-space-collapse: preserve-breaks;">®</sup> MSCI Health Care Index ETF
|
| Trading Symbol |
FHLC
|
| Security Exchange Name |
NYSEArca
|
| Annual or Semi-Annual Statement [Text Block] |
This annual shareholder report contains important information about Fidelity® MSCI Health Care Index ETF for the period of August 1, 2025 to July 31, 2026.
|
| Additional Information [Text Block] |
You can find additional information about the Fund at fundresearch.fidelity.com/prospectus/sec. You can also request this information by contacting us at 1-800-FIDELITY or by sending an e-mail to fidfunddocuments@fidelity.com.
|
| Additional Information Phone Number |
1-800-FIDELITY
|
| Additional Information Email |
<span style="box-sizing: border-box; color: rgb(0, 0, 0); display: inline; flex-wrap: nowrap; font-size: 10.6667px; font-weight: 400; grid-area: auto; line-height: 16px; margin: 0px; overflow: visible; text-align: left; text-align-last: auto; white-space-collapse: preserve-breaks;">fidfunddocuments@fidelity.com</span>
|
| Additional Information Website |
fundresearch.fidelity.com/prospectus/sec
|
| Expenses [Text Block] |
What were the Fund costs for the last year?(based on a hypothetical $10,000 investment) FUND COST (PREVIOUS YEAR)
Table Summary
Class |
Costs of a $10,000 investment |
Costs paid as a percentage of a $10,000 investment |
Fidelity® MSCI Health Care Index ETF |
$9 |
0.08% | |
| Expenses Paid, Amount |
$ 9
|
| Expense Ratio, Percent |
0.08%
|
| Factors Affecting Performance [Text Block] |
What affected the Fund's performance this period?• U.S. stocks achieved a strong gain for the 12 months ending July 31, 2026, reflecting enthusiasm for artificial intelligence, strong corporate fundamentals, a resilient economy and, beginning in September, the Federal Reserve’s first interest-rate reductions since December 2024. • Against this backdrop, pharmaceuticals gained 53% and contributed most to the fund's performance for the fiscal year. Biotechnology stocks also helped (+37%). Managed health care rose about 62%, life sciences tools & services gained approximately 22%, and health care services advanced 39%. Other contributors included the health care distributors (+25%), health care facilities (+23%) and health care supplies (+19%) subindustries. • In contrast, health care equipment returned -14% and detracted most. Health care technology (-34%) and personal care products (-40%) also hurt. • Turning to individual stocks, the top contributor was Eli Lilly (+57%), from the pharmaceuticals subindustry. From the same subindustry, Johnson & Johnson (+61%) and Merck (+75%) contributed. In managed health care, UnitedHealth (+71%) contributed. Lastly, AbbVie (+39%), a stock in the biotechnology subindustry, also helped. • Conversely, the biggest detractor was Boston Scientific (-54%), from the health care equipment subindustry. Within the same subindustry, Intuitive Surgical (-28%) and Abbott Laboratories (-15%) hurt the fund's performance. In pharmaceuticals, Zoetis (-47%) detracted. Lastly, Alnylam Pharmaceuticals (-48%), a stock in the biotechnology subindustry, also detracted. |
| Performance Past Does Not Indicate Future [Text] |
The Fund's past performance is not a good predictor of the Fund's future performance.
|
| Line Graph [Table Text Block] |
Table Summary
|
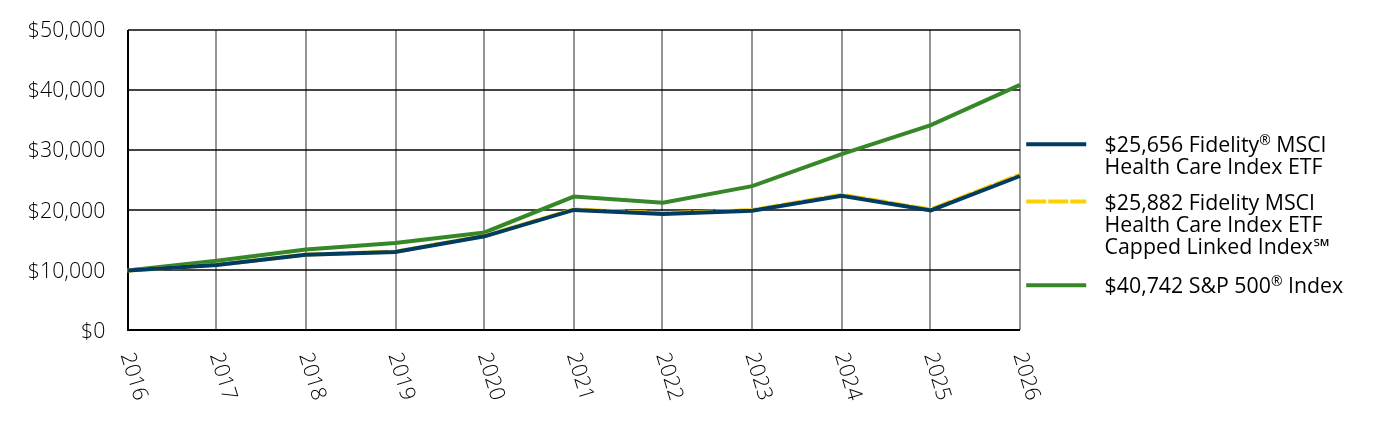
$25,656 Fidelity® MSCI Health Care Index ETF |
$25,882 Fidelity MSCI Health Care Index ETF Capped Linked Index℠ |
$40,742 S&P 500® Index |
2016 |
$10,000 |
$10,000 |
$10,000 |
2017 |
$10,928 |
$10,939 |
$11,604 |
2018 |
$12,604 |
$12,631 |
$13,489 |
2019 |
$13,088 |
$13,128 |
$14,566 |
2020 |
$15,665 |
$15,727 |
$16,308 |
2021 |
$20,038 |
$20,135 |
$22,251 |
2022 |
$19,373 |
$19,481 |
$21,219 |
2023 |
$19,887 |
$20,012 |
$23,980 |
2024 |
$22,386 |
$22,546 |
$29,292 |
2025 |
$19,959 |
$20,118 |
$34,076 |
2026 |
$25,656 |
$25,882 |
$40,742 |
|
| Average Annual Return [Table Text Block] |
AVERAGE ANNUAL TOTAL RETURNS:
Table Summary
Fund |
1 Year |
5 Years |
10 Years |
Fidelity® MSCI Health Care Index ETF - NAV |
28.54% |
5.07% |
9.88% |
Fidelity MSCI Health Care Index ETF Capped Linked Index℠ |
28.65% |
5.15% |
9.98% |
S&P 500® Index |
19.56% |
12.86% |
15.08% | Visit www.fidelity.com for more recent performance information. The Fund's past performance is not a good predictor of the Fund's future performance. The graph and table do not reflect the deduction of taxes that a shareholder would pay on fund distributions or redemption of fund shares. |
| No Deduction of Taxes [Text Block] |
The graph and table do not reflect the deduction of taxes that a shareholder would pay on fund distributions or redemption of fund shares.
|
| Updated Performance Information Location [Text Block] |
Visit www.fidelity.com for more recent performance information.
|
| AssetsNet |
$ 3,296,468,345
|
| Holdings Count | Holding |
337
|
| Advisory Fees Paid, Amount |
$ 2,355,922
|
| InvestmentCompanyPortfolioTurnover |
4.00%
|
| Additional Fund Statistics [Text Block] |
Table Summary
FUND STATISTICS |
Value |
Fund Size |
$3,296,468,345 |
Number of Holdings |
337 |
Portfolio Turnover |
4% |
Total Advisory Fee |
$2,355,922 | |
| Holdings [Text Block] |
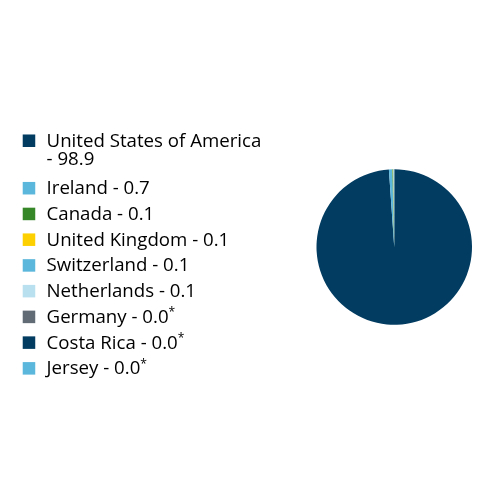
What did the Fund invest in? GEOGRAPHIC DIVERSIFICATION(% of Fund's net assets)
Table Summary
Value |
Value |
United States of America - |
98.9 |
Ireland - |
0.7 |
Canada - |
0.1 |
United Kingdom - |
0.1 |
Switzerland - |
0.1 |
Netherlands - |
0.1 |
Germany - |
0.0Footnote Reference* |
Costa Rica - |
0.0Footnote Reference* |
Jersey - |
0.0Footnote Reference* |
| Footnote |
Description |
Footnote* |
Amount rounds to less than 0.1%. | What did the Fund invest in? TOP INDUSTRIES(% of Fund's net assets)
Table Summary
Pharmaceuticals |
33.9 |
Biotechnology |
22.5 |
Health Care Providers & Services |
18.1 |
Health Care Equipment & Supplies |
15.4 |
Life Sciences Tools & Services |
9.2 |
All Others |
0.9 | ASSET ALLOCATION(% of Fund's net assets)
Table Summary
Value |
Value |
Common Stocks - |
99.7 |
Short-Term Investments and Net Other Assets (Liabilities) - |
0.3 | |
| Largest Holdings [Text Block] |
TOP HOLDINGS(% of Fund's net assets)
Table Summary
Eli Lilly & Co. |
13.3 |
Johnson & Johnson |
8.9 |
AbbVie, Inc. |
6.4 |
UnitedHealth Group, Inc. |
5.4 |
Merck & Co., Inc. |
4.7 |
Thermo Fisher Scientific, Inc. |
3.1 |
Amgen, Inc. |
3.0 |
Abbott Laboratories |
2.7 |
Gilead Sciences, Inc. |
2.3 |
Pfizer, Inc. |
2.1 |
Total |
51.9 | |
| Material Fund Change [Text Block] |
|
| C000131668 |
|
| Shareholder Report [Line Items] |
|
| Fund Name |
Fidelity<sup style="inset: 1.5px 0px 4px; box-sizing: border-box; color: rgb(255, 255, 255); display: inline; flex-wrap: nowrap; font-size: 18px; font-weight: 300; grid-area: auto; line-height: 0px; margin: 0px; overflow: visible; position: relative; text-align: left; text-align-last: auto; white-space-collapse: preserve-breaks;">®</sup> MSCI Industrials Index ETF
|
| Trading Symbol |
FIDU
|
| Security Exchange Name |
NYSEArca
|
| Annual or Semi-Annual Statement [Text Block] |
This annual shareholder report contains important information about Fidelity® MSCI Industrials Index ETF for the period of August 1, 2025 to July 31, 2026.
|
| Additional Information [Text Block] |
You can find additional information about the Fund at fundresearch.fidelity.com/prospectus/sec. You can also request this information by contacting us at 1-800-FIDELITY or by sending an e-mail to fidfunddocuments@fidelity.com.
|
| Additional Information Phone Number |
1-800-FIDELITY
|
| Additional Information Email |
<span style="box-sizing: border-box; color: rgb(0, 0, 0); display: inline; flex-wrap: nowrap; font-size: 10.6667px; font-weight: 400; grid-area: auto; line-height: 16px; margin: 0px; overflow: visible; text-align: left; text-align-last: auto; white-space-collapse: preserve-breaks;">fidfunddocuments@fidelity.com</span>
|
| Additional Information Website |
fundresearch.fidelity.com/prospectus/sec
|
| Expenses [Text Block] |
What were the Fund costs for the last year?(based on a hypothetical $10,000 investment) FUND COST (PREVIOUS YEAR)
Table Summary
Class |
Costs of a $10,000 investment |
Costs paid as a percentage of a $10,000 investment |
Fidelity® MSCI Industrials Index ETF |
$9 |
0.08% | |
| Expenses Paid, Amount |
$ 9
|
| Expense Ratio, Percent |
0.08%
|
| Factors Affecting Performance [Text Block] |
What affected the Fund's performance this period?• U.S. stocks achieved a strong gain for the 12 months ending July 31, 2026, reflecting enthusiasm for artificial intelligence, strong corporate fundamentals, a resilient economy and, beginning in September, the Federal Reserve’s first interest-rate reductions since December 2024. • Against this backdrop, aerospace & defense gained roughly 21% and contributed most to the fund's performance for the fiscal year. Construction machinery & heavy transportation equipment, which gained approximately 69%, also helped, as did construction & engineering, which advanced 50%. The electrical components & equipment subindustry rose about 24%, while heavy electrical equipment gained about 58%, and industrial machinery & supplies & components advanced 16%. Other contributors included the rail transportation (+34%), air freight & logistics (+44%), cargo ground transportation (+50%), trading companies & distributors (+13%), industrial conglomerates (+21%) and building products (+4%) subindustries. • Conversely, passenger ground transportation returned -20% and detracted most, followed by research & consulting services, which returned -17%. The human resource & employment services subindustry returned -11%. Data processing & outsourced services (-26%) also hurt. Diversified support services (-12%) and environmental & facilities services (-5%) hampered the fund's result, along with the specialized consumer services (-5%) subindustry. Lastly, specialty chemicals (0%) also hurt. • Turning to individual stocks, the top contributor was Caterpillar (+87%), from the construction machinery & heavy transportation equipment subindustry. In aerospace & defense, GE Aerospace (+34%) and RTX (+39%) helped. In heavy electrical equipment, GE Vernova gained roughly 52% and helped. Lastly, in rail transportation, Union Pacific (+34%) contributed. • In contrast, the biggest detractor was Uber Technologies (-21%), from the passenger ground transportation subindustry. Axon Enterprise (-31%) and TransDigm Group (-17%), from the aerospace & defense subindustry, hurt the fund's performance. In diversified support services, Copart (-36%) hurt. Lastly, Automatic Data Processing (-12%), a stock in the human resource & employment services subindustry, also hindered the fund. |
| Performance Past Does Not Indicate Future [Text] |
The Fund's past performance is not a good predictor of the Fund's future performance.
|
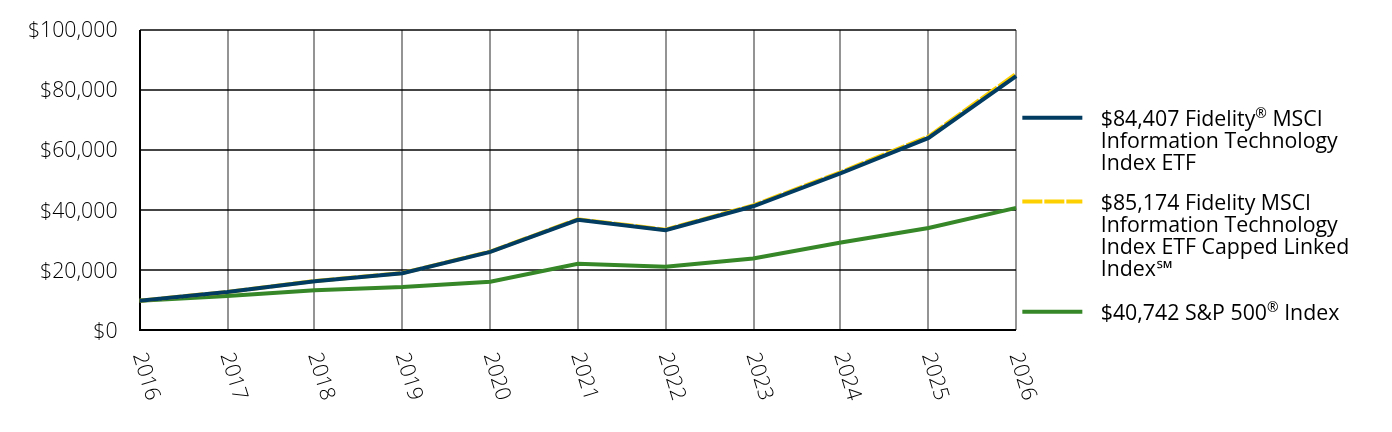
| Line Graph [Table Text Block] |
Table Summary
|
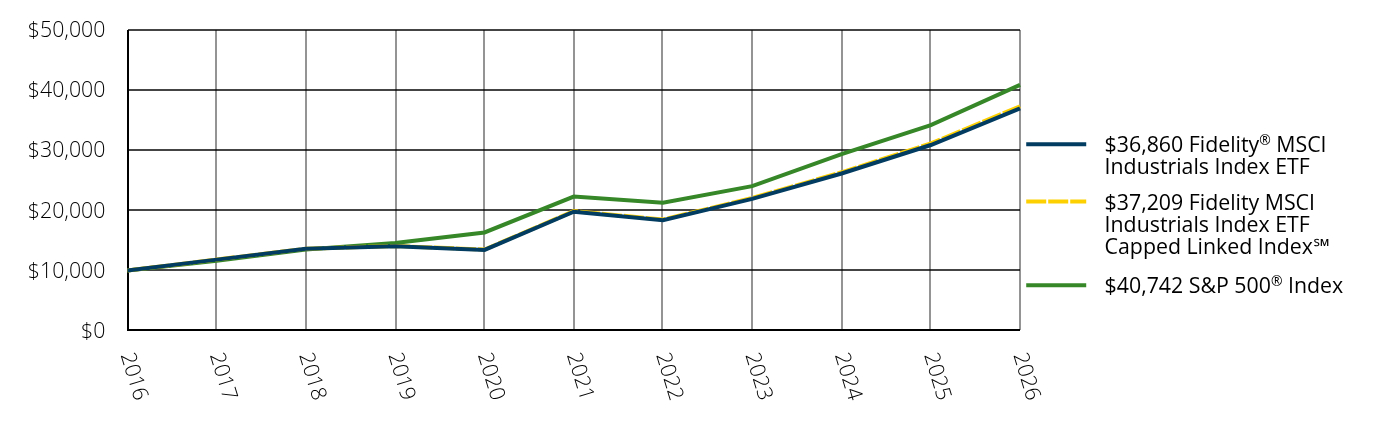
$36,860 Fidelity® MSCI Industrials Index ETF |
$37,209 Fidelity MSCI Industrials Index ETF Capped Linked Index℠ |
$40,742 S&P 500® Index |
2016 |
$10,000 |
$10,000 |
$10,000 |
2017 |
$11,808 |
$11,819 |
$11,604 |
2018 |
$13,589 |
$13,617 |
$13,489 |
2019 |
$14,028 |
$14,066 |
$14,566 |
2020 |
$13,419 |
$13,470 |
$16,308 |
2021 |
$19,749 |
$19,843 |
$22,251 |
2022 |
$18,346 |
$18,447 |
$21,219 |
2023 |
$21,862 |
$22,003 |
$23,980 |
2024 |
$26,072 |
$26,270 |
$29,292 |
2025 |
$30,785 |
$31,048 |
$34,076 |
2026 |
$36,860 |
$37,209 |
$40,742 |
|
| Average Annual Return [Table Text Block] |
AVERAGE ANNUAL TOTAL RETURNS:
Table Summary
Fund |
1 Year |
5 Years |
10 Years |
Fidelity® MSCI Industrials Index ETF - NAV |
19.73% |
13.29% |
13.93% |
Fidelity MSCI Industrials Index ETF Capped Linked Index℠ |
19.84% |
13.40% |
14.04% |
S&P 500® Index |
19.56% |
12.86% |
15.08% | Visit www.fidelity.com for more recent performance information. The Fund's past performance is not a good predictor of the Fund's future performance. The graph and table do not reflect the deduction of taxes that a shareholder would pay on fund distributions or redemption of fund shares. |
| No Deduction of Taxes [Text Block] |
The graph and table do not reflect the deduction of taxes that a shareholder would pay on fund distributions or redemption of fund shares.
|
| Updated Performance Information Location [Text Block] |
Visit www.fidelity.com for more recent performance information.
|
| AssetsNet |
$ 2,312,817,566
|
| Holdings Count | Holding |
365
|
| Advisory Fees Paid, Amount |
$ 1,506,267
|
| InvestmentCompanyPortfolioTurnover |
4.00%
|
| Additional Fund Statistics [Text Block] |
Table Summary
FUND STATISTICS |
Value |
Fund Size |
$2,312,817,566 |
Number of Holdings |
365 |
Portfolio Turnover |
4% |
Total Advisory Fee |
$1,506,267 | |
| Holdings [Text Block] |
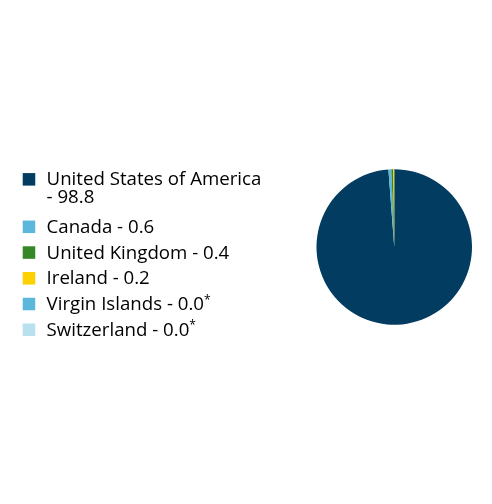
What did the Fund invest in? GEOGRAPHIC DIVERSIFICATION(% of Fund's net assets)
Table Summary
Value |
Value |
United States of America - |
98.8 |
Canada - |
0.6 |
United Kingdom - |
0.4 |
Ireland - |
0.2 |
Virgin Islands - |
0.0Footnote Reference* |
Switzerland - |
0.0Footnote Reference* |
| Footnote |
Description |
Footnote* |
Amount rounds to less than 0.1%. | What did the Fund invest in? TOP INDUSTRIES(% of Fund's net assets)
Table Summary
Aerospace & Defense |
25.1 |
Machinery |
20.4 |
Electrical Equipment |
13.0 |
Ground Transportation |
8.9 |
Building Products |
5.8 |
All Others |
26.8 | ASSET ALLOCATION(% of Fund's net assets)
Table Summary
Value |
Value |
Common Stocks - |
99.9 |
Short-Term Investments and Net Other Assets (Liabilities) - |
0.1 | |
| Largest Holdings [Text Block] |
TOP HOLDINGS(% of Fund's net assets)
Table Summary
Caterpillar, Inc. |
5.4 |
General Electric Co. |
5.3 |
RTX Corp. |
4.1 |
GE Vernova, Inc. |
3.8 |
Union Pacific Corp. |
2.5 |
Boeing Co. |
2.3 |
Eaton Corp. PLC |
2.3 |
Deere & Co. |
2.0 |
Uber Technologies, Inc. |
1.8 |
Parker-Hannifin Corp. |
1.8 |
Total |
31.3 | |
| Material Fund Change [Text Block] |
|
| C000131669 |
|
| Shareholder Report [Line Items] |
|
| Fund Name |
Fidelity<sup style="inset: 1.5px 0px 4px; box-sizing: border-box; color: rgb(255, 255, 255); display: inline; flex-wrap: nowrap; font-size: 18px; font-weight: 300; grid-area: auto; line-height: 0px; margin: 0px; overflow: visible; position: relative; text-align: left; text-align-last: auto; white-space-collapse: preserve-breaks;">®</sup> MSCI Information Technology Index ETF
|
| Trading Symbol |
FTEC
|
| Security Exchange Name |
NYSEArca
|
| Annual or Semi-Annual Statement [Text Block] |
This annual shareholder report contains important information about Fidelity® MSCI Information Technology Index ETF for the period of August 1, 2025 to July 31, 2026.
|
| Additional Information [Text Block] |
You can find additional information about the Fund at fundresearch.fidelity.com/prospectus/sec. You can also request this information by contacting us at 1-800-FIDELITY or by sending an e-mail to fidfunddocuments@fidelity.com.
|
| Additional Information Phone Number |
1-800-FIDELITY
|
| Additional Information Email |
<span style="box-sizing: border-box; color: rgb(0, 0, 0); display: inline; flex-wrap: nowrap; font-size: 10.6667px; font-weight: 400; grid-area: auto; line-height: 16px; margin: 0px; overflow: visible; text-align: left; text-align-last: auto; white-space-collapse: preserve-breaks;">fidfunddocuments@fidelity.com</span>
|
| Additional Information Website |
fundresearch.fidelity.com/prospectus/sec
|
| Expenses [Text Block] |
What were the Fund costs for the last year?(based on a hypothetical $10,000 investment) FUND COST (PREVIOUS YEAR)
Table Summary
Class |
Costs of a $10,000 investment |
Costs paid as a percentage of a $10,000 investment |
Fidelity® MSCI Information Technology Index ETF |
$9 |
0.08% | |
| Expenses Paid, Amount |
$ 9
|
| Expense Ratio, Percent |
0.08%
|
| Factors Affecting Performance [Text Block] |
What affected the Fund's performance this period?• U.S. stocks achieved a strong gain for the 12 months ending July 31, 2026, reflecting enthusiasm for artificial intelligence, strong corporate fundamentals, a resilient economy and, beginning in September, the Federal Reserve’s first interest-rate reductions since December 2024. • Against this backdrop, semiconductors gained 50% and contributed most to the fund's performance for the fiscal year. Technology hardware, storage & peripherals, which gained 72%, also helped, as did semiconductor materials & equipment, which advanced 163%. The communications equipment subindustry rose roughly 88%, while electronic components gained about 81%, and internet services & infrastructure advanced approximately 36%. Other contributors included the electronic manufacturing services (+56%), electronic equipment & instruments (+25%) and technology distributors (+38%). • Conversely, application software returned roughly -23% and detracted most. Systems software (-10%) and IT consulting & other services (-27%) also hurt. • Turning to individual stocks, the top contributor was Apple (+49%), from the technology hardware, storage & peripherals subindustry. Lastly, Micron Technology (+638%), Advanced Micro Devices (+166%), NVIDIA (+12%) and Intel (+359%), within the semiconductors subindustry, also helped. • In contrast, the biggest detractor was Microsoft (-12%), from the systems software subindustry. From the same subindustry, Oracle (-49%) and ServiceNow (-41%) hurt the fund. Lastly, Intuit (-59%) and Strategy (-79%), within the application software subindustry, also hindered the fund. |
| Performance Past Does Not Indicate Future [Text] |
The Fund's past performance is not a good predictor of the Fund's future performance.
|
| Line Graph [Table Text Block] |
Table Summary
|
$84,407 Fidelity® MSCI Information Technology Index ETF |
$85,174 Fidelity MSCI Information Technology Index ETF Capped Linked Index℠ |
$40,742 S&P 500® Index |
2016 |
$10,000 |
$10,000 |
$10,000 |
2017 |
$12,884 |
$12,900 |
$11,604 |
2018 |
$16,482 |
$16,523 |
$13,489 |
2019 |
$19,109 |
$19,172 |
$14,566 |
2020 |
$26,177 |
$26,291 |
$16,308 |
2021 |
$36,798 |
$36,991 |
$22,251 |
2022 |
$33,335 |
$33,534 |
$21,219 |
2023 |
$41,289 |
$41,574 |
$23,980 |
2024 |
$52,269 |
$52,617 |
$29,292 |
2025 |
$63,904 |
$64,386 |
$34,076 |
2026 |
$84,407 |
$85,174 |
$40,742 |
|
| Average Annual Return [Table Text Block] |
AVERAGE ANNUAL TOTAL RETURNS:
Table Summary
Fund |
1 Year |
5 Years |
10 Years |
Fidelity® MSCI Information Technology Index ETF - NAV |
32.08% |
18.06% |
23.78% |
Fidelity MSCI Information Technology Index ETF Capped Linked Index℠ |
32.29% |
18.15% |
23.89% |
S&P 500® Index |
19.56% |
12.86% |
15.08% | Visit www.fidelity.com for more recent performance information. The Fund's past performance is not a good predictor of the Fund's future performance. The graph and table do not reflect the deduction of taxes that a shareholder would pay on fund distributions or redemption of fund shares. |
| No Deduction of Taxes [Text Block] |
The graph and table do not reflect the deduction of taxes that a shareholder would pay on fund distributions or redemption of fund shares.
|
| Updated Performance Information Location [Text Block] |
Visit www.fidelity.com for more recent performance information.
|
| AssetsNet |
$ 19,851,859,939
|
| Holdings Count | Holding |
282
|
| Advisory Fees Paid, Amount |
$ 14,395,429
|
| InvestmentCompanyPortfolioTurnover |
9.00%
|
| Additional Fund Statistics [Text Block] |
Table Summary
FUND STATISTICS |
Value |
Fund Size |
$19,851,859,939 |
Number of Holdings |
282 |
Portfolio Turnover |
9% |
Total Advisory Fee |
$14,395,429 | |
| Holdings [Text Block] |
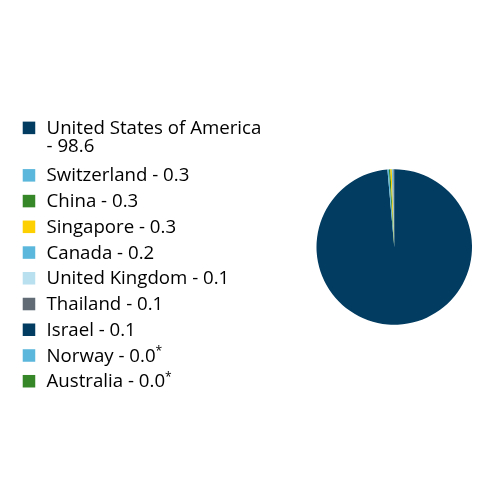
What did the Fund invest in? GEOGRAPHIC DIVERSIFICATION(% of Fund's net assets)
Table Summary
Value |
Value |
United States of America - |
98.6 |
Switzerland - |
0.3 |
China - |
0.3 |
Singapore - |
0.3 |
Canada - |
0.2 |
United Kingdom - |
0.1 |
Thailand - |
0.1 |
Israel - |
0.1 |
Norway - |
0.0Footnote Reference* |
Australia - |
0.0Footnote Reference* |
| Footnote |
Description |
Footnote* |
Amount rounds to less than 0.1%. | What did the Fund invest in? TOP INDUSTRIES(% of Fund's net assets)
Table Summary
Semiconductors & Semiconductor Equipment |
41.9 |
Software |
24.5 |
Technology Hardware, Storage & Peripherals |
20.4 |
Electronic Equipment, Instruments & Components |
5.1 |
Communications Equipment |
4.3 |
All Others |
3.8 | ASSET ALLOCATION(% of Fund's net assets)
Table Summary
Value |
Value |
Common Stocks - |
99.9 |
Short-Term Investments and Net Other Assets (Liabilities) - |
0.1 | |
| Largest Holdings [Text Block] |
TOP HOLDINGS(% of Fund's net assets)
Table Summary
NVIDIA Corp. |
17.2 |
Apple, Inc. |
16.3 |
Microsoft Corp. |
11.0 |
Broadcom, Inc. |
4.2 |
Micron Technology, Inc. |
3.8 |
Advanced Micro Devices, Inc. |
3.2 |
Cisco Systems, Inc. |
1.9 |
Applied Materials, Inc. |
1.7 |
Intel Corp. |
1.7 |
Lam Research Corp. |
1.5 |
Total |
62.5 | |
| Material Fund Change [Text Block] |
|
| C000131670 |
|
| Shareholder Report [Line Items] |
|
| Fund Name |
Fidelity<sup style="inset: 1.5px 0px 4px; box-sizing: border-box; color: rgb(255, 255, 255); display: inline; flex-wrap: nowrap; font-size: 18px; font-weight: 300; grid-area: auto; line-height: 0px; margin: 0px; overflow: visible; position: relative; text-align: left; text-align-last: auto; white-space-collapse: preserve-breaks;">®</sup> MSCI Materials Index ETF
|
| Trading Symbol |
FMAT
|
| Security Exchange Name |
NYSEArca
|
| Annual or Semi-Annual Statement [Text Block] |
This annual shareholder report contains important information about Fidelity® MSCI Materials Index ETF for the period of August 1, 2025 to July 31, 2026.
|
| Additional Information [Text Block] |
You can find additional information about the Fund at fundresearch.fidelity.com/prospectus/sec. You can also request this information by contacting us at 1-800-FIDELITY or by sending an e-mail to fidfunddocuments@fidelity.com.
|
| Additional Information Phone Number |
1-800-FIDELITY
|
| Additional Information Email |
<span style="box-sizing: border-box; color: rgb(0, 0, 0); display: inline; flex-wrap: nowrap; font-size: 10.6667px; font-weight: 400; grid-area: auto; line-height: 16px; margin: 0px; overflow: visible; text-align: left; text-align-last: auto; white-space-collapse: preserve-breaks;">fidfunddocuments@fidelity.com</span>
|
| Additional Information Website |
fundresearch.fidelity.com/prospectus/sec
|
| Expenses [Text Block] |
What were the Fund costs for the last year?(based on a hypothetical $10,000 investment) FUND COST (PREVIOUS YEAR)
Table Summary
Class |
Costs of a $10,000 investment |
Costs paid as a percentage of a $10,000 investment |
Fidelity® MSCI Materials Index ETF |
$9 |
0.08% | |
| Expenses Paid, Amount |
$ 9
|
| Expense Ratio, Percent |
0.08%
|
| Factors Affecting Performance [Text Block] |
What affected the Fund's performance this period?• U.S. stocks achieved a strong gain for the 12 months ending July 31, 2026, reflecting enthusiasm for artificial intelligence, strong corporate fundamentals, a resilient economy and, beginning in September, the Federal Reserve’s first interest-rate reductions since December 2024. • Against this backdrop, steel gained 65% and contributed most to the fund's performance for the fiscal year. Specialty chemicals, which gained 14%, also helped, as did gold, which advanced 49%. The copper subindustry rose 58%, while industrial gases gained 5%, and commodity chemicals advanced 18%. Other contributors included the aluminum (+71%), paper & plastic packaging products & materials (+7%), silver (+150%), fertilizers & agricultural chemicals (+4%), metal, glass & plastic containers (+6%) and diversified chemicals (+27%) subindustries. • In contrast, construction materials returned -1% and detracted most, followed by diversified metals & mining, which returned -11%. The building products subindustry returned -12%, and paper products (-15%) also hurt. Other detractors included the aerospace & defense (-1%), broadline retail (-71%) and semiconductor materials & equipment (-6%) subindustries. • Turning to individual stocks, the top contributor was Newmont (+54%), from the gold subindustry. In copper, Freeport-McMoRan (+58%) lifted the fund. Nucor (+78%) and Steel Dynamics (+97%), within the steel subindustry, helped. Lastly, in industrial gases, Linde gained 5% and also lifted the fund. • Conversely, the biggest detractor was Mosaic (-38%), from the fertilizers & agricultural chemicals subindustry. From the same subindustry, FMC returned -71% and detracted. In paper & plastic packaging products & materials, Graphic Packaging Holding (-52%) hurt the fund's performance. Martin Marietta Materials (-9%), a stock in the construction materials subindustry, detracted as well. Lastly, in diversified metals & mining, MP Materials (-31%) also hurt. |
| Performance Past Does Not Indicate Future [Text] |
The Fund's past performance is not a good predictor of the Fund's future performance.
|
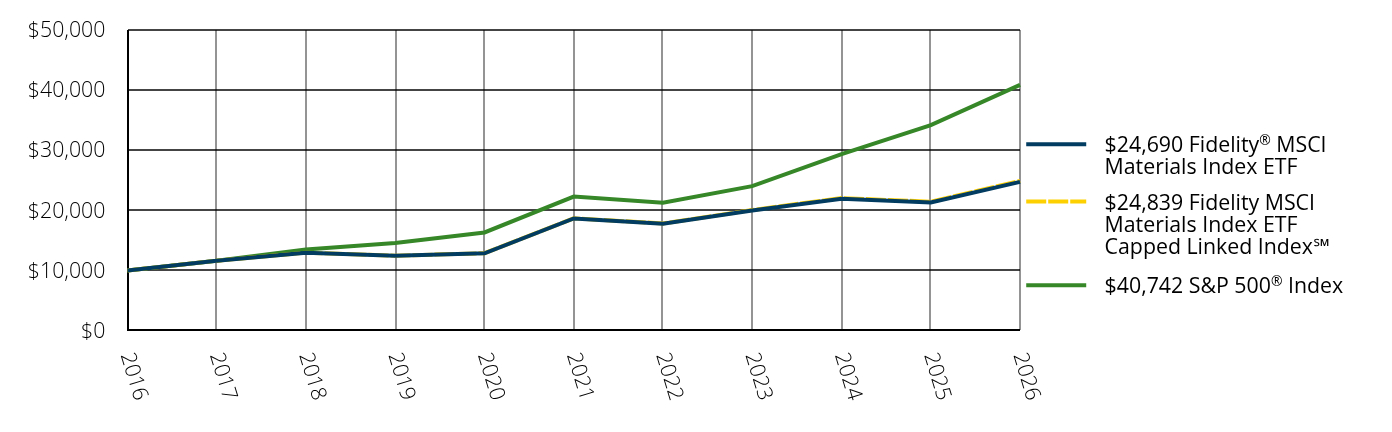
| Line Graph [Table Text Block] |
Table Summary
|
$24,690 Fidelity® MSCI Materials Index ETF |
$24,839 Fidelity MSCI Materials Index ETF Capped Linked Index℠ |
$40,742 S&P 500® Index |
2016 |
$10,000 |
$10,000 |
$10,000 |
2017 |
$11,616 |
$11,626 |
$11,604 |
2018 |
$12,956 |
$12,962 |
$13,489 |
2019 |
$12,435 |
$12,458 |
$14,566 |
2020 |
$12,843 |
$12,879 |
$16,308 |
2021 |
$18,623 |
$18,652 |
$22,251 |
2022 |
$17,751 |
$17,795 |
$21,219 |
2023 |
$19,955 |
$20,022 |
$23,980 |
2024 |
$21,905 |
$21,999 |
$29,292 |
2025 |
$21,285 |
$21,395 |
$34,076 |
2026 |
$24,690 |
$24,839 |
$40,742 |
|
| Average Annual Return [Table Text Block] |
AVERAGE ANNUAL TOTAL RETURNS:
Table Summary
Fund |
1 Year |
5 Years |
10 Years |
Fidelity® MSCI Materials Index ETF - NAV |
16.00% |
5.80% |
9.46% |
Fidelity MSCI Materials Index ETF Capped Linked Index℠ |
16.10% |
5.90% |
9.53% |
S&P 500® Index |
19.56% |
12.86% |
15.08% | Visit www.fidelity.com for more recent performance information. The Fund's past performance is not a good predictor of the Fund's future performance. The graph and table do not reflect the deduction of taxes that a shareholder would pay on fund distributions or redemption of fund shares. |
| No Deduction of Taxes [Text Block] |
The graph and table do not reflect the deduction of taxes that a shareholder would pay on fund distributions or redemption of fund shares.
|
| Updated Performance Information Location [Text Block] |
Visit www.fidelity.com for more recent performance information.
|
| AssetsNet |
$ 578,674,493
|
| Holdings Count | Holding |
102
|
| Advisory Fees Paid, Amount |
$ 426,086
|
| InvestmentCompanyPortfolioTurnover |
10.00%
|
| Additional Fund Statistics [Text Block] |
Table Summary
FUND STATISTICS |
Value |
Fund Size |
$578,674,493 |
Number of Holdings |
102 |
Portfolio Turnover |
10% |
Total Advisory Fee |
$426,086 | |
| Holdings [Text Block] |
What did the Fund invest in? GEOGRAPHIC DIVERSIFICATION(% of Fund's net assets)
Table Summary
Value |
Value |
United States of America - |
99.8 |
Canada - |
0.2 |
United Kingdom - |
0.0Footnote Reference* |
| Footnote |
Description |
Footnote* |
Amount rounds to less than 0.1%. | What did the Fund invest in? TOP INDUSTRIES(% of Fund's net assets)
Table Summary
Chemicals |
49.7 |
Metals & Mining |
28.1 |
Construction Materials |
11.4 |
Containers & Packaging |
10.6 |
Paper & Forest Products |
0.1 |
All Others |
0.1 | ASSET ALLOCATION(% of Fund's net assets)
Table Summary
Value |
Value |
Common Stocks - |
99.9 |
Short-Term Investments and Net Other Assets (Liabilities) - |
0.1 | |
| Largest Holdings [Text Block] |
TOP HOLDINGS(% of Fund's net assets)
Table Summary
Linde PLC |
15.1 |
Newmont Corp. |
6.9 |
Freeport-McMoRan, Inc. |
6.2 |
Sherwin-Williams Co. |
5.5 |
Ecolab, Inc. |
4.8 |
CRH PLC |
4.3 |
Air Products & Chemicals, Inc. |
4.3 |
Nucor Corp. |
3.9 |
Corteva, Inc. |
3.6 |
Vulcan Materials Co. |
2.4 |
Total |
57.0 | |
| Material Fund Change [Text Block] |
|
| C000151119 |
|
| Shareholder Report [Line Items] |
|
| Fund Name |
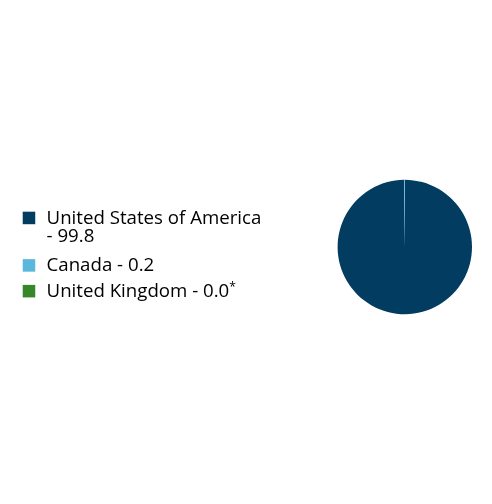
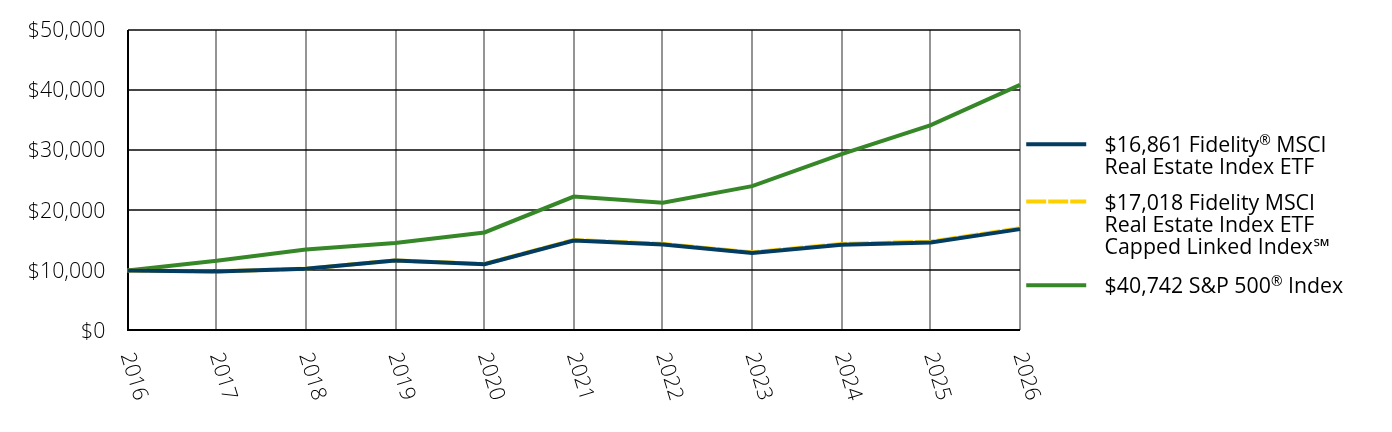
Fidelity<sup style="inset: 1.5px 0px 4px; box-sizing: border-box; color: rgb(255, 255, 255); display: inline; flex-wrap: nowrap; font-size: 18px; font-weight: 300; grid-area: auto; line-height: 0px; margin: 0px; overflow: visible; position: relative; text-align: left; text-align-last: auto; white-space-collapse: preserve-breaks;">®</sup> MSCI Real Estate Index ETF
|
| Trading Symbol |
FREL
|
| Security Exchange Name |
NYSEArca
|
| Annual or Semi-Annual Statement [Text Block] |
This annual shareholder report contains important information about Fidelity® MSCI Real Estate Index ETF for the period of August 1, 2025 to July 31, 2026.
|
| Additional Information [Text Block] |
You can find additional information about the Fund at fundresearch.fidelity.com/prospectus/sec. You can also request this information by contacting us at 1-800-FIDELITY or by sending an e-mail to fidfunddocuments@fidelity.com.
|
| Additional Information Phone Number |
1-800-FIDELITY
|
| Additional Information Email |
<span style="box-sizing: border-box; color: rgb(0, 0, 0); display: inline; flex-wrap: nowrap; font-size: 10.6667px; font-weight: 400; grid-area: auto; line-height: 16px; margin: 0px; overflow: visible; text-align: left; text-align-last: auto; white-space-collapse: preserve-breaks;">fidfunddocuments@fidelity.com</span>
|
| Additional Information Website |
fundresearch.fidelity.com/prospectus/sec
|
| Expenses [Text Block] |
What were the Fund costs for the last year?(based on a hypothetical $10,000 investment) FUND COST (PREVIOUS YEAR)
Table Summary
Class |
Costs of a $10,000 investment |
Costs paid as a percentage of a $10,000 investment |
Fidelity® MSCI Real Estate Index ETF |
$9 |
0.08% | |
| Expenses Paid, Amount |
$ 9
|
| Expense Ratio, Percent |
0.08%
|
| Factors Affecting Performance [Text Block] |
What affected the Fund's performance this period?• U.S. stocks achieved a strong gain for the 12 months ending July 31, 2026, reflecting enthusiasm for artificial intelligence, strong corporate fundamentals, a resilient economy and, beginning in September, the Federal Reserve’s first interest-rate reductions since December 2024. • Against this backdrop, health care REITs gained about 37% and contributed most to the ETF's performance for the fiscal year. The retail industry, which advanced 31%, also helped, as did industrial REITs, which were up 35%. The data center category rose 21%, while hotel & resort gained 61%, and self storage advanced 20%. Other contributors included the other specialized (+12%), multi-family residential (+5%), diversified (+21%), office (+8%), single-family residential (+3%) and real estate operating companies (+50%) segments of the REIT market. • Conversely, real estate services returned about -27% and detracted most. Telecom tower (-17%) REITs also hurt. Other detractors were the integrated telecommunication services (-47%) subindustry and the real estate development (-4%) group. • Turning to individual stocks, the biggest contributor was Welltower (+45%), from the health care industry. From the same category, Ventas (+43%) lifted the fund as well. Among industrial REITs, Prologis gained roughly 40% and also contributed. Another notable contributor was Simon Property (+46%), a stock in the retail segment. Lastly, in the data center category, Equinix gained roughly 34% and also lifted the fund. • In contrast, the biggest detractor was CoStar (-70%), in real estate services. From the same industry, Zillow returned about -58% and hurt the fund as well. Among telecom tower REITs, American Tower (-16%) and Crown Castle (-26%) further detracted. Lastly, VICI Properties (-14%), from the other specialized category, also hurt the fund's performance. |
| Performance Past Does Not Indicate Future [Text] |
The Fund's past performance is not a good predictor of the Fund's future performance.
|
| Line Graph [Table Text Block] |
Table Summary
|
$16,861 Fidelity® MSCI Real Estate Index ETF |
$17,018 Fidelity MSCI Real Estate Index ETF Capped Linked Index℠ |
$40,742 S&P 500® Index |
2016 |
$10,000 |
$10,000 |
$10,000 |
2017 |
$9,848 |
$9,852 |
$11,604 |
2018 |
$10,294 |
$10,307 |
$13,489 |
2019 |
$11,651 |
$11,669 |
$14,566 |
2020 |
$11,037 |
$11,085 |
$16,308 |
2021 |
$14,965 |
$15,063 |
$22,251 |
2022 |
$14,328 |
$14,416 |
$21,219 |
2023 |
$12,916 |
$13,009 |
$23,980 |
2024 |
$14,284 |
$14,413 |
$29,292 |
2025 |
$14,656 |
$14,781 |
$34,076 |
2026 |
$16,861 |
$17,018 |
$40,742 |
|
| Average Annual Return [Table Text Block] |
AVERAGE ANNUAL TOTAL RETURNS:
Table Summary
Fund |
1 Year |
5 Years |
10 Years |
Fidelity® MSCI Real Estate Index ETF - NAV |
15.04% |
2.41% |
5.36% |
Fidelity MSCI Real Estate Index ETF Capped Linked Index℠ |
15.14% |
2.47% |
5.46% |
S&P 500® Index |
19.56% |
12.86% |
15.08% | Visit www.fidelity.com for more recent performance information. The Fund's past performance is not a good predictor of the Fund's future performance. The graph and table do not reflect the deduction of taxes that a shareholder would pay on fund distributions or redemption of fund shares. |
| No Deduction of Taxes [Text Block] |
The graph and table do not reflect the deduction of taxes that a shareholder would pay on fund distributions or redemption of fund shares.
|
| Updated Performance Information Location [Text Block] |
Visit www.fidelity.com for more recent performance information.
|
| AssetsNet |
$ 1,493,430,546
|
| Holdings Count | Holding |
124
|
| Advisory Fees Paid, Amount |
$ 1,054,621
|
| InvestmentCompanyPortfolioTurnover |
8.00%
|
| Additional Fund Statistics [Text Block] |
Table Summary
FUND STATISTICS |
Value |
Fund Size |
$1,493,430,546 |
Number of Holdings |
124 |
Portfolio Turnover |
8% |
Total Advisory Fee |
$1,054,621 | |
| Holdings [Text Block] |
What did the Fund invest in? GEOGRAPHIC DIVERSIFICATION(% of Fund's net assets)
Table Summary
Value |
Value |
United States of America - |
100.0 | What did the Fund invest in? TOP INDUSTRIES(% of Fund's net assets)
Table Summary
Specialized REITs |
31.2 |
Health Care REITs |
16.9 |
Retail REITs |
15.2 |
Industrial REITs |
11.3 |
Residential REITs |
10.8 |
All Others |
14.6 | ASSET ALLOCATION(% of Fund's net assets)
Table Summary
Value |
Value |
Common Stocks - |
99.6 |
Short-Term Investments and Net Other Assets (Liabilities) - |
0.4 | |
| Largest Holdings [Text Block] |
TOP HOLDINGS(% of Fund's net assets)
Table Summary
Welltower, Inc. |
9.1 |
Prologis, Inc. |
7.9 |
Equinix, Inc. |
5.2 |
Simon Property Group, Inc. |
4.7 |
American Tower Corp. |
4.1 |
Digital Realty Trust, Inc. |
3.9 |
Realty Income Corp. |
3.6 |
Public Storage |
3.4 |
CBRE Group, Inc., Class A |
2.7 |
Ventas, Inc. |
2.7 |
Total |
47.3 | |
| Material Fund Change [Text Block] |
|
| C000131663 |
|
| Shareholder Report [Line Items] |
|
| Fund Name |
Fidelity<sup style="inset: 1.5px 0px 4px; box-sizing: border-box; color: rgb(255, 255, 255); display: inline; flex-wrap: nowrap; font-size: 18px; font-weight: 300; grid-area: auto; line-height: 0px; margin: 0px; overflow: visible; position: relative; text-align: left; text-align-last: auto; white-space-collapse: preserve-breaks;">®</sup> MSCI Utilities Index ETF
|
| Trading Symbol |
FUTY
|
| Security Exchange Name |
NYSEArca
|
| Annual or Semi-Annual Statement [Text Block] |
This annual shareholder report contains important information about Fidelity® MSCI Utilities Index ETF for the period of August 1, 2025 to July 31, 2026.
|
| Additional Information [Text Block] |
You can find additional information about the Fund at fundresearch.fidelity.com/prospectus/sec. You can also request this information by contacting us at 1-800-FIDELITY or by sending an e-mail to fidfunddocuments@fidelity.com.
|
| Additional Information Phone Number |
1-800-FIDELITY
|
| Additional Information Email |
<span style="box-sizing: border-box; color: rgb(0, 0, 0); display: inline; flex-wrap: nowrap; font-size: 10.6667px; font-weight: 400; grid-area: auto; line-height: 16px; margin: 0px; overflow: visible; text-align: left; text-align-last: auto; white-space-collapse: preserve-breaks;">fidfunddocuments@fidelity.com</span>
|
| Additional Information Website |
fundresearch.fidelity.com/prospectus/sec
|
| Expenses [Text Block] |
What were the Fund costs for the last year?(based on a hypothetical $10,000 investment) FUND COST (PREVIOUS YEAR)
Table Summary
Class |
Costs of a $10,000 investment |
Costs paid as a percentage of a $10,000 investment |
Fidelity® MSCI Utilities Index ETF |
$8 |
0.08% | |
| Expenses Paid, Amount |
$ 8
|
| Expense Ratio, Percent |
0.08%
|
| Factors Affecting Performance [Text Block] |
What affected the Fund's performance this period?• U.S. stocks achieved a strong gain for the 12 months ending July 31, 2026, reflecting enthusiasm for artificial intelligence, strong corporate fundamentals, a resilient economy and, beginning in September, the Federal Reserve’s first interest-rate reductions since December 2024. • Against this backdrop, electric utilities gained about 8% and contributed most to the fund's performance for the fiscal year. Multi-utilities stocks (+8%) also helped. The gas utilities subindustry rose 12%. Other contributors included the water utilities (+4%) and renewable electricity (+9%) subindustries. • In contrast, independent power producers & energy traders returned -21% and detracted most. • Turning to individual stocks, the top contributor was NextEra Energy (+26%), from the electric utilities subindustry. Within the same subindustry, American Electric Power (+17%), Edison International (+48%) and Entergy (+23%) helped. Lastly, Dominion Energy, within the multi-utilities subindustry, gained about 24% and also boosted the fund. • Conversely, the biggest detractor was Constellation Energy (-22%), from the electric utilities subindustry. Within the same subindustry, NRG Energy (-15%) and Oklo (-50%) hurt. Another notable detractor was Vistra (-27%), a stock in the independent power producers & energy traders subindustry. Lastly, Public Service Enterprise, within the multi-utilities subindustry, returned -11% and also hurt the fund's performance. |
| Performance Past Does Not Indicate Future [Text] |
The Fund's past performance is not a good predictor of the Fund's future performance.
|
| Line Graph [Table Text Block] |
Table Summary
|
$23,068 Fidelity® MSCI Utilities Index ETF |
$23,308 Fidelity MSCI Utilities Index ETF Capped Linked Index℠ |
$40,742 S&P 500® Index |
2016 |
$10,000 |
$10,000 |
$10,000 |
2017 |
$10,662 |
$10,677 |
$11,604 |
2018 |
$11,070 |
$11,101 |
$13,489 |
2019 |
$12,833 |
$12,885 |
$14,566 |
2020 |
$13,235 |
$13,307 |
$16,308 |
2021 |
$14,885 |
$14,978 |
$22,251 |
2022 |
$17,132 |
$17,250 |
$21,219 |
2023 |
$15,997 |
$16,120 |
$23,980 |
2024 |
$17,998 |
$18,154 |
$29,292 |
2025 |
$21,727 |
$21,933 |
$34,076 |
2026 |
$23,068 |
$23,308 |
$40,742 |
|
| Average Annual Return [Table Text Block] |
AVERAGE ANNUAL TOTAL RETURNS:
Table Summary
Fund |
1 Year |
5 Years |
10 Years |
Fidelity® MSCI Utilities Index ETF - NAV |
6.17% |
9.16% |
8.72% |
Fidelity MSCI Utilities Index ETF Capped Linked Index℠ |
6.27% |
9.25% |
8.83% |
S&P 500® Index |
19.56% |
12.86% |
15.08% | Visit www.fidelity.com for more recent performance information. The Fund's past performance is not a good predictor of the Fund's future performance. The graph and table do not reflect the deduction of taxes that a shareholder would pay on fund distributions or redemption of fund shares. |
| No Deduction of Taxes [Text Block] |
The graph and table do not reflect the deduction of taxes that a shareholder would pay on fund distributions or redemption of fund shares.
|
| Updated Performance Information Location [Text Block] |
Visit www.fidelity.com for more recent performance information.
|
| AssetsNet |
$ 2,328,529,730
|
| Holdings Count | Holding |
64
|
| Advisory Fees Paid, Amount |
$ 1,880,305
|
| InvestmentCompanyPortfolioTurnover |
4.00%
|
| Additional Fund Statistics [Text Block] |
Table Summary
FUND STATISTICS |
Value |
Fund Size |
$2,328,529,730 |
Number of Holdings |
64 |
Portfolio Turnover |
4% |
Total Advisory Fee |
$1,880,305 | |
| Holdings [Text Block] |
What did the Fund invest in? GEOGRAPHIC DIVERSIFICATION(% of Fund's net assets)
Table Summary
Value |
Value |
United States of America - |
100.0 | What did the Fund invest in? TOP INDUSTRIES(% of Fund's net assets)
Table Summary
Electric Utilities |
61.7 |
Multi-Utilities |
24.6 |
Independent Power and Renewable Electricity Producers |
5.6 |
Gas Utilities |
4.8 |
Water Utilities |
3.1 |
All Others |
0.2 | ASSET ALLOCATION(% of Fund's net assets)
Table Summary
Value |
Value |
Common Stocks - |
99.8 |
Short-Term Investments and Net Other Assets (Liabilities) - |
0.2 | |
| Largest Holdings [Text Block] |
TOP HOLDINGS(% of Fund's net assets)
Table Summary
NextEra Energy, Inc. |
11.8 |
Southern Co. |
6.9 |
Duke Energy Corp. |
6.4 |
Constellation Energy Corp. |
5.3 |
American Electric Power Co., Inc. |
4.5 |
Dominion Energy, Inc. |
4.0 |
Sempra |
3.8 |
Vistra Corp. |
3.3 |
Entergy Corp. |
3.2 |
Xcel Energy, Inc. |
3.2 |
Total |
52.4 | |
| Material Fund Change [Text Block] |
|