Pay versus Performance
As required by Item 402(v) of Regulation S-K, we are providing the following information about the relationship between executive “compensation actually paid” (as defined by SEC rules) and certain financial performance metrics of the Company for the last two fiscal years. In determining the “compensation actually paid” to our named executive officers, we are required to make various adjustments to amounts that have been previously reported in the Summary Compensation Table (“SCT”) in previous years, as the SEC’s valuation methods for this section differ from those required in the SCT. The table below summarizes compensation values both as previously reported in our SCT, as well as the adjusted values required in this section for the 2025, 2024 and 2023 calendar years. The Board did not consider the pay versus performance disclosure when making its incentive compensation decisions.
The following table sets for the information concerning the compensation of our principal executive officer, or “PEO”, and the compensation of our other NEO for each of the years ending December 31, 2025, 2024 and 2023, as such compensation relates to our financial performance for each such year. The PEO for each of the years presented within the following tables was Rowland Perkins, Chief Executive Officer and Director. The other NEO for each of the years presented was Anton J. Drescher, Chief Financial Officer and Director.
|
(a) |
(b) |
(c) |
(d) |
(e) |
(f) |
(g) |
|||||||||||||||
|
Year |
SCT Total for PEO |
Compensation Actually Paid to PEO(1) |
Average SCT Total for Non- PEO NEO |
Average Compensation Actually Paid to Non-PEO NEO(2) |
Value of Initial Fixed $100 Investment Based on Total Shareholder Return(3) |
Net Loss (Dollars in thousands) |
|||||||||||||||
|
2025 |
|
|
$ | 60,000 | $ | 60,000 | $ | 7.19 | $ | 328 | |||||||||||
|
2024 |
|
|
$ | 90,000 | $ | 90,000 | $ | 14.17 | $ | 326 | |||||||||||
|
2023 |
$ | 180 |
|
$ | 149,041 | $ | 148,500 | $ | 34.48 | $ | 589 | ||||||||||
|
(1) |
The dollar amounts reported for the PEO under “Compensation Actually Paid” represent the amount of “Compensation Actually Paid” to the PEO, as computed in accordance with Item 402(v) of Regulation S-K. The dollar amounts do not reflect the actual amount of compensation earned by or paid to the PEO during the applicable year. In accordance with the requirements of Item 402(v) of Regulation S-K, the adjustments in the table below were made to the PEO’s total compensation for each year to determine the compensation actually paid: |
|
Adjustments to Determine Compensation “Actually Paid” for PEO |
2025 |
2024 |
2023 |
|||||||||
|
Deduction for Amounts Reported under the “Stock Awards” Column in the SCT |
|
|
$ | 180 | ||||||||
|
Deduction for Amounts Reported under the “Option Awards” Columns in the SCT |
- | - | - | |||||||||
|
Increase for Fair Value of Awards Granted during year that Remain Unvested as of Year end |
- | - | - | |||||||||
|
Increase for Fair Value of Awards Granted during year that Vest during year |
- | - | - | |||||||||
|
Increase/deduction for Change in Fair Value from Prior Year-end to current Year-end of Awards Granted Prior to year that were Outstanding and Unvested as of Year-end |
|
|
- | |||||||||
|
Increase/deduction for Change in Fair Value from Prior Year-end to Vesting Date of Awards Granted Prior to year that Vested during year |
- | - | $ | (180 | ) | |||||||
|
Deduction of Fair Value of Awards Granted Prior to year that were Forfeited during year |
- | - | - | |||||||||
|
Increase based upon Incremental Fair Value of Awards Modified during year |
- | - | - | |||||||||
|
Increase based on Dividends or Other Earnings Paid during year prior to Vesting Date of Award |
- | - | - | |||||||||
|
Total Adjustments |
|
|
|
|||||||||
|
(2) |
The dollar amounts reported for the NEO under “Compensation Actually Paid’ represent the amount of “Compensation Actually Paid” to the NEO, as computed in accordance with Item 402(v) of Regulation S-K. The dollar amounts do not reflect the actual amount of compensation earned by or paid to the NEO during the applicable year. In accordance with the requirements of Item 402(v) of Regulation S-K, the adjustments in the table below were made to the NEO’s total compensation for each year to determine the compensation actually paid: |
|
Adjustments to Determine Compensation “Actually Paid” for Non-PEO NEO |
2025 |
2024 |
2023 |
|||||||||
|
Deduction for Amounts Reported under the “Stock Awards” Column in the SCT |
$ | 60,000 | $ | 90,000 | $ | 149,041 | ||||||
|
Deduction for Amounts Reported under the “Option Awards” Columns in the SCT |
- | - | - | |||||||||
|
Increase for Fair Value of Awards Granted during year that Remain Unvested as of Year end |
- | - | - | |||||||||
|
Increase for Fair Value of Awards Granted during year that Vest during year |
- | - | - | |||||||||
|
Increase/deduction for Change in Fair Value from Prior Year-end to current Year-end of Awards Granted Prior to year that were Outstanding and Unvested as of Year-end |
- | - | - | |||||||||
|
Increase/deduction for Change in Fair Value from Prior Year-end to Vesting Date of Awards Granted Prior to year that Vested during year |
- | - | $ | (541 | ) | |||||||
|
Deduction of Fair Value of Awards Granted Prior to year that were Forfeited during year |
- | - | - | |||||||||
|
Increase based upon Incremental Fair Value of Awards Modified during year |
- | - | - | |||||||||
|
Increase based on Dividends or Other Earnings Paid during year prior to Vesting Date of Award |
- | - | - | |||||||||
|
Compensation Actually Paid |
$ | 60,000 | $ | 90,000 | $ | 148,500 | ||||||
|
(3) |
For purposes of calculating the cumulative total shareholder return, the measurement period is the market close on the last trading day of 2025, through and including the end of the year for which cumulative total shareholder return is being calculated. |
Analysis of the Information Presented in the Pay Versus Performance Tables
Because we are a development stage technology company, we did not have any revenue from continuing operations during the periods presented. Consequently, we have not historically focused on net income (loss) as a performance measure for our executive compensation programs. In 2023, 2024 and 2025, our net loss improved from approximately $0.59 million in 2023 to approximately $0.33 million in 2024 to approximately $0. $0.33 million in 2025 and during the same periods the compensation actually paid to our PEO was $Nil in each of 2024, 2023 and 2022 and compensation actually paid to our other NEO increased from to $148,500 in 2023 $90,000 in 2024 and to $60,000 in 2025.
The following graph shows the compensation actually paid to Mr. Perkins and the amount of compensation actually paid to Mr. Drescher during the periods presented and total shareholder return over those periods. Total Shareholder return was negative during 2023, 2024 and 2025. Mr. Perkins’ compensation remained unchanged year over year and the amount of compensation actually paid to Mr. Dresher increased year over year.
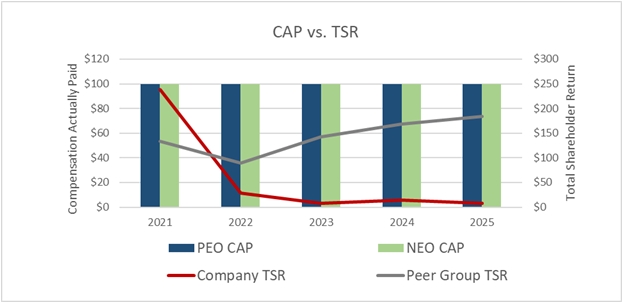
We utilize performance measures to align executive compensation with performance, but those tend not to be financial performance measures, such as total shareholder return. For example, as described in more detail above in the section “Executive Compensation – Compensation Discussion and Analysis,” our named executive officers are eligible to receive short term bonuses which are designed to provide appropriate incentives to our executives to achieve defined annual individual and corporate goals. Additionally, we believe stock options, which are an integral part of our executive compensation program, are closely related to the Company’s performance, although not directly tied to total shareholder return, because their value is directly correlated to the market price of our Common Shares and requires that the executive officer continues in our employment over the vesting period. As such, these stock option awards strongly align our executive officers’ interests with those of our Shareholders by providing a continuing financial incentive to maximize long-term value for our Shareholders and by encouraging our executive officers to continue in our employment for the long-term.