| Fiscal Year | Summary Compensation Table for PEO #1 (1) | Compensation Actually Paid to PEO #1 (2) | Summary Compensation Table for PEO #2 (1) | Compensation Actually Paid to PEO #2 (2) | Average Summary Compensation Table Totals for Non-PEO NEOs (1) | Average Compensation Actually Paid to Non-PEO NEOs (3) | Value of Initial Fixed $100 Investment Based On Total Shareholder Return (4) | Net Income (Loss) (5) | |||||||||||||||||||||||||
| 2026 TP | 3,285,510 | 3,285,510 | 40,000 | 40,000 | 935,784 | 934,268 | $ | 102.86 | (50,320,000 | ) | |||||||||||||||||||||||
| 2025 | 908,750 | 911,017 | 479,813 | 462,165 | $ | 48.40 | (11,695,000 | ) | |||||||||||||||||||||||||
| 2024 | 473,017 | 526,312 | 394,850 | 402,695 | $ | 23.02 | (11,330,000 | ) | |||||||||||||||||||||||||
| 2023 | 637,020 | 1,120,310 | 718,163 | 1,031,773 | $ | 94.34 | (15,198,000 | ) | |||||||||||||||||||||||||
| 2023 | 2024 | 2025 | 2026 TP | |||||||||||||||||
| PEO | PEO | PEO | PEO #1 | PEO #2 | ||||||||||||||||
| Adjustments | ||||||||||||||||||||
| SCT Total (a) | $ | 637,020 | $ | 473,017 | $ | 908,750 | $ | 3,285,510 | $ | 40,000 | ||||||||||
| Minus Grant Date Fair Value of Options Awards and Stock Awards Granted in Fiscal Year (b) | $ | (420,000 | ) | |||||||||||||||||
| Plus Fair Value at Fiscal Year-End of Outstanding and Unvested Option Awards and Stock Awards Granted in Fiscal Year (c) | ||||||||||||||||||||
| Plus Change in Fair Value of Outstanding and Unvested Options Awards and Stock Awards Granted in Prior Fiscal Years (d) | $ | 292,104 | $ | (189,000 | ) | |||||||||||||||
| Plus Fair Value at Vesting of Option Awards and Stock Awards Granted in Fiscal Year That Vested During Fiscal Year (e) | $ | 420,000 | ||||||||||||||||||
| Plus Changes in Fair Values as of Vesting Date of Option Awards and Stock Awards Granted in Prior Fiscal Years For Which Applicable Vesting Conditions Were Satisfied During Fiscal Year (f) | $ | 191,186 | $ | 242,295 | $ | 2,267 | ||||||||||||||
| Minus Fair Value as of Prior Fiscal Year-End of Option Awards and Stock Awards Granted in Prior Fiscal Years That Failed to Meet Applicable Vesting Conditions During Fiscal Year (g) | ||||||||||||||||||||
| Compensation Actually Paid | $ | 1,120,310 | $ | 526,312 | $ | 911,017 | $ | 3,285,510 | $ | 40,000 | ||||||||||
| (a) | Represents Total Compensation as reported in the Summary Compensation Table for the indicated fiscal year. |
| (b) | Represents the aggregate grant date fair value of the stock awards and option awards granted to the reported PEO during the indicated fiscal year, computed in accordance with FASB ASC 718. Amounts shown are the amounts reported in the Summary Compensation Table. |
| (c) | Represents the aggregate fair value as of the indicated fiscal year-end of the reported PEO’s outstanding and unvested stock awards and option awards granted during such fiscal year, computed in accordance with FASB ASC 718. |
| (d) | Represents the aggregate change in fair value during the indicated fiscal year of the outstanding and unvested stock awards and option awards held by the reported PEO as of the last day of the indicated fiscal year, computed in accordance with FASB ASC 718. |
| (e) | Represents the aggregate fair value at vesting of the stock and option awards that were granted to the reported PEO and vested during the indicated fiscal year, computed in accordance with FASB ASC 718. |
| (f) | Represents the aggregate change in fair value, measured from the prior fiscal year-end to the vesting date, of each stock award and option award held by the reported PEO that was granted in a prior fiscal year and which vested during the indicated fiscal year, computed in accordance with FASB ASC 718. |
| (g) | Represents the aggregate fair value as of the last day of the prior fiscal year of the reported PEO’s stock awards and option awards that were granted in a prior fiscal year and which failed to meet the applicable vesting conditions in the indicated fiscal year, computed in accordance with FASB ASC 718. |
(3) Amounts reported in this column represent the average CAP to the Company’s Non-PEO NEOs in the indicated fiscal years and the Transition Period, as calculated per the SEC disclosure rules based on the total compensation reported in the Summary Compensation Table for the indicated fiscal years and adjusted as shown in the table below:
| NEO Average | 2023 | 2024 | 2025 | 2026 TP | ||||||||||||
| SCT Total (a) | $ | 718,163 | $ | 394,850 | $ | 479,813 | $ | 935,784 | ||||||||
| Minus Grant Date Fair Value of Options Awards and Stock Awards Granted in Fiscal Year (b) | (248,760 | ) | (90,563 | ) | ||||||||||||
| Plus Fair Value at Fiscal Year-End of Outstanding and Unvested Option Awards and Stock Awards Granted in Fiscal Year (c) | 471,911 | |||||||||||||||
| Plus Change in Fair Value of Outstanding and Unvested Options Awards and Stock Awards Granted in Prior Fiscal Years (d) | 56,597 | (198,865 | ) | (1,932 | ) | |||||||||||
| Plus Fair Value at Vesting of Option Awards and Stock Awards Granted in Fiscal Year That Vested During Fiscal Year (e) | (90,563 | ) | ||||||||||||||
| Plus Changes in Fair Values as of Vesting Date of Option Awards and Stock Awards Granted in Prior Fiscal Years For Which Applicable Vesting Conditions Were Satisfied During Fiscal Year (f) | 33,862 | 206,710 | (15,716 | ) | (1,515 | ) | ||||||||||
| Minus Fair Value as of Prior Fiscal Year-End of Option Awards and Stock Awards Granted in Prior Fiscal Years That Failed to Meet Applicable Vesting Conditions During Fiscal Year (g) | ||||||||||||||||
| Compensation Actually Paid | $ | 1,031,773 | $ | 402,695 | $ | 462,165 | $ | 934,268 | ||||||||
| (a) | Represents the average Total Compensation as reported in the Summary Compensation Table for the reported NEOs other than the PEO in the indicated fiscal year. |
| (b) | Represents the average aggregate grant date fair value of the stock awards and option awards granted to the reported NEOs excluding the PEO during the indicated fiscal year computed in accordance with FASB ASC 718. Amounts shown are the amounts reported in the Summary Compensation Table. |
| (c) | Represents the average aggregate fair value as of the indicated fiscal year-end of the reported NEOs’ (excluding the PEO) outstanding and unvested stock awards and option awards granted during such fiscal year, computed in accordance with FASB ASC 718. |
| (d) | Represents the average aggregate change in fair value during the indicated fiscal year of the outstanding and unvested stock awards and option awards held by the reported NEOs excluding the PEO as of the last day of the indicated fiscal year, computed in accordance with FASB ASC 718. |
| (e) | Represents the average aggregate fair value at vesting of the stock awards and option awards that were granted to the reported NEOs (excluding the PEO) and vested during the indicated fiscal year, computed in accordance with FASB ASC 718. |
| (f) | Represents the average aggregate change in fair value, measured from the prior fiscal year-end to the vesting date, of each stock award and option award held by the reported NEOs (excluding the PEO) that was granted in a prior fiscal year and which vested during the indicated fiscal year, computed in accordance with FASB ASC 718. |
| (g) | Represents the average aggregate fair value as of the last day of the prior fiscal year of the reported NEOs’ (excluding the PEO) stock awards and option awards that were granted in a prior fiscal year and which failed to meet the applicable vesting conditions in the indicated fiscal year computed in accordance with FASB ASC 718. |
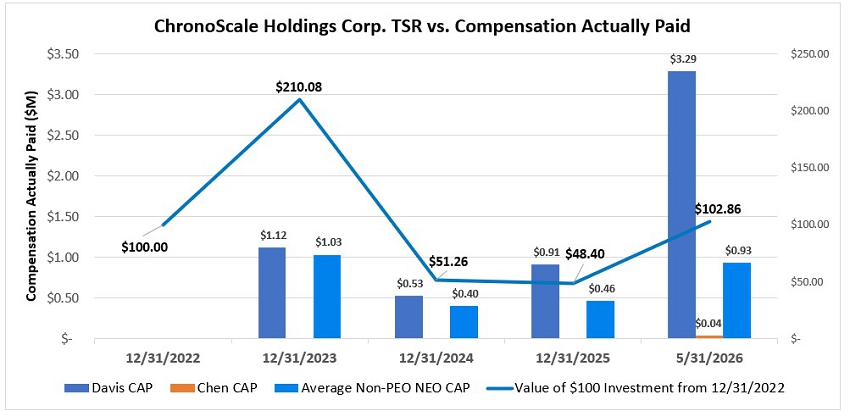
Description of Relationship Between PEO and Non-PEO NEO Compensation Actually Paid and Company Total Shareholder Return (“TSR”)
The following chart sets forth the relationship between Compensation Actually Paid (“CAP”) to our PEO, the average of Compensation Actually Paid to our Non-PEO NEOs, and the Company’s TSR over the three most recently completed fiscal years and the Transition Period.
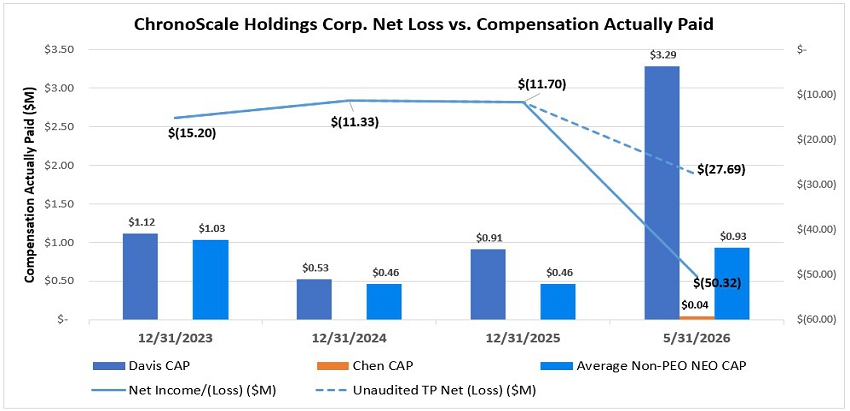
Description of Relationship Between PEO and Non-PEO NEO Compensation Actually Paid and Company Net Income (Loss)
The following chart sets forth the relationship between Compensation Actually Paid (“CAP”) to our PEO, the average of Compensation Actually Paid to our Non-PEO NEOs, and the Company’s net loss over the three most recently completed fiscal years and the Transition Period.
| [1] | Represents Total Compensation as reported in the Summary Compensation Table for the indicated fiscal year. |
| [2] | Represents the aggregate grant date fair value of the stock awards and option awards granted to the reported PEO during the indicated fiscal year, computed in accordance with FASB ASC 718. Amounts shown are the amounts reported in the Summary Compensation Table. |
| [3] | Represents the aggregate fair value as of the indicated fiscal year-end of the reported PEO’s outstanding and unvested stock awards and option awards granted during such fiscal year, computed in accordance with FASB ASC 718. |
| [4] | Represents the aggregate change in fair value during the indicated fiscal year of the outstanding and unvested stock awards and option awards held by the reported PEO as of the last day of the indicated fiscal year, computed in accordance with FASB ASC 718. |
| [5] | Represents the aggregate fair value at vesting of the stock and option awards that were granted to the reported PEO and vested during the indicated fiscal year, computed in accordance with FASB ASC 718. |
| [6] | Represents the aggregate change in fair value, measured from the prior fiscal year-end to the vesting date, of each stock award and option award held by the reported PEO that was granted in a prior fiscal year and which vested during the indicated fiscal year, computed in accordance with FASB ASC 718. |
| [7] | Represents the aggregate fair value as of the last day of the prior fiscal year of the reported PEO’s stock awards and option awards that were granted in a prior fiscal year and which failed to meet the applicable vesting conditions in the indicated fiscal year, computed in accordance with FASB ASC 718. |
| [8] | Represents the average Total Compensation as reported in the Summary Compensation Table for the reported NEOs other than the PEO in the indicated fiscal year. |
| [9] | Represents the average aggregate grant date fair value of the stock awards and option awards granted to the reported NEOs excluding the PEO during the indicated fiscal year computed in accordance with FASB ASC 718. Amounts shown are the amounts reported in the Summary Compensation Table. |
| [10] | Represents the average aggregate fair value as of the indicated fiscal year-end of the reported NEOs’ (excluding the PEO) outstanding and unvested stock awards and option awards granted during such fiscal year, computed in accordance with FASB ASC 718. |
| [11] | Represents the average aggregate change in fair value during the indicated fiscal year of the outstanding and unvested stock awards and option awards held by the reported NEOs excluding the PEO as of the last day of the indicated fiscal year, computed in accordance with FASB ASC 718. |
| [12] | Represents the average aggregate fair value at vesting of the stock awards and option awards that were granted to the reported NEOs (excluding the PEO) and vested during the indicated fiscal year, computed in accordance with FASB ASC 718. |
| [13] | Represents the average aggregate change in fair value, measured from the prior fiscal year-end to the vesting date, of each stock award and option award held by the reported NEOs (excluding the PEO) that was granted in a prior fiscal year and which vested during the indicated fiscal year, computed in accordance with FASB ASC 718. |
| [14] | Represents the average aggregate fair value as of the last day of the prior fiscal year of the reported NEOs’ (excluding the PEO) stock awards and option awards that were granted in a prior fiscal year and which failed to meet the applicable vesting conditions in the indicated fiscal year computed in accordance with FASB ASC 718. |