
D.A. Davidson Diversified Industrials & Services Investor Conference September 22, 2026
2 Forward Looking Statements This presentation may contain forward-looking statements regarding our business, operations, and financial performance. Such statements are based on current expectations and assumptions that are subject to a number of risks and uncertainties. Actual results could differ materially. Please refer to our most recently filed Form 10-K and our Form 10-Qs for the periods following that Form 10-K, including the risk factors described therein. We undertake no obligation to update any forward-looking statement, except as required by law. Given these risks and uncertainties, investors are cautioned not to place undue reliance on such forward-looking statements. We present both GAAP and non-GAAP financial measures in this presentation. A reconciliation of non-GAAP to GAAP measures is included in this presentation and in the most recent earnings press release, which is distributed and available to the public through our Investor Relations website located at investors.nninc.com/news-events/presentations.
3 Investment Thesis 1 2 3 NN is delivering a profitable growth program in desirable end markets NN is increasing its margins with a balanced program of growth & cost-out NN has positive results trend, a positive multi-year outlook, and a strong team
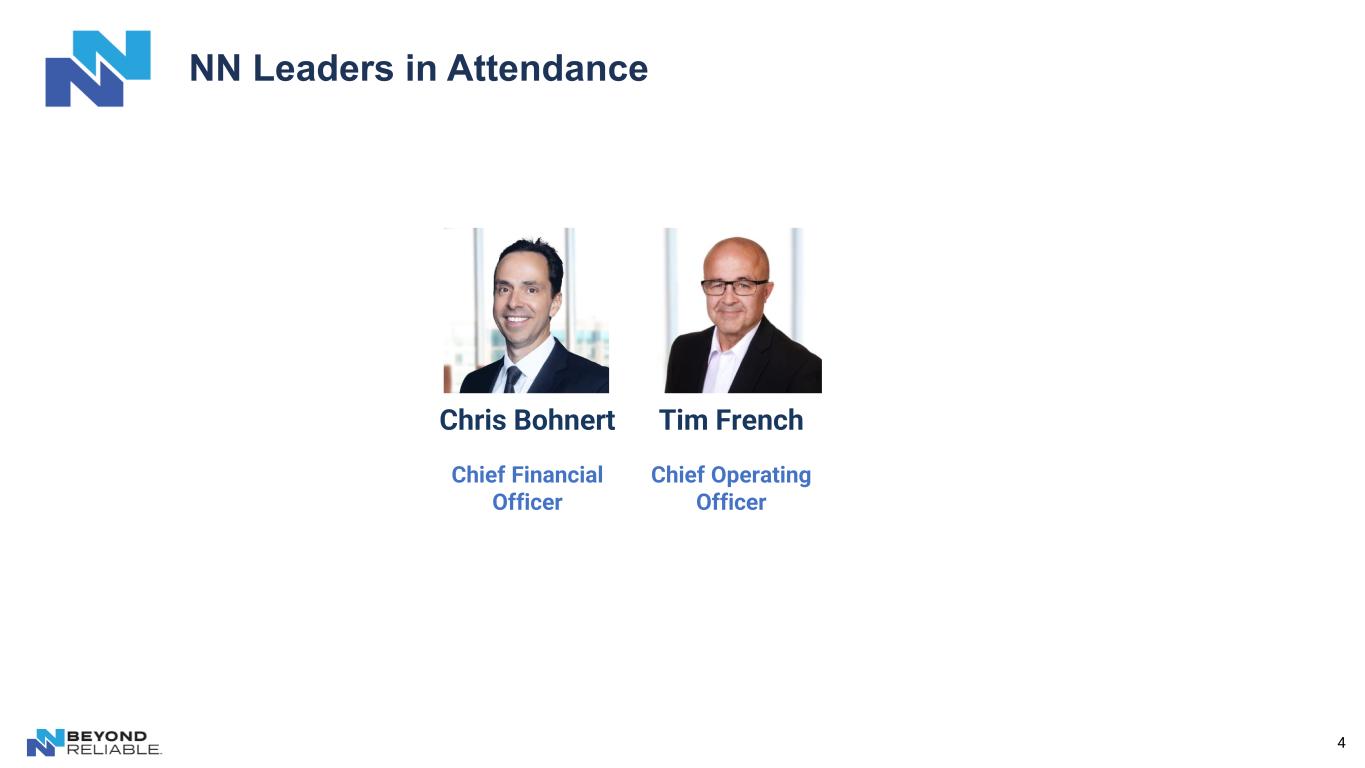
4 NN Leaders in Attendance Chris Bohnert Chief Financial Officer Tim French Chief Operating Officer
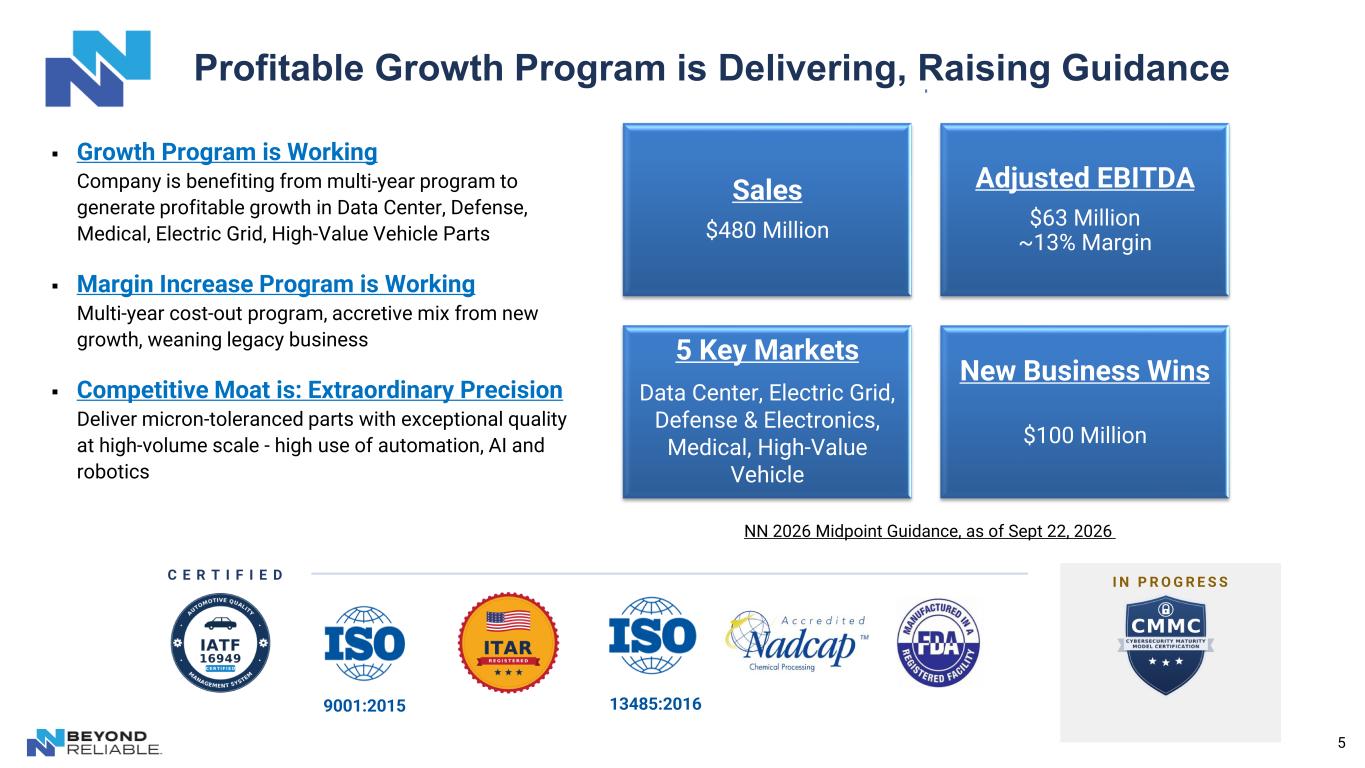
5 Profitable Growth Program is Delivering, Raising Guidance ▪ Growth Program is Working Company is benefiting from multi-year program to generate profitable growth in Data Center, Defense, Medical, Electric Grid, High-Value Vehicle Parts ▪ Margin Increase Program is Working Multi-year cost-out program, accretive mix from new growth, weaning legacy business ▪ Competitive Moat is: Extraordinary Precision Deliver micron-toleranced parts with exceptional quality at high-volume scale - high use of automation, AI and robotics Sales $480 Million Adjusted EBITDA $63 Million ~13% Margin 5 Key Markets Data Center, Electric Grid, Defense & Electronics, Medical, High-Value Vehicle New Business Wins $100 Million NN 2026 Midpoint Guidance, as of Sept 22, 2026 9001:2015 13485:2016 I N P R O G R E S S C E R T I F I E D
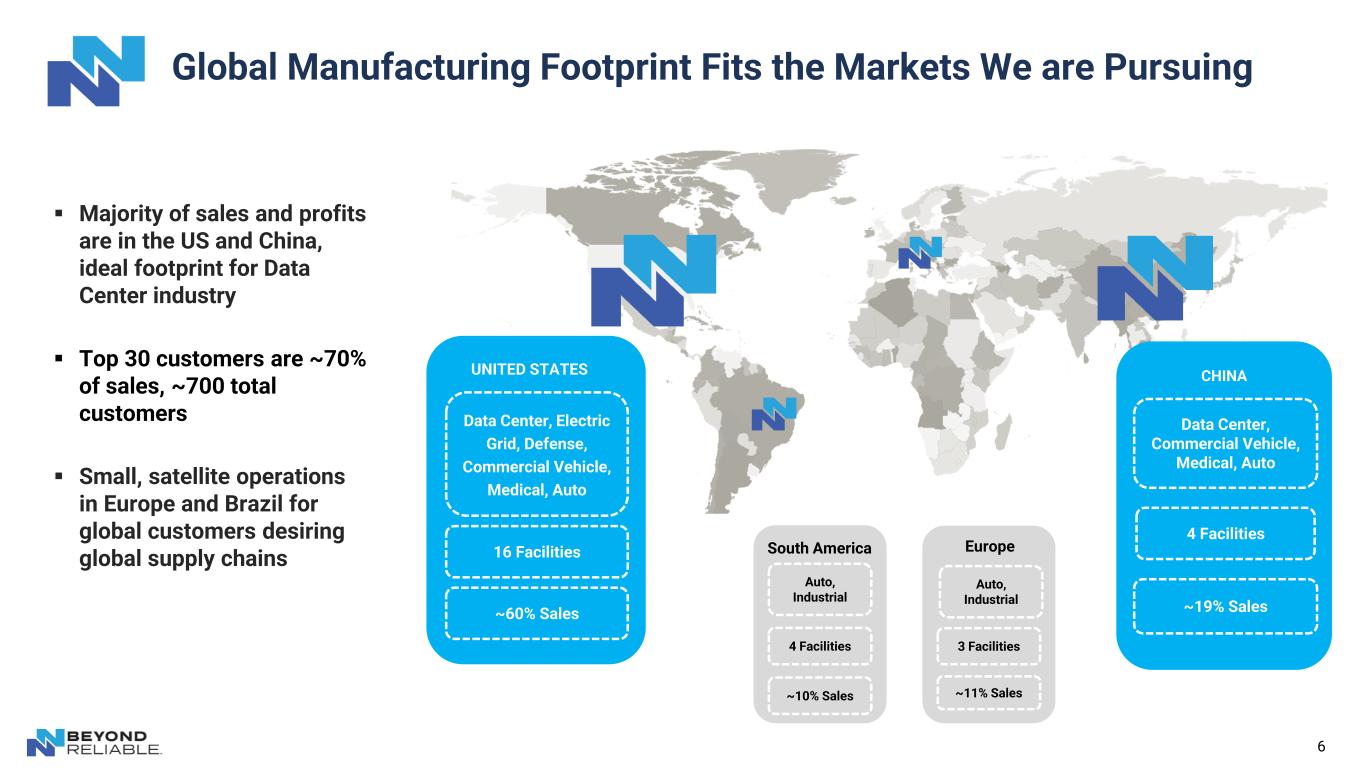
6 ▪ Majority of sales and profits are in the US and China, ideal footprint for Data Center industry ▪ Top 30 customers are ~70% of sales, ~700 total customers ▪ Small, satellite operations in Europe and Brazil for global customers desiring global supply chains Global Manufacturing Footprint Fits the Markets We are Pursuing UNITED STATES ~60% Sales Data Center, Electric Grid, Defense, Commercial Vehicle, Medical, Auto 16 Facilities Europe ~11% Sales Auto, Industrial 3 Facilities South America ~10% Sales Auto, Industrial 4 Facilities ~19% Sales Data Center, Commercial Vehicle, Medical, Auto 4 Facilities CHINA
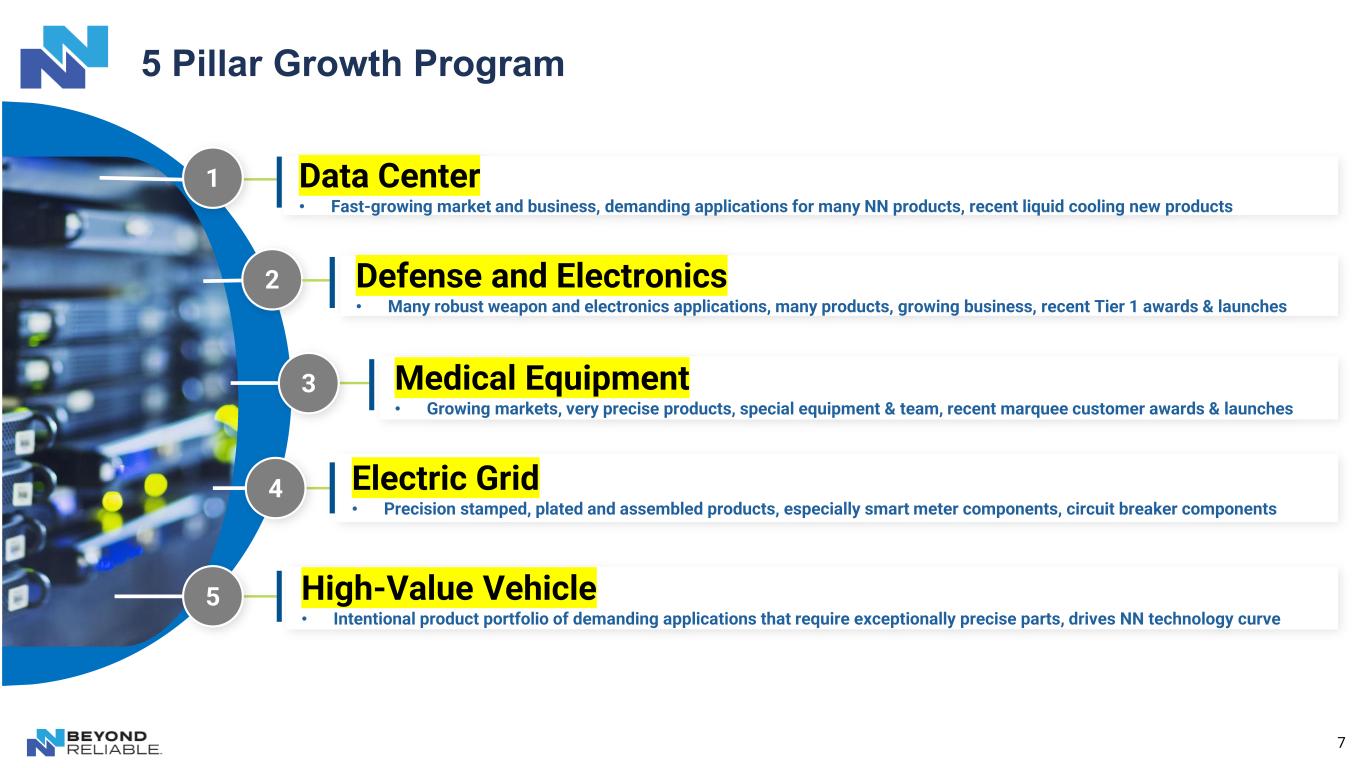
7 5 Pillar Growth Program High-Value Vehicle • Intentional product portfolio of demanding applications that require exceptionally precise parts, drives NN technology curve Electric Grid • Precision stamped, plated and assembled products, especially smart meter components, circuit breaker components 2 Medical Equipment • Growing markets, very precise products, special equipment & team, recent marquee customer awards & launches 3 Defense and Electronics • Many robust weapon and electronics applications, many products, growing business, recent Tier 1 awards & launches 4 5 1 Data Center • Fast-growing market and business, demanding applications for many NN products, recent liquid cooling new products
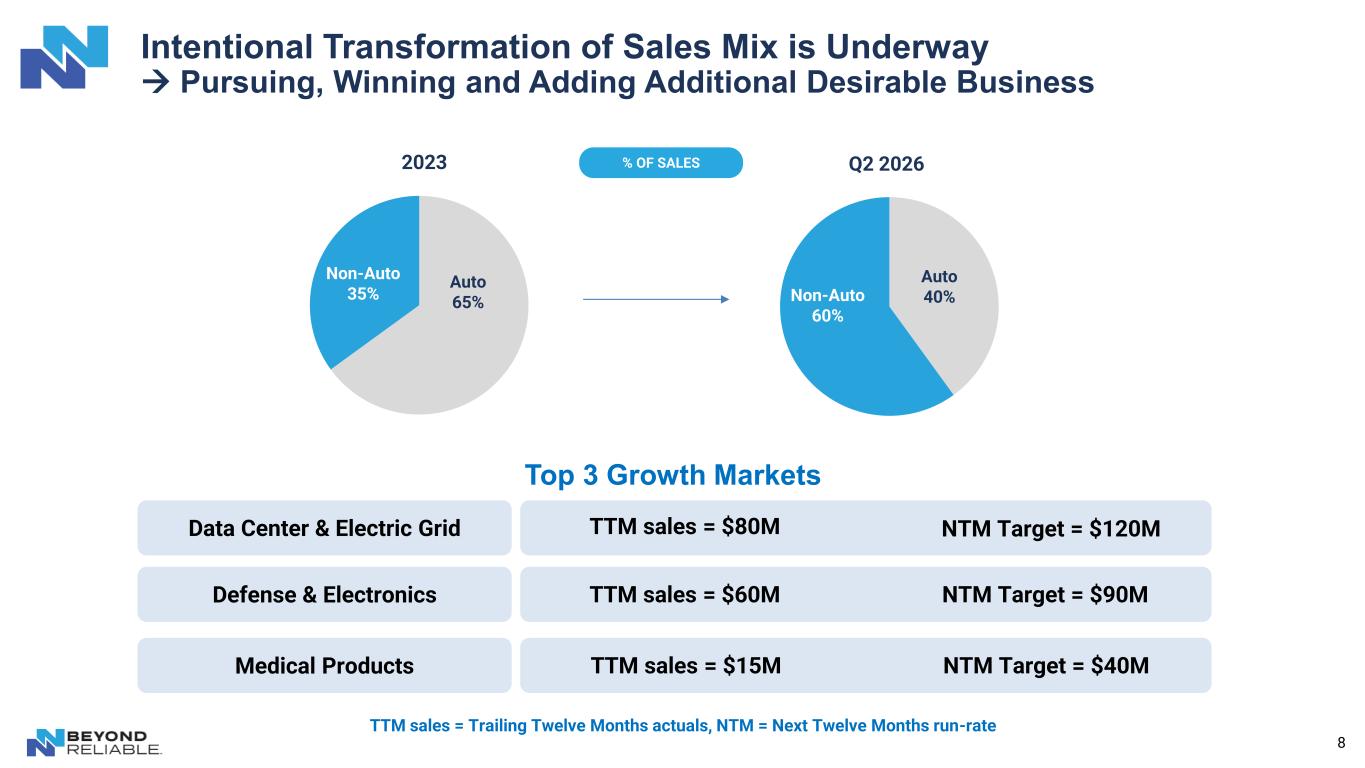
8 Intentional Transformation of Sales Mix is Underway → Pursuing, Winning and Adding Additional Desirable Business Auto 65% Non-Auto 35% 2023 Auto 40%Non-Auto 60% Q2 2026% OF SALES Data Center & Electric Grid Medical Products Defense & Electronics TTM sales = $80M NTM Target = $120M TTM sales = $15M NTM Target = $40M TTM sales = $60M NTM Target = $90M Top 3 Growth Markets TTM sales = Trailing Twelve Months actuals, NTM = Next Twelve Months run-rate
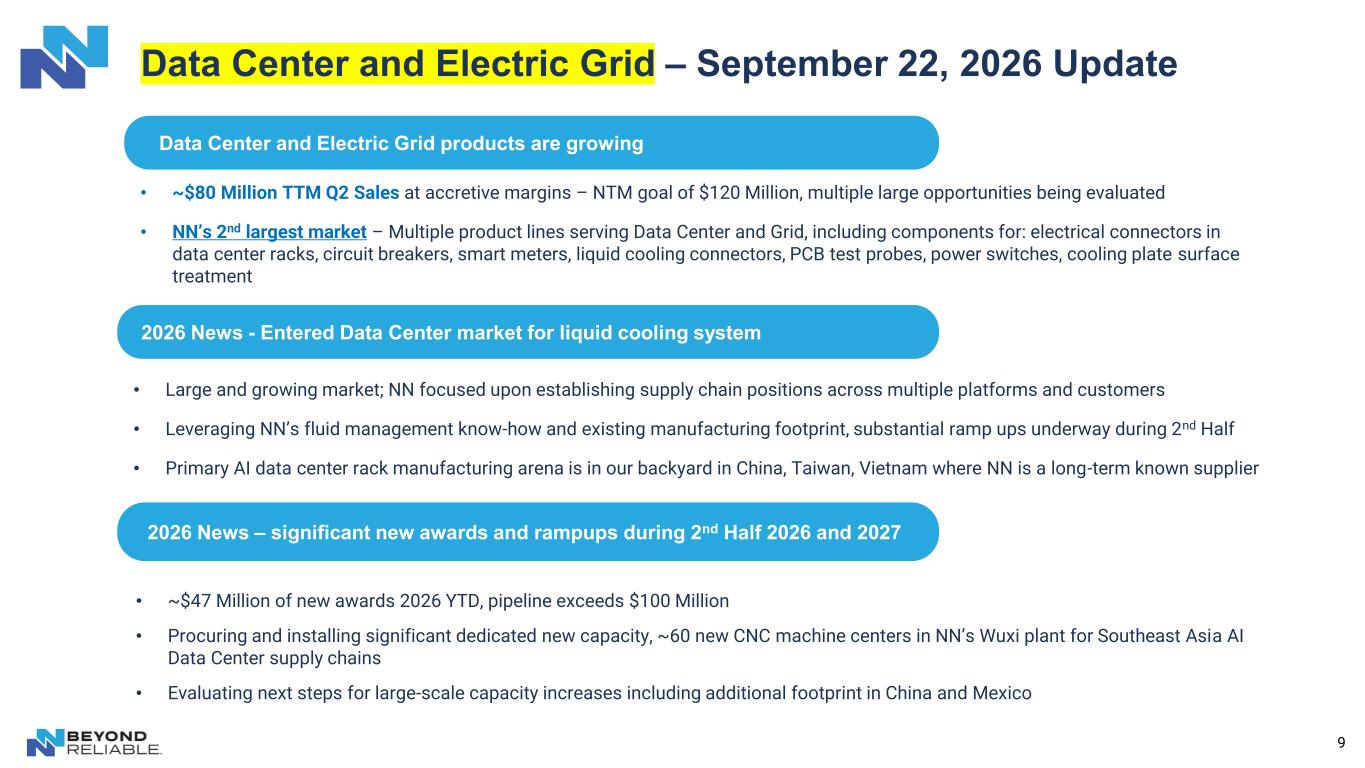
9 Data Center and Electric Grid – September 22, 2026 Update Data Center and Electric Grid products are growing • ~$80 Million TTM Q2 Sales at accretive margins – NTM goal of $120 Million, multiple large opportunities being evaluated • NN’s 2nd largest market – Multiple product lines serving Data Center and Grid, including components for: electrical connectors in data center racks, circuit breakers, smart meters, liquid cooling connectors, PCB test probes, power switches, cooling plate surface treatment 2026 News - Entered Data Center market for liquid cooling system • Large and growing market; NN focused upon establishing supply chain positions across multiple platforms and customers • Leveraging NN’s fluid management know-how and existing manufacturing footprint, substantial ramp ups underway during 2nd Half • Primary AI data center rack manufacturing arena is in our backyard in China, Taiwan, Vietnam where NN is a long-term known supplier 2026 News – significant new awards and rampups during 2nd Half 2026 and 2027 • ~$47 Million of new awards 2026 YTD, pipeline exceeds $100 Million • Procuring and installing significant dedicated new capacity, ~60 new CNC machine centers in NN’s Wuxi plant for Southeast Asia AI Data Center supply chains • Evaluating next steps for large-scale capacity increases including additional footprint in China and Mexico
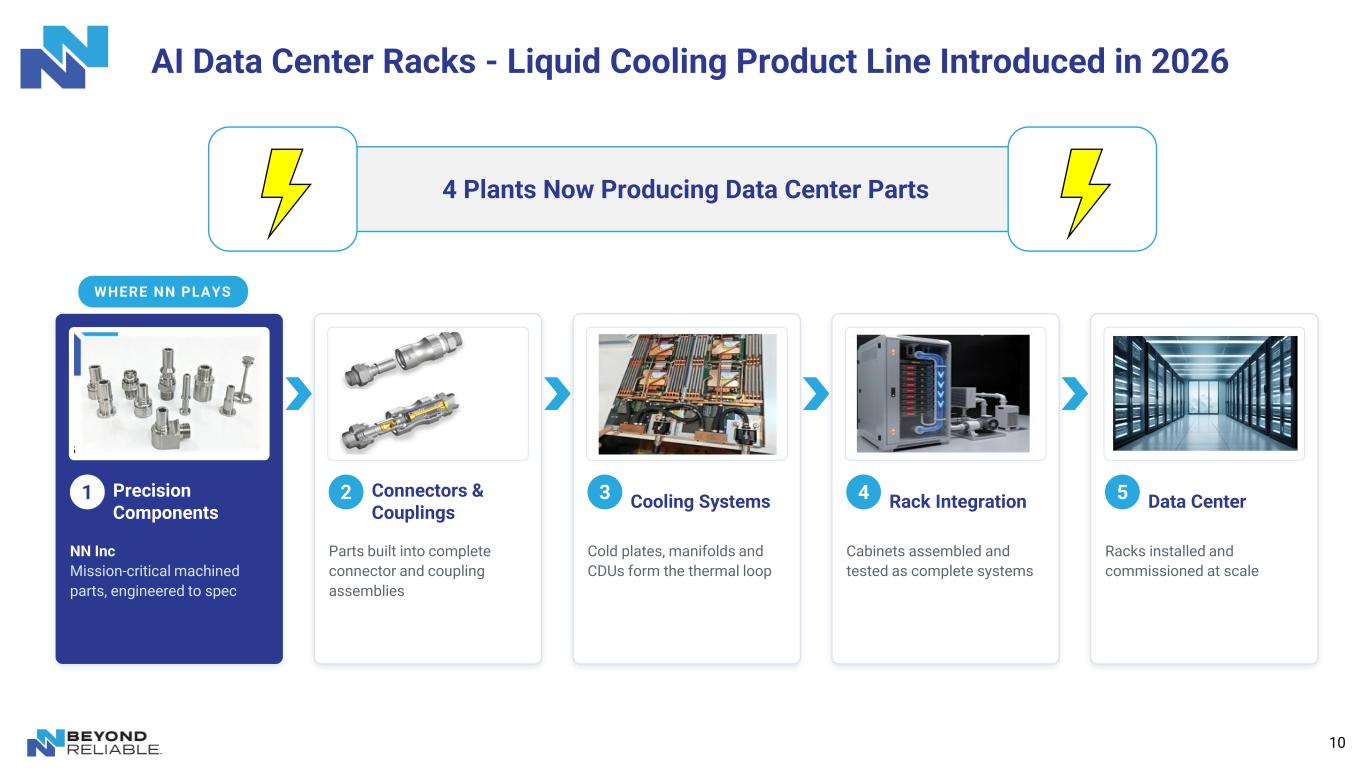
10 AI Data Center Racks - Liquid Cooling Product Line Introduced in 2026 WHERE NN PLAYS 1 Precision Components NN Inc Mission-critical machined parts, engineered to spec 2 Connectors & Couplings Parts built into complete connector and coupling assemblies 3 Cooling Systems Cold plates, manifolds and CDUs form the thermal loop 4 Rack Integration Cabinets assembled and tested as complete systems 5 Data Center Racks installed and commissioned at scale 4 Plants Now Producing Data Center Parts
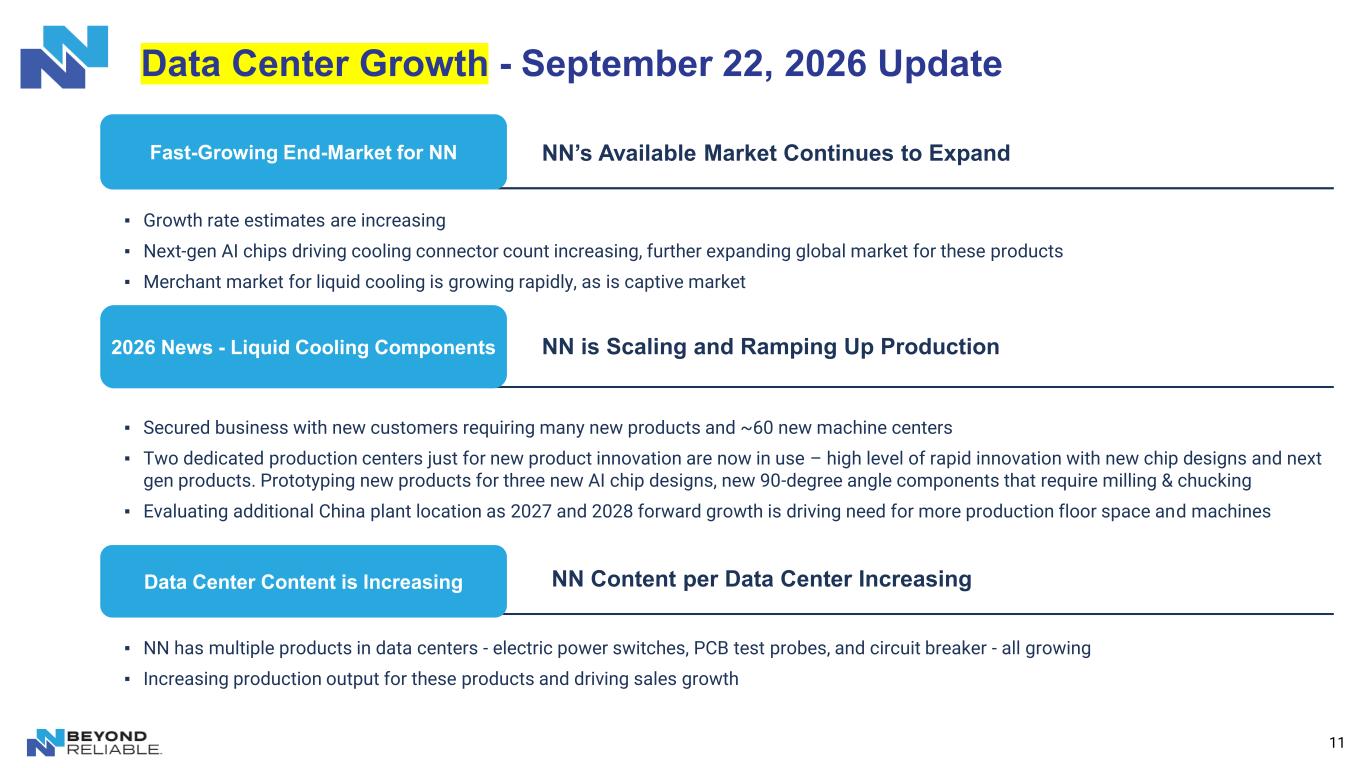
11 Data Center Growth - September 22, 2026 Update NN’s Available Market Continues to Expand ▪ Growth rate estimates are increasing ▪ Next-gen AI chips driving cooling connector count increasing, further expanding global market for these products ▪ Merchant market for liquid cooling is growing rapidly, as is captive market NN is Scaling and Ramping Up Production ▪ Secured business with new customers requiring many new products and ~60 new machine centers ▪ Two dedicated production centers just for new product innovation are now in use – high level of rapid innovation with new chip designs and next gen products. Prototyping new products for three new AI chip designs, new 90-degree angle components that require milling & chucking ▪ Evaluating additional China plant location as 2027 and 2028 forward growth is driving need for more production floor space and machines NN Content per Data Center Increasing ▪ NN has multiple products in data centers - electric power switches, PCB test probes, and circuit breaker - all growing ▪ Increasing production output for these products and driving sales growth Fast-Growing End-Market for NN 2026 News - Liquid Cooling Components Data Center Content is Increasing
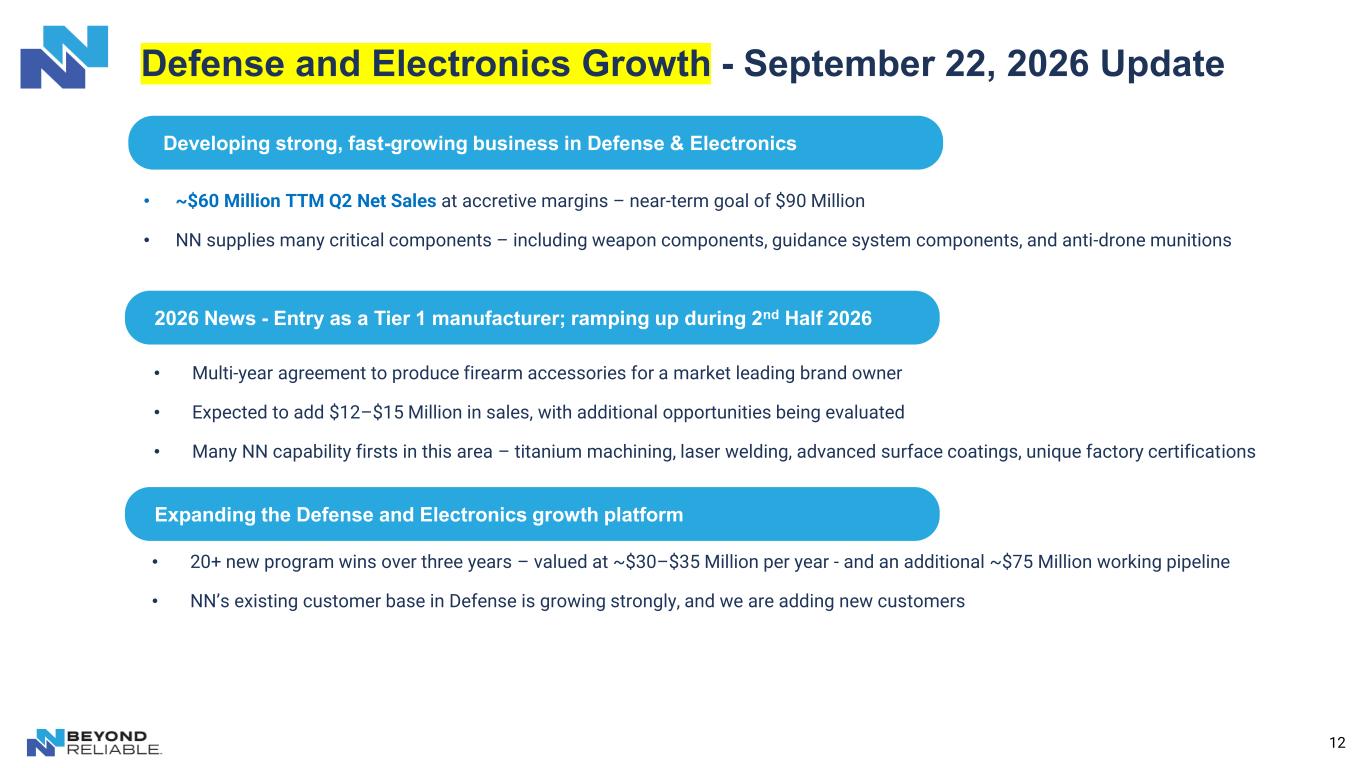
12 Defense and Electronics Growth - September 22, 2026 Update 2026 News - Entry as a Tier 1 manufacturer; ramping up during 2nd Half 2026 • Multi-year agreement to produce firearm accessories for a market leading brand owner • Expected to add $12–$15 Million in sales, with additional opportunities being evaluated • Many NN capability firsts in this area – titanium machining, laser welding, advanced surface coatings, unique factory certifications Expanding the Defense and Electronics growth platform • 20+ new program wins over three years – valued at ~$30–$35 Million per year - and an additional ~$75 Million working pipeline • NN’s existing customer base in Defense is growing strongly, and we are adding new customers Developing strong, fast-growing business in Defense & Electronics • ~$60 Million TTM Q2 Net Sales at accretive margins – near-term goal of $90 Million • NN supplies many critical components – including weapon components, guidance system components, and anti-drone munitions
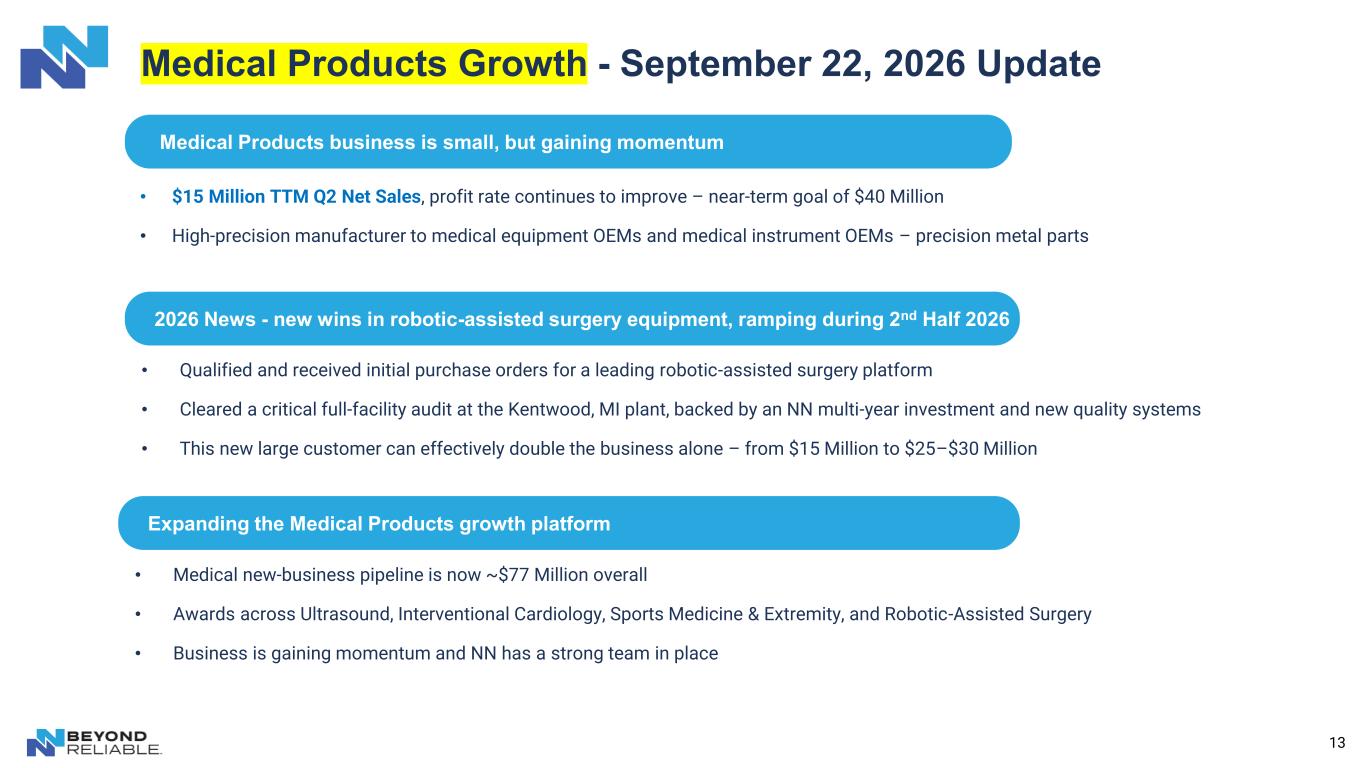
13 Medical Products Growth - September 22, 2026 Update 2026 News - new wins in robotic-assisted surgery equipment, ramping during 2nd Half 2026 • Qualified and received initial purchase orders for a leading robotic-assisted surgery platform • Cleared a critical full-facility audit at the Kentwood, MI plant, backed by an NN multi-year investment and new quality systems • This new large customer can effectively double the business alone – from $15 Million to $25–$30 Million Expanding the Medical Products growth platform • Medical new-business pipeline is now ~$77 Million overall • Awards across Ultrasound, Interventional Cardiology, Sports Medicine & Extremity, and Robotic-Assisted Surgery • Business is gaining momentum and NN has a strong team in place • $15 Million TTM Q2 Net Sales, profit rate continues to improve – near-term goal of $40 Million • High-precision manufacturer to medical equipment OEMs and medical instrument OEMs – precision metal parts Medical Products business is small, but gaining momentum
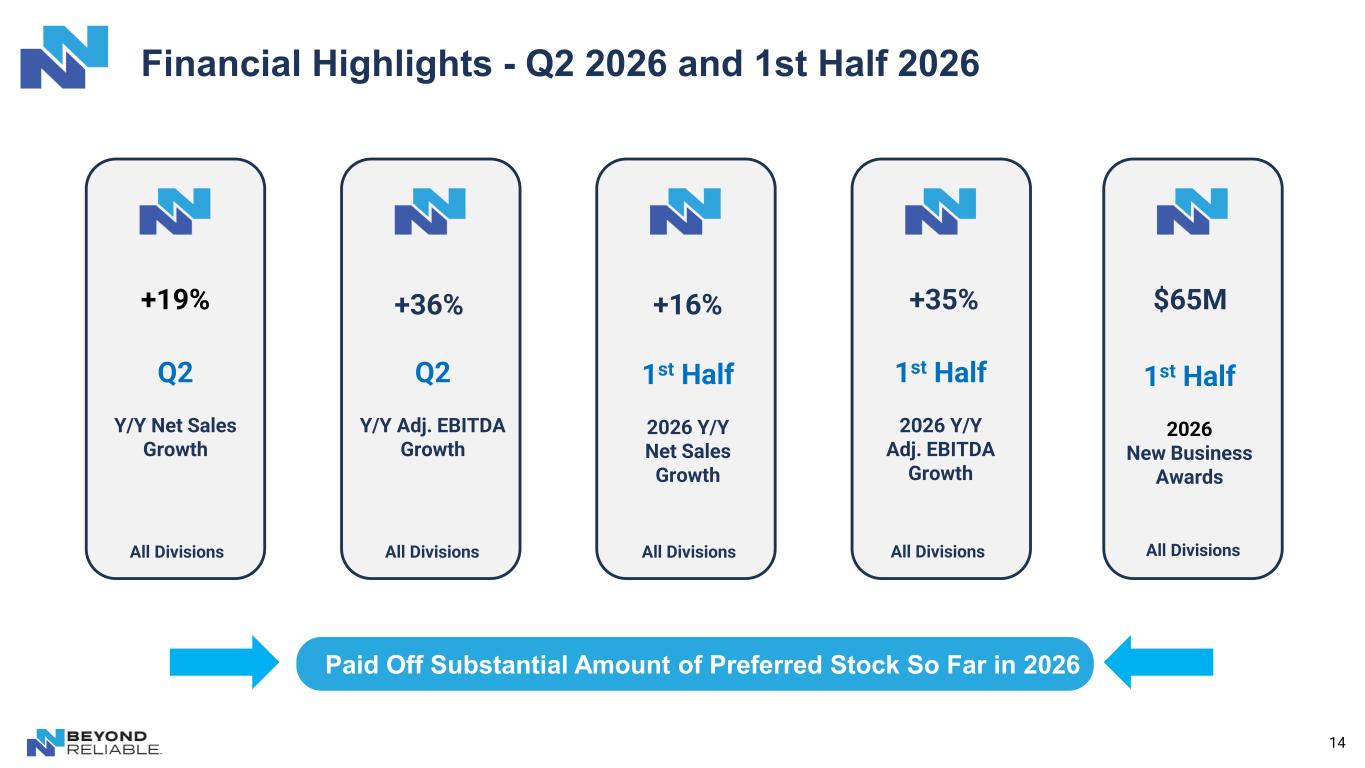
14 Financial Highlights - Q2 2026 and 1st Half 2026 +19% +16%+36% +35% $65M Q2 Y/Y Net Sales Growth 1st Half 2026 Y/Y Net Sales Growth Q2 Y/Y Adj. EBITDA Growth 1st Half 2026 Y/Y Adj. EBITDA Growth 1st Half 2026 New Business Awards All Divisions All Divisions All Divisions All Divisions All Divisions Paid Off Substantial Amount of Preferred Stock So Far in 2026
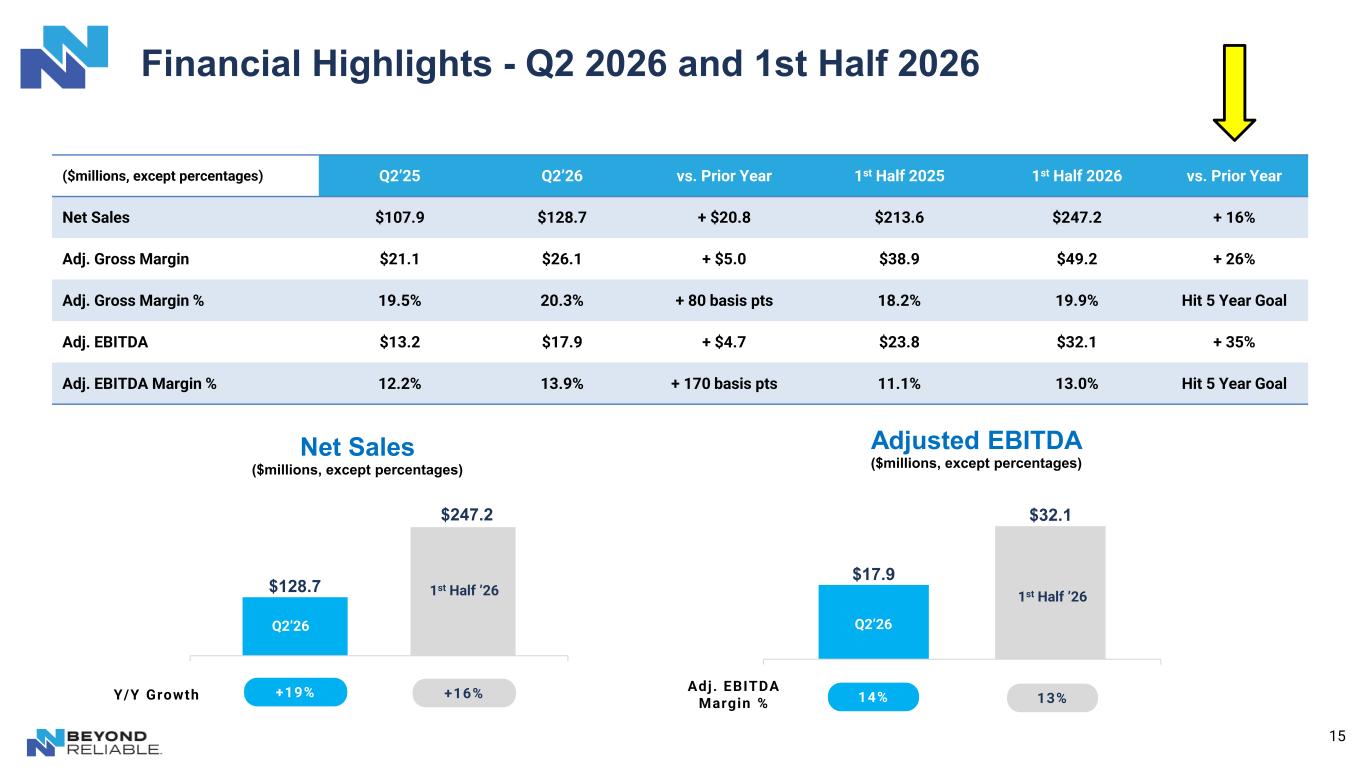
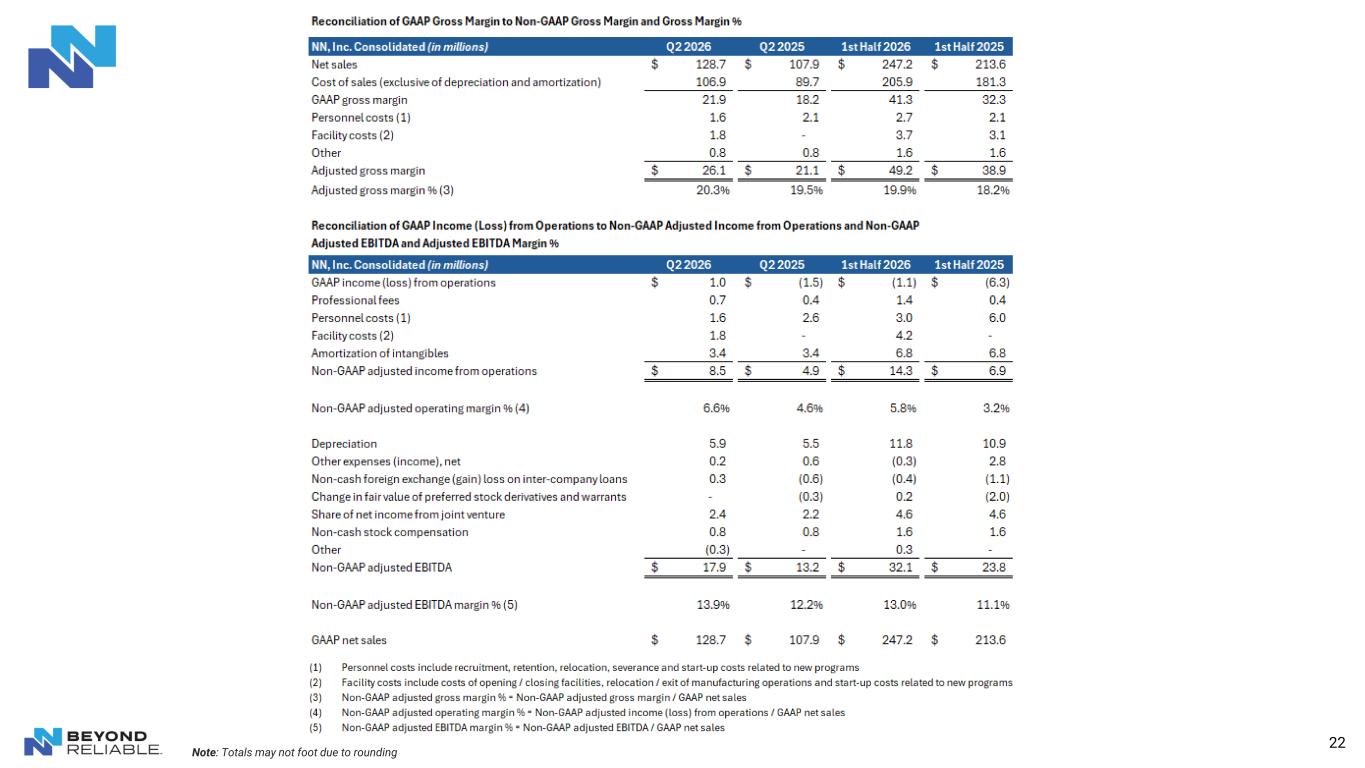
15 Financial Highlights - Q2 2026 and 1st Half 2026 $17.9 $32.1 Adjusted EBITDA ($millions, except percentages) $128.7 $247.2 Net Sales ($millions, except percentages) ($millions, except percentages) Q2’25 Q2’26 vs. Prior Year 1st Half 2025 1st Half 2026 vs. Prior Year Net Sales $107.9 $128.7 + $20.8 $213.6 $247.2 + 16% Adj. Gross Margin $21.1 $26.1 + $5.0 $38.9 $49.2 + 26% Adj. Gross Margin % 19.5% 20.3% + 80 basis pts 18.2% 19.9% Hit 5 Year Goal Adj. EBITDA $13.2 $17.9 + $4.7 $23.8 $32.1 + 35% Adj. EBITDA Margin % 12.2% 13.9% + 170 basis pts 11.1% 13.0% Hit 5 Year Goal +19% +16% 14% 13%Y/Y Growth Adj. EBITDA Margin % Q2’26 Q2’26 1st Half ’26 1st Half ’26
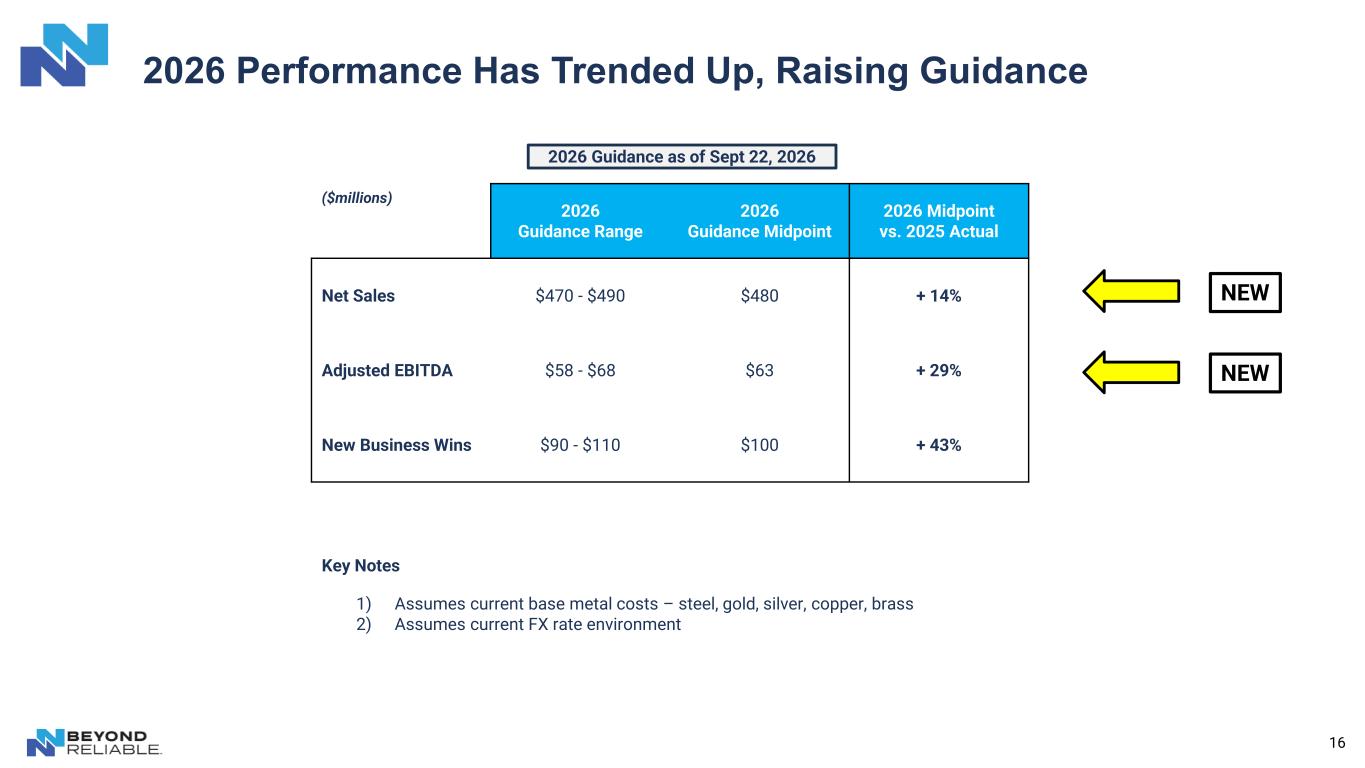
16 2026 Performance Has Trended Up, Raising Guidance ($millions) 2026 Guidance Range 2026 Guidance Midpoint 2026 Midpoint vs. 2025 Actual Net Sales $470 - $490 $480 + 14% Adjusted EBITDA $58 - $68 $63 + 29% New Business Wins $90 - $110 $100 + 43% Key Notes 1) Assumes current base metal costs – steel, gold, silver, copper, brass 2) Assumes current FX rate environment 2026 Guidance as of Sept 22, 2026 NEW NEW
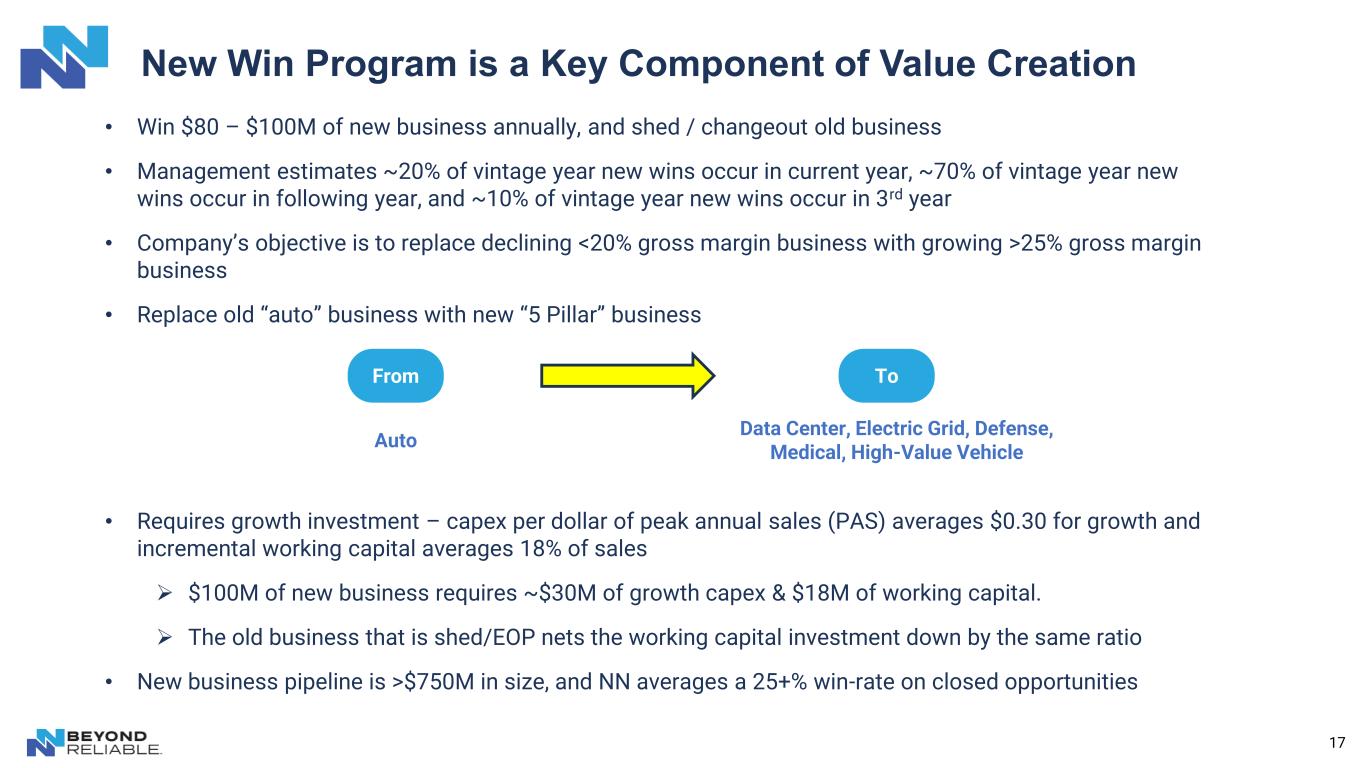
17 New Win Program is a Key Component of Value Creation • Win $80 – $100M of new business annually, and shed / changeout old business • Management estimates ~20% of vintage year new wins occur in current year, ~70% of vintage year new wins occur in following year, and ~10% of vintage year new wins occur in 3rd year • Company’s objective is to replace declining <20% gross margin business with growing >25% gross margin business • Replace old “auto” business with new “5 Pillar” business • Requires growth investment – capex per dollar of peak annual sales (PAS) averages $0.30 for growth and incremental working capital averages 18% of sales ➢ $100M of new business requires ~$30M of growth capex & $18M of working capital. ➢ The old business that is shed/EOP nets the working capital investment down by the same ratio • New business pipeline is >$750M in size, and NN averages a 25+% win-rate on closed opportunities Auto Data Center, Electric Grid, Defense, Medical, High-Value Vehicle From To
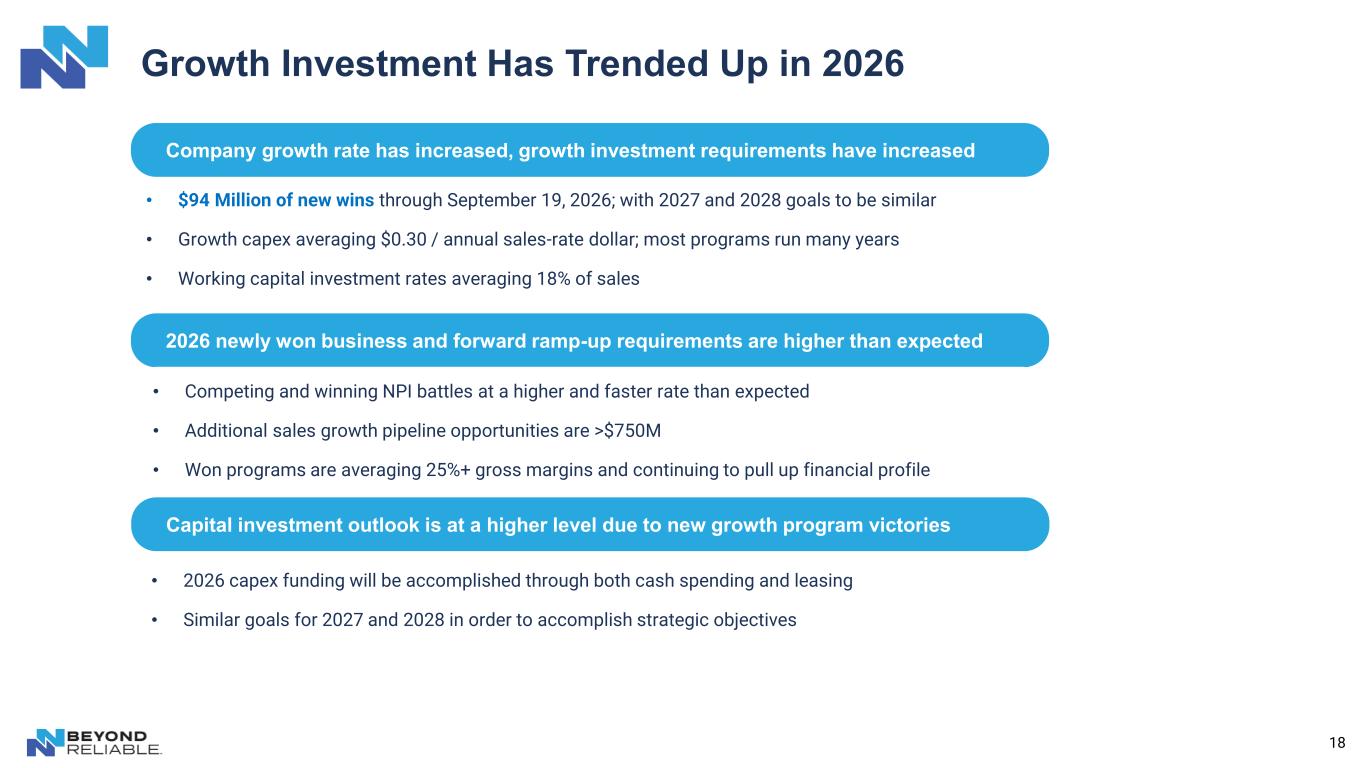
18 Growth Investment Has Trended Up in 2026 2026 newly won business and forward ramp-up requirements are higher than expected • Competing and winning NPI battles at a higher and faster rate than expected • Additional sales growth pipeline opportunities are >$750M • Won programs are averaging 25%+ gross margins and continuing to pull up financial profile Capital investment outlook is at a higher level due to new growth program victories • 2026 capex funding will be accomplished through both cash spending and leasing • Similar goals for 2027 and 2028 in order to accomplish strategic objectives • $94 Million of new wins through September 19, 2026; with 2027 and 2028 goals to be similar • Growth capex averaging $0.30 / annual sales-rate dollar; most programs run many years • Working capital investment rates averaging 18% of sales Company growth rate has increased, growth investment requirements have increased
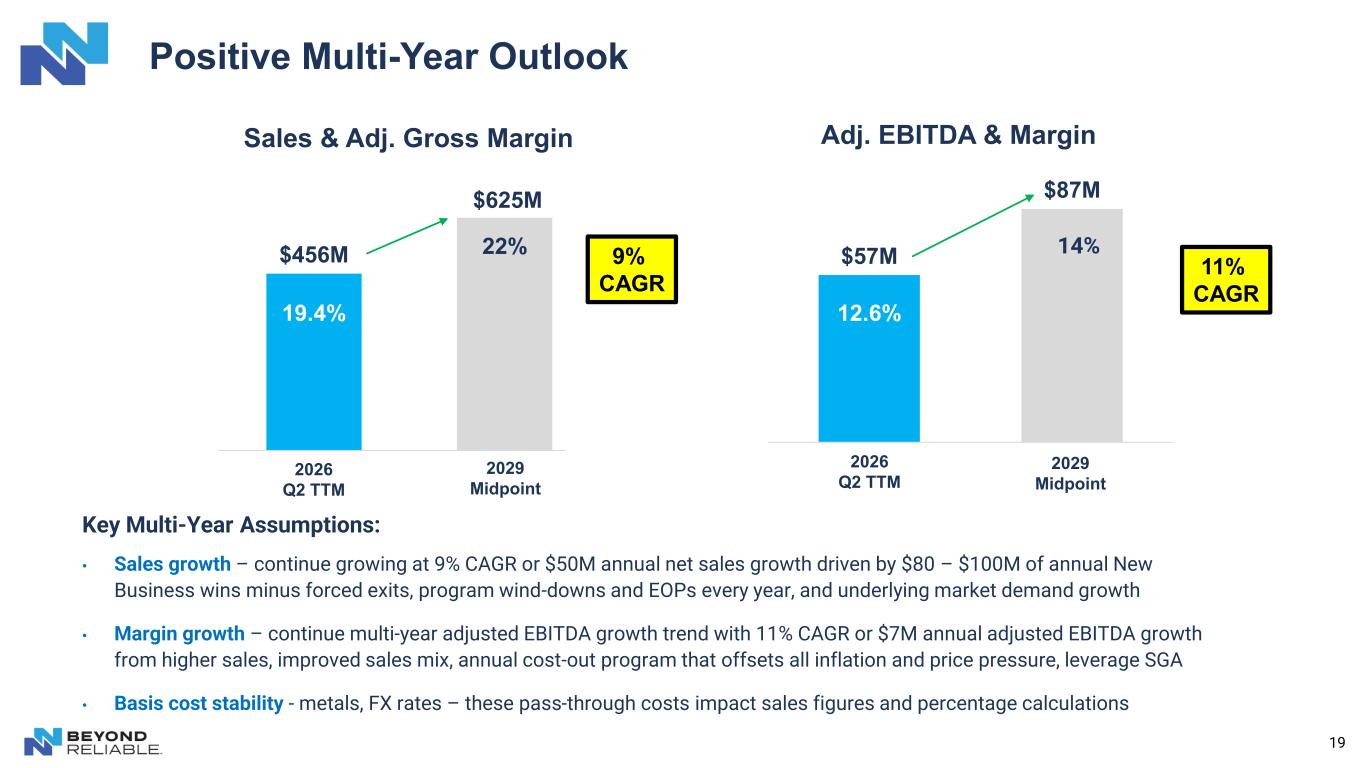
Positive Multi-Year Outlook 19 Key Multi-Year Assumptions: • Sales growth – continue growing at 9% CAGR or $50M annual net sales growth driven by $80 – $100M of annual New Business wins minus forced exits, program wind-downs and EOPs every year, and underlying market demand growth • Margin growth – continue multi-year adjusted EBITDA growth trend with 11% CAGR or $7M annual adjusted EBITDA growth from higher sales, improved sales mix, annual cost-out program that offsets all inflation and price pressure, leverage SGA • Basis cost stability - metals, FX rates – these pass-through costs impact sales figures and percentage calculations $456M Q2'26 TTM 2029 2030 Sales & Adj. Gross Margin 19.4% 22% $57M $87M Q2'26 TTM 2029 Adj. EBITDA & Margin 12.6% 14% $625M 9% CAGR 11% CAGR Midpoint Mid-PointMidp i 026 Q2 TTM 2026 Q2 TTM
20 Appendix
21 This presentation contains certain financial measures not presented in accordance with U.S. generally accepted accounting principles ("GAAP"), including adjusted gross margin, adjusted gross margin %, adjusted income from operations, adjusted EBITDA, adjusted EBITDA margin % (collectively, the "non-GAAP financial measures"). These non-GAAP financial measures are not calculated in accordance with GAAP and should not be considered in isolation from, or as a substitute for, the most directly comparable GAAP measures, and may not be comparable to similarly titled measures used by other companies. Management uses these non-GAAP financial measures, together with the comparable GAAP measures, to evaluate the Company's operating performance and underlying business trends across periods on a consistent basis, and to assist in operational and financial decision-making, including with respect to internal budgeting and resource allocation. Reconciliations of each non-GAAP financial measure to its most directly comparable GAAP measure are set forth in the tables accompanying this presentation. A reconciliation of forward-looking non-GAAP financial measures to the most directly comparable GAAP measures is not provided because the Company cannot reasonably predict certain items necessary for such reconciliation without unreasonable efforts. Non-GAAP Financial Measures Footnotes
22 Note: Totals may not foot due to rounding
23 Note: Totals may not foot due to rounding
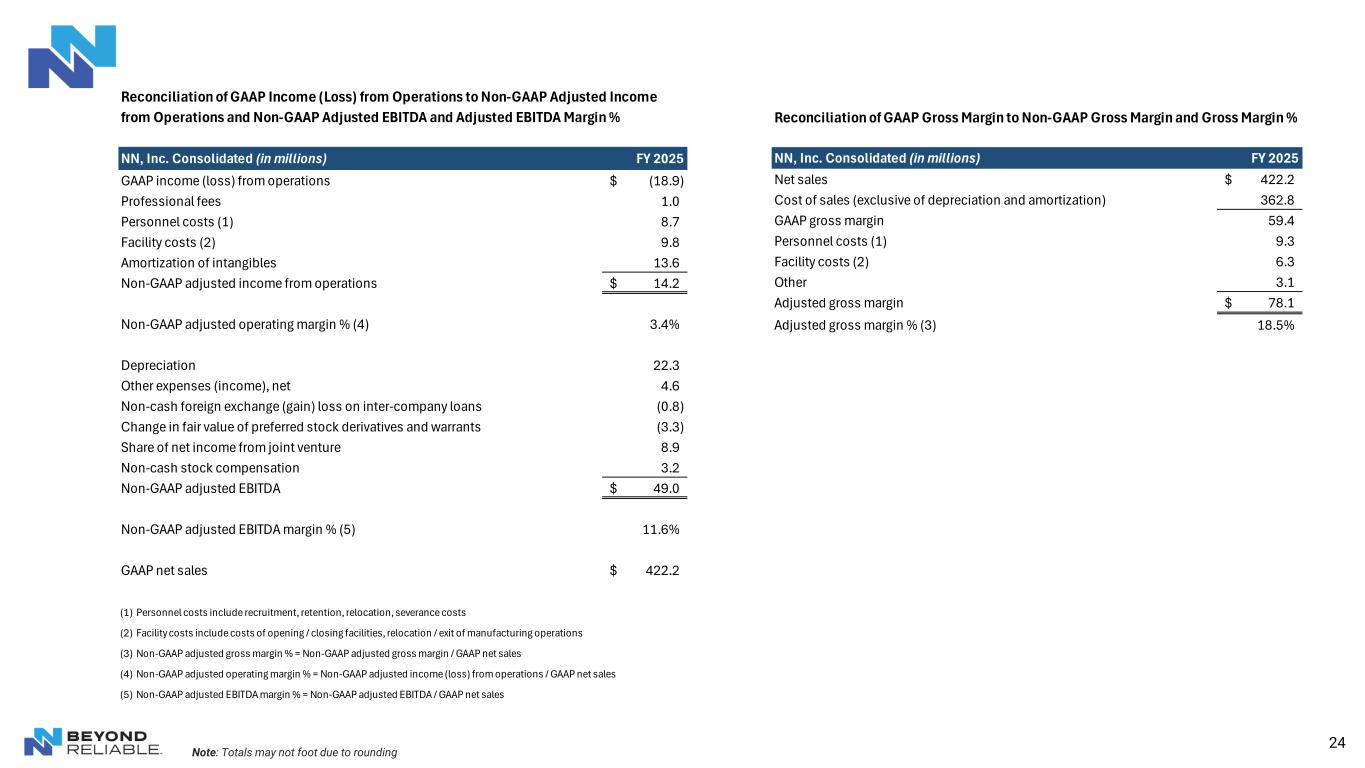
24 Reconciliation of GAAP Gross Margin to Non-GAAP Gross Margin and Gross Margin % NN, Inc. Consolidated (in millions) FY 2025 Net sales 422.2$ Cost of sales (exclusive of depreciation and amortization) 362.8 GAAP gross margin 59.4 Personnel costs (1) 9.3 Facility costs (2) 6.3 Other 3.1 Adjusted gross margin 78.1$ Adjusted gross margin % (3) 18.5% Note: Totals may not foot due to rounding NN, Inc. Consolidated (in millions) FY 2025 GAAP income (loss) from operations (18.9)$ Professional fees 1.0 Personnel costs (1) 8.7 Facility costs (2) 9.8 Amortization of intangibles 13.6 Non-GAAP adjusted income from operations 14.2$ Non-GAAP adjusted operating margin % (4) 3.4% Depreciation 22.3 Other expenses (income), net 4.6 Non-cash foreign exchange (gain) loss on inter-company loans (0.8) Change in fair value of preferred stock derivatives and warrants (3.3) Share of net income from joint venture 8.9 Non-cash stock compensation 3.2 Non-GAAP adjusted EBITDA 49.0$ Non-GAAP adjusted EBITDA margin % (5) 11.6% GAAP net sales 422.2$ (1) Personnel costs include recruitment, retention, relocation, severance costs (2) Facility costs include costs of opening / closing facilities, relocation / exit of manufacturing operations (3) Non-GAAP adjusted gross margin % = Non-GAAP adjusted gross margin / GAAP net sales (4) Non-GAAP adjusted operating margin % = Non-GAAP adjusted income (loss) from operations / GAAP net sales (5) Non-GAAP adjusted EBITDA margin % = Non-GAAP adjusted EBITDA / GAAP net sales Reconciliation of GAAP Income (Loss) from Operations to Non-GAAP Adjusted Income from Operations and Non-GAAP Adjusted EBITDA and Adjusted EBITDA Margin %
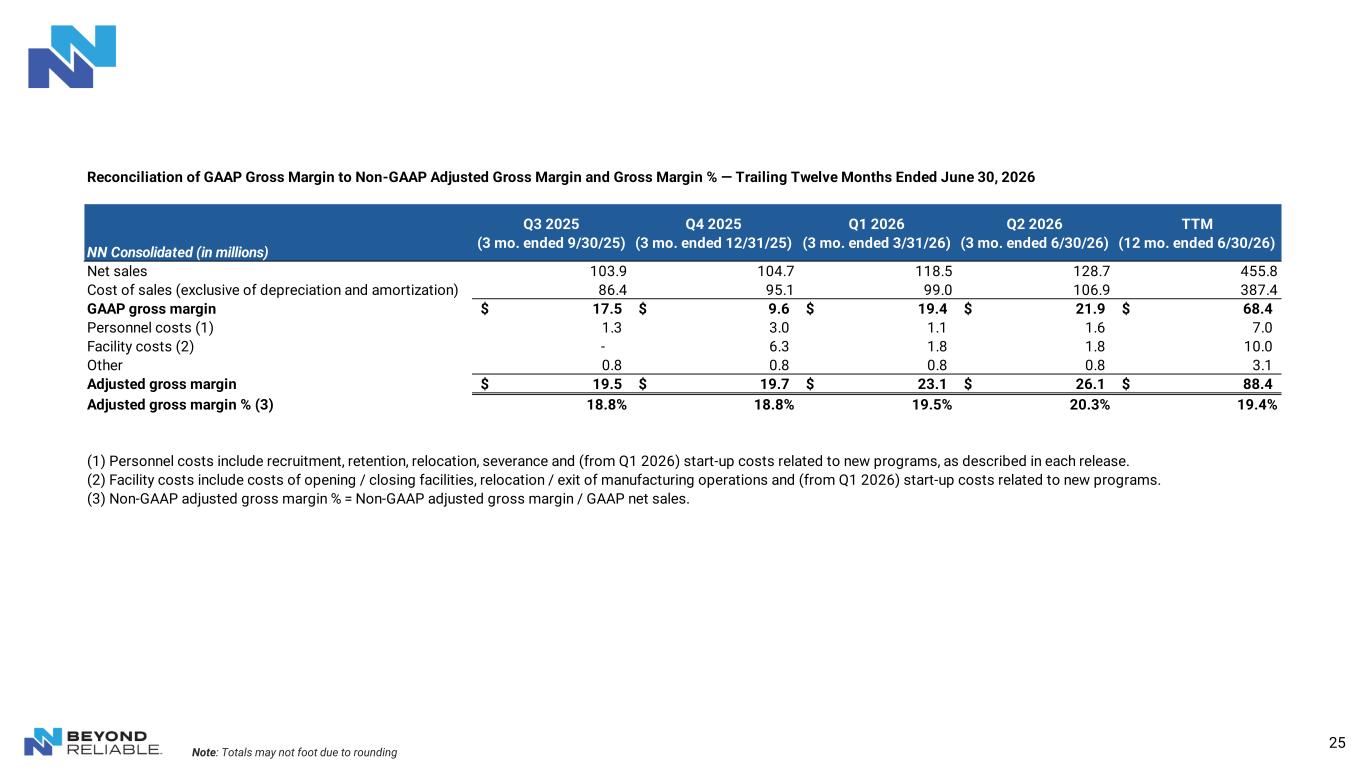
25 Note: Totals may not foot due to rounding Reconciliation of GAAP Gross Margin to Non-GAAP Adjusted Gross Margin and Gross Margin % — Trailing Twelve Months Ended June 30, 2026 NN Consolidated (in millions) Q3 2025 (3 mo. ended 9/30/25) Q4 2025 (3 mo. ended 12/31/25) Q1 2026 (3 mo. ended 3/31/26) Q2 2026 (3 mo. ended 6/30/26) TTM (12 mo. ended 6/30/26) Net sales 103.9 104.7 118.5 128.7 455.8 Cost of sales (exclusive of depreciation and amortization) 86.4 95.1 99.0 106.9 387.4 GAAP gross margin 17.5$ 9.6$ 19.4$ 21.9$ 68.4$ Personnel costs (1) 1.3 3.0 1.1 1.6 7.0 Facility costs (2) - 6.3 1.8 1.8 10.0 Other 0.8 0.8 0.8 0.8 3.1 Adjusted gross margin 19.5$ 19.7$ 23.1$ 26.1$ 88.4$ Adjusted gross margin % (3) 18.8% 18.8% 19.5% 20.3% 19.4% (1) Personnel costs include recruitment, retention, relocation, severance and (from Q1 2026) start-up costs related to new programs, as described in each release. (2) Facility costs include costs of opening / closing facilities, relocation / exit of manufacturing operations and (from Q1 2026) start-up costs related to new programs. (3) Non-GAAP adjusted gross margin % = Non-GAAP adjusted gross margin / GAAP net sales.
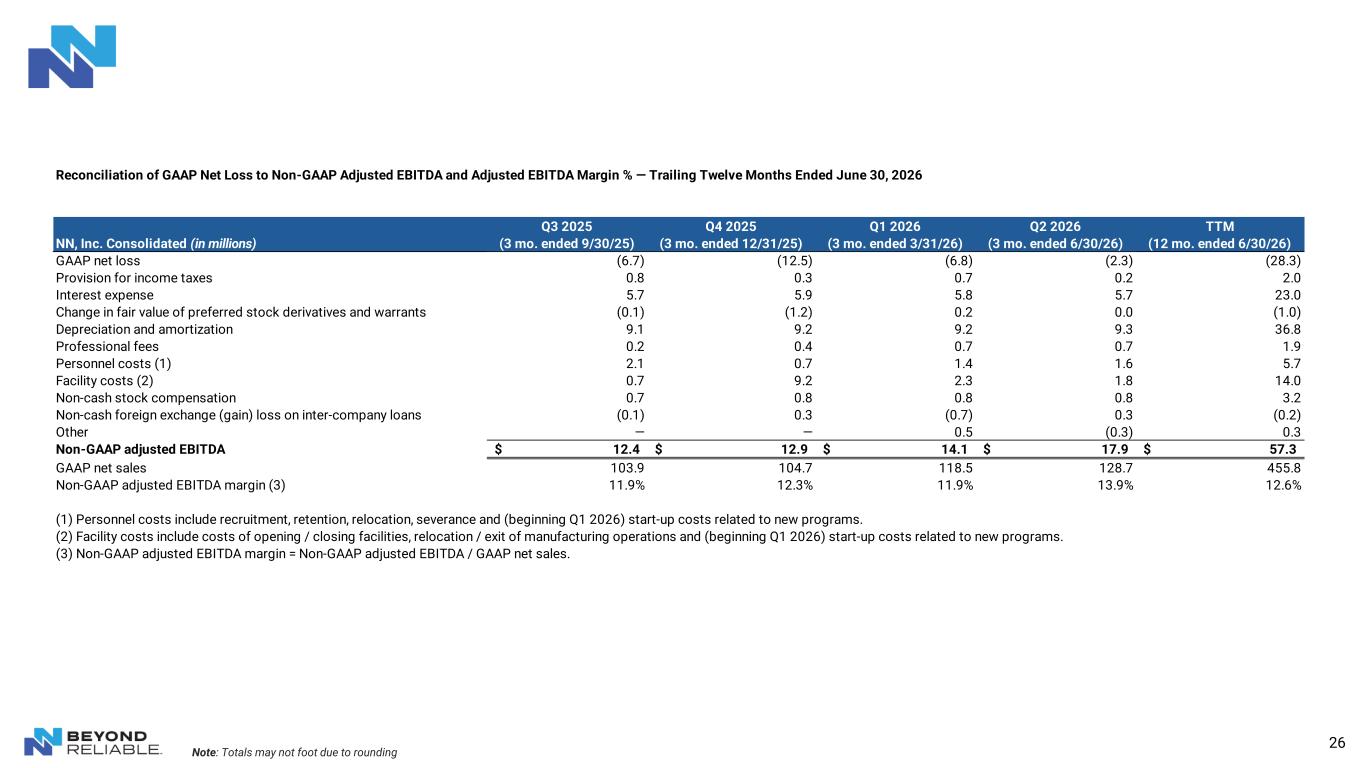
26 Note: Totals may not foot due to rounding Reconciliation of GAAP Net Loss to Non-GAAP Adjusted EBITDA and Adjusted EBITDA Margin % — Trailing Twelve Months Ended June 30, 2026 NN, Inc. Consolidated (in millions) Q3 2025 (3 mo. ended 9/30/25) Q4 2025 (3 mo. ended 12/31/25) Q1 2026 (3 mo. ended 3/31/26) Q2 2026 (3 mo. ended 6/30/26) TTM (12 mo. ended 6/30/26) GAAP net loss (6.7) (12.5) (6.8) (2.3) (28.3) Provision for income taxes 0.8 0.3 0.7 0.2 2.0 Interest expense 5.7 5.9 5.8 5.7 23.0 Change in fair value of preferred stock derivatives and warrants (0.1) (1.2) 0.2 0.0 (1.0) Depreciation and amortization 9.1 9.2 9.2 9.3 36.8 Professional fees 0.2 0.4 0.7 0.7 1.9 Personnel costs (1) 2.1 0.7 1.4 1.6 5.7 Facility costs (2) 0.7 9.2 2.3 1.8 14.0 Non-cash stock compensation 0.7 0.8 0.8 0.8 3.2 Non-cash foreign exchange (gain) loss on inter-company loans (0.1) 0.3 (0.7) 0.3 (0.2) Other — — 0.5 (0.3) 0.3 Non-GAAP adjusted EBITDA 12.4$ 12.9$ 14.1$ 17.9$ 57.3$ GAAP net sales 103.9 104.7 118.5 128.7 455.8 Non-GAAP adjusted EBITDA margin (3) 11.9% 12.3% 11.9% 13.9% 12.6% (1) Personnel costs include recruitment, retention, relocation, severance and (beginning Q1 2026) start-up costs related to new programs. (2) Facility costs include costs of opening / closing facilities, relocation / exit of manufacturing operations and (beginning Q1 2026) start-up costs related to new programs. (3) Non-GAAP adjusted EBITDA margin = Non-GAAP adjusted EBITDA / GAAP net sales.
Thank You 27