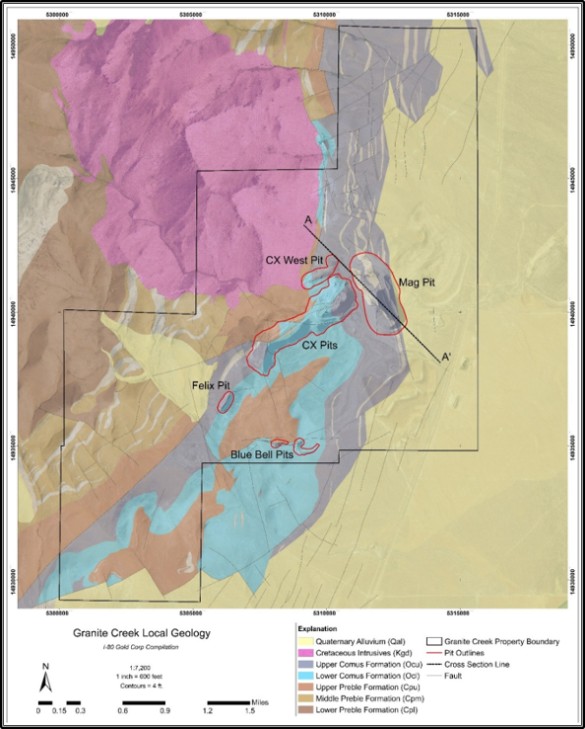
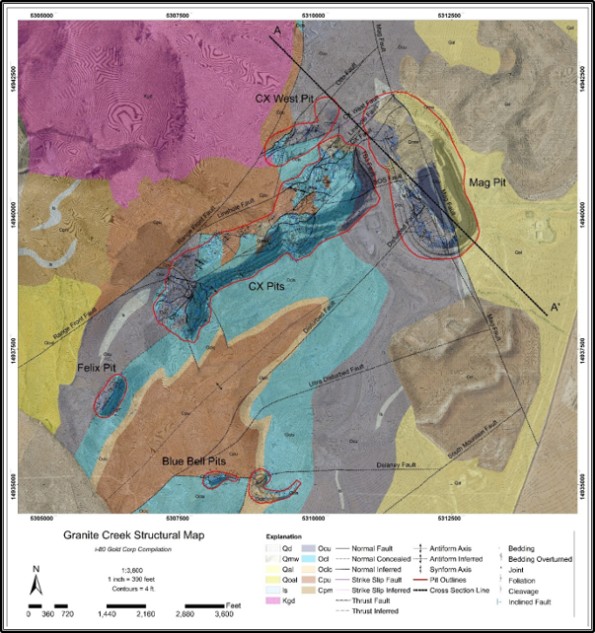
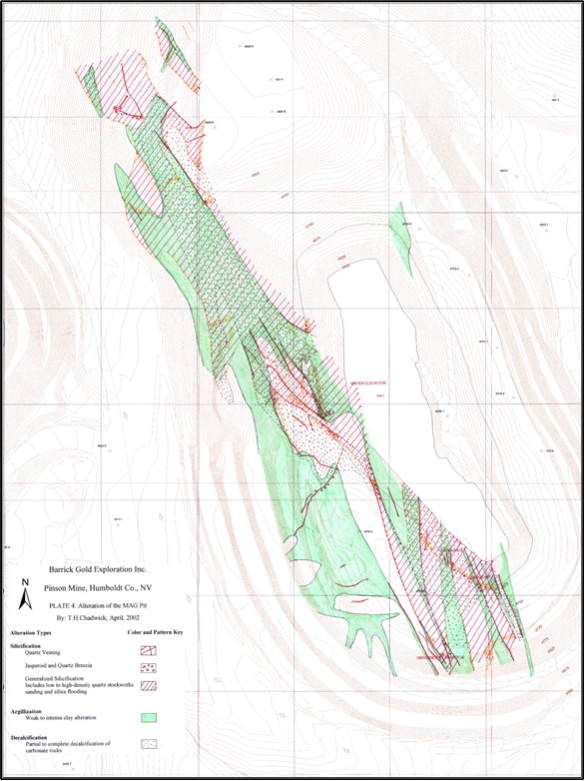
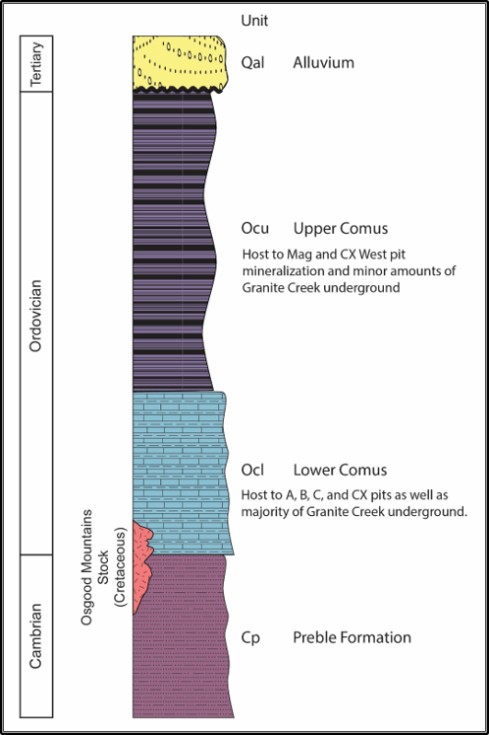
Exhibit 99.1


SEC Technical Report Summary

Pre-Feasibility Study

Granite Creek

Humboldt County, NV


Effective Date: March 31, 2026

Report Date: September 21, 2026


Report Prepared for


i-80 Gold Corp.


5190 Neil Road Suite 460

Reno, Nevada 89502


Report Prepared by


LOGO


SRK Consulting (U.S.), Inc.

999 Seventeenth Street, Suite 400

Denver, CO 80202


SRK Project Number: USPR002507


SRK Consulting (U.S.), Inc.

SEC Technical Report Summary – Granite Creek

   Page ii


Table of Contents


1  Executive Summary    1  

1.1  Property Description (Including Mineral Rights) and Ownership

     1  

1.2  Geology and Mineralization

     1  

1.3  Status of Exploration, Development and Operations

     2  

1.4  Mineral Resource and Mineral Reserve Estimates

     3  

1.4.1 Underground

     3  

1.4.2 Open Pit

     5  

1.5  Metallurgical Testing and Recovery Methods

     6  

1.6  Mineral Reserve

     7  

1.7  Summary Capital and Operating Cost Estimates

     9  

1.8  Economic Analysis

     10  

1.9  Permitting Requirements

     12  

1.10  Conclusions and Recommendations

     14  

1.10.1 Drilling

     14  

1.10.2 Mining

     14  

1.10.3 Metallurgical Testing

     15  

1.10.4 Permitting / Environmental

     15  

1.10.5 Economics

     15  

2  Introduction

     16  

2.1  Registrant for Whom the Technical Report Summary was Prepared

     16  

2.2  Terms of Reference and Purpose of the Report

     16  

2.3  Sources of Information

     16  

2.4  Details of Inspection

     16  

2.5  Report Version Update

     17  

3  Property Description

     18  

3.1  Property Description

     18  

3.2  Mineral Tenure and Surface Rights

     18  

3.2.1 Owned Unpatented Mining Claims

     22  

3.2.2 Leased Unpatented Mining Claims

     22  

3.2.3 Fee Lands

     22  

3.3  Royalties and Net Profit Interests

     22  

3.3.1 1996 Royal Gold Royalty – Granite Creek Property (Royal Gold, Inc. – Current Holder)

     23  

3.3.2 2026 Franco- Nevada Royalty – Granite Creek Property – 1.5% to 3% NSR

     24  

3.3.3 Pinson Private Royalty – Pinson Claims – 3.125% NSR (Noceto, Phillips, Murphy - Current Holders) & 0.17% NSR (FN USA & S&G Pinson – Current Holders)

     24  


September 2026


SRK Consulting (U.S.), Inc.

SEC Technical Report Summary – Granite Creek

   Page iii


3.3.4 Pinson Royalty – Section 21 Bee Dee 21-56 Claims – 0.5% NSR (Pinson Mining Company – Current Holder)

     24  

3.3.5 2001 Royal Gold Royalty – Section 21, 29 & Pacific Claims – 3-5% NSR (Royal Gold Inc. - Current Holder)

     24  

3.3.6 Goldfield Royalty – Section 33 – 2% NSR (FN USA - Current Holder)

     25  

3.3.7 Bee Dee Reserved Royalty - Bee Dee Claims - 2% NSR Royalty (FN USA (50%) and S&G Pinson, LLC (50%) – Current Holders)

     25  

3.3.8 Section 28 Private Royalty – Section 28 Fee lands - 2% NSR (Murphy, Noceto, Phillips, D. and J. Christison – Current Holders)

     25  

3.3.9 Mineral Production Royalty Agreement – Granite Creek Property - 10% Net Profit Interest (NGM - Current Holder)

     25  

3.4  History of Ownership and Prior Mining

     26  

3.5  Environmental Liabilities

     26  

3.6  Permits and Authorizations

     26  

4  Accessibility, Climate, Local Resources, Infrastructure and Physiography

     27  

4.1  Topography, Elevation and Vegetation

     27  

4.2  Means of Access

     27  

4.3  Climate and Length of Operating Season

     27  

4.4  Infrastructure Availability and Sources

     27  

4.4.1 Water

     28  

4.4.2 Electricity

     28  

4.4.3 Personnel

     28  

4.4.4 Supplies

     28  

5  History

     29  

5.1  Previous Operations

     29  

5.2  Exploration and Development of Previous Owners or Operators

     29  

6  Geological Setting, Mineralization, and Deposit

     31  

6.1  Regional, Local and Property Geology

     31  

6.1.1 Regional Geology

     31  

6.1.2 Local Geology

     33  

6.1.3 Property Geology

     36  

6.2  Mineral Deposit

     42  

6.3  Stratigraphic Column and Local Geology Cross-Section

     42  

7  Exploration

     45  

7.1  Exploration Work (Other Than Drilling)

     45  

7.1.1 Procedures and Parameters Relating to the Surveys and Investigations

     45  

7.1.2 Sampling Methods and Sample Quality

     49  

7.1.3 Information About the Area Covered

     49  

7.1.4 Significant Results and Interpretation

     49  


September 2026


SRK Consulting (U.S.), Inc.

SEC Technical Report Summary – Granite Creek

   Page iv


7.2  Exploration Drilling

     57  

7.2.1 Drilling Type and Extent

     57  

7.2.2 Drilling, Sampling, or Recovery Factors

     67  

7.2.3 Drilling Results and Interpretation

     68  

7.3  Hydrogeology

     78  

7.4  Geotechnical Data, Testing and Analysis

     85  

7.5  Property Plan View

     85  

7.6  Exploration Target

     85  

8  Sample Preparation, Analysis and Security

     86  

8.1  Sample Preparation Methods and Quality Control Measures

     86  

8.2  Sample Preparation, Assaying and Analytical Procedures

     86  

8.3  Quality Control Procedures/Quality Assurance

     87  

8.4  Opinion on Adequacy

     102  

8.5  Non-Conventional Industry Practice

     103  

9  Data Verification

     104  

9.1  Data Verification Procedures

     104  

9.2  WSP Verification

     119  

9.3  Limitations

     119  

9.4  Opinion on Data Adequacy

     119  

10  Mineral Processing and Metallurgical Testing

     121  

10.1  Metallurgical Testing Programs

     121  

10.2  Sample Representativeness

     136  

10.3  Laboratories

     149  

10.4  Relevant Results

     150  

10.5  Adequacy of Data and Non-Conventional Industry Practice

     170  

11  Mineral Resource Estimate

     172  

11.1  Open Pit

     172  

11.1.1 Drillhole Database

     172  

11.1.2 Topography

     174  

11.1.3 Geologic Model

     175  

11.1.4 Estimation Domains

     176  

11.1.5 Compositing

     183  

11.1.6 Evaluation of Outliers

     186  

11.1.7 Density

     187  

11.1.8 Variography

     187  

11.1.9 Block Model Parameters

     188  


September 2026


SRK Consulting (U.S.), Inc.

SEC Technical Report Summary – Granite Creek

   Page v


11.1.10 Estimation Domains

     188  

11.1.11 Estimation Parameters

     189  

11.1.12 Geometallurgical Modeling

     190  

11.1.13 Block Model Validation

     191  

11.1.14 Mineral Resource Classification

     199  

11.1.15 Open Pit Mineral Resource Statement

     201  

11.1.16 Mineral Resource Sensitivity by Domain

     203  

11.1.17 Factors that Could Affect Open Pit Mineral Resources

     206  

11.2  Underground Mineral Resources

     206  

11.2.1 Drillhole Database

     206  

11.2.2 Topography and Mining Depletion

     208  

11.2.3 Geological Model

     210  

11.2.4 Estimation Domain Analysis

     210  

11.2.5 Compositing

     223  

11.2.6 Assay Capping

     226  

11.2.7 Variogram Analysis and Modeling

     230  

11.2.8 Block Model Parameters

     233  

11.2.9 Estimation Methodology

     234  

11.2.10 Geo-Metallurgical Parameters

     241  

11.2.11 Density

     251  

11.2.12 Model Validation

     251  

11.2.13 Classification

     264  

11.2.14 Underground Mineral Resource Statement

     268  

11.2.15 Mineral Resource Sensitivity

     271  

11.2.16 Sources of Uncertainty

     273  

11.2.17 Reconciliation

     274  

11.2.18 Relevant Factors

     275  

12  Mineral Reserve Estimates

     282  

12.1  Key Assumptions, Parameters, and Methods Used

     282  

12.2  Cut-Off Grades Estimates

     285  

12.3  Reserves Classification and Criteria

     286  

12.4  Multiple Commodity Reserve

     286  

12.5  Impact of Changes of Modifying Factors to the Mineral Reserve Estimates

     286  


September 2026


SRK Consulting (U.S.), Inc.

SEC Technical Report Summary – Granite Creek

   Page vi


13  Mining Methods

     287  

13.1  Parameters Relevant to Mine Designs and Plans

     287  

13.1.1 Geotechnical

     287  

13.1.2 Hydrological

     293  

13.1.3 Ventilation

     295  

13.2  Production Rates, Expected Mine Life, Mining Unit Dimensions, and Mining Dilution and Recovery Factors

     301  

13.3  Requirements for Stripping, Underground Development, and Backfilling

     308  

13.4  Required Mining Equipment Fleet and Machinery, and Personnel

     309  

13.5  Final Mine Outline Map

     311  

14  Processing and Recovery Methods

     313  

14.1  Lone Tree Facility Historical Processing

     313  

14.2  Lone Tree Facility Process Description

     313  

14.2.1 Key Process Design Criteria

     316  

14.2.2 Ore Reclaim

     316  

14.2.3 Grinding

     317  

14.2.4 Thickening and Acidulation

     318  

14.2.5 Pressure Oxidation

     318  

14.2.6 POX Off-Gas Treatment

     319  

14.2.7 Neutralization

     320  

14.2.8 Carbon-in-Leach

     320  

14.2.9 Carbon Elution and Regeneration

     321  

14.2.10 Cyanide Destruction

     322  

14.2.11 Tailings Management

     322  

14.2.12 Water Distributions

     323  

14.2.13 Reagents

     324  

14.2.14 Oxygen Plant

     324  

14.2.15 Compressed Air

     325  

14.2.16 Utilities Consumption

     325  

14.2.17 Water Consumption

     325  

14.3  Third-Party Refractory Processing

     326  

15  Infrastructure

     329  

15.1  Summary

     329  

15.2  Access and Local Resources

     329  

15.3  Administrative Facilities

     330  

15.4  Dewatering

     331  

15.4.1 Dewatering Wells

     331  

15.4.2 Monitoring Wells and VWPs

     334  

15.4.3 Underground Contact Water Management

     338  

15.4.4 Water Treatment and Rapid Infiltration Basins

     339  

15.4.5 Fresh Water Supply

     343  


September 2026


SRK Consulting (U.S.), Inc.

SEC Technical Report Summary – Granite Creek

   Page vii


15.5  Electrical

     343  

15.6  Portal Facilities

     344  

15.7  Backfill Aggregate Crusher

     346  

15.8  Screen Plant

     346  

15.9  Waste Rock Disposal (WRD)

     347  

15.10 Waste Disposal

     349  

15.11 Communications

     350  

15.12 Equipment

     350  

16  Market Studies

     351  

16.1  Market Information

     351  

16.2  Contracts and Status

     353  

17  Environmental Studies, Permitting, and Plans, Negotiations, or Agreements with Local Individuals or Groups

     355  

17.1  Environmental Study Results

     355  

17.2  Requirements and Plans for Waste and Tailings Disposal, Site Monitoring, and Water Management During Operations and After Mine Closure

     359  

17.3  Project Permitting

     362  

17.4  Local Individuals and Groups

     364  

17.5  Mine Closure

     365  

17.6  Adequacy of Plans

     367  

17.7  Commitments to Ensure Local Procurement and Hiring

     367  

18  Capital and Operating Costs

     368  

18.1  Underground

     368  

18.1.1 Expected Accuracy of Cost Estimates

     368  

18.1.2 Capital Cost Estimates

     368  

18.1.3 Operating Cost Estimates

     368  

18.1.4 Closure and Reclamation

     370  

18.1.5 Infrastructure

     370  

18.2  Surface Operating Costs

     370  

18.2.1 Autoclave Capital Cost Allocation (Processing Fee)

     372  

18.2.2 Operating Cost Estimates

     375  

18.2.3 General and Administrative Costs

     379  

19  Economic Analysis

     380  

19.1  General Description

     380  

19.2  Results

     389  

19.3  Sensitivity Analysis

     408  


September 2026


SRK Consulting (U.S.), Inc.

SEC Technical Report Summary – Granite Creek

   Page viii


20  Adjacent Properties

     410  

21  Other Relevant Data and Information

     412  

22  Interpretation and Conclusions

     413  

23  Recommendations

     422  

23.1  Recommended Work Programs

     422  

23.2  Recommended Work Program Costs

     425  

24  References

     426  

25  Reliance on Information Provided by the Registrant

     432  

26  Date and Signature Page

     434  
Appendices      1  
Appendix A: Consent Letter      2  

List of Tables

  
Table 1-1: Inclusive Mineral Resource Statement for Granite Creek Underground - Effective Date March 31, 2026      4  
Table 1-2: Exclusive Mineral Resource Statement for Granite Creek Underground - Effective Date March 31, 2026      5  
Table 1-3: Granite Creek Open Pit Mineral Resource Statement      6  
Table 1-4: Underground Cut-off Grade Parameters      8  
Table 1-5: Mineral Reserve Estimate for Granite Creek as of March 31, 2026 - SRK Consulting (U.S.), Inc.      9  
Table 1-6: Life of Mine Capital Costs      10  
Table 1-7: Life of Mine Operating Costs      10  
Table 1-8: Indicative Economic Result      11  
Table 2-1: Site Visit Participants      17  
Table 3-1: Summary of Mineral and Surface Title Holders, Granite Creek Project      20  
Table 3-2: Holding Costs, Granite Creek Project      21  
Table 3-3: Owned Unpatented Claims, Granite Creek Project      21  
Table 3-4: Leased Unpatented Claims, Granite Creek Project      21  
Table 7-1: Salient Results of the Ogee Zone Channel Sample Assays      57  
Table 7-2: Summary of Historical Drilling (pre i-80) on the Granite Creek Property Since 1970      59  
Table 7-3: PMC Drilling 1970 to 1996      59  
Table 7-4: PMC – Homestake Drilling 1997 to 2000      59  
Table 7-5: PMC – Barrick Drilling 2003      59  
Table 7-6: Atna Drilling 2004      60  
Table 7-7: Atna Drilling 2005 to 2006      60  


September 2026


SRK Consulting (U.S.), Inc.

SEC Technical Report Summary – Granite Creek

   Page ix


Table 7-8: PMC (Barrick) Drilling 2007      60  
Table 7-9: PMC (Barrick) 2008 Drilling      61  
Table 7-10: 2012 Atna Mag Pit Core Drilling      61  
Table 7-11: 2013 to 2015 Atna Underground Development RC Drilling      61  
Table 7-12: Drillholes Within the Current Property Boundary by Type and Operator      63  
Table 8-1: Historical (pre-i-80) Operators, Periods, and Analytical Laboratories at Granite Creek      87  
Table 8-2: Historical (pre-i-80) CRMs at Granite Creek — Certified Au Values and Insertion Counts      88  
Table 8-3: i-80 Gold CRM Catalog Used at Granite Creek, 2021 to 2026 (year-to-date) — Certified Au Values and Insertion Counts      91  
Table 8-4: Lower Limit of Detection (LLD) and 5xLLD Blank Acceptance Threshold by Gold Analytical Method      95  
Table 8-5: Duplicate Tolerance Envelopes Applied to the i-80 Gold Drillhole Assay Database      96  
Table 8-6: Annual QA/QC Insertion Summary, i-80 Gold Drillhole Sampling at Granite Creek, 2021 to 2026      100  
Table 9-1: i-80 Standard Operating Procedure List      112  
Table 10-1: Metallurgical Test Work Programs      121  
Table 10-2: Underground Samples Batch Pressure Oxidation Conditions from FLS Program      123  
Table 10-3: Granite Creek Underground Metallurgical Sample Blends for Additional Testing      124  
Table 10-4: Granite Creek Underground Metallurgical Testing Program Follow-Up BTAC Test Conditions      124  
Table 10-5: Granite Creek Underground Metallurgical Testing Program Continuous POX Run Test Conditions      124  
Table 10-6: Underground Blend Samples Cyanide Detox Conditions from FLS Program      126  
Table 10-7: Proportions of Continuous Pressure Oxidation Feed from i-80 Sources      127  
Table 10-8: Particle Size Analysis of Continuous Pressure Oxidation Blend and Components      128  
Table 10-9: Continuous Pressure Oxidation Test Conditions      128  
Table 10-10: Continuous Pressure Oxidation Testing, Cyanide Detoxification Conditions      133  
Table 10-11: Malvern Laser Diffraction Particle Size Analysis of Continuous Pressure Oxidation Samples      134  
Table 10-12: Required Solids Feed Concentration Ranges      134  
Table 10-13: Continuous Fill Tests on Continuous Pressure Oxidation Samples      134  
Table 10-14: Slurry Rheology on Continuous Pressure Oxidation Samples      134  
Table 10-15: Pressure Filtration on Cyanide Detoxification Samples      135  
Table 10-16: Bond Ball Mill Grindability Test Results      135  
Table 10-17: Underground Samples Head Assays from FLS Program      137  
Table 10-18: Composition of Continuous Pressure Oxidation Feed Blend      138  
Table 10-19: South Pacific Test Program Sample List      138  
Table 10-20: Projected Feed from Granite Creek Underground      149  
Table 10-21: Summary of Feed Values for Granite Creek Test Programs      149  
Table 10-22: Autoclave Pre-Treatment Tests from Dawson Test Work Program      150  


September 2026


SRK Consulting (U.S.), Inc.

SEC Technical Report Summary – Granite Creek

   Page x


Table 10-23: Underground Samples Baseline and Batch Pressure Oxidation CIL Results from FLS Program      153  

Table 10-24: Granite Creek Underground Metallurgical Testing Program Follow-Up BTAC Sulfide Oxidation Results Compared to Predicted Results

     154  

Table 10-25: Granite Creek Underground Metallurgical Testing Program Follow-Up BTAC Gold Recovery Results Compared to Predicted Results

     155  
Table 10-26: Underground Samples (OAPC) Continuous Autoclave Tests from FLS Program      156  
Table 10-27: Underground Cyanide Detox Reagent Consumption from FLS Program      157  
Table 10-28: Underground Cyanide Detox WAD from FLS Program      157  
Table 10-29: Pressure Oxidation Continuous Test, Sulfide Sulfur Oxidation and Carbonate Decomposition      158  
Table 10-30: Bench Top Autoclave Tests on Continuous Pressure Oxidation Feed Blend      158  
Table 10-31: Continuous Pressure Oxidation, CIL Au Recovery      159  
Table 10-32: Bench Top Autoclave, CIL Au Recovery      159  
Table 10-33: POX Results      161  
Table 10-34: Baseline CIL Results      162  
Table 10-35: POX Residue CIL Results      163  
Table 10-36: Gold Recovery Results from Toll Milling BTAC Tests      165  
Table 10-37: BTAC Gold Recovery Results on Otto Zone Samples      168  
Table 11-1: Negative Values in Drillhole Database      174  
Table 11-2: Open Pit Estimation Zone and Pit Name      177  
Table 11-3: Open Pit Numeric Indicator Model Parameters      177  
Table 11-4: Open Pit Compositing Interval Statistics      185  
Table 11-5: Open Pit Compositing Comparison, 6 m (20 ft) Intervals      186  
Table 11-6: Open Pit Upper Clipping (Capping) Au ppm Values by Domain      187  
Table 11-7: Open Pit Domain Density Summary      187  
Table 11-8: Open Pit Variogram Parameters      188  
Table 11-9: Open Pit Block Model Parameters      188  
Table 11-10: Open Pit ID2 Estimation Parameters      190  
Table 11-11: Open Pit Combined Estimator Hierarchy      190  
Table 11-12: Open Pit Comparison of Composite Values to Grade Estimation Methods      195  
Table 11-13: Open Pit Mineral Resource Classification Parameters      200  
Table 11-14: Open Pit Parameters for Resource Class Numeric Indicator Model      200  
Table 11-15: Granite Creek Resource Parameters for Open Pit Optimization      202  
Table 11-16: Granite Creek Open Pit Mineral Resource Statement      203  
Table 11-17: Granite Creek Mineral Resource Sensitivity to Cut-off Grade – Reported on 100% basis      204  
Table 11-18: Summary of Drilling and Sampling in Target Area      207  
Table 11-19: Summary of Drilling and Sampling Information Available within Leapfrog      207  
Table 11-20: Summary of Domains and Criteria Used      221  


September 2026


SRK Consulting (U.S.), Inc.

SEC Technical Report Summary – Granite Creek

   Page xi


Table 11-21: Summary of Raw vs. Capped Composite Statistics per Domain      230  
Table 11-22: Summary of Gold Variogram Parameters      231  
Table 11-23: Summary of Rotated Prototype Parameters Used in Granite Creek Model      234  
Table 11-24: Summary of Faults and Key Structures Used to Define Variable Orientations for Estimation      235  
Table 11-25: Summary of Estimation Parameters for Gold Estimates      240  
Table 11-26: Summary Statistics and Coverage of Raw Sampling per Metallurgical Parameter vs. Gold Coverage      242  
Table 11-27: Summary Statistics of Capped Composites (5 ft), Showing Capping (Maximum) Levels per Metallurgical Elements      243  
Table 11-28: Summary of Variogram Parameters Used for Metallurgical Elements      245  
Table 11-29: Summary of Search Parameters Used for AuCN      246  
Table 11-30: Summary Estimation Parameters (CO3 %)      247  
Table 11-31: Summary Estimation Parameters (Preg Rob %)      248  
Table 11-32: Summary Estimation Parameters (Total Organic Carbon, TOC %)      249  
Table 11-33: Summary Estimation Parameters (Sulfide Sulfur %)      250  
Table 11-34: Density Values Used in the Underground Model      251  
Table 11-35: Summary Statistics of Raw and Declustered Composite Grades vs. Block Estimates and NN-Assigned Values (0 g/t Cut-off)      259  
Table 11-36: Summary of Mineral Resource Cut-off and MSO Assumptions      269  
Table 11-37: Inclusive Mineral Resource Statement for Granite Creek Underground - Effective Date March 31, 2026      270  
Table 11-38: Exclusive Mineral Resource Statement for Granite Creek Underground - Effective Date March 31, 2026      271  
Table 11-39: Grade Sensitivity (Combined Measured and Indicated), inside MSO on a 100% Project basis      272  
Table 11-40: Grade Sensitivity Table (Inferred), inside MSO on a 100% Project Basis      273  
Table 11-41: Open Pit Mineral Resource Sensitivity by Domain      277  
Table 11-42: Underground Mineral Resource Sensitivity (1 of 2)      280  
Table 11-43: Underground Mineral Resource Sensitivity (2 of 2)      281  
Table 12-1: Mineral Reserve Estimate for Granite Creek Underground – Effective Date March 31, 2026      284  
Table 12-2: Underground Cut-off Grade Parameters      285  
Table 13-1: Geotechnical Domains      289  
Table 13-2: Geotechnical Parameters for the Three Geotechnical Domains      289  
Table 13-3: RMR Summary for Each Geotechnical Domain      290  
Table 13-4: Major Joint Sets Defined by Televiewer Data Analysis in Dips Software      290  
Table 13-5: Stress Analysis from Assumed Depth and k Value of 0.75      291  


September 2026


SRK Consulting (U.S.), Inc.

SEC Technical Report Summary – Granite Creek

   Page xii


Table 13-6: Ground Support Recommendations for Granite Creek SPZ Development and Mining      291  
Table 13-7: Recommended Operating Practices for Ground Support Installation      292  
Table 13-8: Site Visit Temperature and Humidity Data      295  
Table 13-9: MSHA Standards      297  
Table 13-10: Capital Cost Estimate      300  
Table 13-11: Annual Operating Cost Estimate      300  
Table 13-12: Productivity Rates      305  
Table 13-13: Schedule Parameters for Underground Mining      306  
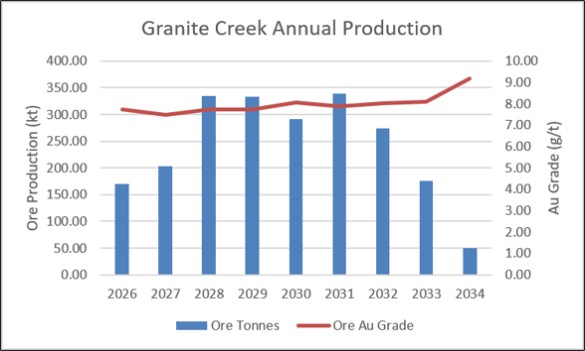
Table 13-14: Granite Creek Annual Production Schedule      307  
Table 13-15: Mobile Equipment Fleet      310  
Table 13-16: Granite Creek Manpower      311  
Table 14-1: Summary of Key Process Statistics      316  
Table 14-2: Design Scenarios for Lone Tree Autoclave Feed      316  
Table 14-3: Lone Tree Facility Water Consumption by Type      325  
Table 14-4: Lone Tree Facility Energy Usage by Area      326  
Table 15-1: Granite Creek Active Dewatering Wells      333  
Table 15-2: Summary of Locations, Construction Information and Water Levels for Dewatering Wells, Monitoring Wells, and Piezometers      336  
Table 15-3: Projected Electrical Demand by Area      343  
Table 15-4: WRD Capacity      348  
Table 17-1: MWMP Results of Rock Placed in CX Pit 2005 to 2022      356  
Table 17-2: MWMP Results of Rock Placed in CX Pit 2023 to 2025      357  
Table 17-3: Water Quality April 2023 to January 2025      357  
Table 17-4: Granite Creek Mine Project Permits      363  
Table 18-1: Estimated Mining Capital Cost      368  
Table 18-2: Mining Operating Costs      369  
Table 18-3: Infrastructure Capital Cost Estimates1      370  
Table 18-4: Infrastructure Unit Operating Cost Estimates      371  
Table 18-5: Annual Infrastructure Operating Costs (US$000’s)      371  
Table 18-6: Unit Costs for Over-the-Road Ore Haulage      372  
Table 18-7:Capital Cost Summary      373  
Table 18-8: Sustaining CAPEX Assumptions for Lone Tree      374  
Table 18-9: Lone Tree Processing Facility Operating Cost Summary      375  
Table 18-10: Lone Tree Pressure Oxidation-CIL Power Costs      375  
Table 18-11: Lone Tree Pressure Oxidation-CIL Labor Costs      377  
Table 18-12: Lone Tree Pressure Oxidation-CIL Maintenance Costs.      377  
Table 18-13: Lone Tree Pressure Oxidation-CIL Consumable Costs      377  
Table 18-14: Key Consumables Costs for Lone Tree Pressure Oxidation-CIL      378  
Table 18-15: Lone Tree Pressure Oxidation-CIL Facility Costs      378  
Table 18-16: Lone Tree Processing Facility Operating Cost Summary      378  


September 2026


SRK Consulting (U.S.), Inc.

SEC Technical Report Summary – Granite Creek

   Page xiii


Table 18-17: Average Annual G&A Spend      379  
Table 19-1: Basic Model Parameters      380  
Table 19-2: Net Proceeds of Mineral Tax Sliding Scale      381  
Table 19-3: Life-of-Mine Production Summary      383  
Table 19-4: Granite Creek Processing Summary      384  
Table 19-5: Granite Creek Mining Cost Summary      386  
Table 19-6: Granite Creek Processing Costs      387  
Table 19-7: Granite Creek Surface Costs      387  
Table 19-8: Granite Creek Power Costs      387  
Table 19-9: Granite Creek G&A Costs      387  
Table 19-10: Modeled Sustaining Capital      388  
Table 19-11: Indicative Economic Results      389  
Table 19-12: Economic Results – Tabular Data      390  
Table 23-1: Summary of Costs for Open Pit and Underground Recommended Work Programs      425  
Table 25-1: Reliance on Information Provided by the Registrant      433  


List of Figures

  
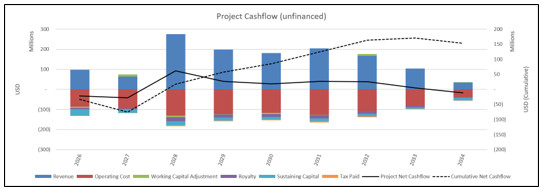
Figure 1-1: Annual Cash Flow Summary      12  
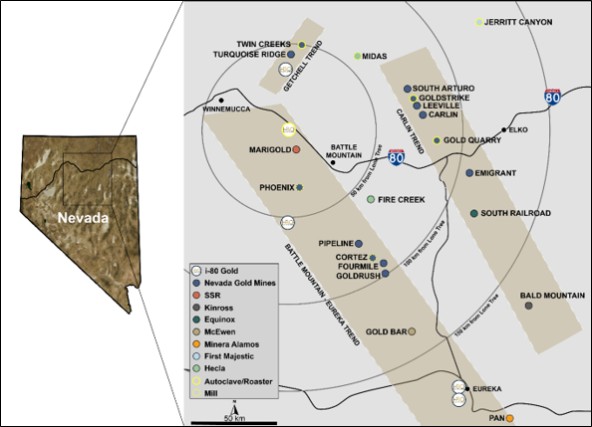
Figure 3-1: Granite Creek Project Location      18  
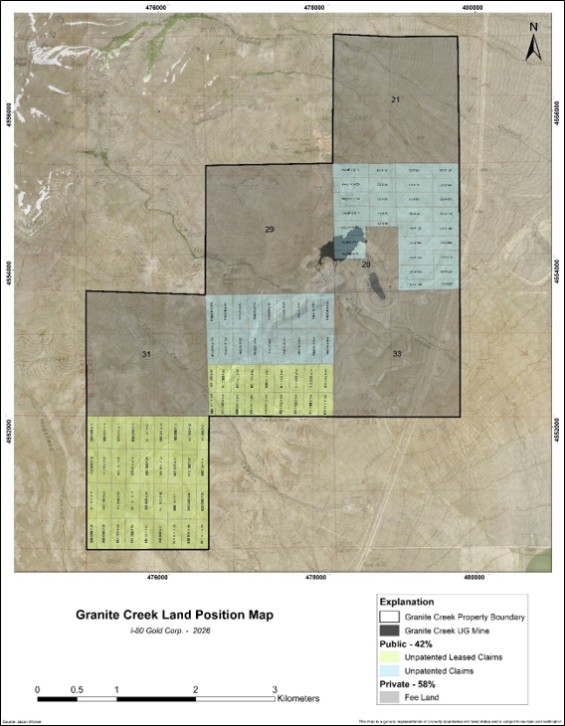
Figure 3-2: Land Position Map, Granite Creek Project      19  
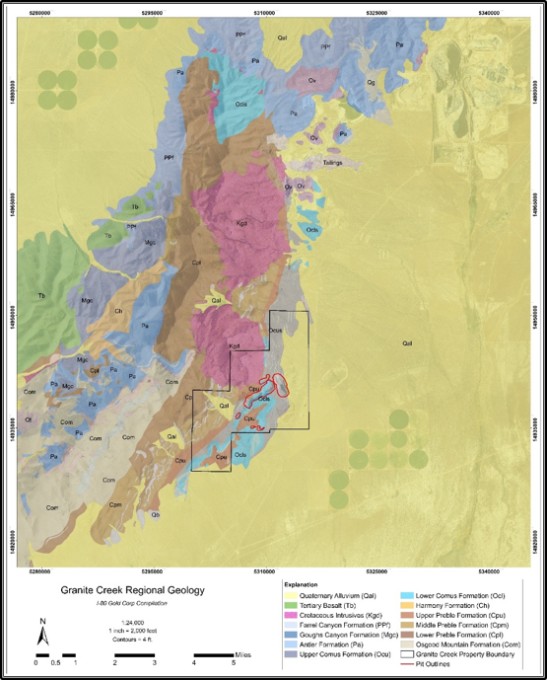
Figure 6-1: Regional Geology Map      33  
Figure 6-2: Local Geology Map      35  
Figure 6-3: Property Geology Map      40  
Figure 6-4: Alteration of the Mag Pit      41  
Figure 6-5: Granite Creek Stratigraphic Column      43  
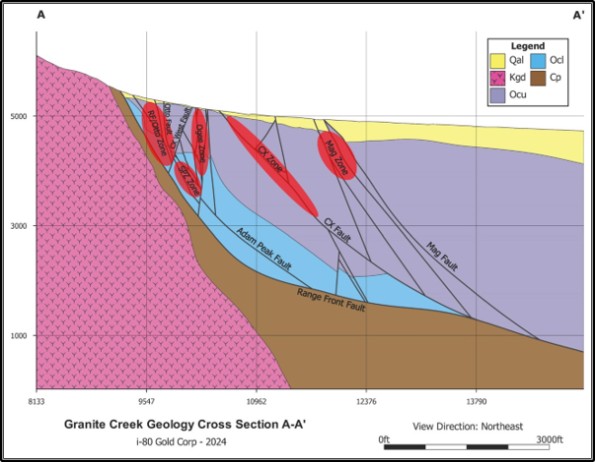
Figure 6-6: Cross-section A-A’ looking Northeast showing Structure, Lithology and Mineralization      44  
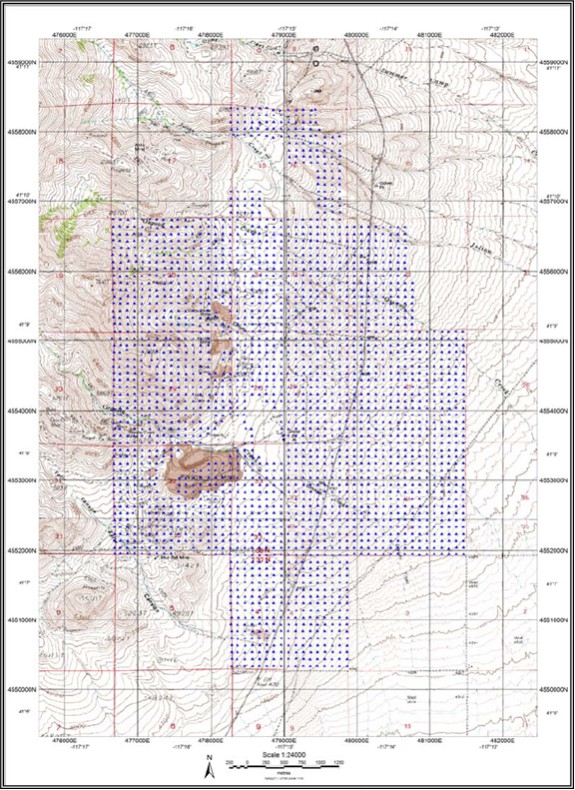
Figure 7-1: Gravity Survey, 2,587 Stations, Magee Geophysical Services, 2006      46  
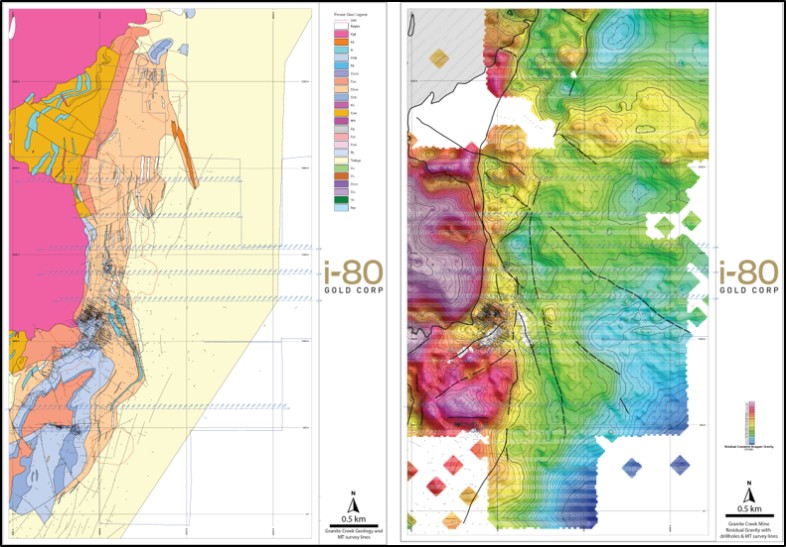
Figure 7-2: Location of the MT Survey Lines on the Geology and Pit Locations (Left) and on the Residual Gravity (Right)      48  
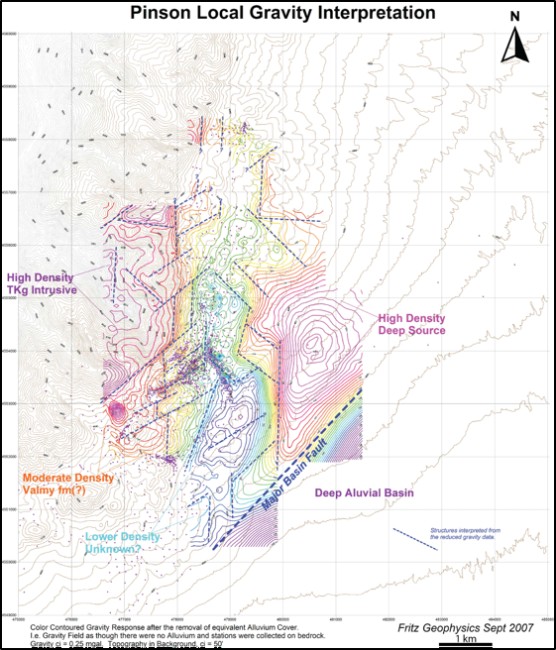
Figure 7-3: Pinson Local Gravity Interpretation      50  
Figure 7-4: MT Resistivity Depth Inversion for Line 6090      51  
Figure 7-5: MT Resistivity Depth Inversion for Line 12300      52  
Figure 7-6: MT Resistivity Depth Inversion for Line 13860      53  
Figure 7-7: MT Resistivity Depth Inversion for Line 15300      54  
Figure 7-8: MT Resistivity Depth Inversion for Line 17160      55  
Figure 7-9: MT Resistivity Depth Inversion for Line 19230      56  
Figure 7-10: Granite Creek Project Drill Plan by Operator      58  


September 2026


SRK Consulting (U.S.), Inc.

SEC Technical Report Summary – Granite Creek

   Page xiv


Figure 7-11: Plan View Section Lines of Granite Creek Mine Project      62  
Figure 7-12: Drilling by Hole Type Completed by PMC      64  
Figure 7-13: Drilling by Type Completed by PMC with Barrick as Operator      65  
Figure 7-14: Drilling Completed by Atna      66  
Figure 7-15: Drilling Completed by i-80      67  
Figure 7-16: Vertical Section A-A’ of the Mag Pit Area      69  
Figure 7-17: Vertical Section B-B1 of the Pit CX and C Area      70  
Figure 7-18: Vertical Section C-C1 of the Pit A Area      71  
Figure 7-19: Vertical Section D-D1 of the Pit B Area      72  
Figure 7-20: Vertical Section E-E1 of the Underground Resource Area      73  
Figure 7-21: Plan View Showing Section Locations through the Underground Resource Area      74  
Figure 7-22: Section A-A’ Showing Drilling in the CX Zone, 30.5 m (100 ft) thick, looking North      75  
Figure 7-23: Section B-B’ Showing Drilling in the Otto and Ogee Zones, looking North      76  
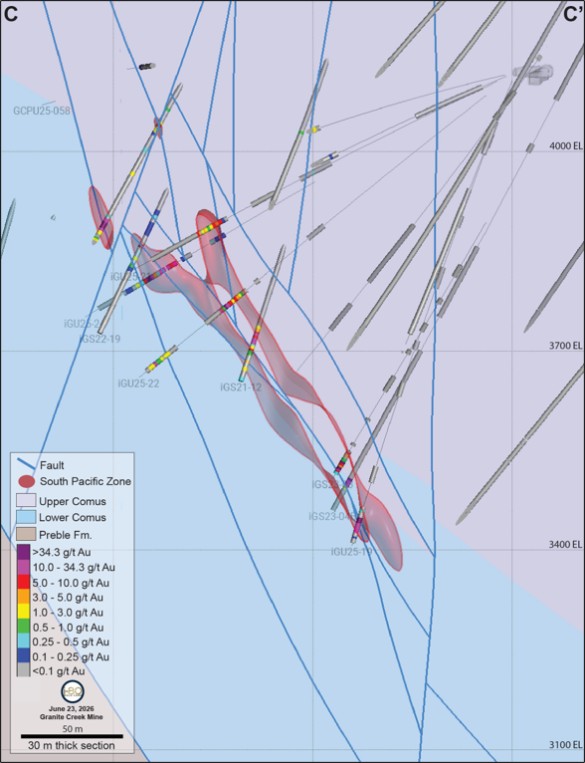
Figure 7-24: Section C-C Showing Drilling in the SPZ, 130 m (100 ft) thick, looking North      77  
Figure 7-25: Well Locations      79  
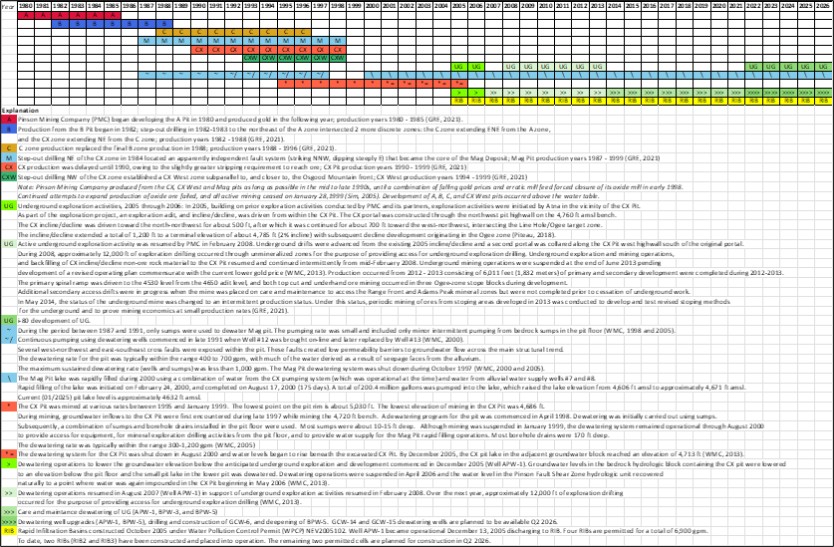
Figure 7-26: Timeline for Hydrogeologic Characterization with Relationship to Mining      80  
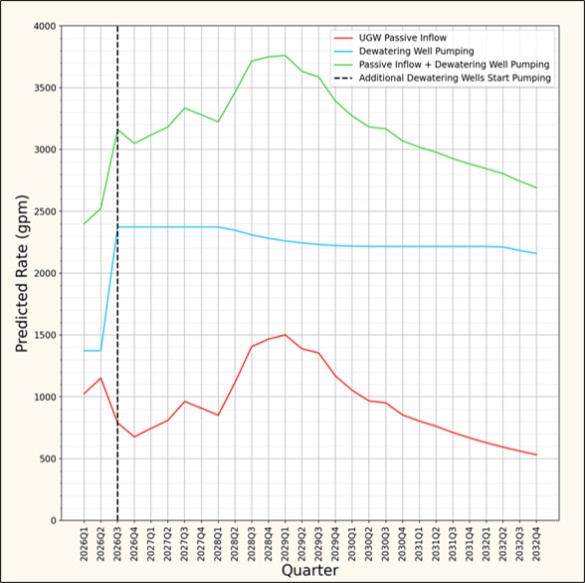
Figure 7-27: Predicted Passive Inflow and Dewatering Well Pumping      82  
Figure 7-28: Predicted Groundwater Elevation in the Vicinity of Ore Bodies: Otto, Ogee, and South Pacific      83  
Figure 7-29: Predictive and Passive Inflows from Scenarios One and Two      84  
Figure 8-1: Historical Rocklabs CRM Control Chart (OxD57, Representative)      89  
Figure 8-2: Historical Blank Control Chart, 2005 to 2018      89  
Figure 8-3: Historical Combined Duplicate Scatter, 2005 to 2018      90  
Figure 8-4: CDN-GS-7J Control Chart, i-80 Era      92  
Figure 8-5: CDN-GS-30C Control Chart, i-80 Era      92  
Figure 8-6: CDN-GS-P6E Control Chart, i-80 Era      93  
Figure 8-7: OREAS-277 Control Chart, i-80 Era      93  
Figure 8-8: OREAS-279 Control Chart, i-80 Era      94  
Figure 8-9: OREAS-282 Control Chart, i-80 Era      94  
Figure 8-10: i-80 Era Blank Control Chart, 2021 to Q1 2026      95  
Figure 8-11: Field (Quarter-core) Duplicate Scatter, i-80 Era      97  
Figure 8-12: Preparation (Coarse Reject) Duplicate Scatter, i-80 Era      98  
Figure 8-13: Lab (Pulp / Analytical) Duplicate Scatter, i-80 Era      99  
Figure 8-14: Check Sample Report Primary vs. Check Assay Scatter, Au, 2023 to 2026      102  

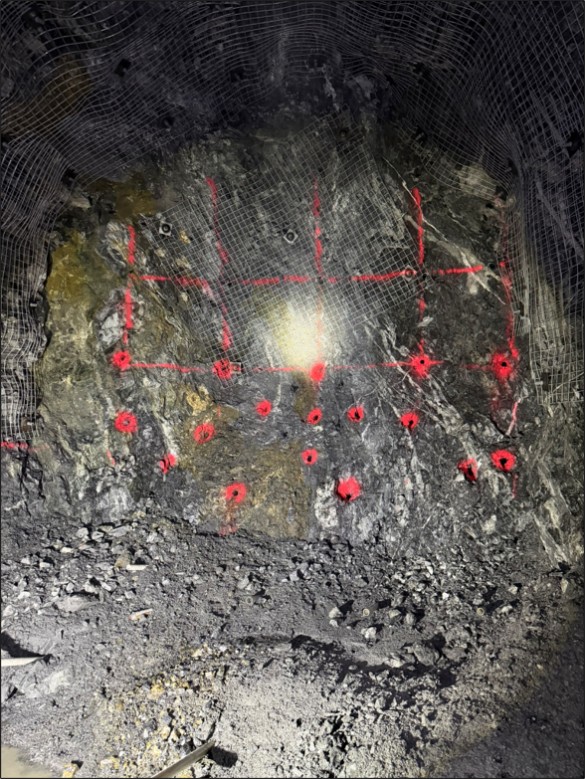
Figure 9-1: Underground Working Heading at Granite Creek Showing Mineralized Structure with Sample Outline and Drill Pattern Marks Observed During the QP Site Visit

     106  
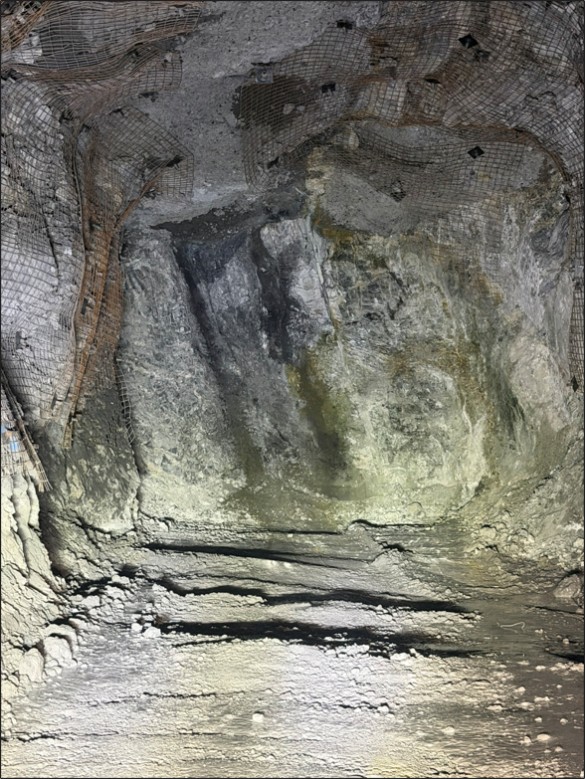
Figure 9-2: Underground Working Heading at Granite Creek Showing Exposed Mineralized Face Observed During the QP Site Visit      107  

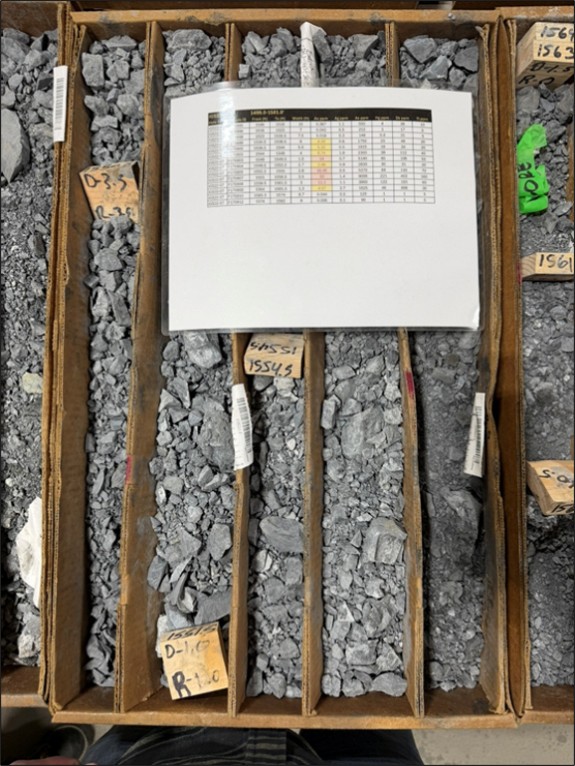
Figure 9-3: Drill Core from Hole iGS22-07 (1,499 to 1,482 m (581 ft)) with Printed Assay Sheet Used by the QP to Cross-Check Mineralization Against Database-Recorded Au and Ag Grades

     109  


September 2026


SRK Consulting (U.S.), Inc.

SEC Technical Report Summary – Granite Creek

   Page xv


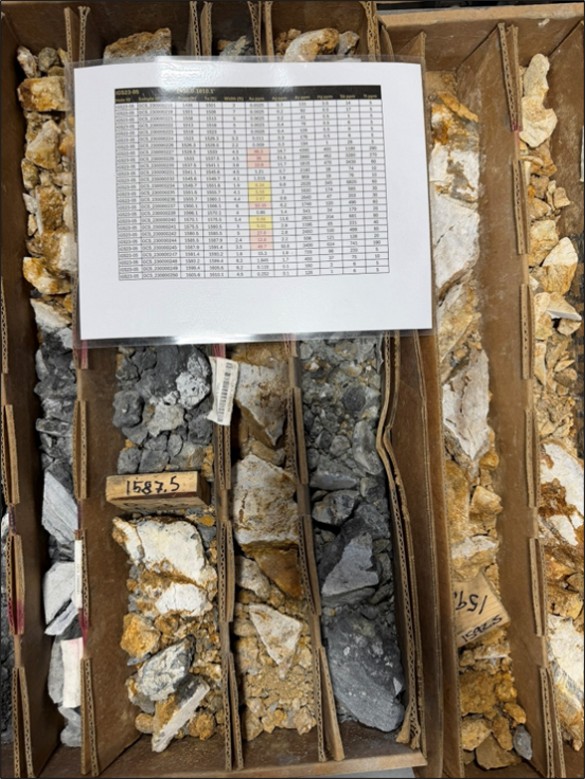
Figure 9-4: Drill Core from Hole iGS23-05 (1,498 to 1,491 m (610 ft)) with Printed Assay Sheet Used by QP to Cross-Check Mineralization Against Database Au and Ag Grades

     110  
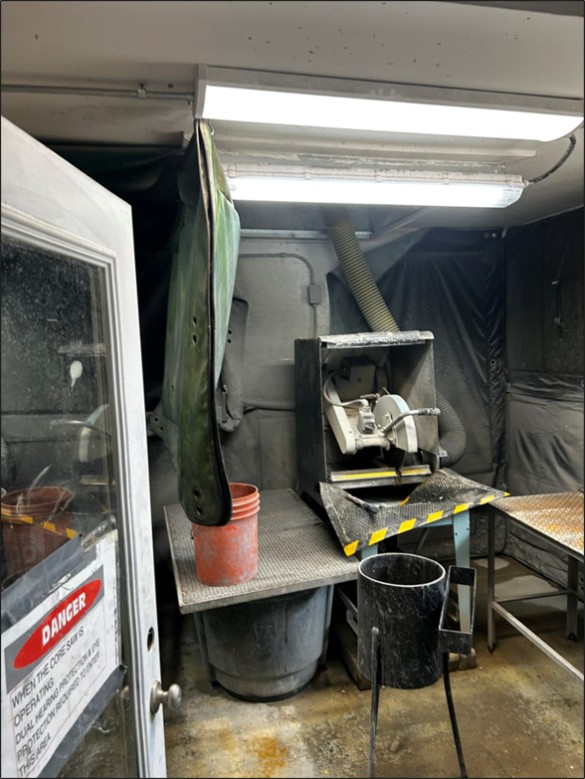
Figure 9-5: Diamond Core Saw Station at the Lone Tree Laboratory Facility      113  
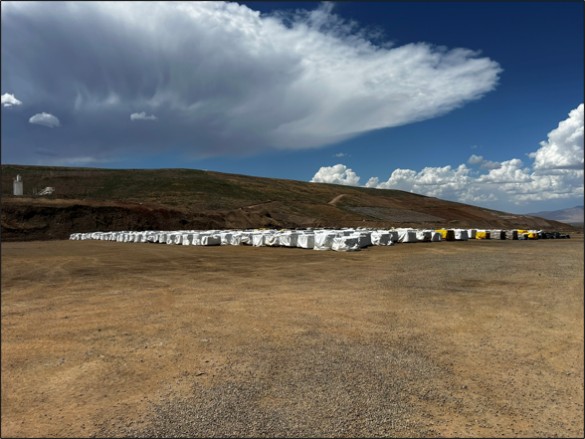
Figure 9-6: Palleted and Tarped Coarse Reject and Core Storage Yard at the Lone Tree Facility      114  
Figure 9-7: Pulp Sample Storage at the Lone Tree Facility      115  
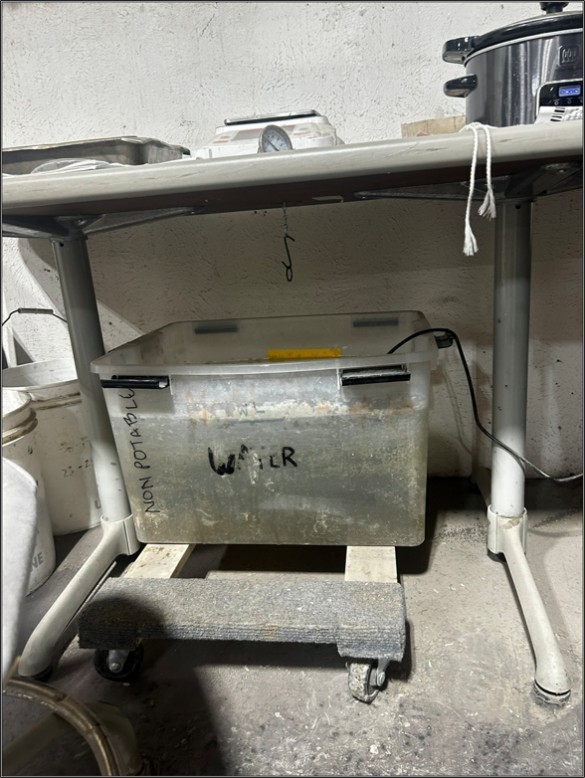
Figure 9-8: Specific Gravity (Water Immersion) Measurement Station at the Lone Tree Laboratory Facility      117  
Figure 10-1: Granite Creek POX Pilot Plant Sulfide Oxidation Profile      125  
Figure 10-2: Continuous Pressure Oxidation Program Flow Sheet      127  
Figure 10-3: Continuous Pressure Oxidation Autoclave at FLSmidth      129  
Figure 10-4: Continuous Pressure Oxidation Slurry Temperature Profile      130  
Figure 10-5: Continuous Pressure Oxidation Vessel Pressure Profile      130  
Figure 10-6: Continuous Pressure Oxidation Vent Oxygen Purity      131  
Figure 10-7: Continuous Pressure Oxidation Calculated Feed Flow Rate      131  
Figure 10-8: Continuous Pressure Oxidation Sulfide Oxidation Profile      132  
Figure 10-9: CNWAD Concentration in Cyanide Detoxification      133  
Figure 10-10: SGS Metallurgical Program Head Assays      139  
Figure 10-11: Bulk Modal (QEMSCAN) Results      141  
Figure 10-12: Pyrite/Marcasite Liberation by Mass      142  
Figure 10-13: Arsenopyrite Liberation by Mass      142  
Figure 10-14: Silicate Liberation by Mass      143  
Figure 10-15: Carbonate Liberation by Mass      144  
Figure 10-16: Locations of Metallurgical Samples (Section View)      145  
Figure 10-17: Locations of Metallurgical Samples (Plan View)      146  
Figure 10-18: Distribution of Gold Grade in Metallurgical Samples      147  
Figure 10-19: Distribution of Organic Carbon in Metallurgical Samples      147  
Figure 10-20: Distribution of Carbonate in Metallurgical Samples      148  
Figure 10-21: Distribution of Sulfide Sulfur in Metallurgical Samples      148  
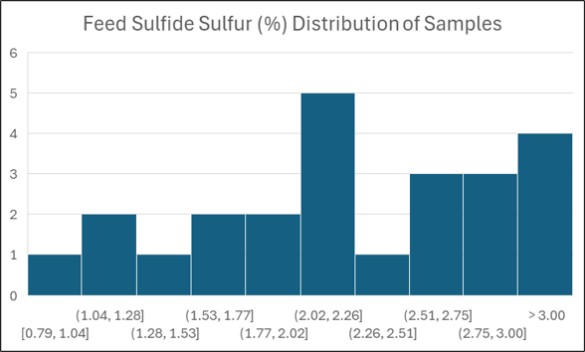
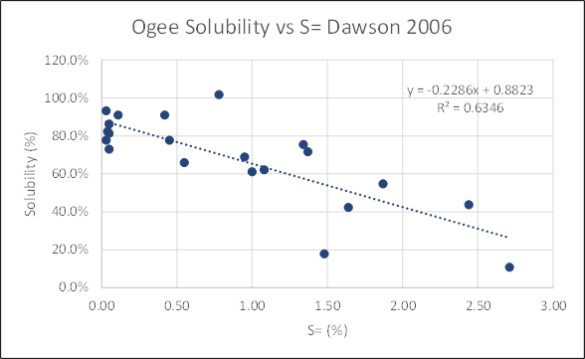
Figure 10-22: Gold Cyanide Solubility and Sulfide Influence – Ogee Samples      151  
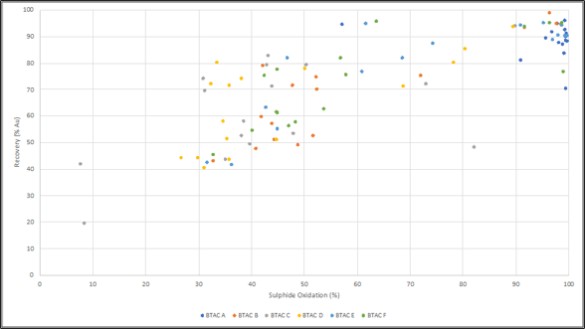
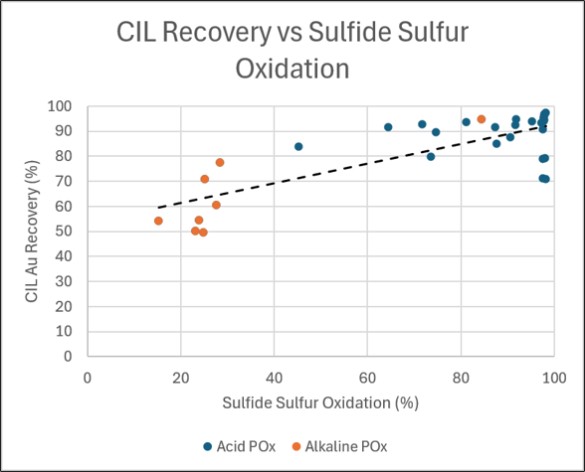
Figure 10-23: CIL Gold Recovery as a Function of Sulfide Sulfur Oxidation – Underground Samples      154  
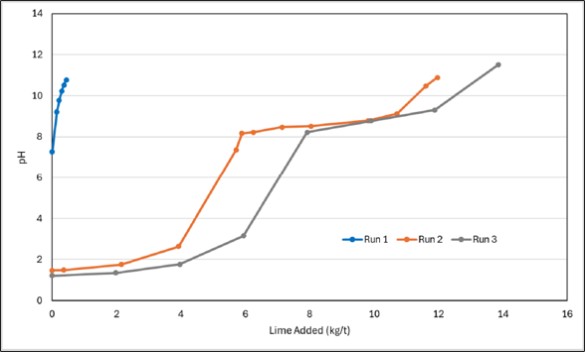
Figure 10-24: Neutralization Lime Usage in Continuous Pressure Oxidation Discharge      159  
Figure 10-25: South Pacific Gold Recovery as a Function of Sulfide Oxidation (SGS 2026)      164  
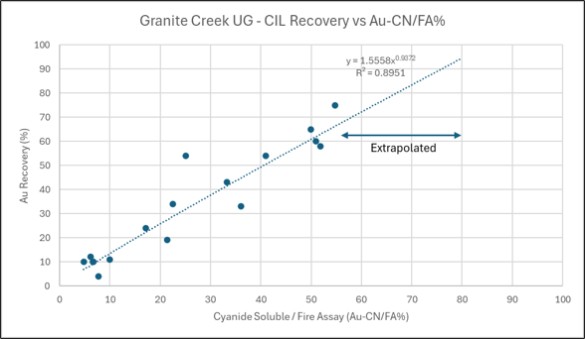
Figure 10-26: CIL Recovery vs Cyanide Soluble Gold Percent      166  
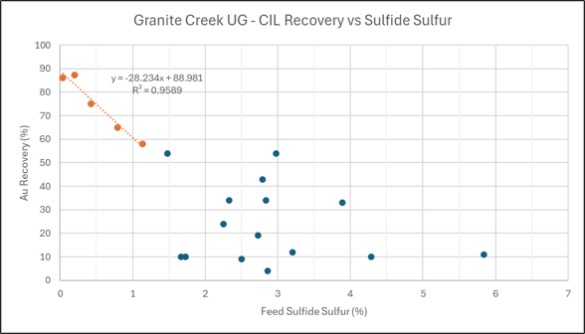
Figure 10-27: CIL Recovery vs Feed Sulfide Sulfur Content      166  
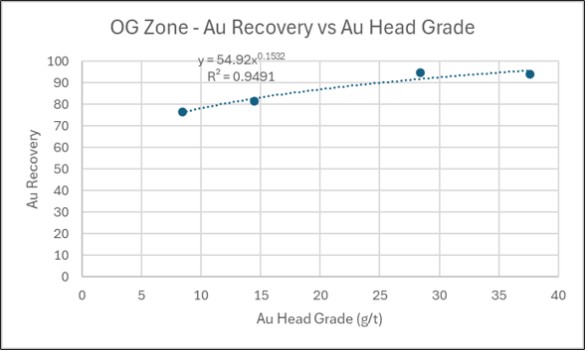
Figure 10-28: OG Zone Gold Recovery vs Gold Head Grade      167  
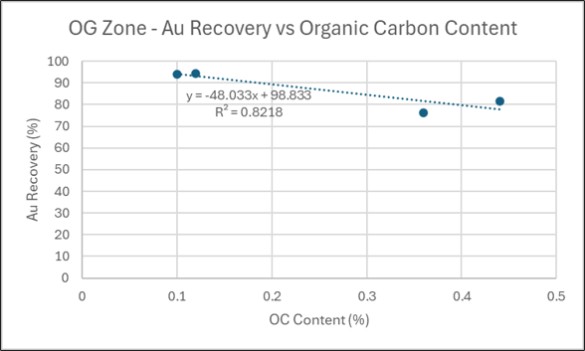
Figure 10-29: OG Zone Gold Recovery vs Organic Carbon Content      168  
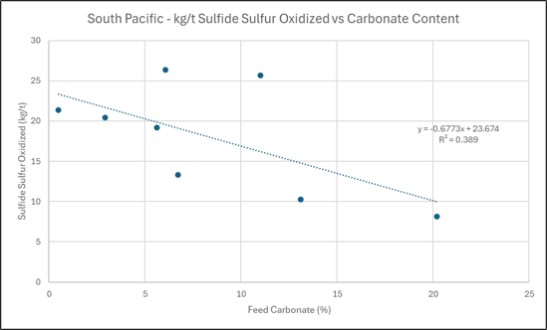
Figure 10-30: Sulfide Oxidation vs Carbonate Content, 45-Minute Retention Time, Acidic Conditions      169  
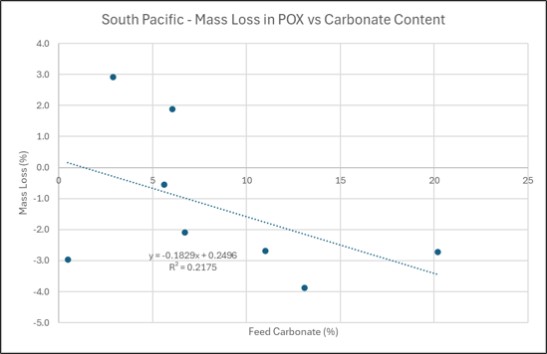
Figure 10-31: Mass Loss versus Carbonate Content, 45-Minute Retention Time, Acidic Conditions      169  
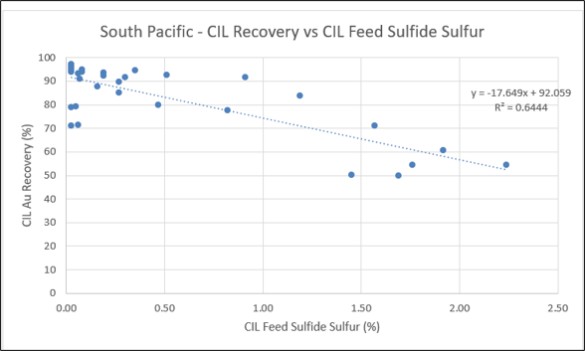
Figure 10-32: CIL Gold Recovery vs CIL Feed Sulfide Sulfur, All Conditions      170  


September 2026


SRK Consulting (U.S.), Inc.

SEC Technical Report Summary – Granite Creek

   Page xvi


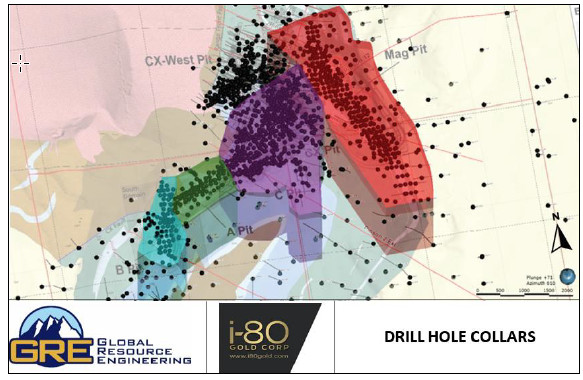
Figure 11-1: Drillhole Used Plan View on Topography      173  
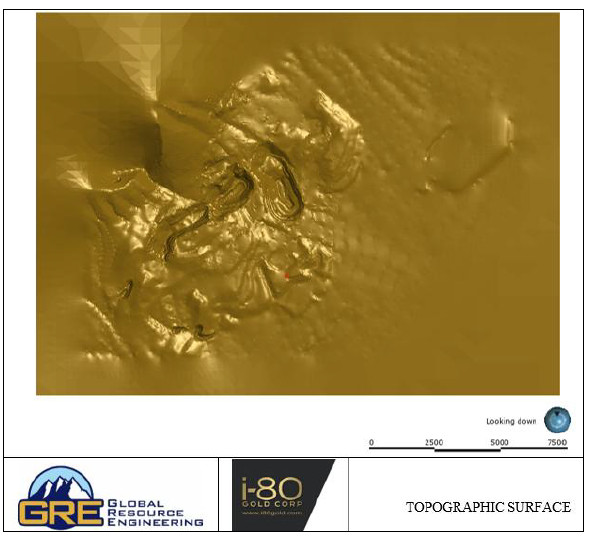
Figure 11-2: Current Topography Used for Open Pit Resource Estimation      175  
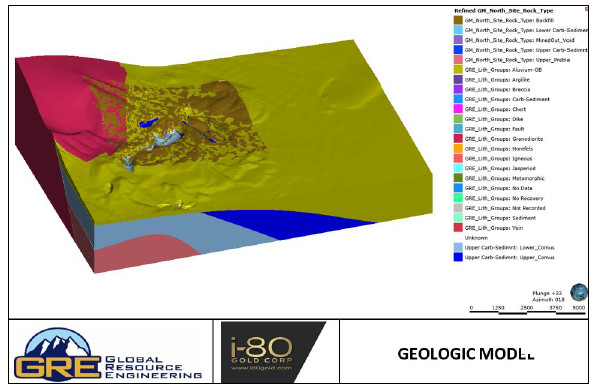
Figure 11-3: Open Pit Geologic Model, Oblique View      176  
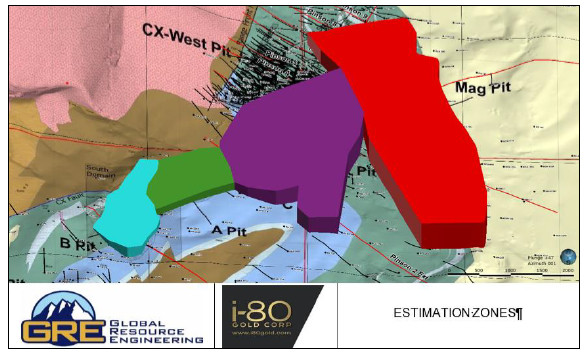
Figure 11-4: Open Pit Estimation Zones      177  
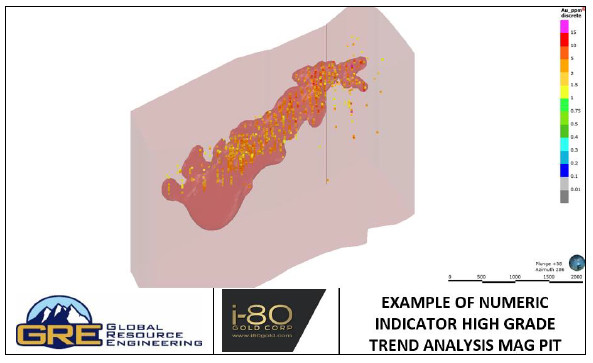
Figure 11-5: Example of Numeric Indicator High-Grade Trend Analysis, Mag Pit      178  
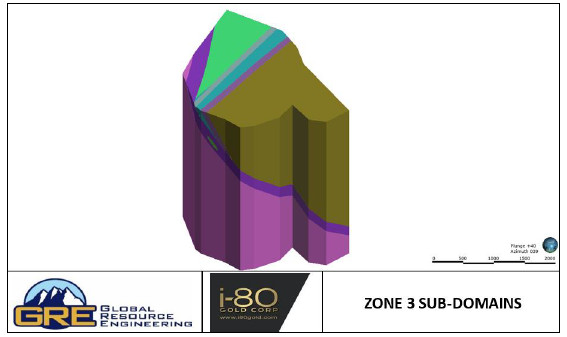
Figure 11-6: Open Pit Zone 3 Sub-Domains      179  
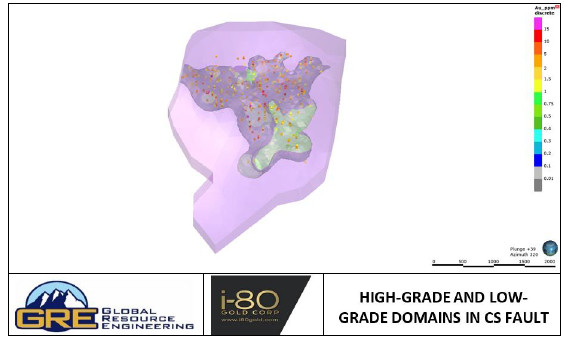
Figure 11-7: High-Grade and Low-Grade Open Pit Domains in the CX Fault      180  
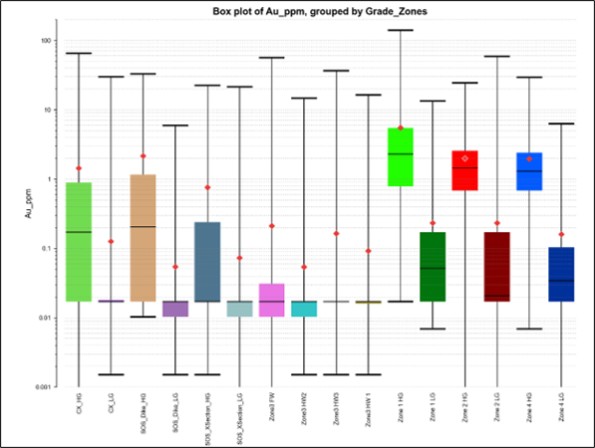
Figure 11-8: Box and Whisker Plot of Open Pit Estimation Domains      181  
Figure 11-9: Histograms of the High-Grade and Low-Grade Distributions in Zones 1 and 2      182  
Figure 11-10: Histograms of the High-Grade and Low-Grade Distributions in Zones 3 and 4      183  
Figure 11-11: Open Pit Sample Interval Length Statistics of Au ppm Assays      184  
Figure 11-12: Open Pit Compositing Comparison, 6 m (20 ft) Intervals      185  
Figure 11-13: Example of Open Pit Cumulative Log Probability Plot, Zone 1 HG      186  
Figure 11-14: Open Pit Numeric Indicator Models      189  
Figure 11-15: Open Pit Zone 1 Visual Comparison Composite to Block Model Grade, Plan View      191  
Figure 11-16: Open Pit Zone 2 Visual Comparison Composite to Block Model Grade, Plan View      192  
Figure 11-17: Open Pit Zone 3 Visual Comparison Composite to Block Model Grade Plan View      192  
Figure 11-18: Open Pit Zone 4 Visual Comparison Composite to Block Model Grade Plan View      193  
Figure 11-19: Open Pit Zone 1 Section Composites and Block Model Cross Sections      193  
Figure 11-20: Open Pit Zone 2 Section Composites and Block Model Cross Section      194  
Figure 11-21: Open Pit Zone 3 Section Composites and Block Model Cross Section      194  
Figure 11-22: Open Pit Zone 4 Section Composites and Block Model Cross Section      195  
Figure 11-23: Cumulative Frequency of Composite and Estimated Block Grades      196  
Figure 11-24: X Axis, Zone 1 High-Grade Domain      197  
Figure 11-25: Open Pit Swath Plot, Y Axis, Zone 1 High-Grade Domain X axis, Zone 1 High-Grade Domain      198  
Figure 11-26: Open Pit Swath Plot Z Axis, Zone 1 High-Grade Domain      199  
Figure 11-27: Open Pit Constrained Resource Class All Areas Plan View      200  
Figure 11-28: Plan Showing Collar Locations and Borehole Traces within the MRE-Focused Dataset      208  
Figure 11-29: Isometric View Showing Open Pit Depletion (Surface) and Underground Workings (Grey)      209  
Figure 11-30: Plan Showing Main Defined Mineralization Domain Boundary Areas at the Granite Creek Underground Operation      212  
Figure 11-31: Plan Showing Main Defined Mineralization Areas at the Granite Creek Underground Operation      213  
Figure 11-32: Long Section (Looking Northwest) Showing Main Defined Mineralization Areas at the Granite Creek Underground Operation      214  
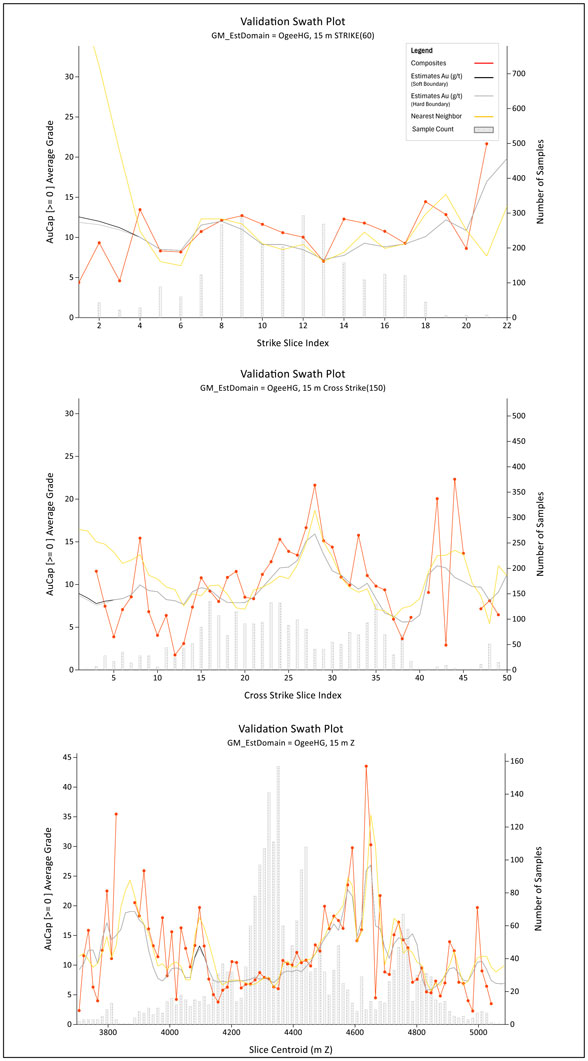
Figure 11-33: Example of EDA Analysis in X-10 to Identify Potential Changes in Grade Populations within the Ogee Domain      215  


September 2026


SRK Consulting (U.S.), Inc.

SEC Technical Report Summary – Granite Creek

   Page xvii


Figure 11-34: Example of Log-Probability Plots Showing Polynomial Model Fitting (Pink) and Potential Trend Breaks (Yellow)      216  
Figure 11-35: Example of Sensitivity Analysis on ISO Values Completed by SRK for the Ogee Domain      218  
Figure 11-36: Level Plan 4230 Showing Selected Ogee and Otto Domain Boundaries vs. Sampling (Including Grade Control Muck Sampling)      219  
Figure 11-37: SRK Domain Model Used for Grade Estimation      222  
Figure 11-38: Box-Whisker Plot Showing Gold Grade Distributions within the SRK Domained Models, showing mean grades.      223  
Figure 11-39: Log Probability Plot Showing Sampling Length in Diamond and RC Sampling at Granite Creek      224  
Figure 11-40: Summary of Sampling Lengths Inside the High-Grade Domains within Diamond and RC Drillholes      225  
Figure 11-41: Examples of X-10 Capping Analysis Showing Capped Values in Yellow      227  
Figure 11-42: Capping Analysis Showing Breaks in Data Population (Ogee HG Domain)      228  
Figure 11-43: Capping Analysis Showing Breaks in Data Population (Otto HG Domain)      228  
Figure 11-44: Capping Analysis Showing Breaks in Data Population (Ogee SPZ Domain)      229  
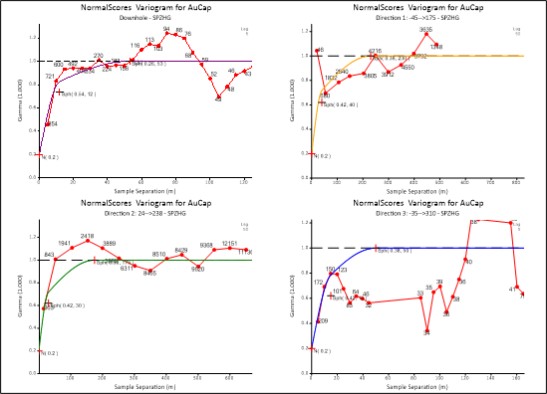
Figure 11-45: Modeled Normal Score Downhole Variograms and Directional Correlograms for OgeeHG (Gold)      232  
Figure 11-46: Modeled Normal Score Downhole and Directional Variograms for OttoHG (Gold)      232  
Figure 11-47: Modeled Normal Score Downhole and Directional Variograms for SPZHG (Gold)      233  
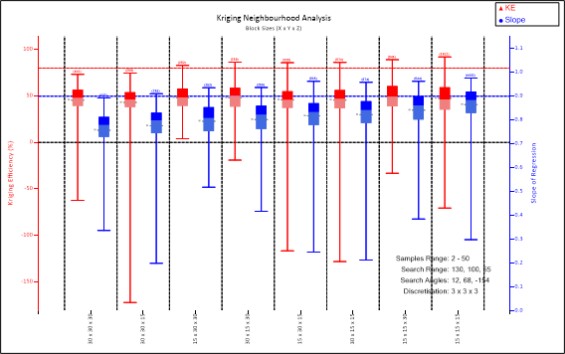
Figure 11-48: Block Size Analysis, Ogee HG Domain      236  
Figure 11-49: KNA Analysis on Number of Samples vs. Slope of Regression (Top) and Impact of Negative Weights (Bottom) — Ogee HG Domain      237  
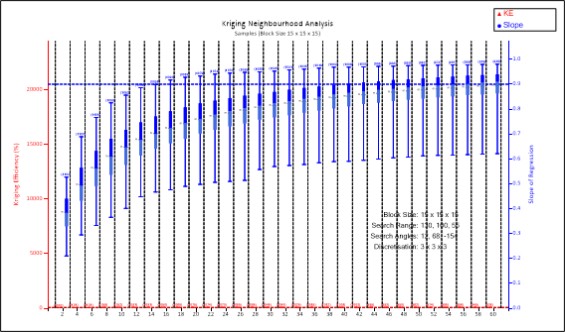
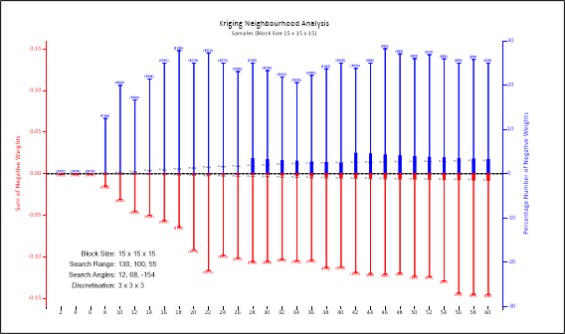
Figure 11-50: KNA Analysis on Number of Samples vs. Slope of Regression (Top) and Impact of Negative Weights (Bottom) — SPZ HG Domain      238  
Figure 11-51: Plan Section Showing Block Grades vs. Composites (Ogee)      252  
Figure 11-52: Cross Section Showing Block Grades vs. Composites (Ogee)      253  
Figure 11-53: Level Plan (Map) Showing Block Grades vs. Composites (Otto)      254  
Figure 11-54: Cross Section Showing Block Grades vs. Composites (Otto)      255  
Figure 11-55: Plan Showing Block Grades vs. Composites (SPZ)      256  
Figure 11-56: Cross Section Showing Block Grades vs. Composites (SPZ)      257  
Figure 11-57: Swath Plot Analysis of Au (g/t), Ogee HG Domain      261  
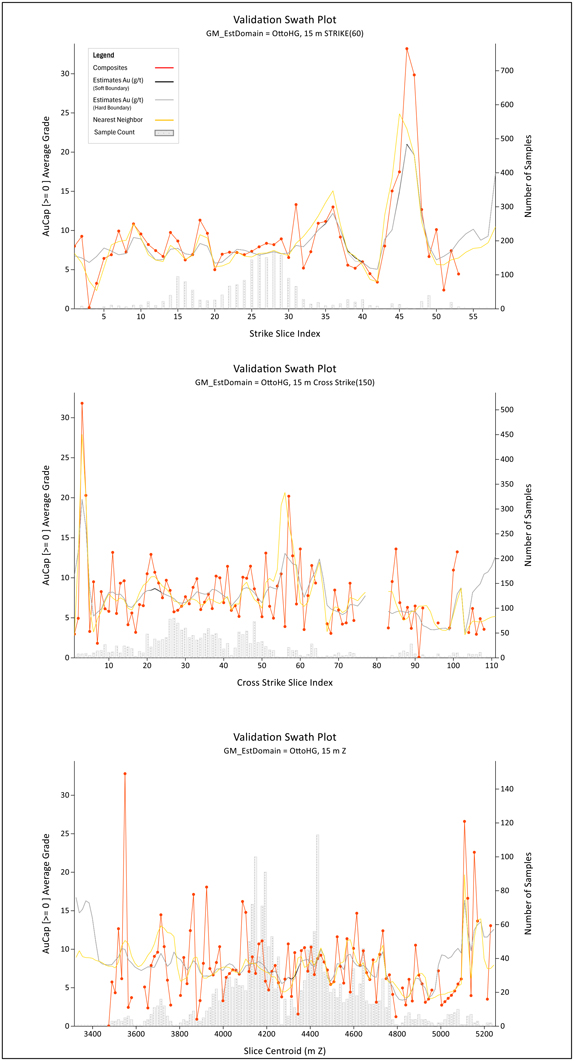
Figure 11-58: Swath Plot Analysis of Au (g/t), Otto HG Domain      262  
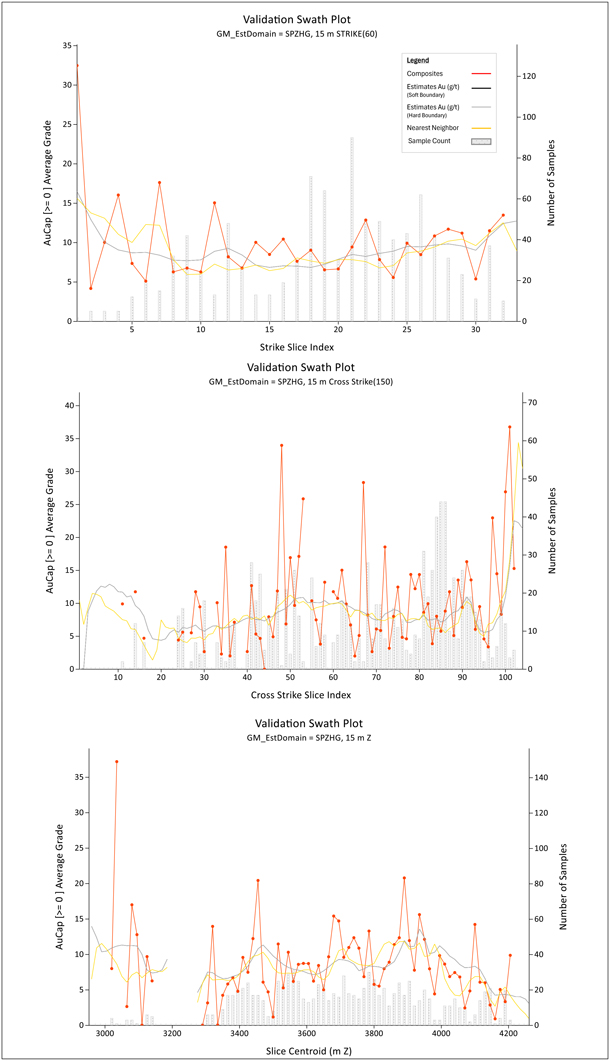
Figure 11-59: Swath Plot Analysis of Au (g/t), SPZ HG Domain      263  
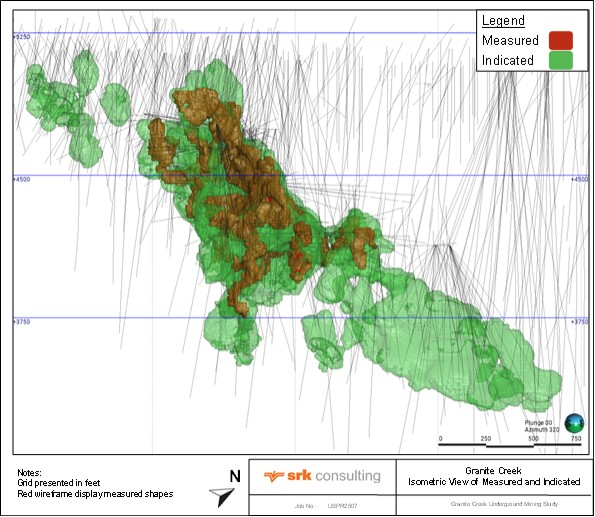
Figure 11-60: Long Section Showing Final Measured (red/brown) and Indicated Shapes (green) Selected for Granite Creek      265  
Figure 11-61: Cross Section Showing Final Measured and Indicated Shapes Selected for Granite Creek (Ogee and Otto Domains)      266  
Figure 11-62: Cross Section Showing Final Measured and Indicated Shapes Selected for Granite Creek (SPZ Domains)      267  
Figure 11-63: Final Classification Shown Against Filtered Mineral Resource Blocks      268  
Figure 12-1: General Locations of the Granite Creek Deposit      282  
Figure 13-1: Contact Water Measurements      294  


September 2026


SRK Consulting (U.S.), Inc.

SEC Technical Report Summary – Granite Creek

   Page xviii


Figure 13-2: Future Mine Airflow Configuration      296  
Figure 13-3: Surface Fan Installation General Arrangement      299  
Figure 13-4: Production Design with MSO Guidance      301  
Figure 13-5: Schematic of Cut Mining Sequence      302  
Figure 13-6: Production Mining Sequence      303  
Figure 13-7: Underground Infrastructure Location      304  
Figure 13-8: Granite Creek Mine Design Looking Northwest      305  
Figure 13-9: Granite Creek Annual Production Schedule      307  
Figure 13-10: Final Mine Outline Map      312  
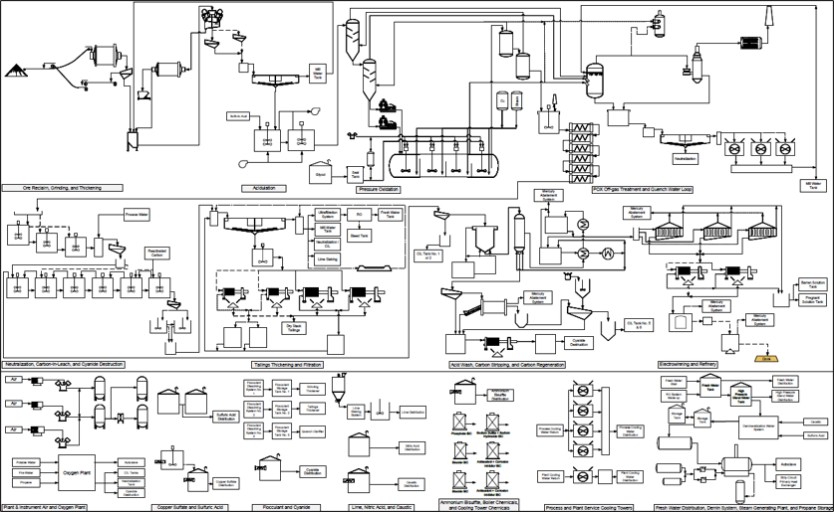
Figure 14-1: Overall Process Flow Diagram for the Lone Tree Facility      315  
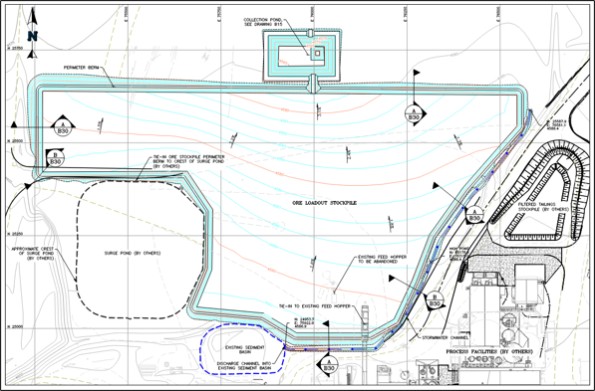
Figure 14-2: Ore Stockpile Area Layout Diagram      317  
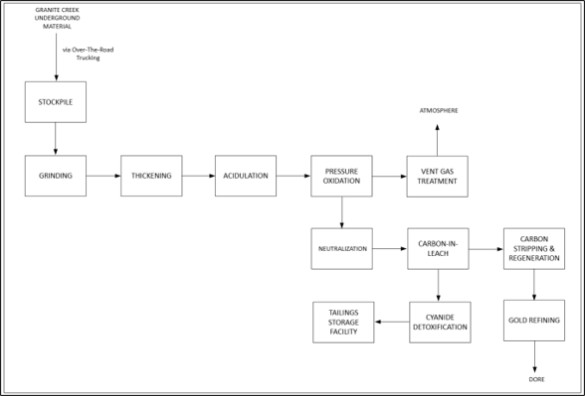
Figure 14-3: Third-Party Pressure Oxidation Facility Flow Diagram      327  
Figure 15-1: Granite Creek Overview      330  
Figure 15-2: Granite Creek Administration Area      331  
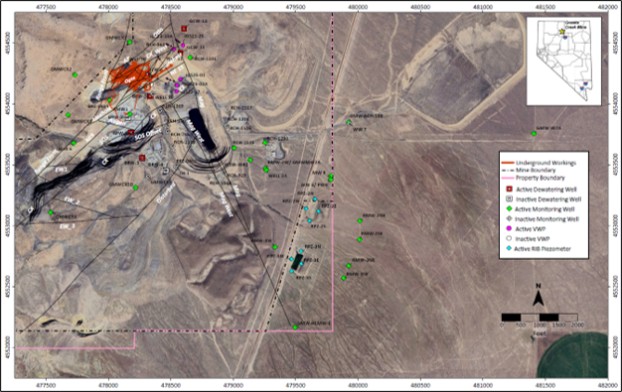
Figure 15-3: Map of Dewatering Wells, Monitoring Wells, Piezometers at Granite Creek      335  
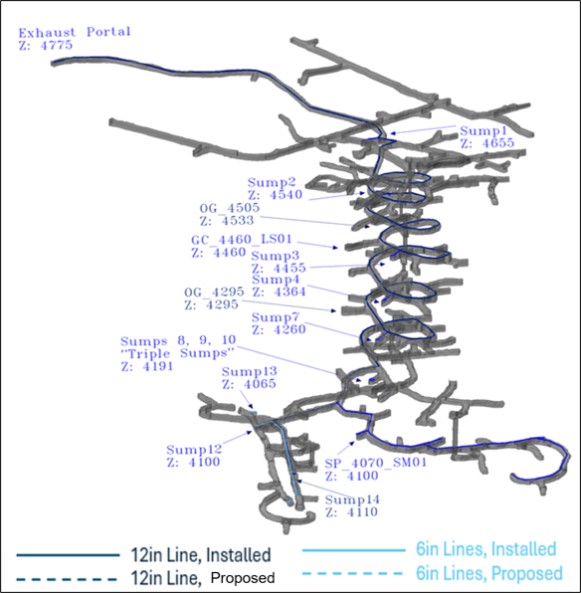
Figure 15-4: Granite Creek Weekly Average Passive Infiltration      338  
Figure 15-5: Underground Contact Water Collection and Discharge System      339  
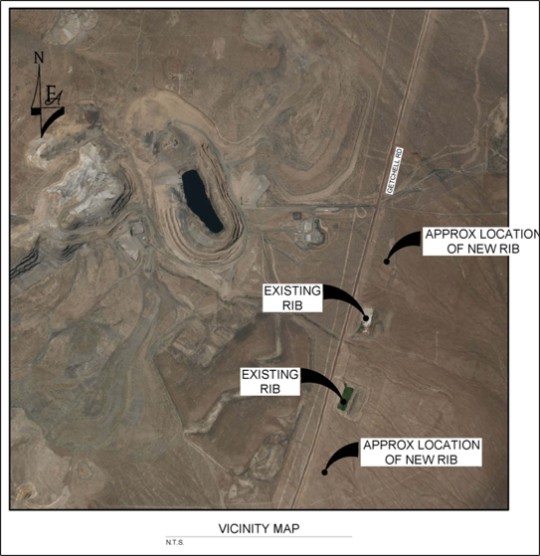
Figure 15-6: Map of Current and Planned RIBs at Granite Creek      340  
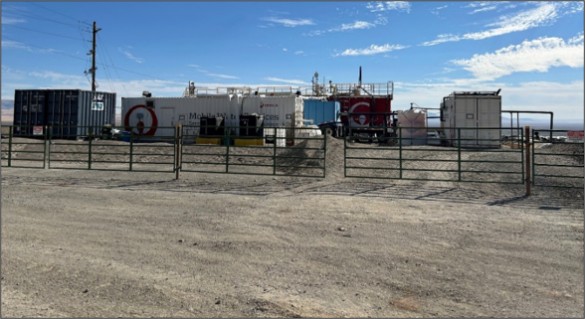
Figure 15-7: Existing Water Treatment Plant (800 gpm capacity)      341  
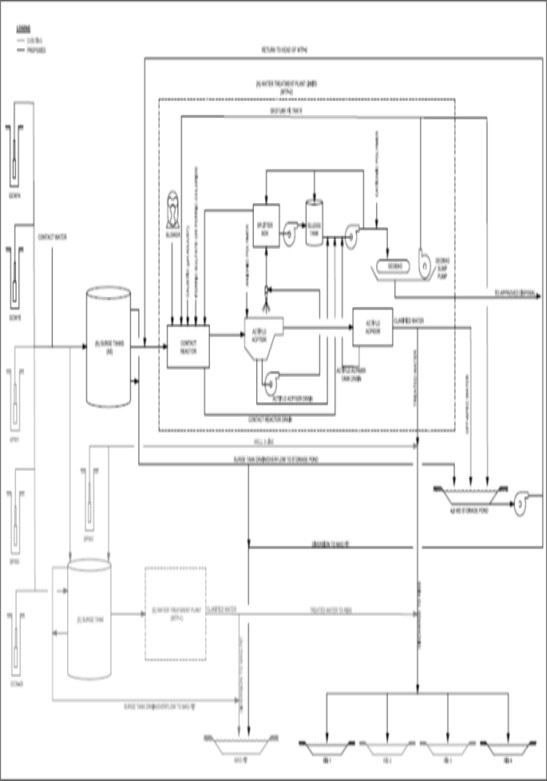
Figure 15-8: WTP-2 Process Flow      342  
Figure 15-9: Granite Creek Electrical Distribution and Dewatering System      344  
Figure 15-10: Granite Creek Portal Facilities      345  
Figure 15-11: Screen Plant Area General Arrangement (OMC 2026)      347  
Figure 15-12: C (Blue) and CX (Green) Pit WRD Plan      349  
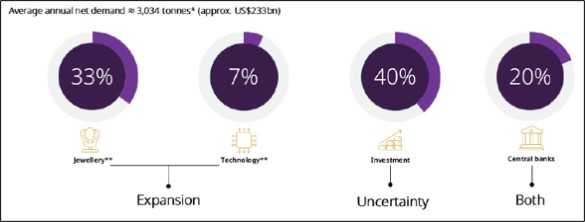
Figure 16-1: Average Annual Demand for Gold – by Sector      352  
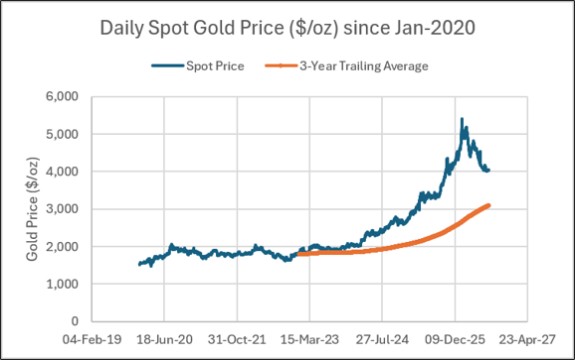
Figure 16-2: Daily Spot Gold Price      352  
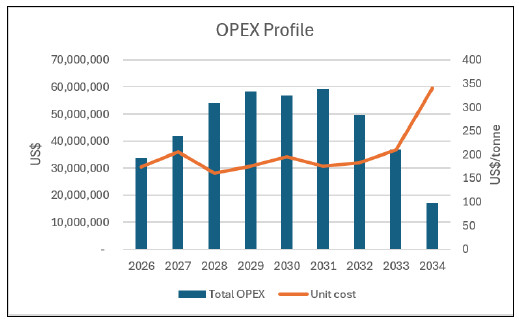
Figure 18-1: Yearly Mine Operating Cost Profile      369  
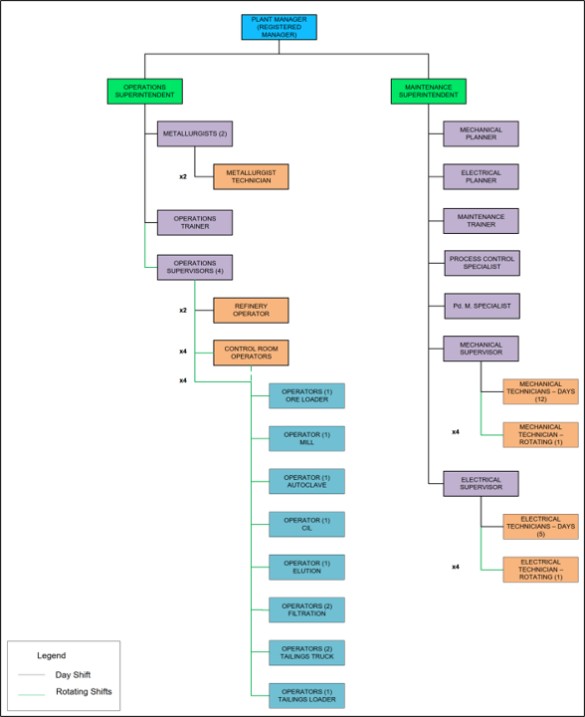
Figure 18-2: Organizational Chart for Lone Tree Pressure Oxidation-CIL      376  
Figure 19-1: Granite Creek Mining Profile (imperial)      382  
Figure 19-2: Granite Creek Mining Profile (metric)      382  
Figure 19-3: Granite Creek Processing Profile      384  
Figure 19-4: LoM Operating Cost Summary      385  
Figure 19-5: LoM Operating Cost Contributions      385  
Figure 19-6: Granite Creek Sustaining Capital Profile      388  
Figure 19-7: Annual Cash Flow Summary      392  
Figure 19-8: Sensitivity Analysis      392  
Figure 20-1: Summary of Gold Production at Turquoise Ridge (as reported by Barrick 2024)      393  


September 2026


SRK Consulting (U.S.), Inc.

SEC Technical Report Summary – Granite Creek

   Page xix


Figure 20-2: Barrick Mineral Resource Statement for Turquoise Ridge (effective date December 31, 2023) – reported on 100% basis      394  
Figure 20-3: Barrick Mineral Reserve Statement for Turquoise Ridge (effective date December 31, 2023) – reported on 100% basis      394  


September 2026


SRK Consulting (U.S.), Inc.

SEC Technical Report Summary – Granite Creek

   Page xx


List of Abbreviations

The metric system has been used throughout this report. Tonnes are metric of 1,000 kg, or 2,204.6 lb. All currency is in U.S. dollars (US$) unless otherwise stated.


Abbreviation


Unit or Term

A    ampere
AA    atomic absorption
A/m2    amperes per square meter
ANFO    ammonium nitrate fuel oil
Ag    silver
Au    gold
AuEq    gold equivalent grade
°C    degrees Centigrade
CCD    counter-current decantation
CIL    carbon-in-leach
CoG    cut-off grade
cm    centimeter
cm2    square centimeter
cm3    cubic centimeter
cfm    cubic feet per minute
ConfC    confidence code
CRec    core recovery
CSS    closed-side setting
CTW    calculated true width
°    degree (degrees)
dia.    diameter
EIS    Environmental Impact Statement
EMP    Environmental Management Plan
FA    fire assay
ft    foot (feet)
ft2    square foot (feet)
ft3    cubic foot (feet)
g    gram
gal    gallon
g/L    gram per liter
g-mol    gram-mole
gpm    gallons per minute
g/t    grams per tonne
ha    hectares
HDPE    Height Density Polyethylene
hp    horsepower
HTW    horizontal true width
ICP    induced couple plasma
ID2    inverse-distance squared
ID3    inverse-distance cubed
IFC    International Finance Corporation
ILS    Intermediate Leach Solution
kA    kiloamperes
kg    kilograms
km    kilometer
km2    square kilometer
koz    thousand troy ounce
kt    thousand tonnes
kt/d    thousand tonnes per day
kt/y    thousand tonnes per year
kV    kilovolt
kW    kilowatt
kWh    kilowatt-hour


September 2026


SRK Consulting (U.S.), Inc.

SEC Technical Report Summary – Granite Creek

   Page xxi


Abbreviation


Unit or Term

kWh/t    kilowatt-hour per metric tonne
L    liter
L/sec    liters per second
L/sec/m    liters per second per meter
lb    pound
LHD    Long-Haul Dump truck
LLDDP    Linear Low Density Polyethylene Plastic
LOI    Loss On Ignition
LoM    Life-of-Mine
m    meter
m2    square meter
m3    cubic meter
masl    meters above sea level
MARN    Ministry of the Environment and Natural Resources
MDA    Mine Development Associates
mg/L    milligrams/liter
mm    millimeter
mm2    square millimeter
mm3    cubic millimeter
MME    Mine & Mill Engineering
Moz    million troy ounces
Mt    million tonnes
MTW    measured true width
MW    million watts
m.y.    million years
NGO    non-governmental organization
NI 43-101    Canadian National Instrument 43-101
OSC    Ontario Securities Commission
oz    troy ounce
%    percent
PLC    Programmable Logic Controller
PLS    Pregnant Leach Solution
PMF    probable maximum flood
ppb    parts per billion
ppm    parts per million
QA/QC    Quality Assurance/Quality Control
RC    rotary circulation drilling
RoM    Run-of-Mine
RQD    Rock Quality Description
SEC    U.S. Securities & Exchange Commission
sec    second
SG    specific gravity
SPT    standard penetration testing
st    short ton (2,000 pounds)
t    tonne (metric ton) (2,204.6 pounds)
t/h    tonnes per hour
t/d    tonnes per day
t/y    tonnes per year
TSF    tailings storage facility
TSP    total suspended particulates
µm    micron or microns
V    volts
VFD    variable frequency drive
W    watt
XRD    x-ray diffraction
y    year


September 2026


SRK Consulting (U.S.), Inc.

SEC Technical Report Summary – Granite Creek

   Page 1


1

Executive Summary

This report was prepared as a Pre-Feasibility Study-level Technical Report Summary in accordance with the Securities and Exchange Commission (SEC) S-K regulations (Title 17, Part 229, Items 601 and 1300 through 1305) for i-80 Gold Corp. (“i-80” or the “Registrant”) by SRK Consulting (U.S.), Inc. (SRK) on the Granite Creek Underground Project (the “ Project “).


1.1

Property Description (Including Mineral Rights) and Ownership

The Granite Creek Project is located in Humboldt County, Nevada, 45 kilometers (km) (28 miles (mi)) northeast of the town of Winnemucca, and it is part of the historic Potosi mining district. It is centered at roughly 41° 8’ N latitude and 117° 15.5’ W longitude. It encompasses about 4,506 acres (1,823.5 hectares (ha)) including owned unpatented claims, leased unpatented claims and owned surface fee land. i-80 Gold purchased the Granite Creek property from Waterton Global in June 2020.


1.2

Geology and Mineralization

The Property is located on the eastern flank of the Osgood Mountains within the Basin and Range tectonic province of northern Nevada. The Granite Creek Mine occurs within a northeast-trending structural corridor known as the Getchell gold trend. This trend also encompasses a number of gold deposits located outside the Property including the Preble, Getchell, Turquoise Ridge, and Twin Creeks. These deposits are hosted in Paleozoic marine sedimentary rocks. Gold mineralization at the Property is described as a Carlin-type, sedimentary-rock hosted system.

The Property geology comprises a sequence of Cambrian to Ordovician sedimentary rocks that form part of the Osgood Mountain Terrane and the Osgood Mountains. Much of the Property comprises shales, hornfels sedimentary rocks and limestone interbeds of the Preble Formation, and an overlying (or juxtaposed), alternating sequence of limestone, shale, and dolomite with tuffaceous shale and intraformational conglomerates belonging to the Comus Formation. The Preble and Comus Formations have been folded into a broad north-plunging anticline and have been intruded by a large Cretaceous granodiorite stock, resulting in irregular contact metamorphism.

Gold mineralization at the Property is strongly structurally controlled, occurring at favorable sites within a fault network occurring around the eastern edge of the Osgood granodiorite and predominantly within Comus Formation host rocks. Mineralization is commonly associated with the decarbonatization of carbonate rocks and the introduction of silica, fine grained pyrite, arsenian pyrite, and remobilized carbon. Continuity of mineralization is highly variable, ranging from 40 to 4,500 feet (ft) (12 to 1,372 meters (m)) in strike extent, 250 to 1,800 ft (76 to 550 m (1,804 ft)) in down-dip extent and 5 to 400 ft (1.5 to 122 m (400 ft)) in thickness. The underground mineralization has a variable thickness between 5 and 30 ft (1.5 and 9 m (30 ft)).

Oxidation reaches depths of up to 550 m (1,800 ft) within fault zones. Oxide mineralization includes pervasive limonite, hematite, along with other iron and arsenic oxides. Historical production from the open pits was focused on oxidized material.

Underground mineralization displays pervasive argillization and decarbonatization of host lithologies, along with the formation of dissolution collapse breccias and intense shearing. Where the alteration is strongest, the altered zones consist of punky, spongy decarbonized limestone in an argillically altered fine-grained, carbon-rich matrix (Gustavson, 2012). Silicification is minor and occurs as a broad overprint on the zone. Underground production includes both sulfide and oxide material.


September 2026


SRK Consulting (U.S.), Inc.

SEC Technical Report Summary – Granite Creek

   Page 2


1.3

Status of Exploration, Development and Operations

Exploration at Granite Creek since the 1970’s has combined geologic mapping, geochemical sampling, and geophysical surveys (gravity, magnetics, and IP/EM/MT/CSAMT), contributing to the discovery of several open pit gold deposits at the Property.

Since acquiring Granite Creek in 2021, i-80 has not conducted new surface geophysical or geochemical programs but has focused the exploration on drilling known targets with the aim to develop Mineral Resources and reserves to support mining operations. The Project is currently in operation and an underground exploration and development program targeting the South Pacific Zone (SPZ) at depth was completed during 2025, comprising approximately 174 m (570 ft) of development drifting and 16,531 m (54,236 ft) of drilling.

Since 1970, a total of 2,083 drillholes totaling 291,312 m (955,748 ft) have been completed at the Property by successive operators (Pinson Mining Company (PMC) and predecessors, Homestake, Barrick, and Atna).

Drilling completed by i-80 has expanded substantially since the Granite Creek Initial Assessment (IA) Technical Report (March 2025). The 2021 and 2022 programs, approximately 69 and 154 holes, respectively, were reviewed in whole or in part by the previous QP as part of that IA as they focused on the open pit potential for the Project.

i-80 increased the exploration drilling materially between 2023 – 2025 with approximately:


In 2023 a total of 278 holes were completed which included a deep SPZ infill program.


In 2024 approximately 185 holes were added to continue the SPZ infill campaign; and


In 2025 there was an increase in the number of holes to approximately 379 holes with the introduction of underground production drilling alongside ongoing surface drilling. Drilling continued into Q1 2026 as the tail of the SPZ infill campaign and the start of new exploration drilling targeting the Ogee, Otto, Adam Peak, and Range Front fault systems.

In total, i-80 Gold has drilled 1,083 holes within the current property boundary; 438 core holes for 93,552 m (306,929 ft) and 645 RC holes for 30,252 m (99,252 ft), for a combined total of 123,804 m (406,181 ft) combined. To date the drilling has been concentrated on the underground Ogee, Otto, and SPZ mineralization.

All holes have been drilled and logged using standard diamond core methods with downhole surveying and structural/geotechnical logging captured directly in the acQuire database. Core handling follows a documented chain of custody from the drill site through sample preparation, with sample security procedures maintained throughout. Sample preparation and analysis for the i-80 Gold program has been performed by independent, accredited commercial laboratories (ALS Minerals (ALS), and MSA Labs (MSA) from 2025), with primary gold analysis transitioning from conventional fire assay to Chrysos Photon Assay in 2025.


September 2026


SRK Consulting (U.S.), Inc.

SEC Technical Report Summary – Granite Creek

   Page 3


1.4

Mineral Resource and Mineral Reserve Estimates


1.4.1

Underground

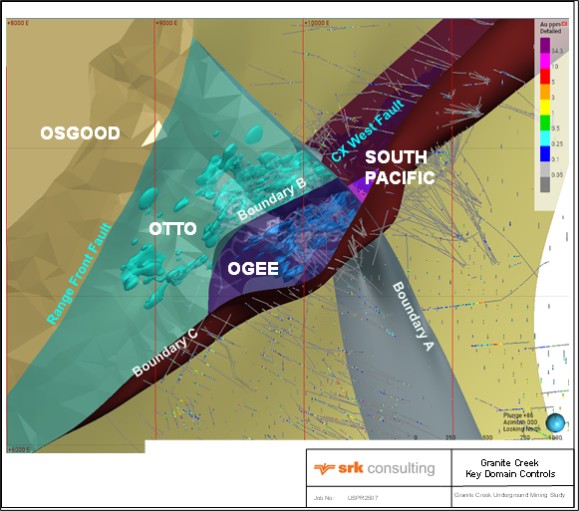
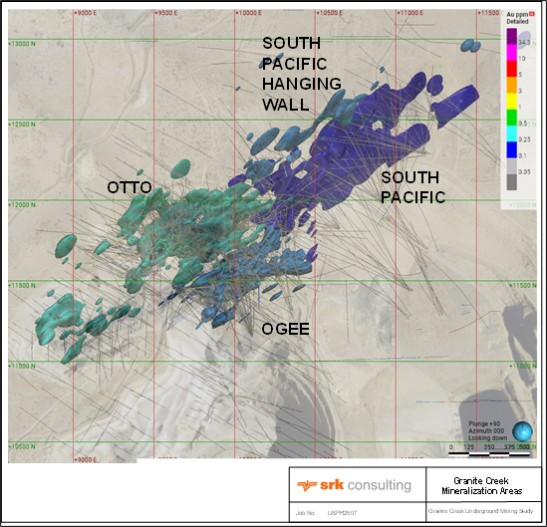
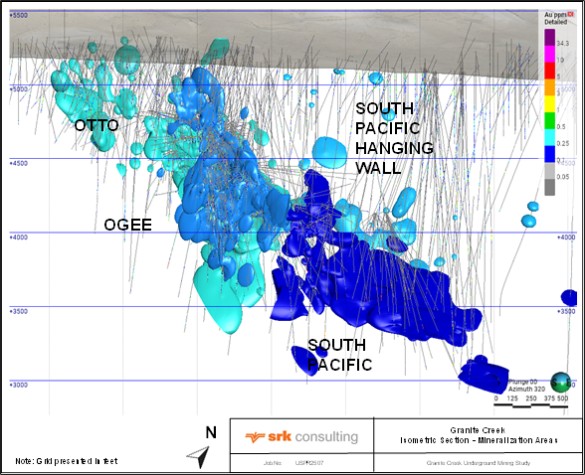
SRK completed the underground MRE using an updated geological and mineralization model built in Leapfrog® Edge, based on i-80’s drillhole database (cut-off date February 17, 2026) restricted to the area around current underground operations. Three principal mineralized areas are recognized which include Ogee, Otto, and the SPZ, each split into high- and low-grade sub-domains together with a separate South Pacific Zone hanging-wall domain (SPZhw), all controlled by a system of faults and structures including the CX West Fault, the Range Front Fault, and domain boundaries A, B, and C.

Grade estimation used 2 m (5 ft) composites, domain-specific high-grade capping (typically reducing mean grades by 2.5% to 5.0 %, with more aggressive capping in the lower-grade Ogee domain), and variogram models developed for each domain. Grades were interpolated using Ordinary Kriging and Inverse Distance Weighting with variable search orientations tied to local fault geometry, within a block model using 15 ft x 15 ft x 15 ft parent blocks.

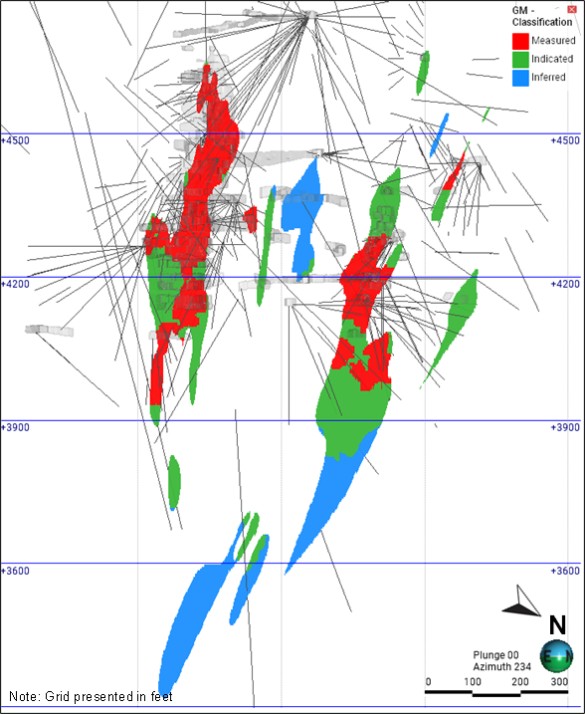
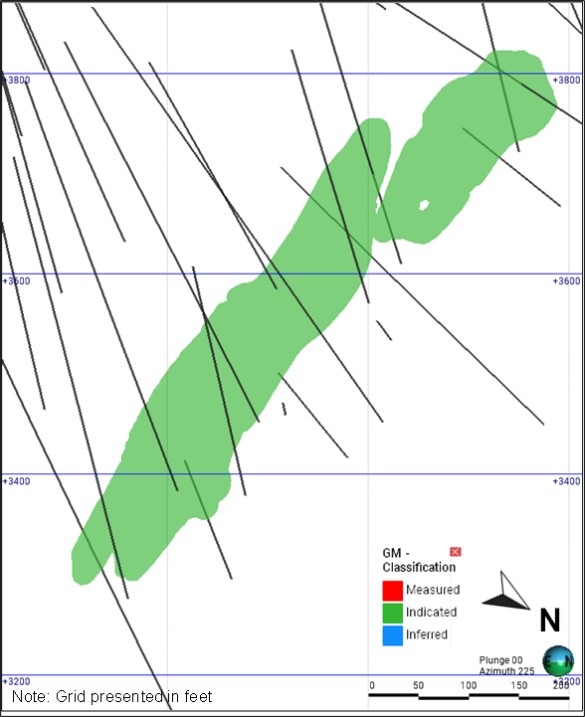
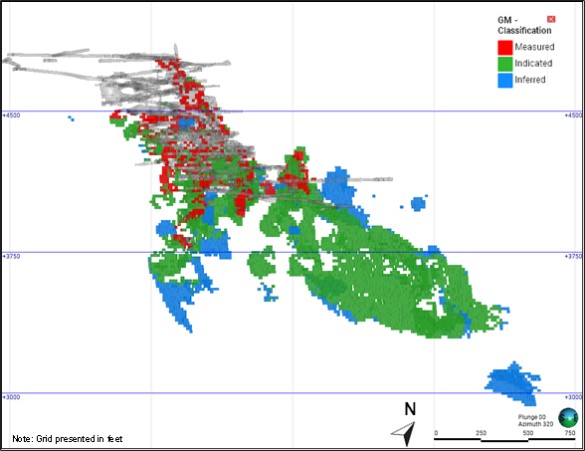
The classification is based on standards as defined by the Society for Mining, Metallurgy and Exploration (SME). The Mineral Resources at the Project have been classified as Measured, Indicated and Inferred based on drillhole spacing, composite and hole counts, and geostatistical confidence in each domain.

To determine the reasonable prospects for economic extraction (RPEE), SRK has used the following key assumptions for costing, and metallurgical recoveries. Mining costs via underground cut and fill are estimated at US$/t 190.18, with processing costs estimated at US$/t 131.13 for the autoclave processing, and US$/t 59.94 for the oxide CIL processing. Shipping costs of US$16.04 and G&A costs of US$/t 22.29 have been used for both material types.

Metallurgical recoveries are based on the outcomes of both the historical and the most recent metallurgical test work completed by i-80. To define the limits for processing route selection and estimated recoveries, SRK estimated AuCn (ppm), TOC% (percent), PregRob% (percent), and Sulfide Sulfur % (percent), which were reviewed and used by the mining team in relation to the metallurgical recovery. SRK worked with i-80 to review the findings of the metallurgical studies which indicated that the metallurgical recoveries range between 77.6% to 93.4% (average 87.6%) for the autoclave and 60.0% to 87.4% (average 68.9%) for the oxide material.

SRK has used an MSO, using Deswik Mining Software to determine the limits for the underground RPEE and were reported within mineable shapes generated using a mineable stope optimizer (MSO). For reporting purposes given the proximity and similar mineralization the SPZhw has been combined with the SPZ MSO domains for the final reporting.

The gold price selected for Mineral Resources has been based on review of market consensus forecast data through a database which SRK subscribe, and review by the QP of industry standards, i-80 and peers considering a time period of 10 years. It is the QP’s opinion that this is a reasonable forecast for the time considered and the current time of the mine being in operation (ramping up production), to cover short term pricing and future long term pricing. The point of reference for the reporting of mineral resources is the in-situ diluted tonnage and grades contained with the defined MSO limits.


September 2026


SRK Consulting (U.S.), Inc.

SEC Technical Report Summary – Granite Creek

   Page 4


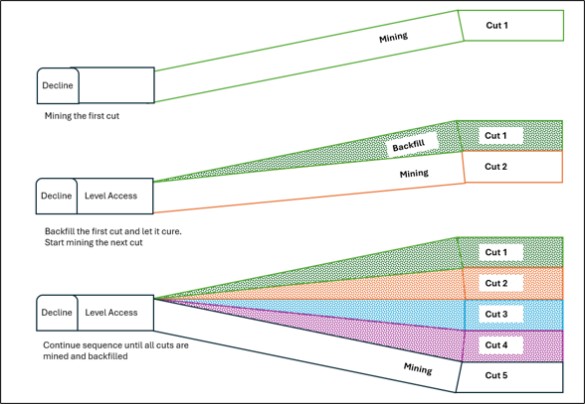
The underground Mineral Resource Statement, effective March 31, 2026, is summarized below (Measured & Indicated by domain, plus separately reported Inferred), with tonnage and metal presented on both a 100% Project basis and the Company Attributable basis.

Table 1-1: Inclusive Mineral Resource Statement for Granite Creek Underground - Effective Date March 31, 2026


Classification

   Domain    Mass
(000’s
tonnes)
     Mass
Attributable

(000’s
tonnes)
     Au
Grade

(g/t)
     Material
Content Au

(000’s t. oz)
     Attributable
Material
Content Au

(000’s t. oz)
 
Measured    Ogee      231        231        7.88        58.6        58.5  
   Otto      310        310        6.69        66.6        66.6  
   SPZ      65        65        9.85        20.7        20.7  
   Total      606        606        7.49        145.9        145.8  
Indicated    Ogee      322        321        7.06        73.0        72.9  
   Otto      746        746        6.26        150.2        150.2  
   SPZ      2,055        2,055        7.42        490.4        490.4  
   Total      3,122        3,122        7.11        713.6        713.5  
M&I    Ogee      553        552        7.40        131.6        131.4  
   Otto      1,056        1,056        6.39        216.8        216.8  
   SPZ      2,120        2,120        7.50        511.1        511.1  
   Total      3,729        3,728        7.17        859.5        859.3  
Inferred    Ogee      39        38        6.70        8.3        8.3  
   Otto      425        425        7.63        104.4        104.4  
   SPZ      429        418        6.53        90.1        87.4  
   Total      893        882        7.06        202.8        200.1  

Source: SRK, 2026

Notes:


  1.

Mineral Resources, which are not Mineral Reserves, do not have demonstrated economic viability. The estimate of Mineral Resources may be materially affected by environmental, permitting, legal, title, market or other relevant issues. The deposit has been classified as Measured, Indicated and Inferred based on confidence in the geological model and drill spacing. The quantity and grade of reported Inferred resources are uncertain in nature, and there has not been sufficient work to define these Inferred Mineral Resources as Indicated or Measured resources. There is no certainty that any part of a mineral resource will ever be converted into reserves.

  2.

Mineral Resources are reported on an inclusive basis with units reported in Metric Tonnes, grade is reported in grams/tonnes, and metal in 000’s troy ounces.

  3.

Mineral Resources are reported within Mineable Stopes which have been defined based on metal price assumptions,* variable metallurgical recovery assumptions, mining costs, processing costs, shipping, G&A costs. Metal Pricing is based on Gold (US$3,000 /oz). Other key assumptions include:

  *

Mining Costs (US$/t 190.18);

  *

Autoclave Processing Cost (US$/t 131.13), Low-grade Oxide (US$/t 59.94)

  *

Autoclave Recoveries ranging 77.6% - 93.4% (average 87.6%) and Oxide recoveries ranging 60.0% - 87.4% (average 68.9%);

  *

Shipping Costs (US$/t 16.04) and G&A Costs (US$/t 22.29);

  *

Totaling US$/t 281.45 – 359.64 for underground mining and Processing;

  *

Based on the variable recoveries an average cut-off grade of 3.75 - 9.81 g/t (0.286 oz/st) has been used reporting.

  4.

Mineral Resources have been depleted for previous underground mining activity, and reported on an attributable basis

  5.

Mineral Resources are based on validated data, which have been subjected to QA/QC analysis, using capped, composited samples at 2 m (5ft) intervals. Estimation has been completed using a combination of OK and IDW estimation methodologies and classified based on confidence in the underlying data and drill spacing. Mineral resource tonnages have been rounded to reflect the precision of the estimate.

  6.

The mineral resources were estimated by SRK Consulting (U.S.), Inc.

  7.

Rounding of some figures may lead to minor discrepancies in totals.


September 2026


SRK Consulting (U.S.), Inc.

SEC Technical Report Summary – Granite Creek

   Page 5


Table 1-2: Exclusive Mineral Resource Statement for Granite Creek Underground - Effective Date March 31, 2026


Classification

   Domain    Mass
(000’s
tonnes)
     Mass
Attributable

(000’s
tonnes)
     Au
Grade

(g/t)
     Material
Content Au

(000’s t. oz)
     Attributable
Material
Content Au

(000’s t. oz)
 
Measured    Ogee      175        175        6.82        38.4        38.3  
   Otto      166        166        5.58        29.7        29.7  
   SPZ      31        31        6.44        6.5        6.5  
   Total      372        372        6.23        74.6        74.5  
Indicated    Ogee      241        241        6.52        50.6        50.6  
   Otto      425        425        5.23        71.5        71.5  
   SPZ      771        771        4.70        116.6        116.6  
   Total      1,438        1,438        5.16        238.6        238.6  
M&I    Ogee      417        416        6.64        89.0        88.9  
   Otto      591        591        5.32        101.2        101.2  
   SPZ      803        803        4.77        123.1        123.1  
   Total      1,810        1,810        5.38        313.3        313.1  
Inferred    Ogee      38        38        6.71        8.3        8.3  
   Otto      417        417        7.62        102.0        102.0  
   SPZ      415        405        6.49        86.6        83.9  
   Total      871        860        7.04        197.0        194.2  

Source: SRK, 2026 

Notes: 


  1.

Mineral Resources, which are not Mineral Reserves, do not have demonstrated economic viability. The estimate of Mineral Resources may be materially affected by environmental, permitting, legal, title, market or other relevant issues. The deposit has been classified as Measured, Indicated and Inferred based on confidence in the geological model and drill spacing. The quantity and grade of reported Inferred resources are uncertain in nature, and there has not been sufficient work to define these Inferred Mineral Resources as Indicated or Measured resources. There is no certainty that any part of a mineral resource will ever be converted into reserves.

  2.

Mineral Resources are reported on an Exclusive basis with units reported in in Metric Tonnes, grade is reported in grams/tonnes, and metal in 000’s troy ounces.

  3.

Mineral Resources are reported fully diluted within Mineable Stopes which have been defined based on metal price assumptions,* variable metallurgical recovery assumptions, mining costs, processing costs, shipping, G&A costs. Metal Pricing is based on Gold (US$3,000 /oz). Other key assumptions include:

  *

Mining Costs (US$/t 190.18);

  *

Autoclave Processing Cost (US$/t 131.13), Low-grade Oxide (US$/t 59.94)

  *

Autoclave Recoveries ranging 77.6% - 93.4% (average 87.6%) and Oxide recoveries ranging 60.0% - 87.4% (average 68.9%);

  *

Shipping Costs (US$/t 16.04) and G&A Costs (US$/t 22.29);

  *

Totaling US$/t 281.45 – 359.64 for underground mining and Processing;

  *

Based on the variable recoveries an average cut-off grade of 3.75 - 9.81 g/t (0.286 oz/st) has been used reporting.

  4.

Mineral Resources have been depleted for previous underground mining activity, and reported on an attributable basis

  5.

Mineral Resources are based on validated data, which have been subjected to QA/QC analysis, using capped, composited samples at 2 m (5ft) intervals. Estimation has been completed using a combination of OK and IDW estimation methodologies and classified based on confidence in the underlying data and drill spacing. Mineral resource tonnages have been rounded to reflect the precision of the estimate.

  6.

The mineral resources were estimated by SRK Consulting (U.S.), Inc.

  7.

Rounding of some figures may lead to minor discrepancies in totals.


September 2026


SRK Consulting (U.S.), Inc.

SEC Technical Report Summary – Granite Creek

   Page 6


1.4.2

Open Pit

Table 1-3 shows the pit-constrained open pit Mineral Resource at a gold grade cut-off of 0.20 g/t. (0.005 oz/st)

Table 1-3: Granite Creek Open Pit Mineral Resource Statement


Deposit

   Cutoff
Grade
(ppm)
     Mass
(000’s
tonnes)
     Mass
(000’s
short
tons)
     Mass
Attributable
(000’s tonnes)
     Au
Grade
(g/t)
     Au
Grade
(opt)
     Au
Contained
(‘000s tr oz)
     Attributable
Material
Content Au
(000’s tr oz)
 

Measured


Pit B

     0.2        3,900        4,299        3,575        1.06        0.031        133.49        122.37  

Pit A

     0.2        1,098        1,211        1,007        0.71        0.021        25.08        22.99  

CX

     0.2        13,493        14,873        12,835        1.10        0.032        478.41        454.02  

Mag

     0.2        15,055        16,596        14,703        1.03        0.030        499.50        487.90  

Total


     33,546        36,978        32,121        1.05        0.031        1,136.47        1,087.28  

Indicated


Pit B

     0.2        823        907        754        0.64        0.019        16.86        15.45  

Pit A

     0.2        969        1,069        889        0.68        0.020        21.06        19.30  

CX

     0.2        4,423        4,876        4,189        1.00        0.029        141.96        133.03  

Mag

     0.2        11,509        12,687        11,415        0.74        0.022        275.03        272.53  

Total


     17,725        19,538        17,247        0.80        0.023        454.91        440.32  

Measured + Indicated


Pit B

     0.2        4,723        5,206        4,329        0.99        0.029        150.34        137.82  

Pit A

     0.2        2,068        2,280        1,896        0.69        0.020        46.13        42.29  

CX

     0.2        17,916        19,749        17,024        1.08        0.031        620.37        587.05  

Mag

     0.2        26,565        29,283        26,119        0.91        0.026        774.53        760.43  

Total


     51,271        56,517        49,368        0.97        0.028        1,591.38        1,527.60  

Inferred


Pit B

     0.2        50        55        46        0.52        0.015        0.84        0.77  

Pit A

     0.2        440        485        403        0.44        0.013        6.22        5.70  

CX

     0.2        1,997        2,201        1,921        0.94        0.028        60.66        58.24  

Mag

     0.2        1,339        1,476        1,320        0.75        0.022        32.12        31.69  

Total


     3,826        4,217        3,689        0.81        0.024        99.84        96.40  


  1)

The effective date of the Mineral Resources Estimate is March 31, 2026

  2)

The Qualified Persons for the estimate is GRE.

  3)

Mineral resources are not ore reserves and are not demonstrably economically recoverable.

  4)

Mineral resources are reported at a 0.20 g/t cutoff, an assumed gold price of 3,000 $/tr. oz, using variable recovery, a slope angle of 41 degrees, 6% royalty, heap leach processing cost $9.04 per tonne (includes admin), CIL processing cost of $17.22 per tonne (includes admin).

  5)

Attributable resources are those resources excluding certain third party claims in the Pinson #1A-18A unpatented mining claims and in the Section 28 Fee lands.

Please note that Mineral Resources are not Mineral Reserves and do not have demonstrated economic viability.


1.5

Metallurgical Testing and Recovery Methods

Metallurgical test work to support the Granite Creek Project has been undertaken at several commercial laboratories including:


Dawson Metallurgical Laboratories


FLSmidth


McClelland Laboratories


SGS

Scope of testing has included bench top autoclave and CIL, cyanide destruction, and solid-liquid separation, along with continuous pressure oxidation testing. The results of these tests were used to inform the projected gold recoveries for the Project.


September 2026


SRK Consulting (U.S.), Inc.

SEC Technical Report Summary – Granite Creek

   Page 7


Granite Creek production will be hauled to the refurbished Lone Tree pressure oxidation facility for processing. Lone Tree unit operations include:


Ore Reclaim, Grinding, and Thickening and Acidulation


Pressure Oxidation


POX Off-gas Treatment and Quench Water Loop


Neutralization, Carbon-in-Leach, and Cyanide Destruction


Tailings Thickening and Filtration


Acid Wash, Carbon Stripping, and Carbon Regeneration


Electrowinning and Refinery


Plant and Instrument Air


Oxygen Plant


Reagent Preparation and Storage


Process and Plant Services Cooling Towers


Water Distribution


Steam Generating Plant and Propane Storage

Tailings thickening and filtration are new operations at Lone Tree required for filtered tailings disposal. The Lone Tree autoclave will operate under acid conditions as this provides superior gold recoveries compared to alkaline pressure oxidation.

Granite Creek production can also be shipped for third party processing.


1.6

Mineral Reserve

Underground Mineral Reserves were estimated by SRK. Estimates were prepared for the Ogee, Otto and SP zones located beneath and adjacent to the historically mined open pit.

Potential mining blocks are generated from the resource block model based on the deposit geometry, metallurgical process, and block values. Measured Mineral Resources were converted to Proven Mineral Reserves and Indicated Mineral Resources were converted to Probable Mineral Reserves by applying the appropriate modifying factors, as described herein. Inferred Mineral Resources were not converted to Mineral Reserves. However, where Inferred Mineral Resources are contained within the Mineral Reserves designs, they were assigned zero grade and are considered internal dilution.

Current estimated project costs and the calculated economic cut-off grade (CoG) are shown inTable 1-4. For reporting reserves within the design, a stope cut-off range of 4.42 g/t (0.13 oz/st) Au and 6.41 g/t (0.19 oz/st) Au was used for oxide material and range of 5.21 g/t (0.15 oz/st) Au and 6.17 g/t (0.18 oz/st) Au was used for the sulfide material. Development headings generate additional material grading between 1.51 g/t (0.04 oz/st) Au and 2.19 g/t (0.06 oz/st) Au oxide material and2.47 g/t (0.07 oz/st) Au and 02.91 g/t (0.08 oz/st) Au for sulfide material. This material is economic to process on an incremental basis and is therefore included in the mineral reserve estimate.


September 2026


SRK Consulting (U.S.), Inc.

SEC Technical Report Summary – Granite Creek

   Page 8


Table 1-4: Underground Cut-off Grade Parameters


Process Method1


Parameter

   Imperial Value      Imperial Unit    Metric Value      Metric Unit
   Gold Price      2,500      US$/oz      80.3769      US$/g
   TC/RC      1.85      US$/oz      0.0595      US$/g
   NSR Royalty      6%
   Nevada Excise Tax      0.75%

Oxides

   Metallurgical Recovery      60.0% - 87.4%
   Mining Cost      172.53      US$/st      190.18      US$/t
   Process Cost      54.38      US$/st      59.94      US$/t
   Shipping Cost      14.55      US$/st      16.04      US$/t
   G&A Cost      20.22      US$/st      22.29      US$/t
   Total Cost      261.68      US$/st      288.45      US$/t
   Stope Cut-off Grade      0.129 – 0.187      oz/st Au      4.423–6.411      g/t Au
   Processing Cut-off Grade2      0.044 – 0.064      oz/st Au      1.509–2.194      g/t Au

Sulfide

   Metallurgical Recovery      77.6% - 92.2%
   Mining Cost      172.53      US$/st      190.18      US$/t
   Process Cost      118.96      US$/st      131.13      US$/t
   Shipping Cost      14.55      US$/st      16.04      US$/t
   G&A Cost      20.22      US$/st      22.29      US$/t
   Total Cost      326.26      US$/st      359.64      US$/t
   Cut-off Grade      0.152–0.180      oz/st Au      5.211–6.171      g/t Au
   Processing Cut-off Grade2      0.072–0.085      oz/st Au      2.469–2.914      g/t Au

Source: SRK, 2026


  1

Dynamic cut-off grade was used for the reserves design based on whether the material is oxide or sulfide.

  2 

Processing Cut-off Grade considers the processing cost and G&A cost.

Mineral Reserves were classified using the 2014 Canadian Institute of Mining Metallurgy and Petroleum Definition Standards on Mineral Resources and Mineral Reserves (CIM Definition Standards). Indicated Mineral Resources were converted to Probable Mineral Reserves by applying the appropriate modifying factors, as described herein, to potential mining shapes created during the mine design process. In the same manner, Measured Mineral Resources were converted to Proven Mineral Reserves.

A 3D design has been created representing the planned reserve mining areas. The underground mine design process resulted in 2.20 Mt (2.42 Mst) of Mineral Reserves at an average grade of 7.87 g/t (0.23 oz/st) Au. Table 1-5 presents the mineral reserve statement as of March 31, 2026.


September 2026


SRK Consulting (U.S.), Inc.

SEC Technical Report Summary – Granite Creek

   Page 9


Table 1-5: Mineral Reserve Estimate for Granite Creek as of March 31, 2026—SRK Consulting (U.S.), Inc.


Classification

   Domain    Metric Units      Imperial Units         
   Tonnage
(000’ tonnes)
     Au Grade
(g/t)
     Tonnage
(000’s s. tons)
     Au Grade
(oz/st)
     Au Metal
Content
(000’s t. oz)
 

Proven

   Ogee      71        9.34        78        0.27        21.2  
   Otto      171        7.04        189        0.21        38.7  
   SP      40        11.21        44        0.33        14.5  
   Stockpile      26        7.33        29        0.21        6.2  
   Total      308        8.13        340        0.24        80.6  

Probable

   Ogee      88        7.95        97        0.23        22.4  
   Otto      366        6.70        403        0.20        78.8  
   SP      1,437        8.11        1,584        0.24        374.7  
   Total      1,890        7.83        2,084        0.23        475.9  

Proven + Probable

   Ogee      158        8.57        174        0.25        43.6  
   Otto      537        6.81        592        0.20        117.6  
   SP      1,477        8.19        1,628        0.24        389.2  
   Stockpile      26        7.33        29        0.21        6.2  
   Total      2,198        7.87        2,423        0.23        556.5  

Source: SRK, 2026

Notes:


All figures are rounded to reflect the relative accuracy of the estimates. Totals may not sum due to rounding. Mineral Reserves have been stated on the basis of a mine design, mine plan, and economic model.


Reserves are reported using a stope CoG range of 4.42 g/t (0.13 oz/st) Au – 6.41 g/t (0.19 oz/st) Au and an incremental processing CoG range of 1.51 g/t (0.04 oz/st) Au – 2.91 g/t (0.08 oz/st) Au depending on the processing method. The CoG calculations assume a US$2,500/oz Au price, and 60% to 92% metallurgical recovery depending on the processing method applied.


Operating costs include mining (US$190.18/tonne), processing (US$59.94/tonne to US$131.13/tonne), G&A (US$22.29/tonne), Shipping Costs (US$/t 16.04).. Additionally, a 6% royalty and 0.75% Excise Tax are applied, along with TC/RC charges of US$1.85/oz Au.


The reserves are mined using the underhand drift and fill method with cemented waste rock backfill. Mining dilution of 10% is included in the reserve at zero grade.


Stockpile reserves reflect ore mined and placed on surface stockpiles prior to the effective date and not yet processed.


The Mineral Reserves were estimated by SRK Consulting, U.S. (Inc.).


1.7

Summary Capital and Operating Cost Estimates

Costs for processing vary depending on ore type and processing method.

For processing refractory ore at Lone Tree, costs are as follows:


Sustaining OPEX of US$25.99/metric ton (processing fee). The processing fee has been presented by i-80 as an Autoclave CAPEX Allocation as noted in Table 1-6


Processing cost of US$105.16/metric ton

For processing oxide ore at Lone Tree, costs are US$33.97/metric ton.

For third-party toll processing, costs are in accordance with the terms of the toll-milling contract and consist of costs incurred by the third party for processing, a treatment charge that varies based on the gold price and any penalties for material that does not meet the specifications of the contract.

LoM capital costs are summarized in Table 1-6.


September 2026


SRK Consulting (U.S.), Inc.

SEC Technical Report Summary – Granite Creek

   Page 10


Table 1-6: Life of Mine Capital Costs


Capital Costs

   Unit      Value  

Mine Capex

   US$ M        60.74  

Autoclave Capex Allocation

   US$ M        49.33  

Surface Capitalized Costs

   US$ M        22.19  

Closure

   US$ M        12.66  

Total

   US$ M        144.92  

Source: SRK, 2026

US$M: US$ million

LoM Operating Costs are summarized in Table 1-7.

Table 1-7: Life of Mine Operating Costs


Operating Costs


Unit

   Value  

Mining Cost

   US$M      395.98  

Oxide Cost

   US$M      0.65  

Autoclave Cost

   US$M      267.30  

Ore Transport Cost

   US$M      36.27  

Surface Ops Cost

   US$M      117.85  

Power Cost

   US$M      32.77  

G&A Cost

   US$M      49.87  

Total

   US$M      900.68  

Mining Cost

   USD/ton ore      165.38  

Oxide Cost

   USD/ton ore processed      17.95  

Autoclave Cost

   USD/ton ore processed      111.97  

Ore Transport Cost

   USD/ton ore      15.15  

Total Processing Cost

   USD/ton ore processed      125.53  

Surface Ops Cost

   USD/ton ore      49.22  

Power Cost

   USD/ton ore      13.69  

G&A Cost

   USD/ton ore      20.58  

Total

   USD/ton ore processed      371.67  

Mining Cost

   USD/tonne ore      182.30  

Oxide Cost

   USD/tonne ore processed      19.78  

Autoclave Cost

   USD/tonne ore processed      123.43  

Ore Transport Cost

   USD/tonne ore      16.70  

Total Processing Cost

   USD/tonne ore processed      138.37  

Surface Ops Cost

   USD/tonne ore      54.25  

Power Cost

   USD/tonne ore      15.09  

G&A Cost

   USD/tonne ore      22.68  

Total

   USD/tonne ore processed      409.69  

Source: SRK, 2026

US$M: US$ million


1.8

Economic Analysis

Economic analysis, including estimation of capital and operating costs, is inherently a forward-looking exercise. These estimates rely upon a range of assumptions and forecasts that are subject to change depending upon macroeconomic conditions, operating strategy and new data collected through future study or operations and therefore actual economic outcomes often deviate significantly from forecasts.

The Granite Creek operation consists of an underground mine with no onsite processing facility that mines and transports gold ore to offsite processing facilities.


September 2026


SRK Consulting (U.S.), Inc.

SEC Technical Report Summary – Granite Creek

   Page 11


The economic analysis metrics are prepared on annual after-tax basis in US$. The results of the analysis are presented in Table 1-8. The results indicate that at a gold price of US$2,750/oz, the after tax NPV @ 5% is US$118 million.

Table 1-8: Indicative Economic Result


LOM Cash Flow

   Unit      Value  

Total Revenue

     US$M        1,328.81  

Royalty

     US$M        (104.47

Total Opex

     US$M        (900.68

Operating Margin

     US$M        323.65  

Operating Margin Ratio

     %        24

Taxes Paid

     US$M        (25.35

Free Cashflow

     US$M        153.38  

Before-Tax


Free Cash Flow

     US$M        178.73  

NPV @ 5%

     US$M        137.66  

NPV @ 7.5%

     US$M        120.98  

NPV @ 10%

     US$M        106.39  

After-Tax


Free Cash Flow

     US$M        153.38  

NPV @ 5%

     US$M        117.55  

NPV @ 7.5%

     US$M        102.97  

NPV @ 10%

     US$M        90.19  

Source: SRK, 2026

US$M: US$ million

Within the constraints of this analysis, the operation’s NPV appears to be most sensitive to metal prices, recovery assumptions and mined grades.

A summary of the cash flow on an annual basis if presented in Figure 1-1.


LOGO

Source: SRK, 2026

Figure 1-1: Annual Cash Flow Summary


1.9

Permitting Requirements

The Granite Creek Underground Project occupies a site with mining history dating to the 1940’s. The Project supports a historic surface mining operation and the current underground operation. The surface operation is permitted through Bureau of Land Management (BLM) and NDEP, while the underground operation is located on private property and is permitted through the NDEP. Limited underground support facilities are permitted through the surface mine permits, under the jurisdiction of the BLM and NDEP.


September 2026


SRK Consulting (U.S.), Inc.

SEC Technical Report Summary – Granite Creek

   Page 12


The surface operations have been the subject of environmental review since 1975, when the first Environmental Assessment (EA) was prepared for the U.S. Department of the Interior – Bureau of Land Management (BLM) under the National Environmental Policy Act (NEPA). Two further assessments followed in 1992 and 2003. The surface permits have been updated from time to time to accommodate closure and underground support facilities.

The majority of the current underground project sits on private land and falls under the jurisdiction of the Nevada Division of Environmental Protection – Bureau of Mining Regulation and Reclamation (NDEP-BMRR) the underground operation permit has been updated from time-to-time to accommodate ongoing operations.

Geochemical testing, beginning with a comprehensive 1998 study and continued through quarterly sampling from 2005 to 2025, consistently shows that waste rock placed in the CX Pit has strong acid-neutralizing capacity and low potential for acid rock drainage (ARD). The main water-quality concern is metal leaching, particularly arsenic and antimony, which periodically exceed NDEP reference values in bedrock groundwater and underground mine water. These constituents are actively managed through the site’s water treatment plant (WTP), which reliably brings effluent into compliance. A metals attenuation study is under development to support site specific discharge requirements that could reduce water treatment requirements for select constituents and lower WTP operational costs. Surface water in Granite Creek and alluvial groundwater both meet applicable standards. The Mag Pit lake, monitored since 2015, shows elevated arsenic and manganese, but a 2025 SRK ecological risk assessment (ERA) concluded these levels are not likely to cause harm to receptors. Modeling of the pit lake’s long-term, post-closure water quality indicates compliance with state standards over a 100-year horizon, with a proven contingency treatment (ferric sulfate dosing) available if arsenic levels were to rise.

SRK is not aware of any known environmental issue that would materially impede extraction of the project’s Mineral Resources or reserves. One issue with potential cost implications was identified in 2025: petroleum-contaminated soil was found within CX Pit waste rock backfill. Because the exact location of the contaminated material is not known, as much as 1.17 million tons of backfill may need to be re-handled and sampled. Osgood is working with NDEP-BMRR to develop a management plan and remediate the issue; this represents the project’s principal environmental cost uncertainty rather than a permitting or resource-access risk.

The project operates under a full suite of state and federal environmental management plans covering water management, waste rock handling, spill response, monitoring, and closure, most recently updated as part of permit amendments. No ore is processed on site; mined material is trucked to a permitted third-party facility. Waste rock is placed in the CX Pit and C Pit under the terms of the site’s water pollution control permit and is sampled quarterly for acid-generation and metal-leaching potential. No tailings are generated by current operations, and the two legacy tailings facilities on site have been reclaimed and released from financial assurance obligations. A second water treatment plant is planned to handle the project’s growing water management needs, and stormwater is actively diverted around the site through an engineered pipe system under an active general permit. Monitoring spans water quality, waste rock chemistry, air quality, surface disturbance and reclamation, and stormwater controls, and the site’s permit-monitoring obligations are all current.


September 2026


SRK Consulting (U.S.), Inc.

SEC Technical Report Summary – Granite Creek

   Page 13


The project holds the permits needed for its current operations from Humboldt County, the State of Nevada, and the BLM, with no permitting actions currently pending before any agency. Water rights total 3,746 ha (9,256 acre)-feet annually, of which 465 ha (1,149 acre)-feet is consumptive use, drawn primarily from certificated rights and permits within a groundwater basin designated by the State Engineer for closer administration; this designation reflects committed water rights relative to the basin’s yield rather than evidence of depletion. Financial assurance bonding for reclamation is in place and current, with the next required three-year bond review anticipated in 2028 to 2029.

Osgood Mining has no formal agreements with local communities currently but maintains ongoing stakeholder engagement through periodic town hall meetings in Winnemucca, participation in regional economic development efforts, and support for local education initiatives. The company follows i-80 Gold Corp’s broader corporate governance policies on local procurement and hiring.

Closure planning follows established state and federal reclamation requirements, with the current mine plan assuming the CX Pit is backfilled (and the Mag Pit lake becomes a long-term groundwater sink posing no identified risk to regional groundwater quality. The current reclamation cost estimate, prepared using Nevada’s standardized cost model, is US$8.64 million; this figure reflects a government-administered closure scenario and is expected to differ from the cost the operator would actually incur, and from the eventual cost at the 2032 anticipated closure date, as site conditions evolve. Overall, given the depth of the existing regulatory framework and the documentation reviewed, SRK’s opinion is that the project’s current environmental, permitting, and community plans are adequate.


1.10

Conclusions and Recommendations


1.10.1

Drilling

The QP considers that the drilling and sampling information is sufficiently reliable to interpret the boundaries of the mineralized structures and domain interpretations, and that the sample grade data are sufficiently reliable to support the MRE. The QP also notes that mineralization remains open at the deposit.

The 2027 to 2028 exploration program targets five zones at Granite Creek: the CX Fault depth / north extension, Rangefront and Adam Peak, the Ogee Zone, SPZ infill and depth extension, and the SPZ / Rangefront / Mag structural intersection.

The combined drill program comprises 128 planned drillholes totaling 32,614 m (107,000 ft) plus associated CX Fault underground development and a gravity survey at the SPZ / Rangefront / Mag intersection. The proposed work program has an estimated cost of US$16 million based on current conditions.

In the opinion of the QP, the proposed program is technically reasonable and appropriately sequenced, with Rangefront and Ogee prioritized ahead of active and planned underground development to reduce the risk of mining ahead of drill data, while the CX Fault program advances the known oxide-to-sulfide transition at depth.


September 2026


SRK Consulting (U.S.), Inc.

SEC Technical Report Summary – Granite Creek

   Page 14


Upon completion of the above items, an update to the geologic model and MRE should be conducted, along with updated metallurgical updated recovery assumptions.


1.10.2

Mining


Mine infrastructure has been completed. Production ramp up has reached approximately 400 tons per day. The mining contractor is in place with the full complement of equipment and personnel.


Decline development has accessed 700 vertical ft of mineralization of the Otto and Ogee zones. Development has reached the top of the SPZ allowing additional active production stopes.


The drill lateral drift over the SPZ has been completed.


Reconciliation of the model to mill indicates process head ounces exceed model by 19%. This appears to be from mining in a larger low-grade halo around high grade core.


Processed grade is lower than the life-of-mine planned grade due to extensive mining of marginal mineralization below the economic cut-off grade.


1.10.3

Metallurgical Testing


Conduct additional variability sampling using the most recent mine plan to select samples to provide additional recovery information to further populate recovery models.


Testing should attempt to establish head grade and extraction relationships for use in more detailed resource modeling.


Mineralogy impacts need to be established and geologic domains within each resource need to be determined.


Testing of additional samples to provide comminution data to assess hardness variability within the zones and any potential impacts on throughput in the Lone Tree process plant.


The estimated cost for the suggested next phase metallurgical program is US$150,000 based on current market pricing.


1.10.4

Permitting / Environmental

Dewatering

Complete the planned dewatering well and re-evaluate the ground water model and inflow into the underground workings.


1.10.5

Economics

The Granite Creek operation consists of an underground mine with no onsite processing facility that mines and transports gold ore to offsite processing facilities. The operational life as modeled for this analysis is approximately 9 years. Under the forward-looking assumptions modeled and documented in this report, the operation is forecast to generate positive cumulative cash flow. However, the Project does not generate positive free cashflow in 2026 and 2027 largely due to the higher processing costs incurred because of third-party processing of ore and a six-month stockpiling period in 2027. Cashflow is forecast to be negative at the end of the operational life as the operation winds down, and closure costs are incurred. This estimated cash flow is inherently forward-looking and dependent upon numerous assumptions and forecasts, such as macroeconomic conditions, mine plans and operating strategy, that are subject to change.


September 2026


SRK Consulting (U.S.), Inc.

SEC Technical Report Summary – Granite Creek

   Page 15


The results indicate that at a gold price of US$2,750/oz the after-tax NPV @ 5% is US$118 million.

The sensitivity analysis performed indicates that the operation’s NPV is most sensitive to metal prices, recovery assumptions and mined grades.


September 2026


SRK Consulting (U.S.), Inc.

SEC Technical Report Summary – Granite Creek

   Page 16


2

Introduction


2.1

Registrant for Whom the Technical Report Summary was Prepared

This Technical Report Summary was prepared in accordance with the Securities and Exchange Commission (SEC) S-K regulations (Title 17, Part 229, Items 601 and 1300 through 1305) for i-80 Gold Corp. (“i-80” or the “Registrant”) on the Granite Creek Underground Project.

This Technical Report Summary is filed as an exhibit to i-80 Gold Corp.’s Current Report onForm 8-K.


2.2

Terms of Reference and Purpose of the Report

The quality of information, conclusions, and estimates contained herein is consistent with the level of effort involved in SRK’s services, based on: i) information available at the time of preparation, ii) data supplied by outside sources, and iii) the assumptions, conditions, and qualifications set forth in this report. This report is intended for use by i-80 subject to the terms and conditions of its contract with SRK and relevant securities legislation.

The purpose of this Technical Report Summary is to report mineral resources, mineral reserves and exploration results.

The effective date of this report is March 31, 2026.


2.3

Sources of Information

The sources of information include data and reports supplied by i-80 personnel as well as documents cited throughout this report and listed in the References section. It is the QP’s opinion that the information and test work provided is fit for purpose for the current level of study.


2.4

Details of Inspection

Site visits conducted by the qualified persons are summarized in Table 2-1.


September 2026


SRK Consulting (U.S.), Inc.

SEC Technical Report Summary – Granite Creek

   Page 17


Table 2-1: Site Visit Participants


Company


Expertise


Date(s) of Visit


Details of Inspection

SRK Consulting    Geology    February 4, 2026    UG mine tour and GC, drill shed and core review
WSP    Geology, Infrastructure    November 5-6, 2025    The purpose of the visit was to review geological, geotechnical, mining, and infrastructure conditions relevant to the SPZ and planned mine expansion. The site visit included inspection of drill core, underground workings, ground support systems, cemented rockfill production facilities, and the proposed ventilation raise location to surface.
WSP    Ventilation    November 5, 2025    UG mine tour and ventilation assessment including inspection of primary, booster, and auxiliary ventilation systems; review of active and planned mine workings, haulage routes, escapeways, and proposed ventilation raise locations; collection of temperature and humidity data for Ventsim model calibration.

Observations made during the site visits were generally consistent with the geological model, geotechnical logging database, underground mapping, laboratory testing results, and operational information reviewed for this study.


2.5

Report Version Update

The user of this document should ensure that this is the most recent Technical Report Summary for the property.

This Technical Report Summary updates a previously disclosed Initial Assessment (IA) on the Granite Creek Open Pit Project (reported March 26, 2025). Based on additional drilling and a shift in focus to the underground operation, the qualified person has determined that the IA is no longer current and has been superseded by this Technical Report Summary. This Technical Report Summary is not valid if a further Technical Report Summary has since been issued.


September 2026


SRK Consulting (U.S.), Inc.

SEC Technical Report Summary – Granite Creek

   Page 18


3

Property Description


3.1

Property Description

The Granite Creek Project is located in Humboldt County, Nevada, 45 km (28 m) northeast of the town of Winnemucca, and it is part of the historic Potosi mining district. It is centered at roughly 41° 8’ N latitude and 117° 15.5’ W longitude. It encompasses about 1,823.5 ha (4,506 acres) including owned unpatented claims, leased unpatented claims and owned surface fee land. The federal land is administered by the BLM. Figure 3-1 shows the location of the Granite Creek Project


LOGO

Source: SRK, 2026

Figure 3-1: Granite Creek Project Location


3.2

Mineral Tenure and Surface Rights

Mineral title to the Granite Creek Project is held by Osgood Mining Company, LLC (Osgood) and Premier Gold Mines USA, Inc., with additional unpatented claims leased from third parties. Surface and mineral rights on fee lands are owned by Osgood. Osgood holds the operating permits and reclamation bonds for the Project and is responsible for all current mining and exploration activities. The Land Position Map along with the summary of the mineral and surface titleholders for the Project can be found below in Figure 3-2 and Table 3-1.


September 2026


SRK Consulting (U.S.), Inc.

SEC Technical Report Summary – Granite Creek

   Page 19


LOGO

Source: SRK, 2026

Figure 3-2: Land Position Map, Granite Creek Project


September 2026


SRK Consulting (U.S.), Inc.

SEC Technical Report Summary – Granite Creek

   Page 20


Table 3-1: Summary of Mineral and Surface Title Holders, Granite Creek Project


Legal Description


Identifying Numbers


Owner(s)

T38N R42E - Section 28 CX 1A-23A

(Unpatented Lode Mining Claims

   BLM Serial No.: NMC319833 - NMC319855    Osgood Mining Company, LLC

T38N R42E - Section 28 PACIFIC 1A-7A

(Unpatented Lode Mining Claims)

   BLM Serial No.: NMC319814 - NMC 319820    Osgood Mining Company, LLC

T38N R42E - Section 32 PINSON 1A-18A

(Unpatented Lode Mining Claims)

   BLM Serial No.: NMC319856 - NMC319873   

Osgood Mining Company, LLC (41.67%),

Premier Gold Mines USA Inc. (50%), Michael C. Murphy (8.33%)

T38N R42E - Section 32

LEASED: BEE DEE 1A-18A, FRACTION 1 & 2

(Unpatented Lode Mining Claims)

   BLM Serial No.: NMC282121 - NMC282122    Lessors: Franco-Nevada & S&G Pinson Lessee: Osgood Mining Company, LLC

T37N R42E - Section 6 LEASED: BEE DEE 21-56

(Unpatented Lode Mining Claims)

   BLM Serial No.: NMC282123 - NMC282158    Lessors: Franco-Nevada & S&G Pinson Lessee: Osgood Mining Company, LLC

T38N R42E - Section 21

640 Acres

(FEE)

   APN 07-0121-05    Osgood Mining Company, LLC

T38N R42E - Section 28

120 Acres
(FEE)

   APN 07-0121-07    Osgood Mining Company, LLC (41.67%), Premier Gold Mines USA Inc. (50%), Michael C. Murphy (8.33%)
T38N R42E - Section 29
640 Acres
(FEE)
   APN 07-0121-06    Osgood Mining Company, LLC

T38N R42E - Section 31

640 Acres

(FEE)

   APN 07-0121-08    Premier Gold Mines USA Inc.

T38N R42E - Section 33

640 Acres

(FEE)

   APN 07-0121-33    Osgood Mining Company, LLC

Source: i-80 Gold, 2026


September 2026


SRK Consulting (U.S.), Inc.

SEC Technical Report Summary – Granite Creek

   Page 21


Unpatented claims have annual maintenance fees of US$200 per claim payable to the BLM and a notice of intent to hold (NIH) in the amount of US$12 per claim plus US$12 document filing fee payable to Humboldt County. Claim maintenance fees are paid through September 1, 2026, with the BLM. The NIH fees to Humboldt County are paid through November 1, 2026; payments are current at the time of this report. All mineral claims and fee lands comprising the Granite Creek Project are valid, in good standing, and free of any known disputes at the effective date of this report. Fee land is subject to Nevada State real property tax, and certain mine infrastructure is subject to Nevada State personal property tax. Leased unpatented claims are subject to yearly lease fees. Holding costs for 2026 are listed in Table 3-2.

Table 3-2: Holding Costs, Granite Creek Project


Description


Payee


Quantity

   Amount (US$)  

Unpatented Claim Maintenance Fee

   BLM    104      20,800.00  

Notice of Intent to Hold Unpatented Claims

   Humboldt County    104      1,260.00  

Real Property Taxes

   Humboldt County    5 parcels      7,234.63  

Personal Property Taxes

   Humboldt County    various infrastructure      94,594.15  

Lease fees, annually adjusted by CPI

   Lease Holders    56 unpatented claims      122,495.24  


Total

   $ 246,384.02  


Source: SRK, 2026

Ownership of the Granite Creek Project land position comprises various forms of title. i-80 Gold Corp owns 48 unpatented lode claims covering about 363 ha (897 acres) (Table 3-3), and leases 56 unpatented lode claims covering about 468 ha (1,156 acres) (Table 3-4). i-80 Gold Corp also owns, through its subsidiaries, fee surface land parcels covering about 777 ha (1,920 acres).

Table 3-3: Owned Unpatented Claims, Granite Creek Project


Claim Name


Location


BLM Legacy Number


Claim Type

   Number
of Claims
 

PACIFIC #1A - #7A

   Section 28 of Township 38 North, Range 42 East    NMC319814 -NMC 319820    Lode      7  

CX #1A - CX #23A

   Section 28 of Township 38 North, Range 42 East    NMC319833 -NMC319855    Lode      23  

PINSON #1A - #18A

   Section 32 of Township 38 North, Range 42 East    NMC319856 -NMC319873    Lode      18  

Total Owned Unpatented Claims

     48  

Source: SRK, 2026

Table 3-4: Leased Unpatented Claims, Granite Creek Project


Claim Name


Location


BLM Legacy Number


Claim Type

   Number of Claims  

NEW BEE DEE FRAC. #1, #2

   Section 32 of Township 38 North, Range 42 East   

NMC282121, NMC282122


Lode

     2  

BEE DEE #21 -BEE DEE #56


NMC282123 -NMC282158


Lode

     36  

BEE DEE #1A


NMC319892 -NMC319909


Lode

     18  

Total Leased Unpatented Claims

     56  

Source: SRK, 2026


September 2026


SRK Consulting (U.S.), Inc.

SEC Technical Report Summary – Granite Creek

   Page 22


3.2.1

Owned Unpatented Mining Claims

i-80, through OMC, owns a 100% interest in the Pacific #1A-7A as well as the CX1A-23A unpatented mining claims.

i-80, through OMC and PGU, owns a 91.67% interest in the Pinson #1A-18A mining claims. The remaining 8.33% interest in these claims is owned by Michael Murphy and is not leased by OMC. The fact that OMC has not leased the unowned 8.33% interest in these claims does not preclude OMC from mining the claims. By law, OMC, as the co-owner of an undivided interest in these claims, has the right to mine the claims without permission or approval from (and even over any objections by) the other co-owner, subject, however, to an obligation on the part of OMC to account to the other co-owner for their proportionate shares of mining revenues less their proportionate shares of mining expenses.


3.2.2

Leased Unpatented Mining Claims

Pursuant to a mining lease agreement from May 9, 1980, which has a term that extends until May 9, 2040, i-80, through OMC as current lessee thereunder, controls a 100% interest in the Bee Dee group of unpatented mining claims listed in Table 3-4 above. Following subsequent assignments and corporate transactions, Franco-Nevada U.S. Corporation (50%) and S&G Pinson, LLC (50%) (“S&G Pinson”) are the current lessors under this lease (the “Bee Dee Lease Agreement”).


3.2.3

Fee Lands

“Fee land” refers to privately owned real property in which title has passed out of United States government ownership. Fee land at the Granite Creek Project is identified by Humboldt County Assessor’s Parcel Number (APN) and, unless otherwise stated, comprises both the surface estate and the mineral estate. Fee land is distinguished from unpatented federal lode mining claims, which are possessory interests in federal land administered by the BLM and remain subject to annual maintenance obligations.

i-80, through OMC, owns a 100% interest in Sections 29 and 33, Township 38 North, Range 42 East.

i-80, through OMC and PGU, also owns a 91.67% interest in the 120-acre (48.5-ha) parcel comprising the east 12 of the southwest 14 and southeast 14 of the southwest 14 of Section 28, Township 38 North, Range 42 East. The remaining interest in this parcel is owned by Michael Murphy (8.33% undivided interest).


3.3

Royalties and Net Profit Interests

The Granite Creek Mine Project is subject to several net smelter royalty obligations, each with specific areas of applicability within the Property and with rates that vary based on location or any pre-existing royalties on the land in question. In addition, there is one mineral production royalty agreement (the “MRPA”, defined further below) which provides the counterparty with a 10% “net profits” interest (also as described further below) and is not contingent merely on production like a typical net smelter royalty agreement.

For the purposes of the economic analysis contained in this Report—which is restricted to the estimated mineral reserves for the underground project at Granite Creek—the total combined applicable royalty is expected to be 7.5% until January 2031 and 9% thereafter. This total payable NSR and 10% “net profit” interest is based on the following facts and qualifications:


The currently anticipated underground operations will impact areas under the Pacific Claims and portions of the fee lands included in Section 29.


September 2026


SRK Consulting (U.S.), Inc.

SEC Technical Report Summary – Granite Creek

   Page 23


The current 7.5% combined royalty applicable to the Pacific Claims and the Section 29 fee lands includes 1% NSR and 3% NSR, respectively, owing under the 1996 Royal Gold Royalty:


0.17% of the royalty owing under the Section 29 fee lands is payable by the minority owner of this privately held land and not OMC.


A Franco Nevada royalty (described further below) of 1.5% included within this 7.5% NSR estimate increases to a 3% NSR effective January 2031.


Applying the gold price assumptions used in this Report for the anticipated life of mine economic analysis included in Chapter 22 (US$2,750 per gold oz), it is not anticipated that any “net profits” will be payable under the MRPA. However, if future gold prices are materially higher than as projected within this Report, then payments under this MRPA may be triggered.

The following section describes the royalties present on the various land rights within the Granite Creek Property.


3.3.1

1996 Royal Gold Royalty – Granite Creek Property (Royal Gold, Inc. – Current Holder)

In a NSR Royalty Agreement dated November 30, 1996, Pinson Mining Company (PMC) agreed to provide Rayrock Mines, Inc. et al. an overriding NSR royalty that varied depending on the nature of the particular land holding and any underlying royalties existing on that land at the time of the transaction. Through a series of subsequent deeds, transfers and corporate transactions this royalty interest is now held by Royal Gold, Inc. (which holds a 97.9% interest) and D.M. Duncan Inc. (which holds the remaining 2.1% interest), hereinafter referred to as the “1996 Royal Gold Royalty”.

The royalty under this agreement applies to the entire Granite Creek Property, but it is not payable until 200,000 troy ounces (oz) of gold have been produced. Currently, based on historical production at Granite Creek post the execution of this NSR Royalty Agreement, the 200,000 oz threshold has now been reached, and this royalty is currently payable.

As noted, the royalty under this 1996 NSR Royalty Agreement is dependent on the land involved and, as applicable, any pre-existing royalty arrangements affixed to said lands. In practical terms it applies as follows:


Fee lands owned by PMC at November 30, 1996—which includes all current fee lands now owned by OMC—the 1996 Royal Gold Royalty holders receive a 2.5% royalty on parcels not subject to an underlying or pre-existing royalty, and a 0.5% royalty on parcels subject to an underlying or pre-existing royalty, which increases to a 1% NSR royalty if the average gross value per ton of ore produced is greater than US$175/ton (which is currently the case at the time of this Report)


Fee lands leased by PMC at November 30, 1996 - the royalty varies from a minimum of 0.5% to a maximum of 5% depending on any underlying royalty. The royalty percentage is determined by the difference between a total royalty load of 6% less any underlying royalty; however, the royalty will never exceed 5% or be reduced to less than 0.5%. For example, if the underlying royalty is 4%, then the Royal Gold Royalty would be 6% less 4%, resulting in a 2% royalty payable to the holders of the Royal Gold Royalty. If the underlying royalty is 0.5%, the Royal Gold Royalty would be 6% less 0.5% equaling 5.5%, which is greater than 5%, thus reducing the applicable royalty rate to 5%. If the underlying royalty is 6% or greater, the Royal Gold Royalty rate is limited to 0.5%


September 2026


SRK Consulting (U.S.), Inc.

SEC Technical Report Summary – Granite Creek

   Page 24


Unpatented lode mining claims owned by PMC at November 30, 1996 – which includes all current claims other than the BeeDee claims within the Property—the royalty is 2.5% with a provision to further reduce this royalty if the U.S. Federal Government were ever to impose a “federal royalty payment obligation” on said claims, subject to a minimum 1.0% NSR in all instances


Unpatented lode mining claims leased by PMC at November 30, 1996 – which is comprised only of the BeeDee claims – the royalty percentage is determined by the difference between a total royalty load of 6% less than the underlying royalty; however, the royalty will never exceed 5% or be reduced to less than 0.5% (as further articulated under (ii) above)


3.3.2

2026 Franco- Nevada Royalty – Granite Creek Property – 1.5% to 3% NSR

On March 16, 2026, the Company entered into a net smelter return royalty financing arrangement with Franco-Nevada U.S. Corporation (“FN USA”), granting a perpetual royalty on production from the Company’s Granite Creek project area (the “FN NSR Royalty”). The royalty rate is 1.5% of net smelter returns through December 31, 2030, increasing to 3.0% thereafter. The royalty is payable monthly in cash or in-kind as refined gold or silver at Franco-Nevada’s election.


3.3.3

Pinson Private Royalty – Pinson Claims – 3.125% NSR (Noceto, Phillips, Murphy—Current Holders) & 0.17% NSR (FN USA & S&G Pinson – Current Holders)

Pursuant to a mining lease agreement dated May 27, 1980, certain lands were leased to Cordilleran Explorations general partnership which included the Pinson unpatented mining claims described in Table 3-1 and Table 3-3 above (the “Pinson Lease”). Through subsequent transfers and conveyances, the Pinson claims are now 91.67% owned by i-80 (through its wholly owned subsidiaries OMC and PG USA). As part of the acquisition of the Pinson claims, three individuals, specifically. Mrs. Barbara P. Noceto, Mrs. Patricia Phillips and Mrs. Kate Murphy, conveyed their interest by way of Deed in exchange for a reserved NSR proportionate to their ownership interest in the Pinson claims at that time. Other conveyances from original counterparties under the Pinson Lease similarly conveyed their interests in exchange for a reserved 2% NSR proportionate to their ownership interest which currently equates to a 0.17% NSR royalty interest now held by FN USA and S&G Pinson in equal shares.


3.3.4

Pinson Royalty – Section 21 Bee Dee 21-56 Claims – 0.5% NSR (Pinson Mining Company – Current Holder)

By way of a NSR Royalty Deed dated May 6, 2022, Nevada Gold Mines LLC grants owned and leased lands – including those in Section 21 and the Bee Dee 21-56 unpatented mining claims – to Pinson Mining Company and in exchange reserves a 0.5% NSR royalty interest in production emanating from these lands.


September 2026


SRK Consulting (U.S.), Inc.

SEC Technical Report Summary – Granite Creek

   Page 25


3.3.5

2001 Royal Gold Royalty – Section 21, 29 & Pacific Claims – 3-5% NSR (Royal Gold Inc.—Current Holder)

By way of a Deed dated September 14, 2001, Cordilleran Explorations partnership (“Cordilleran”), the original developer of the Property, agreed to deed (or convey) certain properties – including al the patented lands in Section 21 and 29 of Township 38 North, Range 42 East, as well as the unpatented Pacific Claims (1A-7A – the “Pacific Claims”) to Pinson Mining Company (PMC), all within the current Property area. In exchange, Cordilleran retained a 3% NSR on Section 21 and 29 fee lands and a 5% NSR over the Pacific Claims Similar to the 1996 Royal Gold Royalty, following a series of subsequent deeds and transfers, Royal Gold, Inc. is the current owner of the 2001 Cordilleran Royalty – hereinafter the “2001 Royal Gold Royalty”.


3.3.6

Goldfield Royalty – Section 33 – 2% NSR (FN USA—Current Holder)

By way of a Special Warranty Deed dated November 11, 1981, The Goldfield Corporation sold and conveyed certain properties – including all of the fee lands within Section 33 of Township 38 North, Range 42 East – in exchange for reserving a 2% NSR royalty over any production from said lands (the “Goldfield Royalty”). Section 33 is now owned by OMC and the Goldfield Royalty is now owed to Franco Nevada U.S. Corporation.


3.3.7

Bee Dee Reserved Royalty—Bee Dee Claims—2% NSR Royalty (FN USA (50%) and S&G Pinson, LLC (50%) – Current Holders)

As described in 4.2.2 above, OMC controls a 100% interest in the 56 Bee Dee unpatented federal lode mining claims by way of the Bee Dee Lease Agreement. The Bee Dee Lease Agreement imposes a 2% net smelter returns (NSR) royalty on the Bee Dee claims in favor of the current lessors.


3.3.8

Section 28 Private Royalty – Section 28 Fee lands—2% NSR (Murphy, Noceto, Phillips, D. and J. Christison – Current Holders)

Pursuant to a mining lease agreement dated May 27, 1980, certain lands were leased to Cordilleran Explorations general partnership from the original which included the fee lands within Section 28 of Township 38 North, Range 42 East as described in Table 3-1 above. Through subsequent transfers and conveyances, the fee lands within Section 28 are now 91.67% owned by i-80 (through its wholly owned subsidiaries OMC and PG USA). As part of the acquisition of the Section 28 fee lands, five individuals noted above, conveyed their interest by way of Deed in exchange for a reserved NSR proportionate to their ownership interest in the Pinson claims at that time. As a result, gold production from the Section 28 fee lands is subject to a 2% NSR royalty interest to the private parties noted above


3.3.9

Mineral Production Royalty Agreement – Granite Creek Property—10% Net Profit Interest (NGM—Current Holder)

Pursuant to a mineral production royalty agreement entered into on August 10, 2011, the entire Property is subject to a 10% “net profits” interest royalty, payable to the current counterparty under this agreement, Gold Royalty U.S. Corp. (the “NPI”).

The NPI is triggered after the first 120,000 ounces of gold (and/or the gold-equivalent of other minerals) are produced from the Property and OMC has derived “net profits” from the said operation. Under the terms of the NPI, “net profits” are only derived once all “recoverable costs” have been realized by OMC. Recoverable costs are defined broadly to include all exploration, development and mining related costs – including mine closure and reclamation costs, financing costs and all third-party costs including to government entities and all taxes—incurred by OMC in exploring, developing and operating the Property. The Property has produced approximately 73,500 ounces as of the date of this Report.


September 2026


SRK Consulting (U.S.), Inc.

SEC Technical Report Summary – Granite Creek

   Page 26


3.4

History of Ownership and Prior Mining

The Property has been explored by several individuals and mining/exploration companies since the late 1930’s. The original discovery on the Property was made by Clovis Pinson and Charles Ogee in the mid to late 1930’s, but production did not occur until after World War II, when ore from the original discovery was shipped to and processed at the Getchell mine mill. In 1949 and 1950, total production from the Granite Creek Mine amounted to approximately 9,071 t (10,000 st) grading approximately 0.14 ounces per ton (opt) (4.8 g/t).


3.5

Environmental Liabilities

The Granite Creek Project’s principal identified environmental liability is the 2025 discovery of petroleum-contaminated soil within CX Pit waste rock backfill; because the affected material’s exact location is unknown, as much as 1.17 million tons of backfill may require re-handling and remediation. Osgood is developing a management plan with NDEP-BMRR to address it. Beyond this, the project carries a standard reclamation and closure bonding obligation, currently estimated at US$8.64 million under Nevada’s standardized cost model, which will be revised at the next required three-year bond review (2028 to 2029) and is likely to differ from the operator’s actual future closure cost given expected changes in site conditions before the 2032 anticipated closure date. Ongoing water treatment represent continuing costs tied to naturally elevated arsenic and antimony in site dewatering water, and a proven contingency treatment (ferric sulfate dosing) is available should arsenic rise in the post-closure Mag pit lake, though water quality modeling indicates this is unlikely to be needed. A metals attenuation study has been commissioned to support site specific discharge requirements that will be used to optimize operational water treatment costs. Notably, the site’s two legacy tailings storage facilities have already been reclaimed and released from financial assurance requirements and are explicitly not a liability of the current operator.


3.6

Permits and Authorizations

All permits and authorizations necessary to conduct the currently proposed work at the Granite Creek Underground Project have been identified and are already in hand. The project holds a Plan of Operations from the BLM, a Class II Air Quality Operating Permit and Mercury Operating Permit to Construct, two Water Pollution Control Permits (covering the Granite Creek Mine and the Rapid Infiltration Basins), two Nevada Reclamation Permits, a Mining Stormwater General Permit, an Onsite Sewage Disposal System Permit, a Hazardous Materials Permit, and an approved Waters of the United States Jurisdictional Determination from the USACE valid through November 2030. These permits, issued by the BLM, the Nevada Division of Environmental Protection (through its Bureaus of Mining Regulation and Reclamation, Air Pollution Control, and Water Pollution Control), and other applicable agencies, are all currently in good standing. There are no permitting actions pending before either the NDEP or the BLM, and the site is up-to-date on all monitoring obligations tied to these permits.

Based on the information provided, no significant factors or risks were identified that would affect Osgood’s right or ability to perform the proposed work. All permits required for current operations are held and in good standing, with no permitting actions pending before the BLM or NDEP for the current underground operations, and the site is meeting all associated monitoring obligations. The Property’s mixed public / private land tenure is already reflected in the jurisdictional split between the BLM and the state.


September 2026


SRK Consulting (U.S.), Inc.

SEC Technical Report Summary – Granite Creek

   Page 27


4

Accessibility, Climate, Local Resources, Infrastructure and Physiography


4.1

Topography, Elevation and Vegetation

The Project lies in the Basin and Range Province, a structural and physiographic province comprised of generally north to north-northeast trending, fault bounded mountain ranges separated by alluvial filled valleys. The Project is located on the eastern flank of the Osgood Mountains. Topography is gentle to moderate at the Project, ranging from an elevation of 1,475 m (4,840 ft) at the mine offices to 1,676 m (5,500 ft) at the crest of the historic CX pit highwall, and rises steeply to the west over 1,158 m (3,800 ft) to Adam Peak at the top of the Granite Creek drainage. Vegetation is typical of the high desert with sagebrush on the alluvial fans, and juniper on the mountain slopes. Climate, physiography, and local topography do not present any material constraints to underground mining, surface infrastructure development, or year-round operations at the Project. Water rights held by OMC are sufficient for its anticipated underground operations.


4.2

Means of Access

The Project can be reached by traveling east on US Interstate Highway 80 from Winnemucca to the Golconda exit, about 24 km (15 miles), then following Nevada State Route 789 and the Getchell Mine Road northeast about 33.0 km (20.5 miles) to the Granite Creek Mine access road. The last 7.2 km (4.5 miles) is unpaved, well maintained gravel road. Areas of Route 789 are designated open range, and travelers must watch for cattle. The Granite Creek security facility is located about 0.3 km (0.2 miles) west of the intersection with Route 789. Traveling from the east, the Golconda exit lies west of Battle Mountain about 58.7 km (36.5 miles) on Interstate Hwy 80. The route from Battle Mountain passes i-80’s Lone Tree facility, which lies south of the interstate about 31 km (19 miles) west of Battle Mountain. Access to the Granite Creek Project is available year-round, with only minor, short-duration disruptions possible during severe winter snowstorms or summer lightning events.


4.3

Climate and Length of Operating Season

The climate in Humboldt County is typical of the high-desert environment. Typical summer temperatures average roughly 24°C (75°F) with occasional day / night extremes of 41°C (105°F) / 4°C (40°F). Winter temperatures average roughly -1°C (30°F) with occasional day / night extremes ranging 60°F (16°C) / -12°C (-10°F). Average annual precipitation is about 8 inches, the majority of which accumulates as snowfall during the winter months. Typical snow accumulation is roughly 3 inches on average at lower elevations, although occasional large storms may accumulate significantly more for short durations. Mining operations are able to continue year-round with brief pauses for summer lightning storms or unusually heavy winter snowstorms.


4.4

Infrastructure Availability and Sources

Existing infrastructure at the Project includes an office building, dry and warehouse facilities, and a lined stockpile area on the surface. Over 2,743 m (9,000 ft) of underground workings have been completed. The mine is accessed through either of two portals, and dual egress has been established for most areas of the mine; where dual egress is not possible, rescue chambers have been installed. Equipment is repaired in an underground mine shop. Air doors and a ventilation fan provide required air supply to the workings in compliance with Mine Safety and Health Administration (MSHA) standards. Landline telephone and digital subscriber line service are available at the Project site; cellular phone service is also available, but is dependent on the strength of receiving antennas, topography, and lines of sight.


September 2026


SRK Consulting (U.S.), Inc.

SEC Technical Report Summary – Granite Creek

   Page 28


4.4.1

Water

Six deep dewatering wells have been drilled and cased, four of which are currently in operation, with the remaining two scheduled to come online in Q2 2026. Dewatering water not consumed by operations is discharged through pipelines to four permitted rapid infiltration basins (RIBs), two of which have been constructed to date; the existing RIBs and associated pipelines re-infiltrate water produced in mine dewatering into the valley aquifer.


4.4.2

Electricity

Electrical infrastructure suitable for mine operations is installed at the Project.


4.4.3

Personnel

The town of Winnemucca has a population of about 8,400. Some experienced and general labor is available locally and from other small towns in the region. There are several mining operations in the region and, as such, there is always competition for employees.


4.4.4

Supplies

Basic services are available in Winnemucca. Local mining districts have been active since the 1980’s, and mining suppliers and contractors are accustomed to working in the area.


September 2026


SRK Consulting (U.S.), Inc.

SEC Technical Report Summary – Granite Creek

   Page 29


5

History


5.1

Previous Operations

The Property has been explored by several individuals and mining / exploration companies since the late 1930’s. The original discovery on the Property was made by Clovis Pinson and Charles Ogee in the mid to late-1930’s, but production did not occur until after World War II, when ore from the original discovery was shipped to and processed at the Getchell mine mill. In 1949 and 1950, total production from the Granite Creek mine amounted to approximately 9,071 t (10,000 st) grading approximately4.8 g/t (0.14 oz/t) gold.

The Property has had a succession of operators since exploration resumed in 1970: the Cordex I Syndicate and its successor, Pinson Mining Company (PMC), operated the Property from 1970 through the mine’s closure in 2000; Homestake and Barrick held a 50/50 interest in PMC and conducted exploration from 1996 to 2003; Atna Resources Ltd. earned into and then acquired PMC’s joint venture interest between 2004 and 2011 and operated the underground mine from 2012 until it was placed on care and maintenance in June 2013; Osgood Mining Company LLC (OMC), a wholly owned subsidiary of Waterton Global Resources Management, acquired the Project in 2016; and i-80 Gold Corp acquired OMC in April 2021 and has operated the Project since.

Historically, the Granite Creek Mine Project, with small additions from the nearby Preble and Kramer Hill mines, was credited with gold production in excess of 1 million ounces and less than 100,000 oz of silver (Tingley, 1998). PMC independently compiled a record of production and credited the Granite Creek Mine Property with production of 986,000 oz of gold through 1999. Historic production figures for the Granite Creek Mine are compiled from a combination of company records and published sources and may be incomplete or approximate; these figures are presented for historical context only and should not be relied upon as an indication of current Mineral Resources or Mineral Reserves.

i-80 previously completed an Initial Assessment (IA) on the Granite Creek Open Pit Project, reported March 26, 2025; the status of that prior study relative to this Technical Report Summary is addressed in the Report Version Update (Section 2.5).


5.2

Exploration and Development of Previous Owners or Operators

The Cordex I Syndicate leased the Property in 1970 and, following a 1971 surface mapping and sampling program, completed 17 reverse circulation (RC) drillholes in and around the 1940s-era Granite Creek Mine pit, confirming low-grade gold values. An 18th step-out hole intercepted 27.4 m (90 ft) of 5.8 g/t (0.17 oz/t) gold, forming the basis for delineation of the ‘A’ Zone. Cordex and its successor, PMC, explored the Property largely through mapping and geochemical sampling, including a regional mapping program from Preble to Getchell in the late 1970s, a 1:6,000-scale mapping program of the Property in 1983, and 1:2,400-scale mapping of the pit areas through the active life of the mine. PMC began developing the A Pit in 1980 and produced gold in 1981; the B Pit followed in 1982. Step-out drilling in 1982-1983 identified the C and CX Zones northeast of the A Zone, and drilling in 1984 identified an independent fault system that became the core of the Mag deposit, which entered production in 1987. PMC produced from the CX, CX West, and Mag pits into the mid-to-late 1990s, until falling gold prices and erratic mill feed forced closure of the oxide mill in early 1998; all active mining ceased in January 1999 and the Project was officially closed in May 2000.


September 2026


SRK Consulting (U.S.), Inc.

SEC Technical Report Summary – Granite Creek

   Page 30


Homestake and Barrick, having become 50/50 partners in PMC, conducted an exploration program from 1996 to 2000, expending approximately US$12 million exploring the deeper feeder fault zones of the Property for a large, high-grade gold system. The program identified gold mineralization with underground grades but did not identify a deposit of sufficient size to be of development interest, and the partners concluded the program. Barrick acquired Homestake in 2003 and drilled three additional exploration drillholes.

Atna Resources Ltd. acquired an option in August 2004 to earn a 70% joint venture interest in the Property from PMC, completing its earn-in in 2006 after expending the required US$12 million. PMC elected to back-in for an additional 40% interest in April 2006 and spent over US$30 million on surface and underground diamond core and RC drilling, underground drifting, and surface infrastructure (including rapid infiltration basins, a mineralized material stockpile pad, and underground electrical upgrades) before completing its claw-back in early 2009, at which point PMC held 70% and Atna 30% of the joint venture. In September 2011, Atna acquired PMC’s 70% interest outright, along with an evergreen processing agreement with Barrick for processing underground refractory ores at Barrick’s Goldstrike facilities. Underground development commenced in early 2012, and mine ramp-up began in late 2012; a total of 1,832 m (6,011 ft) of primary and secondary development was completed during 2012 and 2013, and approximately 27,216 t (30,000 st) of ore containing 7,900 oz of gold were mined and shipped to off-site processing facilities. The mine was placed on care and maintenance in June 2013, driven primarily by the steep decline in gold prices that year; in May 2014, the underground mine was changed to an intermittent production status to test revised stoping methods and prove mining economics at small production rates.

Osgood Mining Company LLC (OMC), a wholly owned subsidiary of Waterton Global Resources Management, acquired the Project in 2016 and completed drillhole database compilation and verification campaigns, including migration of the Atna database to Maxwell Datashed software (2017) and further verification (2018). In 2016, OMC completed a project-scale structural geology study — surface and underground mapping, historical data review, and cross-section interpretation — that formed the basis of an updated 3D litho-structural model used for the 2020 Mineral Resource estimate (AMC, 2020). From 2017 to 2018, OMC also completed an extensive drill material inventory and salvage program securing available drill core and RC chips. OMC maintained environmental permit compliance throughout its ownership and continued to maintain and improve site infrastructure, including a third-party hydrology and dewatering review that led to pump replacement in 2019 and upgraded dewatering well process controls. In April 2021, i-80 Gold Corp — created as a spinout of Premier Gold Mines Limited’s Nevada assets — acquired OMC from Waterton Global Resources Management, and additional land was purchased the following month. Further land acquisitions followed in 2021 (Section 31 fee land and Christison interests) and 2022 (Section 21 fee land and BEE DEE unpatented claims lessee interest).


September 2026


SRK Consulting (U.S.), Inc.

SEC Technical Report Summary – Granite Creek

   Page 31


6

Geological Setting, Mineralization, and Deposit


6.1

Regional, Local and Property Geology


6.1.1

Regional Geology

The Property is located on the eastern flank of the Osgood Mountains within the Basin and Range tectonic province of northern Nevada (Figure 6-1). The Granite Creek Mine, together with the Preble, Getchell, Turquoise Ridge, and Twin Creeks mines, lies on the Getchell gold trend, which generally strikes northeast-southwest and has been cross-cut by secondary north-south and northwest-southeast-trending structures. Deposits along the trend are hosted in Paleozoic marine sedimentary rocks exposed in the Osgood Mountains, which have been complexly thrust faulted and intruded by the Cretaceous-aged (92 Ma) Osgood Mountains granodiorite stock. Gold mineralization at Granite Creek is characteristic of a Carlin-type gold system, similar to other deposits along the Getchell Trend. These units are unconformably overlain by Miocene volcanic rocks.

The Osgood Mountains Range is underlain by Cambrian Osgood Mountain Quartzite, Cambrian Preble Formation, Ordovician “Comus” Formation and the “upper plate” Valmy Formation. These units are unconformably overlain by the Permian Etchart Formation (Antler Peak Equivalent) of the Roberts Mountains overlap assemblage, and by the Triassic Golconda allochthon. These uppermost units form a belt of outcrops flanking the western and northern sides of the Osgood Range. These rocks have been intruded by the Cretaceous-aged Osgood Mountains granodiorite stock, which forms the core of the Osgood Mountains. Stratigraphy throughout the Osgood Mountains plunges north (Chevillon, et al., 2000). A significant thermal metamorphic aureole surrounds the stock. At least four Paleozoic units, defined by structure, lithology, and age comprise the Osgood Mountains (McLachlan, et al., 2000). These include the:


Autochthonous Cambrian Osgood Mountains Quartzite and Preble Formation and Cambrian to Ordovician Comus Formation


Allochthonous Ordovician Valmy Formation, part of the Roberts Mountains allochthon


Antler overlap sequence including the Mississippian Goughs Canyon Formation, Pennsylvanian Battle Formation, and Pennsylvanian-Permian Etchart Limestone


Allochthonous Pennsylvanian-Permian Farrel Canyon Formation, part of the Golconda allochthon

The autochthonous Cambrian-Ordovician package has been described by Jones (1991, cited in McLachlan et al. 2000) and comprises the Osgood Mountains Quartzite, Preble Formation, and Comus Formation. All these units have undergone regional metamorphism and intense, northwest-directed folding (McLachlan, et al., 2000). At the Getchell Project, these two units are folded together to form the northwest-verging Pinson anticline. The Comus and Preble Formations show distinct facies changes across the district. These units at Turquoise Ridge and Twin Creeks contain tuffs, pillow basalts, and mafic sills, none of which are present in the same units at Granite Creek.

The Roberts Mountains allochthon described by Stenger et al. (1998) is exposed at the Turquoise Ridge and Twin Creeks mines where it has been mapped as the Valmy Formation. The Roberts Mountains allochthon is composed of a thick (299 m (>980 ft)) sequence of mid-ocean ridge basalts and intercalated pelagic sediments that have been thrust over the Twin Creeks member of the Comus Formation (Stenger, et al., 1998). This sequence has not been identified at the Granite Creek Mine but was likely present and eroded prior to the present day.


September 2026


SRK Consulting (U.S.), Inc.

SEC Technical Report Summary – Granite Creek

   Page 32


The Antler overlap sequence in the Osgood Mountains consists of the Pennsylvanian Battle Formation, and Pennsylvanian-Permian Etchart and Adam Peak formations (McLachlan, et al., 2000). The Battle Conglomerate consists of cobbles and quartzite pebbles. The Etchart lies conformably on the Battle and consists of calcareous sandstone underlying fossiliferous limestone. South of the Getchell Project, the Battle and Etchart lie unconformably on the Preble Formation and Osgood Mountain Quartzite (McLachlan, et al., 2000). These units are not present at the Granite Creek Mine Project.

The Golconda allochthon comprises the Mississippian Goughs Canyon and the Pennsylvanian Permian Farrel Canyon formations present along the northwest flank of the Osgood Mountains. The thrust strikes north to northeast from the central part of the range to the Dry Hills in the north (McLachlan, et al., 2000). These units are not present at the Granite Creek Mine Project.


September 2026


SRK Consulting (U.S.), Inc.

SEC Technical Report Summary – Granite Creek

   Page 33


LOGO

Source: SRK, 2026

Figure 6-1: Regional Geology Map


September 2026


SRK Consulting (U.S.), Inc.

SEC Technical Report Summary – Granite Creek

   Page 34


6.1.2

Local Geology

The geology throughout the Osgood Mountains is typified by folded Cambrian-to-Ordovician sedimentary rocks intruded by Cretaceous stocks and cross-cut by later high-angle structural deformation related to Basin and Range extension. The older rocks are overlain by Miocene andesitic basalt, with surrounding fault-bounded basins filled by Quaternary alluvial gravel. The Osgood Mountains trend generally northeast, although at a structural hinge near the Granite Creek Mine the east flank of the range rotates and trends north toward the Getchell mine (Figure 6-2). Gold mineralization is primarily hosted by fine-grained marine sedimentary rocks overlying a large stock of Cretaceous granodiorite. Cambrian-to-Ordovician siliciclastic and carbonate rocks have been intruded by the Cretaceous Osgood Mountains granodiorite, forming large metamorphosed aureoles with several tungsten-bearing skarns, two of which occur on the Property. The Cambrian Osgood Mountains Quartzite is overlain by the Preble Formation and, in turn, the Ordovician Comus Formation; both have been folded into a broad, north-plunging anticline — the Pinson Anticline — which is northeast-plunging and northwest-verging, extends approximately 4.8 km (3 miles) southwest from the Granite Creek Mine, and is cored by the Preble Formation and flanked by the Comus Formation. Gold mineralization on the Property is primarily hosted in the Comus Formation and exhibits strong structural control, with the most important structural feature being the network of faults bordering the escarpment marking the southern and eastern edge of the Osgood granodiorite. This fault system divides into three structural and stratigraphically mineralized zones, the Rangefront, CX, and Mag Zones, each defined by one or more major structural elements.


September 2026


SRK Consulting (U.S.), Inc.

SEC Technical Report Summary – Granite Creek

   Page 35


LOGO

Source: i-80, 2026

Figure 6-2: Local Geology Map


September 2026


SRK Consulting (U.S.), Inc.

SEC Technical Report Summary – Granite Creek

   Page 36


The geology throughout the Osgood Mountains is typified by folded Cambrian-to-Ordovician sedimentary rocks intruded by Cretaceous stocks and cross-cut by later high-angle structural deformation related to Basin and Range extension. The older rocks are overlain by Miocene andesitic basalt, with surrounding fault-bounded basins filled by Quaternary alluvial gravel. The Osgood Mountains trend generally northeast, although at a structural hinge near the Granite Creek Mine the east flank of the range rotates and trends north toward the Getchell mine. Gold mineralization is primarily hosted by fine-grained marine sedimentary rocks overlying a large stock of Cretaceous granodiorite. Cambrian-to-Ordovician siliciclastic and carbonate rocks have been intruded by the Cretaceous Osgood Mountains granodiorite, forming large metamorphosed aureoles with several tungsten-bearing skarns, two of which occur on the Property. The Cambrian Osgood Mountains Quartzite is overlain by the Preble Formation and, in turn, the Ordovician Comus Formation; both have been folded into a broad, north-plunging anticline — the Pinson Anticline — which is northeast-plunging and northwest-verging, extends approximately 4.8 km (3 miles) southwest from the Granite Creek Mine, and is cored by the Preble Formation and flanked by the Comus Formation. Gold mineralization on the Property is primarily hosted in the Comus Formation and exhibits strong structural control, with the most important structural feature being the network of faults bordering the escarpment marking the southern and eastern edge of the Osgood granodiorite. This fault system divides into three structural and stratigraphically mineralized zones — the Rangefront, CX, and Mag Zones — each defined by one or more major structural elements.


6.1.3

Property Geology

In 2022, i-80 Gold Corp created an updated comprehensive geologic model for the Granite Creek Mine Project, incorporating surface and underground mapping, structural analyses, geologic interpretation, and a complete 3D geologic model built in Leapfrog Geo using all available drillhole, surface and underground mapping, televiewer, and structural analysis data. Structure at the Project is highly complex, reflecting multiple deformation events; regional deformation events (the Antler, Sonoma, and Elko orogenies) are likely responsible for the numerous overprinted fabrics and compressional structures observed, which appear to have been dissected and/or reactivated by subsequent Basin and Range extension. i-80 recognizes a west-northwest-verging imbricate thrust system comprising the Rangefront, Adam Peak, Otto, and CX faults, interpreting most of the compressional, westward transport along these faults to have pre-dated emplacement of the Osgood stock. The main structural element on the Property is the Rangefront fault (strike 010° to 045°, dip 60° near-surface shallowing with depth); the Adam Peak and Otto faults are hanging wall splays off its northern extent, and the CX fault (strike 050°, dip 55°) lies to the east. The Mag fault system, on the eastern portion of the Property, trends 335° and is a younger fault system associated with Tertiary extension, with the Mag and Mag West faults forming a horst block (Figure 6-3).

Significant named structural features on the Property include:

Rangefront Zone (RFZ)

A northeast-trending fault zone forming a broad, persistent zone of shearing and brecciation along the Range Front Fault, involving the entire stratigraphic sequence at the Property, including the Cambrian Preble, Ordovician Comus, and Cretaceous granodiorite.

Range Front Fault (RFF)

A prominent 010° to 045° striking normal fault defining the eastern front of the Osgood Mountains, juxtaposing the Comus Formation in the hanging wall against the Preble Formation in the footwall. Originated as a west-verging thrust fault and has been reactivated as a down-to-the-east normal fault of significant, unknown displacement, with a near-surface dip of 60° that shallows with depth.


September 2026


SRK Consulting (U.S.), Inc.

SEC Technical Report Summary – Granite Creek

   Page 37


Adam Peak Fault

A 048° striking hanging wall splay off the Rangefront fault with a near-surface dip of 72° that shallows with depth, reactivated as a normal fault of unknown displacement.

Otto Fault

A 040° striking hanging wall splay off the Rangefront fault with a near-surface dip of 80° that shallows with depth, defined by a zone of discrete anastomosing splays; its on-strike and down-dip extent defines the SPZ fault system.

CX West Fault

A younger offsetting normal fault (strike 245°, dip 70°) with approximately 46 m (150 ft) of displacement, offsetting stratigraphy as well as the Adam Peak and Otto faults in a down-to-the-northwest direction.

Ogee Fault

A 10 to 30 m (100 ft) wide fault zone (strike 070°, dip 85°) juxtaposing the Upper and Lower Comus formations, defined by an anastomosing system of splays and interpreted as a long-lived accommodation zone with multiple phases of reactivation, including recent right-lateral oblique-normal motion of unknown displacement.

Linehole Fault

A through-going southwest-trending normal fault dipping 85° to the northwest with approximately 30 m (100 ft) of displacement, acting as a structural and mineralization boundary on the Property.

LH Fault

A splay off the Linehole fault (strike 030°, dip 80°) with approximately 15 m (50 ft) of normal-sense displacement; its intersection with the Ogee fault is one of the most important and prolific structural intersections on the Property.

CX Fault

A complex zone of brittle fracturing juxtaposing Upper Comus argillite against limestone beds of the Lower Comus, striking approximately 035° to 045° and dipping 55° to 65° southeast. Originated as a west-verging thrust and has been reactivated as a normal fault with an unknown amount of down-to-the-southeast displacement.

SPZ Fault System

Comprises the along-strike and down-dip extent of the Otto fault and its associated splays, trending northeast with a dip of approximately 50° to the southeast. The Upper and Lower Comus formations are often juxtaposed along this suite of faults, with a transition from weakly metamorphosed rock in the hanging wall to more strongly metamorphosed rock in the footwall.

Mag Fault

A younger, through-going normal fault (strike 340°, dip 75°) related to Basin and Range extension, with unknown but interpreted-significant down-to-the-east displacement.


September 2026


SRK Consulting (U.S.), Inc.

SEC Technical Report Summary – Granite Creek

   Page 38


Mag Fault System

A northwest-trending suite of brittle faults defining the Mag pit; its two main faults, the east-northeast dipping Mag fault and the west-southwest dipping Mag West fault, form a horst block within which mineralization is concentrated.

Mineralization at Granite Creek is structurally controlled, with faults the primary control especially in high-grade underground zones, while lithologic contacts, bedding, and folds play an important role in near-surface (open pit) mineralization. High-grade mineralized zones are moderately continuous along faults, with the most prolific zones at structural intersections. Gold mineralization occurs within pyrite in two stages — an early non-ore-pyrite stage and a gold-bearing arsenian pyrite stage — and correlates with arsenic, antimony, mercury, and thallium.

Gold mineralization is primarily hosted by the Upper and Lower Comus Formations (argillite and interbedded argillite/limestone, respectively): the Upper Comus is the primary host in the Mag Zone and hosts most surface resources, and is also locally mineralized within the B, C, CX, CX West, and portions of the RFZ; the Lower Comus hosts most of the high-grade underground resources. Near the Osgood Mountains stock, including in the underground resource areas, host rock has been metamorphosed (argillite to hornfels, limestone to garnet/pyroxene/wollastonite/marble), and higher gold grades typically occur in these metamorphosed rocks along fault zones. The Preble Formation is a poor host for gold mineralization but contains localized gold concentrations where brecciated and adjacent to major fluid conduits. Oxide mineralization (limonite, hematite, and other iron/arsenic oxides) is extensive in the Ogee Zone and CX Fault system to a depth of 457 m (1,500 ft), and more variable within the RFF system, ranging from less than 152 m (500 ft) to 549 m (1,800 ft).

Dimensions and characteristics of the significant mineralized zones on the Property are as follows:

Mag Pit

Hosted by Upper Comus Formation argillite; the mineralized zone is north-northwest oriented, sub-parallel to the Mag Fault, dips east-northeast, and plunges south-southeast. The tabular body has a strike length of approximately 1,219 m (4,000 ft), varies from 61 to 122 m (200 to 400 ft) in width, and has an average down-dip extent of 137 m (450 ft). Mineralization is more disseminated and lower grade than the Rangefront, CX, and Ogee zones, and is spatially associated with decarbonatization, kaolinization, silicification, and quartz veinlets.

Otto-Adam Peak Zone

Defined by the Otto and Adam Peak faults and their associated splays; trends northeast, dips southeast, plunges east-northeast, and is offset down-dip by the CX West fault. Mineralization is moderately continuous, controlled by a network of discrete anastomosing faults and splays within the Lower Comus Formation, with high-grade mineralization at fault intersections. Strike length approximately 152 m (500 ft), vertical extent 213 m (700 ft), average width 23 m (75 ft).

Ogee Zone

An east-northeast trending, near-vertical mineralized zone controlled by the Ogee Fault and associated splays; the upper portion plunges east-northeast at 55° and is strongly oxidized, while the lower portion is near vertical, mostly oxidized, and contains more comingled sulfide. Strike length 122 m (400 ft), vertical extent 457 m (1,500 ft), average width 23 m (75 ft).


September 2026


SRK Consulting (U.S.), Inc.

SEC Technical Report Summary – Granite Creek

   Page 39


South Pacific Zone (SPZ)

A northeast-trending, southeast-dipping zone of high-grade, fault-bound mineralization with a northeast plunge of 45°, controlled by the along-strike and down-dip extent of the Otto fault; highest grades are concentrated along faults juxtaposing the Upper and Lower Comus Formations. Strike length 381 m (1,250 ft), down-dip extent 274 m (900 ft), average width 7.6 m (25 ft).

CX Zone

Consists of both near-surface (open pit) and higher-grade underground mineralization. The near-surface portion is controlled by the through-going CX fault and its splays, is discontinuous, and is associated with pervasive argillization and decarbonatization within the Lower Comus Formation (strike length 1,066 m (3,500 ft), down-dip extent 122 m (400 ft), average width 23 m (75 ft)). The higher-grade underground portion is more tightly structurally controlled along the down-dip section of the CX Fault (strike length 305 m (1,000 ft), down-dip extent 366 m (1,200 ft), average width 12 m (40 ft)).

Rangefront Zone (RFZ)

Pervasively argillized and decarbonatized with intense brecciation along the lower-bounding Range Front Fault; mineralization occurs as discontinuous amorphous bodies within the Comus Formation, with high-grade zones concentrated in the Lower Comus and anomalous mineralization present in the Preble Formation proximal to the RFF. Strike length approximately 290 m (950 ft), down-dip extent 335 m (1,100 ft), average width 30 m (100 ft).

Multiple areas of high-grade gold mineralization are amenable to underground mining methods, including the Otto-Adam Peak, Ogee, SPZ, CW, and Rangefront zones; the current underground operation mines the Otto-Adam Peak and Ogee zones, with 2025 exploration focused on the SPZ, together forming the underground Mineral Resource at the Project.

Alteration assemblages at Granite Creek include silicification, decarbonatization, pyrite, and remobilization of carbon. In the CX Zone (encompassing the A, B, C, CX, and CX West pits), alteration style and intensity vary gradationally: in the B Pit, gold mineralization occurs in fractured shale and silty carbonate that is weakly silicified and clay-altered; in the A Pit, alteration consists of intense silicification of carbonate lithologies and gold-rich jasperoid formation along structures, with gold grains typically less than 5 microns hosted as inclusions in arsenian pyrite; in the C Pit, high-grade material is hosted in decarbonatized carbonates cross-cut by small faults. In the CX Pit, mineralization consists of silica and pyrite replacing carbonate along narrow structures; in the CX-West Pit, mineralization is hosted in strongly calc-silicate carbonates with strong argillic alteration. In the Mag Pit, mineralization is associated with decarbonatization, kaolinization, silicification, and quartz veining, with silicification occurring as replacement of decalcified lithologies and healing of fault gouge and breccia. The RFF Zone displays pervasive argillization and decarbonatization with dissolution collapse breccias and intense shearing, with minor silicification as a broad overprint and calcite veining along the RFF margins (Figure 6-4)


September 2026


SRK Consulting (U.S.), Inc.

SEC Technical Report Summary – Granite Creek

   Page 40


LOGO

Source: SRK, 2026

Figure 6-3: Property Geology Map


September 2026


SRK Consulting (U.S.), Inc.

SEC Technical Report Summary – Granite Creek

   Page 41


LOGO

Source: Chadwick 2002

Figure 6-4: Alteration of the Mag Pit


September 2026


SRK Consulting (U.S.), Inc.

SEC Technical Report Summary – Granite Creek

   Page 42


6.2

Mineral Deposit

The structural setting, alteration mineralogy, and mineralization characteristics of Granite Creek are consistent with Carlin-type deposits.

Carlin-type deposits formed in the mid-Tertiary after the onset of extension in an east-west-trending, subduction-related magmatic belt. The deposits are located along long-lived, deep crustal structures inherited from Late Proterozoic rifting and the formation of a passive margin within Paleozoic carbonate sequences composed of silty limestone to calcareous siltstone. The carbonate sequences are overlain by either structurally controlled siliciclastic sequences controlled by the Early Mississippian-aged Roberts Mountain allochthon or by stratigraphically controlled siliciclastic sequences. The siliciclastic rocks are less permeable than the underlying carbonate rocks, which traps fluids along major structures, causing them to flow laterally into the permeable and reactive carbonate sequences.

Alteration of host carbonate sequences consists of decarbonatization, argillization, and selective silicification, forming jasperoid and causing carbon flooding. Gangue minerals in Carlin-type deposits consist of calcite, siderite, and ferroan dolomites that can occur as geochemical fronts beyond the mineralized zones.

Gold deposition occurs in arsenian pyrite, is hosted within carbonaceous sequences near major high angle structural zones, and is concentrated in structural traps and/or replacement horizons of reactive and permeable sedimentary beds.

Carlin-type deposits typically show enrichment in antimony, arsenic, mercury, and thallium, caused by hydrothermal fluids with temperatures ranging from 180°C (356°F) to 230°C (446°F). The source of fluids is likely deep-seated magmas that release gold-bearing fluids at depths of 10 to 12 km (7 mi). These magmas formed during Eocene slab-rollback of the Farallon plate as upwelling asthenosphere impinged on a strongly metasomatized sub-continental lithospheric mantle. Tertiary dikes associated with mineralization and radiometric age dates between 39 and 42 Ma, along with isotopic data, provide evidence toward this hypothesis. This genetic model represents the prevailing scientific interpretation for Carlin-type gold systems and is based on regional observations and published studies; alternative interpretations may exist.

Structural pathways, reactive rocks, and sources of heat, gold, sulfur, and iron are required for Carlin-type deposits to form. Large regional structures transecting reactive rocks create contacts, faults, and shears; these secondary structures create pathways and traps for hydrothermal and metalliferous fluids. Mineralization at the Granite Creek Project exhibits the key geological, mineralogical, geochemical, and structural characteristics of Carlin-type gold deposits as described above.


6.3

Stratigraphic Column and Local Geology Cross-Section

The stratigraphy of the Osgood Mountains, from youngest to oldest, comprises Quaternary alluvium and basalt; Tertiary andesite/basalt flows, rhyolitic tuffs, chert-shale-rhyolite clastics, and dacite/andesite dikes; the Cretaceous Osgood Mountains granodiorite/quartz diorite stock; Permian-Pennsylvanian Havallah Formation and Etchart Limestone; Pennsylvanian Battle Formation; and Ordovician Valmy and Comus Formations overlying the Cambrian Preble Formation and Osgood Mountain Quartzite. Gold mineralization at the Property is primarily hosted in the Comus Formation, as shown in the stratigraphic column below (Figure 6-5) and the representative cross-section (Figure 6-6), which together illustrate the geometry of mineralization-controlling structural features, including faults and the lithologic contact between the Upper and Lower Comus Formation.


September 2026


SRK Consulting (U.S.), Inc.

SEC Technical Report Summary – Granite Creek

   Page 43


LOGO

Source: SRK, 2026

Figure 6-5: Granite Creek Stratigraphic Column


September 2026


SRK Consulting (U.S.), Inc.

SEC Technical Report Summary – Granite Creek

   Page 44


LOGO

Source: SRK, 2026

Figure 6-6: Cross-section A-A’ looking Northeast showing Structure, Lithology and Mineralization


September 2026


SRK Consulting (U.S.), Inc.

SEC Technical Report Summary – Granite Creek

   Page 45


7

Exploration

Exploration techniques employed on the Property to define additional gold resources have consisted primarily of mapping, geochemical sampling, geophysical surveys, and drilling. Use of these methods has resulted in the discovery of approximately one million ounces of gold in several open pit deposits. Atna became involved in Project planning in July 2004 and began drilling the Property in August 2004 after execution of the earn-in agreement with PMC; i-80 Gold has not performed any new geophysical or surface geochemistry work. Exploration work other than drilling is discussed in Section 7.1; drilling is discussed in Section 7.2; and hydrogeology and geotechnical data relevant to underground mine development are discussed in Sections 7.3 and 7.4.


7.1

Exploration Work (Other Than Drilling)


7.1.1

Procedures and Parameters Relating to the Surveys and Investigations

Cordex and its successor, PMC, explored the Property through geologic mapping and geochemical sampling, including a regional mapping program from the Preble to the Getchell mines in the late 1970’s, a 1:6,000-scale mapping program of the Property in 1983, and a 1:2,400-scale mapping program of the Pinson pit area through the active life of the mine. Bench mapping in the pits occurred during mining and was followed by detailed 1:1,200-scale mapping of the A, B, C, CX, Mag, CX West, and Blue Bell pits by Tom Chadwick starting in 2000, completed under the Homestake / Barrick partnership agreement. In 2016, OMC contracted Robert Leonardson to complete a geological study focused on advancing the understanding of the structural framework and providing exploration targeting guidance, including structural and geologic mapping of the open pits and underground exposures and construction of property-wide cross-sections. Numerous geophysical surveys have also been conducted on the Property, including regional gravity and aeromagnetic surveys and detailed electromagnetic techniques — Induced Polarization (IP), Electromagnetics (EM), Magnetotellurics (MT), and Controlled Source Audio-frequency Magnetotellurics (CSAMT). A detailed gravity survey was conducted by Magee Geophysical Services, LLC of Reno, Nevada in October 2006 (Figure 7-1), acquiring 2,587 gravity readings on a 100 m (328 ft) station spacing over approximately 27 square km (10 square miles); the results were interpreted by Fritz Geophysics in 2007.


September 2026


SRK Consulting (U.S.), Inc.

SEC Technical Report Summary – Granite Creek

   Page 46


LOGO

Source: Magee, 2006

Figure 7-1: Gravity Survey, 2,587 Stations, Magee Geophysical Services, 2006


September 2026


SRK Consulting (U.S.), Inc.

SEC Technical Report Summary – Granite Creek

   Page 47


In 2002, Quantec Geoscience was contracted to acquire TITAN 24 MT data over the Pinson property. Six east-west lines were collected along the Rangefront, spaced on average around 610 m (2,000 ft) apart, with a dipole spacing along line of 91 m (300 ft). Quantec ran regular two-dimensional inversions on the MT data to create resistivity depth sections (Figure 7-2).


September 2026


SRK Consulting (U.S.), Inc.

SEC Technical Report Summary – Granite Creek

   Page 48


LOGO

Source: i-80, 2026

Figure 7-2: Location of the MT Survey Lines on the Geology and Pit Locations (Left) and on the Residual Gravity (Right)


September 2026


SRK Consulting (U.S.), Inc.

SEC Technical Report Summary – Granite Creek

   Page 49


7.1.2

Sampling Methods and Sample Quality

Cordex collected 737 rock chip samples in conjunction with its mapping programs, assayed for gold, silver, arsenic, antimony, and mercury, with select samples also analyzed for lead, zinc, copper, and manganese; the combined mapping/sampling programs were responsible for the discoveries of the Blue Bell and Felix Canyon deposits. PMC completed six float chip geochemical grids consisting of 8,756 samples covering the Mag deposit and along strike south of the A and B Pits. A biogeochemical sagebrush sampling program was conducted in the 1990s with inconclusive results. Under the Homestake/Barrick joint venture, an additional 312 rock samples and 273 soil samples were collected on strike south of the existing pit areas and west of the A, B, C, and CX Pits. For underground channel sampling, Atna channel-sampled 14 ribs in the Ogee Zone and sent 74 rib and face samples out for assay.


7.1.3

Information About the Area Covered

Historic mapping and geochemical sampling programs covered the Property from the Preble to the Getchell mines at regional scale, narrowing to 1:6,000-scale coverage of the Property (1983) and 1:2,400- to 1:1,200-scale coverage of individual pit areas through the active mine life. The 2006 Magee gravity survey covered approximately 27 square km (10 square miles) on a 100 m (328 ft) station spacing (2,587 stations total). The 2002 Quantec TITAN 24 MT survey comprised six east-west lines along the Rangefront, spaced on average around 610 m (2,000 ft) apart, with a 91 m (300 ft) dipole spacing along each line. Underground channel sampling in the Ogee Zone covered 14 ribs.


7.1.4

Significant Results and Interpretation

Mr. Leonardson’s 2016 structural study concluded that potential targets for additional gold mineralization occur at intersections of the east-dipping, north-south faults (Rangefront/Mag) with the southeast-dipping CX-type faults, and at intersections of sub-vertical northwest-striking faults with CX-type faults; zones of limestone decarbonatization, such as those seen in the CX Pit, are also potential hosts for gold mineralization, indicating strong fluid/vapor flow through the rock mass. Identified areas for further exploration include the intersection of the SOS and JP dikes on the south wall of the CX Pit (the largest block of decarbonatization on the Property); the Ogee pipe extension 457 to 549 m (1,500 to 1,800 ft) below the CX-C Pit, where historical hole HPC-070A intersected a 232 m (760 ft) interval of low-to-moderate gold grades with high-grade mineralization near the proposed Ogee high-grade down-dip extension; the northern continuation of the fault-propagated anticline in the western Mag Pit; the intersection of the Adam Peak Fault and the Mag Fault suite north of the Mag Pit; the CX-B Pit decarbonatization zone; and decarbonatization zones on the Mag Pit west wall.


September 2026


SRK Consulting (U.S.), Inc.

SEC Technical Report Summary – Granite Creek

   Page 50


LOGO

Source: Fritz Geophysics, 2007

Figure 7-3: Pinson Local Gravity Interpretation

The existence of about 1,700 drillholes within the gravity survey area allowed a novel approach for interpreting the detailed gravity data (Figure 7-3), correlating basement rock types defined by the basement gravity response with the general mapped geology. In 2008, Barrick interpreted the geophysical survey data at Pinson, combining the 2002 MT survey, the 2006 gravity survey, and all available geological/geochemical information to define target areas requiring drillhole testing. Figure 7-4 through Figure 7-9 show MT resistivity depth inversions for each of the six survey lines, annotated with drilling, surface geological mapping, interpreted sectional geology, and structural targets.


September 2026


SRK Consulting (U.S.), Inc.

SEC Technical Report Summary – Granite Creek

   Page 51


LOGO

Source: i-80, 2026

Figure 7-4: MT Resistivity Depth Inversion for Line 6090


September 2026


SRK Consulting (U.S.), Inc.

SEC Technical Report Summary – Granite Creek

   Page 52


LOGO

Source: i-80, 2026

Figure 7-5: MT Resistivity Depth Inversion for Line 12300


September 2026


SRK Consulting (U.S.), Inc.

SEC Technical Report Summary – Granite Creek

   Page 53


LOGO

Source: i-80, 2026

Figure 7-6: MT Resistivity Depth Inversion for Line 13860


September 2026


SRK Consulting (U.S.), Inc.

SEC Technical Report Summary – Granite Creek

   Page 54


LOGO

Source: i-80, 2026

Figure 7-7: MT Resistivity Depth Inversion for Line 15300


September 2026


SRK Consulting (U.S.), Inc.

SEC Technical Report Summary – Granite Creek

   Page 55


LOGO

Source: i-80, 2026

Figure 7-8: MT Resistivity Depth Inversion for Line 17160


September 2026


SRK Consulting (U.S.), Inc.

SEC Technical Report Summary – Granite Creek

   Page 56


LOGO

Source: i-80, 2026

Figure 7-9: MT Resistivity Depth Inversion for Line 19230


September 2026


SRK Consulting (U.S.), Inc.

SEC Technical Report Summary – Granite Creek

   Page 57


A small exploration drifting program was conducted on the upper ‘B’ zone by Cordex in the 1970s to conduct bulk testing (results unavailable). In May 2005, Small Mine Development (SMD) of Boise, Idaho, was contracted by Atna to drive exploration drifts, crosscuts, and drill stations to evaluate the Range Front and CX resource areas, completing 606 m (1,988 ft) of adit, 115 m (378 ft) of decline, and six diamond drill stations; a mineability test on the newly defined Ogee Zone extracted approximately 363 t (400 st) of material and indicated the possibility of drift-and-fill as a potential mining method. During 2008, approximately 211 m (693 ft) of development drifting was completed with significant geological data recorded in the RFZ. Throughout 2024 and 2025, approximately 173.7 m (570 ft) of development drifting was completed for the South Pacific exploration drill program, which began June 2025 and concluded December 13, 2025, targeting SPZ mineralization with a total of 16,531 m (54,235.7 ft) drilled to pre-feasibility-study-quality resource and reserve declaration density. Salient results of the Ogee Zone channel sample assays are summarized in Table 7-1; assays indicated no high-grade mineralization except where the main drift intersected the Ogee Zone on the 4770 elevation.

Table 7-1: Salient Results of the Ogee Zone Channel Sample Assays


Sample No.


From ft
(m)


To ft
(m)


Length ft
(m)


Gold Grade opt
(g/t)

North Rib

RFUG-055

   76 (23.1)    81 (24.7)    5 (1.5)    0.144 (4.94)

RFUG-056

   81 (24.7)    85 (25.9)    4 (1.2)    0.445 (15.26)

RFUG-059

   85 (25.9)    88 (26.8)    3 (0.9)    0.274 (9.39)

RFUG-061

   88 (26.8)    93 (28.3)    5 (1.5)    1.448 (49.65)

RFUG-063

   93 (28.3)    97 (29.6)    4 (1.2)    0.176 (6.03)

RFUG-064

   97 (29.6)    101 (30.8)    4 (1.2)    0.739 (25.34)

RFUG-067

   101 (30.8)    110 (33.5)    9 (2.7)    0.996 (34.15)

Weighted Average

         34 (10.4)    0.682 (23.38)

South Rib

RFUG-081

   77 (23.5)    80 (24.4)    3 (0.9)    0.106 (3.63)

RFUG-082

   80 (24.4)    83 (25.3)    3 (0.9)    0.065 (2.23)

RFUG-083

   83 (25.3)    93 (28.3)    10 (3)    1.082 (37.10)

RFUG-084

   93 (28.3)    96 (29.3)    3 (0.9)    0.894 (30.65)

RFUG-086

   96 (29.3)    99 (30.2)    3 (0.9)    0.355 (12.17)

RFUG-087

   99 (30.2)    107 (32.6)    8 (2.4)    0.028 (0.96)

RFUG-088

   107 (32.6)    112 (34.1)    5 (1.5)    0.228 (7.82)

Weighted Average

         (10.7)   


7.2

Exploration Drilling


7.2.1

Drilling Type and Extent

Since 1970, a total of 2,083 drillholes totaling 291,312 m (955,747.9 ft) have been drilled within the Property area by previous operators (Figure 7-10) (drillhole data from prior to 1970 is no longer available). PMC and its predecessors, Rayrock Mines and the Cordex Syndicate, account for most of these holes (1,434 holes totaling 168,991.8 m (554,435 ft)); Homestake drilled 165 holes totaling 48,831.3 m (160,207.7 ft) and Barrick drilled 166 holes totaling 37,195 m (122,031 ft), both acting as operators for PMC; Atna, the last company to operate at the Granite Creek Mine prior to i-80, drilled 318 holes totaling 36,293.8 m (119,074.1 ft). Table 7-2 presents a summary of this historical drilling; each period is described in further detail below.


September 2026


SRK Consulting (U.S.), Inc.

SEC Technical Report Summary – Granite Creek

   Page 58


LOGO

Source: i-80, 2026

Figure 7-10: Granite Creek Project Drill Plan by Operator


September 2026


SRK Consulting (U.S.), Inc.

SEC Technical Report Summary – Granite Creek

   Page 59


Table 7-2: Summary of Historical Drilling (pre i-80) on the Granite Creek Property Since 1970


Company

   Surface RC      Surface Core      UG RC      UG Core      Total Holes      Total Footage  
   #
Holes
     Footage
(ft)
     #
Holes
     Footage
(ft)
     #
Holes
     Footage
(ft)
     #
Holes
     Footage
(ft)
 

PMC

     1,426        546,313.0        8        8,122.0                    1,434        554,435.0  

PMC (Homestake)

     136        108,335.0        29        51,872.7                    165        160,207.7  

PMC (Barrick)

     39        35,645.0        67        65,700.1        4        930.0        56        19,756.0        166        122,031.1  

Atna

     29        18,672.0        65        52,847.6        176        32,068.0        48        15,486.5        318        119,074.1  


Total

     1,630        708,965.0        169        178,542.4        180        32,998.0        104        35,242.5        2,083        955,747.9  


Many holes drilled by PMC during this period were development holes drilled in and adjacent to existing pits — over 1,400 holes within the A, B, C, CX, Mag, CX West, Felix, and Blue Bell pit areas, nearly all conventional rotary or RC; the eight core holes drilled (2,475.6 m (8,122 ft)) tested stratigraphy, metallurgy, or deep mineralized structures in the B, C, CX, and Mag Pit areas (Table 7-3).

Table 7-3: PMC Drilling 1970 to 1996


Company

   Surface RC      Surface Core      Total Holes  
   #
Holes
     Footage
(ft)
     Meters
(m)
     #
Holes
     Footage
(ft)
     Meters
(m)
     #
Holes
     Total
Footage

(ft)
     Total
Meters

(m)
 

PMC

     1,426        546,313.0        166,516.2        8        8,122.0        2,475.6        1,434        554,435.0        168,991.8  

Between 1997 and 2000, Homestake, as operator for PMC, drilled 165 holes, of which 136 (33,020.5 m (108,335 ft)) were directed into the CX and RFF system (Table 7-4).

Table 7-4: PMC – Homestake Drilling 1997 to 2000


Company

   Surface RC      Surface Core      Total Holes  
   #
Holes
     Footage
(ft)
     Meters
(m)
     #
Holes
     Footage
(ft)
     Meters
(m)
     #
Holes
     Footage
(ft)
     Meters
(m)
 

PMC (Homestake)

     136        108,335.0        33.020.5        29        51,872.7        15.810.8        165        160,207.7        48,831.3  

Four exploration holes were drilled by Barrick, operator at the time for PMC, to test extensions of the CX Fault Zone near its projected intersection with the Mag Pit fault system; the drilling did not identify significant mineralized zones, and no additional work was conducted by Barrick (Table 7-5).

Table 7-5: PMC – Barrick Drilling 2003


Company

   Surface RC      Surface Core      Total Holes  
   #
Holes
     Footage
(ft)
     Meters
(m)
     #
Holes
     Footage
(ft)
     Meters
(m)
     #
Holes
     Footage
(ft)
     Meters
(m)
 

PMC (Barrick)

     3        3,340.00        1,018.0        1        3,003.30        915.4        4        6,343.30        1,933.4  

Atna’s 2004 drilling followed up on mineralized zones previously identified by PMC and Homestake: 31 holes totaling 9,064.6 m (29,739.5 ft), comprising four RC holes and 27 core holes, with five objectives — improving grade / thickness definition where prior drilling was RC-only, infilling where spacing exceeded 121.9 m (400 ft), expanding mineralized zones laterally and down-dip, obtaining rock quality data, and evaluating previously identified targets. Of the 31 holes, 13 (3,962.4 m (13,000 ft)) tested the CX Fault Zone and 18 (5,102.2 m (16,739.5 ft)) tested the RFF Zone (Table 7-6).


September 2026


SRK Consulting (U.S.), Inc.

SEC Technical Report Summary – Granite Creek

   Page 60


Table 7-6: Atna Drilling 2004


Company

   Surface RC      Surface Core      Total Holes  
   #
Holes
     Footage
(ft)
     Meterage
(m)
     #
Holes
     Footage
(ft)
     Meterage
(m)
     #
Holes
     Total
Footage
(ft)
     Total
Meterage
(m)
 

Atna

     4        2,217.00        675.7        27        27,522.50        8,388.9        31        29,739.50        9,064.6  

The 2005 to 2006 program aimed to define and delineate Measured and Indicated gold Mineral Resources in the upper RFF Zone, testing the zone between 1,524 and 1,341 m (5,000 and 4,400 ft) amsl using both surface and underground drilling: 107 drillholes (16,818.9 m (55,180.1 ft)) in total, including 59 surface holes (12,098.6 m (39,693.6 ft), beginning May 2005) and 48 underground holes (4,720.3 m (15,486.5 ft), beginning September 2005) in the Ogee, CX West, and Range Front targets (Table 7-7).

Table 7-7: Atna Drilling 2005 to 2006


Company

   Surface RC      Surface Core      UG Core      Total Holes  
   #
Holes
     Footage
(ft)
     Meters
(m)
     #
Holes
     Footage
(ft)
     Meters
(m)
     #
Holes
     Footage
(ft)
     Meters
(m)
     #
Holes
     Total
Footage
(ft)
     Meters
(m)
 

Atna

     25        16,455.00        5,015.5        34        23,238.60        7,083.1        48        15,486.50        4,720.3        107        55,180.10        16,818.9  

In August 2007, surface exploration and development drilling began using an Eklund RC drill rig and a Major Drilling core rig, testing portions of the CX and RFF, the Ogee Zone, and the HPR104 area north of the Granite Creek Mine — 23 surface holes (5,765.7 m (18,916.2 ft)) were completed, with disappointing results (only thin, sub-economic zones of underground mining gold grades) (Table 7-8).

Table 7-8: PMC (Barrick) Drilling 2007


Company

   Surface RC      Surface Core      Total Holes  
   #
Holes
     Footage
(ft)
     Meterage
(m)
     #
Holes
     Footage
(ft)
     Meterage
(m)
     Total
Holes
     Total
Footage
     Total
Meterage
(m)
 

PMC (Barrick)

     7        4,935.00        1,504.2        16        13,981.20        4,261.5        23        18,916.20        5,765.7  

Surface drilling began in January 2008 with three core drills and one RC drill testing areas north of the CX West pit and the deep potential of the Getchell Fault system; underground exploration began in April 2008, rehabilitating existing workings and driving exploration headings into the Ogee and CX zones, followed by a second surface program in August 2008 to twin RC holes suspected of downhole contamination. Total 2008 drilling comprised 29 surface RC holes (8,342.4 m (27,370 ft)), 50 surface core holes (14,848.5 m (48,715.6 ft)), four underground RC holes (283.5 m (930 ft)), and 56 underground core holes (6,021.6 m (19,756 ft)). Eight holes drilled north of the Pinson deposit to twin earlier drilling of the Range Front/Linehole Fault intersection (the HPR104 area) could not reproduce the earlier thick low-grade intercept (considered downhole contamination, and removed from the database), though follow-up core drilling intersected thin, higher-grade mineralization structurally controlled by the Linehole Fault/Comus contact. Two deep drillholes (BPIN-010C to 867.3 m (2,845.5 ft) and BPIN-011A to 846.7 m (2,778 ft)) tested deep structural targets identified from the 2006 gravity survey; BPIN-010C returned negative results, while BPIN-011A indicated a narrow, low-grade zone associated with decarbonatization and pyritized sediments (Table 7-9).


September 2026


SRK Consulting (U.S.), Inc.

SEC Technical Report Summary – Granite Creek

   Page 61


Table 7-9: PMC (Barrick) 2008 Drilling


Company

   Surface RC      Surface Core      UG RC      UG Core      Total
Holes
     Total
Footage
 
   #
Holes
     Footage
(ft)
     #
Holes
     Footage
(ft)
     #
Holes
     Footage
(ft)
     #
Holes
     Footage
(ft)
 

PMC (Barrick)

     29        27,370.0        50        48,715.6        4        930.0        56        19,756.0        139        96,771.6  

In 2012, Atna completed four PQ-size core holes (636 m (2,086.5 ft)) to acquire column leach metallurgical samples from the Mag Pit resource area, plus 56 underground exploration RC holes (2,284.5 m (7,495 ft)) in the Ogee Zone (Table 7-10).

Table 7-10: 2012 Atna Mag Pit Core Drilling


Company

   Surface Core      UG RC      Total Holes  
   #
Holes
     Footage
(ft)
     Meters
(m)
     #
Holes
     Footage
(ft)
     Meters
(m)
     #
Holes
     Total Footage
(ft)
     Meters
(m)
 

Atna

     4        2,086.50        636.0        56        7,495.00        2,284.5        60        9,581.50        2,920.4  

Between 2012 and 2015, Atna completed 120 underground RC holes totaling 7,489.9 m (24,573 ft), designed to confirm continuity of mineralization and delineate stope configuration within the Ogee Zone for mining (Table 7-11).

Table 7-11: 2013 to 2015 Atna Underground Development RC Drilling


Company

   UG RC      Total Holes  
   #
Holes
     Footage
(ft)
     Meters
(m)
     #
Holes
     Total Footage
(ft)
     Meters
(m)
 

Atna

     120        24,573.00        7,489.9        120        24,573.00        7,489.9  

Figure 7-11 shows the drill plan of the Property in the area of the 2021 Mineral Resource (red outline), coded by operator and time period, with section lines for the representative vertical sections presented in Section 7.2.3. All drilling described above predates i-80’s involvement — i-80 had not conducted drilling on the Property at the time of the 2021 resource model.


September 2026


SRK Consulting (U.S.), Inc.

SEC Technical Report Summary – Granite Creek

   Page 62


LOGO

Source: i-80, 2026

Figure 7-11: Plan View Section Lines of Granite Creek Mine Project

The Granite Creek land position expanded in 2021, with infill drilling targeting the underground Mineral Resources. Table 7-12 lists the number of holes drilled within the current property boundary by type and operator, including holes drilled from surface and underground and Figure 7-12 throughFigure 7-14 no discoveries have been made beyond the core land package, and holes outside the core land package (all drilled by PMC) serve primarily to augment geological knowledge rather than contribute to the resource estimate.


September 2026


SRK Consulting (U.S.), Inc.

SEC Technical Report Summary – Granite Creek

   Page 63


Table 7-12: Drillholes Within the Current Property Boundary by Type and Operator


Company


Core Holes
(includes RC pre-

collar with Core Tail)

   Core
Footage
     RC
Holes
     RC
Footage
     Total
Holes
     Total
Footage
 

i-80 Gold

   438      306,929        645        99,252        1,083        406,181  

Atna

   113      68,334        205        50,740        318        119,074  

PMC (Barrick)

   123      85,456        43        36,575        166        122,031  

PMC (Homestake)

   29      51,872.7        136        108,335        165        160,208  

PMC

   8      8,122        1,426        546,313        1,434        554,435  


Totals

   711      520,714        2,455        841,215        3,166        1,361,929  


September 2026


SRK Consulting (U.S.), Inc.

SEC Technical Report Summary – Granite Creek

   Page 64


LOGO

Source: SRK, 2026

Figure 7-12: Drilling by Hole Type Completed by PMC


September 2026


SRK Consulting (U.S.), Inc.

SEC Technical Report Summary – Granite Creek

   Page 65


LOGO

Source: SRK, 2026

Figure 7-13: Drilling by Type Completed by PMC with Barrick as Operator


September 2026


SRK Consulting (U.S.), Inc.

SEC Technical Report Summary – Granite Creek

   Page 66


LOGO

Source: SRK, 2026

Figure 7-14: Drilling Completed by Atna

Drilling at Granite Creek is ongoing. The holes drilled by i-80 presented here were drilled from April 2021 through January 2026, with complete assay results by February 17, 2026 (the cutoff date for the current underground resource estimate). i-80 primarily uses core drilling for sample collection, with most surface holes pre-collared using RC down to the water table and completed with HQ-size core, focused mainly on the Ogee and SPZ zones; underground holes were all drilled as HQ-size core, focused on the Otto, Rangefront, Ogee, and SPZ zones. A Cubex RC rig is used by ore control geologists to assist short-term mining decisions. Figure 7-15 shows holes drilled by i-80.


September 2026


SRK Consulting (U.S.), Inc.

SEC Technical Report Summary – Granite Creek

   Page 67


LOGO

Source: SRK, 2026

Figure 7-15: Drilling Completed by i-80


7.2.2

Drilling, Sampling, or Recovery Factors

Initial surface collar locations are based on drill plan targeting, marked in the field by a geologist using a handheld GPS device loaded with coordinates from Leapfrog Geo drill plans; drill rigs are aligned to the planned azimuth and inclination using north-seeking gyroscopic rig alignment tools, re-confirmed by the geologist. A final collar location survey is performed by a professional contractor or i-80 Gold surveyor (UTM NAD83 Zone 11N international feet). Downhole surveys are performed by International Directional Services (IDS) of Elko on 50-foot intervals using a north-seeking gyroscopic downhole survey tool. Reverse circulation (RC) samples are collected by the drill contractor on five-foot intervals through a rotating splitter (cyclone), with contamination minimized by regular cyclone cleaning and sample IDs/footage checked against a written sample log. Core is recovered via wire line core tube, boxed in labeled, partitioned waxed cardboard boxes in sequential order, with wooden blocks marking


September 2026


SRK Consulting (U.S.), Inc.

SEC Technical Report Summary – Granite Creek

   Page 68


run footage and any drilling problems (caving, voids, core tube mismatches). Core recovery is measured as the ratio of recovered core length to drilled run length and has been excellent, at 99% or greater, with any core loss (less than 1 m (2 ft)) limited to zones with stratigraphic voids. The authors believe the drilling procedures are adequate, and there are no drilling, sampling, or recovery factors that could materially impact the accuracy and reliability of the results.


7.2.3

Drilling Results and Interpretation

Figure 7-16 through Figure 7-19 show representative vertical sections through the four Open Pit areas (Mag, CX/C, A, and B), and Figure 7-20 shows a vertical section through the underground resource area, illustrating drilling results by operator and time period.


September 2026


SRK Consulting (U.S.), Inc.

SEC Technical Report Summary – Granite Creek

   Page 69


LOGO

Source: i-80, 2026

Note: Black line is a topographic surface. Not all items listed in the legend are on all sections

Figure 7-16: Vertical Section A-A’ of the Mag Pit Area


September 2026


SRK Consulting (U.S.), Inc.

SEC Technical Report Summary – Granite Creek

   Page 70


LOGO

Source: i-80, 2026

Note: Black line is a topographic surface. Not all items listed in the legend are on all sections.

Figure 7-17: Vertical Section B-B1 of the Pit CX and C Area


September 2026


SRK Consulting (U.S.), Inc.

SEC Technical Report Summary – Granite Creek

   Page 71


LOGO

Source: i-80, 2026

Note: Black line is a topographic surface. Not all items listed in the legend are on all sections

Figure 7-18: Vertical Section C-C1 of the Pit A Area


September 2026


SRK Consulting (U.S.), Inc.

SEC Technical Report Summary – Granite Creek

   Page 72


LOGO

Source: i-80, 2026

Note: Black line is a topographic surface. Not all items listed in the legend are on all sections

Figure 7-19: Vertical Section D-D1 of the Pit B Area


September 2026


SRK Consulting (U.S.), Inc.

SEC Technical Report Summary – Granite Creek

   Page 73


LOGO

Source: i-80, 2026

Note: Black line is a topographic surface. Not all items listed in the legend are on all sections

Figure 7-20: Vertical Section E-E1 of the Underground Resource Area

Example sections showing drilling in the underground resource area are shown in Figure 7-21 through Figure 7-24. Holes drilled by i-80 are labeled with hole name and shown with thicker traces; faults and mineralized envelopes modeled at 0.1 oz Au (3 g) cut-off grade are shown for reference.


September 2026


SRK Consulting (U.S.), Inc.

SEC Technical Report Summary – Granite Creek

   Page 74


LOGO

Source: SRK, 2026

Figure 7-21: Plan View Showing Section Locations through the Underground Resource Area


September 2026


SRK Consulting (U.S.), Inc.

SEC Technical Report Summary – Granite Creek

   Page 75


LOGO

Source: SRK, 2026

Figure 7-22: Section A-A’ Showing Drilling in the CX Zone, 30.5 m (100 ft) thick, looking North


September 2026


SRK Consulting (U.S.), Inc.

SEC Technical Report Summary – Granite Creek

   Page 76


LOGO

Source: SRK, 2026

Figure 7-23: Section B-B’ Showing Drilling in the Otto and Ogee Zones, looking North


September 2026


SRK Consulting (U.S.), Inc.

SEC Technical Report Summary – Granite Creek

   Page 77


LOGO

Source: SRK, 2026

Figure 7-24: Section C-C Showing Drilling in the SPZ, 130 m (100 ft) thick, looking North


September 2026


SRK Consulting (U.S.), Inc.

SEC Technical Report Summary – Granite Creek

   Page 78


7.3

Hydrogeology

The geotechnical database developed by i-80 Gold comprises approximately 6,096 m (20,000 ft) of geotechnically logged core from 40 drillholes, mostly since 2024, intersecting all major geotechnical units relevant to proposed mine development. Hydrogeological data — water table measurements, pore pressure distribution, and groundwater flow direction — are collected in conjunction with exploration and geotechnical investigations, supplemented once mining commenced by in-pit and underground operational data. Groundwater dewatering and monitoring wells are the primary data-collection method, supplemented by pore pressure data from vibrating wire piezometers (VWPs) and hydrologic testing (injection/slug tests, air-lift tests, short- and long-term pumping tests, and spinner logging), analyzed using industry-standard analytical methods. Analytical and numerical groundwater flow models have been developed using hydraulic parameters from testing, 3D geological modeling, and historic site data. From approximately 1980 through 2008, 14 dewatering wells and 42 monitoring wells were completed; from 2022 through 2025, 23 VWPs were installed in the underground mining area, with additional dewatering wells completed or deepened in 2023, 2024, and 2025 to 2026. There are currently 4 active dewatering wells, 41 active monitoring wells, and 16 active VWPs across 6 locations (Figure 7-25), with pumping rates ranging from 100 to 750 gpm.

Monitoring wells are sampled routinely and analyzed for the State of Nevada Profile I suite at certified laboratories (currently Western Environmental Testing Laboratory and Pace Analytical, Reno, NV), per permitting requirements; monitor wells and piezometer-equipped exploration drillholes are monitored for water levels and piezometric heads, and surface water is measured and sampled routinely as required by permits. The Project area has been the subject of multiple hydrogeologic characterization studies by successive owners/operators (WMC 1998, 2000, 2002, and 2005; SWS 2014; Piteau Associates 2018), and more recently i-80 has contracted LRE Water (formerly HydroGeoLogica, now part of Spheros Environmental) for groundwater level and pore pressure monitoring, dewatering well planning and oversight, and groundwater flow modeling (Figure 7-26).


September 2026


SRK Consulting (U.S.), Inc.

SEC Technical Report Summary – Granite Creek

   Page 79


LOGO

Source: i-80, 2026

Figure 7-25: Well Locations


September 2026


SRK Consulting (U.S.), Inc.

SEC Technical Report Summary – Granite Creek

   Page 80


LOGO

Source: i-80, 2026

Figure 7-26: Timeline for Hydrogeologic Characterization with Relationship to Mining


September 2026


SRK Consulting (U.S.), Inc.

SEC Technical Report Summary – Granite Creek

   Page 81


The Granite Creek Mine lies in the Great Basin region of the Basin and Range Physiographic Province, a closed drainage system; Granite Creek is an ephemeral stream sourced from seasonal snowmelt, diverted and routed around the CX Pit and typically infiltrating into permeable alluvial deposits within 762 to 1,500 m (2,500 ft) downgradient, with mean annual flow estimated at 0.28 cfs. High spring flows have historically been routed to the floor of the mined-out A and B pits, infiltrating into the CX shear zone, which is hydrologically connected to the CX Pit and underground development. Two groundwater systems are recognized: an alluvial system, moving south-southeast toward the Humboldt River and well understood from historical monitoring, with saturated alluvium concentrated east and southeast of the Mag Pit; and a bedrock system, controlled predominantly by stratigraphy and geologic structure, with major faults acting as either groundwater flow pathways or gouge-filled barriers, favoring hydraulically isolated fault-bounded bedrock blocks.

The Mag Pit, excavated mostly in Upper Comus calcareous mudstones, siltstones, and carbonaceous shales, was dewatered from 1987 through April 1998 (initially by sumps, then dewatering wells #12 and #13 from 1991), after which the pit lake was rapidly filled in 2000 and has since generally declined with alluvial groundwater levels, reaching an elevation of 1,411.3 m (4,630.3 ft) amsl as of January 2026. The CX Pit and underground mine workings lie along east-northeast-trending, steeply southeast-dipping shear zones in the Lower Comus Formation; the CX block has been dewatered from 2007 to present via four operating dewatering wells (APW-1, BPW-3, BPW-5, and GCW-6) at a combined average rate of approximately 1,450 gpm, supplemented by approximately 1,350 gpm of underground sump pumping. Water from dewatering wells not used operationally is discharged to four permitted rapid infiltration basins (RIBs), with two additional cells constructed in Q2 2026; wells with elevated arsenic (APW-1, BPW-5, GCW-6) require treatment prior to discharge at the Water Treatment Plant (WTP), with a second WTP planned for Q3 2026 to increase capacity to 4,000 gpm.

Spheros Environmental (formerly LRE Water) constructed and calibrated a numerical groundwater flow model to historic water level measurements and passive inflow rates, used to evaluate the effectiveness of current dewatering wells and estimate passive inflow into the underground workings (UGWs) for the current Life of Mine plan through 2032 (Figure 7-27). The model simulates current dewatering wells plus two additional wells (GCW-14 and GCW-15) coming online in Q3 2026 at a conservative 500 gpm each. Passive inflow is predicted at approximately 1,050 gpm in Q1 2026, rising to a maximum of 1,500 gpm in Q1 2029 before leveling as mining progresses primarily within an already-established cone of depression. The model was also used to estimate groundwater elevation at the Otto, Ogee, and SPZ ore bodies, all of which are predicted to remain below their starting vertical centroid elevations, with the SPZ and Ogee expected to see more drawdown than Otto due to greater nearby UGW development and proximity to dewatering wells (Figure 7-28). The model results are considered a reasonable representation of predicted groundwater levels and passive inflow, given good calibration to local historical data; modeling work is ongoing and is being refined as additional data becomes available (Figure 7-29).


September 2026


SRK Consulting (U.S.), Inc.

SEC Technical Report Summary – Granite Creek

   Page 82


LOGO

Source: i-80, 2026

Figure 7-27: Predicted Passive Inflow and Dewatering Well Pumping


September 2026


SRK Consulting (U.S.), Inc.

SEC Technical Report Summary – Granite Creek

   Page 83


LOGO

Source: i-80, 2026

Figure 7-28: Predicted Groundwater Elevation in the Vicinity of Ore Bodies: Otto, Ogee, and South Pacific


September 2026


SRK Consulting (U.S.), Inc.

SEC Technical Report Summary – Granite Creek

   Page 84


LOGO

Source: i-80, 2026

Figure 7-29: Predictive and Passive Inflows from Scenarios One and Two


September 2026


SRK Consulting (U.S.), Inc.

SEC Technical Report Summary – Granite Creek

   Page 85


7.4

Geotechnical Data, Testing and Analysis

The geotechnical database developed by i-80 Gold comprises approximately 6,096 m (20,000 ft) of geotechnically logged core from 40 drillholes distributed throughout the Project area, mostly drilled since 2024 using HQ-diameter core, intersecting all major geotechnical units relevant to proposed mine development (the Upper Comus, Lower Comus, and SPZ fault-hosted mineralization). Geotechnical Rock Mass Rating (RMR) logging was completed on the drill core, providing the basis for geotechnical domains, rock mass classifications, representative design parameters, and ground support recommendations for underground mine development, discussed further in Mining Methods (Item 13). The dataset was supplemented by independent WSP photo-logging of three complete and four partial core holes as part of the data verification program. Rock fabric characterization was completed using optical and acoustic televiewer surveys from 11 drillholes, used to define the orientation and spacing of bedding and major joint sets, develop stereographic projections of the principal structural domains within the Upper and Lower Comus units, and support kinematic analyses of structurally controlled failure mechanisms and excavation orientation assessments. Dedicated core holes were also drilled along the proposed Vent Raise 1 and Vent Raise 2 alignments to support geotechnical stability assessments for those excavations.


7.5

Property Plan View

A plan view of the Property showing drillhole locations, coded by operator and significant time period, is presented as Figure 7.2.1-2.


7.6

Exploration Target

Exploration targets consist of five zones at Granite Creek: the CX Fault depth/north extension, Rangefront and Adam Peak, the Ogee Zone, SPZ infill and depth extension, and the SPZ/ Rangefront /Mag structural intersection.

Rangefront and Ogee are prioritized ahead of active and planned underground development to reduce the risk of mining ahead of drill data, while the CX Fault program advances the known oxide-to-sulfide transition at depth. If successful, the program has the potential to add additional Mineral Resources at Rangefront, Adam Peak, Ogee, and the SPZ / Rangefront / Mag intersection, and to upgrade a portion of the existing SPZ Inferred resource to the indicated category. In addition, mineralization drilled at the CX fault target could result in this area being brought into the mine plan in the near future, allowing flexibility in the mine plan for more active faces and mined tonnage.


September 2026


SRK Consulting (U.S.), Inc.

SEC Technical Report Summary – Granite Creek

   Page 86


8

Sample Preparation, Analysis and Security


8.1

Sample Preparation Methods and Quality Control Measures

The Granite Creek drillhole database comprises two distinct data sets that differ materially in operator, laboratory, analytical method, sample security practice, and QA/QC framework: historical (pre-i-80) drilling conducted between 1970 and 2016 under successive operators (PMC, PMC-Homestake, PMC-Barrick, Atna Resources, and Atna Underground), and i-80 Gold Corp drilling conducted from program inception in April 2021 through Q1 2026. Sample preparation procedures applied prior to shipment for the historical era were not consistently recorded for the earliest programs (PMC 1970-1996); from 1997 onward, core was logged, and split samples (Jones split or equivalent) were prepared for shipment to the contract laboratory of record. Under the i-80 Gold program, diamond core drilling predominates, with reverse-circulation drilling used only for pre-collar sections that are logged but not routinely production-sampled. Core is transferred from the core barrel to a wax-impregnated box at the drill rig, washed, and delivered to i-80 Gold’s Lone Tree core shed for logging and sampling. Logging captures recovery, Rock Quality Designation (RQD), lithology, alteration, oxidation, structure, and sulfide mineralization. Sample intervals are assigned by a project geologist subject to the rules that a sample must not cross a geological contact or an obvious alteration/oxidation boundary, and a sample length must not exceed 3 m (10 ft); average core sample length from 2023 through Q1 2026 has been approximately 1.3 to 1.5 m (4.3 to 4.8 ft). Core is cut lengthwise with a 5 hp diamond saw using a 14-inch diamond-impregnated blade; soft, clay-rich, or rubbly intervals are split rather than sawn to preserve sample integrity. The half-core sample is bagged in a heavy-duty Protexo plastic bag with a stapled paper sample tag, tied closed, and held for collection; the remaining half-core is returned to the original core box and stored under weather-resistant pallet coverings at the Lone Tree facility.

Sample security and chain of custody have been maintained throughout the i-80 Gold program. Sample bags are collected from the Lone Tree core shed directly by laboratory personnel (ALS or MSA, depending on the program year) and transported by the laboratory to its preparation facility. Each sample carries a unique numeric tag stapled to the bag, and bags are tied closed for transport. Each hole is tracked under a dedicated dispatch (prefix MSAGCS25_xxxx for surface and MSAGCU25_xxxx for underground holes processed by MSA Labs) and a corresponding laboratory work-order number. No chain-of-custody breaches have been reported over the period. Drilling activity predating 2005 predates formal documentation of these procedures; sample security practices for the historical era prior to that point are not separately documented in the source records available to the QP.


8.2

Sample Preparation, Assaying and Analytical Procedures

Historical (pre-i-80) sample preparation and analysis were performed by a succession of operator-selected laboratories, summarized in Table 8-1: ALS Chemex (Reno, NV) for PMC-Homestake (1997-2000), crushing to -10 mesh with a 300 g Jones split, pulverizing to -150 mesh, and 30 g fire assay with AA finish (detection limit 5 ppb); American Assay Laboratories (AAL, Sparks, NV) for PMC-Barrick (2000-2008), one-assay-ton fire assay with AA finish and multi-element 69-element aqua-regia ICP-AES analysis; Inspectorate American Laboratories (IAL, Reno, NV; ISO 9002 accredited) for Atna’s surface program (2004-2013), a two-stage crush and 300 g Jones split pulverized to greater than 90% passing -150 mesh with 30 g fire assay and AA finish; and an on-site mine laboratory adjacent to the administration building for Atna’s underground program (2011 to 2016), following the same general jaw-crush/Jones-split/pulverize/30 g fire-assay-charge sequence. No relationship between these historical laboratories and the registrant (i-80 Gold Corp, which did not yet hold the property) is applicable.


September 2026


SRK Consulting (U.S.), Inc.

SEC Technical Report Summary – Granite Creek

   Page 87


Table 8-1: Historical (pre-i-80) Operators, Periods, and Analytical Laboratories at Granite Creek


Operator


Period


Laboratory


Primary Au method

PMC

   1970-1996   

Not recorded


AA on cyanide leach; FA-AA above 0.01 oz/t

PMC-Homestake

   1997-2000   

ALS Chemex (Reno)


30 g FA-AA (Au-AA23); FA-Gravimetric overlimit

PMC-Barrick

   2000-2008   

American Assay Labs (Sparks)


1 AT FA-AA; FA-Gravimetric above 5 ppm

Atna (Surface)

   2004-2013   

Inspectorate American Labs (Reno)


30 g FA-AA; gravimetric above 3 g/t

Atna Underground

   2011-2016   

On-site mine laboratory


30 g FA on -150 mesh pulp

All sample preparation and analytical work performed under i-80 Gold’s tenure has been completed by independent commercial laboratories holding internationally recognized accreditations (ISO/IEC 17025 for analytical testing, ISO 9001 for quality management) — neither laboratory is affiliated with or related to the registrant. ALS (Sparks and Elko, Nevada) was the sole laboratory in 2023 and 2024 and remains in use in parallel with MSA Labs from Q1 2026 for confirmation check-assay work. ALS sample preparation follows protocol PREP-31 (PREP-31AY in 2026): air-drying, whole-sample crushing to better than 70% passing 2 mm, riffle/rotary splitting to a 250 g subsample, and pulverizing to better than 85% passing 75 microns. MSA Labs (355 W River Street, Elko, Nevada) became the principal laboratory in 2025, following codes CRU-CPA (crushing to 2 mm and splitting to 500 g), SPL-410 (riffle splitting to a 250 g subsample), and PPU-510 (pulverizing to better than 85% passing 75 microns). Coarse reject and pulp are retained at the laboratory for follow-up work.

The principal analytical change over the i-80 Gold program has been the transition of the primary gold method from conventional fire assay to Chrysos Photon Assay beginning in 2025. Through 2023 and 2024, gold was determined by ALS method Au-AA23, a 30 g fire-assay fusion with atomic-absorption finish (working range 0.005 to 10 ppm Au), with samples above the upper limit re-assayed by gravimetric finish (Au-GRA21, working range 0.05 to 10,000 ppm); a 35-element aqua-regia/ICP-AES suite (ME-ICP41) was also determined. Beginning in 2025, gold was determined by MSA method CPA-Au-1 (Chrysos Photon Assay, detection limit 0.015 ppm Au), a non-destructive X-ray activation technique analyzing a substantially larger effective sample mass (typically 400 to 600 g) than conventional 30 g fire assay; multi-element analysis under the MSA program uses a four-acid ICP-MS suite (IMS-230, 50-plus elements) with mercury by aqua-regia ICP-MS (IMS-130-Hg). In Q1 2026, the tail of the 2025 underground program was submitted to ALS in parallel with the MSA Photon Assay program (Au-AA23/Au-GRA21, with a 48-element four-acid ICP-MS suite, ME-MS61m); samples from the new iGU26 hole series are excluded from the PFS database cut-off and will be incorporated in future updates.


8.3

Quality Control Procedures/Quality Assurance

From 2005 to 2015, drilling programs under Atna Resources (surface, 2005-2013), Barrick (2005-2008), and the Atna underground operation (2011-2016) incorporated systematic QA/QC sample insertion (certified reference materials [CRMs], blanks, and field and preparation duplicates) into the sample stream; no QA/QC data is available for work conducted prior to 2005. QA/QC performance from these pre-i-80 programs was reviewed in the Granite Creek IA Technical Report (March 2025)


September 2026


SRK Consulting (U.S.), Inc.

SEC Technical Report Summary – Granite Creek

   Page 88


by the previous QP (GRE), and SRK has independently regenerated the historical control charts from the legacy assay database to verify the previous QP’s conclusions (Figure 8.3-1 through Figure 8.3-3). A total of 1,081 CRMs were inserted between 2005 and 2015 (555 by Atna in 2005, 2006, 2013, and 2015; 526 by Barrick in 2007, 2008, and 2012), drawn from thirty-seven Rocklabs (New Zealand) and CDN Resource Laboratories (Vancouver, BC) standards at insertion rates averaging 2.7% (peak 5.5%; generally 1-in-20 to 1-in-25 samples); the principal CRMs, certified gold values, and insertion counts are summarized in Table 8-2. A total of 1,249 blank samples were reviewed, of which 270 exceeded the five-times-detection-limit threshold (maximum 1.02 ppm Au, four notable outliers); the previous QP concluded blank contamination was not material to the resource estimate. A total of 287 duplicate samples were reviewed, with field-duplicate scatter returning an R-squared of 0.93 (increased scatter at higher grades attributed to inhomogeneous coarse-gold distribution); duplicate type is not preserved in the legacy database, so historical pairs are combined under a conservative ±30% field-duplicate envelope (Figure 8-1 through Figure 8-3).

Table 8-2: Historical (pre-i-80) CRMs at Granite Creek — Certified Au Values and Insertion Counts


CRM


Supplier

   Certified Au
(ppm)
     ± SD
(ppm)
     N
(Au inserts)
 

CDN-GS-7J

   CDN Resource Labs      7.34        0.29        194  

OxD57

   Rocklabs      0.413        0.012        181  

CDN-GS-P6E

   CDN Resource Labs      0.572        0.031        163  

CDN-GS-8C

   CDN Resource Labs      8.59        0.52        160  

SF23

   Rocklabs      0.831        0.027        137  

OxH52

   Rocklabs      1.291        0.025        130  

SG31

   Rocklabs      0.996        0.028        116  

OxI54

   Rocklabs      1.868        0.066        113  

CDN-GS-30C

   CDN Resource Labs      32.14        0.89        112  

OxG60

   Rocklabs      1.025        0.028        106  

CDN-GS-P1A

   CDN Resource Labs      0.143        0.008        105  

OxC58

   Rocklabs      0.201        0.007        104  

SJ32

   Rocklabs      2.645        0.068        102  

OxF53

   Rocklabs      0.810        0.029        95  

OxK48

   Rocklabs      3.557        0.042        94  

OxA59

   Rocklabs      0.0817        0.0052        91  

OxN49

   Rocklabs      7.635        0.189        82  

SI25

   Rocklabs      1.801        0.044        68  

SK33

   Rocklabs      4.041        0.103        65  

OxP50

   Rocklabs      14.890        0.493        37  

SN26

   Rocklabs      8.543        0.175        22  

Other (16 Rocklabs / CDN CRMs)

   Rocklabs / CDN      0.024 -14.99 (range)        varies        < 20 each  


September 2026


SRK Consulting (U.S.), Inc.

SEC Technical Report Summary – Granite Creek

   Page 89


LOGO

Source: SRK, 2026

Figure 8-1: Historical Rocklabs CRM Control Chart (OxD57, Representative)


LOGO

Source: SRK, 2026

Figure 8-2: Historical Blank Control Chart, 2005 to 2018


September 2026


SRK Consulting (U.S.), Inc.

SEC Technical Report Summary – Granite Creek

   Page 90


LOGO

Source: SRK, 2026

Figure 8-3: Historical Combined Duplicate Scatter, 2005 to 2018

i-80 Gold Corp acquired the Granite Creek Property in 2021 and commenced drilling in April 2021. From program inception through 2025 (the PFS database cut-off), approximately 1,065 drillholes have been sampled and analyzed under a formal QA/QC program designed and implemented by i-80 Gold Corp. The program is a four-stream design comprising CRMs, coarse blanks, sample (field) duplicates, and preparation duplicates, supplemented by independent third-party check assays — consistent with current industry best practice. From 2023 onward, the program has targeted an overall control-sample insertion rate of 20% of submitted samples (approximately greater than 5% each of CRMs, blanks, and field duplicates, and greater than 2.5% preparation duplicates), exceeding the typical 1-in-20 (5%) per-stream insertion rate observed in recent industry surveys of SK-1300 technical reports. The 2021 and 2022 programs, conducted under a transitional QA/QC framework reviewed by the previous QP, operated at lower aggregate insertion rates of approximately 13% to 21%.


September 2026


SRK Consulting (U.S.), Inc.

SEC Technical Report Summary – Granite Creek

   Page 91


CRMs are inserted at approximately one per twenty samples, with CRM identity rotated to maintain coverage across the expected grade range. Acceptance follows the Shewhart control chart convention: assays within ±2 standard deviations (2SD) of the certified inter-laboratory mean are ‘in control’; assays between 2SD and 3SD are ‘warning’ values triggering batch review; and assays beyond 3SD are treated as batch failures requiring corrective action, using standard deviations published by the CRM supplier (Rocklabs, CDN Resource Laboratories, or Oreas). The CRM catalog has evolved over the program (Table 8-3): the 2021 and 2022 programs used CDN Resource Laboratories Carlin-style standards (CDN-GS-7J, CDN-GS-8C, CDN-GS-30C, CDN-GS-P1A, CDN-GS-P6E); 2024 introduced Oreas Carlin-style standards (OREAS-277, OREAS-279, OREAS-282); and 2025 onward added OREAS-238B, OREAS-241, and OREAS-241B. During QP review, a subset of records carrying a mismatched CRM label were identified as wrong-standard inserts or data-entry transcription errors (rather than genuine laboratory failures) and were excluded from the CRM performance assessment; the issue has been raised with i-80 Gold for database hygiene remediation. SRK has regenerated CRM control charts for each of the principal standards used over the period (Figure 8-4 through Figure 8-9).

Table 8-3: i-80 Gold CRM Catalog Used at Granite Creek, 2021 to 2026 (year-to-date) — Certified Au Values and Insertion Counts


CRM


Supplier


Certified Au (ppm)


± SD (ppm)


n (Au inserts)


Period used


CDN-GS-30C

  CDN Resource Labs     32.14       0.445       500       2021-2025  

CDN-GS-P6E

  CDN Resource Labs     0.572       0.0155       402       2022-2024  

CDN-GS-P2B

  CDN Resource Labs     0.433       0.011       385       2022-2025  

CDN-GS-7J

  CDN Resource Labs     7.34       0.145       354       2022-2026  

OREAS-277

  Oreas     3.39       0.18       258       2024-2026  

OREAS-282

  Oreas     14.05       0.3855       248       2024-2026  

OREAS-279

  Oreas     6.55       0.327       196       2024-2026  

OREAS-238B

  Oreas     3.16       0.10       140       2025-2026  

OREAS-241

  Oreas     7.06       0.15       127       2025-2026  

CDN-GS-P1A

  CDN Resource Labs     0.143       0.012       84       2021-2022  

CDN-GS-8C

  CDN Resource Labs     8.62       0.72       83       2021-2022  

OREAS-241B

  Oreas     7.058       0.163       45       2025-2026  

CDN-GS-20C

  CDN Resource Labs     19.67       0.381       13       2025  

OREAS-273

  Oreas     10.76       0.50       9       2025-2026  

OREAS-264

  Oreas     0.307       0.0185       5       2025  


September 2026


SRK Consulting (U.S.), Inc.

SEC Technical Report Summary – Granite Creek

   Page 92


LOGO

Source: SRK, 2026

Figure 8-4: CDN-GS-7J Control Chart, i-80 Era


LOGO

Source: SRK, 2026

Figure 8-5: CDN-GS-30C Control Chart, i-80 Era


September 2026


SRK Consulting (U.S.), Inc.

SEC Technical Report Summary – Granite Creek

   Page 93


LOGO

Source: SRK, 2026

Figure 8-6: CDN-GS-P6E Control Chart, i-80 Era


LOGO

Source: SRK, 2026

Figure 8-7: OREAS-277 Control Chart, i-80 Era


September 2026


SRK Consulting (U.S.), Inc.

SEC Technical Report Summary – Granite Creek

   Page 94


LOGO

Source: SRK, 2026

Figure 8-8: OREAS-279 Control Chart, i-80 Era


LOGO

Source: SRK, 2026

Figure 8-9: OREAS-282 Control Chart, i-80 Era


September 2026


SRK Consulting (U.S.), Inc.

SEC Technical Report Summary – Granite Creek

   Page 95


Coarse blanks (Vigoro brand crushed marble chips) are inserted to monitor the full sample-preparation circuit for contamination or carry-over, placed where possible directly behind the highest-grade samples in each batch. The acceptance threshold is set at five times the analytical lower limit of detection (LLD; 0.025 ppm Au for the conventional fire-assay methods used through 2024, held at the same conservative level for Photon Assay despite its slightly higher 0.015 ppm Au detection limit); LLDs and thresholds by method are summarized in Table 8-4. The i-80 era blank control chart regenerated by SRK (Figure 8-10) shows 89.8% of blank inserts (2,112 of 2,353) below the 5×LLD design threshold; 241 exceed it. Applying a materiality floor at 10×LLD (0.05 ppm Au) reclassifies 74 of the 241 exceedances as within acceptable range, yielding a revised pass rate of 92.9% (2,186 of 2,353). Of the remaining 167 failures, 128 (76%) were assayed at the Lone Tree in-house laboratory, spread across 2022 through 2025 rather than confined to a single period — discussed further under Opinion on Adequacy as a laboratory-performance matter.

Table 8-4: Lower Limit of Detection (LLD) and 5xLLD Blank Acceptance Threshold by Gold Analytical Method


Method


Lab


LLD (ppm Au)


5×LLD threshold (ppm)

Au-AA23

  ALS   0.005   0.025

Au-GRA21

  ALS   0.05   0.25 (held at 0.025 conservatively)

ME-ICP41

  ALS   0.001   0.005

ME-MS61m

  ALS   0.005   0.025

CPA-Au-1

  MSA   0.015   0.075 (held at 0.025 conservatively)

IMS-230

  MSA   (multi-element)   n/a


LOGO

Source: SRK, 2026

Figure 8-10: i-80 Era Blank Control Chart, 2021 to Q1 2026


September 2026


SRK Consulting (U.S.), Inc.

SEC Technical Report Summary – Granite Creek

   Page 96


Two duplicate streams are run: sample (field) duplicates, prepared at the Lone Tree core shed by quarter-splitting selected core intervals (one quarter primary, one quarter duplicate — chosen over half-core duplication to preserve a portion of the original core for future reference), monitoring in situ sampling variance plus all downstream preparation and assay variance; and preparation duplicates, prepared at the laboratory from the coarse-crushed reject of selected samples, monitoring laboratory preparation and analytical variance alone. The QP applied the duplicate-pair regression framework of Thompson and Howarth (1978), with tolerance envelopes reflecting the additivity of in situ sampling, preparation, and analytical variance across stages: ±10% mean relative difference (MRD) for lab (pulp/analytical) duplicates, ±20% MRD for preparation duplicates, and ±30% MRD for field (quarter-core) duplicates, reflecting the nuggety distribution of gold in Carlin-style mineralization (Table 8-5). Preparation duplicates are additionally expected to return an R-squared of 0.99 or better across the analytical method’s mineralized working range. SRK has regenerated the duplicate scatter plots for the i-80 era (Figure 8-11 through Figure 8-13).

Table 8-5: Duplicate Tolerance Envelopes Applied to the i-80 Gold Drillhole Assay Database


Duplicate type


Variance sources


Envelope (MRD)


Basis

Lab (pulp)   Analytical only    ±10%    QP-adopted basis: 9% RP observed for pulp >2 g/t Au
Preparation   Prep + analytical    ±20%    QP judgment + typical CVAVE for Carlin-style prep
Field
(quarter-core)
  In-situ + prep + analytical    ±30%    QP judgment + typical CVAVE for nuggety Carlin-style gold
Historical (combined)  

Type not preserved in

legacy DB

   ±30%    Conservative; assumes field-equivalent


September 2026


SRK Consulting (U.S.), Inc.

SEC Technical Report Summary – Granite Creek

   Page 97


LOGO

Source: SRK, 2026

Figure 8-11: Field (Quarter-core) Duplicate Scatter, i-80 Era


September 2026


SRK Consulting (U.S.), Inc.

SEC Technical Report Summary – Granite Creek

   Page 98


LOGO

Source: SRK, 2026

Figure 8-12: Preparation (Coarse Reject) Duplicate Scatter, i-80 Era


September 2026


SRK Consulting (U.S.), Inc.

SEC Technical Report Summary – Granite Creek

   Page 99


LOGO

Source: SRK, 2026

Figure 8-13: Lab (Pulp / Analytical) Duplicate Scatter, i-80 Era

Annual QA/QC insertion counts for the 2021 through Q1 2026 i-80 Gold drilling programs are summarized in Table 8-6. The 2021 and 2022 reviews are drawn from the previous QP’s analysis in the Granite Creek IA Technical Report (March 2025); the 2023 through Q1 2026 reviews are based on the eight quarterly QA/QC reports issued by i-80 Gold Corp.


September 2026


SRK Consulting (U.S.), Inc.

SEC Technical Report Summary – Granite Creek

   Page 100


Table 8-6: Annual QA/QC Insertion Summary, i-80 Gold Drillhole Sampling at Granite Creek, 2021 to 2026


Year


Au-method
CRM


Au-method
Blank


Field dup


Prep dup


Lab dup


Check assay


Total


2021

     109        122        89        94        1,568        0        1,982  

2022

     825        844        688        356        683        0        3,396  

2023

     260        169        116        113        78        69        805  

2024

     332        237        152        95        129        54        999  

2025

     970        741        386        388        1,081        411        3,977  

2026 (YTD)

     353        240        99        139        330        9        1,170  


Total

     2,849        2,353        1,530        1,185        3,869        543        12,329  


2021

Approximately 69 holes drilled (20 surface diamond core, 9 metallurgical, 40 underground diamond core). The previous QP reviewed 1,395 drillhole samples with control samples inserted at 3.9% CRMs, 3.7% blanks, 2.4% field duplicates, and 2.7% preparation duplicates using five Carlin-style CDN standards; performance was acceptable, with no systematic CRM bias, blanks predominantly below the detection-limit threshold, and preparation-duplicate R-squared of 0.99.

2022

Approximately 154 holes drilled (30 surface diamond core, 56 underground diamond core, 62 underground production core, 5 underground Cubex, 1 water well). The previous QP reviewed a three-hole, 800-sample sub-set with control samples inserted at 5.9% CRMs, 6.4% blanks, 6.0% field duplicates, and 3.0% preparation duplicates; performance was again acceptable. Beginning with 2023, the QA/QC framework was formalized to the current 20% target insertion rate.

2023

Approximately 278 holes drilled, including a twelve-hole deep SPZ infill program (~5,904 m / 19,369 ft). Control samples were inserted at the 20% program target using CDN-GS-30C, CDN-GS-7J, and CDN-GS-P6E; SRK’s regenerated control charts show no consistent CRM bias, and all duplicate variance fell within acceptance. 69 check-assay samples (8 holes) were submitted to American Assay Laboratories (AAL).

2024

Approximately 185 holes drilled, continuing the deep SPZ infill program. The principal QA/QC change was migration from CDN to Oreas standards (OREAS-277/279/282). One CRM exceedance was investigated and resolved by re-assay; duplicate variance was within acceptance for most pairs. 54 check-assay samples (3 holes) were submitted to AAL.

2025

Approximately 379 holes drilled, marking a substantial expansion with the introduction of underground production drilling. SRK’s regenerated control charts show weighted-average observed-to-certified ratios of 84.6% (Q3) and 98.1% (Q4); OREAS-238B/241/241B remained within ±1.5% of certified in both quarters, while OREAS-282 averaged 82.0% of certified in Q3 before recovering to 96.0% in Q4 — carried forward as a corrective-action item under Opinion on Adequacy, below. 93.7% of 741 blanks returned values below the 5×LLD threshold. Q4 2025 included the program’s first material check-assay round: 209 samples (10.5% QC) submitted to a third-party laboratory, with 93.0% of primaries within ±15% of the check result.


September 2026


SRK Consulting (U.S.), Inc.

SEC Technical Report Summary – Granite Creek

   Page 101


Q1 2026

Drilling continued as the tail of the 2025 SPZ infill campaign and the start of 2026 exploration drilling targeting the Ogee, Otto, Adam Peak, and Range Front fault systems; the PFS database cut-off restricts the dataset to holes iGU25-37, iGU25-37A, and iGU25-38. Two laboratories were used in parallel (MSA for iGS25/iGU25-prefix holes; ALS for the new iGU26 prefix), with overall control-sample insertion of 19.5% (214 of 1,097 samples). ALS blank failures were attributed to minor pulverizer carry-over, with a procedural correction implemented; four OREAS-282 failures on the ALS gravimetric method were due to undersized pulp aliquots, and CRM submitted mass has been increased going forward. A cross-laboratory check assay (24 MSA Photon Assay pulps re-analyzed by ALS fire assay) returned R = 0.9972 with a small negative bias of -3.48% (ALS lower than MSA).

i-80’s Check Sample Report identifies check-assay activity in every year from 2023 onward — 69 samples (8 holes) in 2023, 54 (3 holes) in 2024, 411 (37 holes) in 2025, and 9 (2 holes) in Q1 2026, totaling 543 samples across 49 holes. Lab destination was determined by cross-referencing each sample’s check-side assay-method code against the corporate QC database: the 2023-2024 population (123 samples) is American Assay Laboratories, and the 2025-Q1 2026 population (420 samples) is ALS — both independent third-party laboratories. Across the full 543-sample population, SRK’s check-assay precision analysis (Figure 8-14) found a mean bias of -6.5% and a median of -3.5% (check assay relative to primary), with 75.3% of pairs within ±10%. Documented corrective actions include: re-assay of the bracketed batch following the Q3 2024 OREAS-279 failure (all bracketed primaries confirmed within tolerance on re-run); flagging of a Q1 2024 sample-duplicate failure for follow-up coarse-reject re-assay; instruction to submit twice the prior CRM material mass for check-assay submissions following the Q4 2025 undersized-aliquot findings; and a procedural correction at the ALS pulverizer sequence following the Q1 2026 blank carry-over findings.


September 2026


SRK Consulting (U.S.), Inc.

SEC Technical Report Summary – Granite Creek

   Page 102


LOGO

Source: SRK, 2026

Figure 8-14: Check Sample Report Primary vs. Check Assay Scatter, Au, 2023 to 2026


8.4

Opinion on Adequacy

Based on review of the eight quarterly QA/QC reports issued by i-80 Gold Corp over the period Q3 2023 to Q1 2026, the previous QP’s review of the 2021 and 2022 programs in the Granite Creek IA Technical Report (March 2025), the prior QPs’ reviews of the historical (pre-i-80) data, and the Q1 2026 Photon Assay method-validation study, the QP concludes the following. Historical (pre-i-80) sample preparation, analytical, and QA/QC procedures from 2005 to 2016 are documented in prior technical reports and have been accepted as adequate for mineral resource estimation by all prior QPs, including in the most recent (March 2025) IA Technical Report; no QA/QC data is available for the pre-2005 portion of the historical dataset, but the volume of subsequent drilling under the modern QA/QC framework is sufficient to support the mineral resource estimate without exclusive reliance on the unverified historical data. i-80 Gold sample preparation was performed by independent ISO/IEC 17025-accredited commercial laboratories (ALS Minerals and MSA Labs) using industry-standard preparation protocols appropriate for Carlin-style gold mineralization, consistently delivering the target product (greater than 85% passing 75 microns) with high preparation precision (preparation-duplicate R-squared of 0.99 across the program; 0.9997 in Q1 2026).

Analytical methods used by i-80 Gold over the period are appropriate for the deposit style and grade distribution. The 2021 to 2024 fire-assay approach (Au-AA23 with Au-GRA21 gravimetric overlimit) is the industry-standard method for sediment-hosted gold deposits. The transition to Chrysos Photon Assay from 2025 onward has been independently validated against both conventional Fire Assay and Screen Fire Assay (R-squared of 0.994 or greater; mean bias +3% to +6%, mechanistically explained by larger effective sample mass), and is fit-for-purpose as the primary analytical method for resource


September 2026


SRK Consulting (U.S.), Inc.

SEC Technical Report Summary – Granite Creek

   Page 103


estimation at Granite Creek. The i-80 Gold QA/QC program has consistently achieved or exceeded the design control-sample insertion rate of 20% across the 2023 to Q1 2026 period; the 2021 and 2022 programs operated at lower insertion rates within a transitional framework reviewed and accepted by the previous QP. CRM, blank, and duplicate performance has been within industry-accepted acceptance limits in every quarter, with all identified failures appropriately investigated and corrected, or appropriately accepted; the Q3 2025 OREAS-282 low bias and the concentration of blank exceedances in Lone Tree in-house-assayed batches are the two items the QP has carried forward as ongoing laboratory-performance matters for continued monitoring. Sample security and chain of custody for the i-80 Gold program are appropriate: samples were collected at i-80 Gold Corp’s secure Lone Tree core shed and transported in sealed sample bags directly by laboratory personnel to the preparation facility, with no chain-of-custody breaches reported over the period.

In the QP’s opinion, the sample preparation, analytical, and security procedures used to generate the combined Granite Creek drillhole assay database — historical (1970 to 2016) and i-80 Gold (2021 to Q1 2026) — are adequate to support mineral-resource estimation, and mineral-reserve and economic studies on the property. SRK recommends that every QC sample record (CRM, blank, field duplicate, preparation duplicate, pulp duplicate, and check assay) be flagged in acQuire with its specific QC type and identity at the time of data entry or LIMS import, rather than relying on generic, ambiguous, or system-generated placeholder identifiers; where a standard or blank record cannot be immediately matched to a certified value or known material at the time of entry, it should be flagged explicitly as ‘unresolved, pending confirmation’ rather than left unflagged or carried under a temporary label. SRK further recommends that i-80 and its laboratories capture and retain per-sample analysis order (or equivalent sample-sequence data) alongside QC results, so that future blank exceedances can be evaluated by a carry-over-percentage method rather than the coarser absolute-value materiality floor applied in this report.


8.5

Non-Conventional Industry Practice

In Q1 2026, i-80 Gold Corp commissioned a three-way analytical comparison of MSA Photon Assay (CPA-Au-1), conventional Fire Assay (AAL method IO-FAAu30), and Screen Fire Assay (AAL method G-FASFAu11) to assess whether Photon Assay — a non-destructive, higher-sample-mass technique that is comparatively new relative to conventional fire assay — produces results statistically comparable to the established fire-assay methods, and to characterize any systematic bias. Photon Assay consistently returned slightly higher gold values than both fire-assay variants (a small positive bias of approximately +0.55 ppm Au vs. Screen Fire Assay and +0.69 ppm Au vs. conventional Fire Assay), an effect that is expected and widely documented in the literature, arising from the non-destructive nature of Photon Assay and its substantially larger effective sample mass (typically 400 to 600 g, versus a 30 g fire-assay charge), which better represents coarse-gold and nugget-effect populations. The coefficient of determination exceeded 0.994 against both fire-assay reference methods across the analyzed grade range, and the Bland-Altman limits of agreement are narrow (approximately ±1 to 2 ppm Au) with no grade-dependent behavior. In the QP’s opinion, this validation supports the reliability of Photon Assay as the primary gold analytical method for the Granite Creek resource estimation, with Screen Fire Assay recommended as a supplementary check method on samples flagged for coarse-gold or nugget-effect risk.


September 2026


SRK Consulting (U.S.), Inc.

SEC Technical Report Summary – Granite Creek

   Page 104


9

Data Verification

Data supporting this technical report summary has been verified through two successive programs: a comprehensive verification program completed by GRE in 2021 in support of the Granite Creek IA Technical Report (March 2025), and a further, independent verification program completed by SRK in 2026 in support of this Pre-Feasibility Study, comprising a site inspection, review of i-80’s Standard Operating Procedures, statistical review of the drilling database, and a systematic comparison of the assay database against original laboratory certificates. Both programs are described in Section 9.1.


9.1

Data Verification Procedures

GRE completed a comprehensive, SK-1300-compliant data verification program to support the previously disclosed IA of the Project (Initial Assessment SK-1300 Technical Report, Granite Creek Mine Project, Humboldt County, Nevada, USA, issued March 26, 2025). The GRE QPs carried out an on-site inspection on April 20, 2021, including review of key geological formations, structural controls, and mineralization, confirming that field observations were consistent with existing geological mapping (Osgood, 2016); core and RC sample storage, handling, and condition were also inspected and found appropriate for that level of study. Approximately 752 RC and core sample intervals from four drillholes were visually checked against drill logs and database records, confirming that logged lithologies and sample descriptions accurately matched the physical samples. To verify assay reliability, seven core/chip check samples and two surface rock chip samples were collected and submitted to Hazen Research Inc. for fire assay; the check assays showed excellent correlation with the original results (R-squared approximately 0.99), with a t-Test indicating no statistically significant bias between the original and check datasets. GRE’s Geology QP manually audited roughly 10% of original assay certificates from the 2021 to 2022 drilling campaigns against the digital database and identified no material errors, and recommended that i-80 implement routine automated database audits after significant programs or database updates. Discipline-specific QPs concluded the data were adequate for IA purposes: the Geology QP considered lithology, mineralization, and assay data reasonably accurate and suitable for mineral resource estimation; the Metallurgy QP found the metallurgical test work representative, professionally executed, and appropriate for recovery assumptions; the Mine Planning QP verified key operating and cost assumptions against comparable operations and industry benchmarks; and the Environmental QP confirmed current compliance with Nevada permits and inferred that environmental data met state QA/QC requirements for that study level. Overall, GRE’s QPs reported no limitations or failures in data verification and considered the datasets used in the Granite Creek IA reliable and appropriate for IA-level evaluation.

During February 2026, SRK conducted a site visit and tour of the Granite Creek operation, including underground mine headings and the Lone Tree facility (core processing and sample storage). Mr. Burkett reviewed and discussed with site personnel the site geology, structure, mineralization, drilling, core logging and sampling, density measurements, site security, core and sample storage, and data management procedures; the visit was hosted by a combination of i-80 management and site-based staff, with unrestricted access to all aspects of the Project and all questions satisfactorily addressed by the Company. WSP coordinated and reviewed the 3D structural interpretation and geologic model constructed by i-80, and separately undertook an exercise to calibrate the ventilation model to data collected during the site visit; the data used in the ventilation evaluation is considered adequate for the purpose used in this technical report.


September 2026


SRK Consulting (U.S.), Inc.

SEC Technical Report Summary – Granite Creek

   Page 105


The QP completed a phased approach to verification of the data provided by i-80, comprising a site inspection, review of i-80 Standard Operating Procedures (SOPs), statistical review of the databases, review of mineralized drill core intervals, an underground mine tour focused on active headings in mineralized material, and verification of assay certificates against original laboratory-issued documents; the QP also independently reviewed i-80’s internal quality control program for analytical data and drilling survey confidence. It is the QP’s opinion that the current procedures and protocols in place for data collection and validation are acceptable for use in mineral resource estimation. WSP separately spent two days on site comparing core shed observations of all major lithologic units with conditions underground, the geotechnical logging database, and the geologic model; in-place Cemented Rock-fill (CRF) backfill was observed underground, backfill QA/QC procedures were reviewed, and the CRF backfill QA/QC database was reviewed for completeness and consistency of backfill strength verification over time. The data used in the geotechnical evaluation is considered adequate for the purpose used in this technical report.

As part of the data verification program, the QP conducted an underground mine tour of the Granite Creek operation focused on direct observation of mineralization in active working headings, to visually confirm the geological controls on mineralization, the geometry of the mineralized structures, and the consistency of the lithological and structural relationships captured in the i-80 drillhole database and 3D geological model. The QP visited multiple working headings in mineralized material and directly observed the hanging wall and footwall contacts of the mineralized structures, the character and continuity of vein and breccia textures, the distribution of sulfide and oxide mineralogy, and the structural attitudes of the controlling faults (Figure 9-1 and Figure 9-2). These observations were compared against the i-80 structural and lithological model and used to independently validate the geologic model and the mineralization domaining strategy applied during resource estimation; the character of the mineralization observed in situ is consistent with the logged descriptions, domain boundaries, and assay distributions stored in the database for the corresponding drillhole intervals.


September 2026


SRK Consulting (U.S.), Inc.

SEC Technical Report Summary – Granite Creek

   Page 106


LOGO

Source: SRK, 2026

Figure 9-1: Underground Working Heading at Granite Creek Showing Mineralized Structure with Sample Outline and Drill Pattern Marks Observed During the QP Site Visit


September 2026


SRK Consulting (U.S.), Inc.

SEC Technical Report Summary – Granite Creek

   Page 107


LOGO

Source: SRK, 2026

Figure 9-2: Underground Working Heading at Granite Creek Showing Exposed Mineralized Face Observed During the QP Site Visit


September 2026


SRK Consulting (U.S.), Inc.

SEC Technical Report Summary – Granite Creek

   Page 108


Following the underground tour, the QP spent time at the on-site core logging facility reviewing retained drill core from recent infill and definition drilling, selecting core boxes spanning a range of grade intervals and mineralization styles represented in the resource model. For each interval reviewed, the QP placed printed assay sheets for the corresponding drillhole alongside the core box and cross-checked the visual character of the mineralization against the Au and Ag grades recorded in the database, interval by interval (Figure 9-3 and Figure 9-4). The visual character of the mineralized intervals (degree of structural damage) was consistent with the recorded Au and Ag grades — elevated-grade intervals corresponded to visibly mineralized and damaged core, and low-grade intervals corresponded to weakly mineralized or barren core with little structural deformation; lithology was not part of this review. No discrepancies were identified between the observed mineralization and the corresponding database Au and Ag grades. Together, the mine tour and the core review provided the QP with an independent, field-based check on the integrity of the mineralization-domain and assay data used in mineral resource estimation.


September 2026


SRK Consulting (U.S.), Inc.

SEC Technical Report Summary – Granite Creek

   Page 109


LOGO

Source: SRK, 2026

Figure 9-3: Drill Core from Hole iGS22-07 (1,499 to 1,482 m (581 ft)) with Printed Assay Sheet Used by the QP to Cross-Check Mineralization Against Database-Recorded Au and Ag Grades


September 2026


SRK Consulting (U.S.), Inc.

SEC Technical Report Summary – Granite Creek

   Page 110


LOGO

Source: SRK, 2026

Figure 9-4: Drill Core from Hole iGS23-05 (1,498 to 1,491 m (610 ft)) with Printed Assay Sheet Used by QP to Cross-Check Mineralization Against Database Au and Ag Grades


September 2026


SRK Consulting (U.S.), Inc.

SEC Technical Report Summary – Granite Creek

   Page 111


The QP conducted a systematic comparison of the Au and Ag values stored in the i-80 acQuire drilling database against the original analytical values reported in laboratory certificates issued by ALS Minerals, MSALABS, and American Assay Laboratories (AAL), to confirm that the database accurately reflects the laboratory-reported results with no transcription or data-management errors. The comparison was conducted programmatically using CSV-format laboratory certificate exports: 138 certificate files were processed, encompassing 14,127 sample rows across the surface and underground drilling programs. Database records were matched to certificate entries by sample ID — of the certificate samples, 10,139 were present in the assay database and 3,988 were lab-inserted QC materials (blanks, CRMs, laboratory duplicates) not retained in the project assay table. A 5% discrepancy threshold was applied to flag samples with differing Au or Ag values.

The initial comparison flagged 13 samples exceeding the 5% threshold, all involving the Au value; these were individually reviewed, and the laboratory was contacted for clarification. MSALABS provided updated certificate documentation for the affected Photon Assay jobs, consisting of dedicated Au-only Photon Assay re-run reports issued separately from the primary multi-element certificates for samples flagged as Heterogeneous Block (‘HB’) during the initial Photon Assay screen. Once incorporated, the 13 flagged samples resolved as follows: six samples (MSALABS job ELK2510227) were Photon Assay re-run reconciliations — the database had correctly stored the Au value from the authoritative Au-only re-run certificate, and the initial comparison had referenced only the multi-element certificate without accounting for the sibling re-run file, so no database correction was required; the remaining seven samples (across MSALABS lab jobs ELK2510221, ELK2510270, and ELK2610263) were database discrepancies — drillhole sample rows existing in the database with no assay value populated, despite valid laboratory certificates (six at or below the 0.015 ppm Au detection limit and one at 0.018 ppm Au), representing database ingest gaps rather than transcription errors, now documented and provided to i-80 for re-ingest; given the very low grades and limited count, the impact on the mineral resource estimate is considered negligible. Following resolution of all 13 samples, the comparison was re-run against the updated database and revised certificates, confirming a 99.90% match (7,181 of 7,188 compared samples) between the database Au values and the original laboratory-reported values; the seven residual samples (non-mineralized) were not received prior to the PFS database cut-off date (February 2, 2026).

The QP performed statistical analyses on the drilling database to check for potential erroneous data in the collar, downhole survey, geology/lithology, specific gravity, and assay tables, including descriptive statistics, charting, and review of potential outlier and erroneous data, to identify errors common among drilling databases (zero values, treatment of below-detection-limit values, negative or non-numeric values, extreme outliers, and interpretation of the distribution of mineralization across the Property). As part of the updated Mineral Resource reporting, SRK completed a detailed review of the database provided; through discussion with the i-80 geological team, several issues were noted and addressed prior to modeling. Seven holes (GCPR25-050, GCPR25-309, GCPR24-108, GCPRPR25-054, GCPR25-045, GCPR25-349, GCPR25-330) showed potential downhole contamination with high-grade smearing down the hole; in all but GCPR25-045, selected intervals were reset to trace to avoid local overstatement of gold. Two holes (GCPU22-34 and GCPU22-55) contained low-grade assays within areas of expected grade but had no collar records in hard copy, and were potentially misplaced in the model — these were removed from the estimation dataset. A further hole with a low-grade interval (iGU22-44) was reviewed but kept in place, as records confirmed its location.


September 2026


SRK Consulting (U.S.), Inc.

SEC Technical Report Summary – Granite Creek

   Page 112


i-80 has a well-documented series of SOPs covering core handling, geological and geotechnical logging, sample collection, chain of custody, QA/QC submission protocols, sample preparation and analysis guidelines, and sample retention policy, applicable to all i-80 employees and contractors at any i-80 site including Granite Creek; SOPs are updated on an as-required basis. Data verification occurs prior to incorporation of data into final databases. i-80’s SOPs are listed in Table 9-1, with the sub-sections below summarizing the SOPs reviewed by the QP. The QP reviewed the SOPs and found them to meet SME standards; the SOPs are specifically designed to comply with U.S. SEC S-K 1300 disclosure requirements for exploration projects. During the site visit, core was not being processed, so the QP did not observe site personnel acting in accordance with the SOPs.

Table 9-1: i-80 Standard Operating Procedure List


SOP Protocol


Version


SOP Updated Date

Core Logging Procedure

   Rev. 3    October 2024

Exploration Drill Sampling and Chain of Custody

   v1.2    December 2021

Sampling and Assay Quality Control Guidelines

   v1.2    December 2021

Sample Analysis Guidelines

   v1.2    March 2022

Sample Retention Guidelines

   v1.3    April 2022

Core drilling is carried out by a reputable contractor using a diamond bit and core barrel to obtain runs of up to 3 m (10 ft) (Figure 9-5); the standard diameter for exploration drilling at Granite Creek is HQ (212-inch diameter core). Core boxes are labeled with the hole ID and footage interval and are collected from the drill site daily by i-80 geologists or geotechnicians and transported to the logging facility (Figure 9-6). Sample intervals are selected by the project geologist based on geological interpretation, lithology, alteration, and structural contacts; sample lengths are nominally 1 to 2 m (5 ft) in ore-zone intervals and up to 3 m (10 ft) in waste. Regular samples consist of one half of the core cut lengthwise with a diamond saw, with the remaining half retained in labeled boxes for the life of the project. Sample identifications follow a 13-character alphanumeric format (the Granite Creek underground program prefix is GCEXU, e.g., GCEXU25002980); scannable sample tags are affixed to sample bags, with the sample ID also transcribed by permanent marker as a backup, and each bag sealed with a tie. All samples remain under the control of i-80 management from collection through delivery to the laboratory, stored while awaiting shipment in a secure facility not accessible to unauthorized personnel (Figure 9-7), and transported by i-80 staff or a laboratory-approved carrier.


September 2026


SRK Consulting (U.S.), Inc.

SEC Technical Report Summary – Granite Creek

   Page 113


LOGO

Source: SRK, 2025

Figure 9-5: Diamond Core Saw Station at the Lone Tree Laboratory Facility


September 2026


SRK Consulting (U.S.), Inc.

SEC Technical Report Summary – Granite Creek

   Page 114


LOGO

Source: SRK, 2025

Figure 9-6: Palleted and Tarped Coarse Reject and Core Storage Yard at the Lone Tree Facility


September 2026


SRK Consulting (U.S.), Inc.

SEC Technical Report Summary – Granite Creek

   Page 115


LOGO

Source: SRK, 2025

Figure 9-7: Pulp Sample Storage at the Lone Tree Facility


September 2026


SRK Consulting (U.S.), Inc.

SEC Technical Report Summary – Granite Creek

   Page 116


Prior to logging, core is washed and scrubbed to remove drill fluids and mud, so geological textures can be clearly observed, with core boxes oriented in ascending order and box labels verified for accuracy before logging commences. All geological and geotechnical data are recorded directly in acQuire database software via remote desktop connection to the i-80 server; drillhole metadata (hole ID, start/end dates, actual depth, drilling company, hole type) are entered upon hole completion using the project Drillhole Tracker spreadsheet as the source document. Rock Quality Designation (RQD) is measured for each 2 m (5 ft) interval by summing the lengths of competent core pieces above a minimum threshold (NQ: 0.34 ft; HQ: 0.40 ft; PQ: 0.55 ft), recording total recovery and RQD footage; geological logging captures lithology, alteration, oxidation, sulfide mineralogy, veining, and structures at a level of detail appropriate for resource modeling, with non-overlapping, consecutive logging intervals. Bulk density (specific gravity) is measured using either the wax immersion method or the vacuum sealer method (Figure 9-8), with one density sample selected per stratigraphic unit and increased sampling density in the ore zone and altered intervals; samples are dried for a minimum of two hours before measurement, and density data are recorded directly in acQuire. Core is photographed in labeled boxes after logging and before cutting, taken wet to improve color and texture contrast, and named by hole ID and footage interval for upload to the i-80 SharePoint.


September 2026


SRK Consulting (U.S.), Inc.

SEC Technical Report Summary – Granite Creek

   Page 117


LOGO

Source: SRK, 2025

Figure 9-8: Specific Gravity (Water Immersion) Measurement Station at the Lone Tree Laboratory Facility


September 2026


SRK Consulting (U.S.), Inc.

SEC Technical Report Summary – Granite Creek

   Page 118


Sample preparation is completed at ALS located in Sparks, Nevada; the prepared pulp is a minimum of 30 g, ground to 85% passing 200 mesh, with prepared pulps returned from the commercial laboratory after analysis and stored in a dry, secure location. The primary analytical program for all samples includes: gold fire assay (AuFA) with atomic absorption (AA) finish for all samples (samples returning greater than 10 ppm Au at commercial laboratories are re-analyzed with a gravimetric finish); gold cyanide (AuCN) assay with AA finish for all underground exploration and production samples where AuFA exceeds 2 ppm, and for open-pit samples where AuFA exceeds 0.2 ppm; carbon and sulfur analyses by LECO method (total carbon, carbonate, sulfate sulfur, sulfide sulfur, and total sulfur) on selected exploration and production samples; and multi-element ICP analyses on exploration samples where AuFA exceeds 2 ppm, on all surface exploration samples regardless of gold grade, and on every fourth underground production drillhole, covering a 40-element suite (Ag, Al, As, Ba, Bi, Ca, Cd, Ce, Co, Cr, Cu — total and cyanide-soluble, Fe, Hg, K, Li, Mg, Mn, Mo, Na, Nb, Nd, Ni, P, Pb, Rb, Sb, Sc, Se, Sn, Sr, Te, Th, Tl, U, V, W, Zn, and Zr).

i-80’s QA/QC program is designed to meet the minimum standards of the SME and to comply with U.S. SEC S-K 1300 disclosure requirements, documented in the i-80 Sampling and Assay Quality Control Guidelines (v1.2, December 2021). The overall QA/QC insertion rate is a minimum of 17.5% of total submitted samples, comprising: CRMs — commercial standards supplied by CDN Resource Laboratories (or equivalent), inserted at a minimum rate of 5% of submitted samples with at least two standards of different grades per submission, required to fall within ±3 standard deviations of the certified expected value (failure triggers re-assay of all samples between adjacent passing standards); blanks — coarse marble-chip blank material inserted at a minimum rate of 5%, acceptable when less than five times the laboratory’s gold detection limit, preferentially placed after high-grade standards to detect contamination (failure triggers re-assay of all samples between adjacent passing blanks); and duplicates — field duplicates (second half of split core) at 5% of submitted samples targeting competent rock intervals (±20% relative-difference acceptance, pending accumulation of project-specific variance data), preparation duplicates (coarse reject split at the laboratory) at 2.5% (±15% relative difference), and analytical duplicates (pulp re-split at the laboratory) assessed as required (±10% relative difference). External check analyses are conducted by submitting 5% to 10% of pulps to an independent secondary laboratory using the same digestion and analytical finish as the primary laboratory, acceptable within ±10% accuracy and ±10% precision; serious discrepancies (greater than 15% for fire assay, greater than 20% for cyanide methods) trigger submission to a third ISO-certified laboratory. All QA/QC data are reviewed on receipt of each assay certificate, and no results are released until QA/QC controls are validated; results are compiled and reported quarterly to the i-80 Senior Resource Geologist, including performance statistics for standards, blanks, and duplicates, Thompson-Howarth precision plots, and documentation of any failures, corrective actions, and re-assays.

i-80’s Sample Retention Guidelines (v1.3, April 2022) govern the storage and disposal of all sample materials from the Granite Creek Project: one half of the split diamond drill core is retained in labeled boxes for the life of the project at the Lone Tree core shed; coarse reject material generated during laboratory sample preparation is retained for a minimum of three years, stored in dry conditions (palleted and tarped, or in labeled barrels) to allow retrieval by batch; sample pulps are stored for the life of the project at the Lone Tree Laboratory or commercial laboratory facility; and disposal of coarse reject, core, or sample pulps requires written approval from the VP Geology and must follow i-80 environmental disposal protocols.


September 2026


SRK Consulting (U.S.), Inc.

SEC Technical Report Summary – Granite Creek

   Page 119


9.2

WSP Verification

WSP spent two days on site comparing core shed observations of all major lithologic units with conditions underground, the geotechnical logging database, and the geologic model. Selected core intervals were independently reviewed against available core photographs and geotechnical logging records as part of the data verification process. Observations of in-placed cemented rockfill (CRF) backfill were made underground, backfill QA/QC procedures were reviewed, and the CRF backfill QA/QC database was reviewed for completeness and consistency of backfill strength verification over time. Data used in the geotechnical evaluation is considered adequate for the purpose used in this technical report.

WSP spent one day on site and completed a ventilation assessment including inspection of primary, booster, and auxiliary ventilation systems, as well as a review of active and planned mine workings, haulage routes, escapeways, and proposed ventilation raise locations. Temperature and humidity data were collected for Ventsim model calibration. The data used in the ventilation evaluation is considered adequate for the purpose used in this technical report.


9.3

Limitations

The following items are identified as known limitations on data verification and are accounted for in mineral resource classification by the QP: the QP did not directly supervise or oversee data acquisition of any drilling, logging, or analytical data used in the determination of mineral resources — the QP reviewed summary data, technical reporting, and supporting documentation, and performed independent verification, with all descriptions of procedures and methods provided by i-80; and the QP has not conducted a visit or inspection of the analytical laboratories providing the baseline analytical data supporting resources, though the laboratories used are considered reputable and independent facilities suitable for the analyses performed.


9.4

Opinion on Data Adequacy

It is the QP’s opinion that the data provided by i-80 for the Granite Creek Project are reasonable, reliable, and of acceptable quality and quantity to support the mineral resource estimate and the technical disclosures presented in this Technical Report Summary. The drilling, sampling, sample preparation, analytical, data management, and QA/QC procedures applied at Granite Creek are consistent with SME Best Practice Guidelines and satisfy the disclosure requirements of U.S. SEC S-K 1300. This opinion is based on the data verification activities completed by the QP, summarized as follows: the assay database vs. analytical certificate comparison confirmed a 99.90% match between the i-80 database Au values and the original laboratory certificates across the 7,188 samples available for direct comparison (the seven residual non-mineralized samples were not received prior to the PFS database cut-off date); the underground mine tour, through direct observation of mineralization in active working headings, confirmed the geometry, hanging wall and footwall contacts, and structural controls represented in the i-80 geological model and mineralization domaining; the core inspection, through cross-check of database-recorded Au and Ag grades against retained drill core, confirmed that the database accurately represents the in situ mineralization distribution and grade; and the SOP and QA/QC program review found i-80’s Standard Operating Procedures, QA/QC insertion rates, acceptance criteria, and sample retention practices fit for purpose and consistent with industry best practice. This opinion is subject to the limitations on data verification identified in Section 9.2, which are accounted for in the QP’s mineral resource classification.


September 2026


SRK Consulting (U.S.), Inc.

SEC Technical Report Summary – Granite Creek

   Page 120


10

Mineral Processing and Metallurgical Testing

Metallurgical test work supporting the Granite Creek Underground Project comprises five test programs completed between 2005 and 2026: an initial autoclave pre-treatment program by Dawson Metallurgical Laboratories (2005-2006); a comprehensive sample characterization, comminution, and pressure oxidation test program by FLSmidth (2022-2023); a pilot-scale continuous pressure oxidation program by FLSmidth (2025-2026) on a blended feed representing the early years of commercial operation across three i-80 Gold properties; a pressure oxidation and cyanidation program by SGS focused on the South Pacific Zone (2025-2026); and ongoing bench top autoclave testing performed by the third-party toll milling facility that currently processes Granite Creek Underground production. The nature and extent of this testing (Section 10.1), the representativeness of the samples tested (Section 10.2), the laboratories involved (Section 10.3), the resulting gold recovery estimates (Section 10.4), and the adequacy of the supporting data (Section 10.5) are discussed below. Note that all metallurgical test work described in this section pertains to Granite Creek Underground. Testing on Granite Creek open pit samples is historical. No current metallurgical testing has been completed on Granite Creek Open Pit samples. The current Granite Creek Open Pit work is acceptable for the purposes of resource estimation.


10.1

Metallurgical Testing Programs

A list of the metallurgical test work programs conducted on Granite Creek Underground samples is shown in Table 10-1: an initial autoclave pre-treatment program completed by Dawson Metallurgical Laboratories in 2005 and 2006; a comprehensive sample characterization, comminution, pressure oxidation, and downstream processing program completed by FLSmidth in 2022 and 2023; a continuous pilot-scale pressure oxidation program completed by FLSmidth in 2025 and 2026 on a blended feed representing the early years of commercial operation; a pressure oxidation and cyanidation program completed by SGS in 2025 and 2026 focused on the South Pacific Zone (SPZ); and ongoing bench top autoclave testing performed by the third-party toll milling facility currently processing Granite Creek Underground production. The nature and extent of the testing and analytical procedures used in each program are described below.

Table 10-1: Metallurgical Test Work Programs


Date


Laboratory


Accreditation


Description

2005 / 2006    Dawson Metallurgical Laboratories    No information available. Independent of i80 Gold.    Bench Top Autoclave and CIL
2022    FLSmidth Minerals Testing and Research Center   

No accreditations provided on their website.

Independent of i80 Gold.


Bench Top Autoclave and CIL

Bench Top Roaster and CIL

Continuous Autoclave and CIL

Cyanide Destruction

Solid-Liquid Separation

2025    FLSmidth Minerals Testing and Research Center   

No accreditations provided on their website.

Independent of i80 Gold.


Continuous Autoclave and CIL (blend)

Cyanide Destruction (blend)

Solid-Liquid Separation (blend)

2025    McClelland Laboratories Inc.   

No accreditations provided on their website.

Independent of i80 Gold.

   Sample preparation and particle Size Analysis


September 2026


SRK Consulting (U.S.), Inc.

SEC Technical Report Summary – Granite Creek

   Page 121


2025    SGS Lakefield Research Ltd.   

Conforms to the requirements of the ISO/IEC 17025 standard for specific registered tests.

Independent of i-80 Gold.

   Bench Top Autoclave and CIL
2023 and Ongoing    3rd Party Toll Milling Facility Laboratory   

No accreditations provided on their website.

Independent of i80 Gold.

   Bench Top Autoclave and CIL

Dawson Metallurgical Program (2005-2006)

Dawson Metallurgical Laboratories completed autoclave metallurgical test work programs on samples from the Granite Creek underground workings (Ogee samples) on behalf of Atna (Dawson, 2005; Dawson, 2006a; Dawson, 2006b), reported in an initial 2005 program (Ogee Right Rib/Left Rib and RF Zone samples RF_Met-1, RF_Met-2, and RF_Met-4) followed by a 2006 program (CX Zone samples APCX-204, APCX-211, APCX-219, and APCX-226; the undefined sample AMW-002; and re-tests of the 2005 program’s Met1 and Met2 samples). The objective of both programs was to determine whether the underground samples, identified as refractory, could be treated using autoclave pre-treatment, as Atna was considering contracting with a third party for autoclave treatment and downstream processing of the underground material. The scope of the test work included head assays (gold, sulfur speciation, and carbon speciation), baseline cyanide leach shake-out tests on ground feed samples, and pressure oxidation test work: samples were ground to a P80 of 75 µm or 45 µm, acidulated with sulfuric acid to a pH of 1.8 to 2.0 for one hour to digest carbonate minerals ahead of autoclave treatment (standard methodology for whole-material autoclave treatment in Nevada), then processed in an autoclave at 225°C (437°F) for a one-hour residence time, 35% solids w/w pulp density, and an oxygen overpressure of 3,176 kPa (460 psi). Lime was added to the autoclave residue to raise the pH to 10.0-10.5 prior to a cyanide leach test simulating CIL (carbon-in-leach) processing to determine gold recovery.

FLSmidth Metallurgical Program (2022-2023)

In early 2022, FLSmidth (FLS) was contracted to undertake a series of tests on Granite Creek underground samples, completed in early 2023. The program’s objectives were sample characterization, mineralogical studies, comminution testing, acid/alkaline batch pressure oxidation (POX) followed by batch cyanidation and preg-robbing tests, a continuous POX test followed by batch neutralization, cyanidation, cyanide detoxification, and solids-liquids separation testing, and a batch of POX-CIL tests on three composite blends.

Comminution testing (Bond ball mill work index, BWi) was conducted on selected samples, limited to Bond ball mill work index testing since no comminution circuit design is required for this study — production will initially be toll milled at a Nevada Gold Mines process facility, and eventually processed through the refurbished Lone Tree facility. Tests were run using a 106 µm closing screen size, targeting a grind size k80 of 75 µm. The overall average work index was 16.4 (imperial, classified as hard), with


September 2026


SRK Consulting (U.S.), Inc.

SEC Technical Report Summary – Granite Creek

   Page 122


a 75th-percentile (normal design) value of 19.0 (very hard). By zone, the OG Zone averaged 18.9 (very hard, 75th percentile 20.3, very hard) with the oxide samples showing similar hardness to the sulfide samples; the Otto Zone averaged 16.2 (hard, 75th percentile 17.4, hard); the Adams Peak Zone averaged 12.8 (medium, 75th percentile 13.2, medium); and the Deep Range Front and Range Front Zone samples were classified as medium hardness while the South Pacific Zone (SPZ) sample was classified as very hard. Mineralogy (XRD) and swelling clay analysis showed gangue mineralogy of quartz, k-feldspar, muscovite, clays (kaolinite and swelling clay), and calcite, with pyrite and marcasite present in all samples as the primary sulfides; two samples (APL and APLG) showed higher percentages of swelling clay that may require attention during POX treatment — addressed in later test conditions through trona addition (see below).

Analytical direct cyanide leach shake tests were conducted on pulverized samples from each of the 17 selected samples in centrifuge tubes on a shaker for 60 minutes, with pH adjusted to 10.5 using lime slurry, followed by centrifuging and gold analysis by AA on the pregnant solution, to provide a baseline recovery. Preg-robbing leach tests were performed similarly, on samples spiked with a stock solution containing a known amount of gold, to measure a preg-rob index (PRI) comparing the amount of gold adsorbed onto the solids to the leached gold.

All metallurgical samples (with the exception of OGOX) were subjected to a series of Batch Autoclave (BTAC) tests under six different conditions (A through F), summarized in Table 10-2. Test conditions B, C, D, and F replicate Lone Tree autoclave operating conditions. Conditions A and E used acidic pre-acidulation (one hour, 98% concentrated sulfuric acid) at two temperatures — Condition A added acid in a stoichiometric ratio for carbonate destruction, and Condition E targeted a CO3/S2- weight ratio of 1 — while Conditions C and D tested trona addition (10 kg/t and 5 kg/t respectively) to counteract swelling-clay effects under alkaline conditions. Continuous POX testing was subsequently used to confirm the batch test results (see below). Carbon-in-Leach bottle roll tests were performed on each sample and on the discharge of each BTAC test, at CIL conditions of 21°C, 35% solids, 20 g/L carbon, pH 10.5-11, initial cyanide addition of 2.5 g/t NaCN, and a 24-hour residence time.

Table 10-2: Underground Samples Batch Pressure Oxidation Conditions from FLS Program


POX Condition


A


B


C


D


E


F

Acidulation

   Yes    No    No    No    Yes    No

POX

   Acid    Alkaline    Alkaline    Alkaline    Acid    Alkaline

Trona Dosage (kg/t)

   None    None    10    5    None    None

Temperature (oC)

   225    199    199    199    199    199

O2 Overpressure (kPag)

   689    689    689    689    689    689

Target Gauge Pressure (kPag)

   3137    2103    2103    2103    2103    2103

Pulp Density (% solids)

   30    30    30    30    30    30

Particle Size, k80 (µm)

   75    75    75    75    75    53

Retention Time (min)

   60    45    45    45    45    45

Follow-up tests were conducted on three sample blends (Table 10-3) to optimize alkaline POX conditions against benchtop roasting, evaluating longer retention time under alkaline (Lone Tree) conditions and confirming the effect of trona addition, using the five test conditions summarized in Table 10-4. Benchtop roasting (BTR) was performed in a Carbolite HTR rotary reactor tube furnace: a dry ground sample was weighed into a tared borosilicate glass reactor and subjected to a two-stage roast with oxygen (99.9% purity) gas applied across the roaster bed, at a first-stage temperature of 986°C for 30 minutes, a second-stage temperature of 1,058°C for 15 minutes, a 5°C/minute ramp rate, an oxygen rate of 2 cc/minute, and a sample feed weight of 500 to 550 g.


September 2026


SRK Consulting (U.S.), Inc.

SEC Technical Report Summary – Granite Creek

   Page 123


Table 10-3: Granite Creek Underground Metallurgical Sample Blends for Additional Testing


Sample


Composition

Blend 1

   65% OTHG, 34% APHG

Blend 2

   50% OTLG, 34% OUT, 16% APL

Blend 3

   60% OUT, 27% APHG, 13%
OTLG

Table 10-4: Granite Creek Underground Metallurgical Testing Program Follow-Up BTAC Test Conditions


Test Condition

   I      II      III      IV      V  

Acidulation

     No        No        No        No        No  

POX Condition

     Alkaline        Alkaline        Alkaline        Alkaline        Alkaline  

Trona Dosage (kg/t)

     None        None        20        10        None  

Temperature (°C)

     199        199        199        199        199  

O2 Overpressure (kPag)

     689        689        689        689        689  

Pulp Density (% solids)

     30        30        30        30        30  

Particle Size, k80 (µm)

     75        75        75        75        75  

Retention Time (min)

     60        45        45        45        75  

A continuous POX test was completed using composite sample OAPC across three conditions (Table 10-5), selected from the batch BTAC results as the conditions producing the highest sulfide oxidation and gold recovery for that sample: Run 1-Condition B (alkaline, no reagents, six 45-minute turnover intervals), Run 2-Condition E (partially acidulated, six 45-minute turnover intervals), and Run 3-Condition A (fully acidulated, six 60-minute turnover intervals at 225°C/437°F). The three runs operated back-to-back for approximately 16 hours, excluding autoclave heating and cooling time; profile samples were collected once steady state was achieved and again after three volume changeovers, and 16 L of POX discharge were collected and weighed at each changeover for downstream testing. The continuous autoclave feed rate was approximately 13.31 kg/hour of solids for Runs 1 and 2 (45-minute residence time) and approximately 9.98 kg/hour for Run 3 (60-minute residence time). Figure 10-1 shows the resulting sulfide oxidation profile by autoclave compartment, from autoclave feed to autoclave discharge: oxidation began quickly in compartments 1 to 2 and reached near-full oxidation by compartment 3 for Runs 2 and 3, while Run 1 (alkaline) did not reach the same level of oxidation as the other two runs.

Table 10-5: Granite Creek Underground Metallurgical Testing Program Continuous POX Run Test Conditions


Test Condition

   B (Run 1)      E (Run 2)      A (Run 3)  

POX Condition

     Alkaline        Acid        Acid  

Acidulation

     No        Partial        Complete  

Trona Dosage (kg/t)

     0        0        0  

Temperature (oC)

     199        199        225  

O2 Overpressure (kPag)

     689        689        689  

Total Pressure (kPag)

     2096        2096        3130  

Pulp Density (% solids)

     30        30        30  

Particle Size, k80 (µm)

     75        75        75  

Retention Time (min)

     45        45        60  


September 2026


SRK Consulting (U.S.), Inc.

SEC Technical Report Summary – Granite Creek

   Page 124


LOGO

Source: TR Raponi Consulting Ltd. (2023)

Figure 10-1: Granite Creek POX Pilot Plant Sulfide Oxidation Profile

Cyanide destruction tests were performed using the SO2/air process, originally developed and patented by Inco Ltd. (now Vale), in which SO2 plus air oxidizes cyanide into cyanate, catalyzed by the addition of copper ions; typical retention times to achieve less than 5 mg/L weak-acid-dissociable cyanide (CNWAD) are 1 to 2 hours at pH 7.5 to 9.5, and the process is capable of achieving discharge concentrations below 1 mg/L CNWAD (though it is not suited to directly reducing total cyanide (CNT). SO2 is typically supplied as sodium metabisulphite (SMBS) solution dissolved on site, or as elemental sulfur combusted to generate SO2 on site for larger users. A total of 32 L of transitional continuous POX discharge material, collected from the beginning of Run 2, was used to conduct a bulk 24-hour Carbon-in-Leach test at standard CIL conditions; the resulting slurry then underwent cyanide detox testing with continuous SMBS and copper sulfate addition, at the two sets of conditions summarized in Table 10-6. The objective in this program was to achieve a discharge concentration of <50 mg/L CNWAD.


September 2026


SRK Consulting (U.S.), Inc.

SEC Technical Report Summary – Granite Creek

   Page 125


Table 10-6: Underground Blend Samples Cyanide Detox Conditions from FLS Program


Test Number

   1      2  

Feed Slurry

     Bulk CIL  

Oxidizing Agent

     SMBS  

Feed CNWAD (mg/L)

     177        182  

SO2:CNWAD (g/g)

     8        5  

Retention Time (h)

     1        1  

Copper (mg/L)

     25        25  

pH range


8.0
-
9.0


8.0
-
9.0


Number of Turnovers

     6        6  

Total Continuous Time (h)

     4.5        4.5  

Temp °C

     25        25  

POX discharge slurry samples from Runs 1, 2, and 3, plus the product slurry from Detox Test 1 (the POX Run 2 sample), were retained for solids-liquids separation testing to determine optimum thickener sizing and operating parameters, evaluating pre-leach thickener duty for the POX discharge samples and tailings thickener duty for the cyanide detox sample. Flocculant screening on the Run 1 sample tested five flocculants (905VHM, 910VHM, 913VHM, 923VHM, and 934VHM); 913VHM (an anionic polyacrylamide flocculant of medium molecular weight and low charge density, substitutable with any comparable product) was found to provide the best overflow clarity and settling velocities and was selected for subsequent testing on all samples. FLSmidth also conducted pressure filtration tests using a bench-scale unit capable of simulating FLSmidth’s recessed-chamber and membrane-squeeze-chamber configurations across a range of feed solids concentrations, pressure profiles, and cake thicknesses; the Detox Tailings sample was tested at a feed of 48% solids by weight to simulate feeding from a thickener underflow.

FLSmidth Metallurgical Program (2025-2026)

In 2025, a program was undertaken at the pilot-scale autoclave facility at the FLSmidth Minerals Testing and Research Center in Salt Lake City, Utah, to simulate continuous pressure oxidation conditions similar to those expected in the commercial plant, using a blended feed made up of ore from Granite Creek, Ruby Hill, and Cove — the three i-80 operations expected to supply feed in the early years of commercial operation. The block flow diagram of the pilot-scale flow sheet is shown in Figure 10-2. The program comprised feed preparation (crushing and grinding), blending, acidulation (where specified), continuous pressure oxidation, neutralization, CIL, and cyanide detoxification; various products of the program were also used for bulk CIL, cyanide detox, solids-liquid separation, and slurry rheology testing.


September 2026


SRK Consulting (U.S.), Inc.

SEC Technical Report Summary – Granite Creek

   Page 126


LOGO

Source: i-80 Gold

Figure 10-2: Continuous Pressure Oxidation Program Flow Sheet

For the Granite Creek portion of the composite, rejected sample material from active underground mining was used; for Ruby Hill, available core from the 426 Zone (planned for the early years of mining) was used; and for Cove, the UHPRODCOMP sample, composited to represent the early years of mining, was used. Blend proportions (Table 10-7) were determined from the expected feed tonnages of the early years of plant operation from the three sources: 26% Granite Creek, 58% Ruby Hill, and 16% Cove.

Table 10-7: Proportions of Continuous Pressure Oxidation Feed from i-80 Sources


Project

   Proportion of Blend (%)  

Granite Creek

     26  

Ruby Hill

     58  

Cove

     16  

The three source materials were prepared individually before blending. Samples were stage-crushed to -10 mesh, then ground in 12 kg batches at 60% solids with water using a rod mill, targeting a P80 of 75 microns; grind studies determined the correct grind time for each sample via dip sampling, wet screening (coarse +20 micron and fine -20 micron fractions), drying at 50°C (122°F), and Ro-Tap sizing of the coarse fraction. Leftover material from the continuous test (constituents and blend) was analyzed by McClelland Labs of Reno, Nevada for particle size (Table 10-8), and McClelland subsequently performed bench-scale autoclave tests on each of the components.


September 2026


SRK Consulting (U.S.), Inc.

SEC Technical Report Summary – Granite Creek

   Page 127


Table 10-8: Particle Size Analysis of Continuous Pressure Oxidation Blend and Components


Sieve Size (µm)

   Cumulative Weight Passing (%)  
   Granite Creek      Ruby Hill      Cove      Blend  

150

     98.9        96.1        98.4        96.2  

104

     91.3        90.7        92.6        90.6  

74

     76.9        82.0        79.1        77.5  

53

     67.4        74.9        66.6        69.8  

43

     61.7        70.0        60.3        63.9  

38

     58.9        67.6        57.6        62.5  

P80 (µm)

     79.3        67.3        75.3        78.7  

Three conditions were tested over three continuous runs, selected to match the expected temperature and pressure conditions of the Lone Tree autoclave, in either alkaline (Run 1) or acidic (Runs 2 and 3) mode, with 45-minute (Runs 1 and 2) or 60-minute (Run 3) retention time (Table 10-9). Samples for Runs 2 and 3 were acidulated by slowly adding the stoichiometric quantity of sulfuric acid required for full carbonate destruction over 2 to 3 hours to prevent bubbling and frothing; the acidified slurry was noticeably more viscous than the alkaline Run 1 feed. Testing used a titanium continuous autoclave with a dynamic operating volume of 27 L (including gas hold-up), a flash discharge system, and six compartments (the first two only partly divided and treated as a single compartment, with cooling water addition available to manage temperature there); a photograph of the autoclave is shown in Figure 10-3. Set points for pre-heat and shell temperature were determined from prior projects of similar sulfide grade and target temperature. At the end of each run, a set of seven profile samples was taken (POX feed; compartment samples 1-2, 3, 4, 5, and 6; and POX discharge), and a total of 50 L of continuous autoclave discharge from the end of Run 2 was collected as a bulk sample.

Table 10-9: Continuous Pressure Oxidation Test Conditions


Test Condition


Run 1


Run 2


Run 3


Acidulation

     No        Yes        Yes  

Temperature (°C)

     199        199        199  

O2 Overpressure (kPag)

     689        689        689  

Total Pressure (kPag)

     2,103        2,103        2,103  

% Solids by Weight

     30        30        3,0  

Retention Time (min)

     45        45        60  

Total Run Time (h)

     3.5        4.0        4.5  


September 2026


SRK Consulting (U.S.), Inc.

SEC Technical Report Summary – Granite Creek

   Page 128


LOGO

Source: FLSmidth (2026)

Figure 10-3: Continuous Pressure Oxidation Autoclave at FLSmidth

The slurry temperature profile of the autoclave compartments over the course of testing is shown in Figure 10-4; the target temperature of 199°C (390°F) was reasonably met, with some notable excursions in Run 2. The overall autoclave pressure, shown inFigure 10-5, showed no significant variation from the target of 2,103 kPag (305 psig) throughout testing. Vent oxygen purity, targeted at 90%, is shown in Figure 10-6; purity dropped below target at times, likely due to carbonate decomposition during the alkaline phase and at the start of acidic pressure oxidation as acidulated feed mixed with the autoclave’s alkaline contents, then increased as the acidic runs proceeded. The higher viscosity of the acidulated slurry caused several upset events where feed pumping was halted due to obstruction; water was added during the acidulated runs to improve pumpability, with pumping rate slowed to compensate and maintain the required retention time, reflected in the calculated feed flow rate shown in Figure 10-7. The progression of sulfide oxidation over autoclave residence time, from the profile samples, is shown in Figure 10-8.


September 2026


SRK Consulting (U.S.), Inc.

SEC Technical Report Summary – Granite Creek

   Page 129


LOGO

Source: FLSmidth (2026)

Figure 10-4: Continuous Pressure Oxidation Slurry Temperature Profile


LOGO

Source: FLSmidth (2026)

Figure 10-5: Continuous Pressure Oxidation Vessel Pressure Profile


September 2026


SRK Consulting (U.S.), Inc.

SEC Technical Report Summary – Granite Creek

   Page 130


LOGO

Source: FLSmidth (2026)

Figure 10-6: Continuous Pressure Oxidation Vent Oxygen Purity


LOGO

Source: FLSmidth (2026)

Figure 10-7: Continuous Pressure Oxidation Calculated Feed Flow Rate


September 2026


SRK Consulting (U.S.), Inc.

SEC Technical Report Summary – Granite Creek

   Page 131


LOGO

Source: FLSmidth (2026)

Figure 10-8: Continuous Pressure Oxidation Sulfide Oxidation Profile

Following pressure oxidation, samples were neutralized in a hot water bath at 60°C (140°F) with overhead mixing and air sparging, with lime added over a 3-hour period to target a pH of 10.5 (the bulk sample collected during pressure oxidation was not neutralized). Neutralized samples were then subjected to bench-scale CIL leach tests using activated carbon, similar to the bench-scale program; the bulk sample was leached in a bulk CIL reactor for 24 hours using the same conditions but with pH adjustment during leaching rather than bulk neutralization, and was subsequently used for cyanide detox and solids-liquids separation testing. Each of Runs 1 through 3 was tested in duplicate CIL runs. Benchtop autoclave tests on the same blended feed used in the continuous test were CIL-leached using the same conditions as the prior bench top program for comparison.

The bulk sample, after 24 hours of CIL leaching, was screened to remove carbon and dosed with sodium metabisulfite (SMBS) as the SO2 source and copper sulfate as catalyst, in a series of two tests at the conditions shown in Table 10-10. In both tests, CNWAD concentrations were reduced to below 5 mg/L after one hour of retention time, as shown in Figure 10-9.


September 2026


SRK Consulting (U.S.), Inc.

SEC Technical Report Summary – Granite Creek

   Page 132


Table 10-10: Continuous Pressure Oxidation Testing, Cyanide Detoxification Conditions


     Test 1      Test 2  

Feed CNWAD (mg/L)

     110        106  

SO2/CNWAD (g/g)

     11        6  

Retention Time (h)

     1        1  

Copper Concentration (mg/L)

     43        31  

pH Range

     8-10        8-10  

Number of Turnovers

     4        4  

Total Continuous Time (h)

     4        4  

Temperature (°C)

     25        25  

Lime Consumption (kg/t)

     1.87        1.87  

SO2 Consumption (kg/t)

     2.77        1.40  

CuSO4 Consumption (kg/t)

     0.10        0.07  

Lime:SO2 (w/w)

     0.67        1.34  


LOGO

Source: FLSmidth (2026)

Figure 10-9: CNWAD Concentration in Cyanide Detoxification

Subsamples of material from the continuous pressure oxidation program were used for thickening, rheology, and filtration test work at FLSmidth. Malvern laser diffraction particle size analyses of the autoclave feed, autoclave discharge, and detox tailings samples are shown in Table 10-11 (the AC Feed sample, representative of autoclave feed during the continuous test, was analyzed after acidulation). Flux testing determined the optimum feedwell suspended solids concentration ranges for flocculation shown in Table 10-12 — quite low ranges, indicating significant internal dilution will be required in thickener feedwells for optimum settling. Continuous fill tests measuring predicted thickener underflow densities are shown in Table 10-13: acceptable underflow densities were achieved for the AC Discharge and Detox Tails samples at bed retention times of up to two hours (typical for an operating thickener), though it is unclear why the AC Feed sample produced a comparatively low


September 2026


SRK Consulting (U.S.), Inc.

SEC Technical Report Summary – Granite Creek

   Page 133


underflow density; rise rates were appropriate for a high-rate thickener while providing acceptable overflow clarity. Dynamic rheology testing, performed at expected underflow densities using a cup-and-bob apparatus on underflow from the continuous fill tests, is shown in Table 10-14; underflow yield stresses were found to be acceptable for centrifugal pumping, and dynamic viscosity analysis showed reduced viscosity with increasing shear rate. Pressure filtration testing on the Detox Tails sample, using recessed chambers with a bench-scale filtration unit across a range of feed solids concentrations, pressure profiles, and cake thicknesses, is shown in Table 10-15; the final cake moisture was high relative to the specification needed for filtered tailings stacking, and filtration rates of 63 to 91 kg/m2/h were roughly an order of magnitude lower than typical tailings filtration, attributed to the fine feed particle size distribution and the oxidized nature of the solids — further thickening and filtration test work on the products of pressure oxidation, CIL, and cyanide detoxification will be required to reach targeted moisture and filtration rates.

Table 10-11: Malvern Laser Diffraction Particle Size Analysis of Continuous Pressure Oxidation Samples


     AC Feed      AC Discharge      Detox Tails  

D90 (µm)

     75        76        50  

D80 (µm)

     ~49        43        ~23  

D50 (µm)

     13        12        6  

D20 (µm)

     ~2.3        2.7        ~1.7  

D10 (µm)

     1.2        1.4        1.0  

Table 10-12: Required Solids Feed Concentration Ranges


Sample


Solids Feed
Concentration Range for
Highest Flux Rate (%)

 
AC Feed      1 – 2  
AC Discharge      5 – 7  
Detox Tails      3 – 5  

Table 10-13: Continuous Fill Tests on Continuous Pressure Oxidation Samples


AC Feed


AC Discharge


Detox Tails

Feed Suspended Solids Concentration (%)

   1.5    6    5

Flocculant Dose Range Tested (g/t)

   50 - 100    60 - 80    40 -65

Unit Area Range Tested (m2/tpd)

   0.13 - 0.25    0.04 -0.10    0.042 - 0.10

Internal Rise Rate Range Tested (m/h)

   12.0 - 23.3    10.6 - 18.7    9.1 - 21.7

Est. Bed Suspended Solids – 0.5 hr (wt%)

   15.3    35.9    36.5

Est. Bed Suspended Solids – 1 hr (wt%)

   18.7    41.0    41.5

Est. Bed Suspended Solids – 2 hr (wt%)

   23.2    44.8    45.8

Est. Bed Suspended Solids – 3 hr (wt%)

   26.5    47.1    47.0

Est. Bed Suspended Solids – 6 hr (wt%)

   28.3    48.2    47.5

Recommended Floc Dose Range (g/t)

   70 - 80    70 - 80    55 - 65

Design Unit Area (m2/tpd)

   0.25    0.07    0.07

Design Overflow Clarity (mg/L)

   55 - 65    75 - 90    < 50

Table 10-14: Slurry Rheology on Continuous Pressure Oxidation Samples


     AC Feed      AC Discharge      Detox Tails  

Underflow Density (wt%)

     19        40        41  

Yield Stress (Pa)

     1.65        40.5        18.7  

Bingham Plastic Viscosity (cP)

     14.4        20.6        28.7  


September 2026


SRK Consulting (U.S.), Inc.

SEC Technical Report Summary – Granite Creek

   Page 134


Table 10-15: Pressure Filtration on Cyanide Detoxification Samples


     Detox Tails

Chamber Type

   Recessed

Filter Media

   POPR 966

Feed Suspended Solids (wt%)

   41

Feed Pressure (kPa)

   1,000 & 1,500

Fill Time (min)

   5.25 – 9.0

Cake Thickness (mm)

   32 & 50

Air Blow Pressure (kPa)

   310 – 700

Air Blow Time (min)

   10

Filtrate Quality (ppm)

   5,243 – 7,219

Ultimate Cake Moisture (wt%)

   28.7 – 29.9

Dry Cake Density (kg/m3)

   1,202 – 1,236

Final Filtration Rate (kg/m2/h)

   63 – 91

SGS Metallurgical Program (2025-2026)

In 2025, a metallurgical test program was conducted at SGS in Lakefield, Ontario, Canada, focused on the South Pacific Zone (SPZ), for which there was not a significant amount of prior test work; the program focused on pressure oxidation followed by gold recovery by CIL and was completed in 2026.

Bond ball mill grindability tests were performed on samples SPZN, SPZCOM1, SPZCOM2, and SPZCOM3 at a 105 µm grind size (Table 10-16).

Table 10-16: Bond Ball Mill Grindability Test Results


Sample ID

   Grind Size
(µm)
     F80
(mm)
     P80
(mm)
     Work Index
(kWh/t)
Imperial
     Work Index
(kWh/t)
Metric
 

SPZN

     105        2,485        85        16.7        18.4  

SPZCOM1

     105        2,446        80        14.4        15.9  

SPZCOM2

     105        2,108        73        13.8        15.3  

SPZCOM3

     105        2,618        76        18.0        19.8  

Pressure oxidation test work was undertaken on the eight SPZ samples to evaluate the effectiveness of oxidative treatment in overcoming their refractory nature, at a grind target P80 of 75 µm, pre-acidulation residence time of 6 hours (where required), pulp density of 35% by weight, temperature of 199°C (390°F), pressure of 2,048 kPag, and residence time of 45, 60, or 75 minutes. Four tests per sample were run: one with no pre-acidulation and three with pre-acidulation at varying residence time, using 2 L titanium autoclave vessels; acid addition (where required) was applied over a six-hour pre-acidulation period with hourly pH and ORP readings. Initial tests based pre-acidulation on the carbonate assay of each feed (targeting a 1:1 carbonate-to-sulfide ratio), but early results (POX tests 2R, 6, 10, 14, 22, and 26) showed solids clumping, unreacted solids, and poor sulfide oxidation; pre-acidulation was subsequently modified to target a pH of 2, which increased sulfide and arsenopyrite oxidation and gold recovery from CIL. Final POX pulp pH across the modified tests averaged 1.24, with an average ORP of 581 mV (excluding POX 7, whose ORP of 21 mV likely reflected a malfunctioning probe).

Standard CIL bottle roll tests were conducted on each of the eight samples, without POX pre-treatment, to provide a baseline recovery, at pH 10.5, NaCN concentration of 1.0 g/L, a 6-hour pre-aeration duration, and a 24-hour CIL residence time. POX residues were subsequently forwarded for CIL testing using the same conditions as the baseline CIL tests.


September 2026


SRK Consulting (U.S.), Inc.

SEC Technical Report Summary – Granite Creek

   Page 135


Third-Party Toll Milling Bench Top Autoclave Tests

As part of the toll milling process, bench top autoclave tests are conducted at the on-site laboratory of the third-party toll milling facility that currently processes Granite Creek Underground production, on a composite of each monthly delivery lot, to assign a gold recovery value to that lot’s production; the result is used, together with the results from other feed components delivered that month, to reconcile the plant’s actual gold recovery to each individual component. The bench top tests are conducted at conditions analogous to the plant: a temperature of 225°C (437°F), a pressure of 3,172 kPag (460 psig), and a residence time of 60 minutes.


10.2

Sample Representativeness

The degree to which the metallurgical test samples are representative of the various types and styles of mineralization at Granite Creek Underground, and of the deposit as a whole, is discussed below by test program and supported by the spatial distribution and grade/composition variability of the samples tested.

FLSmidth 2022 Program Samples

The FLSmidth 2022 program tested 17 samples selected to span the primary mineralized zones of the Granite Creek Underground deposit — OG Zone (upper and lower sulfide, oxide, and high-/low-grade variability samples), Otto Zone (upper and lower sulfide and high-/low-grade variability samples), Adams Peak Zone (upper, lower, and high-/low-grade variability samples), the Otto/Adams Peak composite (OAPC), and variability samples from the Deep Range Front, Range Front, and South Pacific Zones — together with dedicated comminution samples for each zone. Head assays for the sample set are shown in Table 10-17, ranging from 4.56 g/t (Adams Peak Zone lower) to 39.43 g/t Au (OG Zone comminution sample), with sulfide sulfur content ranging up to 5.84% (Adams Peak Zone upper), reflecting the range of mineralization styles and grades present across the deposit.


September 2026


SRK Consulting (U.S.), Inc.

SEC Technical Report Summary – Granite Creek

   Page 136


Table 10-17: Underground Samples Head Assays from FLS Program


Sample
Number
  

Description

   ID      Au g/t      Au oz/
st
     Ag g/t      Ag oz/
st
     S=%      Corg%  
1    OG Zone Upper (Sulfide)      OGU        14.54        0.424        4.63        0.135        1.96        0.44  
2    OG Zone Lower (Sulfide)      OGL        28.46        0.830        9.39        0.274        2.98        0.12  
   OG Zone Oxide      OGOX        12.48        0.364        11.55        0.337        0.43        0.34  
3    OG Zone High Grade (Sulfide) Variability Sample      OGHG        37.71        1.100        7.41        0.216        3.89        0.10  
4    OG Zone Low Grade (Sulfide) Variability Sample      OGLG        8.43        0.246        22.29        0.650        2.73        0.36  
   OG Zone Comminution Sample No. 1      OGCOM1        12.75        0.372        153.26        4.470        2.33        0.33  
   OG Zone Comminution Sample No. 2      OGCOM2        39.43        1.150        9.77        0.285        0.04        0.03  
   OG Zone Comminution Sample No. 3      OGCOM3        10.39        0.303        7.10        0.207        0.15        0.02  
   OG Zone Comminution Sample No. 4      OGCOM4        9.94        0.290        4.22        0.123        0.00        0.19  
   OG Zone Comminution Sample No. 5      OGCOM5        26.23        0.765        3.70        0.108        0.00        0.03  
   OG Zone Comminution Sample No. 6      OGCOM6        12.89        0.376        1.92        0.056        1.41        1.12  
5    Otto Zone Upper (Sulfide)      OTU        16.70        0.487        4.01        0.117        1.14        0.18  
6    Otto Zone Lower (Sulfide)      OTL        14.98        0.437        10.94        0.319        1.67        0.38  
7    Otto Zone High Grade (Sulfide) Variability Sample      OTHG        20.40        0.595        12.89        0.376        0.79        0.19  
8    Otto Zone Low Grade (Sulfide) Variability Sample      OTLG        6.24        0.182        1.10        0.032        1.48        0.22  
   Otto Zone Comminution Sample No. 1      OTCOM1        8.40        0.245        0.00        0.000        3.01        0.11  
   Otto Zone Comminution Sample No. 2      OTCOM2        13.92        0.406        0.99        0.029        1.81        0.47  
   Otto Zone Comminution Sample No. 3      OTCOM3        9.50        0.277        1.06        0.031        2.84        0.27  
9    Adams Peak Zone Upper      APU        7.65        0.223        0.93        0.027        5.84        0.33  
10    Adams Peak Zone Lower      APL        4.56        0.133        4.90        0.143        4.29        0.25  
11    Adams Peak Zone High Grade Variability Sample      APHG        20.43        0.596        0.99        0.029        2.86        0.20  
12    Adams Peak Zone Low Grade Variability Sample      APLG        6.45        0.188        8.23        0.240        3.20        0.13  
   Adams Peak Zone Comminution Sample No. 1      APCOM1        11.04        0.322        3.12        0.091        3.12        0.37  
   Adams Peak Zone Comminution Sample No. 2      APCOM2        11.76        0.343        15.05        0.439        3.85        0.17  
13    Otto/Adams Peak Zone Composite      OAPC        11.35        0.331        3.67        0.107        2.25        0.24  
14    Deep Range Front Zone Variability Sample      DRFV        6.31        0.184        2.78        0.081        1.73        0.26  
15    Range Front Zone Variability Sample      RFV        7.30        0.213        2.85        0.083        2.33        0.17  
16    South Pacific Zone Variability Sample      SPZV        20.16        0.588        1.23        0.036        2.79        0.75  


September 2026


SRK Consulting (U.S.), Inc.

SEC Technical Report Summary – Granite Creek

   Page 137


FLSmidth 2025 Program Feed Blend

The FLSmidth 2025 continuous pressure oxidation program used a blended feed representing the early years of commercial operation across three i-80 properties — 26% Granite Creek, 58% Ruby Hill, and 16% Cove (Table 10-18) — rather than Granite Creek material alone; the assayed head composition of each source and of the blend is shown in Table 10-18. The blend’s composition (11.8 g/t Au, 18.2% carbonate, and 1.94% sulfide sulfur, assayed) indicates a high level of carbonate and sulfide sulfur relative to the design parameters of the Lone Tree pressure oxidation plant. Because the blend includes material from the Adam’s Peak Zone, which is not part of the Granite Creek Underground mine plan, recovery data from the continuous tests on this blend were not used directly in Granite Creek Underground recovery modeling (see Section 10.4); the blend nonetheless demonstrates the pilot-scale continuous process response of Granite Creek material processed together with other i-80 feed sources under commercial-scale conditions.

Table 10-18: Composition of Continuous Pressure Oxidation Feed Blend


Project


Au

(g/t)


Au
(oz/st)


Corg

(%)


Ctotal

(%)


CO3

(%)


Stotal

(%)


Ssulfide

(%)


Granite Creek

     9.5        0.277        0.39        3.2        13.8        1.8        1.52  

Ruby Hill

     6.8        0.198        0.11        3.3        16.1        2.7        2.43  

Cove

     15.1        0.440        0.11        6.7        32.9        0.9        0.86  

Blend (assayed)

     11.8        0.344        0.16        3.8        18.2        2.0        1.94  

SGS 2025 Program Samples

The SGS 2025 program tested eight half-HQ-core samples selected to represent the South Pacific Zone (SPZ) — south, middle, and north variability samples, high- and low-grade variability samples, and three comminution samples (Table 10-19). Gold grades of the delivered samples ranged from 5.34 to 21.8 g/t, with composite samples displaying a consistent gold grade around 15 g/t; gold cyanide analysis showed three samples (SPZM, SPZN, and SPZCOM2) were highly refractory (AuCN less than 10% of total gold) while three others (SPZS, SPZHG, and SPZCOM3) displayed partial free gold or weak refractoriness. Sulfide sulfur levels varied from 1.3% to 3.4%, mercury from 42 to 256 g/t (likely cinnabar), arsenic from 0.19% to 1.91%, total carbon from 0.47% to 4.7%, and carbonate from 0.49% to 20.2% — head assays for the sample set are shown in Figure 10-10.

Table 10-19: South Pacific Test Program Sample List


Sample ID


Sample Description

SPZS    South Pacific Zone South Variability Sample
SPZM    South Pacific Zone Middle Variability Sample
SPZN    South Pacific Zone North Variability Sample
SPZHG    South Pacific Zone High Grade Variability Sample
SPZLG    South Pacific Zone Low Grade Variability Sample
SPZCOM1    Comminution Sample No. 1
SPZCOM2    Comminution Sample No. 2
SPZCOM3    Comminution Sample No. 3


September 2026


SRK Consulting (U.S.), Inc.

SEC Technical Report Summary – Granite Creek

   Page 138


LOGO

Source: SGS

Figure 10-10: SGS Metallurgical Program Head Assays


September 2026


SRK Consulting (U.S.), Inc.

SEC Technical Report Summary – Granite Creek

   Page 139


Mineralogical Representativeness (SGS Samples)

Bulk modal mineralogy conducted on four SGS samples (SPZS, SPZN, SPZHG, and SPZCOM2), shown in Figure 10-11, found the samples primarily composed of quartz (41% to 68%), calcite (4.6% to 32.7%), sericite/muscovite (5.8% to 11%), and clays (9.3% to 10.2%), with SPZCOM2 reporting the highest sulfide concentration at 6.1%. The degree of particle liberation of pyrite-marcasite, arsenopyrite, silicates, and carbonates by mass is shown in Figure 10-12 through Figure 10-15: SPZHG showed the highest liberation of pyrite and arsenopyrite, while SPZCOM2 showed poor sulfide liberation and highly locked arsenopyrite; all samples showed poor liberation of arsenopyrite, with no free arsenopyrite present, suggesting the refractory gold in the SPZ is likely associated with arsenic.


September 2026


SRK Consulting (U.S.), Inc.

SEC Technical Report Summary – Granite Creek

   Page 140


LOGO

Source: SGS, 2025

Figure 10-11: Bulk Modal (QEMSCAN) Results


September 2026


SRK Consulting (U.S.), Inc.

SEC Technical Report Summary – Granite Creek

   Page 141


LOGO

Source: SGS (2026)

Figure 10-12: Pyrite/Marcasite Liberation by Mass


LOGO

Source: SGS (2026)

Figure 10-13: Arsenopyrite Liberation by Mass


September 2026


SRK Consulting (U.S.), Inc.

SEC Technical Report Summary – Granite Creek

   Page 142


LOGO

Source: SGS (2026)

Figure 10-14: Silicate Liberation by Mass


September 2026


SRK Consulting (U.S.), Inc.

SEC Technical Report Summary – Granite Creek

   Page 143


LOGO

Source: SGS (2026)

Figure 10-15: Carbonate Liberation by Mass

Location of Metallurgical Samples

Figure 10-16 and Figure 10-17 show the locations of the test samples for the recent FLSmidth and SGS test programs within the mining shapes of the Granite Creek deposits, in section and plan view respectively. From a spatial perspective, selection of samples for the Granite Creek metallurgical test programs appears to represent the extents of the deposit.


September 2026


SRK Consulting (U.S.), Inc.

SEC Technical Report Summary – Granite Creek

   Page 144


LOGO

Source: i-80 Gold

Figure 10-16: Locations of Metallurgical Samples (Section View)


September 2026


SRK Consulting (U.S.), Inc.

SEC Technical Report Summary – Granite Creek

   Page 145


LOGO

Source: i-80 Gold

Figure 10-17: Locations of Metallurgical Samples (Plan View)

Variability and Representativeness of Metallurgical Samples

Figure 10-18 through Figure 10-21 are histograms illustrating the variability of key attributes across the samples of the Granite Creek Underground test programs — gold grade, organic carbon content, carbonate content, and sulfide sulfur content.


September 2026


SRK Consulting (U.S.), Inc.

SEC Technical Report Summary – Granite Creek

   Page 146


LOGO

Source: i-80 Gold

Figure 10-18: Distribution of Gold Grade in Metallurgical Samples


LOGO

Source: i-80 Gold

Figure 10-19: Distribution of Organic Carbon in Metallurgical Samples


September 2026


SRK Consulting (U.S.), Inc.

SEC Technical Report Summary – Granite Creek

   Page 147


LOGO

Source: i-80 Gold

Figure 10-20: Distribution of Carbonate in Metallurgical Samples


LOGO

Source: i-80 Gold

Figure 10-21: Distribution of Sulfide Sulfur in Metallurgical Samples


September 2026


SRK Consulting (U.S.), Inc.

SEC Technical Report Summary – Granite Creek

   Page 148


Table 10-20 shows the projected life-of-mine range of gold grade, organic carbon, carbonate, and sulfide sulfur content for Granite Creek Underground autoclave feed, and Table 10-21 compares the average and range of these feed characteristics for the FLS 2023 and SGS 2025 test programs against that projected feed. Based on this comparison, the grades of the samples tested — in terms of gold, organic carbon, carbonate, and sulfide sulfur — are considered representative of the feed expected during mining.

Table 10-20: Projected Feed from Granite Creek Underground


     Gold Grade
(g/t)
     Gold Grade
(oz/st)
     Organic
Carbon

(%)
     Carbonate
(%)
     Sulfide
Sulfur

(%)
 

Life of Mine

     7.85        0.229        0.30        11.3        1.24  

Annual Maximum

     9.77        0.285        0.38        12.7        1.71  

Annual Minimum

     7.65        0.223        0.20        9.4        0.78  

Table 10-21: Summary of Feed Values for Granite Creek Test Programs


     Gold Grade
(g/t)
     Gold Grade
(oz/st)
     Organic Carbon
(%)
     Carbonate
(%)
     Sulfide Sulfur
(%)
 

FLS 2023 Program


Average

     14.6        0.426        0.28        8.8        2.2  

Maximum

     39.5        1.152        1.12        21.4        5.8  

Minimum

     4.5        0.131        0.02        0.01        0.0  

SGS 2025 Program


Average

     12.9        0.376        0.70        8.3        2.1  

Maximum

     21.8        0.636        1.30        20.2        2.7  

Minimum

     5.3        0.155        0.33        0.5        1.1  


10.3

Laboratories

Metallurgical testing on Granite Creek Underground samples has been performed at five independent, commercial or contract laboratories and facilities, none of which is affiliated with i-80 Gold Corp. (the registrant): Dawson Metallurgical Laboratories (Salt Lake City, Utah), which completed the 2005-2006 autoclave pre-treatment program on behalf of Atna; FLSmidth, whose FLSmidth Minerals Testing and Research Center pilot-scale autoclave facility in Salt Lake City, Utah performed both the 2022-2023 bench-scale/continuous test program and the 2025-2026 continuous pilot-plant program; McClelland Laboratories, Inc. (Reno, Nevada), which performed particle size analysis and bench-scale autoclave testing on the components and blend of the 2025 FLSmidth continuous program; SGS, whose Lakefield, Ontario, Canada facility performed the 2025-2026 South Pacific Zone pressure oxidation and cyanidation test program; and the on-site laboratory of the third-party toll milling facility that currently processes Granite Creek Underground production, which performs ongoing bench top autoclave testing on monthly production lots as part of the toll milling reconciliation process. Each of these laboratories is an established, independent commercial metallurgical testing facility with no ownership, financial, or other relationship to i-80 Gold Corp. The source technical documentation reviewed by the QP does not state the specific accreditation or certification status (e.g., ISO 17025) held by each laboratory for the metallurgical testing performed; accordingly, no representation of formal accreditation is made here beyond the independent, commercial nature of each facility.


September 2026


SRK Consulting (U.S.), Inc.

SEC Technical Report Summary – Granite Creek

   Page 149


10.4

Relevant Results

The results of the metallurgical test programs, and the basis for recovery estimates and assumptions used in this technical report summary, are presented below by test program, followed by the QP’s synthesis of expected gold recovery by mining zone and process route.

Dawson Program Results

The cyanide leach gold recoveries from the Dawson baseline tests and autoclave pre-treatment tests are shown in Table 10-22. The refractory material responded well to autoclave pre-treatment: for samples with both a baseline cyanide leach (no pre-treatment) and an autoclave-residue cyanide leach, average recovery increased from 52% (baseline) to 92% (post-autoclave). There is a wide range of baseline gold recoveries — from 11% to 86% — among samples with measured sulfide sulfur; an attempted correlation between sulfide sulfur content and baseline gold recovery had a very low coefficient of determination and is not presented. There was an inverse relationship between sulfide sulfur content and cyanide solubility (no autoclave treatment), shown in Figure 10-22, with a reasonable correlation between solubility and sulfide grade; prior test work by McClelland Labs had found that sulfide sulfur content did not correlate well with cyanide solubility, and other factors (such as the presence of organic carbon, and gold not directly associated with pyrite) also appear to influence cyanide solubility.

Table 10-22: Autoclave Pre-Treatment Tests from Dawson Test Work Program


Sample

   Year of
Test
Work
Program
     Grind
P80
(µm)
     Gold
Head
Assay
(g/t)
     Gold
Head
Assay
(oz/st)
     Total
Sulfide
Sulfur
(%)
     Total
Carbon
(CO2)
Head
Assay
(%)
     Cyanide Leach Gold
Recovery (%)
 
   Baseline
Tests
     Tests on
Autoclave
Residue
 

Ogee Samples


Ogee (Right Rib + Left Rib)

     2005        75        13.71        0.400        0.0        0.82        86        93  

RF Zone Samples


RF_Met-1 (33941)

     2005        75        8.23        0.240        1.21        2.27        52        93  

RF_Met-2 (33942)

     2005        75        14.74        0.430        2.61        1.76        61        95  

RF_Met-4 (34259)

     2005        75        14.74        0.430        2.32        2.43        11        89  

CX Zone Samples


APCX-204

     2006        75        9.26        0.270        0.00        5.34        94        N/A  

APCX-211

     2006        75        11.31        0.330        0.00        4.29        85        N/A  

APCX-219

     2006        75        11.31        0.330        0.84        0.77        60        91  

APCX-226

     2006        45        19.20        0.560        1.53        2.70        42        94  

Undefined Samples


AMW-002

     2006        75        11.31        0.330        0.03        0.35        77        N/A  

MET 1

     2005        75        17.49        0.510        1.21        2.27       
N/
A

 
     93  

MET 2

     2005        75        10.97        0.320        2.61        1.76       
N/
A

 
     95  


September 2026


SRK Consulting (U.S.), Inc.

SEC Technical Report Summary – Granite Creek

   Page 150


LOGO

Source: i-80 Gold

Figure 10-22: Gold Cyanide Solubility and Sulfide Influence – Ogee Samples

FLSmidth 2022 Batch Autoclave Results

Averaged baseline and batch pressure oxidation CIL results by zone are shown in Table 10-23 Baseline CIL tests confirmed the refractory nature of the samples, with an average recovery of 31.3% Au across all zones. Acidic BTAC conditions produced the highest gold recoveries: Condition A produced the highest average sulfide oxidation (95.6%) and average recovery (88.6% Au), ranging from 70.2% (OGLG, 99.5% sulfide oxidation) to 95.7% (SPZV, 99.6% sulfide oxidation); Condition E produced the next-highest average sulfide oxidation (71.8%) and average recovery (79.0% Au), ranging from 42.2% (APHG, 31.8% sulfide oxidation) to 94.5% (OGL, 61.7% sulfide oxidation). Alkaline conditions produced lower sulfide oxidation and recovery: Condition F (finer grind) performed best among the alkaline conditions, averaging 60.3% sulfide oxidation and 72.6% recovery; Condition B averaged 59.8% sulfide oxidation and 69.2% recovery; and the trona-addition conditions (C and D) produced the lowest results — Condition C averaged 44.1% sulfide oxidation and 61.5% recovery, and Condition D averaged 46.7% sulfide oxidation and 64.6% recovery. By zone: Adam’s Peak and Deep Range Front were the most refractory based on baseline CIL recoveries, while the SPZ variability sample (SPZV) responded well to all BTAC conditions, averaging 90.5% recovery across sulfide oxidations ranging from 43.0% (Condition C, 79.0% recovery) to 99.5% (Condition A, 95.7% recovery). OG Zone samples showed a positive trend between gold head grade and recovery and had the highest recoveries of the primary zones regardless of POX condition, with the highest average recoveries under Condition F followed by Condition A. Otto Zone and Adam’s Peak Zone samples showed no clear grade-recovery relationship; Otto Zone recoveries were highest under acidic conditions (E followed by A), and Adam’s Peak Zone recoveries were highest under Condition A, with the other three conditions notably lower. The OAPC composite responded best to acidic Conditions A and E and


September 2026


SRK Consulting (U.S.), Inc.

SEC Technical Report Summary – Granite Creek

   Page 151


poorly to alkaline conditions. RFV and DRFV samples responded well only to Condition A (95.0% and 89.1% recovery respectively), with recoveries below 60% under all other conditions. Overall, there is a positive trend between sulfide sulfur oxidation and gold recovery, shown in Figure 10-23


September 2026


SRK Consulting (U.S.), Inc.

SEC Technical Report Summary – Granite Creek

   Page 152


Table 10-23: Underground Samples Baseline and Batch Pressure Oxidation CIL Results from FLS Program


Parameter

   OG Zone      Otto Zone      Adam’s Peak      Otto /Adam’s Peak      Deep Range Front      Range Front      South Pacific  
N/A    Baseline Recovery (% Au)      41.50        46.75        9.25        24.00        10.00        34.00        43.00  
A    S Oxidation (%)      86.26        99.49        98.87        99.33        95.87        96.62        99.48  
   Recovery (% Au)      84.12        88.77        90.65        83.18        89.05        94.96        95.65  
   NaCN Consumption (kg/t)      0.66        0.75        0.66        0.50        0.61        0.31        0.80  
B    S Oxidation (%)      71.11        56.10        57.71        44.00        32.95        42.06        98.68  
   Recovery (% Au)      85.17        67.12        61.33        56.88        42.79        59.32        94.19  
   NaCN Consumption (kg/t)      1.41        1.07        0.73        1.81        1.62        1.31        1.82  
C    S Oxidation (%)      66.56        38.66        32.35        38.22        35.26        38.63        43.01  
   Recovery (% Au)      75.75        66.71        45.43        52.17        43.33        57.64        79.09  
   NaCN Consumption (kg/t)      1.11        1.07        1.60        1.79        1.71        1.91        1.17  
D    S Oxidation (%)      60.60        37.91        42.81        35.56        31.21        34.76        80.47  
   Recovery (% Au)      80.40        66.93        52.71        50.99        40.10        57.79        84.98  
   NaCN Consumption (kg/t)      0.75        1.11        1.65        0.92        1.65        1.90        1.65  
E    S Oxidation (%)      65.20        92.98        67.32        68.67        36.42        42.92        98.84  
   Recovery (% Au)      86.59        89.31        70.02        81.70        41.47        63.04        93.95  
   NaCN Consumption (kg/t)      1.31        0.99        1.42        0.38        0.47        1.80        1.85  
F    S Oxidation (%)      67.68        60.17        58.13        44.89        32.95        45.06        98.80  
   Recovery (% Au)      86.40        72.76        65.74        61.13        45.18        60.99        94.83  
   NaCN Consumption (kg/t)      0.76        1.33        0.71        1.07        1.51        1.39        2.08  


September 2026


SRK Consulting (U.S.), Inc.

SEC Technical Report Summary – Granite Creek

   Page 153


LOGO

Source: TR Raponi Consulting Ltd. (2023)

Figure 10-23: CIL Gold Recovery as a Function of Sulfide Sulfur Oxidation – Underground Samples

FLSmidth 2022 Follow-Up BTAC and Roasting Results

Actual and predicted sulfide oxidation results from the follow-up BTAC and roasting tests are compared in Table 10-24, and gold recovery results in Table 10-25. Overall, actual sulfide oxidation exceeded predicted values, and gold recoveries slightly exceeded predicted values; extended retention times did not significantly improve recovery, and trona addition again did not prove beneficial. Benchtop roasting (BTR) provided superior sulfide oxidation (average 97.0%) and gold recovery (average 83.0%) compared to all alkaline BTAC blend results.

Table 10-24: Granite Creek Underground Metallurgical Testing Program Follow-Up BTAC Sulfide Oxidation Results Compared to Predicted Results


Test Condition

   Actual Results      Predicted Results  
   Blend 1      Blend 2      Blend 3      Average      Blend 1      Blend 2      Blend 3      Average  

I

     48        57        49        51        —         —         —         —   

II

     43        52        42        46        43        60        50        51  

III

     39        49        39        42        39        26        33        33  

IV

     37        35        41        38        36        33        37        35  

V

     55        52        45        51        —         —         —         —   

BTR

     99.0        93.9        98.2        97.0              


September 2026


SRK Consulting (U.S.), Inc.

SEC Technical Report Summary – Granite Creek

   Page 154


Table 10-25: Granite Creek Underground Metallurgical Testing Program Follow-Up BTAC Gold Recovery Results Compared to Predicted Results


Test Condition

   Actual Results      Predicted Results  
   Blend 1      Blend 2      Blend 3      Average      Blend 1      Blend 2      Blend 3      Average  

I

     46        75        71        64        —         —         —         —   

II

     65        74        70        70        63        69        66        66  

III

     67        73        68        69        63        64        64        64  

IV

     52        73        69        65        62        68        65        65  

V

     69        77        66        71        —         —         —         —   

BTR

     84.0        85.0        80.0        83.0              

FLSmidth 2022 Continuous POX Results

Continuous POX discharge leached in a hot stir tank showed no significant difference in gold recovery compared to POX discharge leached in a bottle roll at ambient temperature; the primary effect of the higher temperature was increased lime and cyanide consumption. Table 10-26 compares results across the three continuous conditions: Conditions A and E (acidic) achieved much higher gold recovery and sulfide oxidation than Condition B (alkaline),but also consumed significantly more lime and recovered much less silver. The acid POX conditions achieved higher sulfide oxidation and therefore higher gold recoveries but required significantly more lime for neutralization; the resulting increased lime consumption likely caused much of the silver to be locked within jarosite, which did not appear to form under alkaline POX conditions — a deleterious effect on silver recovery specific to the acidic POX route.


September 2026


SRK Consulting (U.S.), Inc.

SEC Technical Report Summary – Granite Creek

   Page 155


Table 10-26: Underground Samples (OAPC) Continuous Autoclave Tests from FLS Program


Parameter

   Baseline Results      Run 1 (B) – Alkaline      Run 2 (E) – Partial Acidulation      Run 3 (A) – Full Acidulation  

Bottle Roll Conditions

   Hot Stir      Bottle Roll      BTAC      Hot Stir      Bottle Roll      BTAC      Hot Stir      Bottle Roll      BTAC  

Sulfide Oxidation (%)

        49        44        97        69        96        99  

CIL Recovery (% Au)

     24        63        63        57        89        91        81.7        91        91        83  

CIL Recovery (% Ag)

     16        50        42        —         3        3        —         2        1        —   

Lime Consumption (kg/t)

     1.3        5.23        2.99        —         43.3        39.19        —         55.88        52.75        —   

Cyanide Consumption (kg/t)

     2.45        2.95        1.79        1.81        2.56        1.83        0.38        3.3        1.64        0.50  


September 2026


SRK Consulting (U.S.), Inc.

SEC Technical Report Summary – Granite Creek

   Page 156


FLSmidth 2022 Cyanide Detoxification Results

Reagent consumption in the two cyanide detox tests is shown in Table 10-27 (lime was used during bulk CIL testing to prepare the feed for both detox tests). Final cyanide (CNWAD) results from both tests, sampled from the feed every two hours and from reactors 1, 2, and the discharge every hour, are shown in Table 10-28; the additional SMBS added in Test 1 resulted in significantly lower CNWAD compared to Test 2.

Table 10-27: Underground Cyanide Detox Reagent Consumption from FLS Program


Reagent

   Detox 1      Detox 2  

Lime Consumption (kg/t)

     1.44        1.44  

SO2 Consumption (kg/t)

     3.45        3.42  

Lime:SO2 (wt/wt)

     0.42        0.60  

CuSO4 Maintained (mg/L)

     29.6        32.1  

CuSO4 Consumption (kg/t)

     0.07        0.09  

Table 10-28: Underground Cyanide Detox WAD from FLS Program


Time (h)

   Detox 1      Detox 2  
   CNWAD (mg/L)  
1      22.5        51.1  
2      25.9        42.8  
3      23.2        46.1  
4      33.2        50.5  

FLSmidth 2025 Continuous POX Results

Sulfide oxidation and carbonate decomposition results from the 2025 continuous pressure oxidation test are shown in Table 10-29. Run 2 (partial acidulation) showed lower-than-expected sulfide oxidation in the middle compartments, though results approached expectations by discharge; because acidic Run 2 immediately followed alkaline Run 1, higher residual carbonate levels in the autoclave may have created a lower-oxygen environment due to CO2 evolution, resulting in lower-than-expected sulfide oxidation for Run 2. As a point of comparison, bench top autoclave tests on the same feed blend at the same conditions are shown in Table 10-30. The amount of lime required to raise the pH of the autoclave discharge slurry to its target cyanide-leaching pH is shown in Figure 10-24. Gold recovery results from the continuous POX CIL tests (each run tested in duplicate) are shown in Table 10-31, and gold recovery results from the corresponding bench top autoclave tests, CIL-leached under the same conditions, are shown in Table 10-32. The reason for the lower recoveries achieved by the continuous pressure oxidation tests compared to the bench top tests, despite similar levels of sulfide sulfur oxidation, is not fully understood; as noted in Section 10.2, this continuous test blend includes Adam’s Peak Zone material not part of the Granite Creek Underground mine plan, and its recovery results were accordingly not used directly in the zone-by-zone recovery modeling presented later in this section.


September 2026


SRK Consulting (U.S.), Inc.

SEC Technical Report Summary – Granite Creek

   Page 157


Table 10-29: Pressure Oxidation Continuous Test, Sulfide Sulfur Oxidation and Carbonate Decomposition


Run

   Sample    Sulfide Sulfur
Assayed
(%)
     Carbonate
Assayed
(%)
     Sulfide Oxidation,
Relative to Head

(%)
     Carbonate
Decomposition,
Relative to Head

(%)
 
1    Feed      1.94        18.2        
   C1-2      1.49        16.9        24.4        8.55  
   C3      1.34        16.7        32.0        9.36  
   C4      1.32        16.5        33.0        10.5  
   C5      1.20        16.3        29.1        11.5  
   C6      1.10        16.0        44.2        13.4  
   Discharge      1.08        16.4        45.2        11.3  
2    Feed      1.94        0.30           98.4  
   C1-2      1.23        0.08        37.6        99.6  
   C3      0.74        0.13        62.5        99.3  
   C4      0.47        0.15        76.2        99.2  
   C5      0.58        0.16        70.6        99.2  
   C6      0.52        0.15        73.6        99.2  
   Discharge      0.25        0.12        87.3        99.4  
3    Feed      1.94        0.25           98.6  
   C1-2      0.51        0.10        74.1        99.5  
   C3      0.29        0.05        85.3        99.7  
   C4      0.20        0.05        89.9        99.7  
   C5      0.12        0.05        93.9        99.7  
   C6      0.20        0.05        89.9        99.7  
   Discharge      0.19        0.05        90.4        99.7  
2    Bulk      0.41        0.16        78.9       
99.1
 

Table 10-30: Bench Top Autoclave Tests on Continuous Pressure Oxidation Feed Blend


Sample

   Sulfide Oxidation  
   45-min Baseline
POX

(%)
     45-min Acidic
POX

(%)
     60-min Acidic
POX

(%)
     75-min Acidic
POX

(%)
 

CONT

     48        82        89        80  


September 2026


SRK Consulting (U.S.), Inc.

SEC Technical Report Summary – Granite Creek

   Page 158


LOGO

Source: FLSmidth (2026)

Figure 10-24: Neutralization Lime Usage in Continuous Pressure Oxidation Discharge

Table 10-31: Continuous Pressure Oxidation, CIL Au Recovery


Test

   Au
Recovery

(%)
     NaCN
Consumption
(kg/t)
     NaCN
Consumption
(lb/st)
     Lime
Consumption

(kg/t)
     Lime
Consumption
(lb/st)
 

Run 1a

     77        1.38        3.35        2.40        5.83  

Run 1b

     77        1.31        3.18        2.49        6.05  

Run 2a

     80        1.82        4.42        42.86        104.16  

Run 2b

     76        2.02        4.91        34.96        84.96  

Run 3a

     88        1.62        3.94        49.89        121.24  

Run 3b

     88        1.49        3.62        56.10        136.33  

Bulk CIL

     68        0.84        2.04        66.54        161.70  

Table 10-32: Bench Top Autoclave, CIL Au Recovery


Sample

   45-min
Baseline POX

(%)
     45-min
Acidic POX

(%)
     60-min
Acidic POX

(%)
     75-min
Acidic POX

(%)
 

CONT

     77        94        96        96  

SGS Program Results

Results from the SGS pressure oxidation tests on the eight SPZ samples are shown in Table 10-33. The initial tests, with insufficient acid addition, achieved low sulfide oxidation of 15% to 30%, corresponding to low free acidity, minimal iron in solution, and high residual sulfide and sulfur content; once sufficient acid was added during the pH-2 pre-acidulation, good to excellent sulfide oxidation efficiencies were achieved, confirming that free acid availability is the leading control on POX


September 2026


SRK Consulting (U.S.), Inc.

SEC Technical Report Summary – Granite Creek

   Page 159


performance for all SPZ samples tested. Results from the baseline CIL tests (without POX pre-treatment) are shown in Table 10-34; these tests averaged 26.9% gold recovery and ranged from 3.6% to 56.0%, confirming the refractory nature of the SPZ material. Results from CIL testing of the POX residues, using the same conditions as the baseline tests, are shown in Table 10-35: the extent of sulfide oxidation was the controlling factor on gold recovery, with recovery consistently above 90% where POX oxidation was good to excellent, and lower recoveries always associated with poor oxidation. This dependence of gold recovery on sulfide oxidation is illustrated in Figure 10-25.


September 2026


SRK Consulting (U.S.), Inc.

SEC Technical Report Summary – Granite Creek

   Page 160


Table 10-33: POX Results


Test ID

   Sample ID    Acid
Addition

(kg/t)
     Acid Addition (lb/st)      POX Res.
Time

(min)
     POX Disch.
Free Acid

(g/
L H2SO4)
     POX
Residue S=

(%)
     POX
Mass Loss

(%)
     POX S=
Oxidation

(%)
 

POX 1

   SPZS      0        0.00        45        0.0        0.82        4.8        28.3  

POX 2R

   SPZS      356        865.14        45        9.41        0.20        -7.3        80.3  

POX 2RR

   SPZS      281        682.88        45        12.6        0.27        -2.7        74.6  

POX 3

   SPZS      290        704.75        60        8.92        0.19        -7.6        81.2  

POX 4

   SPZS      325        789.81        75        11.3        0.08        -11.4        91.8  

POX 5

   SPZM      0        0.00        45        0.0        1.45        4.0        23.1  

POX 6

   SPZM      80        194.41        45        0.0        1.50        -2.2        15.3  

POX 6R

   SPZM      121        294.05        45        10.3        0.47        -2.1        73.5  

POX 7

   SPZM      215        522.49        60        20.0        0.16        -6.1        90.6  

POX 8

   SPZM      148        359.67        75        39.3        0.08        -8.0        95.2  

POX 9

   SPZN      0        0.00        45        0.0        1.76        2.3        23.9  

POX 10

   SPZN      177        430.14        45        5.0        0.84        -6.2        60.5  

POX 10R

   SPZN      217        527.35        45        13.5        1.19        -3.9        45.3  

POX 11R

   SPZN      298        724.19        60        14.1        0.34        -45.8        78.1  

POX 12

   SPZN      227        551.65        75        18.5        < 0.05        -8.1        97.6  

POX 13

   SPZHG      0        0.00        45        0.0        1.57        -0.1        25.1  

POX 14

   SPZHG      13        31.59        45        0.0        1.52        -0.4        27.3  

POX 14R

   SPZHG      55        133.66        45        16.0        0.06        2.9        97.2  

POX 15

   SPZHG      60        145.81        60        16.0        0.51        -16.4        71.7  

POX 16

   SPZHG      84        204.13        75        23.7        < 0.05        3.9        97.7  

POX 17

   SPZLG      0        0.00        45        0.0        1.92        -1.7        27.6  

POX 18

   SPZLG      107        260.03        45        20.4        0.07        1.9        97.5  

POX 19

   SPZLG      111        269.75        60        23.4        < 0.05        2.8        98.2  

POX 20

   SPZLG      123        298.91        75        21.7        < 0.05        -18.2        97.8  

POX 21

   SPZCOM1      0        0.00        45        0.0        1.69        2.7        24.9  

POX 22

   SPZCOM1      56        136.09        45        0.0        1.84        0.2        16.2  

POX 22R

   SPZCOM1      96        233.30        45        15.8        0.27        -0.5        87.6  

POX 23

   SPZCOM1      182        442.29        60        19.5        0.06        11.4        97.6  

POX 23R

   SPZCOM1      120        291.62        60        10.2        0.79        -24.4        55.1  

POX 24

   SPZCOM1      116        281.90        75        16.2        0.30        7.1        87.3  

POX 25

   SPZCOM2      0        0.00        45        0.0        2.24        0.9        15.3  

POX 26

   SPZCOM2      137        332.93        45        0.0        2.30        4.3        16.0  

POX 26R

   SPZCOM2      187        454.44        45        23.2        0.05        -2.7        98.0  

POX 27

   SPZCOM2      145        352.38        60        10.3        0.91        -2.6        64.4  

POX 28

   SPZCOM2      184        447.15        75        8.25        < 0.05        1.5        98.1  

POX 29

   SPZCOM3      0        0.00        45        25.1        0.35        2.8        84.4  

POX 30

   SPZCOM3      12        29.16        45        33.1        < 0.05        10.4        97.9  

POX 31

   SPZCOM3      0        0.00        60        26.3        < 0.05        4.3        97.8  

POX 32

   SPZCOM3      0        0.00        75        23.3        < 0.05        1.7        97.7  


September 2026


SRK Consulting (U.S.), Inc.

SEC Technical Report Summary – Granite Creek

   Page 161


Table 10-34: Baseline CIL Results


Test

ID

   Sample
ID
   Calc
Head
Au (g/t)
     Calc Head
Au
(oz/st)
     Assayed
Residue
Au

(g/t)
     Assayed
Residue Au
(oz/st)
     Au
Extraction
(%)
     NaCN
Consumption

(kg/t)
     NaCN
Consumption
(lb/st)
     CaO
Consumption

(kg/t)
     CaO Consumption
(lb/st)
 

CIL 1

   SPZS      14.42        0.421        6.35        0.185        56.0        1.15        2.79        1.35        3.28  

CIL 2

   SPZM      7.84        0.229        7.56        0.221        3.6        0.70        1.70        0.95        2.31  

CIL 3

   SPZN      12.81        0.374        12.15        0.354        5.2        0.67        1.63        0.99        2.41  

CIL 4

   SPZHG      29.60        0.863        14.15        0.413        52.2        1.31        3.18        1.96        4.76  

CIL 5

   SPZLG      5.79        0.169        5.2        0.152        10.2        0.96        2.33        0.97        2.36  

CIL 6

   SPZCOM1      16.70        0.487        13.15        0.384        21.2        1.69        4.11        2.79        6.78  

CIL 7

   SPZCOM2      16.08        0.469        14.15        0.413        12.0        1.02        2.48        1.19        2.89  

CIL 8

   SPZCOM3      16.00        0.467        7.28        0.212        54.5        3.09        7.51        9.07        22.04  


September 2026


SRK Consulting (U.S.), Inc.

SEC Technical Report Summary – Granite Creek

   Page 162


Table 10-35: POX Residue CIL Results


Test ID

  Sample ID   POX
Test ID
    Calc Head Au
(g/t)
    Calc
Head Au (oz/st)
    Assayed Residue Au
(g/t)
    Assayed
Residue Au (oz/st)
    Au
Extraction
(%)
    NaCN
Consumption
(kg/t)
    NaCN
Consumption (lb/st)
    CaO
Consumption
(kg/t)
    CaO
Consumption (lb/st)
 

CIL 9

  SPZS     1       10.9       0.318       2.44       0.071       77.6       0.92       2.24       0.97       2.36  

CIL 10

  SPZS     2R       9.53       0.278       0.68       0.020       92.9       1.09       2.65       2.16       5.25  

CIL 12

  SPZS     2RR       10.2       0.298       1.06       0.031       89.6       0.88       2.14       2.15       5.22  

CIL 36

  SPZS     3       9.75       0.284       0.64       0.019       93.5       0.75       1.82       3.43       8.34  

CIL 37

  SPZS     4       9.48       0.277       0.50       0.015       94.8       0.64       1.56       2.33       5.66  

CIL 5

  SPZM     5       8.19       0.239       4.07       0.119       50.3       1.13       2.75       0.89       2.16  

CIL 6

  SPZM     6       8.02       0.234       3.90       0.114       51.4       1.24       3.01       0.81       1.97  

CIL 15

  SPZM     6R       7.54       0.220       1.52       0.044       79.9       1.34       3.26       4.00       9.72  

CIL 38

  SPZM     7       11.7       0.341       1.45       0.042       87.6       1.65       4.01       6.98       16.96  

CIL 39

  SPZM     8       7.27       0.212       0.44       0.013       94.0       0.78       1.90       4.61       11.20  

CIL 17

  SPZN     9       12.3       0.359       5.59       0.163       54.4       1.15       2.79       0.99       2.41  

CIL 18

  SPZN     10       11.6       0.338       1.66       0.048       85.7       1.45       3.52       1.87       4.54  

CIL 26

  SPZN     10R       12.0       0.350       1.94       0.057       83.8       1.58       3.84       4.76       11.57  

CIL 45

  SPZN     11R       11.6       0.338       0.88       0.026       92.4       1.12       2.72       5.49       13.34  

CIL 40

  SPZN     12       11.4       0.333       2.41       0.070       78.9       0.76       1.85       3.99       9.70  

CIL 13

  SPZHG     13       23.6       0.688       6.85       0.200       70.9       1.16       2.82       0.91       2.21  

CIL 14

  SPZHG     14       22.8       0.665       6.85       0.200       69.9       1.13       2.75       0.93       2.26  

CIL 16

  SPZHG     14R       22.3       0.650       1.51       0.044       93.2       0.68       1.65       2.56       6.22  

CIL 41

  SPZHG     15       13.1       0.382       0.95       0.028       92.7       1.26       3.06       4.74       11.52  

CIL 22

  SPZHG     16       18.4       0.537       1.11       0.032       94.0       0.91       2.21       3.31       8.04  

CIL 23

  SPZLG     17       5.61       0.164       2.22       0.065       60.5       1.03       2.50       0.63       1.53  

CIL 25

  SPZLG     18       5.42       0.158       0.50       0.015       90.9       0.91       2.21       3.53       8.58  

CIL 19

  SPZLG     19       5.25       0.153       1.53       0.045       71.0       1.05       2.55       2.58       6.27  

CIL 20

  SPZLG     20       5.16       0.151       0.28       0.008       94.6       1.05       2.55       3.12       7.58  

CIL 29

  SPZCOM1     21       15.8       0.461       7.95       0.232       49.7       1.57       3.82       1.67       4.06  

CIL 30

  SPZCOM1     22       15.5       0.452       8.39       0.245       45.7       0.95       2.31       1.13       2.75  

CIL 43

  SPZCOM1     22R       15.3       0.446       2.29       0.067       85.1       0.81       1.97       4.29       10.43  

CIL 46

  SPZCOM1     23R       15.2       0.443       4.36       0.127       71.3       0.84       2.04       5.23       12.71  

CIL 24

  SPZCOM1     24       16.7       0.487       1.39       0.041       91.7       1.38       3.35       5.27       12.81  

CIL 33

  SPZCOM2     25       14.8       0.432       6.75       0.197       54.3       1.16       2.82       0.85       2.07  

CIL 34

  SPZCOM2     26       14.3       0.417       7.98       0.233       44.3       1.02       2.48       0.73       1.77  

CIL 44

  SPZCOM2     26R       14.4       0.420       3.01       0.088       79.2       0.61       1.48       3.63       8.82  

CIL 21

  SPZCOM2     27       14.4       0.420       1.19       0.035       91.7       1.39       3.38       3.31       8.04  

CIL 28

  SPZCOM2     28       16.2       0.473       0.44       0.013       97.3       1.08       2.62       4.48       10.89  

CIL 29

  SPZCOM3     29       16.8       0.490       0.89       0.026       94.7       1.14       2.77       5.50       13.37  

CIL 35

  SPZCOM3     30       15.8       0.461       0.49       0.014       96.9       1.01       2.45       3.41       8.29  

CIL 31

  SPZCOM3     31       16.2       0.473       0.62       0.018       96.2       1.13       2.75       3.64       8.85  

CIL 32

  SPZCOM3     32       15.1       0.440       0.69       0.020       95.5       1.13       2.75       4.13       10.04  


September 2026


SRK Consulting (U.S.), Inc.

SEC Technical Report Summary – Granite Creek

   Page 163


LOGO

Source: i-80 Gold

Figure 10-25: South Pacific Gold Recovery as a Function of Sulfide Oxidation (SGS 2026)

Third-Party Toll Milling Results

Gold recovery results from the monthly toll milling bench top autoclave tests, from October 2023 through December 2025, are shown in Table 10-36; recovery averaged 91.1%, ranging from 88.9% to 95.4%.


September 2026


SRK Consulting (U.S.), Inc.

SEC Technical Report Summary – Granite Creek

   Page 164


Table 10-36: Gold Recovery Results from Toll Milling BTAC Tests


Lot

Month

   Calculated
Head
Grade Au

(g/t)
     Calculated Head
Grade Au (oz/st)
     Residue
Grade Au

(g/t)
     Residue
Grade
Au (oz/
st)
     Gold
Recovery
(%)
 

Oct-2023 (#1)

     10.02        0.292        0.89        0.026        90.5  

Oct-2023 (#2)

     10.13        0.295        1.07        0.031        88.9  

Mar-2025

     6.78        0.198        0.59        0.017        90.1  

Apr-2025

     7.10        0.207        0.62        0.018        90.5  

May-2025

     5.83        0.170        0.57        0.017        89.1  

Jun-2025

     6.25        0.182        0.65        0.019        89.6  

Jul-2025

     9.60        0.280        0.86        0.025        90.2  

Aug-2025

     8.06        0.235        0.48        0.014        93.6  

Sep-2025

     7.86        0.229        0.34        0.010        95.4  

Oct-2025

     8.07        0.235        0.55        0.016        93.3  

Nov-2025

     6.47        0.189        0.50        0.015        91.4  

Dec-2025

     7.64        0.223        0.65        0.019        90.5  

Gold Recovery — Basis for Recovery Estimates

Expected gold recoveries for the Granite Creek Underground Project were developed from the BTAC test data described above, by mining zone and material type.

Oxide-type material will not require pressure oxidation to achieve acceptable gold recovery and will be processed directly by CIL. Gold recovery in CIL bottle roll tests on Granite Creek Underground samples, as a function of cyanide-soluble gold percent and of sulfide sulfur content, is shown in Figure 10-26 and Figure 10-27, respectively; at the lower range of sulfide sulfur content, CIL recovery decreases approximately linearly with increasing sulfide sulfur, and this portion of the data was used to model oxide CIL recovery (only samples below 1% sulfide sulfur were considered for the sulfide sulfur-based function, since samples above 1% sulfide sulfur would not be processed by CIL alone without pressure oxidation). Combining the two regressions as an average yields an expression for gold recovery by CIL without pressure oxidation as a function of cyanide-soluble gold, fire-assayed gold, and sulfide sulfur content, capped at a maximum recovery of 87.4% (the maximum gold recovery achieved in any of the tests).


September 2026


SRK Consulting (U.S.), Inc.

SEC Technical Report Summary – Granite Creek

   Page 165


LOGO

Source: i-80 Gold

Figure 10-26: CIL Recovery vs Cyanide Soluble Gold Percent


LOGO

Source: i-80 Gold

Figure 10-27: CIL Recovery vs Feed Sulfide Sulfur Content


September 2026


SRK Consulting (U.S.), Inc.

SEC Technical Report Summary – Granite Creek

   Page 166


Gold recovery by pressure oxidation and CIL at the Lone Tree facility is estimated by mining zone, based on bench top autoclave tests conducted at FLSmidth and SGS at the expected operating conditions of the Lone Tree facility.

OG Zone gold recovery is plotted as a function of gold head grade and organic carbon content in Figure 10-28 and Figure 10-29, respectively, for tests at the expected Lone Tree operating conditions; combining these two regressions as an average yields an expression for gold recovery by CIL after pressure oxidation as a function of gold head grade and organic carbon content.


LOGO

Source: i-80 Gold

Figure 10-28: OG Zone Gold Recovery vs Gold Head Grade


September 2026


SRK Consulting (U.S.), Inc.

SEC Technical Report Summary – Granite Creek

   Page 167


LOGO

Source: i-80 Gold

Figure 10-29: OG Zone Gold Recovery vs Organic Carbon Content

Gold recovery of Otto Zone material was consistent across the four samples tested at expected Lone Tree operating conditions, shown in Table 10-37; the average of these values, 89.3%, was selected as the expected recovery by pressure oxidation-CIL at Lone Tree for the Otto Zone.

Table 10-37: BTAC Gold Recovery Results on Otto Zone Samples


Program

   Sample ID      Au Recovery (%)  

FLS-2023

     OTU        90.0  

FLS-2023

     OTL        90.3  

FLS-2023

     OTHG        87.0  

FLS-2023

     OTLG        90.0  

Recovery for the SPZ was estimated using data from tests conducted at expected Lone Tree conditions from the 2025 SGS program. Figure 10-30 through Figure 10-32 show sulfide oxidation versus carbonate content, mass loss in pressure oxidation versus carbonate content, and CIL gold recovery as a function of CIL feed sulfide sulfur content (after POX), respectively. Samples with higher carbonate content tended to be less oxidized after acid pressure oxidation at Lone Tree conditions, and higher carbonate content resulted in a mass gain as gypsum formed with sulfuric acid addition; the resulting sulfide sulfur grade of the POX residue controlled downstream CIL gold recovery, with higher residual sulfide values corresponding to lower gold recovery. Combining the resulting regression lines with head sulfide sulfur content yields an expression for SPZ gold recovery as a function of carbonate and sulfide sulfur content in the feed, capped at 98.0% (the highest recovery achieved in any of the testing at expected Lone Tree conditions).


September 2026


SRK Consulting (U.S.), Inc.

SEC Technical Report Summary – Granite Creek

   Page 168


LOGO

Source: i-80 Gold

Figure 10-30: Sulfide Oxidation vs Carbonate Content, 45-Minute Retention Time, Acidic Conditions


LOGO

Source: i-80 Gold

Figure 10-31: Mass Loss versus Carbonate Content, 45-Minute Retention Time, Acidic Conditions


September 2026


SRK Consulting (U.S.), Inc.

SEC Technical Report Summary – Granite Creek

   Page 169


LOGO

Source: i-80 Gold

Figure 10-32: CIL Gold Recovery vs CIL Feed Sulfide Sulfur, All Conditions

The toll milling facility performs bench top autoclave testing on each monthly lot of sulfide material shipped to it, as described in Section 10.1; the average recovery of these tests, 91.1%, has been relatively consistent within a tight range since inception of toll milling operations, and 91.1% is accordingly the expected recovery for material processed by pressure oxidation-CIL at the toll milling facility.

Several processing factors and deleterious elements were identified across the test programs that affect, or could affect, gold and silver recovery: all FLSmidth 2022 samples demonstrated some degree of preg-robbing (average preg-robbing index 17.9%, ranging from 4.4% to 54.1%), consistent with historical preg-robbing observed in Mag Pit samples, though CIL improved recoveries over baseline cyanide shake tests by only an average of 4.1%, indicating CIL counteracts preg-robbing only to a small extent; two FLSmidth 2022 samples (APL and APLG) showed elevated swelling clay content that required attention (trona addition) during POX treatment; acidic POX conditions, while producing higher sulfide oxidation and gold recovery than alkaline conditions, consume substantially more lime and appear to lock silver within jarosite, which does not form under alkaline conditions, resulting in markedly lower silver recovery under acidic POX; and SGS mineralogical work on the South Pacific Zone found no free arsenopyrite liberation in any sample, suggesting the zone’s refractory gold is likely associated with arsenic. These factors are accounted for in the zone-specific recovery models described above.


September 2026


SRK Consulting (U.S.), Inc.

SEC Technical Report Summary – Granite Creek

   Page 170


10.5

Adequacy of Data and Non-Conventional Industry Practice

The metallurgical test programs described in Sections 10.1 through 10.4 — spanning autoclave pre-treatment testing (Dawson, 2005-2006), comprehensive characterization and pressure oxidation testing (FLSmidth, 2022-2023), pilot-scale continuous pressure oxidation testing on a representative blended feed (FLSmidth, 2025-2026), pressure oxidation and cyanidation testing focused on the South Pacific Zone (SGS, 2025-2026), and ongoing production-scale bench top autoclave testing at the third-party toll milling facility — collectively provide, in the opinion of the QP, an adequate basis for the gold recovery estimates used in this technical report summary. The test samples span the primary mineralized zones of the Granite Creek Underground deposit (OG, Otto, Adams Peak, Deep Range Front, Range Front, and South Pacific), and their grade and compositional characteristics (gold, organic carbon, carbonate, and sulfide sulfur) are consistent with the range expected in the projected life-of-mine feed (Section 10.2). Recovery estimates for each zone are based on regression relationships developed from batch and, where available, continuous test data at the expected operating conditions of the Lone Tree pressure oxidation facility, informed by ongoing production-scale reconciliation data from the toll milling facility currently processing Granite Creek Underground material — providing an actual operating cross-check on the bench-scale recovery estimates. The pressure oxidation (POX) and carbon-in-leach (CIL) processes tested for the refractory sulfide gold mineralization at Granite Creek Underground, and the associated comminution, cyanide destruction, and solids-liquids separation test methods, are conventional, industry-standard metallurgical testing procedures for refractory Carlin-style gold ore; the analytical procedures used across all five test programs are consistent with conventional industry practice, and no non-conventional testing procedures were identified in the source technical documentation reviewed by the QP.


September 2026


SRK Consulting (U.S.), Inc.

SEC Technical Report Summary – Granite Creek

   Page 171


11

Mineral Resource Estimate

The Mineral Resource for the Granite Creek Underground Project has been developed as two separate estimates, reflecting the deposit’s two distinct extraction methods. The open pit Mineral Resource was estimated by GRE and remains unchanged from the previously disclosed estimate in terms of underlying drilling, sampling, and technical information; GRE updated only its assessment of reasonable prospects for economic extraction (RPEE) to reflect the current resource gold price. The underground Mineral Resource was estimated by SRK Consulting using the exploration database supporting the underground operation completed by i-80 Gold Corp. The effective date of both the open pit and underground Mineral Resource estimates is March 31, 2026.


11.1

Open Pit

The Mineral Resource Statement presented herein is updated from the 2025 Technical Report, “Initial Assessment SK-1300 Technical Report, Granite Creek Mine Project, Humbolt County, Nevada, USA,” with an effective date of December 31, 2024, and an issue date of March 26, 2025, with the following new data:


Seventeen new drillholes with 2,195 new gold assays have been added to the database.


Major faults used for structural trends of gold grade continuity have been updated with input from i-80 Geology team.


Economically feasible gold price based on a 36-month trailing average has been calculated for defining potentially minable resources.

The Mineral Resources were estimated in conformity with the Society for Mining, Metallurgy and Exploration (SME) best practice guidelines and are reported in accordance with the S-K 1300 Requirements. There is also no certainty that the Inferred Mineral Resources will be converted to the Measured or Indicated categories through further drilling or into Mineral Reserves, once economic considerations are applied. Mineral Resources are not Mineral Reserves and do not have demonstrated economic viability. There is no certainty that all or any part of the mineral resource will be converted into Mineral Reserves. The open pit project presently has no Mineral Reserves. Whittle Pit optimization was applied to the open pit MRE to assess the reasonable prospects for economic extraction (RPEE) for the resource.

The open pit MRE for the Granite Creek Mine Project was completed by GRE an independent QP as defined in SK-1300. The effective date of the open pit resource statement is March 31, 2026. In the opinion of GRE, the MRE reported here is a reasonable representation of the Mineral Resources found in the open pit portion of the Granite Creek Mine Project at the current level of sampling.


11.1.1

Drillhole Database

GRE performed a data validation of the drillhole database prepared by i-80 for the Granite Creek deposit and determined it to be of suitable accuracy to perform an MRE for the open pit portion of the property. More details regarding the validation of the drillhole database can be found in Section 12. The drill hole data for the Granite Creek Mine Project was delivered as separate .csv files that contained exploration and production collar locations, drillhole survey orientations, sample intervals with gold assays in ppm, geologic intervals with lithology, alteration type, and alteration strength. The collar locations are projected in a local grid system, with planar and elevation units in feet. All downhole intervals are captured in feet.


September 2026


SRK Consulting (U.S.), Inc.

SEC Technical Report Summary – Granite Creek

   Page 172


The complete data set contained assays, collar, and survey data for a total of 2,855 exploration holes (surface, underground, and trench samples) and 695 production holes (surface and underground). Drilling is a mix of RC drilling, diamond drilling, and RC pre-collar with diamond drilling to final depth. The exploration assay file contains 212,839 gold assays. The production data assay file contains 1,477 gold assays. The drillhole collar locations are shown in Figure 11-1.


LOGO

Source: GRE, 2021, reviewed and confirmed 2026

Note: This figure is intended to show the relative distribution of surface drillhole collars on topography around the areas of interest. This figure does not show all collars that have been drilled.

Figure 11-1: Drillhole Used Plan View on Topography

A number of negative, missing, and blank assay values exist in the drillhole data files provided to GRE by i-80. Missing intervals and values were assumed to be non-mineralized and therefore assigned a value of half of the most common detection limit used to assay the samples. Negative assay values were replaced according to Table 11-1.


September 2026


SRK Consulting (U.S.), Inc.

SEC Technical Report Summary – Granite Creek

   Page 173


Table 11-1: Negative Values in Drillhole Database


Non-Positive Value


Interpretation


Count In Data Set


Action Taken

-0.005

   below detection limit of 0.005 opt    6417    replaced with 0.0857 ppm

-0.003

   below detection limit of 0.003 ppm    2723    replaced with 0.0015 ppm

-0.9943

   below detection limit of 0.029 opt    429    replaced with 0.0857 ppm

-5557

   Sample Not Received    3    Omit

-5556

   Sample Not Received    80    Omit

-0.0343

   Half the detection limit of 0.002opt    926    replaced with 0.0343 ppm

-0.1714

   below detection limit for 0.005 opt    52    replaced with 0.0857 ppm

-3394.2842

   conversion of -99 opt to ppm    13    replaced with 0.0857 ppm

Source: GRE, 2026


11.1.2

Topography

Topography was provided by i-80 as .dxf files with triangulated surfaces. The files included both as built surfaces showing dimensions of previously mined pits at their maximum depths, and present topography which includes backfill, pits, dumps, and surrounding topography. The current topographic data was loaded into Leapfrog Geo and used to constrain the block model. The topographic data provided by i-80 was not rectangular, which is required within Leapfrog to generate models; therefore, GRE extrapolated topographic data around the edges to form a rectangular surface (Figure 11-2). The extrapolated area, however, is not part of the resource estimate.


September 2026


SRK Consulting (U.S.), Inc.

SEC Technical Report Summary – Granite Creek

   Page 174


LOGO

Source: GRE, 2021, reviewed and confirmed 2026

Figure 11-2: Current Topography Used for Open Pit Resource Estimation


11.1.3

Geologic Model

The geologic model used to complete the MRE was developed by Dr. Samari of GRE using grouped majority composites for lithology based on data provided to GRE as part of the drillhole database. Material below the current topography and above the as-built surface was classified as backfill and assigned an Au ppm grade of zero. Figure 11-3 illustrates the geologic model used in the resource estimation. The model was validated for geologic accuracy and found to be suitable for the purpose of mineral resource estimation by GRE as defined in SK-1300.


September 2026


SRK Consulting (U.S.), Inc.

SEC Technical Report Summary – Granite Creek

   Page 175


LOGO

Source: GRE, 2021, reviewed and confirmed 2026

Figure 11-3: Open Pit Geologic Model, Oblique View


11.1.4

Estimation Domains

Estimation zones were created by constraining the assays that surround the existing open pit areas (Figure 11-4). The underground zone to the North of Zone 3 / CX Pit was not considered since this area was estimated in the underground resource section of this technical report. Vertical extents of the estimation zones range from 1,676 m (5,500 ft) amsl to 762 m (2,500 ft) amsl.


September 2026


SRK Consulting (U.S.), Inc.

SEC Technical Report Summary – Granite Creek

   Page 176


LOGO

Source: GRE, 2021, reviewed and confirmed 2026

Figure 11-4: Open Pit Estimation Zones

Table 11-2 summarizes the estimation zone numbers along with the corresponding pits.

Table 11-2: Open Pit Estimation Zone and Pit Name


Estimation Zone


Pit Name

    
  Zone 1    A Pit   
  Zone 2    Mag Pit   
  Zone 3    CX Pit   
  Zone 4    B Pit   

Source: GRE, 2021

Numeric indicator models using gold were constructed to better define the high-grade mineralized domains contained within the generalized estimation domains to fit around the existing pits. The parameters used to define the indicator models are shown in Table 11-3.

Table 11-3: Open Pit Numeric Indicator Model Parameters


Estimation Zone

   Indicator
Model
Cut-off (Au
ppm)
     ISO Value      Search
Distance
(ft)
     Search Distance
(m)
     Dynamic Anisotropy

Zone 1

     1.0        0.4        200        61.0      CX Fault

Zone 2

     1.0        0.3        250        76.2      Mag Fault

Zone 3 CX

     0.1        0.4        180        54.9      CX Fault

Zone 3 SOS Dike

     0.1        0.4        100        30.5      SOS Dike

Zone 3 SOS XSECTION

     0.1        0.3        150        45.7      SOS X Section Fault

Zone 4

     1.0        0.3        200        61.0      NA*

*Because Zone 4 did not use dynamic anisotropy, a global trend set to the following parameters was used: dip 90, dip Azimuth 100, pitch 75, and ellipse ratios max. 200, int. 200, min. 100.


September 2026


SRK Consulting (U.S.), Inc.

SEC Technical Report Summary – Granite Creek

   Page 177


Source: GRE, 2021

Initial search ellipse orientations were set from examining the spatial orientation of the composites greater than 1 g/t (0.029 oz/st) (Figure 11-5). After initial construction of the high-grade solids using indicator models, it was noted that some of the high-grade numeric models had voids or otherwise poor geometry. When examining the fault structures, it was noted that the high-grade domain corresponded well with the location and orientation of several fault structures. Dr. Samari of GRE then attempted to add a structural trend using dynamic anisotropy to the numeric model by constructing a structural trend from the fault meshes. This improved the continuity of the indicator models and helped eliminate voids that were previously present in the indicator models. ISO factor values, which are defined as a specified numeric threshold value used for indicator Radial Basis Function (RBF) interpolants to generate a volume, for interpolants were based on visually examining the mineralized body and using an iterative process to select a value that produced a reasonable geologic shape that respected the informing data. If small islands of volume were created off the major trend, they were clipped out.


LOGO

Source: GRE, 2021, reviewed and confirmed 2026

Note: The opaque red solid represents the high-grade domain. The transparent red solid is the low-grade domain. Composite grades are shown at a cut-off of 1 ppm.

Figure 11-5: Example of Numeric Indicator High-Grade Trend Analysis, Mag Pit

One resource estimation zone, Zone 3, was broken into several sub-domains after failing to produce a reasonable high grade numeric indicator model using a single global trend within the Zone 3 domain. It was noted that during the initial attempt, branching solids formed displaying three distinct trends. Upon further investigation it was found that these trends corresponded to fault structures that crosscut the Zone 3 domain. The identified structural trends are the CX fault, the SOS Dike, and the SOS X-Section.


September 2026


SRK Consulting (U.S.), Inc.

SEC Technical Report Summary – Granite Creek

   Page 178


To construct estimation sub-domains, GRE offset the fault meshes both forwards and backwards to a thickness that contained most of the high-grade intercept (Figure 11-6). Separate numeric estimators were constructed within these domains, and high-grade and low-grade zones were defined within the zones that contained the mineralized trends (Figure 11-7). To later avoid estimation boundary issues during resource estimation, the volumes on either side of the mineralized domains were separated into sub domains. These include the HW 1, HW 2, HW 3, and FW zones.


LOGO

Source: GRE, 2021, reviewed and confirmed 2026

Figure 11-6: Open Pit Zone 3 Sub-Domains


September 2026


SRK Consulting (U.S.), Inc.

SEC Technical Report Summary – Granite Creek

   Page 179


LOGO

Source: GRE, 2021, reviewed and confirmed 2026

Note: The high-grade zone is shown in green, the low-grade domain is shown in purple.

Figure 11-7: High-Grade and Low-Grade Open Pit Domains in the CX Fault

Domain Analysis

To check the validity of the high grade and low-grade estimation domains box and whisker plots were constructed, as shown in Figure 11-8. Generally, a good correlation was observed between the high -grade and low-grade solids and the distribution of the grades contained within them.


September 2026


SRK Consulting (U.S.), Inc.

SEC Technical Report Summary – Granite Creek

   Page 180


LOGO

Source: GRE, 2026

Figure 11-8: Box and Whisker Plot of Open Pit Estimation Domains


September 2026


SRK Consulting (U.S.), Inc.

SEC Technical Report Summary – Granite Creek

   Page 181


LOGO

Source: GRE, 2026

Figure 11-9: Histograms of the High-Grade and Low-Grade Distributions in Zones 1 and 2


September 2026


SRK Consulting (U.S.), Inc.

SEC Technical Report Summary – Granite Creek

   Page 182


LOGO

Source: GRE, 2026

Figure 11-10: Histograms of the High-Grade and Low-Grade Distributions in Zones 3 and 4


11.1.5

Compositing

Sample data was composited to intervals of equal length as a bias reduction measure to ensure that the samples used in statistical analysis and estimations were equally weighted. To accomplish compositing, Ms. Lane of GRE first examined the sample length interval histogram to determine the most common assay length (Figure 11-11).


September 2026


SRK Consulting (U.S.), Inc.

SEC Technical Report Summary – Granite Creek

   Page 183


LOGO

Source: GRE, 2026

Figure 11-11: Open Pit Sample Interval Length Statistics of Au ppm Assays

Once it was determined that 2 m (5 ft) was the primary assay length, Ms. Lane of GRE evaluated various compositing lengths using 2 m (5 ft) intervals to avoid splitting assays. It was decided that compositing on a 6 m (20 ft) interval represented a significant decrease in the variance of the data while not adversely decreasing the mean of the data set, as shown in Table 11-4. Therefore, Ms. Lane of GRE selected a 26 m (0 ft ) composite interval.


September 2026


SRK Consulting (U.S.), Inc.

SEC Technical Report Summary – Granite Creek

   Page 184


Table 11-4: Open Pit Compositing Interval Statistics


Statistic

   AU_ppm_Assays      Composite Interval  
   5 ft      10 ft      15 ft      20 ft      25 ft  

Count

     221,062        264,712        133,121        88,217        66,103        52,752  

Length

     1,323,435.3        1,323,396.9        1,323,367.4        1,322,037.1        1,321,859.4        1,321,327.9  

Mean

     0.362        0.362        0.361        0.358        0.357        0.354  

SD

     2.58        2.49        2.31        2.08        1.95        1.87  

CV

     7.1        6.9        6.4        5.8        5.5        5.3  

Variance

     6.6        6.2        5.4        4.3        3.8        3.5  

Minimum

     0        0        0        0        0        0  

Q1

     0.0170        0.0171        0.0171        0.0171        0.0171        0.0171  

Q2

     0.0170        0.0171        0.0274        0.0343        0.0343        0.0343  

Q3

     0.0860        0.0857        0.0857        0.0857        0.0857        0.0857  

Maximum

     290.06        290.06        290.06        119.89        94.33        85.08  

Source: GRE, 2026

A box plot comparison of the 6 m (20 ft) composited and the uncomposited assays is shown in Figure 11-12. This comparison shows that compositing, while not changing the mean or quartiles, does drastically reduce the maximum value of grades. Table 11-5 shows the open pit compositing comparison at 6 m (20 ft) intervals.


LOGO

Source: GRE, 2026

Figure 11-12: Open Pit Compositing Comparison, 6 m (20 ft) Intervals


September 2026


SRK Consulting (U.S.), Inc.

SEC Technical Report Summary – Granite Creek

   Page 185


Table 11-5: Open Pit Compositing Comparison, 6 m (20 ft) Intervals


Statistic

   Composited      Uncomposited  

Count

     67,143        224,077  

Length

     1,342,141.4        1,343,991.7  

Mean

     0.36        0.36  

SD

     1.95        2.58  

CV

     5.45        7.11  

Variance

     3.81        6.65  

Minimum

     0        0  

Q1

     0.017        0.017  

Q2

     0.034        0.017  

Q3

     0.086        0.086  

Maximum

     94.329        290.057  

Source: GRE, 2026


11.1.6

Evaluation of Outliers

Cumulative probability plots for gold were completed for the composites within each estimation domain (Figure 11-13). A break in the population was identified and marked with the clipping line. Based on this analysis, Ms. Lane of GRE applied a maximum allowable value for the gold grade within each separate domain, as shown in Table 11-6.


LOGO

Source: GRE, 2026

Figure 11-13: Example of Open Pit Cumulative Log Probability Plot, Zone 1 HG


September 2026


SRK Consulting (U.S.), Inc.

SEC Technical Report Summary – Granite Creek

   Page 186


Table 11-6: Open Pit Upper Clipping (Capping) Au ppm Values by Domain


Zone

   Sub-Domain      Clipping Value  

Zone 1

     HG        35  
     LG        NA  

Zone 2

     HG        10  
     LG        5  

Zone 3

     CX HG        20  
     CX LG        10  
     SOS DIKE HG        NA  
     SOS DIKE LG        NA  
     SOS XSECTION HG        NA  
     SOS XSECTION LG        NA  
     HW 1        7  
     HW 2        3  
     HW 3        7  
     FW        12  

Zone 4

     HG        NA  
     LG        3  

Source: GRE, 2026


11.1.7

Density

Density was assigned to each domain in the block model based on a combination of rock type and grade, as shown in Table 11-7. The bulk densities are the same as those used in the 2020 Getchell Project Technical Report (AMC, 2020) and were originally supplied by OMC. The results for each domain fit well with GRE’s experience with similar rock types.

Table 11-7: Open Pit Domain Density Summary


Unit

   Au>=0.008 opt
(tonne/m3)
     Au<0.008 opt
(tonne/m3)
 

Backfill

     1.85        1.85  

Alluvium

     1.85        1.85  

Granodiorite

     2.7        2.7  

Upper Comus

     2.5        2.7  

Lower Comus

     2.51        2.64  

Preble

     2.42        2.6  

Source: GRE, 2026


11.1.8

Variography

After iterative analysis, a good fit for the gold grade variography was found using pairwise relative variograms. The pairwise relative variogram helps to smooth the variogram by scaling g(h) using the square of the mean of each sample pair of the data from calculating g(h). This helps make the interpretation of the variogram model easier, and all variances calculated this way are relative to the mean of the sample pairs within the distribution.

Variogram analysis was completed on the samples within each of the high-grade and low-grade estimation domains to establish the direction of maximum continuity between sample pairs. The range for each variogram was found using a global variogram. The nugget was calculated by examining the downhole variograms and determining where the short-range trend crossed the y-axis. Variograms were oriented along the strike and dip of the visually observed high-grade trend of the composites, with the major axis oriented along the direction of maximum continuity (Table 11-8).


September 2026


SRK Consulting (U.S.), Inc.

SEC Technical Report Summary – Granite Creek

   Page 187


Table 11-8: Open Pit Variogram Parameters


Zone

   Sub-Domain   Dip      Dip Azimuth      Pitch      Major Axis
(ft)
     Major Axis
(m)
     Semi-Major
Axis (ft)
     Semi-Major
Axis (m)
     Minor Axis
(ft)
     Minor Axis
(m)
 

Zone 1

   Overall     38        134        75        200        61.0        200        61.0        100        30.5  
   HG     38        134        160        160        48.8        160        48.8        75        22.9  
   LG     38        134        75        175        53.3        175        53.3        60        18.3  

Zone 2

   Overall     50        70        105        250        76.2        250        76.2        100        30.5  
   HG     50        70        75        180        54.9        125        38.1        75        22.9  
   LG     50        70        105        300        91.4        200        61.0        200        61.0  

Zone 3

   Overall*     56        135        75        160        48.8        160        48.8        125        38.1  
   CX     56        135        75        180        54.9        160        48.8        70        21.3  
   CX HG     56        135        75        80        24.4        80        24.4        50        15.2  
   CX LG     56        135        75        50        15.2        50        15.2        50        15.2  
   SOS Dike     65        170        45        100        30.5        80        24.4        50        15.2  
   SOS DIKE HG     65        170        45        100        30.5        80        24.4        75        22.9  
   SOS DIKE LG     65        170        45        100        30.5        50        15.2        25        7.6  
   SOS XSECTION     80        170        80        150        45.7        125        38.1        50        15.2  
   SOS XSECTION HG     80        170        80        80        24.4        80        24.4        80        24.4  
   SOS XSECTION LG     80        170        105        150        45.7        125        38.1        50        15.2  
   HW 1     56        135        150        160        48.8        100        30.5        125        38.1  
   HW 2     56        135        100        160        48.8        160        48.8        125        38.1  
   HW 3     56        135        75        160        48.8        160        48.8        125        38.1  
   FW*     56        135        70        140        42.7        125        38.1        125        38.1  

Zone 4

   Overall     90        100        75        200        61.0        200        61.0        100        30.5  
   HG     90        100        90        60        18.3        60        18.3        25        7.6  
   LG     90        100        75        300        91.4        225        68.6        75        22.9  

Source: GRE, 2026


11.1.9

Block Model Parameters

A 3D block model was developed to represent the open pit deposit using a block size of 25 ft x 25 ft x 20 ft. The block model dimensions and model limits are shown in Table 11-9. The coordinate system used for the 3D modeling was based on the local grid system using imperial units of feet. The block model is un-rotated and contains no sub blocking.

Table 11-9: Open Pit Block Model Parameters


Parameter

   Value
Base point    6000,7000,5800 (X,Y,Z)
Parent block size    25x25x20 (X,Y,Z)
Azimuth Rotation    0
Boundary size    9000,7000,3000 (X,Y,Z)
Size in Blocks    360x280x150 (X,Y,Z)
Sub-blocking    None

Source: GRE, 2026


11.1.10

Estimation Domains

The estimation domains used to constrain the MRE resulted from the numeric indicator models developed as part of the geologic model as discussed in Section 14.2.4.

Figure 11-14 shows an overview of the estimation domains that were used to constrain the mineral resource estimation for the open pit MRE.


September 2026


SRK Consulting (U.S.), Inc.

SEC Technical Report Summary – Granite Creek

   Page 188


LOGO

Source: GRE, 2021, reviewed and confirmed 2026

Figure 11-14: Open Pit Numeric Indicator Models


11.1.11

Estimation Parameters

Estimation within mineralized domain boundaries was performed using an inverse distance squared method with a minimum of 4 samples, a maximum of 20 samples, and a drillhole limit of 2. Declustering objects were applied to all high-grade estimation domains. Dynamic anisotropy was applied where it was applicable based on faults that structurally control mineralization. The exception to this was Zone 4, which has no apparent structural control that has yet been mapped. In this case, search ellipse orientation was determined from examining the spatial orientation of the composites greater than 1 g/t. (0.029 oz/st)

Search distances of the domained estimators were based on the variography for each sub-domain, as discussed in Section 14.1.7. Search distances for domains that showed poor variography were replaced by the overall sub-domain or overall domain search distances. This method was used for the Zone 4 HG and LG estimations and the Zone 3 sub-domains. All estimations used hard boundaries except for the boundaries between Zone 1 HG and Zone 3 HG and between Zone 1 LG and Zone 4 LG. Soft 40-foot boundaries were set up with filters between these boundaries since they are immediately adjacent to each other and could potentially have continuity in grade estimation across these boundaries. The inverse distance estimation parameters for each domain are given in Table 11-10.


September 2026


SRK Consulting (U.S.), Inc.

SEC Technical Report Summary – Granite Creek

   Page 189


Table 11-10: Open Pit ID2 Estimation Parameters


Zone

   Sub-Domain    Dynamic
Anisotropy
     Trend      Major
(ft)
     Major
(m)
     Semi-Major
(ft)
     Semi-Major
(m)
     Minor
(ft)
     Minor
(m)
 

Zone 1

   HG      Yes        CX Fault        160        48.8        160        48.8        75        22.9  
   LG      Yes        CX Fault        175        53.3        175        53.3        60        18.3  

Zone 2

   HG      Yes        Mag Fault        180        54.9        125        38.1        75        22.9  
   LG      Yes        Mag Fault        300        91.4        200        61.0        200        61.0  

Zone 3

   CX HG      Yes        CX Fault        180        54.9        160        48.8        70        21.3  
   CX LG      Yes        CX Fault        180        54.9        160        48.8        70        21.3  
   SOS DIKE HG      Yes        SOS Dike        100        30.5        80        24.4        50        15.2  
   SOS DIKE LG      Yes        SOS Dike        100        30.5        80        24.4        50        15.2  
   SOS XSECTION HG      Yes        SOS Xsection        150        45.7        125        38.1        50        15.2  
   SOS XSECTION LG      Yes        SOS Xsection        150        45.7        125        38.1        50        15.2  
   HW 1      Yes        CX Fault        160        48.8        100        30.5        125        38.1  
   HW 2      Yes        CX Fault        160        48.8        160        48.8        125        38.1  
   HW 3      Yes        CX Fault        160        48.8        160        48.8        125        38.1  
   FW      Yes        CX Fault        160        48.8        160        48.8        125        38.1  

Zone 4

   HG      No        90,100,90        200        61.0        200        61.0        100        30.5  
   LG      No        90,100,75        200        61.0        200        61.0        100        30.5  

Source: GRE, 2026

After each domained estimator was constructed, a combined estimator was used to assign a hierarchical value to each domained estimation to produce a single gold grade value. The combined estimator hierarchy is shown in Table 11-11.

Table 11-11: Open Pit Combined Estimator Hierarchy


Priority


Domained Estimation


Priority


Domained Estimation

1    Zone 1 HG    11    Zone 3 HW 3
2    Zone 1 LG    12    Zone 3 HW 1
3    Zone 2 HG    13    Zone 3 HW2
4    Zone 2 LG    14    Zone 3 FW
5    Zone 3 CX HG    15    Zone 4 HG
6    Zone 3 CX LG    16    Zone 4 LG
7    SOS Dike HG    17    Zone 1
8    SOS Dike LG    18    Zone 2
9    SOS Xsection HG    19    Zone 3
10    SOS Xsection LG    20    Zone 4

Source: GRE, 2026

The overall domain grade estimations were assigned to priority 17 to 20 so that they would fill in areas of the numeric estimator domains that lacked the required number of samples to be able to estimate grade due to the small volume being estimated that excluded drillholes.


11.1.12

Geometallurgical Modeling

Section 13.5 goes into detail of how the gold recovery model was estimated and implemented in the block model.

Cyanide solubility was compared to all available interval information from the drilling data: gold assay, alteration, lithology, depth, etc. From this available data, a principal component analysis, regression tree, and multivariate adaptive regression spline analysis were performed. A multivariate adaptive regression spline analysis model was created to predict cyanide solubility in different zones using the available drilling data. Heap Leach (HLCL) recovery was determined by plotting the cyanide solubility with the column recovery. The carbon in leach (CIL) recovery equation was determined by plotting the trend with the calculated head grade and CIL recovery.


September 2026


SRK Consulting (U.S.), Inc.

SEC Technical Report Summary – Granite Creek

   Page 190


The input fields required in the recovery equations were added to the block model. Then, the recovery equations were applied to the block model for HLCH and CIL recoveries. These recoveries, along with the Whittle inputs from Table 14 5, were used to determine which of the two processes would be applied to each block.


11.1.13

Block Model Validation

Validation of the estimated block grades for the open pit MRE were completed for each of the estimation domains. The resource block model estimate was validated by:


Completing a series of visual inspections by comparisons of gold assay and composite grades to estimated block values across the deposit in both horizontal and vertical sections.


Statistical comparison of parameters such as means, quantiles, and variance between 6 m (20 ft) composites, Nearest Neighbor (NN), Inverse Distance squared (ID2), and Ordinary Kriged (OK) estimators to ensure that the grade estimations are representative of the composites they are based on.


Comparing average composite sample values with average estimated block grades along east, north, and elevation orientations using swath grade trend plots.

Visual Inspection

The block model was examined in plan and section views to compare to drillhole locations and grades. Plan views and section views for each of the estimation areas are shown in Figure 11-15 through Figure 11-22. Comparison of the block model grade from the assays did not reveal any major discrepancies. In the section views, blocks above current topography have been removed.


LOGO

Source: GRE, 2026

Figure 11-15: Open Pit Zone 1 Visual Comparison Composite to Block Model Grade, Plan View


September 2026


SRK Consulting (U.S.), Inc.

SEC Technical Report Summary – Granite Creek

   Page 191


LOGO

Source: GRE, 2026

Figure 11-16: Open Pit Zone 2 Visual Comparison Composite to Block Model Grade, Plan View


LOGO

Source: GRE, 2026

Figure 11-17: Open Pit Zone 3 Visual Comparison Composite to Block Model Grade Plan View


September 2026


SRK Consulting (U.S.), Inc.

SEC Technical Report Summary – Granite Creek

   Page 192


LOGO

Source: GRE, 2026

Figure 11-18: Open Pit Zone 4 Visual Comparison Composite to Block Model Grade Plan View


LOGO

Source: GRE, 2026

Figure 11-19: Open Pit Zone 1 Section Composites and Block Model Cross Sections


September 2026


SRK Consulting (U.S.), Inc.

SEC Technical Report Summary – Granite Creek

   Page 193


LOGO

Source: GRE, 2026

Figure 11-20: Open Pit Zone 2 Section Composites and Block Model Cross Section


LOGO

Source: GRE, 2026

Figure 11-21: Open Pit Zone 3 Section Composites and Block Model Cross Section


September 2026


SRK Consulting (U.S.), Inc.

SEC Technical Report Summary – Granite Creek

   Page 194


LOGO

Source: GRE, 2026

Figure 11-22: Open Pit Zone 4 Section Composites and Block Model Cross Section

Statistical Comparison

To ensure that the grade estimations are representative of the composites they are based on and validate the resource estimation results, the block model grade estimation statistics were analyzed. Ms. Lane of GRE compared the means, quantiles, and variance between 20-foot composites, Nearest Neighbor (NN), Inverse Distance squared (ID2), and Ordinary Kriged (OK) estimators, as shown in Table 11-12. Blocks are confined to the 3000 US$/tr oz Whittle pit at a cutoff grade of zero.

Table 11-12: Open Pit Comparison of Composite Values to Grade Estimation Methods


Parameter

   Composites      Parameter      NN      ID2      OK  

Count

     14,380        Block Count        304,317        256,088        256,088  

Mean

     0.49        Mean        0.28        0.33        0.34  

SD

     1.86        SD        1.08        0.80        0.78  

CV

     3.81        CV        3.80        2.41        2.29  

Variance

     3.47        Variance        1.17        0.65        0.61  

Minimum

     0        Minimum        0        0.0        -0.5  

Q1

     0.02        Q1        0.02        0.03        0.03  

Q2

     0.04        Q2        0.04        0.08        0.08  

Q3

     0.18        Q3        0.09        0.25        0.26  

Maximum

     78.71        Maximum        35.00        32.19        27.27  

Source: GRE, 2026

As expected, the NN estimator generates more blocks due to the lack of restrictions of having to use multiple samples and multiple drillholes to estimate a block grade. Both ID2 and OK produced similar quantiles, means, variance, etc. The one marked difference seen between ID2 and OK is that is possible to have a negative value in Kriging as seen in the minimum value of the OK estimator (Figure 11-23).


September 2026


SRK Consulting (U.S.), Inc.

SEC Technical Report Summary – Granite Creek

   Page 195


LOGO

Source: GRE, 2026

Figure 11-23: Cumulative Frequency of Composite and Estimated Block Grades

Swath Plots

Swath plots of the various estimation methods (NN, ID2, and OK) were used to compare the results from each estimation method to the informing composite values and examine which method smoothed the estimated grades. As an example, swatch plots are provided below for the Zone 1 high-grade and low -grade domains (Figure 11-24 though Figure 11-26). The swatch plots show a general trend that the ID2 estimator smoothed out drastic swings in grade while not over smoothing local variability.


September 2026


SRK Consulting (U.S.), Inc.

SEC Technical Report Summary – Granite Creek

   Page 196


LOGO

Source: GRE, 2026

Figure 11-24: X Axis, Zone 1 High-Grade Domain


September 2026


SRK Consulting (U.S.), Inc.

SEC Technical Report Summary – Granite Creek

   Page 197


LOGO

Source: GRE, 2026

Figure 11-25: Open Pit Swath Plot, Y Axis, Zone 1 High-Grade Domain X axis, Zone 1 High-Grade Domain


September 2026


SRK Consulting (U.S.), Inc.

SEC Technical Report Summary – Granite Creek

   Page 198


LOGO

Source: GRE, 2026

Figure 11-26: Open Pit Swath Plot Z Axis, Zone 1 High-Grade Domain


11.1.14

Mineral Resource Classification

Block model quantities and grade estimates for the Granite Creek open pit deposit were classified according to the Society for Mining, Metallurgy and Exploration (SME) guidelines.

Mineral Resources were classified as Measured, Indicated, or Inferred.

A Measured Mineral Resource is that part of a Mineral Resource for which quantity, grade or quality, densities, shape, and physical characteristics are estimated with confidence sufficient to allow the application of Modifying Factors to support detailed mine planning and final evaluation of the economic viability of the deposit. Geological evidence is derived from detailed and reliable exploration, sampling and testing and is sufficient to confirm geological and grade or quality continuity between points of observation (SME, 2017). Due to the density of drill hole spacing around the historical pit and underground excavations, GRE found it reasonable to classify portions of the resource as Measured.

Mineral resource classification involved a two-step process using minimum distances and minimum numbers of samples to define resource classification initially before applying numeric indicator model to define a more continuous and reasonable resource classification. The criteria used in the first step of the resource classification are listed in Table 11-13. Parameters used for the numeric indicator models for the second step of the resource classifications are listed in Table 11-14.


September 2026


SRK Consulting (U.S.), Inc.

SEC Technical Report Summary – Granite Creek

   Page 199


Table 11-13: Open Pit Mineral Resource Classification Parameters


Resource Class

   Minimum Distance (ft)      Minimum Distance (m)      Minimum Number of Samples  

Measured

     50        15.2        7  

Indicated

     100        30.5        5  

Inferred

     150        45.7        NA  

Source: GRE, 2026

Table 11-14: Open Pit Parameters for Resource Class Numeric Indicator Model


Resource Class

   Shape      Interpolant Distance (ft)      Interpolant Distance (m)      ISO  

Measured

     Isotropic        250        76.2        0.4  

Indicated

     Isotropic        250        76.2        0.4  

Inferred

     NA        NA           NA  

Source: GRE, 2026

Because the classification was performed across all resource estimation domains, an isotropic search was used along with an interpolant distance of 250, which was based on the average continuity of grade seen in the deposit. No numeric indicator model was constructed for the Inferred resource class, rather it was defined as any block with a calculated gold grade that did not fall within the Measured or indicated numeric indicator domains that had a calculated gold grade. A plan view of the estimated resource classes is shown in Figure 11-27.


LOGO

Source: GRE, 2026

Figure 11-27: Open Pit Constrained Resource Class All Areas Plan View


September 2026


SRK Consulting (U.S.), Inc.

SEC Technical Report Summary – Granite Creek

   Page 200


11.1.15

Open Pit Mineral Resource Statement

Society for Mining, Metallurgy and Exploration (2017) defines a mineral resource as: “a concentration or occurrence of solid material of economic interest in or on the Earth’s crust in such form, grade or quality, and quantity that there are reasonable prospects for economic extraction. The location, quantity, grade or quality, continuity, and other geological characteristics of a Mineral Resource are known, estimated or interpreted from specific geological evidence and knowledge, including sampling.” The Mineral Resources may be impacted by further infill and exploration drilling that may result in increases or decreases in future resource evaluations. The Mineral Resources may also be affected by subsequent assessment of mining, environmental, processing, permitting, taxation, socio-economic, and other factors. Mineral Resources are not Mineral Reserves and do not have demonstrated economic viability. Mineral Reserves can only be estimated based on the results of an economic evaluation as part of a Preliminary Feasibility Study or Feasibility Study. As a result, no Mineral Reserves have been estimated as part of this study. There is no certainty that all or any part of the Mineral Resources will be converted into a mineral reserve.

The requirement, “reasonable prospects for economic extraction,” generally implies that the quantity and grade estimates meet certain economic thresholds and that the Mineral Resources are reported at a cut-off grade considering appropriate extraction scenarios and processing recoveries. To meet this requirement, Ms. Lane of GRE considered that major portions of the Granite Creek deposit are amenable for open pit extraction.

To determine the quantities of material offering “reasonable prospects for economic extraction” by an open pit, Ms. Lane of GRE constructed open pit scenarios developed from the resource block model estimate using Whittle’s Lerchs-Grossman miner “Pit Optimizer” software. Reasonable mining assumptions were applied to evaluate the portions of the block model (Measured, Indicated, and Inferred blocks) that could be “reasonably expected” to be mined from an open pit. The optimization parameters presented in Table 11-15 were selected based on experience and benchmarking against similar projects. The results are used as a guide to assist in the preparation of a mineral resource statement and to select an appropriate resource reporting cut-off grade. Ms. Lane of GRE considers that the blocks located within the resulting conceptual pit envelope show “reasonable prospects for economic extraction” and can be reported as a mineral resource.


September 2026


SRK Consulting (U.S.), Inc.

SEC Technical Report Summary – Granite Creek

   Page 201


Table 11-15: Granite Creek Resource Parameters for Open Pit Optimization


Parameter


Items


Unit


Value

Costs    Mining Cost (waste/mineralized material)    US$/tonne mined    2.46
   Heap Leach*    US$/tonne mineralized material treated    9.04
   Carbon in Leach**    US$/tonne mineralized material treated    17.22
Recovery    Heap Leach (HLCH) Recovery with CN
Solubility <60
   %    CN Solubility*100
   HLCH Recovery with CN Solubility >= 60    %    ((0.1225 * [Au_ppm]) + 0.4164)*100
   CIL Recovery    %    ((0.5388 * CN Solubility) + 0.3201)*100
Net revenue gold    Gold price    US$/oz    3,000
   Selling costs and penalties***    US$/oz    114
Royalty    Total royalty (simplified)    %    6.00%
Slope angles    Slope Angle    degrees    41
Limits    HLCH    tonnes per year    2,975,000
   CIL    tonnes per year    1,050,000

Source: GRE, 2026


  1 

HLCH and CIL costs include US$1.56/tonne milled for admin costs.

  2 

Various royalties are applicable at various points throughout the mine life, however for the scope of this Technical Report, GRE has used a single 6% royalty for the open pit mineral resource.

  3 

The gold price used for this analysis is the 36-month trailing average gold price as of June 30, 2026.

  4

This selling cost is used to apply the 6% royalty

The pit optimization used a royalty of 6%; however, the current royalty is approximately 7.5%. The GRE QP does not believe that the change in royalty results in a material impact on the pit optimization.

Due to the large ratio of deposit size to block size and method of grade estimation, the grade model is fully diluted, and the resource is 100% recoverable as estimated.

The gold price selected for the open pit Mineral Resource has been based on review of the market study presented in Section 16 of this report, which has been compared to market consensus forecast data, review by the GRE QP of industry peers, plus discussion with i-80 technical teams. The resource gold price of US$3,000/oz reflects the 36-month trailing average as of June 30, 2026. Based on review, it is the GRE QP’s opinion that this price is reasonable over a time period of 10 years, covering both short-term pricing and future long-term pricing. The point of reference for the reporting of open pit Mineral Resources is the tonnage and grades contained within the Whittle pit shell limits, reported at a 0.20 g/t cut-off grade using variable metallurgical recovery.

The Granite Creek open pit mineral resource constrained by a Whittle pit shell that corresponds to a gold price of US$3,000 per troy ounce is shown in Table 11-16. The reader is cautioned that the results from the pit optimization are used solely for testing the “reasonable prospects for economic extraction” by an open pit and do not represent an attempt to estimate Mineral Reserves.


September 2026


SRK Consulting (U.S.), Inc.

SEC Technical Report Summary – Granite Creek

   Page 202


Table 11-16: Granite Creek Open Pit Mineral Resource Statement


Deposit

   Cutoff
Grade
(ppm)
     Mass
(‘000s tonnes)
     Mass
(‘000s short tons)
     Au Grade
(g/t)
     Au Grade
(opt)
     Au Contained
(‘000s tr oz)
 

Measured


Pit B

     0.2        3,900        4,299        1.06        0.031        133.49  

Pit A

     0.2        1,098        1,211        0.71        0.021        25.08  

CX

     0.2        13,493        14,873        1.10        0.032        478.41  

Mag

     0.2        15,055        16,596        1.03        0.030        499.50  


Total


     33,546        36,978        1.05        0.031        1,136.47  


Indicated


Pit B

     0.2        823        907        0.64        0.019        16.86  

Pit A

     0.2        969        1,069        0.68        0.020        21.06  

CX

     0.2        4,423        4,876        1.00        0.029        141.96  

Mag

     0.2        11,509        12,687        0.74        0.022        275.03  


Total


     17,725        19,538        0.80        0.023        454.91  


Measured + Indicated


Pit B

     0.2        4,723        5,206        0.99        0.029        150.34  

Pit A

     0.2        2,068        2,280        0.69        0.020        46.13  

CX

     0.2        17,916        19,749        1.08        0.031        620.37  

Mag

     0.2        26,565        29,282        0.91        0.026        774.53  


Total


     51,271        56,517        0.97        0.028        1,591.38  


Inferred


Pit B

     0.2        50        55        0.52        0.015        0.84  

Pit A

     0.2        440        485        0.44        0.013        6.22  

CX

     0.2        1,997        2,201        0.94        0.028        60.66  

Mag

     0.2        1,339        1,476        0.75        0.022        32.12  


Total


     3,826        4,217        0.81        0.024        99.84  


Source: GRE, 2026

1) The effective date of the Mineral Resources Estimate is March 31, 2026

2) The Qualified Persons for the estimate are GRE.

3) Mineral Resources are not ore reserves and are not demonstrably economically recoverable.

4) Mineral Resources are reported at a 0.20 g/t (0.006 oz/st) cutoff, an assumed gold price of 3,000 US$/tr. oz, using variable recovery, a slope angle of 41 degrees, 6% royalty, heap leach processing cost US$9.04 per tonne (includes admin), CIL processing cost of US$17.22 per tonne (includes admin).


11.1.16

Mineral Resource Sensitivity by Domain

Table 11-17 shows the sensitivity of the mineral resource to cut-off grade in each domain.


September 2026


SRK Consulting (U.S.), Inc.

SEC Technical Report Summary – Granite Creek

   Page 203


Table 11-17: Granite Creek Mineral Resource Sensitivity to Cut-off Grade – Reported on 100% basis


Deposit

   Cutoff Grade
(ppm)
     Mass
(000’s tonnes)
     Mass
(000’s short tons)
     Au Grade
(g/t)
     Au Grade
(opt)
     Au Contained
(000’s tr oz)
 

Measured


Pit B

     0.1        5,131        5,656        0.84        0.025        139.202  
     0.15        4,399        4,849        0.96        0.028        136.288  
     0.2        3,900        4,299        1.06        0.031        133.487  
     0.25        3,501        3,859        1.16        0.034        130.620  
     0.3        3,153        3,476        1.26        0.037        127.537  
     0.35        2,856        3,148        1.36        0.040        124.449  
     0.4        2,629        2,897        1.44        0.042        121.702  
     0.45        2,391        2,635        1.54        0.045        118.446  
     0.5        2,187        2,410        1.64        0.048        115.323  

Pit A

     0.1        1,489        1,641        0.56        0.016        26.932  
     0.15        1,270        1,400        0.64        0.019        26.038  
     0.2        1,098        1,211        0.71        0.021        25.078  
     0.25        915        1,009        0.81        0.024        23.756  
     0.3        773        852        0.91        0.026        22.507  
     0.35        638        703        1.03        0.030        21.103  
     0.4        526        580        1.17        0.034        19.759  
     0.45        440        485        1.31        0.038        18.590  
     0.5        370        408        1.47        0.043        17.520  

CX

     0.1        18,417        20,301        0.85        0.025        500.907  
     0.15        15,362        16,933        0.99        0.029        488.857  
     0.2        13,493        14,873        1.10        0.032        478.406  
     0.25        12,117        13,356        1.20        0.035        468.522  
     0.3        11,130        12,268        1.29        0.037        459.863  
     0.35        10,282        11,334        1.36        0.040        451.026  
     0.4        9,577        10,557        1.44        0.042        442.531  
     0.45        8,944        9,859        1.51        0.044        433.891  
     0.5        8,344        9,198        1.58        0.046        424.760  

Mag

     0.1        18,446        20,333        0.87        0.025        515.371  
     0.15        16,524        18,214        0.96        0.028        507.759  
     0.2        15,055        16,596        1.03        0.030        499.500  
     0.25        13,683        15,083        1.11        0.032        489.626  
     0.3        12,603        13,893        1.18        0.035        480.080  
     0.35        11,672        12,866        1.25        0.037        470.359  
     0.4        10,721        11,818        1.33        0.039        458.902  
     0.45        9,852        10,860        1.41        0.041        447.027  
     0.5        9,114        10,046        1.49        0.043        435.771  

Indicated


Pit B

     0.1        1,491        1,643        0.42        0.012        19.963  
     0.15        1,098        1,210        0.52        0.015        18.406  
     0.2        823        907        0.64        0.019        16.857  
     0.25        587        647        0.80        0.023        15.168  
     0.3        433        477        0.99        0.029        13.825  
     0.35        347        382        1.16        0.034        12.925  
     0.4        279        307        1.35        0.039        12.113  
     0.45        243        268        1.49        0.043        11.635  
     0.5        207        229        1.66        0.049        11.090  

Pit A

     0.1        1,290        1,422        0.54        0.016        22.538  
     0.15        1,114        1,228        0.61        0.018        21.854  
     0.2        969        1,069        0.68        0.020        21.057  
     0.25        863        952        0.73        0.021        20.288  
     0.3        782        862        0.78        0.023        19.575  
     0.35        694        765        0.84        0.024        18.655  
     0.4        605        667        0.90        0.026        17.579  
     0.45        524        578        0.98        0.029        16.466  
     0.5        463        510        1.04        0.030        15.531  

CX

     0.1        6,949        7,660        0.69        0.020        153.509  
     0.15        5,406        5,959        0.85        0.025        147.421  
     0.2        4,423        4,876        1.00        0.029        141.964  
     0.25        3,755        4,139        1.14        0.033        137.167  
     0.3        3,364        3,708        1.24        0.036        133.734  
     0.35        3,102        3,419        1.31        0.038        131.006  
     0.4        2,875        3,169        1.39        0.040        128.266  
     0.45        2,652        2,924        1.47        0.043        125.225  
     0.5        2,482        2,736        1.54        0.045        122.621  

Mag

     0.1        15,095        16,640        0.60        0.018        291.797  
     0.15        13,067        14,403        0.68        0.020        283.755  
     0.2        11,509        12,687        0.74        0.022        275.034  
     0.25        10,179        11,221        0.81        0.024        265.446  
     0.3        9,029        9,953        0.88        0.026        255.304  
     0.35        8,018        8,838        0.95        0.028        244.767  
     0.4        7,160        7,893        1.02        0.030        234.421  
     0.45        6,245        6,884        1.11        0.032        221.921  
     0.5        5,416        5,970        1.20        0.035        209.258  

Inferred


Pit B

     0.1        72        79        0.40        0.012        0.919  
     0.15        52        57        0.51        0.015        0.848  
     0.2        50        55        0.52        0.015        0.837  
     0.25        45        50        0.55        0.016        0.804  
     0.3        39        43        0.60        0.017        0.746  
     0.35        30        33        0.67        0.020        0.655  
     0.4        24        27        0.75        0.022        0.582  
     0.45        23        26        0.76        0.022        0.569  
     0.5        21        23        0.80        0.023        0.528  


September 2026


SRK Consulting (U.S.), Inc.

SEC Technical Report Summary – Granite Creek

   Page 204


Deposit

   Cutoff Grade
(ppm)
     Mass
(000’s tonnes)
     Mass
(000’s short tons)
     Au Grade
(g/t)
     Au Grade
(opt)
     Au Contained
(000’s tr oz)
 

Pit A

     0.1        615        678        0.35        0.010        7.010  
     0.15        506        558        0.40        0.012        6.583  
     0.2        440        485        0.44        0.013        6.216  
     0.25        352        388        0.49        0.014        5.577  
     0.3        275        304        0.55        0.016        4.910  
     0.35        229        253        0.60        0.018        4.432  
     0.4        188        207        0.65        0.019        3.936  
     0.45        154        170        0.70        0.020        3.480  
     0.5        124        137        0.76        0.022        3.018  

CX

     0.1        3,155        3,478        0.65        0.019        65.995  
     0.15        2,464        2,716        0.80        0.023        63.252  
     0.2        1,997        2,201        0.94        0.028        60.660  
     0.25        1,734        1,912        1.05        0.031        58.790  
     0.3        1,574        1,735        1.13        0.033        57.387  
     0.35        1,426        1,572        1.22        0.036        55.846  
     0.4        1,316        1,451        1.29        0.038        54.524  
     0.45        1,232        1,358        1.35        0.039        53.370  
     0.5        1,146        1,263        1.41        0.041        52.064  

Mag

     0.1        1,901        2,095        0.57        0.017        34.750  
     0.15        1,594        1,757        0.65        0.019        33.550  
     0.2        1,339        1,476        0.75        0.022        32.123  
     0.25        1,036        1,142        0.90        0.026        29.916  
     0.3        783        863        1.10        0.032        27.723  
     0.35        699        770        1.20        0.035        26.851  
     0.4        635        700        1.28        0.037        26.090  
     0.45        612        675        1.31        0.038        25.783  
     0.5        602        664        1.32        0.039        25.631  

Source: GRE, 2026


September 2026


SRK Consulting (U.S.), Inc.

SEC Technical Report Summary – Granite Creek

   Page 205


11.1.17

Factors that Could Affect Open Pit Mineral Resources

To the best of the QP’s knowledge, there are no known legal, political, environmental, permitting, title, taxation, socio-economic, marketing, mining, metallurgical, or other factors that would further materially affect the open pit Mineral Resources reported herein.

There are no known significant factors or risks that may affect property access, title, or the right to perform work on the Property.

The open pit MRE could be materially affected negatively by low market prices for gold and by difficulties in material handling and processing that would affect the recovery and production of gold. Changes in the estimated materials and supply costs, and in labor availability and rates are other factors that could materially affect the open pit MRE. The taxation and political environment for mining in Nevada is relatively stable. The Project requires infrastructure development and permitting.


11.2

Underground Mineral Resources

SRK completed the MRE process using updated mineralization models. i-80 provided SRK with a comprehensive exploration database with logging indicating the main geological features and units, including full assays from exploration and production. In addition to the database, SRK worked with i-80 on preliminary geological interpretations, on which, SRK made minor alterations accordingly. The resource estimation methodology involved the following procedures:


Database compilation and verification


Construction of wireframe models for the fault networks and centerlines of mining development per vein


Definition of resource domains


Data conditioning (compositing and capping) for statistical and geostatistical analysis


Variography


Block modeling and grade interpolation


Resource validation and classification


Application of reporting CoG using the 2026 inputs


Preparation of the mineral resource statement


11.2.1

Drillhole Database

i-80 supplied SRK with extracts from the Central database (acQuire) in both csv and Leapfrog formats. The cut-off for the database was February 17, 2026. The digital database includes both holes inside the area of interest and the regional drilling over the Granite Creek deposit. The database contains a total of 7,977 boreholes and production samples for 521,332.6 m (1,710,408.7 ft) of drilling. SRK has limited the analysis for the study to the drilling in the near vicinity to the current underground operations and therefore has applied a spatial limitation of Easting between 8,200 to 12,800, and northing 9,000 to 15,000 in the local grid. The export reduced the total database to 6,800 holes which is a combination of the exploration, production and environmental drillhole data (Table 11-18).


September 2026


SRK Consulting (U.S.), Inc.

SEC Technical Report Summary – Granite Creek

   Page 206


Table 11-18: Summary of Drilling and Sampling in Target Area


Drilling Type

   Count      Sum of Depth (ft)      Sum of Depth (m)  

Environmental

     22        18,227.0        5,555.6  

Exploration

     1,669        905,284.2        275,930.6  

Core

     159        125,636.1        38,293.9  

CV

     111        29,903.0        9,114.4  

CVM

     1        1,000.0        304.8  

DDH

     131        55,777.7        17,001.0  

Metallurgical

     3        1,535.0        467.9  

RC

     1,075        456,390.0        139,107.7  

RC/CORE

     65        92,353.0        28,149.2  

RC_CVM

     1        1,940.0        591.3  

RC_DDT

     121        140,084.4        42,697.7  

UNK

     2        665.0        202.7  

Production

     5,109        243,178.1        74,120.7  

Channel

     544        48,624.3        14,820.7  

Core

     199        67,446.8        20,557.8  

Cubex

     641        89,857.0        27,388.4  

Sludge

     3,725        37,250.0        11,353.8  


Grand Total

     6,800        1,166,689.3        355,606.9  


Source: SRK, 2026

The subset databased in Leapfrog used for the estimation is split into a series of tables taken from the central acQuire database is summarized in Table 11-19, using the above defined spatial restrictions (whereby any holes which have intersections with the geographical area have been included in the export). The assay database contains the complete multi-element data analysis plus basis for the geo-metallurgical analysis including PregRob (%), Total Organic Carbon (TOC %), Carbonate (CO3 %), and cyanide soluble gold Au_CN (ppm), which are used to aid in the gold recovery calculations.

Table 11-19: Summary of Drilling and Sampling Information Available within Leapfrog


Data Table

   Data Type    Number of Columns      Number of Rows  

collar

   collar      19        6,800  

survey

   survey      8        35,633  

Assay_Combined

   interval      68        189,851  

alteration

   interval      22        54,079  

density

   interval      20        8,431  

geotech

   interval      11        60,593  

lithology

   interval      33        58,466  

oxides

   interval      20        47,247  

structures

   interval      12        21,935  

sulfides

   interval      20        45,239  

veins

   interval      14        14,175  

point_structures

   point      16        8,924  

Source: SRK, 2026

During the review SRK noted several missing sampling intervals (60), which were reset to zero, and a total of 1,980 missing assays which were omitted from the analysis. In addition to the absent values, SRK notes there are 10,774 occurrences of zero in the database which have been kept as they define areas which were not sampled and assumed to be waste by the geologist. Figure 11-28 shows the collar locations for all drillholes in the drillhole database and are colored coded by company drilled.


September 2026


SRK Consulting (U.S.), Inc.

SEC Technical Report Summary – Granite Creek

   Page 207


LOGO

Source: SRK, 2026

Figure 11-28: Plan Showing Collar Locations and Borehole Traces within the MRE-Focused Dataset


11.2.2

Topography and Mining Depletion

SRK has been supplied with a series of wireframes from the i-80 Geology team to reflect the current topography and the underground mining depletion at the Granite Creek deposit. The depletion was based on a combination of both open pit mining and month-end depletion from the underground mining operation as of March 31, 2026. Separate models were produced by SRK for the open pit and underground models to account for these separately.


September 2026


SRK Consulting (U.S.), Inc.

SEC Technical Report Summary – Granite Creek

   Page 208


To create the depletion, SRK has imported the information provided by i-80 in the .dxf formats supplied. The three key files used for the depletion are:


Regional Topo – Pre Mine.dxf


Mine Topo – Backfilled.dxf


GC_Merged_2603_Clean.dxf

SRK created a depletion model using the same prototype as the geological and mineralization models. The open pit depletion has been treated as an erosional surface in Leapfrog®. SRK generated an “intrusion” model in Leapfrog® to account for the underground depletion and sterilization around the workings. Overall, SRK considers the depletion model to accurately reflect the information provided. There is a low risk that these depletions do not accurately reflect the final pit or stopes, but SRK would not consider that material and considers the current process as reasonable for the definition of the current Mineral Resources. An isometric view of the depletion model is seen below in Figure 11-29.


LOGO

Source: SRK, 2026

Figure 11-29: Isometric View Showing Open Pit Depletion (Surface) and Underground Workings (Grey)


September 2026


SRK Consulting (U.S.), Inc.

SEC Technical Report Summary – Granite Creek

   Page 209


11.2.3

Geological Model

SRK conducted a site visit to the Granite Creek Project located in Nevada on February 4, 2026. The purpose of the geological site visit was in part to discuss the latest geological model developed by i-80 geological team which has been reviewed in detail by SRK, to understand the controls on the mineralization and to provide recommendations for adjustments as appropriate. Final work on the geological model was completed on February 26, 2026.

During the review it was noted that the major structure and control on fluid movement is associated with a series of key faults striking northeast and northeast-east, located to the north of the historical open pit mining operations.

The primary structural control is the northeast / southwest-striking, steeply dipping normal faults related to extension. The structures are the main conduits for mineralizing fluids moving along strike and vertically. Lithologic contacts, bedding and localized folds also play an important role for developing mineralized zones. High-grade mineralized zones are moderately continuous along faults with the most prolific zones occurring at structural intersections along the Rangefront, Otto, Ogee and South Pacific fault corridors.

i-80 geologists produced an updated fault model for the Granite Creek Project. The updated model is based on the review of the following datasets. A total of 62 faults have been identified by i-80 and modeled of which a total of 57 are considered active as controlling features in the geological model at a regional level. These faults and structures were defined and confirmed by:


Onsite core review and geological logging


Core photos for verification


Geological mapping of the underground workings

Mineralization at Granite Creek is controlled by a combination of structural, lithologic, and intrusive features within a complex intrusion-related hydrothermal system. In addition to the regional model

i-80 have supplied a mine scale geological model, which contains more localized scale offsets. The mine-scale model carries a dedicated mine-scale set M1–M25 (plus M1 Offset) that isn’t in the Regional model, while dropping many of the Regional-only structures (the NNW / NS sets, several NE / EW faults, Felix, Delaney, Mag_West, etc.).


11.2.4

Estimation Domain Analysis

SRK reviewed the current underground operation at Granite Creek as part of the site inspection. The current geological model and mineralization at Granite Creek has identified three main areas of mineralization defined as the Ogee, Otto, and SPZ Additional mineralization potential exists outside these three areas but is not currently considered in the underground model as further exploration is needed to better define the continuity. The three areas are controlled by faulting in the local areas which has acted as controls on the mineralization. The key faults used to define the fault blocks which host the mineralization are:


CX West Fault


Range Front Fault


Domain Boundary A (Boundary A)


Domain Boundary B (Boundary B)


Domain Boundary C (Boundary C)


September 2026


SRK Consulting (U.S.), Inc.

SEC Technical Report Summary – Granite Creek

   Page 210


The Ogee domain is bound to the south by domain Boundary C, to the north by domain Boundary B, and the domain Boundary A, cuts the mineralization to the northeast. The Otto domain is located to the north of Ogee and is bound between the Boundary B limit and the Front Range Fault to the west, with the Boundary A surface limiting the mineralization to the northeast. SRK notes some mineralization remains to the west of the Range Front Fault within a local domain referred to as Osgood.

Further exploration work will be needed to confirm the depth, extent and geotechnical conditions of the mineralization. The current focus for i-80 during the most recent exploration has been to test the depth extensions of the SPZ at the operation which is limited to a fault block below the CW-West Fault, with the current depth extents limited to the Boundary C surface. Above the CW-West Fault the mineralization has been defined for the purpose of this study as the SPZ hanging wall Zone (SPZhw). A summary of the controls used to define the broad mineralization domain blocks is shown in Figure 11-30.

A review of the lithology shows the Range Front Fault marks the change between the Ocl (hanging wall) and Cp (footwall) units, with most of the mineralization occurring within the Ocl unit of the overlying Ocu units. It is therefore assumed these are considered good hosts for the mineralization but that the lithological contacts between these two units do not act as a lithological control. Additional analysis of the statistics by lithology also indicated higher grades in the vicinity of the faults which supports the observations made during the site inspection and knowledge from the current operation.


September 2026


SRK Consulting (U.S.), Inc.

SEC Technical Report Summary – Granite Creek

   Page 211


LOGO

Source: SRK, 2026

Figure 11-30: Plan Showing Main Defined Mineralization Domain Boundary Areas at the Granite Creek Underground Operation

Using the defined limits of the three main boundary areas the first step has been to identify within these areas the regions of potential mineralization (Figure 11-31 and Figure 11-32). To undertake this SRK initially defined three low-grade indicator grade shells based on a nominal 0.5 g/t (0.015 oz/st) Au cut-off. To create the grade shells the sampling has been limited to each domain, with a series of structural trends generated based on selected local faults mapped at the current operation and interpreted from the diamond drilling data. The structural model is under continual review and updates by the i-80 geological team are reviewed by SRK. Overall, it is opinion of SRK that the structures selected are reasonable for consideration controlling the mineralization, so the trends have been modeled in Leapfrog using the “strongest along inputs” for Ogee and Otto but using a “blended” approach at SPZ due to most of the interpretation at depth being based on diamond drilling interpretation vs. underground operations. Using this method each structure is assigned a strength and range with the range of influence being between 9 m and 14 m (30 to 45 ft. )The interpretations were then finalized using an ISO Value of 0.45 (which is defined by Leapfrog as the confidence that the probability of the indicator shell will contain the cut-off value), which upon review by the QP was deemed to provide a reasonable limit to the edge of the mineralization for which the data could be coded to undertake the estimation domain analysis.


September 2026


SRK Consulting (U.S.), Inc.

SEC Technical Report Summary – Granite Creek

   Page 212


LOGO

Source: Source: SRK, 2026

Figure 11-31: Plan Showing Main Defined Mineralization Areas at the Granite Creek Underground Operation


September 2026


SRK Consulting (U.S.), Inc.

SEC Technical Report Summary – Granite Creek

   Page 213


LOGO

Source: SRK, 2026

Figure 11-32: Long Section (Looking Northwest) Showing Main Defined Mineralization Areas at the Granite Creek Underground Operation

To undertake the estimation domain analysis SRK used a combination of Phinar X-10 (version 2.1.42.14) and Snowden Supervisor (v.9.2.5). Using the 0.5 g/t (0.015 oz/st) Au limits as a lower boundary of potentially economic mineralization SRK undertook a statistical analysis of the grade distribution within each domain using a combination of log histograms, log-probability plots and noted in general there are still mixed populations within the domains defined. A review of the log-probability plots shows increases in the gradient of the curves above values in the order of 1.5 g/t (0.044 oz/st) to 3.0 g/t (0.088 oz/st) Au within each of the domains. The changes in the population are noted to be subtle, and therefore further work on sensitivity was completed in Leapfrog to test a range of values. An example of the analysis is shown in Figure 11-33 for the Otto domain with the interpreted possible trend breaks shown on the log-probability chart. Figure 11-34 shows the equivalent analysis using Snowden supervisor for all domains on the log-probability highlighting potential changes in trend based on the QP’s opinion and analysis.

It is noted there remains a high-grade component (shown by the red line) for the mineralization above values of 10 to 15 g/t (0.438 oz/st) in the example shown but based on the grade continuity and that typically < 5% of the data population within the boundary domains are above these values they have been combined with the >1.5 g/t (0.044 oz/st) grade domains.


September 2026


SRK Consulting (U.S.), Inc.

SEC Technical Report Summary – Granite Creek

   Page 214


LOGO

Source: SRK, 2026

Figure 11-33: Example of EDA Analysis in X-10 to Identify Potential Changes in Grade Populations within the Ogee Domain


September 2026


SRK Consulting (U.S.), Inc.

SEC Technical Report Summary – Granite Creek

   Page 215


LOGO

Source: SRK, 2026

Figure 11-34: Example of Log-Probability Plots Showing Polynomial Model Fitting (Pink) and Potential Trend Breaks (Yellow)


September 2026


SRK Consulting (U.S.), Inc.

SEC Technical Report Summary – Granite Creek

   Page 216


For each domain SRK completed a sensitivity analysis testing the impact of grade limits, the use of structural trends, and variable search ranges during the indicator grade shell analysis. The final sensitivity test was completed initially on eight different cut-off grades 0.5, 1.0, 1.5, 2.0, 3.0, 3.5, 4.0, 10.0 g/t (0.292 oz/st). Based on visual review and comparison to the i-80 mine production model it was then decided to focus on the grade ranges of 1.5 to 2.5 g/t (0.073 oz/st) for more detailed analysis. A total of 14 different models were generated on selected confidence levels using various ISO values to understand the variable ranges in sample statistics for each scenario.

The results of each analysis were captured with the wireframe volume, average grades, and the percentage of samples above and below cut-off tracked to determine the portion of internal waste for any given scenario. The results were then charted (Figure 11-35) and the final scenarios selected based on the QP’s opinion of an optimized search in terms of the proportion of internal waste vs. maintaining a reasonable volume and potential loss of metal outside the indicator shells. These values tend to fall in the range of 0.44 to 0.45 ISO values based on the analysis.


September 2026


SRK Consulting (U.S.), Inc.

SEC Technical Report Summary – Granite Creek

   Page 217


LOGO

Source: SRK, 2026

Figure 11-35: Example of Sensitivity Analysis on ISO Values Completed by SRK for the Ogee Domain


September 2026


SRK Consulting (U.S.), Inc.

SEC Technical Report Summary – Granite Creek

   Page 218


During the review SRK has considered the statistical support for the domains but has also reviewed the continuity of the mineralization in 3D in Leapfrog to ensure grade continuity is maintained (Figure 11-36). Where available in the upper portions of the active mine the results have been compared to the grade control sampling (muck and sludge sampling) to visually check the preferred parameters.

The review of the geological boundaries to the grade control has also aided in the assessment of the key faults and orientation controls used for the interpretation. Figure 14 36 provides an example of the review, with the key faults shown in gray on. It is the QP’s opinion that the grade boundaries of the high-grade domains closely follow the limits of the high-grade data as defined by the muck sampling. In the case of the Ogee domain in the example shown, the two key orientations of a north-northeast limb and a northeast limb are clearly shown which is supported by the mining activities in these areas of the mine.


LOGO

Source: SRK, 2026

Figure 11-36: Level Plan 4230 Showing Selected Ogee and Otto Domain Boundaries vs. Sampling (Including Grade Control Muck Sampling)


September 2026


SRK Consulting (U.S.), Inc.

SEC Technical Report Summary – Granite Creek

   Page 219


The final domains were initially exported to dxf format and provided to the i-80 Geology team for review. Several small areas were noted where some manual adjustments to the interpretation were needed to improve the geological interpretation (namely in areas of lower sampling volumes), which has been completed by SRK and then final review and agreement reached with the i-80 Geology team that the selected grade shells are representative of the underlying geological controls.

Based on the review and in summary the following domains have been defined by SRK for use in the underground Mineral Resource (Table 11-20), with the domains shown in Figure 11-37.


September 2026


SRK Consulting (U.S.), Inc.

SEC Technical Report Summary – Granite Creek

   Page 220


Table 11-20: Summary of Domains and Criteria Used


Domain


Wireframe


Description/Criteria

OgeeHG    GM_EstDomain – OgeeHG.dxf    Indicator 2.0 g/t Au, Trend = Ogee FS 2025_12, Range =300 ft, ISOVALUE 0.45
OgeeLG    GM_EstDomain – OgeeLG.dxf    Indicator 0.5 g/t Au, Trend = Ogee FS 2025_12, , Range =300 ft, ISOVALUE 0.45
OttoHG    GM_EstDomain – OttoHG.dxf    Indicator 2.0 g/t Au, Trend = OT FS 2025_12, Range =300 ft, ISOVALUE 0.45
OttoLG    GM_EstDomain – OttoLG.dxf    Indicator 0.5 g/t Au, Trend = OT FS 2025_12, , Range =300 ft, ISOVALUE 0.45
SPZHG    GM_EstDomain – SPZHG.dxf    Indicator 1.5 g/t Au, Trend = SPZ FS 2025_12, Range =300 ft, ISOVALUE 0.45
SPZLG    GM_EstDomain – SPZLG.dxf    Indicator 0.5 g/t Au, Trend = SPZ FS 2025_12, Range =300 ft, ISOVALUE 0.45
SPZhwHG    GM_EstDomain – SPZhwHG.dxf    Indicator 2.5 g/t Au, Trend = SPZ FS 2025_12, Range =175 ft, ISOVALUE 0.45
SPZhwLG    GM_EstDomain – SPZhwLG.dxf    Indicator 0.5 g/t Au, Trend = SPZ FS 2025_12, Range =175 ft, ISOVALUE 0.45

Source: SRK, 2026


September 2026


SRK Consulting (U.S.), Inc.

SEC Technical Report Summary – Granite Creek

   Page 221


LOGO

Source: SRK, 2026

Figure 11-37: SRK Domain Model Used for Grade Estimation

As a final step, SRK has cross-checked statistically to ensure the domains are reasonable for the purpose of the grade estimation process and a box-whisker plot of the final domained gold statistics is shown in Figure 11-38. It is the QP’s opinion that these represent valid domains for the purpose of estimation.


September 2026


SRK Consulting (U.S.), Inc.

SEC Technical Report Summary – Granite Creek

   Page 222


LOGO

Source: SRK, 2026

Figure 11-38: Box-Whisker Plot Showing Gold Grade Distributions within the SRK Domained Models, showing mean grades.

11.2.5 Compositing

The composite length review indicates that approximately 90% of the samples taken are less than 1.53 m (5 ft) in length and that 98% of the samples are less than 3.05 m (10 ft) in length (Figure 11-39). SRK completed this review on both the combined dataset and within the individual domains. Figure 11-40 shows the results of the analysis within the high-grade domains. The QP has opted to use a single composite length for all domains.


September 2026


SRK Consulting (U.S.), Inc.

SEC Technical Report Summary – Granite Creek

   Page 223


LOGO

Source: SRK, 2026

Figure 11-39: Log Probability Plot Showing Sampling Length in Diamond and RC Sampling at Granite Creek


September 2026


SRK Consulting (U.S.), Inc.

SEC Technical Report Summary – Granite Creek

   Page 224


LOGO

Source: SRK, 2026

Figure 11-40: Summary of Sampling Lengths Inside the High-Grade Domains within Diamond and RC Drillholes


September 2026


SRK Consulting (U.S.), Inc.

SEC Technical Report Summary – Granite Creek

   Page 225


Based on this review SRK selected 1.53 m (5 ft) for the composite lengths for all estimation domains, as in the QP’s opinion this better reflected the downhole grade variations noted in the drilling than the larger 10 or 5 m (15 ft) composites as shown in Figure 11-39 and Figure 11-40. SRK also noted the difference in the mean grades between the raw and composited data reported closer in the 1.53 m (5 ft) composites than the longer 3.05 (10 ft) composites.

SRK completed a statistical comparison of the composite lengths and the mean grades for Au (g/t) before capping, which reported within < 1% difference in the mean grades for the mineralized data. However, on a zone-by-zone basis the QP noted there is a slight increase in the mean grade within the OgeeHG domain (approximately 2.5%), which in the QP’s opinion is acceptable. Overall, in the QP’s opinion the 2 m (5 ft) composites were preferred.


11.2.6

Assay Capping

High-grade capping is undertaken where data is no longer considered to be part of the main population. The QP completed the analysis based on log and raw probability plots and histograms which can be used to distinguish the grades at which samples have significant impacts on the local estimation and affect is considered extreme. The QP notes that the mean grades within the different domains are sensitive to changes in the capping values.

SRK completed a statistical analysis of the impact of grade capping by importing the geologically domained coded composites into Phinar’s X10 Geo (X10) statistical software packages for review. During the analysis, SRK reviewed the percentage of metal loss and the reduction in the coefficient of variation (CoV). Examples of the capping showing a review of the data distribution at the highest grades completed in X10 are shown in Figure 11-41.

The high-grade domains which account for the majority of the Mineral Resources are shown in Figure 11-41 and Figure 11-42. The selected capping values have also been cross-checked to the impact on the distributions using Snowden Supervisor (v9.0.4) to ensure the selected capping is appropriate relative to the log-histograms, log probability, mean and variance cumulative frequency plots, and the distribution of the cumulative metal above the selected cap (Figure 11-43).


September 2026


SRK Consulting (U.S.), Inc.

SEC Technical Report Summary – Granite Creek

   Page 226


LOGO


LOGO


LOGO

Source: SRK, 2026

Figure 11-41: Examples of X-10 Capping Analysis Showing Capped Values in Yellow


September 2026


SRK Consulting (U.S.), Inc.

SEC Technical Report Summary – Granite Creek

   Page 227


LOGO

Source: SRK, 2026

Figure 11-42: Capping Analysis Showing Breaks in Data Population (Ogee HG Domain)


LOGO

Source: SRK, 2026

Figure 11-43: Capping Analysis Showing Breaks in Data Population (Otto HG Domain)


September 2026


SRK Consulting (U.S.), Inc.

SEC Technical Report Summary – Granite Creek

   Page 228


LOGO

Source: SRK, 2026

Figure 11-44: Capping Analysis Showing Breaks in Data Population (Ogee SPZ Domain)

The analysis process has been completed for all the key elements used in the estimation process covering the gold and the geo-metallurgical parameters discussed in more detail in Section 14.3.10 of this report. The capping levels have been selected (Table 11-21) where the populations were identified by the QP to be breaking down, but also with the goal of reducing the coefficient of variation (CoV) to acceptable levels for the application of geostatistical methodology (1.5 to 2.0).

The capping levels typically reduced the mean grades in the order of 2.5% to 5.0% for most domains, except OgeeLG which has the largest significant differences noted (-15.8%). The basis for the more significant capping at this domain was the relatively high coefficient of variation (2.42 in the raw data), which needed more aggressive capping to reduce the CoV compared to the other domains. The QP notes that continuing to monitor this domain during the mining process should be considered to either identify if additional high-grade materials have been missed during the geological modeling, or if the grade capping needs further adjustment based on reconciliation data as mining progresses. In all the domains the CoV has been reduced from high variability >2.0 to approximately 1.5 to 1.7 which in the QP’s opinion is reasonable for the application of geostatistics and estimation and the results are summarized in Table 11-21.


September 2026


SRK Consulting (U.S.), Inc.

SEC Technical Report Summary – Granite Creek

   Page 229


Table 11-21: Summary of Raw vs. Capped Composite Statistics per Domain


Name

   Parameter    Count    Minimum    Maximum    Mean    Variance    Std Dev    CoV    %
Change
 
OgeeHG    Au (g/t)    1668    0.00    134.85    12.37    283.70    16.84    1.36      -2.4%  
   AuCap    1668    0.00    70.00    12.07    239.67    15.48    1.28
OgeeLG    Au (g/t)    1768    0.00    82.43    3.44    69.00    8.31    2.42      -15.8%  
   AuCap    1768    0.00    24.00    2.89    31.25    5.59    1.93
OttoHG    Au (g/t)    1150    0.00    95.50    8.32    136.07    11.66    1.40      -1.4%  
   AuCap    1150    0.00    62.00    8.20    120.55    10.98    1.34
OttoLG    Au (g/t)    2030    0.00    67.20    2.58    29.39    5.42    2.10      -2.5%  
   AuCap    2030    0.00    32.00    2.52    24.50    4.95    1.97
SPZHG    Au (g/t)    940    0.00    140.91    9.43    159.62    12.63    1.34      -2.3%  
   AuCap    940    0.00    52.50    9.22    129.60    11.38    1.23
SPZLG    Au (g/t)    568    0.00    50.40    2.05    21.81    4.67    2.28      -6.3%  
   AuCap    568    0.00    20.00    1.92    14.87    3.86    2.01
SPZhwHG    Au (g/t)    44    0.02    64.50    11.91    199.53    14.13    1.19      0.0%  
   AuCap    44    0.02    64.50    11.91    199.53    14.13    1.19
SPZhwLG    Au (g/t)    194    0.00    10.90    1.41    2.66    1.63    1.15      -2.4%  
   AuCap    194    0.00    7.50    1.38    2.13    1.46    1.06

Source: SRK, 2026


11.2.7

Variogram Analysis and Modeling

The QP reviewed the geostatistical properties of the domains using Snowden Supervisor (v9.0.4) variogram analysis on the capped 1.53 m (5.02 ft) composite dataset for the Otto, Ogee, and SPZ domains (LG and HG domains for each). Based on the size of the data populations, initial test work for semi-variograms in the SPZhw (LG and HG) returned poor structures for directional variogram; therefore, the QP elected to use omni- variograms within these domains.

The SRK workflow included review of the radial plot (to define the general orientation), then definition of the Major, Semi-Major, and minor axis variograms, which in most cases have been orientated to a dip of 55° to 80°, dip azimuth of 130° to 155° and pitches ranging from of 65° to 120°. The dip and orientations have been selected based on discussions with the Geology team’s analysis of key structures localized to each domain and visual trends noted in the mineralization. Variograms have been modeled using a combination of variograms and correlograms depending on the quality of the experimental variogram data, which have been transformed and normalized in Supervisor and the parameters transferred to Leapfrog® for the estimation process. Summary of gold variogram parameters are shown in Table 11-22 and Figure 11-45 through Figure 11-47.


September 2026


SRK Consulting (U.S.), Inc.

SEC Technical Report Summary – Granite Creek

   Page 230


Table 11-22: Summary of Gold Variogram Parameters


Domain

   Nugget      s1_sill      s1_maj      s1_semi      s1_min      s2_sill      s2_maj      s2_semi      s2_min      Dip      dip_azi      Pitch      Variance  

OgeeHG

     0.20        0.44        20        15        15        0.37        130        55        50        80        165        100        214.10  

OgeeLG

     0.20        0.44        20        15        15        0.37        130        55        50        80        155        65        25.80  

OttoHG

     0.22        0.55        20        10        10        0.23        70        60        30        80        155        65        107.90  

OttoLG

     0.27        0.58        10        10        10        0.15        115        55        35        80        155        65        23.80  

SPZHG

     0.24        0.44        40        30        15        0.32        230        175        50        55        130        120        125.60  

SPZLG

     0.22        0.55        10        10        10        0.23        70        60        30        80        155        65        13.90  

SPZhwHG

     0.21        0.39        10        10        10        0.40        65        65        65        80        155        65        269.60  

SPZhwLG

     0.21        0.51        10        10        10        0.28        60        60        60        80        155        65        2.20  

Source: SRK, 2026


September 2026


SRK Consulting (U.S.), Inc.

SEC Technical Report Summary – Granite Creek

   Page 231


LOGO

Source: SRK, 2026

Figure 11-45: Modeled Normal Score Downhole Variograms and Directional Correlograms for OgeeHG (Gold)


LOGO

Source: SRK, 2026

Figure 11-46: Modeled Normal Score Downhole and Directional Variograms for OttoHG (Gold)


September 2026


SRK Consulting (U.S.), Inc.

SEC Technical Report Summary – Granite Creek

   Page 232


LOGO

Source: SRK, 2026

Figure 11-47: Modeled Normal Score Downhole and Directional Variograms for SPZHG (Gold)


11.2.8

Block Model Parameters

SRK has produced the block models using Leapfrog® Edge (version 2025.3.1). The procedure involved construction of wireframe models for the fault networks, lithology domains, definition of resource domains (Ogee, Otto, SPZ and the SPZhw), split into low and high-grade subdomains. SRK produced a single block model for underground portion of the Project to cover the main areas of mineralization. A single model was generated to cover the estimation of all the key domains. Estimation was completed based on coded 1.53 m (5 ft) composites (based on the updated defined wireframes), which have been capped to appropriate levels.

The resource evaluation work was completed by SRK. Grade estimation has been based on block dimensions of 4.57 m x 4.57 m x 4.57 m or (15 ft x 15 ft x 15 ft). The block size reflects potential size variations for the geological units plus consideration for any underground smallest mining units (SMU). The block size is consistent with the current grade underground production models to aid future reconciliation. SRK utilized sub-blocking methodology in Leapfrog® (Octree), which allows subdivision of the parent block by division of (4, 8, 16, and 32) to accurately reflect the defined mineralization and lithological models. SRK has utilized sub-blocking to accurately reflect the defined geological models, with a sub-block size of 0.57 m x 0.57 m x 1.14 m (1.875 ft x 1.875 ft x 3.75 ft) used to reflect the thickness and orientation of the domain wireframes (Table 11-23). It was also decided through discussions with the mining engineer to use an orientated grid which aligns to the strike of the mineralization. SRK used an azimuth of 60 degrees to align to the primary mineralization orientation.


September 2026


SRK Consulting (U.S.), Inc.

SEC Technical Report Summary – Granite Creek

   Page 233


Table 11-23: Summary of Rotated Prototype Parameters Used in Granite Creek Model


Item

   Origin      Extent      Block Size      Block
Count
     Subblock  
   (ft)      (m)      (ft)      (m)  

X

     7,775.500        2,295        15        4.75        153        1.875        0.57  

Y

     11,743.045        4,200        15        4.75        280        1.875        0.57  

Z

     5,960.000        3,375        15        4.75        225        3.75        1.14  

Rotation

     60º (azimuth)  

Source: SRK, 2026


11.2.9

Estimation Methodology

Grades have been interpolated for Au (g/t), using a combination of Ordinary Kriging and Inverse Distance Weighting (Power 3). SRK tested several estimation scenarios for the Ogee, Otto, and SPZ domains. The primary focus for the parameter selection has been the OgeeHG and SPZHG (based on Ogee HG representing the current mining areas and SPZ HG providing the longer-term potential within the main mineralization domains) to identify the sensitivity of the estimates to the maximum number of samples being used and the assumption to use a maximum of three composites per drillhole during the estimation process. The QP did not lower performance of the estimators based on slope of regression and negative weights within the Otto HG domain compared to Ogee and SPZ HG domains, which is a function of the variogram, however it is the QP view that keeping the estimation parameters relatively consistent in terms of block size and number of samples is preferred.

SRK has utilized variable orientation searches to control the orientation of the estimates for the Granite Creek deposit. SRK tested both linear and variable orientation (default dip and strike orientations) for each zone.

The principal direction of mineralization can change across a domain, such as when the domain features an undulating, gently folded structure. Using a single fixed orientation for the sample search and the variogram can result in poor sample selection and weighting locally. Using a variable orientation makes it possible to re-orient the search and variogram according to local characteristics, which results in improved local value estimates. Variable orientations can have multiple inputs, including veins, bedding or faults, and practically are based on any selected mesh in the project. The variable orientation can be applied to Kriging and inverse distance estimators.

To set up the variable orientations in Leapfrog the QP has worked with the i-80 Geology team to identify the key features within each domain that impact the local grade distribution. Given the predominance of the higher-grade mineralization to be controlled by faulting, selected fault surfaces formed the majority of the controls on the orientation. The i-80 team have been working during 2025 to 2026 to integrate variable search orientation into the operational level grade estimates with success. To determine the final orientation parameters for each domain the QP used the initial models as presented by i-80 and then refined to the controls based on visual inspection of rotations within the block model to avoid any sharp changes in the grade estimates outside the areas of influence of the faults. The QP noted a few occasions where the search ranges were being impacted by some mine scale cross faulting outside the area of the mineralization and has therefore removed these from the analysis. A summary of the final fault structures used per vein is included in Table 11-24.


September 2026


SRK Consulting (U.S.), Inc.

SEC Technical Report Summary – Granite Creek

   Page 234


Table 11-24: Summary of Faults and Key Structures Used to Define Variable Orientations for Estimation


Azimuth: 0
Plunge: 0
VO, Ogee 2026_02    VO, Otto_RF 2026_02    VO, SPZ 2026_02 Exclude NE_12_Offset
GC - Mine: EW_4    GC - Mine: Adam Peak Offset Fault    GC - Mine: M9
GC - Mine: LH Offset Fault    GC - Mine: Adam_Peak_Fault    GC - Mine: M14
GC - Mine: LH_Fault    GC - Mine: EW_5    GC - Mine: M19
GC - Mine: M1    GC - Mine: M10    GC - Mine: M20
GC - Mine: M1 Offset    GC - Mine: M11    GC - Mine: M21
GC - Mine: M2    GC - Mine: M12    GC - Mine: M23
GC - Mine: M4    GC - Mine: M13    GC - Mine: M24
GC - Mine: M5    GC - Mine: M14    GC - Mine: M25
GC - Mine: M7    GC - Mine: M15    GC - Regional: Adam Peak Offset Fault
GC - Mine: M8    GC - Mine: NE_1    GC - Regional: Otto Offset Fault
GC - Mine: M9    GC - Mine: NE_10    GC - Regional: Otto Offset Splay
GC - Mine: M16    GC - Mine: NW_1    GC - Regional: Otto_Zone
GC - Mine: M17    GC - Mine: NW_2    GC - Regional: Otto_Zone_2
GC - Mine: M18    GC - Mine: Ogee Fault    GC - Regional: Otto_Zone_3
GC - Mine: NE_3    GC - Mine: Otto Offset Fault    GC - Regional: SPZ
GC - Mine: NE_13    GC - Mine: Otto_Fault   
GC - Mine: NE_14    GC - Mine: Otto_Zone   
GC - Mine: NNE 1    GC - Mine: Range_Front_Fault   
GC - Mine: Ogee Fault    GC - Mine: Splat_Fault   
GC - Mine: Otto Offset Splay      
GC - Mine: Otto_Zone_2      
GC - Mine: SPZ      

Source: SRK, 2026

SRK also undertook a review of the use of a hard and soft boundary between the low-grade / high-grade and boundaries to test if a hard or soft boundary was more appropriate. Given the use of 2 m(5 ft) composites, the analysis focused on 2 m (5 ft) and 3 m (10 ft) boundaries to allow the influence of either single or two samples across the various boundaries. Based on visual review of the models and from boundary analysis the 2 m (5 ft) soft boundary was selected for the HG and LG domains.

SRK undertook a Kriging Neighborhood Analysis (KNA) in Snowden Supervisor to aid in the definition of the minimum and a maximum number of composites to be used. The analysis looked at a range of block sizes (Figure 11-48) with 15 ft x 15 ft x 15 ft selected, and composites numbers ranging from 2 to 60 samples to review the impact on potential smoothing on the grades. SRK noted for both domains through the KNA in Snowden that the number of negative weights increased significantly above 26 to 30 composites. A review of the statistics indicates that the sum of the negative weights first impacts the estimates in the 8 to 12 sample range, and that within this range the estimation variance of the blocks has already been reduced by 52% to 59% with the reduction levelling out in the 16 to 20 composite range and shown in. Figure 11-49 and Figure 11-50.


September 2026


SRK Consulting (U.S.), Inc.

SEC Technical Report Summary – Granite Creek

   Page 235


LOGO

Source: SRK, 2026

Figure 11-48: Block Size Analysis, Ogee HG Domain


September 2026


SRK Consulting (U.S.), Inc.

SEC Technical Report Summary – Granite Creek

   Page 236


LOGO


LOGO

Source: SRK, 2026

Figure 11-49: KNA Analysis on Number of Samples vs. Slope of Regression (Top) and Impact of Negative Weights (Bottom) — Ogee HG Domain


September 2026


SRK Consulting (U.S.), Inc.

SEC Technical Report Summary – Granite Creek

   Page 237


LOGO


LOGO

Source: SRK, 2026

Figure 11-50: KNA Analysis on Number of Samples vs. Slope of Regression (Top) and Impact of Negative Weights (Bottom) — SPZ HG Domain


September 2026


SRK Consulting (U.S.), Inc.

SEC Technical Report Summary – Granite Creek

   Page 238


Based on the KNA analysis the QP completed a number of test estimates with various minimum and maximum number of composites with the view of practically testing the selection ranges presented. The QP then reviewed the results and considered the impact of potential grade smoothing within each of the scenarios and concluded that the preferred number of minimum and maximum samples in the first search should be in the order of 9 (minimum) and 12 (maximum) composites. A maximum of 4 composites per hole were used in the first and second pass which was reduced to 3 composites in the final pass.

The decision to use a maximum of 12 composites vs. 16 or 20 composites (3 holes vs. 4 or 5 holes) was selected based on visual validation and discussions with the i-80 technical team based on the current mining assumptions and model performance. A summary of the final gold parameters is contained in Table 11-25..


September 2026


SRK Consulting (U.S.), Inc.

SEC Technical Report Summary – Granite Creek

   Page 239


Table 11-25: Summary of Estimation Parameters for Gold Estimates


General

    Ellipsoid Ranges     

Ellipsoid Orientation

  Number of Samples     Outlier Restrictions     Drillhole Limit  

Estimator
Name

  Domain     Numeric Values     Maximum     Intermediate     Minimum     

Variable Orientation

  Minimum     Maximum     Method     Max Samples per
Hole
     Apply Drillhole Limit
per Sector
 

Kr, AuCap: OgeeHG Trend SftP1

    OgeeHG       AuCap       55       45       30      VO, Ogee 2026_02     9       12       None       4        TRUE  

Kr, AuCap: OgeeHG Trend SftP2

    OgeeHG       AuCap       125       90       60      VO, Ogee 2026_02     5       16       None       4        TRUE  

Kr, AuCap: OgeeHG Trend SftP3

    OgeeHG       AuCap       210       180       90      VO, Ogee 2026_02     5       12       None       3        TRUE  

Kr, AuCap: OgeeLG Trend SftP1

    OgeeLG       AuCap       65       65       30      VO, Ogee 2026_02     9       12       None       4        TRUE  

Kr, AuCap: OgeeLG Trend SftP2

    OgeeLG       AuCap       130       130       60      VO, Ogee 2026_02     5       16       None       4        TRUE  

Kr, AuCap: OgeeLG Trend SftP3

    OgeeLG       AuCap       210       210       100      VO, Ogee 2026_02     4       12       None       3        TRUE  

Kr, AuCap: OttoHG Trend SftP1

    OttoHG       AuCap       55       45       30      VO, Otto_RF 2026_02     9       12       None       4        TRUE  

Kr, AuCap: OttoHG Trend SftP2

    OttoHG       AuCap       105       90       60      VO, Otto_RF 2026_02     5       16       None       4        TRUE  

Kr, AuCap: OttoHG Trend SftP3

    OttoHG       AuCap       330       300       125      VO, Otto_RF 2026_02     4       12       None       3        TRUE  

Kr, AuCap: OttoLG Trend SftP1

    OttoLG       AuCap       55       30       20      VO, Otto_RF 2026_02     9       12       None       4        TRUE  

Kr, AuCap: OttoLG Trend SftP2

    OttoLG       AuCap       115       55       40      VO, Otto_RF 2026_02     5       16       None       4        TRUE  

Kr, AuCap: OttoLG Trend SftP3

    OttoLG       AuCap       172.5       110       70      VO, Otto_RF 2026_02     2       12       None       3        TRUE  

Kr, AuCap: SPZHG Trend SftP1

    SPZHG       AuCap       115       90       30      VO, SPZ 2026_02 Exclude NE_12_Offset     9       12       None       4        TRUE  

Kr, AuCap: SPZHG Trend SftP2

    SPZHG       AuCap       175       135       40      VO, SPZ 2026_02 Exclude NE_12_Offset     5       16       None       4        TRUE  

Kr, AuCap: SPZHG Trend SftP3

    SPZHG       AuCap       230       175       50      VO, SPZ 2026_02 Exclude NE_12_Offset     3       12       None       3        TRUE  

Kr, AuCap: SPZhwHG Trend SftP1

    SPZhwHG       AuCap       60       60       30      VO, SPZhw 2026_02     5       12       None       4        TRUE  

Kr, AuCap: SPZhwHG Trend SftP2

    SPZhwHG       AuCap       90       90       30      VO, SPZhw 2026_02     5       16       None       4        TRUE  

Kr, AuCap: SPZhwHG Trend SftP3

    SPZhwHG       AuCap       180       180       60      VO, SPZhw 2026_02     2       12       None       3        TRUE  

Kr, AuCap: SPZhwLG Trend SftP1

    SPZhwLG       AuCap       60       60       30      VO, SPZhw 2026_02     5       12       None       4        TRUE  

Kr, AuCap: SPZhwLG Trend SftP2

    SPZhwLG       AuCap       90       90       30      VO, SPZhw 2026_02     5       16       None       4        TRUE  

Kr, AuCap: SPZhwLG Trend SftP3

    SPZhwLG       AuCap       180       180       60      VO, SPZhw 2026_02     2       12       None       3        TRUE  

Kr, AuCap: SPZLG Trend SftP1

    SPZLG       AuCap       85       65       30      VO, SPZ 2026_02 Exclude NE_12_Offset     9       12       None       4        TRUE  

Kr, AuCap: SPZLG Trend SftP2

    SPZLG       AuCap       120       100       40      VO, SPZ 2026_02 Exclude NE_12_Offset     5       16       None       4        TRUE  

Kr, AuCap: SPZLG Trend SftP3

    SPZLG       AuCap       240       200       75      VO, SPZ 2026_02 Exclude NE_12_Offset     2       12       None       3        TRUE  

Source: SRK, 2026


September 2026


SRK Consulting (U.S.), Inc.

SEC Technical Report Summary – Granite Creek

   Page 240


11.2.10 Geo-Metallurgical

Parameters

The mineralization at Granite includes refractory mineralization which requires different processing routes to maximize the recovery and value for the material. The decision to direct material heap leaching or CIL methods and those that require autoclave treatment .is based on metallurgical indicators. The final decisions for material routing are expected to happen during the short-term modeling and production stage of the Project. However, to provide a more accurate reflection of the mine plan within the long-term models and Mineral Reserves calculations, SRK has estimated the key metallurgical factors into the block model. The factors are based on LECO assay analysis of selected samples taken by an i-80 geologist during the recent i-80 infill drilling program.

SRK completed a review of the key parameters which can impact the potential decision for processing routes and expected recoveries which included:


Cyanide Soluble Gold (ppm) – AuCN_BestValue_ppm


Total Organic Carbon (%) – TOC_pct


PregRob (%) – PregRob_pct


Sulfide Sulfur (%) – SulfideSulfur_pct


CO3 (%) – CO3_LT_pct

Prior to the estimation of these elements the QP completed a review of the sampling available as the LECO test work has not been completed routinely during the exploration phases. The results of the analysis (Table 11-26) indicated that there is limited coverage in the additional elements needed with limited datasets in the upper portions of the mine in Ogee and Otto. It is the QP’s opinion that estimates within these regions would not be representative if the same restriction used in the grade estimates on only using Diamond and RC drilling sampling was applied. It is noted that the coverage with the addition of the grade control sampling from within the current underground operation would significantly improve the sampling coverage for use in the metallurgical assessment.

The additional sampling consists of sampling defined as Muck Sampling and Sludge Sampling. The sludge sampling has not been included in the analysis as it is the QP’s opinion that the samples are not representative as all sampling is assigned a default length. In comparison, the muck samples are taken from each round as the mining advances, and while these are not considered as representative across the width of the advance, they are representative of each advance. The QP has therefore taken the approach to supplement the exploration database as used to define the gold estimates, with the aim to provide a more representative local scale variability in the metallurgical parameters.

In addition to the parameters defined above and that the ratio of gold vs. cyanide soluble gold ratio may impact the recovery curves to ensure accurate comparisons between the two values, SRK has also completed an additional estimate for gold using the muck samples defined in the block model as AuGC (g/t). In the cases of the low-grade domains where there remains gaps in the paired data for Au and AuCN only the paired datasets have been used for OgeeLG, OttoLG and SPZLG.


September 2026


SRK Consulting (U.S.), Inc.

SEC Technical Report Summary – Granite Creek

   Page 241


Table 11-26: Summary Statistics and Coverage of Raw Sampling per Metallurgical Parameter vs. Gold Coverage


Name

          Count      Length      Mean      Std Dev      CoV      Variance      Minimum      Maximum      % Coverage  

Au_BestValue_ppm

     OgeeHG        1,970.0        8,097.9        12.12        18.02        1.49        324.72        0.000        143.07     
     OgeeLG        1,912.0        8,619.6        3.40        8.96        2.63        80.27        0.000        114.67     
     OttoHG        1,222.0        5,582.1        8.21        12.27        1.49        150.57        0.000        130.42     
     OttoLG        2,061.0        9,870.9        2.58        5.66        2.20        32.06        0.000        67.20     
     SPZHG        1,063.0        4,554.6        9.31        13.98        1.50        195.58        0.000        140.91     
     SPZhwHG        53.0        215.1        11.93        15.80        1.32        249.60        0.008        79.00     
     SPZhwLG        193.0        947.4        1.41        1.92        1.36        3.67        0.000        15.15     
     SPZLG        601.0        2,704.1        2.03        5.14        2.54        26.38        0.000        51.50     

AuCN_BestValue_ppm

     OgeeHG        972.0        4,242.4        11.60        13.88        1.20        192.65        0.001        125.73        52.4  
     OgeeLG        577.0        2,666.0        5.38        9.10        1.69        82.72        0.001        104.40        30.9  
     OttoHG        578.0        2,630.3        4.13        8.69        2.11        75.59        0.015        72.37        47.1  
     OttoLG        677.0        3,189.9        1.99        4.57        2.30        20.86        0.001        34.48        32.3  
     SPZHG        748.0        3,135.2        2.05        5.24        2.55        27.42        0.001        47.74        68.8  
     SPZhwHG        25.0        106.6        1.53        1.76        1.15        3.11        0.034        6.10        49.6  
     SPZhwLG        113.0        553.9        0.46        0.65        1.42        0.42        0.014        3.27        58.5  
     SPZLG        244.0        1,058.2        1.13        2.91        2.58        8.47        0.001        19.49        39.1  

CO3_LT_pct

     OgeeHG        651.0        2,631.7        11.55        13.43        1.16        180.41        0.000        62.26        32.5  
     OgeeLG        428.0        1,912.3        15.99        13.90        0.87        193.21        0.000        54.88        22.2  
     OttoHG        493.0        2,187.1        19.30        15.15        0.79        229.59        0.000        61.20        39.2  
     OttoLG        444.0        2,051.7        14.47        14.54        1.00        211.40        0.000        66.06        20.8  
     SPZHG        789.0        3,344.9        12.66        13.20        1.04        174.17        0.000        64.66        73.4  
     SPZhwHG        17.0        62.7        6.48        7.91        1.22        62.62        0.200        29.35        29.1  
     SPZhwLG        44.0        208.0        13.58        16.19        1.19        262.08        0.864        54.60        22.0  
     SPZLG        327.0        1,446.4        17.14        16.40        0.96        269.09        0.000        57.10        53.5  

PregRob_Pct

     OgeeHG        144.0        607.8        6.87        15.16        2.21        229.87        0.000        95.00        7.5  
     OgeeLG        71.0        295.0        2.56        6.29        2.46        39.59        0.000        38.80        3.4  
     OttoHG        181.0        821.6        3.93        8.83        2.25        78.03        0.000        75.50        14.7  
     OttoLG        77.0        335.6        2.67        6.47        2.42        41.91        0.000        47.10        3.4  
     SPZHG        667.0        2,796.9        3.06        9.17        3.00        84.16        0.000        164.10        61.4  
     SPZhwHG        14.0        52.2        3.08        5.32        1.73        28.35        0.000        16.70        24.3  
     SPZhwLG        26.0        128.0        2.17        5.25        2.41        27.51        0.000        19.40        13.5  
     SPZLG        201.0        861.0        2.14        4.21        1.97        17.76        0.000        26.00        31.8  

SulfideSulfur_pct

     OgeeHG        651.0        2,631.7        0.50        0.94        1.87        0.88        0.000        6.11        32.5  
     OgeeLG        428.0        1,912.3        0.50        0.91        1.84        0.83        0.000        5.47        22.2  
     OttoHG        493.0        2,187.1        1.18        1.28        1.09        1.63        0.000        6.44        39.2  
     OttoLG        444.0        2,051.7        1.10        1.35        1.23        1.83        0.000        6.72        20.8  
     SPZHG        789.0        3,344.9        1.76        1.26        0.71        1.59        0.000        8.63        73.4  
     SPZhwHG        17.0        62.7        2.69        0.84        0.31        0.71        1.803        4.85        29.1  
     SPZhwLG        44.0        208.0        1.43        1.17        0.82        1.37        0.000        4.20        22.0  
     SPZLG        327.0        1,446.4        1.10        1.12        1.02        1.25        0.000        9.95        53.5  

TOC_pct_D

     OgeeHG        651.0        2,631.7        0.27        0.25        0.96        0.06        0.017        2.83        32.5  
     OgeeLG        428.0        1,912.3        0.25        0.23        0.92        0.05        0.000        2.02        22.2  
     OttoHG        493.0        2,187.1        0.19        0.18        0.94        0.03        0.002        1.36        39.2  
     OttoLG        444.0        2,051.7        0.21        0.24        1.17        0.06        0.000        5.17        20.8  
     SPZHG        789.0        3,344.9        0.47        0.60        1.26        0.35        0.008        6.79        73.4  
     SPZhwHG        17.0        62.7        1.64        2.00        1.22        3.99        0.082        5.53        29.1  
     SPZhwLG        44.0        208.0        1.11        1.14        1.03        1.30        0.019        4.07        22.0  
     SPZLG        327.0        1,446.4        0.62        0.85        1.38        0.73        0.000        5.10        53.5  

Source: SRK, 2026

Note: % Coverage is based on the total length per domain of each element versus the Au BestValue ppm coverage.


September 2026


SRK Consulting (U.S.), Inc.

SEC Technical Report Summary – Granite Creek

   Page 242


Based on the revised database using the muck samples, the process workflow used by SRK has followed the same procedures as presented in the gold estimation process (Section 14.3.9). Capping has been completed per element with the AuGC values using the same capping parameters as presented in the gold estimates, with all other elements considered on a case-by-case basis per domain. The capped statistics are presented in Table 11-27.

Table 11-27: Summary Statistics of Capped Composites (5 ft), Showing Capping (Maximum) Levels per Metallurgical Elements


Name

   Domain      Count      Length      Mean      Std
Dev
     CoV      Variance      Minimum      Maximum  

AuCn_cap

     OgeeHG        938.0        4,667.3        11.22        11.91        1.06        141.87        0.00        52.00  
     OgeeLG        594.0        2,944.3        4.80        6.58        1.37        43.26        0.00        22.50  
     OttoHG        583.0        2,887.1        3.74        6.59        1.76        43.40        0.02        35.00  
     OttoLG        725.0        3,566.0        1.91        4.13        2.16        17.07        0.00        25.00  
     SPZHG        680.0        3,349.7        1.93        4.06        2.10        16.48        0.00        25.00  
     SPZhwHG        22.0        110.1        1.60        1.69        1.06        2.85        0.03        5.50  
     SPZhwLG        120.0        594.0        0.48        0.66        1.38        0.44        0.02        3.25  
     SPZLG        247.0        1,200.2        1.11        2.50        2.25        6.25        0.00        12.50  

PregRob_Cap

     OgeeHG        147.0        730.5        6.01        9.81        1.63        96.20        0.00        47.50  
     OgeeLG        73.0        355.5        2.24        4.54        2.02        20.59        0.00        19.50  
     OttoHG        188.0        938.4        3.25        4.74        1.45        22.42        0.00        21.50  
     OttoLG        85.0        413.9        2.26        3.62        1.60        13.12        0.00        17.50  
     SPZHG        613.0        3,026.2        2.51        4.28        1.70        18.31        0.00        20.00  
     SPZhwHG        11.0        55.2        3.24        4.55        1.40        20.72        0.00        15.00  
     SPZhwLG        32.0        157.0        2.03        4.47        2.20        19.96        0.00        15.00  
     SPZLG        205.0        999.8        2.24        3.83        1.71        14.70        0.00        15.50  

TOCcap

     OgeeHG        562.0        2,760.5        0.27        0.23        0.86        0.05        0.03        1.60  
     OgeeLG        403.0        1,959.5        0.25        0.21        0.84        0.04        0.00        1.35  
     OttoHG        469.0        2,317.5        0.20        0.18        0.93        0.03        0.00        1.36  
     OttoLG        452.0        2,181.5        0.21        0.20        0.92        0.04        0.00        1.95  
     SPZHG        711.0        3,506.7        0.46        0.52        1.12        0.27        0.01        3.30  
     SPZhwHG        13.0        65.2        1.60        1.96        1.22        3.82        0.10        5.00  
     SPZhwLG        45.0        217.5        1.49        2.67        1.79        7.13        0.02        13.30  
     SPZLG        316.0        1,540.4        0.61        0.79        1.30        0.62        0.01        3.50  

SulfSulf_Cap

     OgeeHG        562.0        2,760.5        0.49        0.82        1.67        0.67        0.00        3.65  
     OgeeLG        403.0        1,959.5        0.48        0.83        1.75        0.70        0.00        3.20  
     OttoHG        469.0        2,317.5        1.21        1.22        1.01        1.49        0.00        4.75  
     OttoLG        452.0        2,181.5        1.11        1.25        1.13        1.56        0.00        4.75  
     SPZHG        711.0        3,506.7        1.75        1.11        0.63        1.24        0.00        5.00  
     SPZhwHG        13.0        65.2        2.68        0.65        0.24        0.42        1.80        3.60  
     SPZhwLG        45.0        217.5        1.44        1.12        0.78        1.25        0.00        3.75  
     SPZLG        316.0        1,540.4        1.09        1.02        0.94        1.05        0.00        4.15  

CO3cap

     OgeeHG        562.0        2,760.5        11.30        12.32        1.09        151.80        0.00        50.00  
     OgeeLG        403.0        1,959.5        15.96        13.11        0.82        171.80        0.00        50.00  
     OttoHG        469.0        2,317.5        18.76        13.78        0.73        189.94        0.00        47.00  
     OttoLG        452.0        2,181.5        14.24        13.79        0.97        190.13        0.00        48.00  
     SPZHG        711.0        3,506.7        12.85        12.60        0.98        158.67        0.00        55.00  
     SPZhwHG        13.0        65.2        6.34        6.60        1.04        43.56        0.26        25.00  
     SPZhwLG        45.0        217.5        13.72        15.28        1.11        233.38        1.04        50.00  
     SPZLG        316.0        1,540.4        17.13        15.58        0.91        242.68        0.09        52.00  

Source: SRK, 2026

SRK reviewed the geostatistical properties of the domains using Snowden Supervisor (version 9.0.4.0). Variography was completed on each of the parameters, which have been modeled using nested double structured spherical variograms.


September 2026


SRK Consulting (U.S.), Inc.

SEC Technical Report Summary – Granite Creek

   Page 243


Variograms have been modeled using a combination of variograms and correlograms depending on the quality of the experimental variogram data, which have been transformed and normalized in Supervisor and the parameters transferred to Leapfrog® for the estimation process. A summary of the parameters are shown in Table 11-28.

Estimation has been completed using a combination of either Ordinary Kriging or Inverse Distance weighting using the capped 2 m (5 ft) composites and the same variable orientation as used for the primary elements. The estimation has been completed using a three-pass process using the parameters as presented in Table 11-28 to Table 11-33.


September 2026


SRK Consulting (U.S.), Inc.

SEC Technical Report Summary – Granite Creek

   Page 244


Table 11-28: Summary of Variogram Parameters Used for Metallurgical Elements


Variable

  Domain     Nugget     s1_sill     s1_major     s1_semi_major     s1_minor     s2_sill     s2_major     s2_semi_major     s2_minor     dip     dip_azimuth     Pitch     Variance  

AuCN (cyanide-soluble gold)

    OgeeHG       0.091       0.678       24       26       17       0.23       65       97       60       80       165       100       65.6  

AuCN (cyanide-soluble gold)

    OgeeLG       0.316       0.39       20       25       16       0.294       95       117       70       80       155       95       20.73  

AuCN (cyanide-soluble gold)

    OttoHG       0.159       0.488       22       14       20       0.353       300       265       80       70       140       45       24.68  

AuCN (cyanide-soluble gold)

    OttoLG       0.297       0.411       28       19       20       0.293       300       80       100       55       140       90       9.68  

AuCN (cyanide-soluble gold)

    SPZHG       0.345       0.329       30       30       15       0.326       170       120       50       55       130       120       15.1  

AuCN (cyanide-soluble gold)

    SPZLG       0.343       0.427       40       17       10       0.23       160       135       50       0       0       90       5.03  

PregRob (preg-robbing)

    OgeeHG       0.274       0.596       20       25       20       0.129       100       115       95       70       165       100       52.98  

PregRob (preg-robbing)

    OgeeLG       0.239       0.609       20       20       12       0.152       100       95       60       75       165       100       14.63  

PregRob (preg-robbing)

    OttoHG       0.174       0.64       30       30       17       0.187       310       300       58       80       150       45       15.19  

PregRob (preg-robbing)

    OttoLG       0.184       0.646       50       50       20       0.171       208       250       60       80       160       50       7.31  

PregRob (preg-robbing)

    SPZHG       0.222       0.427       50       50       27       0.351       260       260       73       55       130       120       16.95  

PregRob (preg-robbing)

    SPZLG       0.19       0.32       36       36       36       0.49       330       330       330       0       0       90       12.18  

CO3 (carbonate)

    OgeeHG       0.142       0.645       30       30       19       0.214       150       160       105       70       165       100       72.87  

CO3 (carbonate)

    OgeeLG       0.096       0.322       25       22       27       0.581       390       170       150       70       140       45       112.36  

CO3 (carbonate)

    OttoHG       0.095       0.42       26       20       15       0.485       253       210       117       70       140       45       88.66  

CO3 (carbonate)

    OttoLG       0.096       0.322       25       22       27       0.581       390       170       150       70       140       45       112.36  

CO3 (carbonate)

    SPZHG       0.122       0.413       60       26       17       0.465       300       285       90       55       130       120       148.29  

CO3 (carbonate)

    SPZLG       0.14       0.52       74       74       74       0.34       267       267       267       0       0       90       213.8  

TOC (total organic carbon)

    OgeeHG       0.114       0.503       25       30       20       0.383       248       204       215       55       345       80       0.04  

TOC (total organic carbon)

    OgeeLG       0.115       0.368       16       16       15       0.517       160       160       125       55       345       80       0.05  

TOC (total organic carbon)

    OttoHG       0.119       0.604       50       25       15       0.277       280       140       65       70       140       45       0.03  

TOC (total organic carbon)

    OttoLG       0.133       0.532       25       25       30       0.336       179       110       110       50       140       50       0.06  

TOC (total organic carbon)

    SPZHG       0.169       0.425       50       40       30       0.406       280       260       80       55       130       120       0.26  

TOC (total organic carbon)

    SPZLG       0.1       0.9       370       370       370                  

SulfS (sulfide sulfur)

    OgeeHG       0.153       0.488       23       7       16       0.359       230       112       190       70       140       40       0.31  

SulfS (sulfide sulfur)

    OgeeLG       0.313       0.337       20       20       25       0.35       275       150       145       70       320       140       0.22  

SulfS (sulfide sulfur)

    OttoHG       0.211       0.432       30       41       20       0.357       360       260       62       70       140       45       0.76  

SulfS (sulfide sulfur)

    OttoLG       0.15       0.363       21       25       25       0.487       150       228       64       55       140       90       0.8  

SulfS (sulfide sulfur)

    SPZHG       0.21       0.301       40       40       15       0.489       330       210       60       55       130       120       1.15  

SulfS (sulfide sulfur)

    SPZLG       0.07       0.21       15       15       15       0.72       170       170       170       0       0       90       0.9256  

Source: SRK, 2026


September 2026


SRK Consulting (U.S.), Inc.

SEC Technical Report Summary – Granite Creek

   Page 245


Table 11-29: Summary of Search Parameters Used for AuCN


General

    Ellipsoid Ranges     Ellipsoid Orientation   Number of Samples     Outlier
Restrictions
    Drillhole Limit

Estimator Name

  Domain     Numeric Values     Maximum     Intermediate     Minimum     Variable Orientation   Minimum     Maximum     Method     Max Samples
per Hole
    Apply Drillhole Limit
per Sector

Kr, AuCN_Cap: Domain Trend P1

    OgeeHGtrend       AuCn_cap       45       75       30     VO, Ogee 2026_02     5       12       None       4     TRUE

Kr, AuCN_Cap: Domain Trend P2

    OgeeHGtrend       AuCn_cap       65       97       60     VO, Ogee 2026_02     5       16       None       4     TRUE

Kr, AuCN_Cap: Domain Trend P3

    OgeeHGtrend       AuCn_cap       210       210       90     VO, Ogee 2026_02     5       16       None       4     TRUE

Kr, AuCN_Cap: Domain Trend P1

    OgeeLGtrend       AuCn_cap       50       60       35     VO, Ogee 2026_02     5       12       None       4     TRUE

Kr, AuCN_Cap: Domain Trend P2

    OgeeLGtrend       AuCn_cap       100       120       70     VO, Ogee 2026_02     5       16       None       4     TRUE

Kr, AuCN_Cap: Domain Trend P3

    OgeeLGtrend       AuCn_cap       210       210       100     VO, Ogee 2026_02     5       16       None       4     TRUE

Kr, AuCN_Cap: Domain Trend P1

    OttoHGtrend       AuCn_cap       75       65       40     VO, Otto_RF 2026_02     5       12       None       4     TRUE

Kr, AuCN_Cap: Domain Trend P2

    OttoHGtrend       AuCn_cap       150       135       60     VO, Otto_RF 2026_02     5       16       None       4     TRUE

Kr, AuCN_Cap: Domain Trend P3

    OttoHGtrend       AuCn_cap       330       300       125     VO, Otto_RF 2026_02     5       16       None       4     TRUE

Kr, AuCN_Cap: Domain Trend P1

    OttoLGtrend       AuCn_cap       55       30       20     VO, Otto_RF 2026_02     5       12       None       4     TRUE

Kr, AuCN_Cap: Domain Trend P2

    OttoLGtrend       AuCn_cap       115       55       40     VO, Otto_RF 2026_02     5       16       None       4     TRUE

Kr, AuCN_Cap: Domain Trend P3

    OttoLGtrend       AuCn_cap       172.5       110       70     VO, Otto_RF 2026_02     5       16       None       4     TRUE

Kr, AuCN_Cap: Domain Trend P1

    SPZHGtrend       AuCn_cap       85       60       30     VO, SPZ 2026_02 Exclude

NE_12_Offset

    5       12       None       4     TRUE

Kr, AuCN_Cap: Domain Trend P2

    SPZHGtrend       AuCn_cap       125       85       50     VO, SPZ 2026_02 Exclude

NE_12_Offset

    5       16       None       4     TRUE

Kr, AuCN_Cap: Domain Trend P3

    SPZHGtrend       AuCn_cap       230       175       60     VO, SPZ 2026_02 Exclude

NE_12_Offset

    5       16       None       4     TRUE

ID, AuCN_BestValue_ppm_D: Domain Trend P1

    SPZhwHGtrend       AuCn_cap       60       60       30     VO, SPZhw 2026_02     5       12       None       4     TRUE

ID, AuCN_BestValue_ppm_D: Domain Trend P2

    SPZhwHGtrend       AuCn_cap       90       90       30     VO, SPZhw 2026_02     5       16       None       4     TRUE

ID, AuCN_BestValue_ppm_D: Domain Trend P3

    SPZhwHGtrend       AuCn_cap       180       180       60     VO, SPZhw 2026_02     4       12       None       4     TRUE

ID, AuCN_Cap: Domain Trend P1

    SPZhwLGtrend       AuCn_cap       60       60       30     VO, SPZhw 2026_02     5       12       None       4     TRUE

ID, AuCN_Cap: Domain Trend P2

    SPZhwLGtrend       AuCn_cap       90       90       30     VO, SPZhw 2026_02     5       16       None       4     TRUE

ID, AuCN_Cap: Domain Trend P3

    SPZhwLGtrend       AuCn_cap       180       180       60     VO, SPZhw 2026_02     5       16       None       4     TRUE

Kr, AuCN_Cap: Domain Trend P1

    SPZLGtrend       AuCn_cap       80       75       30     VO, SPZ 2026_02 Exclude

NE_12_Offset

    5       12       None       4     TRUE

Kr, AuCN_Cap: Domain Trend P2

    SPZLGtrend       AuCn_cap       160       135       50     VO, SPZ 2026_02 Exclude

NE_12_Offset

    5       16       None       4     TRUE

Kr, AuCN_Cap: Domain Trend P3

    SPZLGtrend       AuCn_cap       200       180       60     VO, SPZ 2026_02 Exclude

NE_12_Offset

    5       16       None       4     TRUE


September 2026


SRK Consulting (U.S.), Inc.

SEC Technical Report Summary – Granite Creek

   Page 246


Table 11-30: Summary Estimation Parameters (CO3 %)


General

  Ellipsoid Ranges    

Ellipsoid Orientation

  Number of Samples     Outlier
Restrictions
    Drillhole Limit

Estimator Name


Domain


Numeric Values

  Maximum     Intermediate     Minimum    

Variable Orientation

  Minimum     Maximum     Method     Max Samples
per Hole
    Apply Drillhole
Limit per Sector

Kr, CO3cap: Domain Trend P1

  OgeeHGtrend   CO3cap     75       80       30     VO, Ogee 2026_02     9       20       None       4     TRUE

Kr, CO3cap: Domain Trend P2

  OgeeHGtrend   CO3cap     150       160       60     VO, Ogee 2026_02     5       24       None       4     TRUE

Kr, CO3cap: Domain Trend P3

  OgeeHGtrend   CO3cap     200       210       105     VO, Ogee 2026_02     5       16       None       4     TRUE

Kr, CO3cap: Domain Trend P1

  OgeeLGtrend   CO3cap     65       100       45     VO, Ogee 2026_02     9       20       None       4     TRUE

Kr, CO3cap: Domain Trend P2

  OgeeLGtrend   CO3cap     129       200       90     VO, Ogee 2026_02     5       24       None       4     TRUE

Kr, CO3cap: Domain Trend P3

  OgeeLGtrend   CO3cap     195       300       135     VO, Ogee 2026_02     5       16       None       4     TRUE

Kr, CO3cap: Domain Trend P1

  OttoHGtrend   CO3cap     125       105       60     VO, Otto_RF 2026_02     9       20       None       4     TRUE

Kr, CO3cap: Domain Trend P2

  OttoHGtrend   CO3cap     190       160       90     VO, Otto_RF 2026_02     5       24       None       4     TRUE

Kr, CO3cap: Domain Trend P3

  OttoHGtrend   CO3cap     250       210       120     VO, Otto_RF 2026_02     5       16       None       4     TRUE

Kr, CO3cap: Domain Trend P1

  OttoLGtrend   CO3cap     145       65       55     VO, Otto_RF 2026_02     9       20       None       4     TRUE

Kr, CO3cap: Domain Trend P2

  OttoLGtrend   CO3cap     290       130       110     VO, Otto_RF 2026_02     5       24       None       4     TRUE

Kr, CO3cap: Domain Trend P3

  OttoLGtrend   CO3cap     390       170       150     VO, Otto_RF 2026_02     5       16       None       4     TRUE

Kr, CO3cap: Domain Trend P1

  SPZHGtrend   CO3cap     85       65       40    

VO, SPZ 2026_02 Exclude

NE_12_Offset

    9       20       None       4     TRUE

Kr, CO3cap: Domain Trend P2

  SPZHGtrend   CO3cap     150       145       45    

VO, SPZ 2026_02 Exclude

NE_12_Offset

    5       24       None       4     TRUE

Kr, CO3cap: Domain Trend P3

  SPZHGtrend   CO3cap     300       285       90    

VO, SPZ 2026_02 Exclude

NE_12_Offset

    5       16       None       4     TRUE

Kr, CO3cap: Domain Trend P1

  SPZhwHGtrend   CO3cap     60       60       30     VO, SPZhw 2026_02     5       16       None       4     TRUE

Kr, CO3cap: Domain Trend P2

  SPZhwHGtrend   CO3cap     90       90       30     VO, SPZhw 2026_02     5       16       None       4     TRUE

Kr, CO3cap: Domain Trend P3

  SPZhwHGtrend   CO3cap     180       180       60     VO, SPZhw 2026_02     4       12       None       4     TRUE

Kr, CO3cap: Domain Trend P1

  SPZhwLGtrend   CO3cap     60       60       30     VO, SPZhw 2026_02     5       16       None       4     TRUE

Kr, CO3cap: Domain Trend P2

  SPZhwLGtrend   CO3cap     90       90       30     VO, SPZhw 2026_02     5       16       None       4     TRUE

Kr, CO3cap: Domain Trend P3

  SPZhwLGtrend   CO3cap     180       180       60     VO, SPZhw 2026_02     4       12       None       4     TRUE

Kr, CO3cap: Domain Trend P1

  SPZLGtrend   CO3cap     70       70       30    

VO, SPZ 2026_02 Exclude

NE_12_Offset

    5       16       None       4     TRUE

Kr, CO3cap: Domain Trend P2

  SPZLGtrend   CO3cap     135       135       60    

VO, SPZ 2026_02 Exclude

NE_12_Offset

    5       24       None       4     TRUE

Kr, CO3cap: Domain Trend P3

  SPZLGtrend   CO3cap     270       270       100    

VO, SPZ 2026_02 Exclude

NE_12_Offset

    5       16       None       4     TRUE


September 2026


SRK Consulting (U.S.), Inc.

SEC Technical Report Summary – Granite Creek

   Page 247


Table 11-31: Summary Estimation Parameters (Preg Rob %)


General

     Ellipsoid Ranges     

Ellipsoid Orientation

   Number of Samples      Outlier
Restrictions
     Drillhole Limit

Estimator
Name


Domain

   Numeric
Values
     Maximum      Intermediate      Minimum     

Variable Orientation

   Minimum      Maximum      Method      Max Samples
per Hole
     Apply Drillhole
Limit per Sector

ID, PregRob_Cap: Domain Trend P1

   OgeeHG trend      PregRob_Cap        50        60        30      VO, Ogee 2026_02      9        20        None        4      TRUE

ID, PregRob_Cap: Domain Trend P2

   OgeeHG trend      PregRob_Cap        100        115        60      VO, Ogee 2026_02      5        24        None        4      TRUE

ID, PregRob_Cap: Domain Trend P3

   OgeeHG trend      PregRob_Cap        210        210        90      VO, Ogee 2026_02      5        16        None        4      TRUE

ID, PregRob_Cap: Domain Trend P1

   OgeeLG trend      PregRob_Cap        50        45        30      VO, Ogee 2026_02      9        20        None        4      TRUE

ID, PregRob_Cap: Domain Trend P2

   OgeeLG trend      PregRob_Cap        100        95        60      VO, Ogee 2026_02      5        24        None        4      TRUE

ID, PregRob_Cap: Domain Trend P3

   OgeeLG trend      PregRob_Cap        200        190        120      VO, Ogee 2026_02      5        16        None        4      TRUE

ID, PregRob_Cap: Domain Trend P1

   OttoHG trend      PregRob_Cap        80        75        30      VO, Otto_RF 2026_02      9        20        None        4      TRUE

ID, PregRob_Cap: Domain Trend P2

   OttoHG trend      PregRob_Cap        155        150        60      VO, Otto_RF 2026_02      5        24        None        4      TRUE

ID, PregRob_Cap: Domain Trend P3

   OttoHG trend      PregRob_Cap        235        225        90      VO, Otto_RF 2026_02      5        16        None        4      TRUE

ID, PregRob_Cap: Domain Trend P1

   OttoLG trend      PregRob_Cap        75        85        30      VO, Otto_RF 2026_02      9        20        None        4      TRUE

ID, PregRob_Cap: Domain Trend P2

   OttoLG trend      PregRob_Cap        156        195        60      VO, Otto_RF 2026_02      5        24        None        4      TRUE

ID, PregRob_Cap: Domain Trend P3

   OttoLG trend      PregRob_Cap        210        250        90      VO, Otto_RF 2026_02      5        16        None        4      TRUE

ID, PregRob_Cap: Domain Trend P1

   SPZHG trend      PregRob_Cap        65        65        35     

VO, SPZ 2026_02 Exclude

NE_12_Offset

     9        20        None        4      TRUE

ID, PregRob_Cap: Domain Trend P2

   SPZHG trend      PregRob_Cap        130        130        55     

VO, SPZ 2026_02 Exclude

NE_12_Offset

     5        24        None        4      TRUE

ID, PregRob_Cap: Domain Trend P3

   SPZHG trend      PregRob_Cap        260        260        90     

VO, SPZ 2026_02

Exclude NE_12_Offset

     5        16        None        4      TRUE

ID, PregRob_Cap: Domain Trend P1

   SPZhwHG trend      PregRob_Cap        60        60        30      VO, SPZhw 2026_02      5        12        None        4      TRUE

ID, PregRob_Cap: Domain Trend P2

   SPZhwHG trend      PregRob_Cap        90        90        30      VO, SPZhw 2026_02      4        12        None        3      TRUE

ID, PregRob_Cap: Domain Trend P3

   SPZhwHG trend      PregRob_Cap        180        180        60      VO, SPZhw 2026_02      4        12        None        3      TRUE

ID, PregRob_Cap: Domain Trend P1

   SPZhwLG trend      PregRob_Cap        60        60        30      VO, SPZhw 2026_02      5        12        None        4      TRUE

ID, PregRob_Cap: Domain Trend P2

   SPZhwLG trend      PregRob_Cap        90        90        30      VO, SPZhw 2026_02      4        12        None        3      TRUE

ID, PregRob_Cap: Domain Trend P3

   SPZhwLG trend      PregRob_Cap        180        180        60      VO, SPZhw 2026_02      2        12        None        3      TRUE

ID, PregRob_Cap: Domain Trend P1

   SPZLG trend      PregRob_Cap        80        65        20     

VO, SPZ 2026_02 Exclude

NE_12_Offset

     9        20        None        4      TRUE

ID, PregRob_Cap: Domain Trend P2

   SPZLG trend      PregRob_Cap        120        100        30     

VO, SPZ 2026_02 Exclude

NE_12_Offset

     5        24        None        4      TRUE

ID, PregRob_Cap: Domain Trend P3

   SPZLG trend      PregRob_Cap        160        130        60     

VO, SPZ 2026_02 Exclude

NE_12_Offset

     5        16        None        4      TRUE


September 2026


SRK Consulting (U.S.), Inc.

SEC Technical Report Summary – Granite Creek

   Page 248


Table 11-32: Summary Estimation Parameters (Total Organic Carbon, TOC %)


General

   Ellipsoid Ranges   

Ellipsoid Orientation

   Number of Samples    Outlier
Restrictions
   Drillhole Limit

Estimator Name


Domain

   Numeric Values    Maximum    Intermediate    Minimum   

Variable Orientation

   Minimum    Maximum    Method    Max Samples
per Hole
   Apply Drillhole
Limit per Sector

Kr, TOC_pct_D: Domain Trend P1


OgeeHG trend

   TOCcap    75    50    30   

VO, Ogee 2026_02

   9    24    None    4    TRUE

Kr, TOC_pct_D: Domain Trend P2


OgeeHG trend

   TOCcap    150    75    50   

VO, Ogee 2026_02

   5    24    None    4    TRUE

Kr, TOC_pct_D: Domain Trend P3


OgeeHG trend

   TOCcap    200    100    70   

VO, Ogee 2026_02

   4    16    None    4    TRUE

Kr, TOC_pct_D: Domain Trend P1


OgeeLG trend

   TOCcap    80    80    60   

VO, Ogee 2026_02

   9    24    None    4    TRUE

Kr, TOC_pct_D: Domain Trend P2


OgeeLG trend

   TOCcap    160    160    90   

VO, Ogee 2026_02

   5    24    None    4    TRUE

Kr, TOC_pct_D: Domain Trend P3


OgeeLG trend

   TOCcap    200    200    155   

VO, Ogee 2026_02

   4    16    None    4    TRUE

Kr, TOC_pct_D: Domain Trend P1


OttoHG trend

   TOCcap    70    50    30   

VO, Otto_RF 2026_02

   9    24    None    4    TRUE

Kr, TOC_pct_D: Domain Trend P2


OttoHG trend

   TOCcap    140    105    65   

VO, Otto_RF 2026_02

   5    24    None    4    TRUE

Kr, TOC_pct_D: Domain Trend P3


OttoHG trend

   TOCcap    280    175    80   

VO, Otto_RF 2026_02

   4    16    None    4    TRUE

Kr, TOC_pct_D: Domain Trend P1


OttoLG trend

   TOCcap    55    30    20   

VO, Otto_RF 2026_02

   9    24    None    4    TRUE

Kr, TOC_pct_D: Domain Trend P2


OttoLG trend

   TOCcap    135    85    85   

VO, Otto_RF 2026_02

   5    24    None    4    TRUE

Kr, TOC_pct_D: Domain Trend P3


OttoLG trend

   TOCcap    180    110    110   

VO, Otto_RF 2026_02

   4    16    None    4    TRUE

Kr, TOC_pct_D: Domain Trend P1


SPZHG trend

   TOCcap    85    55    30   

VO, SPZ 2026_02 Exclude

NE_12_Offset

   9    24    None    4    TRUE

Kr, TOC_pct_D: Domain Trend P2


SPZHG trend

   TOCcap    165    105    45   

VO, SPZ 2026_02 Exclude

NE_12_Offset

   5    24    None    4    TRUE

Kr, TOC_pct_D: Domain Trend P3


SPZHG trend

   TOCcap    330    210    60   

VO, SPZ 2026_02 Exclude

NE_12_Offset

   4    16    None    4    TRUE

Kr, TOC_pct_D: Domain Trend P1


SPZhwHG trend

   TOCcap    60    60    30   

VO, SPZhw 2026_02

   5    16    None    4    TRUE

Kr, TOC_pct_D: Domain Trend P2


SPZhwHG trend

   TOCcap    90    90    30   

VO, SPZhw 2026_02

   5    16    None    4    TRUE

Kr, TOC_pct_D: Domain Trend P3


SPZhwHG trend

   TOCcap    180    180    60   

VO, SPZhw 2026_02

   4    16    None    4    TRUE

Kr, TOC_pct_D: Domain Trend P1


SPZhwLG trend

   TOCcap    60    60    30   

VO, SPZhw 2026_02

   5    16    None    4    TRUE

Kr, TOC_pct_D: Domain Trend P2


SPZhwLG trend

   TOCcap    90    90    30   

VO, SPZhw 2026_02

   5    16    None    4    TRUE

Kr, TOC_pct_D: Domain Trend P3


SPZhwLG trend

   TOCcap    180    180    60   

VO, SPZhw 2026_02

   4    16    None    4    TRUE

Kr, TOC_pct_D: Domain Trend P1


SPZLG trend

   TOCcap    75    75    75   

VO, SPZ 2026_02 Exclude

NE_12_Offset

   9    24    None    4    TRUE

Kr, TOC_pct_D: Domain Trend P2


SPZLG trend

   TOCcap    170    170    170   

VO, SPZ 2026_02 Exclude

NE_12_Offset

   5    24    None    4    TRUE

Kr, TOC_pct_D: Domain Trend P3


SPZLG trend

   TOCcap    370    370    370   

VO, SPZ 2026_02 Exclude

NE_12_Offset

   4    16    None    4    TRUE


September 2026


SRK Consulting (U.S.), Inc.

SEC Technical Report Summary – Granite Creek

   Page 249


Table 11-33: Summary Estimation Parameters (Sulfide Sulfur %)


General

  Ellipsoid Ranges    

Ellipsoid Orientation

  Number of Samples     Outlier
Restrictions
    Drillhole Limit

Estimator Name

  Domain  

Numeric Values

  Maximum     Intermediate     Minimum    

Variable Orientation

  Minimum     Maximum     Method     Max Samples
per Hole
     Apply Drillhole
Limit per Sector

ID, SulfideSulfur_pct_D: Domain Trend P1

  OgeeHGtrend   SulfSulf_Cap     60       30       50     VO, Ogee 2026_02     9       24       None       4      TRUE

ID, SulfideSulfur_pct_D: Domain Trend P2

  OgeeHGtrend   SulfSulf_Cap     115       60       95     VO, Ogee 2026_02     5       24       None       4      TRUE

ID, SulfideSulfur_pct_D: Domain Trend P3

  OgeeHGtrend   SulfSulf_Cap     230       115       190     VO, Ogee 2026_02     5       16       None       4      TRUE

ID, SulfideSulfur_pct_D: Domain Trend P1

  OgeeLGtrend   SulfSulf_Cap     75       35       35     VO, Ogee 2026_02     9       24       None       4      TRUE

ID, SulfideSulfur_pct_D: Domain Trend P2

  OgeeLGtrend   SulfSulf_Cap     130       75       75     VO, Ogee 2026_02     5       24       None       4      TRUE

ID, SulfideSulfur_pct_D: Domain Trend P3

  OgeeLGtrend   SulfSulf_Cap     275       150       145     VO, Ogee 2026_02     5       16       None       4      TRUE

ID, SulfideSulfur_pct_D: Domain Trend P1

  OttoHGtrend   SulfSulf_Cap     90       80       30     VO, Otto_RF 2026_02     9       24       None       4      TRUE

ID, SulfideSulfur_pct_D: Domain Trend P2

  OttoHGtrend   SulfSulf_Cap     180       130       60     VO, Otto_RF 2026_02     5       24       None       4      TRUE

ID, SulfideSulfur_pct_D: Domain Trend P3

  OttoHGtrend   SulfSulf_Cap     270       195       75     VO, Otto_RF 2026_02     5       16       None       4      TRUE

ID, SulfideSulfur_pct_D: Domain Trend P1

  OttoLGtrend   SulfSulf_Cap     60       85       30     VO, Otto_RF 2026_02     9       24       None       4      TRUE

ID, SulfideSulfur_pct_D: Domain Trend P2

  OttoLGtrend   SulfSulf_Cap     115       170       50     VO, Otto_RF 2026_02     5       24       None       4      TRUE

ID, SulfideSulfur_pct_D: Domain Trend P3

  OttoLGtrend   SulfSulf_Cap     150       230       65     VO, Otto_RF 2026_02     5       16       None       4      TRUE

ID, SulfideSulfur_pct_D: Domain Trend P1

  SPZHGtrend   SulfSulf_Cap     80       50       30    

VO, SPZ 2026_02 Exclude

NE_12_Offset

    9       24       None       4      TRUE

ID, SulfideSulfur_pct_D: Domain Trend P2

  SPZHGtrend   SulfSulf_Cap     165       105       50    

VO, SPZ 2026_02 Exclude

NE_12_Offset

    5       24       None       4      TRUE

ID, SulfideSulfur_pct_D: Domain Trend P3

  SPZHGtrend   SulfSulf_Cap     250       160       75    

VO, SPZ 2026_02 Exclude

NE_12_Offset

    5       16       None       4      TRUE

ID, SulfideSulfur_pct_D: Domain Trend P1

  SPZhwHGtrend   SulfSulf_Cap     60       60       30     VO, SPZhw 2026_02     5       16       None       4      TRUE

ID, SulfideSulfur_pct_D: Domain Trend P2

  SPZhwHGtrend   SulfSulf_Cap     90       90       30     VO, SPZhw 2026_02     5       16       None       4      TRUE

ID, SulfideSulfur_pct_D: Domain Trend P3

  SPZhwHGtrend   SulfSulf_Cap     180       180       60     VO, SPZhw 2026_02     4       12       None       4      TRUE

ID, SulfideSulfur_pct_D: Domain Trend P1

  SPZhwLGtrend   SulfSulf_Cap     60       60       30     VO, SPZhw 2026_02     5       16       None       4      TRUE

ID, SulfideSulfur_pct_D: Domain Trend P2

  SPZhwLGtrend   SulfSulf_Cap     90       90       30     VO, SPZhw 2026_02     5       16       None       4      TRUE

ID, SulfideSulfur_pct_D: Domain Trend P3

  SPZhwLGtrend   SulfSulf_Cap     180       180       60     VO, SPZhw 2026_02     4       12       None       4      TRUE

ID, SulfideSulfur_pct_D: Domain Trend P1

  SPZLGtrend   SulfSulf_Cap     45       45       45    

VO, SPZ 2026_02 Exclude

NE_12_Offset

    9       24       None       4      TRUE

ID, SulfideSulfur_pct_D: Domain Trend P2

  SPZLGtrend   SulfSulf_Cap     170       170       170    

VO, SPZ 2026_02 Exclude

NE_12_Offset

    5       24       None       4      TRUE

ID, SulfideSulfur_pct_D: Domain Trend P3

  SPZLGtrend   SulfSulf_Cap     240       240       240    

VO, SPZ 2026_02 Exclude

NE_12_Offset

    5       16       None       4      TRUE

Source: SRK, 2026


September 2026


SRK Consulting (U.S.), Inc.

SEC Technical Report Summary – Granite Creek

   Page 250


11.2.11  Density

The drill database contains 419 density measurements collected from drilling and by the mine operations of the Granite Creek underground Project. Density values are assigned to blocks based on the lithological unit. These values are summarized by lithology in Table 11-34.

Table 11-34: Density Values Used in the Underground Model


Lithologic Unit

   Density
(tons/
ft3)
     Density
(g/cm3)
 

Qal

     0.0578        1.852  

Cp

     0.0826        2.646  

Ocl

     0.0820        2.627  

Ocu

     0.0814        2.608  

Kgd

     0.0819        2.624  

Other

     0.0820        2.628  

Source: SRK, 2026

11.2.12  Model Validation

SRK has validated the block model using the following techniques:


Visual inspection of block grades in comparison with informing drillhole sample data


Statistical comparison of estimation methods to raw sample data and Nearest Neighbor (NN) estimates


Sectional validation of the mean sample grades in comparison to the mean model grades

Visual Comparison

Visual inspection of block grades in comparison with informing drillhole sample data are shown in Figure 11-51 to Figure 11-56, for each domain. Overall, SRK considers the visual validation to be reasonable. The visual comparison of the 1.53 m (5 ft) composite to the estimated block grades shows no obvious bias with a fair reflection of both the high and low-grade samples. Given the variable sample coverage SRK also inspected the grade continuity compared to the grade control data which showed reasonable correlations for both high and low-grade areas. SRK completed the analysis on a domain-by-domain level with additional focus being made to the boundary between the HG and LG domains, which when estimated using a hard contact was felt to produce a sharp transition when a more gradational transition was assumed, thus 1.53 m (5 ft) soft boundaries were selected for the HG and LG domains.


September 2026


SRK Consulting (U.S.), Inc.

SEC Technical Report Summary – Granite Creek

   Page 251


LOGO

Source: SRK, 2026

Figure 11-51: Plan Section Showing Block Grades vs. Composites (Ogee)


September 2026


SRK Consulting (U.S.), Inc.

SEC Technical Report Summary – Granite Creek

   Page 252


LOGO

Source: SRK, 2026

Figure 11-52: Cross Section Showing Block Grades vs. Composites (Ogee)


September 2026


SRK Consulting (U.S.), Inc.

SEC Technical Report Summary – Granite Creek

   Page 253


LOGO

Source: SRK, 2026

Figure 11-53: Level Plan (Map) Showing Block Grades vs. Composites (Otto)


September 2026


SRK Consulting (U.S.), Inc.

SEC Technical Report Summary – Granite Creek

   Page 254


LOGO

Source: SRK, 2026

Figure 11-54: Cross Section Showing Block Grades vs. Composites (Otto)


September 2026


SRK Consulting (U.S.), Inc.

SEC Technical Report Summary – Granite Creek

   Page 255


LOGO

Source: SRK, 2026

Figure 11-55: Plan Showing Block Grades vs. Composites (SPZ)


September 2026


SRK Consulting (U.S.), Inc.

SEC Technical Report Summary – Granite Creek

   Page 256


LOGO

Source: SRK, 2026

Figure 11-56: Cross Section Showing Block Grades vs. Composites (SPZ)


September 2026


SRK Consulting (U.S.), Inc.

SEC Technical Report Summary – Granite Creek

   Page 257


Statistical Analysis Comparison

Statistical analysis has been completed using a zero g/t cut-off as a global bias check. The results show in general strong correlations in the mean grades between the Ordinary Kriging estimates, the declustered estimates and to some extent the NN estimates (Table 11-35). The majority of the mineralization is contained within the high-grade domains, so SRK has focused its review on the high-grade domains with the results reporting <5% difference between the declustered (30 ft x 30 ft x 15 ft) composites and the block grade estimates. SRK noted a slight improvement in the soft boundary results in the low-grade domains at Ogee and Otto, with the largest change in the estimates from the selection of the soft boundary occurring within the SPZ. SRK highlights to the reader that the majority of the low-grade domains are in the order of 1.8 to 2.5 g/t (0.073 oz/st)which is significantly lower than the mining cut-off grade and therefore has only been considered during the assignment of dilution, and thus, SRK does not consider these differences to be material.

SRK highlights there are some differences in the SPZhw domain which are notable, but this domain has a relatively low tonnage and high-grades, therefore SRK has considered the lower confidence in these estimates during the classification process.


September 2026


SRK Consulting (U.S.), Inc.

SEC Technical Report Summary – Granite Creek

   Page 258


Table 11-35: Summary Statistics of Raw and Declustered Composite Grades vs. Block Estimates and NN-Assigned Values (0 g/t Cut-off)


Domain


Statistic

   Composite
Au
(g/t)
     Declustered Sample Data
Au
(g/t)
     Block Estimate
Au(g/t)

Soft Boundary
    Block
Estimate
Au(g/t)
Hard
Boundary
    Block Estimate
NN Au (g/t)

Hard
Boundary
 

OgeeHG

   Points      2,482.00        2,482.00        299,379.00       299,907.00       300,100.00  
   Mean      10.66        10.00        9.41       9.39       10.25  
   Std Dev      14.63        13.71        6.57       6.58       12.35  
   Variance      214.10        188.06        43.18       43.24       152.49  
   CV      1.37        1.37        0.70       0.70       1.21  
   Maximum      70.00        70.00        44.05       44.05       70.00  
   Minimum      0.00        0.00        0.02       0.00       0.00  
   Diff % (Raw vs. Estimate)            -11.8     -11.9     -3.9
   Diff % (Declust vs. Estimate)            -6.0     -6.1     2.4

OgeeLG

   Points      6,095.00        6,095.00        545,613.00       547,552.00       547,175.00  
   Mean      2.95        2.56        2.32       2.02       2.08  
   Std Dev      7.33        6.46        2.59       1.94       3.85  
   Variance      53.80        41.78        6.72       3.77       14.83  
   CV      2.49        2.52        1.12       0.96       1.85  
   Maximum      70.00        70.00        36.81       16.87       24.00  
   Minimum      0.00        0.00        0.00       0.00       0.00  
   Diff % (Raw vs. Estimate)            -21.2     -31.5     -29.5
   Diff % (Declust vs. Estimate)            -9.5     -21.3     -19.0

OttoHG

   Points      1,982.00        1,982.00        438,647.00       439,346.00       438,771.00  
   Mean      8.12        7.69        7.71       7.71       7.74  
   Std Dev      10.39        10.20        4.24       4.24       7.61  
   Variance      108.03        103.95        17.95       17.99       57.94  
   CV      1.28        1.33        0.55       0.55       0.98  
   Maximum      62.00        62.00        35.17       35.17       62.00  
   Minimum      0.00        0.00        0.00       0.00       0.00  
   Diff % (Raw vs. Estimate)            -5.0     -5.1     -4.7
   Diff % (Declust vs. Estimate)            0.3     0.2     0.6

OttoLG

   Points      6,214.00        6,214.00        998,700.00       1,011,333.00       1,011,110.00  
   Mean      2.43        2.19        2.26       1.81       1.87  
   Std Dev      5.38        5.08        2.23       1.75       3.06  
   Variance      28.91        25.80        4.98       3.06       9.35  
   CV      2.21        2.32        0.99       0.97       1.64  
   Maximum      62.00        62.00        42.86       18.62       32.00  
   Minimum      0.00        0.00        0.00       0.00       0.00  
   Diff % (Raw vs. Estimate)            -7.2     -25.6     -23.3
   Diff % (Declust vs. Estimate)            3.0     -17.4     -14.9

SPZHG

   Points      977.00        977.00        564,489.00       564,489.00       564,489.00  
   Mean      8.96        8.66        8.56       8.56       8.18  
   Std Dev      11.23        11.11        4.93       4.93       8.49  
   Variance      126.02        123.45        24.30       24.30       72.09  
   CV      1.25        1.28        0.58       0.58       1.04  
   Maximum      52.50        52.50        40.29       40.29       52.50  
   Minimum      0.00        0.00        0.00       0.00       0.00  
   Diff % (Raw vs. Estimate)            -4.4     -4.4     -8.7
   Diff % (Declust vs. Estimate)            -1.1     -1.1     -5.5

SPZLG

   Points      1,580.00        1,580.00        591,655.00       591,655.00       587,689.00  
   Mean      2.67        2.49        2.31       1.30       1.41  
   Std Dev      6.24        5.90        2.34       1.33       2.61  
   Variance      38.94        34.81        5.47       1.76       6.82  
   CV      2.34        2.37        1.01       1.02       1.85  
   Maximum      52.50        52.50        22.75       13.81       20.00  
   Minimum      0.00        0.00        0.00       0.00       0.00  
   Diff % (Raw vs. Estimate)            -13.4     -51.2     -47.2
   Diff % (Declust vs. Estimate)            -7.1     -47.6     -43.3

SPZhwHG

   Points      205.00        205.00        50,323.00       50,323.00       50,323.00  
   Mean      11.85        9.08        9.69       11.49       12.01  
   Std Dev      15.55        13.95        7.55       10.25       11.37  
   Variance      241.81        194.65        56.95       105.03       129.25  
   CV      1.31        1.54        0.78       0.89       0.95  
   Maximum      65.00        65.00        42.96       54.86       65.00  
   Minimum      0.00        0.00        0.00       0.00       0.00  
   Diff % (Raw vs. Estimate)            -18.2     -3.0     1.3
   Diff % (Declust vs. Estimate)            6.7     26.5     32.2

SPZhwLG

   Points      411.00        411.00        123,673.00       123,399.00       123,673.00  
   Mean      1.54        1.40        1.65       1.34       1.23  
   Std Dev      2.88        2.89        1.11       0.89       0.95  
   Variance      8.30        8.34        1.23       0.79       0.89  
   CV      1.88        2.06        0.67       0.66       0.77  
   Maximum      26.06        26.06        10.74       6.32       5.16  
   Minimum      0.00        0.00        0.00       0.00       0.02  
   Diff % (Raw vs. Estimate)            7.3     -13.0     -20.1
   Diff % (Declust vs. Estimate)            17.4     -4.9     -12.6

Source: SRK, 2026


September 2026


SRK Consulting (U.S.), Inc.

SEC Technical Report Summary – Granite Creek

   Page 259


Swath Plots

A more local comparison between the blocks and the informing composites is made using swath plots. The comparisons show both the varying means of the block and composites (declustered) along swaths or slices through the model, as well as the amount of data supporting the estimate in each swath. The swath plots show that there are no significant local biases in the estimation. Analysis was completed on a domain-by-domain level for gold and all the other elements. Only gold results have been shown in Figure 11-57 through Figure 11-59 for the high-grade domains which carry the majority of the value for the Project. Overall, it is the QP’s opinion that the swath plots show similar trends for the three different estimation methods with a close correlation between the NN and the estimated grades per swath. The declustered composite means show more variation which is expected due to a difference in sample support, but the peaks and troughs of the charts display a reasonable correlation and therefore in the QP’s opinion are acceptable for the purpose of validation.


September 2026


SRK Consulting (U.S.), Inc.

SEC Technical Report Summary – Granite Creek

   Page 260


LOGO

Source: SRK, 2026

Figure 11-57: Swath Plot Analysis of Au (g/t), Ogee HG Domain


September 2026


SRK Consulting (U.S.), Inc.

SEC Technical Report Summary – Granite Creek

   Page 261


LOGO

Source: SRK, 2026

Figure 11-58: Swath Plot Analysis of Au (g/t), Otto HG Domain


September 2026


SRK Consulting (U.S.), Inc.

SEC Technical Report Summary – Granite Creek

   Page 262


LOGO

Source: SRK, 2026

Figure 11-59: Swath Plot Analysis of Au (g/t), SPZ HG Domain


September 2026


SRK Consulting (U.S.), Inc.

SEC Technical Report Summary – Granite Creek

   Page 263


11.2.13  Classification

Block model quantities and grade estimates for the Project were classified according to the Society for Mining, Metallurgy and Exploration (2017).

Mineral Resource classification is typically a subjective concept. Industry best practices suggest that classification should consider the confidence in the geological continuity of the mineralized structures, the quality and quantity of data supporting the estimates, and the geostatistical confidence in the tonnage and grade estimates. Appropriate classification criteria should aim to integrate both concepts to delineate regular areas at similar resource classification.

Data quality, drillhole spacing, and the interpreted continuity of grades controlled by the structures and high-grade domains allowed SRK to classify portions of the Project into Measured, Indicated, and Inferred Mineral Resources categories. SRK has based the current classification on a review of the variograms, statistical support to the confidence of the estimates (Estimation Variance and Slope of Regression), number of composites and number of holes used to define each estimate:


Measured Mineral Resources: Measured blocks have been focused on drilling coverage and proximity to the current workings within the drilling completed by i-80 averaging a 9.1 m x 9.1 m (30 ft x 30 ft) grid, with three drillholes and three composites. Using the equation:


[AuOK_trend: NDh]>=3 and [3 Holes: AvgD]<30 = Measured


Indicated Mineral Resources: Limited to drilling coverage within a 27.4 m x 27.4 m (90 ft x 90 ft) grid completed and with a minimum three holes. Using the equation:


[AuOK_trend: NDh]>=3 and [3 Holes: AvgD]<90 = Indicated


Inferred Mineral Resources: All other material within the key modeled domains (which limits of 91 m (300 ft) were applied to the range during definition).

The classification criteria was initially applied and based on study of the variogram ranges, the QP then undertook a visual review of the grade and geological continuity to assess the level of consistency before applying the final assessment of confidence.

To achieve this the initial mathematical definitions have been completed, they are stored in the block model as Class1_Pass1, which have then been converted into point data to allow for smoothing of the shapes to avoid block by block assignment. The generated shapes were created in Leapfrog and used a buffer of 2.3 m (7.5 ft) (half the block size) for Measured and 3 m (10 ft) (for Indicated). The generated shapes were then reviewed by the QP and only areas deemed to demonstrate continuity were defined in the final classification process. Areas of low continuity were down-graded appropriately.

The final block model was generated by creating a stacked classification “geological” model in Leapfrog, which is overlain on the grade estimation model for reporting.

A summary of the final classification for the key domains is shown in Figure 11-60 to Figure 11-63.


September 2026


SRK Consulting (U.S.), Inc.

SEC Technical Report Summary – Granite Creek

   Page 264


LOGO

Source: SRK, 2026

Figure 11-60: Long Section Showing Final Measured (red/brown) and Indicated Shapes (green) Selected for Granite Creek


September 2026


SRK Consulting (U.S.), Inc.

SEC Technical Report Summary – Granite Creek

   Page 265


LOGO

Source: SRK, 2026

Figure 11-61: Cross Section Showing Final Measured and Indicated Shapes Selected for Granite Creek (Ogee and Otto Domains)


September 2026


SRK Consulting (U.S.), Inc.

SEC Technical Report Summary – Granite Creek

   Page 266


LOGO Source: SRK, 2026

Figure 11-62: Cross Section Showing Final Measured and Indicated Shapes Selected for Granite Creek (SPZ Domains)


September 2026


SRK Consulting (U.S.), Inc.

SEC Technical Report Summary – Granite Creek

   Page 267


LOGO Source: SRK, 2026

Figure 11-63: Final Classification Shown Against Filtered Mineral Resource Blocks


11.2.14

 Underground Mineral Resource Statement

SME defines a Mineral Resource as:

“a concentration or occurrence of solid material of economic interest in or on the Earth’s crust in such form, grade or quality, and quantity that there are reasonable prospects for economic extraction.”

The reasonable prospects for economic extraction (RPEE) requirement generally implies that the quantity and grade estimates meet certain economic thresholds and that the Mineral Resources are reported at an appropriate cut-off grade (CoG) taking into account extraction scenarios and processing recoveries. “In order to meet reasonable prospects for economic extraction” requirement, Granite Creek has been deemed amenable to both open pit (discussed in Section 14.2) and underground mining (based on a cut and fill mining methodology). Metallurgical test work programs have been used to define dynamic recoveries in the mining models which have also been applied to the RPEE assessment. The current underground mined material is currently toll treated in an offsite autoclave process.

To determine the potential for RPEE, SRK has used the following key assumptions for costing, and metallurgical recoveries. Metallurgical recoveries are based on the outcomes of both the historical and


September 2026


SRK Consulting (U.S.), Inc.

SEC Technical Report Summary – Granite Creek

   Page 268


the most recent metallurgical test work completed by i-80. To define the limits for processing route selection and estimated recoveries, SRK estimated AuCn (ppm), TOC% (percent), PregRob% (percent), and Sulfide Sulfur % (percent), which were reviewed and used by the mining team in relation to the metallurgical recovery.

SRK worked with i-80 to review the findings of the metallurgical studies which indicated that the metallurgical recoveries range between 77.6% to 93.4% (average 87.6%) for the autoclave and 60.0% to 87.4% (average 68.9%) for the oxide material. SRK has used an MSO, using Deswick Mining Software to determine the limits for the underground RPEE (Table 11-36).

The gold price selected for Mineral Resources has been based on review of market study as presented in section 16 of this report which has been compared to market consensus forecast data through a database to which SRK subscribes, review by the QP of industry peers, plus discussion with i-80 technical teams. Based on the review SRK is considering the price reasonable over a time period of 10 years. It is the QP’s opinion that this is a reasonable forecast for the time considered and the current time of the mine being in operation (ramping up production), to cover short-term pricing and future long-term pricing. The point of reference for the reporting of mineral resources is the in-situ diluted tonnage and grades contained with the defined MSO limits.

Table 11-36: Summary of Mineral Resource Cut-off and MSO Assumptions


     Metric (costs)      Imperial (costs)  

Process Method1


Parameter

   Value      Unit      Value      Unit  
   Gold Price      3,000        US$/oz        3,000        US$/oz  
   TC/RC      1.85        US$/oz        1.85        US$/oz  
   NSR Royalty      6%           6%     
   Nevada Excise Tax      0.75%           0.75%     

Oxides

   Metallurgical Recovery      30.0%-86.5%           30.0%-86.5%     
   Mining Cost      190.18        US$/t        172.53        US$/st  
   Process Cost      59.94        US$/t        54.38        US$/st  
   Shipping Cost      16.04        US$/t        14.55        US$/st  
   G&A Cost      22.29        US$/t        20.22        US$/st  
   Total Cost      288.45        US$/t        261.68        US$/st  
   Stope Cut-off Grade      0.108 - 0.312        oz/st Au        0.108 - 0.312        oz/st Au  
   Cut-off Grade      3.38 - 9.75        g/t Au        3.38 - 9.75        g/t Au  

Sulfide

   Metallurgical Recovery      37.2%-97.0%           37.2%-97.0%     
   Mining Cost      190.18        US$/t        172.53        US$/st  
   Process Cost      131.13        US$/t        118.96        US$/st  
   Shipping Cost      16.04        US$/t        14.55        US$/st  
   G&A Cost      22.29        US$/t        20.22        US$/st  
   Total Cost      359.64        US$/t        326.26        US$/st  
   Cut-off Grade      0.120 - 0.314        oz/t Au        0.120 - 0.314        oz/st Au  
   Cut-off Grade      3.75 - 9.81        g/t Au        3.75 - 9.81        g/t Au  

Source: SRK, 2026

$:US dollars

oz/st = troy ounce per short ton

g/t = grams per metric tonne

1. Dynamic cut-off grade was used for the reserves design based on whether the material is oxide or sulfide.

The final Mineral Resource for the underground portion of Granite Creek has been reported on a diluted basis within the MSO defined shapes using the following conditions:


GM MSO Final = Resource


GM Classification = Measured, Indicated or Inferred


September 2026


SRK Consulting (U.S.), Inc.

SEC Technical Report Summary – Granite Creek

   Page 269


Au (g/t) > 0.00 g/t (0.000 oz/st)

The Mineral Resource statement for the underground portion of the Granite Creek Project is shown in Table 11-37 on an exclusive basis and as per SK-1300 the QP has reported the Mineral Resources on an Exclusive basis which has been defined by removing all material within the mine design which was converted to Reserves, including a marginal small portion of Inferred from within the design which was considered as waste within the reserves. Note, for reporting purposes given the proximity and similar mineralization, the SPZhw has been combined with the SPZ MSO domains for the final reporting.

Table 11-37: Inclusive Mineral Resource Statement for Granite Creek Underground—Effective Date March 31, 2026


Classification

   Domain      Mass
(000’s
tonnes)
     Mass
Attributable

(000’s
tonnes)
     Au
Grade

(g/t)
     Material
Content Au

(000’s t. oz)
     Attributable
Material Content
Au

(000’s t. oz)
 

Measured

     Ogee        231        231        7.88        58.6        58.5  
     Otto        310        310        6.69        66.6        66.6  
     SPZ        65        65        9.85        20.7        20.7  
     Total        606        606        7.49        145.9        145.8  

Indicated

     Ogee        322        321        7.06        73.0        72.9  
     Otto        746        746        6.26        150.2        150.2  
     SPZ        2,055        2,055        7.42        490.4        490.4  
     Total        3,122        3,122        7.11        713.6        713.5  

M&I

     Ogee        553        552        7.40        131.6        131.4  
     Otto        1,056        1,056        6.39        216.8        216.8  
     SPZ        2,120        2,120        7.50        511.1        511.1  
     Total        3,729        3,728        7.17        859.5        859.3  

Inferred

     Ogee        39        38        6.70        8.3        8.3  
     Otto        425        425        7.63        104.4        104.4  
     SPZ        429        418        6.53        90.1        87.4  
     Total        893        882        7.06        202.8        200.1  

Source: SRK, 2026

Notes:

1. Mineral Resources, which are not Mineral Reserves, do not have demonstrated economic viability. The estimate of Mineral Resources may be materially affected by environmental, permitting, legal, title, market or other relevant issues. The deposit has been classified as Measured, Indicated and Inferred based on confidence in the geological model and drill spacing. The quantity and grade of reported Inferred resources are uncertain in nature, and there has not been sufficient work to define these Inferred Mineral Resources as Indicated or Measured resources. There is no certainty that any part of a mineral resource will ever be converted into reserves.

2. Mineral Resources are reported on an inclusive basis with units reported in in Metric Tonnes, grade is reported in grams/tonnes, and metal in 000’s troy ounces.

3. Mineral Resources are reported within Mineable Stopes which have been defined based on metal price assumptions,* variable metallurgical recovery assumptions, mining costs, processing costs, shipping, G&A costs. Metal Pricing is based on Gold (US$3,000 /oz). Other key assumptions include:

* Mining Costs (US$/t 190.18);

* Autoclave Processing Cost (US$/t 131.13), Low-grade Oxide (US$/t 59.94)

* Autoclave Recoveries ranging 77.6% - 93.4% (average 87.6%) and Oxide recoveries ranging 60.0% - 87.4% (average 68.9%);

* Shipping Costs (US$/t 16.04) and G&A Costs (US$/t 22.29);

* Totaling US$/t 281.45 – 359.64 for underground mining and Processing;

* Based on the variable recoveries an average cut-off grade of 3.75—9.81 g/t (0.286 oz/st) has been used reporting.

4. Mineral Resources have been depleted for previous underground mining activity, and reported on an attributable basis

5. Mineral Resources are based on validated data, which have been subjected to QA/QC analysis, using capped, composited samples at 2 m (5ft) intervals. Estimation has been completed using a combination of OK and IDW estimation methodologies and classified based on confidence in the underlying data and drill spacing. Mineral resource tonnages have been rounded to reflect the precision of the estimate.

6. The mineral resources were estimated by SRK Consulting (U.S.), Inc.

7. Rounding of some figures may lead to minor discrepancies in totals.


September 2026


SRK Consulting (U.S.), Inc.

SEC Technical Report Summary – Granite Creek

   Page 270


Table 11-38: Exclusive Mineral Resource Statement for Granite Creek Underground—Effective Date March 31, 2026


Classification

   Domain      Mass
(000’s
tonnes)
     Mass
Attributable

(000’s tonnes)
     Au
Grade

(g/t)
     Material
Content Au

(000’s t. oz)
     Attributable Material
Content Au

(000’s t. oz)
 

Measured

     Ogee        175        175        6.82        38.4        38.3  
     Otto        166        166        5.58        29.7        29.7  
     SPZ        31        31        6.44        6.5        6.5  
     Total        372        372        6.23        74.6        74.5  

Indicated

     Ogee        241        241        6.52        50.6        50.6  
     Otto        425        425        5.23        71.5        71.5  
     SPZ        771        771        4.70        116.6        116.6  
     Total        1,438        1,438        5.16        238.6        238.6  

M&I

     Ogee        417        416        6.64        89.0        88.9  
     Otto        591        591        5.32        101.2        101.2  
     SPZ        803        803        4.77        123.1        123.1  
     Total        1,810        1,810        5.38        313.3        313.1  

Inferred

     Ogee        38        38        6.71        8.3        8.3  
     Otto        417        417        7.62        102.0        102.0  
     SPZ        415        405        6.49        86.6        83.9  
     Total        871        860        7.04        197.0        194.2  

Source: SRK, 2026 

Notes: 

1. Mineral Resources, which are not Mineral Reserves, do not have demonstrated economic viability. The estimate of Mineral Resources may be materially affected by environmental, permitting, legal, title, market or other relevant issues. The deposit has been classified as Measured, Indicated and Inferred based on confidence in the geological model and drill spacing. The quantity and grade of reported Inferred resources are uncertain in nature, and there has not been sufficient work to define these Inferred Mineral Resources as Indicated or Measured resources. There is no certainty that any part of a mineral resource will ever be converted into reserves.

2. Mineral Resources are reported on an Exclusive basis with units reported in in Metric Tonnes, grade is reported in grams/tonnes, and metal in 000’s troy ounces.

3. Mineral Resources are reported fully diluted within Mineable Stopes which have been defined based on metal price assumptions,* variable metallurgical recovery assumptions, mining costs, processing costs, shipping, G&A costs. Metal Pricing is based on Gold (US$3,000 /oz). Other key assumptions include:

* Mining Costs (US$/t 190.18);

* Autoclave Processing Cost (US$/t 131.13), Low-grade Oxide (US$/t 59.94)

* Autoclave Recoveries ranging 77.6% - 93.4% (average 87.6%) and Oxide recoveries ranging 60.0% - 87.4% (average 68.9%);

* Shipping Costs (US$/t 16.04) and G&A Costs (US$/t 22.29);

* Totaling US$/t 281.45 – 359.64 for underground mining and Processing;

* Based on the variable recoveries an average cut-off grade of 3.75—9.81 g/t (0.286 oz/st) has been used reporting.

4. Mineral Resources have been depleted for previous underground mining activity, and reported on an attributable basis

5. Mineral Resources are based on validated data, which have been subjected to QA/QC analysis, using capped, composited samples at 2 m (5ft) intervals. Estimation has been completed using a combination of OK and IDW estimation methodologies and classified based on confidence in the underlying data and drill spacing. Mineral resource tonnages have been rounded to reflect the precision of the estimate.

6. The mineral resources were estimated by SRK Consulting (U.S.), Inc.

7. Rounding of some figures may lead to minor discrepancies in totals.


11.2.15

Mineral Resource Sensitivity

Table 11-39 Table 11-38 and Table 11-40 show the continuity of the grade estimates at various cut-off increments and the sensitivity of the mineral resource to changes in CoG. The reader should note that the results presented herein have been limited to the current MSO shape and show limited growth on cut-off below 4.78 g/t (0.139 oz/st) Au, while comparison of in situ tonnage and grades may show greater growth. The reader is cautioned that the values in Table 14 38 and Table 14 39 should not be misconstrued with the mineral resource statement. The values are only presented to show the sensitivity of the block model estimates to the selection of CoG. All values are rounded to reflect the relative accuracy of the estimates.


September 2026


SRK Consulting (U.S.), Inc.

SEC Technical Report Summary – Granite Creek

   Page 271


Table 11-39: Grade Sensitivity (Combined Measured and Indicated), inside MSO on a 100% Project basis


Cut-Off

   Classification      Mass
(000’s tonnes)
     Au Grade
(g/t)
     Material Content
Au (000’s t. oz)
 

Au (g/t) ≥ 0.00 g/t

     M&I        3,729        7.17        859.5  

Au (g/t) ≥ 0.50 g/t

     M&I        3,324        8.04        859.0  

Au (g/t) ≥ 1.00 g/t

     M&I        3,274        8.15        857.8  

Au (g/t) ≥ 1.50 g/t

     M&I        3,210        8.29        855.2  

Au (g/t) ≥ 2.00 g/t

     M&I        3,145        8.42        851.5  

Au (g/t) ≥ 2.50 g/t

     M&I        3,075        8.56        846.5  

Au (g/t) ≥ 3.00 g/t

     M&I        3,007        8.69        840.5  

Au (g/t) ≥ 3.50 g/t

     M&I        2,923        8.85        831.7  

Au (g/t) ≥ 4.00 g/t

     M&I        2,813        9.05        818.4  

Au (g/t) ≥ 4.25 g/t

     M&I        2,742        9.18        808.9  

Au (g/t) ≥ 4.50 g/t

     M&I        2,742        9.18        808.9  

Au (g/t) ≥ 4.75 g/t

     M&I        2,562        9.50        782.7  

Au (g/t) ≥ 5.00 g/t

     M&I        2,457        9.70        766.4  

Au (g/t) ≥ 5.25 g/t

     M&I        2,356        9.90        749.7  

Au (g/t) ≥ 5.50 g/t

     M&I        2,254        10.10        732.1  

Au (g/t) ≥ 5.75 g/t

     M&I        2,148        10.32        712.8  

Au (g/t) ≥ 6.00 g/t

     M&I        2,043        10.55        693.0  

Au (g/t) ≥ 6.25 g/t

     M&I        1,944        10.78        673.5  

Au (g/t) ≥ 6.50 g/t

     M&I        1,851        11.00        654.5  

Au (g/t) ≥ 6.75 g/t

     M&I        1,754        11.24        633.7  

Au (g/t) ≥ 7.00 g/t

     M&I        1,662        11.48        613.5  

Au (g/t) ≥ 7.25 g/t

     M&I        1,576        11.72        593.7  

Au (g/t) ≥ 7.50 g/t

     M&I        1,493        11.96        574.0  

Au (g/t) ≥ 8.00 g/t

     M&I        1,327        12.49        532.7  

Au (g/t) ≥ 8.50 g/t

     M&I        1,185        13.00        495.1  

Source: SRK, 2026


September 2026


SRK Consulting (U.S.), Inc.

SEC Technical Report Summary – Granite Creek

   Page 272


Table 11-40: Grade Sensitivity Table (Inferred), inside MSO on a 100% Project Basis


Cut-Off

   Classification      Mass
(000’s tonnes)
     Au Grade (g/t)      Material Content
Au (000’s t. oz)
 

Au (g/t) ≥ 0.00 g/t

     Inferred        893        7.06        202.8  

Au (g/t) ≥ 0.50 g/t

     Inferred        727        8.66        202.6  

Au (g/t) ≥ 1.00 g/t

     Inferred        717        8.78        202.4  

Au (g/t) ≥ 1.50 g/t

     Inferred        702        8.94        201.8  

Au (g/t) ≥ 2.00 g/t

     Inferred        684        9.13        200.7  

Au (g/t) ≥ 2.50 g/t

     Inferred        660        9.38        199.0  

Au (g/t) ≥ 3.00 g/t

     Inferred        635        9.64        196.8  

Au (g/t) ≥ 3.50 g/t

     Inferred        612        9.88        194.3  

Au (g/t) ≥ 4.00 g/t

     Inferred        590        10.11        191.8  

Au (g/t) ≥ 4.25 g/t

     Inferred        581        10.20        190.5  

Au (g/t) ≥ 4.50 g/t

     Inferred        581        10.20        190.5  

Au (g/t) ≥ 4.75 g/t

     Inferred        551        10.51        186.2  

Au (g/t) ≥ 5.00 g/t

     Inferred        530        10.73        183.0  

Au (g/t) ≥ 5.25 g/t

     Inferred        512        10.93        180.0  

Au (g/t) ≥ 5.50 g/t

     Inferred        500        11.07        177.8  

Au (g/t) ≥ 5.75 g/t

     Inferred        486        11.22        175.3  

Au (g/t) ≥ 6.00 g/t

     Inferred        471        11.39        172.4  

Au (g/t) ≥ 6.25 g/t

     Inferred        451        11.63        168.4  

Au (g/t) ≥ 6.50 g/t

     Inferred        432        11.86        164.6  

Au (g/t) ≥ 6.75 g/t

     Inferred        420        12.01        162.0  

Au (g/t) ≥ 7.00 g/t

     Inferred        391        12.39        155.7  

Au (g/t) ≥ 7.25 g/t

     Inferred        370        12.69        150.8  

Au (g/t) ≥ 7.50 g/t

     Inferred        360        12.83        148.6  

Au (g/t) ≥ 8.00 g/t

     Inferred        301        13.82        133.8  

Au (g/t) ≥ 8.50 g/t

     Inferred        267        14.53        124.7  

Source: SRK, 2026


11.2.16 

Sources of Uncertainty

Areas of uncertainty that may materially impact the MREs include impacts of the underlying supporting data, geological interpretation, estimation parameters and economic assumptions:

SRK has considered the various sources of the data and accounted for these in the QP’s opinion through the estimations methodology and classification systems applied. Areas with lower drilling density or lower continuity either geologically or grade based have been considered when assigning the level of confidence. Some areas within the existing mining operations have relatively limited drilling cover from the diamond and RC drilling, but in the QP’s opinion the visual reconciliation to the muck and sludge samplings is acceptable to maintain the assigned confidence.

In the estimation process for this style of deposit there is a degree of sensitivity to the grades related to the selected capping levels, which the QP has applied based on their years of experience in the style of mineralization. Changes in capping (up or down), would result in higher or lower overall grades, but the QP has selected values based on analysis in two separate software packages to test the impact on the contained metal at various caps to select the most appropriate values. As in any production environment the grades (and hence capping values), should be monitored through the reconciliation process to confirm performance of the model.

In terms of the level of study and the available information it is the QP’s opinion that the level of density sampling remains relatively low and there is some degree of uncertainty in the level of variability in the density within the different units. Reduction in density could result in lower tonnage and contained metal. However, as this mine is an operating entity with active reconciliation to production it is not considered by the QP at this time that any variability would be material.


September 2026


SRK Consulting (U.S.), Inc.

SEC Technical Report Summary – Granite Creek

   Page 273


SRK notes that future economic assessment could result in a change in the CoG which would potentially result in a change in the tonnage of available mineable material. Mineralization represented by the resource block model was evaluated for reasonable prospects of economic extraction for underground mining methods by applying an appropriate CoG, these can be impacted by:


Changes to long term metal price assumptions


Changes to the input values for mining, processing, and G&A costs to constrain the estimate


Changes to local interpretations of mineralization geometry and continuity of mineralized domains, including the stratigraphic and structural models


Changes in the capping values can impact the sensitivity of the grade estimates and reconciliation data should be reviewed to ensure consistency with grade distribution


Material types (oxide vs sulphide) is based on visual inspection and changes in material type could impact metallurgical recovery


Changes to metallurgical recovery and geo-metallurgical assumptions


Changes to assumptions with an existing agreement or new agreements


Changes to environmental, permitting, and social license assumptions

It is the QP’s opinion that the risks highlighted above can be reduced through additional exploration and technical studies, but the Mineral Resources as presented have accounted for the confidence where applicable.


11.2.17

Reconciliation

Production Reconciliation Process

i-80 performs routine reconciliation between the mineral resource (previous model only), underground production and a short-term block model (STBM). Surveyed mining extents for individual development rounds were used to define the mined volumes, which were then intersected with the block models to extract modeled grades and contained gold within the exact mined shapes. Recorded production tonnages and associated grade-control assays (assigned to each mining round) were compiled, and tonnage-weighted grades and contained ounces were calculated and compared to the model predictions on a volume-matched basis.

The QP considers this approach is generally consistent with industry best practice for underground reconciliation as it is based on surveyed mined volumes, uses tonnage-weighted comparisons, and evaluates performance by domain and through time. However, some implementation details (e.g., exact production grade basis, classification cut-offs, and linkage of the reconciled model to current Mineral Resource / Reserve statement will need to be to the updated resource and reserves model needs to be completed. The reconciliation to the previous model showed a bias between the earlier model estimates and actual production. In aggregate, mined grades and contained gold were higher than predicted by both the longer-term model and the STBM, indicating an overall positive reconciliation (i.e., the earlier models underestimated production). This positive bias was concentrated in high-grade oxide and sulfide material, while some low-grade oxide material reconciled negatively, suggesting that grades in that category were over-estimated.


September 2026


SRK Consulting (U.S.), Inc.

SEC Technical Report Summary – Granite Creek

   Page 274


i-80 interpreted these results as evidence that the earlier model was conservative overall, with domain-specific biases that needed to be addressed. In particular, the strong positive reconciliation in high-grade material and negative reconciliation in parts of the low-grade oxide inventory highlight the importance of domain-specific parameterization, grade capping / clamping strategies, and classification thresholds. These findings were considered in the development and refinement of the current geological and estimation models and in the assessment of uncertainty and risk in the pre-feasibility-level Mineral Resource and Reserve estimates. The reconciliation is therefore used as a diagnostic tool to inform model improvement, rather than as a basis for current public disclosure of Mineral Resources and Reserves

Comparison to the Previous Mineral Resources

No Exclusive Resource have previously been reported for the project as this is the first declared Mineral Resources, with the previous report limited to an initial assessment. Comparison of the inclusive Mineral Resources noted an increase in the Measured and Indicated portion of the deposit from 775 kt at grade of 10.50 g/t Au for 261 koz of contained gold, to 3,729 kt at 7.17 g/t for 859 koz of contained gold. There was a reduction in the Inferred Mineral Resources from 782 kt of material at an average grade of 13.0 g/t for 326 koz, to 893 kt at 7.06 g/t Au for 203 koz of gold.

The differences in the models are attributed to the following key changes:


Depletion of mined material to March 31, 2026


Infill drilling completed during 2025 targeting high-grade extensions and infill of the PEA model material


Increase in the gold price used for the RPEE assessment from $2,175/oz to $3,000/oz


September 2026


SRK Consulting (U.S.), Inc.

SEC Technical Report Summary – Granite Creek

   Page 275


11.2.18

Relevant Factors

The QP is not aware of any additional Environmental, permitting, legal, title, taxation marketing or other factors that could affect resources.

The final domains were exported to .dxf format and provided to the i-80 Geology team for review; several small areas needed manual adjustment to improve the geological interpretation (namely in areas of lower sampling volume), which was completed by SRK, with final review and agreement


September 2026


SRK Consulting (U.S.), Inc.

SEC Technical Report Summary – Granite Creek

   Page 276


Table 11-41: Open Pit Mineral Resource Sensitivity by Domain


Deposit    Cutoff Grade (g/t)      Total Process Material
(‘000s tonnes)
     Total Process Material
(‘000s short tons)
     Au Grade
(g/t)
     Au Grade
(opt)
     Au Contained
(million tr
oz)
 

Measured


Pit B

     0.1        5,131        5,656        0.84        0.025        0.139  
     0.15        4,399        4,849        0.96        0.028        0.136  
     0.2        3,900        4,299        1.06        0.031        0.133  
     0.25        3,501        3,859        1.16        0.034        0.131  
     0.3        3,153        3,476        1.26        0.037        0.128  
     0.35        2,856        3,148        1.36        0.040        0.124  
     0.4        2,629        2,897        1.44        0.042        0.122  
     0.45        2,391        2,635        1.54        0.045        0.118  
     0.5        2,187        2,410        1.64        0.048        0.115  

Pit A

     0.1        1,489        1,641        0.56        0.016        0.027  
     0.15        1,270        1,400        0.64        0.019        0.026  
     0.2        1,098        1,211        0.71        0.021        0.025  
     0.25        915        1,009        0.81        0.024        0.024  
     0.3        773        852        0.91        0.026        0.023  
     0.35        638        703        1.03        0.030        0.021  
     0.4        526        580        1.17        0.034        0.020  
     0.45        440        485        1.31        0.038        0.019  
     0.5        370        408        1.47        0.043        0.018  

CX

     0.1        18,417        20,301        0.85        0.025        0.501  
     0.15        15,362        16,933        0.99        0.029        0.489  
     0.2        13,493        14,873        1.10        0.032        0.478  
     0.25        12,117        13,356        1.20        0.035        0.469  
     0.3        11,130        12,268        1.29        0.037        0.460  
     0.35        10,282        11,334        1.36        0.040        0.451  
     0.4        9,577        10,557        1.44        0.042        0.443  
     0.45        8,944        9,859        1.51        0.044        0.434  
     0.5        8,344        9,198        1.58        0.046        0.425  

Mag

     0.1        18,446        20,333        0.87        0.025        0.515  
     0.15        16,524        18,214        0.96        0.028        0.508  
     0.2        15,055        16,596        1.03        0.030        0.500  
     0.25        13,683        15,083        1.11        0.032        0.490  
     0.3        12,603        13,893        1.18        0.035        0.480  
     0.35        11,672        12,866        1.25        0.037        0.470  
     0.4        10,721        11,818        1.33        0.039        0.459  
     0.45        9,852        10,860        1.41        0.041        0.447  
     0.5        9,114        10,046        1.49        0.043        0.436  

Indicated


Pit B

     0.1        1,491        1,643        0.42        0.012        0.020  
     0.15        1,098        1,210        0.52        0.015        0.018  
     0.2        823        907        0.64        0.019        0.017  
     0.25        587        647        0.80        0.023        0.015  
     0.3        433        477        0.99        0.029        0.014  
     0.35        347        382        1.16        0.034        0.013  
     0.4        279        307        1.35        0.039        0.012  
     0.45        243        268        1.49        0.043        0.012  
     0.5        207        229        1.66        0.049        0.011  


September 2026


SRK Consulting (U.S.), Inc.

SEC Technical Report Summary – Granite Creek

   Page 277


Deposit    Cutoff Grade (g/t)      Total Process Material
(‘000s tonnes)
     Total Process Material
(‘000s short tons)
     Au Grade
(g/t)
     Au Grade
(opt)
     Au Contained
(million tr
oz)
 

Pit A

     0.1        1,290        1,422        0.54        0.016        0.023  
     0.15        1,114        1,228        0.61        0.018        0.022  
     0.2        969        1,069        0.68        0.020        0.021  
     0.25        863        952        0.73        0.021        0.020  
     0.3        782        862        0.78        0.023        0.020  
     0.35        694        765        0.84        0.024        0.019  
     0.4        605        667        0.90        0.026        0.018  
     0.45        524        578        0.98        0.029        0.016  
     0.5        463        510        1.04        0.030        0.016  

CX

     0.1        6,949        7,660        0.69        0.020        0.154  
     0.15        5,406        5,959        0.85        0.025        0.147  
     0.2        4,423        4,876        1.00        0.029        0.142  
     0.25        3,755        4,139        1.14        0.033        0.137  
     0.3        3,364        3,708        1.24        0.036        0.134  
     0.35        3,102        3,419        1.31        0.038        0.131  
     0.4        2,875        3,169        1.39        0.040        0.128  
     0.45        2,652        2,924        1.47        0.043        0.125  
     0.5        2,482        2,736        1.54        0.045        0.123  

Mag

     0.1        15,095        16,640        0.60        0.018        0.292  
     0.15        13,067        14,403        0.68        0.020        0.284  
     0.2        11,509        12,687        0.74        0.022        0.275  
     0.25        10,179        11,221        0.81        0.024        0.265  
     0.3        9,029        9,953        0.88        0.026        0.255  
     0.35        8,018        8,838        0.95        0.028        0.245  
     0.4        7,160        7,893        1.02        0.030        0.234  
     0.45        6,245        6,884        1.11        0.032        0.222  
     0.5        5,416        5,970        1.20        0.035        0.209  

Inferred


Pit B

     0.1        72        79        0.40        0.012        0.001  
     0.15        52        57        0.51        0.015        0.001  
     0.2        50        55        0.52        0.015        0.001  
     0.25        45        50        0.55        0.016        0.001  
     0.3        39        43        0.60        0.017        0.001  
     0.35        30        33        0.67        0.020        0.001  
     0.4        24        27        0.75        0.022        0.001  
     0.45        23        26        0.76        0.022        0.001  
     0.5        21        23        0.80        0.023        0.001  

Pit A

     0.1        615        678        0.35        0.010        0.007  
     0.15        506        558        0.40        0.012        0.007  
     0.2        440        485        0.44        0.013        0.006  
     0.25        352        388        0.49        0.014        0.006  
     0.3        275        304        0.55        0.016        0.005  
     0.35        229        253        0.60        0.018        0.004  
     0.4        188        207        0.65        0.019        0.004  
     0.45        154        170        0.70        0.020        0.003  
     0.5        124        137        0.76        0.022        0.003  


September 2026


SRK Consulting (U.S.), Inc.

SEC Technical Report Summary – Granite Creek

   Page 278


Deposit    Cutoff Grade (g/t)      Total Process Material
(‘000s tonnes)
     Total Process Material
(‘000s short tons)
     Au Grade
(g/t)
     Au Grade
(opt)
     Au Contained
(million tr
oz)
 

CX

     0.1        3,155        3,478        0.65        0.019        0.066  
     0.15        2,464        2,716        0.80        0.023        0.063  
     0.2        1,997        2,201        0.94        0.028        0.061  
     0.25        1,734        1,912        1.05        0.031        0.059  
     0.3        1,574        1,735        1.13        0.033        0.057  
     0.35        1,426        1,572        1.22        0.036        0.056  
     0.4        1,316        1,451        1.29        0.038        0.055  
     0.45        1,232        1,358        1.35        0.039        0.053  
     0.5        1,146        1,263        1.41        0.041        0.052  

Mag

     0.1        1,901        2,095        0.57        0.017        0.035  
     0.15        1,594        1,757        0.65        0.019        0.034  
     0.2        1,339        1,476        0.75        0.022        0.032  
     0.25        1,036        1,142        0.90        0.026        0.030  
     0.3        783        863        1.10        0.032        0.028  
     0.35        699        770        1.20        0.035        0.027  
     0.4        635        700        1.28        0.037        0.026  
     0.45        612        675        1.31        0.038        0.026  
     0.5        602        664        1.32        0.039        0.026  


September 2026


SRK Consulting (U.S.), Inc.

SEC Technical Report Summary – Granite Creek

   Page 279


Table 11-42: Underground Mineral Resource Sensitivity (1 of 2)


Cut-Off

   Classification      Mass
(Mt)
     Average Value
Au (g/t)
     Material Content
Au (g/t)
thousand t. oz
 

Au (g/t) ≥ 0.00 g/t

     M&I        2.26        9.15        666.41  

Au (g/t) ≥ 0.50 g/t

     M&I        2.26        9.19        666.32  

Au (g/t) ≥ 1.00 g/t

     M&I        2.25        9.22        666.10  

Au (g/t) ≥ 1.50 g/t

     M&I        2.23        9.27        665.59  

Au (g/t) ≥ 2.00 g/t

     M&I        2.22        9.31        664.87  

Au (g/t) ≥ 2.50 g/t

     M&I        2.20        9.36        663.69  

Au (g/t) ≥ 3.00 g/t

     M&I        2.19        9.41        662.29  

Au (g/t) ≥ 3.50 g/t

     M&I        2.17        9.48        659.89  

Au (g/t) ≥ 4.00 g/t

     M&I        2.13        9.56        655.87  

Au (g/t) ≥ 4.25 g/t

     M&I        2.11        9.63        652.51  

Au (g/t) ≥ 4.50 g/t

     M&I        2.07        9.72        647.73  

Au (g/t) ≥ 4.75 g/t

     M&I        2.02        9.85        639.66  

Au (g/t) ≥ 5.00 g/t

     M&I        1.96        10.01        629.79  

Au (g/t) ≥ 5.25 g/t

     M&I        1.89        10.18        618.94  

Au (g/t) ≥ 5.50 g/t

     M&I        1.82        10.36        607.06  

Au (g/t) ≥ 5.75 g/t

     M&I        1.75        10.56        594.00  

Au (g/t) ≥ 6.00 g/t

     M&I        1.68        10.77        579.93  

Au (g/t) ≥ 6.25 g/t

     M&I        1.60        10.97        565.71  

Au (g/t) ≥ 6.50 g/t

     M&I        1.53        11.19        551.19  

Au (g/t) ≥ 6.75 g/t

     M&I        1.46        11.42        535.16  

Au (g/t) ≥ 7.00 g/t

     M&I        1.39        11.65        519.99  

Au (g/t) ≥ 7.25 g/t

     M&I        1.32        11.87        505.04  

Au (g/t) ≥ 7.50 g/t

     M&I        1.26        12.11        489.03  

Au (g/t) ≥ 8.00 g/t

     M&I        1.12        12.63        455.89  

Au (g/t) ≥ 8.50 g/t

     M&I        1.01        13.12        425.89  


September 2026


SRK Consulting (U.S.), Inc.

SEC Technical Report Summary – Granite Creek

   Page 280


Table 11-43: Underground Mineral Resource Sensitivity (2 of 2)


Cut-Off

   Classification      Mass
(Mt)
     Average Value
Au (g/t)
     Material Content
Au (g/t)
thousand t. oz
 

Au (g/t) ≥ 0.00 g/t

     Inferred        0.44        9.88        138.37  

Au (g/t) ≥ 0.50 g/t

     Inferred        0.43        9.98        138.35  

Au (g/t) ≥ 1.00 g/t

     Inferred        0.43        10.03        138.30  

Au (g/t) ≥ 1.50 g/t

     Inferred        0.43        10.08        138.20  

Au (g/t) ≥ 2.00 g/t

     Inferred        0.42        10.16        137.96  

Au (g/t) ≥ 2.50 g/t

     Inferred        0.42        10.29        137.47  

Au (g/t) ≥ 3.00 g/t

     Inferred        0.41        10.41        136.92  

Au (g/t) ≥ 3.50 g/t

     Inferred        0.40        10.53        136.21  

Au (g/t) ≥ 4.00 g/t

     Inferred        0.40        10.64        135.41  

Au (g/t) ≥ 4.25 g/t

     Inferred        0.39        10.70        134.94  

Au (g/t) ≥ 4.50 g/t

     Inferred        0.39        10.78        134.26  

Au (g/t) ≥ 4.75 g/t

     Inferred        0.38        10.95        132.68  

Au (g/t) ≥ 5.00 g/t

     Inferred        0.37        11.13        131.01  

Au (g/t) ≥ 5.25 g/t

     Inferred        0.36        11.30        129.31  

Au (g/t) ≥ 5.50 g/t

     Inferred        0.35        11.44        127.91  

Au (g/t) ≥ 5.75 g/t

     Inferred        0.34        11.58        126.39  

Au (g/t) ≥ 6.00 g/t

     Inferred        0.33        11.76        124.49  

Au (g/t) ≥ 6.25 g/t

     Inferred        0.31        12.01        121.63  

Au (g/t) ≥ 6.50 g/t

     Inferred        0.30        12.27        118.82  

Au (g/t) ≥ 6.75 g/t

     Inferred        0.29        12.41        117.36  

Au (g/t) ≥ 7.00 g/t

     Inferred        0.28        12.66        114.47  

Au (g/t) ≥ 7.25 g/t

     Inferred        0.27        12.94        111.41  

Au (g/t) ≥ 7.50 g/t

     Inferred        0.26        13.07        110.02  

Au (g/t) ≥ 8.00 g/t

     Inferred        0.22        14.14        98.98  

Au (g/t) ≥ 8.50 g/t

     Inferred        0.20        14.70        93.94  


September 2026


SRK Consulting (U.S.), Inc.

SEC Technical Report Summary – Granite Creek

   Page 281


12

Mineral Reserve Estimates

Underground Mineral Reserves for the Granite Creek Project were estimated by SRK Consulting, for the Ogee, Otto, and SP zones located beneath the historically mined open pit. The open pit Mineral Resource (Section 11) has no corresponding Mineral Reserve, no mineral reserves have been estimated for the open pit as part of this study as further technical work is needed to increase the confidence in the modifying factors. Granite Creek is currently in production and is mined using an underhand drift-and-fill (DAF) method, with stopes backfilled primarily using cemented waste rock backfill (CRF). The general location of the deposit is shown in Figure 12-1.


LOGO

Source: SRK, 2026

Figure 12-1: General Locations of the Granite Creek Deposit


12.1

Key Assumptions, Parameters, and Methods Used

Potential mining blocks are generated from the resource block model based on the deposit geometry, metallurgical process, and block values. Measured Mineral Resources were converted to Proven Mineral Reserves and Indicated Mineral Resources were converted to Probable Mineral Reserves by applying the modifying factors described below; Inferred Mineral Resources were not converted to mineral reserves, where Inferred material is contained within the mineral reserve designs, it was assigned zero grade and treated as internal dilution.


September 2026


SRK Consulting (U.S.), Inc.

SEC Technical Report Summary – Granite Creek

   Page 282


Mining Dilution

Dilution in the mineral reserves consists of internal and external dilution. Internal (planned) dilution depends on the geometry of the deposit and the minimum mining width: where the width of above-cut-off-grade mineralization is less than the 4.5 m (15 ft) minimum mining width, a limited amount of below-cut-off material is mined to achieve that minimum width, and this is treated as internal dilution. External dilution consists of below-cut-off material that overbreaks into the designed stope due to the geotechnical properties of the adjacent rock (from the host rock or from backfill in adjacent drifts); an external dilution of 10% was applied to the drift-and-fill production shapes at zero grade.

Mining Recovery

A stope recovery factor of 100% was applied to the reserves, determined based on what current mining has achieved (the drifts tend to overbreak, and the planned material is recovered). A development recovery factor of 100% was used for all lateral development.

Mineral Reserves Estimates

The gold price selected for Mineral Reserves has been based on review of market study as presented in section 16 of this report which has been compared to market consensus forecast data through a database to which SRK subscribes, review by the QP of industry peers, plus discussion with i-80 technical teams. Based on the review SRK is considering the price reasonable over a time period of 10 years. It is the QP’s opinion that this is a reasonable forecast for the time considered and the current time of the mine being in operation (ramping up production), to cover short-term pricing and future long-term pricing. A 3D mine design has been created representing the planned reserve mining areas for the Granite Creek underground operation. The point of reference for the reporting of mineral reserves is the in-situ diluted tonnage and grades contained within the Mine Design, which accounts for the modifying factors.

The design process resulted in 2.20 Mt (2.42 Mst) of Proven and Probable Mineral Reserves at an average grade of 7.87 g/t (0.23 oz/st) Au, for all commodities gold only (no other commodity is estimated — see Section 12.5). The cut-off grades and metallurgical recoveries underlying the estimate are discussed in Section 12.3. Table 12-1 presents the Mineral Reserve statement as of March 31, 2026.


September 2026


SRK Consulting (U.S.), Inc.

SEC Technical Report Summary – Granite Creek

   Page 283


Table 12-1: Mineral Reserve Estimate for Granite Creek Underground – Effective Date March 31, 2026


Classification

   Domain      Metric Units      Imperial Units     


   Tonnage
(000’ tonnes)
     Au Grade (g/t)      Tonnage
(000’s s. tons)
     Au Grade (oz/st)      Au Metal Content
(000’s t. oz)
 

Proven

     Ogee        71        9.34        78        0.27        21.2  
     Otto        171        7.04        189        0.21        38.7  
     SP        40        11.21        44        0.33        14.5  
     Stockpile        26        7.33        29        0.21        6.2  
     Total        308        8.13        340        0.24        80.6  

Probable

     Ogee        88        7.95        97        0.23        22.4  
     Otto        366        6.70        403        0.20        78.8  
     SP        1,437        8.11        1,584        0.24        374.7  
     Total        1,890        7.83        2,084        0.23        475.9  

Proven + Probable

     Ogee        158        8.57        174        0.25        43.6  
     Otto        537        6.81        592        0.20        117.6  
     SP        1,477        8.19        1,628        0.24        389.2  
     Stockpile        26        7.33        29        0.21        6.2  
     Total        2,198        7.87        2,423        0.23        556.5  

Source: SRK, 2026

Notes:


All figures are rounded to reflect the relative accuracy of the estimates. Totals may not sum due to rounding. Mineral Reserves have been stated on the basis of a mine design, mine plan, and economic model.


Reserves are reported using a stope CoG range of 4.42 g/t (0.13 oz/st) Au – 6.41 g/t (0.19 oz/st) Au and an incremental processing CoG range of 1.51 g/t (0.04 oz/st) Au – 2.91 g/t (0.08 oz/st) Au depending on the processing method. The CoG calculations assume a US$2,500/oz Au price, and 60% to 92% metallurgical recovery depending on the processing method applied.


Operating costs include mining (US$190.18/tonne), processing (US$59.94/tonne to US$131.13/tonne), G&A (US$22.29/tonne), Shipping Costs (US$/t 16.04). Additionally, a 6% royalty and 0.75% Excise Tax are applied, along with TC/RC charges of US$1.85/oz Au.


The reserves are mined using the underhand drift and fill method with cemented waste rock backfill. Mining dilution of 10% is included in the reserve at zero grade.


Stockpile reserves reflect ore mined and placed on surface stockpiles prior to the effective date and not yet processed.


The Mineral Reserves were estimated by SRK Consulting, U.S. (Inc.).


September 2026


SRK Consulting (U.S.), Inc.

SEC Technical Report Summary – Granite Creek

   Page 284


All figures are rounded to reflect the relative accuracy of the estimates; totals may not sum due to rounding. Mineral Reserves are stated on the basis of a mine design, mine plan, and economic model, using the underhand drift-and-fill method with cemented waste rock backfill and a mining dilution of 10% included in the reserve at zero grade. Stockpile reserves reflect ore mined and placed on surface stockpiles prior to the effective date and not yet processed. The Mineral Reserves were estimated by SRK.

The qualified person preparing the mineral resource estimates must round off, to appropriate significant figures chosen to reflect order of accuracy, any estimates of quantity and grade or quality.


12.2

Cut-Off Grades Estimates

Current estimated project costs and the calculated economic cut-off grade (CoG) for the underground Mineral Reserve are shown in Table 12-2. A dynamic cut-off grade was used based on whether material is oxide or sulfide: a stope cut-off range of 4.42 to 6.41 g/t (0.13 to 0.19 oz/st) Au was used for oxide material, and 5.21 to 6.17 g/t (0.15 to 0.18 oz/st) Au for sulfide material. Development headings generate additional material grading between 1.51 and 2.19 g/t (0.04 to 0.06 oz/st) Au for oxide material and 2.47 to 2.91 g/t (0.07 to 0.08 oz/st) Au for sulfide material; this material is economic to process on an incremental basis and is therefore included in the mineral reserve estimate.

Table 12-2: Underground Cut-off Grade Parameters


Process

Method1

   Parameter   Imperial
Value
     Imperial
Unit
     Metric Value      Metric
Unit
 
   Gold Price     2,500      US$ /oz        80.3769      US$ /g  
   TC/RC     1.85      US$ /oz        0.0595      US$ /g  
   NSR Royalty     6%  
   Nevada
Excise Tax
    0.75%  

Oxides

   Metallurgical
Recovery
    60.0% - 87.4%  
   Mining Cost     172.53      US$ /st        190.18      US$ /t  
   Process Cost     54.38      US$ /st        59.94      US$ /t  
   Shipping
Cost
    14.55      US$ /st        16.04      US$ /t  
   G&A Cost     20.22      US$ /st        22.29      US$ /t  
   Total Cost     261.68      US$ /st        288.45      US$ /t  
   Stope
Cut-off
Grade
    0.129 – 0.187        oz/st Au        4.423 – 6.411        g/t Au  
   Processing
Cut-off
Grade2
    0.044 – 0.064        oz/st Au        1.509 – 2.194        g/t Au  

Sulfide

   Metallurgical
Recovery
    77.6% - 92.2%  
   Mining Cost     172.53      US$ /st        190.18      US$ /t  
   Process Cost     118.96      US$ /st        131.13      US$ /t  
   Shipping
Cost
    14.55      US$ /st        16.04      US$ /t  
   G&A Cost     20.22      US$ /st        22.29      US$ /t  
   Total Cost     326.26      US$ /st        359.64      US$ /t  
   Cut-off
Grade
    0.15–0.18        oz/st Au        5.21–6.17        g/t Au  
   Processing
Cut-off
Grade2
    0.07–0.08        oz/st Au        2.47–2.91        g/t Au  

The cut-off grade calculations assume a US$2,500/troy oz Au price, 60.0% to 92.2% metallurgical recovery depending on the processing method applied, mining costs of US$190.18/tonne, processing costs of US$59.94 to US$131.13/tonne, G&A costs of US$22.29/tonne, a 6% net smelter return royalty, a 0.75% Nevada excise tax, and treatment/refining charges of US$1.85/oz Au.


September 2026


SRK Consulting (U.S.), Inc.

SEC Technical Report Summary – Granite Creek

   Page 285


12.3

Reserves Classification and Criteria

Mineral Reserves for the Granite Creek Project are classified as Proven or Probable. Under the S-K 1300 definitions at 17 CFR 229.1300, a Proven Mineral Reserve is the economically mineable part of a Measured Mineral Resource and can only result from conversion of a Measured Mineral Resource; a Probable Mineral Reserve is the economically mineable part of an Indicated, and in some cases a Measured, Mineral Resource. Consistent with this framework, Measured Mineral Resources at Granite Creek were converted to Proven Mineral Reserves, and Indicated Mineral Resources were converted to Probable Mineral Reserves, by applying the modifying factors described in Section 12.1 to potential mining shapes created during the mine design process; Inferred Mineral Resources were not converted to mineral reserves.


12.4

Multiple Commodity Reserve

Not applicable. The Mineral Reserve for the Granite Creek Project is estimated for gold only; no other commodity grade or quantity is reported in the source technical documentation for this deposit.


12.5

Impact of Changes of Modifying Factors to the Mineral Reserve Estimates

Mineral reserves are subject to risks typically associated with drift-and-fill operations. In the QP’s opinion, these risks could materially affect the mineral reserves and include, but are not limited to, the following:


Differences between the mineral reserves metal price assumption and actual metal prices.


Changes in the interpretation of the deposit geometry and grade continuity.


Changes to the estimated gold grades, estimation strategy and input assumptions.


Changes to the density values applied to the mineralized domains.


Changes to mining, processing, and G&A costs used to determine the cut-off grade.


Changes to metallurgical recovery rates.


Changes in the geotechnical assumptions leading to potential impacts to schedule, dilution and/or mining recovery.


Changes to mining method in portions of the deposit.


Assumptions related to ongoing access to the site, retention of mineral tenure, obtaining necessary environmental, mining, and other regulatory permits, and maintaining a social license to operate with relevant stakeholders.


September 2026


SRK Consulting (U.S.), Inc.

SEC Technical Report Summary – Granite Creek

   Page 286


13

Mining Methods

The Granite Creek Mine currently produces 600 st of ore per day (216,000 st per year assuming 360 days per year) and is operated by a local contractor. The contractor has operated a number of mines in northern Nevada over the past thirty years. The mine is accessed through the bottom of the open pit with a 4.57 m (15 ft) wide x 4.87 m (16 ft) high decline with a gradient of 13%. Mining of the Ogee and Otto zones are between 4790 level and 4150 level and the decline to the SPZ is developed to 3950 level.

The mining method used in Granite Creek is underhand drift and fill with cemented waste rockfill. The production drifts are 4.57 m (15 ft) x 4.57 m (15 ft). Mineralization is loaded on 30 t (33.1 st) mining trucks and hauled to the surface via the decline.

Fresh air comes in from a fresh air portal at the bottom of the pit and is connected to the various workings through raises. The haulage ramp serves as an exhaust drift.

The proposed mining method for the life of Granite Creek mine will remain the same as the current operations. The decline will continue down another 650 vertical ft to the bottom of the mine at a 14% gradient.

The ventilation plan will remain the same with fresh air coming in from the fresh air portal, down raises and exhausted out the haulage ramp. A new 3.2 m (10.5 ft) diameter fresh air raise will be developed to supply enough air to the bottom of the mine.


13.1

Parameters Relevant to Mine Designs and Plans


13.1.1

Geotechnical

WSP, conducted a site visit to the Granite Creek Mine on November 5-6, 2025. The purpose of the visit was to review geological, geotechnical, mining, and infrastructure conditions relevant to the SPZ and planned mine expansion. The site visit included inspection of drill core, underground workings, ground support systems, cemented rockfill production facilities, and the proposed ventilation raise location to surface. Observations made during the site visit were used to validate geological interpretations, geotechnical domains, rock mass classifications, mining methods, ground support recommendations, and ventilation raise development assumptions presented in this report.

The South Pacific Ore zone will be accessed via the SPZ Decline and mined using the Underhand Cut and Fill method, replacing open stopes with jammed CRF. i-80 has been mining other ore bodies at Granite Creek with a similar mining method with success since 2022.

Benchmarking in the Region and at Granite Creek

Northern Nevada is a well-established underground gold mining region with significant experience available to draw upon for benchmark comparison. The underhand cut and fill mine method has been demonstrated to be well suited for the challenging ground conditions in the region with other mining operations successfully applying the method including Turquoise Ridge, Cortez Hills, Goldstrike, and others. Design parameters available to compare include:


September 2026


SRK Consulting (U.S.), Inc.

SEC Technical Report Summary – Granite Creek

   Page 287


Ground support design and implementation


Specialized heading advance techniques for difficult ground conditions


Backfill design and implementation


Minimum sill pillar thickness between mine levels

Benchmarking studies and a review of Warren (2016) indicate the SPZ mine method and designs in this report are in line with experience gained at most underground mines in the region. Additionally, the current mine workforce draws from experience in the region including technical staff and operations.

Granite Creek has been operating successfully using underhand cut and fill since 2022. Installed ground support and CRF design have generally included:


Moderate – good ground (Rock Mass Rating (RMR) 35 +) 2 m (8 ft) Swellex, 3 ft x 3 ft bolt spacing and wire mesh and shotcrete where necessary.


Poor ground (RMR<30) 2 m (8 ft) Swellex, 2 ft x 2 ft bolt spacing and wire mesh and shotcrete where necessary. This is typically in fault zones and ore body mining areas.


CRF backfill design of 700 psi with emplaced QA/QC program per Golder (2012) design.

The above ground support and backfill design has performed adequately thus far at the Granite Creek mine.

Cemented Rockfill Designs

CRF design strength determination was based on Stone et al., (2019) modified from Stone (1993) and Pakalnis (2005). The SPZ will implement a CRF design strength of 700 psi (7% cement) with 2-inch minus crushed aggregate sourced from the CX West pit on surface. This is consistent with other ore body extraction designs at Granite Creek and with recommendations by Golder (2012).

Backfill will be made using a typical pit mix configuration using a front end loader to mix aggregates with a cement slurry into a consistent mixture. Mixed CRF will be loaded into haul trucks for dumping at the designated location underground. A jammer, (typically an LHD-or similar fitted for jamming) will be used to “jam” CRF tight to the back underground.

i-80 will continue current practice of their CRF QA/QC program consisting of:


Regular crushed aggregate sampling and testing targeting the ideal Talbot Curve for gradation distribution.


Regular CRF backfill cylinder sampling and testing to ensure minimum design strengths are met.

The CRF design strength, mixing operation, and QA/QC program for the SPZ is consistent with other operations in the area operating in similar lithologies and ore extraction practices.


September 2026


SRK Consulting (U.S.), Inc.

SEC Technical Report Summary – Granite Creek

   Page 288


Geotechnical Domains for Underground Mining and Development

Geotechnical domains in a mine are developed by dividing the rock mass into zones that exhibit similar engineering properties and will respond similarly to mining activities. Table 13-1 indicates geotechnical domains developed for the SPZ based on evaluation of the geological model, geotechnical logging of core holes, underground observations, and laboratory testing results.

Table 13-1: Geotechnical Domains


Geotechnical Domain


Lithology


Description


RMR/GSI

Upper Comus (Ocu)    Argillite    Strong rock (50 to 100 MPa) typically brittle in nature. Thinly bedded to massive    45 (25 to 50)
Lower Comus (Ocl)    Interbedded argillite and limestone, typically metamorphosed to hornfels (argillite) and marble (limestone) with calcsilicate mineral assemblages    Very strong rock >100 MPa moderately fractured to massive rock mass    60 (50+)
SPZ ore body and other faults    Breccia mixed with clay gouge. Clayey Gravel, roughly 10% to 15% clay    Angular breccia mixed with clay gouge. Clayey Gravel, roughly 10% to 15% clay.    20 (<25)

Laboratory Testing

Laboratory testing was performed to obtain strength and material parameters for the SPZ zone main rock types. Testing included 15 (5 with modulus) Unconfined Compressive Strength (UCS), 27 Triaxial Compressive Strength (TCS), 10 Brazilian Tensile Strength (BTS), and 5 Unified Soil Classification (USCS) tests. Table 13-2 presents typical properties for the SPZ mining area.

Table 13-2: Geotechnical Parameters for the Three Geotechnical Domains


Domain

   UCS
(MPa)
     Tensile
Strength
(MPa)
     Specific
Weight
(kg/
M3)
     Youngs
Modulus
Ei (GPa)
     Poisson’s
Ratio
     USCS  

Upper Comus

     85        11        2788        99.9        0.25        NA  

Lower Comus

     134        14        2794        82.6        0.26        NA  

SPZ Ore Body and Fault Zones

     NA        NA        NA        NA        NA       

Clayey
Gravel
(GC)


Note: Rock sample testing was performed at the WSP laboratory in Burnaby Canada and at the Earth Mechanics Institute in Golden Colorado, USA. Soil Classification testing was performed at the WSP lab in Golden Colorado, USA.

Rock Mass Classification

Geotechnical core logging provides the main source of information for classification of the rock masses in each of the geotechnical domains within the SPZ mine area. Additional supplemental information includes underground observations from within the existing developments and observation of representative sections in the core shed. For this project, the main classification system selected was the Rock Mass Rating (RMR) System (Bieniawski, 1976). Input parameters for the RMR system include:


Rock Quality Designation (RQD) from core logging based on Deer and Deer (1988)


Intact Rock Strength (ISRM R Strength) from core logging, underground mapping, and laboratory testing


Joint spacing from core logging and underground mapping


Joint condition rating from core logging and underground mapping


Groundwater rating is assumed to be damp-wet for empirical design, and dry for numerical mode input parameters with groundwater conditions considered directly in the modeling conditions


September 2026


SRK Consulting (U.S.), Inc.

SEC Technical Report Summary – Granite Creek

   Page 289


Table 13-3 indicates the range of RMR estimates by source for each geotechnical domain along with the representative values selected for estimating rock mass strength.

Table 13-3: RMR Summary for Each Geotechnical Domain


Domain

   Range      i-80 Mode      WSP Logging Mode      Observations Underground      Design RMR  

Upper Comus

     0 to 70        20 to 30        40 to 50        40 to 50        45  

Lower Comus

     0 to 90        30 to 40        60 to 70        60 to 70        60  

SPZ/Faults

     0 to 40        NA        20 to 30        0 to 20        20  

Geological Structural Assessment

Geologic structures can generally be defined as large-scale (mine wide) and small scale (rock fabric). Structure at the Granite Creek Project is highly complex and indicative of multiple deformation events. Thickness and orientation of major structures are constrained by core logging, underground mapping, and 3D interpretive modeling (i.e., Leapfrog). Most faults outside the main ore bodies and Range Front Fault are typically steeply dipping and average 2.4 to 3 m (8 to 10 ft) thick, with a maximum thickness of 6 m (20 ft).

Rock fabric data are available from 11 core holes with televiewer optical and acoustic structural pics. Stereographic analysis of the compiled data was used to define the major joint sets. Table 13-4 summarizes the major sets defined through the analysis and used as basis for kinematic excavation stability analysis discussed subsequently.

Table 13-4: Major Joint Sets Defined by Televiewer Data Analysis in Dips Software


Design Joint Set Name

   Bedding
Dip°
     Bedding
Dip Dir°
     J2 Dip°      J2 Dip
Dir°
     J3
Dip°
     J3 Dip
Dir°
     Excavation
Orientation
 

Typical Bedding

     50        62        34        243        80        150        NE and NW  

Steep Bedding

     84        100        15        23        81        160        NE and NW  

Stress Assessment

Local geologic and large-scale structural information indicate an extensional in situ stress regime. Vertical stress estimates are assumed to increase linearly with depth and proportional to the unit weight of the rock. Laboratory results indicated an average rock density of 174.9 pounds per cubic foot (pcf) (2802 kg/m3) with a maximum depth below ground surface of 457 m (1500 ft) = 1,822 psi (12.56 megapascal (MPa)). Basin and range extensional tectonics and back analysis of modeling studies (Sandback et al., 2020) suggest generally isotropic horizontal stress have a K value (horizontal / stress) of 0.75. Therefore, maximum horizontal stress is assumed to be 1,366.5 (9.42 MPa). Table 13-5 lists assumed stress values assumed for this study.


September 2026


SRK Consulting (U.S.), Inc.

SEC Technical Report Summary – Granite Creek

   Page 290


Table 13-5: Stress Analysis from Assumed Depth and k Value of 0.75


Stress

   Depth (ft)      Depth (m)      Density (pcf)      K      Stress (psi)      Stress (Mpa)  

Vertical

     1,500        457.2        174.9        —         1,822.0        12.56  

Horizontal

     1,500        457.2        174.9        0.75        1,366.0        9.4  

Ground Support

Ground support design methodology consisted of the following steps:


Nevada-specific empirical support design based on Warren (2016), Warren et al., (2018), Pakalnis et al., (2008), Pakalnis (2014), and Warren et al., (2020) as a starting point for ground support design


Kinematic Factor of Safety (FOS) stability checks based on design joint sets and empirical ground support design


2D numerical modeling checks on stability of development drifts and mining drifts based on in situ stress analysis, mining induced stress, and input parameters from core logging and laboratory testing

Ground Support Design

Table 13-6 presents the ground support recommendations for Granite Creek SPZ based on empirical design, kinematic analysis, 2D numerical modeling, and a review of benchmarking studies for other mines in the region.

Table 13-6: Ground Support Recommendations for Granite Creek SPZ Development and Mining


Ground Type


Typical
Geotechnical
Domain


Drift Dimension
(WxH ft)


RMR/ GSI
(range)


Primary bolt 8 ft 120
kN Swellex-type
bolt (ft x ft) (1)


Secondary Bolt
Spacing 12ft 240
kN Swellex-type
(ft x ft)


Shotcrete

Type I    Lower Comus    15x16    60 (50+)    4x4    As needed    As needed
Type II    Upper Comus    15x16    45 (25-50)    3x3    As needed    As needed
Type III    Fault Zones Development    15x16    20 (<25)    2x2    6 x 6    3” minimum
Type III (temporary)    South Pacific Zone ore cuts    15x15    20 (<25)    2x2    As needed    As needed
All Intersections    All    Up to 20 ft circular diameter    All    As required above    6x6    As needed


  (1)

Welded wire mesh is required and should be installed simultaneously with the primary bolt pattern.

Operational Considerations

Stand-up time in weak ground will be a primary risk to development in fault zones and in the top cuts of the South Pacific ore body. Experience in these conditions at Granite Creek has shown that spiling with grouted self-drilling hollow-bar MAI bolts has proven effective in stabilizing the back to allow installation of primary ground support. General operating practices for ground types are presented in Table 13-7 below.


September 2026


SRK Consulting (U.S.), Inc.

SEC Technical Report Summary – Granite Creek

   Page 291


Table 13-7: Recommended Operating Practices for Ground Support Installation


Ground

Type


Typical
Geotechnical
Domain


RMR (range)


Span (ft)


Span (m)


Unsupported
Standup Time


Operational
Considerations

I    Lower Comus    60 (55+)    16    4.9    1 month to 1 year    10 ft blast rounds, longer standup time, shotcrete not necessary
II    Upper Comus Development    45 (35-55)    16    4.9    1 to 4 days    8 to 10 ft rounds, likely will stand until next shift can install support, shotcrete where necessary
III    Fault Zone Development and SPZ ore body top cuts    20(<35)    15 to 16       Immediate collapse - hours    4 to 6 ft light blast rounds or muck advance, spiling or flash shotcrete prior mucking likely necessary

Overstressed mine openings, particularly on mining levels, is a common occurrence in Nevada underground mines due to the generally poor ground conditions and typically results in a time-dependent (squeezing) ground response or convergence of the openings. Successful management of these conditions typically involves mining and backfilling as soon as possible (within weeks) before squeezing becomes a problem. The selected ground support elements of Swellex-type bolts have a relatively high strain capacity and are well suited for these conditions.

Granite Creek has not experienced evidence of overstressed ground in ore zones or development drifts. However, experience in the region and 2D Finite Element Analysis indicate that as mining progresses deeper, time-dependent deformation may be encountered, particularly in the top cuts of ore drives.

The minimum sill pillar thickness at Granite Creek is 9 m (30 ft) per mine policy. Modeling using 2D Finite Element Analysis of the minimum sill pillar thickness indicates potential, but manageable overstressing of the pillar if mining levels are in direct vertical alignment. Staggering level advance so that these openings are not in direct vertical alignment will help to reduce or prevent this condition from occurring.

Production schedules and ground support maintenance planning need to provide sufficient buffer or contingency to account for ground support rehabilitation efforts if these conditions are experienced. Mining production schedules should be sequenced to reduce open stope time and backfill as soon as possible, particularly in top cuts.

Ventilation Raises

Two ventilation raises are planned for development (VR1 and VR2) connected by 213 m (700 ft) of underground drift, with an additional 152 m (500 ft) of development access drift. VR1 is planned from surface (elevation 1,694 m (5,557 ft)) to a depth of approximately 600 ft (elevation 4,957). VR2 is a 91 m (300 ft) internal raise from elevation 4,500 to 4200. Stability analysis based on cover core holes along VR1 and near the VR2 alignment indicates that raise bore methods are feasible with ground improvements over sections of both alignments. Specific ground improvements include:


September 2026


SRK Consulting (U.S.), Inc.

SEC Technical Report Summary – Granite Creek

   Page 292


The upper 18 m (60 ft) of alluvium in VR1 will require ground improvements such as grout injection and secant piling.


Pre-excavation ground improvements will be required in VR1 from depths 18 to 61 m (60 to 200 ft) and the lower 23 m (75 ft).


Pre-excavation ground improvements will be required in limited sections of the lower 30 m (100 ft) of VR2 within faulted intervals of greater than 2 m (6 ft).

Final lining is required in both vent raises for long term stability (finished concrete or grouted in place steel liner) installed immediately after raise boring.


13.1.2

Hydrological

Groundwater Assumption

This study assumes the dewatering program will be effective and potential for adverse groundwater-related stability conditions will be minimized. Accordingly, geotechnical analyses were completed assuming drained groundwater conditions.

Dewatering

There are seven existing sumps in the mine with a 60 HP pump in each sump. Dual 6-inch pipes are used to transport the water along the decline to surface.

Water from the production faces is pumped by either air-operated diaphragm or electrical pumps into either 2-inch or 4-inch HDPE discharge lines. The discharge lines are then routed to the nearest main sump. Pipe size, pump-type, and pump size are adjusted as required to maintain safe access in the production headings. Most ore headings use a 2-inch air-operated diaphragm pump while development headings most often use a 30 hp or 60 hp electric pump.

The Triple Sump consists of three 50 to 18 m (60 ft) long drifts spurring off of single access at the 4170 Level. Water from the mine is discharged to Sump 8 and decants through drain holes to Sump 9 and then decants through a second set of drain to Sump 10 in an effort to clarify the water. A concrete weir and catwalk is installed in Sump 10 to allow the clarified water to flow to the pumps while solids are left in the sump. The total installed capacity of the triple sump system is approximately 60,000 gallons.

Granite Creek has not seen significant additional increases in the amount of contact water encountered during mining since advance in the exploration drift was completed. The exploration drift and the watercourse encountered in Sump 12 continue to serve as the primary point-sources into the mine. Total flows are estimated at 800 to 1000 gpm between the two sources. The balance is made from water encountered in the ore headings; flow encountered in lower levels are generally balanced by a decrease in flow at higher levels on the same geologic structure. Figure 13-1 depicts the rolling tracker for the contact water management system.


September 2026


SRK Consulting (U.S.), Inc.

SEC Technical Report Summary – Granite Creek

   Page 293


LOGO

Source: i-80, 2026

Figure 13-1: Contact Water Measurements

The current dewatering model estimates residual passive inflow into Granite Creek will exceed 2500 to 2700 gpm until the combined influence of the second water treatment plant and additional dewatering wells advance the dewatering cone-of-depression below the current workings.

A Phase 2 upgrade to the dewatering system is in progress to achieve the following:


Discharge Line Upgrade:


The uphill piping system should be a single line capable of handling all the projected inflow.


HDPE is preferred to carbon-steel for material for installation in the decline.


Lift Stations:


The number of lift stations between the pit crest and the lowest point of the underground workings needs to be minimized to control capital expenditures and ensure system reliability by decreasing the number of components (i.e., points-of-failure).


Lift Stations should be spaced as evenly as possible to balance head pressure to each pump and further increase system reliability.


Station dimensions should fit in a standard muck bay (e.g., 15 ft W x 15 ft H x 50 ft L) where possible.


Pumps:


Pumps must operate within the pressure spec of the pipe.


Installed motor power should be delivered at 480V.


September 2026


SRK Consulting (U.S.), Inc.

SEC Technical Report Summary – Granite Creek

   Page 294


Pump Style should allow for minimal maintenance in the presence of up-to 1% solids (or more).


Power:


Use of installed load-centers to transform voltage from feed to 480V is preferred to transformation at the installation location.


Control Systems:


Variable Frequency Drives (VFDs): Granite Creek currently uses VFDs manufactured by Baker-Hughes and would prefer to continue to use their product line to ensure parts commonality.


13.1.3

Ventilation

The following site visit observations and temperature/humidity data were collected to calibrate the mine ventilation model discussed under Ventilation, below.

A site visit was completed on November 5, 2025, by WSP. A guided tour of the mine was completed with i-80 staff that included a visit and review of conditions at the main fan, booster, and auxiliary fans, as well as active working areas, the main haulage route, escapeways, and future ventilation raise locations. Staff indicated the mine was very humid, with the likely source being groundwater seepage. However, neither SMD nor i-80 had humidity measurements available, so WSP collected this pertinent data while on Site for use in calibrating the ventilation model. Overall ventilation practices, implementation, and management were discussed during the site visit with available i-80 and SMD personnel.

Temperature and humidity data collected during the site visit is shown in Table 13-8. Locations of primary airflow in the mine were used to calibrate the existing mine Ventsim model since these data are believed to be the most reliable for calibration purposes. Non-working areas with limited airflow were excluded.

Table 13-8: Site Visit Temperature and Humidity Data


Test


Dry Bulb
(F)


Wet Bulb
(F)


Relative
Humidity
(%)


Dew Point
(F)


Location


Notes

1    59.2    50.0    52.2    41.7    Main fan (intake side)   
2    58.7    49.7    52.8    41.5    Main fan (intake side)   
3    80.0    77.2    88.5    76.3    4480 spiling roof area
(dead heading)
   Discarded
4    78.3    71.5    72.3    68.6    4129   
5    76.4    69.4    70.9    66.3    Lower decline three
(ventilation tube discharge point)
  
6    77.1    70.1    71.1    67.0    Exploration decline
(ventilation tube discharge point)
  
7    78.2    67.7    58.8    62.6    4110 future ventilation raise location    Discarded
8    79.0    65.6    49.6    58.5    Ventilation raise (4175 level)    Discarded
9    87.7    80.2    72.6    77.8    Exhaust near portal   

Ventilation at the Granite Creek Mine is circulated through the two portals, one as intake and one as exhaust. The haulage is on the only decline, which acts as the exhaust airway. Intake airflow is delivered through a series of raises that were developed through the center of the spirals on the decline. This Pre-Feasibility Study (PFS) expands upon previous lower level of detail studies to describe


September 2026


SRK Consulting (U.S.), Inc.

SEC Technical Report Summary – Granite Creek

   Page 295


improvements with enhanced engineering and sensitivity analyses required. Figure 13-2 shows the airflow scheme for the planned mine development.


LOGO

Source: WSP, 2026

Figure 13-2: Future Mine Airflow Configuration

Weather

The psychrometric properties of the surface air were calculated using the weather data collected by i-80 over the last two years. From the data recorded, WSP calculated average values for summer and winter to be used in modeling.

Diesel Equipment

Diesel equipment operating underground produces pollutants that must be diluted to safe working levels according to the United States Mine Safety and Health Administration (MSHA). The comprehensive list of every diesel machine on site that has the potential to go underground must be examined for calculating adequate airflow. WSP applied airflow rates based upon the engines fitted to each machine, assuming a similar horsepower (hp) rating where an exact engine is not listed.

When considering the total hp and cubic feet per minute (cfm) ratings for the equipment, on average 44 cfm is applied for each hp operating in the mine. This considers that all equipment is on and operating for a whole shift, which should be seen as the maximum airflow requirements, not the typical. WSP assumes that 80% of the equipment will be working in the mine during any shift, meaning that only about 336 thousand cubic feet per minute (kcfm) will be required under normal circumstances. The other 20% of equipment is assumed to be in the maintenance shop or on surface and is not considered a part of the airflow demand calculation.


September 2026


SRK Consulting (U.S.), Inc.

SEC Technical Report Summary – Granite Creek

   Page 296


Relevant MSHA Standards

To remain in compliance, the mine must comply with the following MSHA standards. The ventilation models developed by WSP respect these standards to the fullest extent possible. Changes in infrastructure are recommended based on non-compliance with any of these limits. The relevant standards are shown in Table 13-9.

Table 13-9: MSHA Standards


MSHA Standard


Value


Units

Minimum Airflow per Person    200    Cfm
Carbon Monoxide Maximum Concentration    50    Ppm TWA
Nitrogen Dioxide Maximum Concentration    5    Ppm TWA
Diesel Particulate Matter (DPM) Maximum Concentration Limit    160    µg/m3 TWA
Respirable Silica Maximum Concentration Limit    50    µg/m3 TWA
General Respirable Dust Maximum Concentration Limit    2.0    mg/m3 TWA
Maximum Temperature Dry-Bulb    120    °F
Maximum Working Temperature Dry-Bulb1    90    °F
Maximum Working Temperature Wet-Bulb1    79    °F

Source: WSP, 2026

Notes:


  (1)

These temperatures are the MSHA action limit. Work can be performed above these temperatures if required, however, regimented breaks and personnel monitoring are required which slows production significantly.

Heating and Cooling Requirements

WSP modeled the winter and summer stages, with allowances for localize heat generation from backfill curing, to see the more extreme scenarios of temperatures and found that no cooling is required in the summer, although air temperatures will feel quite warm around diesel equipment and operators should remain in enclosed cabs whenever possible. Open cab drills and bolters are expected to have sufficient cool airflow to keep operating conditions for personnel below the MSHA action limits. Dry-bulb temperatures in the decline will be locally elevated, wherever haul trucks are present, and all haul trucks should be outfitted with functional air conditioning units. The most critical method to avoid excess heat in at the working faces is to duct air from the intake raise over an air door through the decline to each level. The temperatures become too hot when reusing air from the decline, because of the truck traffic.

In the winter scheme, intake air low temperatures are at, or slightly below, freezing. This can cause icing in the intake raise if wet-bulb temperatures remain below freezing for extended periods of time because humidity drops out of the air and forms ice around the raise circumference. If enough ice builds up, the resistance of a small, open cross-section in the raise can stall the fan and cut off airflow. To mitigate this risk of reduced airflow and fan damage, WSP recommends installing a 1.8 MBTU/hr propane heater near the fan and ducting it into the plenum just upstream of the vanes. This amount of heat is enough to raise the temperature of the air intake by 12°F dry bulb (6°F wet bulb) and should be sufficient to prevent icing for 95% of the operating days during each year according to the site recorded temperature data. For the remaining 5% of the days, i-80 may either turn the fan off temporarily and operate at a lower production rate or rent another 1.8 MBTU/hr unit to manage the icing risk on a case-by-case basis. Each heater is estimated to cost about US$40/hour to operate.


September 2026


SRK Consulting (U.S.), Inc.

SEC Technical Report Summary – Granite Creek

   Page 297


DPM and Dust Management

WSP simulated DPM using Ventsim, which derives the concentrations from particulate mixing and dispersion using the source diesel hp or user set emission rate as an input. Since the decline is exhausting, the highest concentration of DPM is experienced there, about 500 µg/m3 steady state. Therefore, WSP recommends equipment movement other than truck haulage is minimized on the decline. This initiative is expected to be adopted by i-80 already considering traffic on the decline slows production.

The silica dust simulation offered very similar results to DPM, except dust is expected to drop out of the air at some point as it moves up the decline so leakage of dust from the decline to the intake raises is modeled as 0 µg/m3. There was no data provided to WSP to calculate or simulate fugitive dust loading in the mine, so silica dust was the focus. i-80 is in compliance with regulations on silica dust exposure but had a few readings that were above the action level of 25 µg/m3 in the testing data provided. WSP does not recommend any infrastructure or administrative changes for silica dust exposure beyond those recommended for airflow, heat, and DPM. However, closed cabin equipment with HEPA® filters would reduce silica dust exposure in the same way the filters will reduce DPM exposure.

New Ventilation Raise Infrastructure Design

Improving on previous studies, the ventilation modeling completed by the engineering team at the Granite Creek property identified that sufficient airflow could be achieved with a single raise from surface to the 4600 level, with drifts to bypass adverse ground conditions, and the development of an additional raise connecting the 4500 level to the 4200 level. The raises are designed to be 4 m (12 ft) excavated diameter and 3.2 m (10.5 ft) finished with a sealed collar. Environmentally permitted space is limited so WSP has designed the new installation to fit within a small footprint. WSP engaged a vendor to quote a fan of sufficient size and power to provide the required airflow to the operations. One permanent and one temporary (rental) 1.8 MBTU heater have been included at the raise collar along with a 10,000-gallon (80% filled) propane tank for a week supply of fuel. The general arrangement of the surface fan infrastructure is shown in Figure 13-3. Variations of this design have been proposed to reduce costs but are not included in this report.


September 2026


SRK Consulting (U.S.), Inc.

SEC Technical Report Summary – Granite Creek

   Page 298


LOGO

Source: WSP, 2026

Figure 13-3: Surface Fan Installation General Arrangement

Ventilation Capital and Operating Costs

After developing the ventilation schemes for the future mining operation, WSP estimated the number of air doors, regulators, fans, and duct work stock to purchase. Some of these items are available in inventory at Granite Creek or sister properties, while other items will need to be purchased new. To reduce the capital cost to i-80, WSP has assumed that available inventory will be used where applicable. Table 13-10 shows a list of the main capital expenditures that will be required for the future mining operations and were included in the estimated cost.


September 2026


SRK Consulting (U.S.), Inc.

SEC Technical Report Summary – Granite Creek

   Page 299


Table 13-10: Capital Cost Estimate


Item

   Cost
(US$)
 

Raisebore Excavation

     8,820,000  

Surface 400 HP Fan Installation1

     3,870,000  

Underground Air Door Installations

     1,720,000  

Underground Fan And Ductwork Installations4

     1,500,000  


Total

   $ 15,900,000  


Source: WSP, 2026

Notes:


  1.

Approximately 25% of the costs sourced from CostMine (Costmine Intelligence, 2024), the remainder from budgetary quotations.

  2.

A total estimated cost of US$1.25 million for injection grouting was added to the raisebore excavation based upon previous WSP projects of similar scope. Injection grouting for ground improvement costs can vary widely depending on the actual ground conditions observed.

  3.

Shipping and installation costs are estimated to be 3-5 times the amount of the raw materials cost. This is based on a basket of recent contractor bids received for various projects. Shipping and installation costs are not applied to the raisebore excavation cost.

  4.

No drifting included in cost estimates.

  5.

Only shipping cost of 15% applied to underground fan and ductwork installations because installation is assumed to be completed by the full-time i-80 ventilation crew labor, with cost captured as an OPEX.

  6.

Values may not add exactly due to rounding.

The operating costs associated with ventilation are almost entirely captured in power consumption, heating and labor for moving fans and installing / removing ductwork. Fans require limited maintenance and are designed to work for 10 to 20 years without planned maintenance service if used properly. Likewise, air doors and regulators are designed with robust and simplistic properties for use in harsh mining environments. The doors and regulators are operated by a hydraulic over electric system with few moving parts. Servicing is limited to basic functions like greasing rotating parts and exchanging hydraulic fluid at periodic intervals. Table 13-11 shows the annual operating expenditure calculation.

Table 13-11: Annual Operating Cost Estimate


Item

     Count      Hourly OPEX1
(US$)
     Annual Operating
Hours2,3
     Annual Cost
(US$)
 

Fans

     400 HP        2        44.15        8322        735,000  
     250 HP        1        29.80        8322        248,000  
     75 HP        4        17.69        8322        147,000  
     40 HP        7        5.78        8322        289,000  

Air Doors


     18        0.09        8322        14,000  

Heater


     1        38.80        2891        112,000  

Ventilation Crew Labor


     2        63.00        8760        1,100,000  

Getman A64 (Scissor deck)


     1        46.58        7884        367,000  


Total


   $ 3,000,000  


Source: WSP, 2026

Notes:


  1.

Fan, air door and mobile equipment maintenance hourly OPEX sourced from CostMine (Costmine Intelligence, 2024). Hourly labor cost sourced from i-80 actual data.

  2.

Fans and air doors are considered to have 95% availability and operate year-round. Mobile equipment availability is not considered since multiple machines are available.

  3.

Power cost given by i-80 Gold was US$0.08/kWh.

  4.

Values may not add exactly due to rounding.


September 2026


SRK Consulting (U.S.), Inc.

SEC Technical Report Summary – Granite Creek

   Page 300


Conclusions and Recommendations

After conducting a series of Ventsim simulations, WSP concluded that ventilation at the Granite Creek property can be improved through the following measures: the installation of a 10.5-ft finished diameter raise from surface to the 4600 level, followed by a drift to bypass adverse ground conditions, and the development of an additional 10.5-ft finished diameter raise connecting the 4250 level to the 4200 level. This ventilation configuration is expected to be sufficient for the remainder of the mine life as presented in the i-80 PFS mine plans and the updated schedule provided by i-80 that includes additional reserves. The main capital additions that accompany the raise-bored excavation include another 400-hp fan, the upgrade of the existing fan motor from 250 hp to 400 hp, one 1.8 MBTU propane heater, one 10,000-gallon propane tank, and the necessary electrical components for safe operation of the fan. These items are estimated to have a capital cost of US$15.9 million. Additional investment could be made in enclosed cabs for the equipment items which currently have open cabs, but WSP does not see this as a necessity to comply with MSHA regulations based on the modeling completed. However, i-80 should monitor conditions and implement controls as necessary based on actual results. Additionally, to better control DPM and silica dust exposure, WSP recommends all headings are ventilated directly from the intake raises with the ductwork passing over air doors placed in the crosscuts which connect the decline to the intake raises. This method provides fresh air directly to working faces for an improved working environment.


13.2

Production Rates, Expected Mine Life, Mining Unit Dimensions, and Mining Dilution and Recovery Factors

Mine Stope optimization (MSO) within the Deswik software was used to determine the potentially economically minable material. The variable cut-off was calculated and written into the block model. 15 ft x 15 ft drifts were generated over the deposit at different orientations to generate minable envelopes. Level intervals were set to match the current mine plan. A mine design was generated using the envelopes as guidance. Figure 13-4 shows the minable envelopes and the mine design.


LOGO

Source: SRK, 2026

Figure 13-4: Production Design with MSO Guidance


September 2026


SRK Consulting (U.S.), Inc.

SEC Technical Report Summary – Granite Creek

   Page 301


Level accesses are developed from the decline to access a maximum of five cuts. An attack ramp provides access to the top cut (Cut 1), once the top cut is mined cemented backfill is placed and cured before the next attack ramp is developed to the bottom cut (Cut 2). A curing period of 21 days will be required before mining can occur below. This continues until all the cuts are mined and backfilled. Figure 13-5 shows a schematic of the cut sequence.


LOGO

Source: SRK, 2026

Figure 13-5: Schematic of Cut Mining Sequence

The mining sequence on a level generally follows a retreat sequence. The access drift is developed to the furthest point of the level and retreats to the access. Mining adjacent to backfill requires 24 hours to allow the backfill to cure and prevent blast damage. Figure 13-6 shows the production drift sequencing of a typical level.


September 2026


SRK Consulting (U.S.), Inc.

SEC Technical Report Summary – Granite Creek

   Page 302


LOGO

Source: SRK, 2026

Figure 13-6: Production Mining Sequence

Underground infrastructure includes sumps for dewatering at roughly every 100 vertical ft. Load centers are located on the ramp to provide power to the mining fronts. These cut outs start off as remucks as the decline is being developed and are repurposed after the ramp is complete.

The main maintenance shop is located on surface between the decline and the fresh air portal. A smaller maintenance bay is located underground that stores hoses and consumables. The powder and cap magazine are located underground near the top of the mine. Figure 13-7 shows the location of the shop and powder and cap magazine.


September 2026


SRK Consulting (U.S.), Inc.

SEC Technical Report Summary – Granite Creek

   Page 303


LOGO

Source: SRK, 2026

Figure 13-7: Underground Infrastructure Location

A muck bay is placed at the entrance to each production pod and serves all the cuts within the pod. Trucks are loaded on the decline.

The cemented waste rock backfill plant is located on surface. The backfill material is loaded onto trucks at the plant and hauled to the drift requiring backfill. Backfill is tight filled and allowed to cure.

The Granite Creek design resulted in 2.39 Mst at an average Au grade of 0.23 oz / st. Figure 13-8 shows the mine design colored by activity type.


September 2026


SRK Consulting (U.S.), Inc.

SEC Technical Report Summary – Granite Creek

   Page 304


LOGO

Source: SRK, 2026

Figure 13-8: Granite Creek Mine Design Looking Northwest

The production schedule is based on the mine design and Mineral Reserves discussed in Section 12. Productivity rates were generated based on actual footage achieved by contractors at the mine as well as geotechnical inputs on ground quality.

The productivity rates used for mine scheduling are based on the ground type defined in Section 13.1 for the top cuts and a constant rate for the undercuts, as they are mined under backfill. They are shown in Table 13-12.

Table 13-12: Productivity Rates


Activity Type


Ground Type

   Rate1      Units  

Capital Development

   Type I      9.0        ft/d  
   Type II      8.0        ft/d  
   Type III      4.0        ft/d  

Production

   Type I      7.0        ft/d  
   Type II      6.0        ft/d  
   Type III      4.0        ft/d  
   Undercut      9.0        ft/d  

Vertical Development

   —       5.0        ft/d  

Backfill

   —       600        st/d  

Source: WSP, 2026


  (1)

All rates are per face. Multiple areas/faces are mined together to generate the production schedule.

General schedule parameters applicable to all underground mining activities are presented in Table 13-13.


September 2026


SRK Consulting (U.S.), Inc.

SEC Technical Report Summary – Granite Creek

   Page 305


Table 13-13: Schedule Parameters for Underground Mining


Schedule Parameters

   Units     Value  

Annual mining days(1)

     days/year       365  

Mining days per week

     days/week       7  

Shifts per day

     shifts/day       2  

Scheduled shift length

     hrs/shift       12  

Scheduled Deductions


Line-Up and Safety Talk

     hrs/shift       0.25  

Travel - In

     hrs/shift       0.25  

Pre-Op Checks

     hrs/shift       0.25  

Lunch/Breaks (travel to lunchroom)

     hrs/shift       1.00  

Wash and grease at end of shift

     hrs/shift       1.00  

Operator unavailable and other interference

     hrs/shift       0.25  

Vehicle loading/Pick-up Area

     hrs/shift       0.08  

Travel - Out

     hrs/shift       0.25  

Total Non-Operating Time

     hrs/shift       3.33  

Total Operating Time

     hrs/shift       8.67  

Utilization of shift time

         72

Source: WSP, 2026

Actual operational mining days are 360. For simplicity the schedule has been completed assuming 365 days, with pro-rated productivity rates.

The production and development schedules were completed using Deswik software. The mining operation schedule is based on 365 days per year, seven days per week, with two twelve-hour shifts each day. The production schedule continues with the current production target of 544.3 t (600 st)/d of ore and ramps up to 907.2 t (1,000 st)/d in 2028 as the SPZ is developed and headings become available.

Granite Creek has an 8.3-year projected mine life, from 2026 to 2034. Table 13-14 and Figure 13-9 summarize the production schedule.


September 2026


SRK Consulting (U.S.), Inc.

SEC Technical Report Summary – Granite Creek

   Page 306


Table 13-14: Granite Creek Annual Production Schedule


Period


Ore

Tonnes
(kt)


Ore Au

Grade
(g/t)


Au Metal
Content
(oz)


Waste

Tonne
(kt)


Backfill

Tonne
(kt)


Development
Length
(m)

20261    169.56    7.72    42,078    142.22    230.30    5,694
2027    203.65    7.48    48,969    132.82    244.31    6,050
2028    334.96    7.73    83,289    113.71    360.06    7,831
2029    333.23    7.73    82,769    82.44    366.25    7,215
2030    291.52    8.08    75,718    62.50    367.69    6,115
2031    339.27    7.89    86,084    66.07    378.97    6,993
2032    273.97    8.04    70,800    32.35    355.58    5,218
2033    175.89    8.09    45,768    11.43    225.79    3,160
2034    50.16    9.20    14,835    3.36    64.31    902


Total

   2,172.20    7.88    550,311    646.90    2,593.26    49,178


Source: WSP, 2026

Last 8 months of 2026.


LOGO

Source: WSP, 2026

Last 8 months of 2026.

Figure 13-9: Granite Creek Annual Production Schedule

Mine development drift and raise dimensions are described in Section 13.3. Mining dilution and mining recovery factors, and the methodology used to derive them, are described in Section 12.1; a 10% external dilution (at zero grade) and 100% stope and development recovery were applied.

Dilution, Ore Loss & Grade Control

The ore control geologist targets viewing each active heading once per shift. The geologist takes a photo of the face and makes notes.


September 2026


SRK Consulting (U.S.), Inc.

SEC Technical Report Summary – Granite Creek

   Page 307


Muck samples are collected by haul truck drivers at the windrow. Development headings receive one sample per round and are automatically shipped as waste unless otherwise directed by the geologist. For ore headings, a sample is collected at the rate of roughly one sample per two trucks. The driver uses a hand-held sample scoop to fill a sample bag half full (five to ten pounds), walking along the windrow and taking a scoop every 2 m (5 ft), making sure to collect both coarse and fine material. Sample bags have a tag with duplicate bar codes separated by a perforation. The perforated portion of the tag includes space to handwrite sample source information including mine level, heading ID and distance, date and shift. The haul truck driver places completed sample bags in a designated location near the mine office trailer. The ore control geologist collects the samples accumulated from the previous day and night shifts and uses the sample tag information to generate a sample submittal for the laboratory and fill the information to the ore control database. The ore control geologist inserts QA/QC samples into the sample stream. A contract driver transports muck samples, Over the Road (OTR) truck samples as well as any drill samples to the Lone Tree laboratory once per day.

The Lone Tree lab analyzes samples for Au grade by fire assay and cyanide absorption, sulfide %, TOC, CO3, and preg-rob potential. The results are used to characterize each round as oxide or autoclave refractory, high grade or low grade, or waste. Assays must be approved by the database administrator before the ore control geologist can enter assay results in the ore control database and flag windrows for routing. The geologist ties color coded flagging associated with the assessed ore type to a lath at the end of the windrow. The windrow can then be moved to the stockpile corresponding to its ore type. The process typically takes three days from mine face mucking to ore type determination and flagging.

High grade oxide and sulfide ores are screened to 3 inches at the stockpile. The minus 3-inch portion is loaded for shipment to the appropriate ore processing location (autoclave or oxide mill). Screened oversize oxide material is placed in the low-grade oxide stockpile, which is shipped to the heap leach facility on a low priority basis. Oversized sulfide material is transferred to long term on-site low-grade sulfide stockpiles and is not shipped.

Ore is shipped to processing facilities using contract OTR trucks. The truck driver receives a ticket number at the security gate and gives the ticket number to the loader operator at the stockpile. The loader operator loads the first bucket, then spills a small portion of every other bucket into a small sample pile on the ground during the loading process. Once the loaded truck departs, the loader operator collects a sample from the sample pile and labels the bag with an ID associated with the truck ticket number. Sample bags are waterproof to preserve moisture content. The loader operator places the samples at the designated sample location at the end of the shift, where they are collected by the ore control geologist who prepares a laboratory sample submittal and enters the sample information into acQuire. Trucks are weighed near the security gate when departing the mine, and security personnel email a report of truck tons and ticket numbers at the end of the shift.


13.3

Requirements for Stripping, Underground Development, and Backfilling

Stripping

Not applicable. Granite Creek is an underground operation; underground access is via the existing Granite Creek open pit and a decline (see Section 13.1), and no additional pit stripping is required to support underground production.


September 2026


SRK Consulting (U.S.), Inc.

SEC Technical Report Summary – Granite Creek

   Page 308


Underground Development

Capital development is sized 15 ft x 15 ft with an arched back and includes the decline, sumps, ventilation drifts and mine load center. The decline gradient averages 14%. Development avoids the main structures where possible. Where it intersects the faults, adequate ground support is used.

Operating development includes attack ramps to access the level, muck bays, production drifts and internal accesses to connect different pods. The production drifts are 15 ft x 15 ft with a flat back, while all other development is 15 ft x 15 ft with an arched back. A 15 m (50 ft) offset between the production drift and a turn is maintained to allow for proper mucking and backfilling by the LHD.

Fresh air raises are 3.2 m (10.5 ft) in diameter and are developed using a raise bore machine. A drill and blast drop raise method is used for raises less than 30 m (100 ft).

All capital and operating development are performed by contractors.

Backfilling

The mine production sequence includes the use of CRF to fill the voids left by the production drift. As the mining method is underhand drift and fill, the CRF needs to have adequate strength to provide a stable roof to work under. A higher strength CRF with 7% cement is used to fill the drifts. For the life of mine, 2.86 Mst of backfill is required.

CRF is produced at the surface plant and hauled underground to the drifts using trucks. A modified LHD with an extended boom and push plate attached to the end is used to tight fill the drift. Backfill aggregate is sourced from waste rock mined in the CX West open pit.


13.4

Required Mining Equipment Fleet and Machinery, and Personnel

Material Handling System

The mine plan assumes 10 t (11.0 st) LHDs will muck the ore from the production face to the muck bay located near the level access. From the level access, 30 t (33.1 st) trucks are loaded and then hauled up the decline. Waste rock will be handled similarly and hauled to surface. The material haulage distances and cycle times were calculated using the haulage profile in Deswik. It is assumed that the trucks will return with backfill.

The one-way haul distance for the waste material increases as the mine gets deeper and averages 2,667 m (8,750 ft) over the life of the mine. The ore haulage distance averages 2,713 m (8,900 ft) over the life of the mine. Average roundtrip cycle times for waste and ore material is one hour.

Equipment & Fleet – Contract Mining

The mobile equipment fleet will consist of diesel vehicles provided by the contractor. The estimate assumes equipment availabilities of 80% to 85%, a job efficiency factor of 83% (50 minute hour), and an activity efficiency factor that varies by activity.

The owner equipment will include pickup trucks for staff and a core drill for definition drilling.

Table 13-15 summarizes the mobile equipment required throughout the mine life.


September 2026


SRK Consulting (U.S.), Inc.

SEC Technical Report Summary – Granite Creek

   Page 309


Table 13-15: Mobile Equipment Fleet


Equipment Type

   Number
Required
 

2 Boom Jumbo

     3  

Bolter with Screen Handler

     6  

10 t Development LHD

     4  

Emulsion Loader

     3  

30 t Truck w/ Push Box

     8  

Scissor Lift

     1  

Multi-Lift

     1  

Boom Truck

     1  

Fuel Lube Truck

     1  

Grader

     1  

Shotcrete Truck

     1  

Transmixer Truck

     1  

Personnel Carrier

     2  

UG Forklift

     1  

Diamond Drill

     1  

4 x 4 Utility Vehicle

     5  

4 x 4 ATV

     3  

Mine Rescue Vehicle

     1  


Total Equipment

      44  


Source: WSP, 2026

Manpower & Operations – Contractor Model

Labor levels are estimated based on the production schedule and equipment needs. Development and production are performed by contractors. Staff labor includes both the mine technical staff from owner and the contractor. Mine technical staff will work 4 @ 10-hour shifts per week. Operations will work twelve hours per shift, two shifts per day and seven days per week.

The mine manpower required is shown in Table 13-16. This assumes a two to four crew rotation for operations and maintenance.


September 2026


SRK Consulting (U.S.), Inc.

SEC Technical Report Summary – Granite Creek

   Page 310


Table 13-16: Granite Creek Manpower


Labor Category


Position


Staffing

Technical Staff
Staff    UG Mine Manager    1
Staff    UG Mine General Foreman    1
Staff    Senior Mining Engineer    1
Staff    Short Term Planning Engineer    1
Staff    Geotechnical Engineer    1
Staff    Senior Mine Geologist    1
Staff    Mine Geologist    3
Staff    Surveyors    2
Staff    Administrative Assistant    1
Staff    Safety    1
Technical Staff Subtotal    13
Operation
Hourly    Lead Development Miner (jumbo)    5
Hourly    Development Miner (bolter)    9
Hourly    Blaster    5
Hourly    Development Helper (Services)    1
Hourly    LHD Operator    6
Hourly    Truck Operator    13
Hourly    Shotcrete/Transmixer Operator    7
Hourly    Lead Construction Miner    2
Hourly    Construction Miner    2
Hourly    General Laborer    4
Operation Subtotal    54
Maintenance
Staff    Maintenance Superintendent    1
Staff    Maintenance Planner    1
Hourly    Shop Supervisor    1
Hourly    Mechanic    5
Hourly    Electrician    2
Hourly    Instrumentation    2
Hourly    Welder    2
Hourly    Mechanic Helper    2
Hourly    Electrician Helper    2
Maintenance Subtotal    18
Mine Total Manpower    85

Source: WSP, 2026


13.5

Final Mine Outline Map

Figure 13-10 shows the final mine outline map.


September 2026


SRK Consulting (U.S.), Inc.

SEC Technical Report Summary – Granite Creek

   Page 311


LOGO

Source: WSP, 2026

Figure 13-10: Final Mine Outline Map


September 2026


SRK Consulting (U.S.), Inc.

SEC Technical Report Summary – Granite Creek

   Page 312


14

Processing and Recovery Methods

This section describes the methods by which ore from the Granite Creek Project is processed and gold is recovered. These methods include whole ore pressure oxidation via the Lone Tree facility or a third-party facility.


14.1

Lone Tree Facility Historical Processing

The Lone Tree Mine is located immediately adjacent to US Interstate 80 (i-80), approximately 19 km (12 miles) west of Battle Mountain, NV, 80 km (50 miles) east of Winnemucca, NV, and 193 km (120 miles) west of Elko, NV. Mining commenced at Lone Tree in April 1991 with the first gold pour in August 1991. In 1993, a POX circuit was added to the facility, which included a SAG / ball mill circuit, followed by a thickening circuit, the POX process for refractory gold ores, and finally CIL, carbon stripping, and refining.

In 1997, a 4,500-tpd flotation plant was constructed to make concentrate to supplement the whole ore feed to the POX circuit. Excess concentrate was shipped to Newmont’s (now NGM) Twin Creeks POX plant or Carlin roaster. The Lone Tree processing facilities were shut down at the end of 2007. Since that time, the mills have been rotated on a regular basis to lubricate the bearings. In general, the facility is still in place with most of the equipment sitting idle.

The objective of i-80 Gold Corp is to refurbish and restart the POX circuit and associated unit operations, including the existing oxygen plant, to similar conditions as it was operating before the shutdown, while meeting all new regulatory requirements. The flotation circuit is not being considered for restart. The POX circuit will have capability to operate under either acidic or basic conditions but is initially anticipated to be operated in an acidic environment.

In order to restart the process plant, new environmental regulations must be met limiting allowable mercury emissions. In February 2011, the NDEP and the EPA brought about new standards to limit mercury emissions to 127 lb of mercury for every million tons of ore processed. In order to meet this requirement, the Lone Tree Facility will require several modifications. In 2022 and 2023 a number of multidiscipline site inspections were completed to assess the current facility condition and develop the requirements for the restart plan.


14.2

Lone Tree Facility Process Description

An overall process flow diagram for the Lone Tree Facility is shown in Figure 14-1. The process flow sheet includes the following major processing areas:


Ore reclaim, grinding, and thickening and acidulation


Pressure oxidation


POX off-gas Treatment and quench water loop


Neutralization, carbon-in-leach, and cyanide destruction


Tailings thickening and filtration


Acid wash, carbon stripping, and carbon regeneration


Electrowinning and refinery


Plant and instrument air


Oxygen plant


Reagent preparation and storage


September 2026


SRK Consulting (U.S.), Inc.

SEC Technical Report Summary – Granite Creek

   Page 313


Process and plant services cooling towers


Water distribution


Steam generating plant and propane storage


September 2026


SRK Consulting (U.S.), Inc.

SEC Technical Report Summary – Granite Creek

   Page 314


LOGO

Source: i-80 Gold, 2025

Figure 14-1: Overall Process Flow Diagram for the Lone Tree Facility


September 2026


SRK Consulting (U.S.), Inc.

NI 43-101 Technical Report – Granite Creek

   Page 315


14.2.1

Key Process Design Criteria

The Lone Tree POX Facility restart will have minimal changes made from the 1993 process design criteria (PDC). A new PDC was developed based on the expected production sources as defined byi-80.

Key process design criteria are summarized in Table 14-1.

Table 14-1: Summary of Key Process Statistics


Criteria


Units


Value

Annual Mill Throughput

   tonnes (tons)    827,806 (912,500)

Daily Throughput (per calendar day)

   tonnes (tons)    2,268 (2,500)

Operating Throughput of Ore to Autoclave Circuit

   mtph (stph)    111.2 (122.5)

Grinding Circuit Product Size, P80

   µm (US mesh)    74 (200)

Operating Time / Availability

   %    85

Design Sulfur Treatment Rate

   mtph (stph)    2.4 (2.7)

Gold Recovery

   %    Varies

Silver Recovery

   %    Varies

Source: i-80, 2026

The feed to the Lone Tree autoclave will consist of material from the various mines. The design scenarios showing the feed chemistry and grades are shown in Table 14-2.

Table 14-2: Design Scenarios for Lone Tree Autoclave Feed


Design Scenario

   Unit     

Case 2


Case 4


Case 6


Case 8


Case 10

Blend

      100% Granite Creek    100% Ruby Hill    100% Cove   

20% GC

40% RH

40% Cove


60% RH

40% Cove

Sulfide Sulfur

     %      1.12    1.88    1.13    1.43    1.58

Carbonate

     %      11.09    15.92    9.21    12.27    13.24

Organic Carbon

     %      0.60    0.15    0.47    0.36    0.28

Gold Grade

     g/t      11.3    5.83    11.3    9.26    7.89

Source: i-80, 2026

Specific to the Granite Creek Project, dependent on the characteristics of the ore, gold recovery is expected to vary over the life of the mine. LOM average of refractory ore via pressure oxidation is expected to be 87.5%, with a range of 78.8% to 94.0%. The dependency of this recovery is discussed in Section 13.


14.2.2

Ore Reclaim

The purpose of the ore reclaim area is to store and reclaim ore for processing, which has been shipped to the Lone Tree processing facility via highway trucks.

ROM ore will be delivered to the ore stockpile area. Production from various mining locations, specifically Granite Creek, Cove, and Ruby Hill, will be dumped at designated locations within the storage area and blended into facility feed stockpiles.

The stockpile will be sited to the north of existing plant buildings in an area of existing disturbance. The stockpile will include a lined base graded to drain to a geomembrane lined collection pond in order to convey and contain precipitation that falls on the stockpile area. The collection pond is sized to contain run-off produced from the stockpile area during a 100-year / 24-hour storm event.


September 2026


SRK Consulting (U.S.), Inc.

NI 43-101 Technical Report – Granite Creek

   Page 316


Ore will be hauled to the site and placed on the stockpile using conventional over-the-road tractor trailers. A front-end loader will be used to consolidate the trailer dumped piles of ore, and to transfer ore from the stockpile to an existing feeder hopper located at the south end of the stockpile.

The stockpile area has been sized to provide capacity for approximately 154,000 tonnes(170,000 tons) of ore to accommodate the shipment of ore to site and provide allowance for necessary blending.

A layout diagram of the area is shown in Figure 14-2.


LOGO

Source: i-80 Gold, 2026

Figure 14-2: Ore Stockpile Area Layout Diagram

Additionally, the reclaim area is utilized for feed blending for the Lone Tree POX circuit. This blending will be used to manage sulfide sulfur concentrations, gold grades, and carbonate grades feeding the autoclave to ensure stable circuit operation within the design criteria for the plant.


14.2.3

Grinding

The purpose of the grinding area is to reduce the ROM ore particle size to support target sulfide oxidation kinetics within the autoclave resulting in increased gold recovery. The ROM feed particle size distribution will be sufficient to direct feed the ore to the grinding circuit without the need for pre-crushing. The grinding area contains a SAG and ball mill circuit to produce the required grind size. The


September 2026


SRK Consulting (U.S.), Inc.

NI 43-101 Technical Report – Granite Creek

   Page 317


SAG mill is fed via a conveyor from the dump hopper. The SAG mill discharges over a vibrating screen with oversize returned to the SAG mill feed conveyor. Vibrating screen undersize discharges into the cyclone feed pump box together with ball mill discharge. The slurry is then pumped to the cyclones with the cyclone underflow gravitating to the ball mill and the cyclone overflow is directed to the POX feed thickening circuit.


14.2.4

Thickening and Acidulation

The purpose of the thickening area is to prepare the slurry for autoclave processing by densifying the product of the grinding circuit to improve storage capacity of the downstream slurry storage tanks, improve the autoclave heat balance by reducing the water transferred to the autoclave, and improve the solids flow through the autoclave feed pumps. The thickened slurry is acidified in two acidulation tanks with sulfuric acid to reduce the carbonate content in the autoclave feed to target a ratio of 1.1:1 carbonate-to-sulfide sulfur ratio. The acidulation tanks double as feed storage tanks to provide a combined storage capacity of 12 hours.

The storage tanks ensure continuous feed to the autoclave plant, unaffected by upstream throughput variations.


14.2.5

Pressure Oxidation

The POX autoclave circuit includes the slurry pre-heaters, autoclave feed, autoclave, pressure let down vessels (flash system) and the POX ancillary services: autoclave agitator seal system, oxygen supply, high pressure cooling water, and high-pressure steam. The Lone Tree Facility restart expects the autoclave to operate under acidic conditions.

Slurry Heaters

The purpose of the slurry heaters is to capture excess energy discharged from the autoclave and pre-heat the feed slurry prior to the autoclave process thereby reducing the total energy input required to operate the autoclave. The heating is achieved in two stages consisting of a series of two refractory lined counter-current splash slurry heater vessels.

The heat source is flashed steam released from the autoclave discharge slurry during the pressure letdown process. The splash slurry heaters are direct contact heat exchangers that provide a means of heat recovery via steam condensation. This reduces the off-gas load on the downstream off-gas equipment and reduces the required input steam from the steam boiler.

Autoclave Feed

The purpose of the autoclave feed area is to increase the pressure of the pre-heated slurry above the autoclave operating pressure to facilitate transfer into the autoclave at the required pressure using the autoclave feed pumps. These pumps are positive displacement pumps selected for the design temperatures and pressures.


September 2026


SRK Consulting (U.S.), Inc.

NI 43-101 Technical Report – Granite Creek

   Page 318


Autoclave

The purpose of the autoclave is to oxidize the refractory sulfide minerals under acidic conditions to liberate the gold trapped in the sulfide sulfur minerals. The autoclave at Lone Tree is designed to operate at 198°C (389 °F) and 297 PSI(g) with a slurry residence time of 40 to 50 minutes and consists of four compartments. The design expects up to 97% cumulative sulfide sulfur oxidation through the autoclave. High purity oxygen is introduced to all four compartments of the autoclave at controlled rates. Due to the low sulfur grades, steam is required to be continuously fed to the first compartment of the autoclave to maintain the kinetically required oxidation temperature. The addition of oxygen and steam support the required oxidation rates to achieve the target sulfide sulfur oxidation. The autoclave slurry is discharged through a level control choke valve and is fed to the high-pressure flash vessel in the pressure letdown system.

Flash System

The purpose of the flash system is to reduce the pressure and temperature of the autoclave discharge slurry, making it suitable for subsequent unit operations downstream. The oxidized slurry undergoes a controlled pressure and temperature reduction process as it passes through two stages of flash vessels located downstream of the last autoclave compartment. The flash steam is recycled upstream to preheat the autoclave feed slurry in Section 17.2.5.

Slurry Coolers

The purpose of the slurry coolers is to reduce the temperature of the incoming slurry from the low-pressure flash vessel to prepare it for the downstream neutralization and CIL circuits through a series of six water-cooled shell and tube heat exchangers.


14.2.6

POX Off-Gas Treatment

The purpose of the POX off-gas treatment area is to effectively eliminate particulate matter present in the POX vent stream, while simultaneously reducing the temperature and volume of the vent gas through direct contact condensation. The POX off-gas treatment circuit also includes a mercury removal step to minimize autoclave mercury emissions to the environment.

Quench Vessel

The vent streams originating from the autoclave, low temperature and high temperature slurry heaters are directed to the quench vessel. The purpose of the quench process is to reduce the gas load to the venturi scrubber by cooling and condensing the steam from the vent gas stream prior to feeding the scrubber. This process also indirectly aids in removing entrained particulate droplets and contaminants. Non-condensed vapor and gases discharge from the top of the vessel and are fed to the Venturi Scrubber. Condensed solutions are directed to the quench water circuit.

Venturi Scrubber

The Venturi scrubber acts as the final stage of particulate gas cleaning prior to the mercury abatement carbon beds. Water containing removed particulates is directed to the quench water circuit.

Emergency Relief Vessel

The purpose of the emergency relief vessel is to serve as an engineered discharge point for effectively managing relief events in the autoclave and the off-gas circuit. Excess pressure beyond vessel Maximum Allowable Working Pressures (MAWP) within the system can occur due to loss of quench water, high pressure conditions in the autoclave, or elevated pressure levels in the high-pressure flash vessel.


September 2026


SRK Consulting (U.S.), Inc.

NI 43-101 Technical Report – Granite Creek

   Page 319


The vessel mitigates the consequences of an emergency release by separating any potential slurry carryover from the gaseous emissions and reducing the velocity of the vent gas before it discharges to atmosphere. The gaseous emissions are discharged outside at the top of the POX mercury abatement structure. The collected solution in the relief vessel is directed to the neutralization area sump pump, which transfers it to the neutralization distributor tank.

POX Mercury Abatement

The purpose of POX mercury abatement system is to remove mercury and volatile organic compounds (VOC’s) from the POX vent gas via adsorption on to activated carbon before the final discharge to the atmosphere.

Quench Water

Heated quench water and condensed steam in the POX off-gas circuit is collected, cooled, and reused within the POX off-gas circuit. The quench water tank collects solutions from the quench vessel and Venturi scrubber, and discharges to the quench water clarifier for entrained solids separation. The clarified solution is cooled via three cooling towers prior to being recirculated to the quench vessel. Excess cooling solution created from condensing vapors in the off gas is bled from the circuit to the mill water tank. The separated solids from the clarifier underflow are pumped to the neutralization circuit where they rejoin with the cooled autoclave discharge slurry.

Cooling Towers

The purpose of the cooling area is to reject heat absorbed within the process to the atmosphere. The solution cooling area includes the process service cooling circuit and the plant service cooling circuit. The process cooling circuit rejects the heat from the autoclave cooling circuit and the elution circuit heat exchangers. The plant service cooling circuit provides trim heat rejection from various equipment support systems throughout the plant. Standard treatment of the cooling water is performed with biocide and corrosion inhibitor.


14.2.7

Neutralization

The purpose of the neutralization circuit is to neutralize all free acid in the slurry, precipitate the heavy metals as their hydroxides, and raise the pH to approximately 10.5 to ensure cyanide stability in the carbon-in-leach circuit for personnel safety and process optimization. The neutralization circuit, comprised of a distributor and three tanks, is dosed with lime slurry to raise the pH of the autoclave discharge slurry. Sparged oxygen converts ferrous iron to ferric iron, reducing downstream cyanide consumption. The neutralized slurry from this circuit is then fed to the CIL circuit for gold recovery.


14.2.8

Carbon-in-Leach

The purpose of the CIL circuit is to leach and extract gold and silver from the oxidized and neutralized slurry using cyanidation and carbon adsorption. The CIL circuit provides retention time of 22 to 24 hours. The CIL circuit consists of six mechanically agitated tanks arranged in series. The agitators prevent solids settlement and maximize contact time with cyanide and activated carbon to improve gold and silver recovery. Oxygen (as opposed to air) is sparged into each tank to maximize the rate of gold dissolution. Each tank is fitted with a carbon retention screen to keep activated carbon with each tank while allowing slurry to flow to the next tank. Slurry and carbon are pumped upstream through the


September 2026


SRK Consulting (U.S.), Inc.

NI 43-101 Technical Report – Granite Creek

   Page 320


circuit to provide counter current flow of the carbon relative to the slurry flow. Loaded carbon from the first CIL tank is pumped to an elution circuit for carbon stripping and regeneration. Stripped, regenerated and sized barren carbon is fed to the last tank of the CIL circuit. The leached slurry is transferred from CIL to the cyanide destruction circuit.


14.2.9

Carbon Elution and Regeneration

The purpose of the elution circuit is to elute precious metals from the loaded carbon and transfer the resulting solution of high gold concentration (pregnant eluate) to the refinery to produce doré. Barren carbon is thermally regenerated prior to addition to the CIL circuit.

Carbon Acid Wash

The purpose of acid wash is to rinse the loaded carbon from CIL with dilute nitric acid solution prior to the carbon stripping process. Carbonate scale builds up on the activated carbon during the CIL process and fouls the carbon’s adsorption properties by depositing a layer of scale. If left intact, over time the scale will limit the adsorption capacity of the carbon and will cause softening of the carbon in the regeneration kiln. The loaded carbon from CIL is first treated within the carbon acid wash vessel prior to treatment within the carbon stripping vessel.

Carbon Stripping

The purpose of the carbon strip circuit is to strip the acid washed loaded carbon of the adsorbed gold using a Pressure ZADRA Strip scheme at 149°C (300°F) and 414 kPag (60 psig). Pressure ZADRA strip uses several bed volumes of a recirculated solution to strip the precious metals off the loaded carbon. The cyanide solution is buffered by caustic to assist with gold elution. The stripped carbon is then sent to carbon regeneration circuits. The resulting pregnant eluate is processed in the electrowinning circuit.

Elution Mercury Abatement

The purpose of elution mercury abatement system is to condition the off-gas leaving the pregnant and barren solution tanks to remove fine particulate, solution aerosols, and condensed and gas phase mercury using absorption on to a new carbon bed.

Carbon Regeneration

The purpose of the carbon regeneration circuit is to restore the activated carbon’s ability to recover gold from the cyanidation circuit solutions. The circuit also permits the introduction of new carbon to the process and removes carbon fines from the process.

As carbon is used in the CIL and elution circuits, the surface and internal pore structure becomes contaminated with organic species. The organics foul the carbon, slow the gold adsorption rate, and decrease the gold loading capacity of the carbon. The carbon reactivation electric kiln is a horizontal rotary kiln that heats the carbon in an inert atmosphere at 750°C (1400°F) and is specifically designed to remove the organic fouling and regenerate the carbon to an active state where it can be used again to adsorb leached gold in the CIL circuit. The rotary kiln operates continuously until a batch of carbon is processed.


September 2026


SRK Consulting (U.S.), Inc.

NI 43-101 Technical Report – Granite Creek

   Page 321


Carbon Fines Handling

Carbon fines that are too small to be mechanically separated from the slurry in the CIL circuit, and would lead to precious metal losses, are collected and transferred by gravity from the reactivated carbon vibrating screen, carbon reactivation feed vibrating screen, kiln feed hopper, and carbon reactivation electric kiln. The carbon fines are dewatered in a filter press and discharged into supersacks for external sale.

Refinery

The purpose of the refinery circuit is to recover concentrated gold from cyanide solutions via electrowinning (EW) and produce doré bars.

Electrowinning

The EW circuit recovers gold from the pregnant eluate by applying a voltage across cathodes and anodes in cells. Pregnant eluate is pumped through three EW cells to electrowin the gold and silver, along with other contaminants, into a sludge that plates onto the cathode mesh material. The plated sludge is manually washed from the cathodes and then melted and refined. Cathodes are made from stainless steel mesh, and anodes are stainless steel punch plate.

Refining

The refining process is to produce doré bars by smelting retorted sludge mixed with fluxes. The fluxes form a slag to which contaminates report to.

The sludge from the EW cells is first processed in a mercury retort oven to dry the sludge and remove the co-captured mercury from the precious metal recovery steps. The retorted gold sludge is then processed in a melt furnace to remove contaminants through slag and produce the final doré bars that are processed by third party refineries for sale.


14.2.10

Cyanide Destruction

The purpose of the cyanide destruction (CND) circuit is to effectively reduce the concentration of cyanide in the final tail discharge and the recycled process water to ensure compliance with predefined environmental standards and regulations. CND also improves the safety of the operation by reducing cyanide concentrations outside the CIL and elution circuits. The CND circuit targets a specific concentration limit of 2.5 mg/L of residual weak acid-dissociable (CNWAD) cyanide. This reduction is accomplished through the application of the SO2/air cyanide destruction process using oxygen in a series of two tanks, which oxidizes the cyanide (to cyanate) to meet the required concentration level. The cyanide destruction circuit is fed directly from the slurry discharge of the CIL circuit.


14.2.11

Tailings Management

The purpose of the tailings circuit is to increase the density of the detoxified tailings to aid with dry stacking of tailings residue. Additionally, this circuit produces process water for internal use within the facility. The tailings circuit consists of a thickener as a first stage of solids densification. The thickener underflow is fed to a tailings filtration circuit which dewaters the tailings sufficiently to support tailings dry stacking. The de-watered tailings from the filter presses are then dry stacked at the tailings storage facility.


September 2026


SRK Consulting (U.S.), Inc.

NI 43-101 Technical Report – Granite Creek

   Page 322


The water removed from the tailings slurry is used as process water within the facility to offset water requirements. Excess process water is processed via a reverse osmosis circuit to provide supplemental permeate, water to offset freshwater requirements.

Tailings Thickening and Overflow Clarification

The purpose of the tailings thickening area is to provide the initial stage of densification and to recycle process water for the facility via thickener overflow using a conventional thickener. Dilute flocculant solution is added to the thickener feed to promote settling and clarify the thickener supernatant. The thickener underflow of 55 to 65 wt.% solids is pumped to a filtration feed tank.

Tailings Filtration

Thickener underflow at 55% to 65% solids by weight is further dewatered via the four horizontal plate and frame tailings filter presses. They are operated in coordinated filtration cycles, two operating and two standbys, to produce a filter cake with a target 15% moisture (17.65% geotechnical moisture). There are two different sizes of filter presses, with the legacy filter presses from the prior operation being repurposed to provide additional filtration capacity, if needed to supplement the newly installed filter presses. The filter cake is collected by a mobile loader and transferred to the filtered tailings facility, the filter press filtrate reports back to the tailings thickener.

Process Water

The tailings thickener overflow tank is the primary process water tank for the facility. The process water is used directly in grinding, CIL, tailings filtration, and reagent make-up areas. Water in excess of that which is needed is treated in the reverse osmosis circuit. In case of process upsets surge water can be directed from the tailings thickener overflow tank to the water surge pond. The pond provides surge capacity and has the ability to discharge to the tailings thickener deaerator tank to be fed back through the thickener if needed for solids removal and the overflow tank for distribution to the other circuits if it does not contain solids.

Reverse Osmosis

The purpose of reverse osmosis (RO) is to treat excess process water to obtain a clean permeate water that can be used as fresh water throughout the facility. The RO circuit comprises pressure filtration, an ultrafiltration system, and an RO system.


14.2.12

Water Distributions

There are eight types of defined water services at Lone Tree:


Fresh water – Is generally used for reagent make-up, and water washing streams.


Gland water (fresh water) – Is used to supply gland water to slurry pumps.


Mill water – (grinding thickener overflow and process water) Is used to provide dilution water within the milling circuit.


Potable water (fresh water) – Is used for safety showers and sanitary uses, generated from a new potable water skid.


Demin water fresh water) – Is primarily used to supply the steam generating plant provided from a demineralization water plant.


September 2026


SRK Consulting (U.S.), Inc.

NI 43-101 Technical Report – Granite Creek

   Page 323


Process water (tailings thickener overflow) – Is used for mill water makeup. Additionally, it feeds the reverse osmosis circuit.


Quench water (condensed steam from autoclave off-gas) – Is used within the POX off-gas circuit as the source of direct cooling water.


Excess water (bleed stream from RO, Demin and Cooling towers) – Is discharged from the main processing facility to the excess water treatment facility (battery limit for restart project).


14.2.13

Reagents

Each set of compatible reagent preparation and storage systems is located within dedicated containment areas to prevent erroneous mixing of reagents. Storage tanks are equipped with level indicators, instrumentation, and alarms to reduce the risk of spills during normal operation. Appropriate ventilation, fire and safety protection, safety shower stations and Safety Data Sheet stations are located throughout the facility.

The required reagents with their estimated consumption rates are as follows:


Ammonium bisulfite (65%) – 2.3 L/t (0.56 gal/ton)


Activated carbon – 0.036 kg/t (0.073 lb/ton)


Cooling tower antiscalant and corrosion inhibitor – 0.017 L/t (0.004 gal/ton)


Biocide – 0.004 L/t (0.001 gal/ton)


Caustic (50%) – 0.17 L/t (0.041 gal/ton)


Copper sulfate – 0.11 kg/t (0.215 lb/ton)


Flocculant – 0.13 kg/t (0.259 lb/ton)


Fuel – 0.23 L/t (0.054 gal/ton)


Glycol – 0.021 L/t (0.005 gal/ton)


Lime – 0.017 kg/t (0.033 lb/ton)


Nitric acid (35%) – 0.13 L/t (0.030 gal/ton)


Phosphate (10%) – 0.004 L/t (0.001 gal/ton)


Sodium cyanide (30%) – 0.32 kg/t (0.63 lb/ton)


Sodium sulfite (10%) – 0.004 L/t (0.001 gal/ton)


Sulfuric acid (93%) – 175 kg/t (350 lb/ton)


Propane – 10.9 L/t (2.61 gal/ton)


14.2.14

Oxygen Plant

High purity oxygen is primarily used for the oxidation of sulfides during the POX process, for iron conversion from ferrous to ferric in the neutralization circuit, and for cyanide to cyanate conversion in cyanide destruction. Furthermore, during cyanidation, the addition of oxygen maximizes the rate of gold dissolution. At Lone Tree, oxygen will be supplied by a vendor owned and operated oxygen plant through a Sale-of-Gas (SOG) contract, of which the vendor is responsible for supply, operation and maintenance of the facility. The oxygen plant is mandated to supply up to 200 stpd of gaseous oxygen at 375 psi(g), delivered to the autoclave, and at reduced pressure to the neutralization tanks, CIL tanks, and cyanide destruction tanks for plant uses. Pressure reduction will be by i-80 Gold for the individual circuits.


September 2026


SRK Consulting (U.S.), Inc.

NI 43-101 Technical Report – Granite Creek

   Page 324


14.2.15

Compressed Air

The Lone Tree facility includes separate instrument and plant air systems to support the facility’s air requirements with excess capacity and redundancy built into the air system design.


14.2.16

Utilities Consumption

The plant consumptions for water and power are provided for the average processing case below and consider the design blend of material to be processed within the Lone Tree Facility for the design life of operation.


14.2.17

Water Consumption

Table 14-3 provides a summary of the water consumption by type for the Lone Tree processing facility.

Table 14-3: Lone Tree Facility Water Consumption by Type


Type

   Consumption
(m3/h)
     Consumption
(gpm)
 

Mill Water

     352        1 550  

Fresh Water

     130        570  

Low Pressure Gland Water

     24        105  

High Pressure Gland Water

     39        170  

Demineralized Water

     25        110  

Potable Water

     3        15  

Source: i-80, 2026

Electrical Power Requirements

The estimated annual electrical energy requirements for the Lone Tree processing facility are summarized by area in Table 14-4. Annual power requirements are 142,090 MWh or 156 kWh/ton based on 85% availability.


September 2026


SRK Consulting (U.S.), Inc.

NI 43-101 Technical Report – Granite Creek

   Page 325


Table 14-4: Lone Tree Facility Energy Usage by Area


Area

   Annual Energy Consumption
(MWh/y)
 

General Plant Wide

     2,250  

Water System

     930  

Potable Water

     240  

Process Water (RO and Process Water Tank)

     4,900  

Ore Reclaim

     770  

Refinery

     2,310  

POX Grinding

     26,920  

POX Grinding Thickening and Acidulation

     1,890  

Neutralization and CIL and Acid Storage

     6,540  

Carbon Stripping

     4,090  

Cyanide Destruction

     690  

Reagents

     2,640  

Plant Air and Propane

     3,310  

POX and POX Utilities

     15,540  

POX Demineralized Water System

     2,660  

Tailings Filtration

     13,690  

Plant Wide Electrical and Instrumentation

     4,000  

ABS and CN Storage

     160  

POX Mercury Abatement

     900  

Quench Water Treatment

     4,020  

Oxygen Plant

     40,090  

Existing Plant Areas

     3,570  


Total

     142,090  


Source: i-80, 2026


14.3

Third-Party Refractory Processing

Prior to the recommissioning of Lone Tree, production designated as refractory will be processed by a third party as part of a toll milling agreement, details of which are provided in Section 19. Material will be transported by over-the-road trucks to the toll processor. The basic processing steps are described in the following sections. A block flow diagram of this process is shown in Figure 14-3.


September 2026


SRK Consulting (U.S.), Inc.

NI 43-101 Technical Report – Granite Creek

   Page 326


LOGO

Source: i-80 Gold, 2026

Figure 14-3: Third-Party Pressure Oxidation Facility Flow Diagram

The pressure oxidation facility at the toll miller consists of SAG milling followed by two-stage ball milling. The final grinding product is 80% passing 200 mesh. The cyclone overflow reports to a thickener. Thickener underflow reports to an acidification circuit where sulfuric acid is added as necessary to ensure adequate autoclave free acid solution levels. The free acid concentration for Turquoise Ridge Complex ore needs to be maintained at >18 g/L. Thickener overflow solution is returned to the milling circuit. After acidulation, ore slurry is added to two identical autoclaves that are operated in parallel. Two stages of flash heat recovery are used. Autoclave discharge is cooled before reporting to the lime neutralization circuit. Autoclave waste gas is cooled and scrubbed before discharging to the atmosphere. Oxide ore and acidic oxidized sulfide ore slurry are combined in the neutralization circuit. After neutralization with the carbonate oxide ore and supplemental lime, the ore slurry reports to a CIL circuit where the ore is leached in cyanide solution to extract the gold. Final tailings slurry is pumped to the tailings area. Tailings settle and decant solution is reclaimed and reused in the grinding circuit. Loaded carbon from the CIL circuit is transferred to the recovery plant. After acid washing to remove inorganic contaminants, the carbon is transferred to the pressure Zadra stripping circuit. Gold is stripped from the carbon using caustic and cyanide solution at elevated temperature and pressure. Pregnant solution from the stripping circuit is pumped to an electrowinning circuit where precious metal is removed from the solution as sludge. The sludge is filtered, dried in a mercury retort, mixed with fluxes, and refined into doré bars. After carbon stripping, the barren carbon reports to the kiln regeneration circuit and returns to the CIL circuit.


September 2026


SRK Consulting (U.S.), Inc.

NI 43-101 Technical Report – Granite Creek

   Page 327


Refractory material from Granite Creek is fed to the autoclave as a proportion of the overall feed blend and processed in monthly batches. The quantity of gold in each batch is determined through net scale truck scale weights, moisture samples and gold assays by both parties. The gold recovery is determined using a bench scale autoclave test and then scaled to the refinery production for that particular month.


September 2026


SRK Consulting (U.S.), Inc.

NI 43-101 Technical Report – Granite Creek

   Page 328


15

Infrastructure


15.1

Summary

Previous operators of the Granite Creek Project constructed a large portion of the infrastructure required to operate the Granite Creek underground mine. This includes:


The connection to the NV Energy grid


5 MW substation


13.8 kV distribution network


Administration building


Dry facilities


Three of the active dewatering wells


Two of the four permitted rapid infiltration basins

Since acquisition of the project, i-80 has added to the existing infrastructure with completion of:


Dewatering well GCW5


Deepening of well BPW5 to 677 m (2,220 ft)


Expansion of the dry facilities to accommodate 176 personnel


Installation of a rental Water Treatment Plant to treat 800 gpm for discharge to the RIB’s

Infrastructure construction in progress includes:


Drilling and completion of dewatering wells GCW14 and GCW15


Construction of a 3,300 gpm water treatment plant


Construction of the two remaining permitted RIBs


Expansion of the contact water handling system and tie it into the water treatment circuit

After completion of the infrastructure construction currently underway, the electrical power distribution, dewatering, water treatment, administrative and related support infrastructure will be adequate to support the planned underground mine operations. The cost to complete infrastructure construction as of June 1, 2026, is US$5.7 million.


15.2

Access and Local Resources

The Granite Creek Mine is located 32 km (20 miles) northeast of Golconda. From Golconda follow NV789 (paved) northeast for approximately 26 km (16 miles) followed by the Getchell Mine Road (unpaved) four miles to the Granite Creek access road. The towns of Winnemucca and Battle Mountain are 27 km (17 miles) west and 61 km (38 miles) east of Golconda respectively via Interstate 80.

Osgood Mining Co. (OMC) provides transportation only for senior level employees. The mine and drilling contractors provide light vehicles for employee transportation. Parking at Granite Creek is available for personal and company vehicles adjacent to the administration building.

Winnemucca and Battle Mountain are both established communities serving the mines and ranches in the surrounding areas. As of the 2020 census, the population of the cities of Winnemucca and Battle Mountain were 8,431 and 3,705, respectively.


September 2026


SRK Consulting (U.S.), Inc.

NI 43-101 Technical Report – Granite Creek

   Page 329


Northern Nevada hosts several operating gold mines that produced a combined 3.5M ounces in 2024. The area is home to a skilled workforce, contractors and suppliers that can fulfill all the needs of Granite Creek.


15.3

Administrative Facilities

OMC offices, dry facilities, warehouse, truck scale and security office are located just off the Getchell Mine Road at the entrance to the property (Figure 15-1). The dry facility is housed in the main administration building and a double wide trailer (Figure 15-2). It can serve a total of 176 OMC and contractor employees. Office space is available to accommodate 25 employees and warehouse area totals 5,000 square feet (ft2) enclosed plus additional yard area. Site security and visitor check-in are provided at the main gate. Security also operates the truck scale where all ore trucks entering and leaving the property are weighed.


LOGO

Source: OMC, 2026

Figure 15-1: Granite Creek Overview


September 2026


SRK Consulting (U.S.), Inc.

NI 43-101 Technical Report – Granite Creek

   Page 330


LOGO

Source: Google Earth, 2026

Figure 15-2: Granite Creek Administration Area


15.4

Dewatering


15.4.1

Dewatering Wells

There are four dewatering wells currently operating at the Project (APW-1, BPW-3, BPW-5 and GCW-6). In total, five wells existed prior to i-80’s purchase of the property in 2021. BPW-2 and BPW-4 were both drilled and tested in 2008 but were never outfitted with permanent pump assemblies due to lower than anticipated production rates and limited effectiveness for underground operations. GCW-6 was drilled in 2022, tested in Q1 2023 and put online Q1 2024. In Q3 2024, BPW-5 was deepened to a total depth of approximately 671 m (2,200 ft), targeting the AP Offset structure for increased hydraulic head depressurization of the planned underground progression. As of Q1 2026, GCW-14 has been drilled and tested and is awaiting completion of GCW-15 in Q2 2026 to allow for accurate sizing of the pump assemblies at both locations (Figure 15-3).

The currently operating wells (APW-1, BPW-3, BPW-5 and GCW-6) are pumping from the CX block hydrogeologic unit at a combined average rate of approximately 1,300 gpm with additional pumping of approximately 1,350 gpm collected from sumps in the underground mine workings. Water is discharged to the Rapid Infiltration Basins (RIBs) on the southeast portion of the mine boundary for infiltration into the downgradient alluvial basin aquifer. A pipeline has been constructed to connect the dewatering circuit to a water treatment circuit, so the water can be treated if required. Currently,


September 2026


SRK Consulting (U.S.), Inc.

NI 43-101 Technical Report – Granite Creek

   Page 331


BPW- 3 (600 gpm) does not require treatment and discharges directly to the RIBs. Approximately200 gpm of BPW-3’s production is routed to the site freshwater supply tank for mining operations, dust suppression and as support for fire suppression. The pump parameters for the dewatering wells are listed in Table 15-1.


September 2026


SRK Consulting (U.S.), Inc.

NI 43-101 Technical Report – Granite Creek

   Page 332


Table 15-1: Granite Creek Active Dewatering Wells


Well Identifier

   Mine Coordinates      Elevation
(ft amsl)
     Casing
Diameter
(inches)
     Well Depth
(ft bgs)
     Static
Water
Level
(ft bgs)
     Screened
Interval
(ft bgs)
     Average
Pumping
Rate
(gpm)
     Pump
Power
(hp)
     Pump
Set-Depth
(ft bgs)
 
   Easting
(ft)
     Northing
(ft)
 

APW-1

     9890.2        10154.3        4722.3        18        620        380       

120 -140
160 -180
200 -600


     210        100        574  

BPW-3

     10188.9        9474.8        5057.1        18        1391        780       

500 -540

580 -620

660 -700

740 -1380


     600        400        1307  

BPW-5

     10387.1        11126.9        5093.9       

18

12


     2222        708       
679 -1380
1400-2222
 
 
     380        200        1290  

GCW-6

     10310.9        11742.9        5153.2        14        2093        742        803 - 2083        110        150        1950  

GCW-14

     11272.8        12953.1        5091.1        14        2178        758        966 - 2168        TBD        TBD        TBD  

GCW-15

     11176.6        12298.1        5086.2        14        TBD        TBD        TBD        TBD        TBD        TBD  

Source: LRE, 2026


September 2026


SRK Consulting (U.S.), Inc.

NI 43-101 Technical Report – Granite Creek

   Page 333


15.4.2

Monitoring Wells and VWPs

Monitoring wells and Vibrating Wire Piezometers (VWP) are used to collect hydrogeological data in support of mining operations. Currently, there are 41 active monitoring wells and 16 active vibrating wire piezometers across 6 locations (Figure 15-3). Construction and recent water level data are provided in Table 15-2.


September 2026


SRK Consulting (U.S.), Inc.

NI 43-101 Technical Report – Granite Creek

   Page 334


LOGO

Source: LRE, 2026

Figure 15-3: Map of Dewatering Wells, Monitoring Wells, Piezometers at Granite Creek


September 2026


SRK Consulting (U.S.), Inc.

NI 43-101 Technical Report – Granite Creek

   Page 335


Table 15-2: Summary of Locations, Construction Information and Water Levels for Dewatering Wells, Monitoring Wells, and Piezometers


Identifier

  Local Mine
Coordinates
    Elevation of
Land Surface
(ft amsl)1
    Year
Completed
    Inclination
(degrees)2
    Open Interval of Well
or VWP Setting
    Geologic
Unit(s)
    Depth
(ft bls)4
    Static Water Level     

Comments

  Easting
(ft)
    Northing
(ft)
    Depth
(ft bls)3
    Elevation
(ft amsl)
    Elevation
(ft amsl)5
    Date
(dd/mm/yyyy)
 

Dewatering Wells

APW-1

    9889.60       10152.60       4722.28       2005       -90       120 to 600       4602 to 4122       Ocl       308.1       4414.18       27/08/2024      CX Pit (active)

BPW-2

    9804.81       10554.13       4762.98       2008       -90       200 to 920       4563 to 3843       Ocl       385.4       4377.58       23/11/2024      CX Pit (inactive)

BPW-3

    10188.94       9474.81       5057.14       2008       -90       500 to 1380       4557 to 3677       Ocl       662.53       4394.61       10/07/2024      South of CX Pit (active)

BPW-4

    10806.54       9132.50       5011.94       2008       -90       540 to 1380       4472 to 3632       Ocl       627.5       4384.44       07/10/2024      South of CX Pit (inactive)

BPW-5

    10387.06       11126.94       5093.90       2008 / 2024       -90       679 to 2222       4415 to 2872       Ocu; Ocl       703.06       4390.84       17/12/2024      Between Mag and CX West Pits (active)

GCW-06

    10310.90       11742.90       5153.20       2022       -90       803 to 2083       4350 to 3070       Ocu; Ocl       1852.3       3300.90       27/12/2024      Between Mag and CX Pits (active); deepened 2025

GCW-14

    11272.8       12953.1       5091.1       2025       -90       966 to 2166       4195 to 2295       Ocu, Ocl       747.57       4343.5       1/30/2027      North of Mag Pit (Inactive) 14 inch diameter casing

GCW-15

    11176.6       12298.1       5086.2       TBD       TBD       TBD       TBD       Ocu, Ocl       TBD       TBD       TBD      North of Mag Pit (Inactive) 14-inch diameter casing. Currently drilling

Water Supply Wells

WW-7

    15630.88       10407.68       4787.39       1984       -90       230 to 420       4557 to 4367       Qal       232.82       4554.57       6/30/2003      E of county road (inactive); 12-inch diameter casing; no sounding port for
water level measurement; alternate identifier PW7; owned by NGM

WW-8

    15141.92       8899.17       4756.11       1987       -90       210 to 560       4546 to 4196       Qal       190       4566.11       31/08/2000      East side of county road (inactive); no sounding port for manual DTW

VWPsa

iGS22-17

    11081.00       11264.70       4830.70       2022       —        —        —        Ocu            Mag Pit (active)

iGS22-17D_4188

    10801.60       11478.90       —        2022       -62       736       4188       Ocu       —        —        —      

iGS22-17C_3735

    10588.50       11598.00       —        2022       -62       1250       3735       Ocl       —        —        —      

iGS22-17B_3391

    10428.30       11688.90       —        2022       -62       1640       3391       Ocl       —        —        —      

iGS22-17A_3233

    10354.60       11732.70       —        2022       -62       1820       3233       Ocl       —        —        —      

iGS22-25

    10411.80       11448.50       5104.00       2022       —        —        —        Ocu            Between Mag and CX Pit (active)

iGS22-25D_4281

    10081.30       11747.90       —        2022       -63       937       4281       Ocl       —        —        —      

iGS22-25C_4190

    10049.50       11779.40       —        2022       -64       1038       4190       Ocl       —        —        —      

iGS22-25B_4077

    10010.20       11819.40       —        2022       -63       1164       4077       Ocl       —        —        —      

iGS22-25A_3978

    9975.60       11855.50       —        2022       -63       1275       3978       Ocl       —        —        —      

iGS22-26

    11247.10       12508.00       5092.00       2022       —        —        —        Qal            North of Mag Pit (active)

iGS22-26D_4199

    11147.30       12590.70       —        2022       -83       902       4199       Ocu       —        —        —      

iGS22-26C_3983

    11124.00       12609.50       —        2022       -82       1120       3983       Ocu       —        —        —      

iGS22-26B_3635

    11087.10       12638.80       —        2022       -82       1472       3635       Ocu       —        —        —      

iGS22-26A_3384

    11061.10       12659.10       —        2022       -80       1725       3384       Ocl       —        —        —      

iGS23-10A

    11005.50       12407.30       5111.00       2023       —        —        —        Ocu            North of Mag Pit (active)

iGS23-10A_4412

    10935.20       12481.40       —        2023       -81       707       4412       Ocu       —        —        —      

iGS23-10A_3861

    10857.40       12517.30       —        2023       -81       1264       3861       Ocu       —        —        —      

iGS23-10A_3700

    10830.50       12526.90       —        2023       -81       1428       3700       Ocu       —        —        —      

iGS23-10A_3579

    10811.70       12533.50       —        2023       -81       1552       3579       Ocl       —        —        —      

iGS23-02A

    11091.40       11430.30       4826.60       2023       —        —        —        Ocu            Mag Pit (active)

iGS23-02A_4128

    10792.40       11906.90       —        2023       -52       898       4128       Ocu       —        —        —      

iGS23-02A_3747

    10634.20       12132.80       —        2023       -52       1371       3747       Ocu       —        —        —      

iGS23-02A_3641

    10592.10       12195.10       —        2023       -52       1500       3641       Ocl       —        —        —      

Monitor Wells

GMWCX-1

    9844.60       12588.10       5258.10       1997       -90       505 to 545       4753 to 4713       Ocl       382.8       4875.30       11/12/2024     

GMWCX-2

    8409.50       11701.20       5580.20       1997       -90       465 to 505       5115.2 to 5075.2       Kgd       278.92       5301.28       05/11/2024     

GMWCX-3

    8235.70       10619.10       5321.30       1997       -90       278 to 318       5043.3 to 5003.3       Cpy       274.45       5046.85       05/11/2024     

GMWCX-4

    7785.30       7991.50       5335.50       1997       -90       610 to 670       4725.5 to 4665.5       Cpy       506       4829.50       05/11/2024     

GMWCX-5

    10341.30       8970.70       5073.00       1997       -90       490 to 523       4583 to 4550       Ocl       DRY       DRY       11/05/2024     

GMWCX-5D

    10008.58       8670.70       5109.77       2008       -90       1000 to 1080       4109.77 to 1029.77       Ocl       711.68       4398.09       23/12/2024      Replacement for GMWCX-5

AMW-1

    9857.09       10652.34       4762.31       2005       -90       900 to 960       3862.31 to 3802.31       Ocl       383.55       4378.76       23/12/2024     

BPZ0802

    11070.54       9224.37       4995.80       2008       -90       —        —        Qal       DRY       DRY       —      

BPZ0803

    9329.24       11014.22       5194.53       2008       -90       —        —        Ocl       678.8       4515.73       16/05/2024     

GMW-HLMW-1

    14221.21       4917.50       4692.27       1989       -90       254       —        Qal       264.06       4428.21       27/09/2023     

GMW-RCH-588

    15614.11       10449.75       4788.60       1995       -90       505       —        Qal       193.94       4594.66       28/09/2023     

GMW-W7A

    20480.58       10155.92       4657.70       1995       -90       110       —        Qal       125.94       4531.76       28/09/2023     


September 2026


SRK Consulting (U.S.), Inc.

NI 43-101 Technical Report – Granite Creek

   Page 336


Identifier

  Local Mine
Coordinates
    Elevation of
Land Surface
(ft amsl)1
    Year
Completed
    Inclination
(degrees)2
    Open Interval of Well
or VWP Setting
    Geologic
Unit(s)
    Depth
(ft bls)4
    Static Water Level     

Comments

  Easting
(ft)
    Northing
(ft)
    Depth
(ft bls)3
    Elevation
(ft amsl)
    Elevation
(ft amsl)5
    Date
(dd/mm/yyyy)
 

MW 8

    15140.35       8999.35       4757.01       1998       -90       212       —        Qal       154.87       4602.14       02/10/2023     

RCH-1101

    11440.58       12178.09       5060.51       1992       -90       264       465       Ocu       270.71       4789.80       05/06/2024     

RCH-1280

    13419.41       9893.00       4850.00       1991       -90       —        —        Qal       211.25       4638.75       23/12/2025     

RCH-1305

    10859.00       10333.45       5012.79       1992       -90       300       —        Ocu       DRY       DRY       —       Records indicate well has collapsed

RCH-1308

    10981.17       9783.77       4996.49       1992       -90       285       —        Ocu       DRY       DRY       —       Records indicate well has collapsed

RCH-1309

    10642.73       10744.50       5048.88       1991       -90       337       —        Ocu       DRY       DRY       —       Records indicate well has collapsed

RCH-1515

    12602.88       9750.12       4895.68       1993       -90       219 to 465       4676.68 to 4430.68       Qal       258.1       4637.58       05/06/2024     

RCH-1516

    12395.45       10333.65       4904.70       1993       -90       229       —        Qal       DRY       DRY       —       Records indicate well has collapsed

RCH-1517

    12458.51       10705.76       4915.72       1993       -90       229       —        Qal       DRY       DRY       —       Records indicate well has collapsed

RMW2NE

    15915.24       7792.24       4718.68       2005       -90       178 to 218       4540.68 to 4500.68       Qal       104.16       4614.52       15/02/2024     

RMW2SE

    15902.63       7292.08       4711.48       2005       -90       158 to 198       4553.48 to 4513.48       Qal       91.35       4620.13       15/02/2024     

RMW2W/GMWMW2A

    13432.00       9194.40       4838.20       1992       -90       140       500       Qal       203.91       4634.29       20/03/2024     

RMW3NE

    15621.68       6584.88       4710.37       2005       -90       158 to 198       4552.37 to 4512.37       Qal       90.52       4619.85       15/02/2024     

RMW3SE

    15488.44       6250.25       4706.13       2005       -90       158 to 198       4548.13 to 4508.13       Qal       87.59       4618.54       15/02/2024     

RMW3W

    13681.94       7080.52       4804.22       2005       -90       278 to 318       4526.22 to 4486.22       Qal       179.19       4625.03       15/02/2024     

WELL 10

    10454.99       11200.32       5084.57       1992       -90       242       542       Ocu       DRY       DRY       16/05/2024      Records indicate well has collapsed

WELL 2A

    13452.52       9148.66       4839.80       1992       -90       144 to 450       4695.8 to 4389.8       Ocu       204.15       4635.65       05/06/2024     

WELL 6

    8381.24       9858.41       5168.70       1998       -90       274       —        Cpy       248.75       4919.95       16/05/2024     

WSW-W#11

    10907.57       12300.59       5117.49       1998       -90       105 to 505       5012.49 to 4612.49       Ocu       DRY       DRY       —      

WSW-W#2

    13024.00       9420.00       4861.90       1992       -90       251 to 555       4610.9 to 4306.9       Ocu       228.83       4633.07       05/06/2024     

WSW-W#9B

    10323.65       11966.86       5173.91       1998       -90       264 to 617       4909.91 to 4556.91       Ocl       DRY       DRY       —      

Rib Piezometers

RPZ2E

    14833.50       8020.25       4768.41       2005       -90       58 to 138       4710.41 to 4630.41       Qal       90.03       4678.38       15/02/2024     

RPZ2N

    14732.84       8348.93       4771.00       2005       -90       58 to 138       4713 to 4633       Qal       128.5       4642.50       15/02/2024     

RPZ2S

    14595.45       7762.05       4773.27       2005       -90       58 to 138       4715.27 to 4635.27       Qal       81.05       4692.22       15/02/2024     

RPZ2W

    14496.42       8090.13       4785.56       2005       -90       58 to 138       4727.56 to 4647.56       Qal       88.58       4696.98       15/02/2024     

RPZ3E

    14388.32       6615.05       4763.06       2005       -90       58 to 138       4705.06 to 4625.06       Qal       DRY       DRY       15/02/2024     

RPZ3N

    14377.55       6939.79       4772.25       2005       -90       58 to 138       4714.25 to 4634.25       Qal       DRY       DRY       15/02/2024     

RPZ3S

    14140.12       6414.30       4766.55       2005       -90       58 to 138       4708.55 to 4628.55       Qal       DRY       DRY       15/02/2024     

RPZ3W

    14124.26       6741.97       4778.56       2005       -90       58 to 138       4720.56 to 4640.56       Qal       DRY       DRY       15/02/2024     

Source: LRE, 2026


  (a) 

Feet above mean sea level; for wells, elevation of land surface at surface casing; for VWPs elevation of surface casing at land surface is provided;

  (b) 

Degrees from horizontal at bottom of well or depth of VWP along inclined borehole using IDS survey

  (c) 

Feet below land surface for wells; feet along inclined borehole for VWPs based on IDS inclination survey and Leapfrog Geologic Model positioning

  (d) 

Feet below land surface for wells

  (e) 

Feet below land surface for wells; depth to water subtracted from collar elevation


September 2026


SRK Consulting (U.S.), Inc.

NI 43-101 Technical Report – Granite Creek

   Page 337


15.4.3 Underground Contact Water Management

Contact water discharge volume reached a maximum of 1,400 gpm when mining the South Pacific exploration drift started in late 2024 (Figure 15-4). The current groundwater model predicts inflow to the underground workings will decrease from a maximum of approximately 1,500 gpm to a minimum of approximately 500 gpm as the cone of depression created by the surface dewatering wells reduces the hydraulic head on the underground workings (Section 10.4.6). (Spheros Environmental 2026).


LOGO

Source: OMC, 2026

Figure 15-4: Granite Creek Weekly Average Passive Infiltration

Water encountered in underground excavations is collected in a series of sumps excavated along the main decline. Water from the sumps is pumped from the mine via two six-inch diameter SDR 11 HDPE pipelines routed through the primary development to the surface (Figure 15-5). Sumps eight through ten serve as the main collection point for contact water.

Expansion of the contact water managements system to handle the anticipated inflow increase will add a 250-HP submersible pump in Sump 10, pumping into a 12-inch diameter discharge line. A series of three 450-HP booster pumps will be located at appropriate intervals along the discharge line to overcome static head and friction losses. All pumps will be powered by variable frequency drives. The underground contact water system expansion is estimated to cost US$2.79 million (Jones 2026).


September 2026


SRK Consulting (U.S.), Inc.

NI 43-101 Technical Report – Granite Creek

   Page 338


LOGO

Source: OMC, 2026

Figure 15-5: Underground Contact Water Collection and Discharge System


15.4.4

Water Treatment and Rapid Infiltration Basins

Water from the dewatering wells that is not utilized for operations is currently discharged to Rapid Infiltration Basins (RIBs) on the east side of the Getchell Mine Road through HDPE pipelines. Two of the four permitted RIBs (NEV2005102) have been constructed to date, with discharge to one of the two cells at any given time (Figure 15-6). When RIB maintenance is required, discharge is routed to the dormant cell. Current dewatering efforts are well under the permitted 6,900 gpm threshold of the RIBs and the RIB infiltration is sufficiently limiting surface ponding in the active cell. As dewatering efforts have increased in recent years, i-80 has constructed the remaining two permitted cells (1 and 4) in Q2 2026. This will increase the surface area of the infiltration basins, allowing for proper future operations and cycling between cells for maintenance as the produced volumes increase with planned dewatering infrastructure upgrades.


September 2026


SRK Consulting (U.S.), Inc.

NI 43-101 Technical Report – Granite Creek

   Page 339


A portable rental water treatment plant capable of 800 gpm is in use currently to treat water from three wells (APW-1, BPW-5 and GCW-6) which does not meet the minimum required water quality standards for direct discharge to the RIBs (Figure 15-7). The Mag Pit serves as a diversion route for off-spec plant water but is limited by continuous monitoring and adjustments within the closed loop plant system.

Due to the depth and planned production rates of wells GCW-14 and GCW-15, a second plant has been designed to treat approximately 3,300 gpm and is planned to begin operating in Q3 2026(Figure 15-8). The original plant will also be available for treatment, allowing for a combined total treatment capacity of approximately 4,100 gpm.


LOGO

Source: Forsgren, 2026

Figure 15-6: Map of Current and Planned RIBs at Granite Creek


September 2026


SRK Consulting (U.S.), Inc.

NI 43-101 Technical Report – Granite Creek

   Page 340


LOGO

Source: Practical Mining, 2026

Figure 15-7: Existing Water Treatment Plant (800 gpm capacity)


September 2026


SRK Consulting (U.S.), Inc.

NI 43-101 Technical Report – Granite Creek

   Page 341


LOGO

Source: Forsgen, 2025

Figure 15-8: WTP-2 Process Flow


September 2026


SRK Consulting (U.S.), Inc.

SEC Technical Report Summary – Granite Creek

   Page 342


15.4.5

Fresh Water Supply

WW-8, east of Getchell Road, has historically been utilized as a potable water well for the Project (Figure 15-3). The well is completed in basin alluvial deposits to a depth of 5,177 m (80 ft) and can produce approximately 60 gpm. The well is currently not in use but may be utilized as a potable water source if needed for future operations.


15.5

Electrical

The Granite Creek project is connected to NV Energy’s 120kv transmission line that parallels the Getchell Mine Road. The Main substation is located adjacent to the mine access road and has a rated capacity of 5,000 kva. The current substation capacity is sufficient to support the project through to the completion of underground mining (Table 15-3). Power is distributed throughout the site at 13.8 kv (Figure 15-9). Pad mounted or pole mounted transformers are located adjacent to each dewatering well, water treatment plant, backfill aggregate crushing plant and the mine portal. The underground mine is supplied by a single 4.16 kv feeder entering at the main portal. A second 13.8 or 4.16 kv underground feeder is planned northeast of the portal that will enter the mine through a borehole or the planned ventilation raise.

Substation repairs and main transformer replacement were initiated in Q1 2026 following a main transformer fire. As of the effective date of this report the substation has returned to operation.

Table 15-3: Projected Electrical Demand by Area


Area

   kva  

Dewatering Wells

     700  

WTP1

     70  

WTP2

     490  

Existing Underground Feed

     1,100  

Future Underground Feed

     1,100  

Portal Facilities

     680  

Admin, Dry and Offices

     30  

Miscellaneous

     70  


Total

     4,240  


Source: Woolever, 2026


September 2026


SRK Consulting (U.S.), Inc.

SEC Technical Report Summary – Granite Creek

   Page 343


LOGO

Source: OMC, 2026

Figure 15-9: Granite Creek Electrical Distribution and Dewatering System


15.6

Portal Facilities

The mine is accessed through either of two portals, one providing fresh air intake and the other exhaust. Existing portal facilities also include an equipment maintenance shop, fueling area with diesel and oil storage, contractor offices, and electrical switchgear supplying power to surface facilities and the 4.16kv underground feeder (Figure 15-10).


September 2026


SRK Consulting (U.S.), Inc.

SEC Technical Report Summary – Granite Creek

   Page 344


LOGO

Source: OMC, 2026

Figure 15-10: Granite Creek Portal Facilities

The lined fuel and oil storage area contains a double-lined 10,000-gallon diesel tank, a 500-gallon gasoline tank, minor amounts of lubricants and oils, and a waste oil holding tank.

The mine contractor supplies a backfill plant consisting of a cement silo, a colloidal grout mixing tank, pumps, and a mixing sump where aggregate is mixed with the cement grout with a front-end loader. The mine contractor also supplies a shotcrete mixing plant with a dedicated cement silo and auger mixer.


September 2026


SRK Consulting (U.S.), Inc.

SEC Technical Report Summary – Granite Creek

   Page 345


15.7

Backfill Aggregate Crusher

Backfill aggregate is mined from the CX West pit and crushed to a nominal 4-inch maximum size. A contractor is mobilized as needed to mine and crush backfill aggregate. A typical campaign produces 300 to 400 ktons of aggregate.


15.8

Screen Plant

Before transporting mineralized material to the process plant, OMC removes material greater than nominal four inches using a diesel-powered screen plant located on a lined stockpile area near the CX pit ramp. The grade of the course material removed is below the process cutoff grade and is sent to the waste rock disposal area. Figure 15-11 shows the general arrangement of the lined pad and screen plant.

Fuel and oil storage for surface support equipment is also staged on the lined screen and stockpile pad. It consists of a double-lined 10,000-gallon diesel tank, a 500-gallon gasoline tank, minor amounts of lubricants and oils, and a waste oil holding tank.


September 2026


SRK Consulting (U.S.), Inc.

SEC Technical Report Summary – Granite Creek

   Page 346


LOGO

Source: OMC, 2026

Figure 15-11: Screen Plant Area General Arrangement (OMC 2026)


15.9

Waste Rock Disposal (WRD)

The infiltration basin located at the bottom of the CX Pit (Figure 15-10) must remain in service until commissioning of WTP-2 is complete. During that period mined waste rock will be disposed of in the C pit.


September 2026


SRK Consulting (U.S.), Inc.

SEC Technical Report Summary – Granite Creek

   Page 347


Mined waste over the Life of Mine (LOM) will be placed in the bottom of the CX Pit and the C Pit as shown in Figure 15-12. The Waste Rock Disposal (WRD) plan has sufficient volume for all waste rock mined over the current LOM plan (Table 15-4).

Table 15-4: WRD Capacity


WRD Phase

   Color      Capacity
(tons)
     Capacity
(tonnes)
 

CX Pit

     Green        475,000        430,912  

C Pit

     Blue        700,000        635,029  

Total WRD Capacity

        1,175,000        1,065,941  

LOM Plan Waste

        660,000        598,742  

Excess WRD Capacity

        515,000        467,200  

Source: OMC, 2026

Waste rock from the underground mine does not contain significant sulfide minerals and is dispersed among an abundance of oxidizing material. The high acid neutralization potential of the waste stream facilitates disposal in unlined waste rock facilities.

WRD in the CX pit will be placed in 20 to 40-foot lifts across the CX Pit. C Pit WRD will be dumped from the 5200 elevation in a single lift approximately 76 m (250 ft) high. The WRD slope is the natural angle of repose and is estimated to be 33 degrees. The in-place density for both dumps is planned at 0.058 tons/ft3.


September 2026


SRK Consulting (U.S.), Inc.

SEC Technical Report Summary – Granite Creek

   Page 348


LOGO

Source: OMC, 2026

Figure 15-12: C (Blue) and CX (Green) Pit WRD Plan


15.10

Waste Disposal

Granite Creek does not have an active permitted Class III landfill. A contractor transports household and non-hazardous waste to an authorized landfill located offsite. Hazardous wastes are collected in the appropriate manor and temporarily stored onsite until removed and transported to an approved disposal site for the type of waste being disposed of.

The administration offices and dry are serviced by a septic system installed in the early 1990’s. The system consists of a 4000 gal septic tank and leach field. The septic tank is pumped annually. Portable toilets are located in suitable locations across the site. These are serviced regularly by a qualified contractor and the waste disposed of offsite at an approved facility.


September 2026


SRK Consulting (U.S.), Inc.

SEC Technical Report Summary – Granite Creek

   Page 349


15.11

Communications

Granite Creek site communications infrastructure is built on a resilient fiber-optic backbone that spans surface and underground areas, providing high-bandwidth, low-latency connectivity for operational systems, control rooms, and data centers. The fiber network supports enterprise services (voice over IP, CCTV, telemetry, SCADA, and high-speed data transfer), links surface and underground network nodes, and enables centralized monitoring, automated reporting, and remote access for maintenance and engineering teams. Redundant routing and diverse-path cabling are implemented where possible to minimize single points of failure and to preserve critical communications during maintenance or incidents.

Wireless coverage is provided by UHF radio across the surface areas and VHF radio throughout the underground workings. Surface UHF systems deliver clear, mobile voice communications for haulage, processing, and surface crews and integrate with dispatch and incident response systems. Underground VHF channels are optimized for penetration in tunnels and confined spaces, ensuring reliable miner-to-control-room voice communications, emergency signaling, and personnel tracking support. Both radio systems are tied in to the fiber network and dispatch consoles, so voice, data, and alarms are consolidated for situational awareness; routine testing, battery/spare management, and periodic coverage surveys maintain reliability and safety compliance.

Additionally, i-80 Gold Corp has a FEMCO, a simple, rugged mine-phone system, that provides a dedicated copper-wire voice circuit to metal handset phones installed at key surface and underground locations (shafts, drifts, refuge stations, pump rooms, crushers, access points and control rooms). The system is intentionally low technology: line-powered drop lines feed magneto-style or dry-cell metal telephones that ring locally and require no active switching equipment in the handset, ensuring survivable voice communications during power outages and after blast events. FEMCO trunks terminate at protected junction boxes and a small central exchange/gateway that provides console access for dispatch and cross-connects into the primary fiber backbone and radio dispatch consoles. Typical design features include corrosion-resistant, armored copper cable, sealed metal enclosures, surge/protection modules at entry points, labeled station circuits, and redundant routing of critical drops where practical. Operational practices include periodic loop and continuity testing, battery/dry-cell replacement schedules (or line-power verification), maintenance logs for handset and cable condition, and weekly functional checks of gateway-to-dispatch connectivity and ringing. Limitations and mitigations are: FEMCO delivers highly reliable voice-on-wire but has no native data, CCTV, or IP functionality, i.e., it cannot use the gateway to bridge alarms or status signals to SCADA/CCTV or carry an isolated emergency voice conversation into the enterprise systems. The use of the FEMCO system is included in emergency response plans by ensuring clear signage of phone locations and FEMCO maintenance with fiber and radio testing to preserve end to end communications resilience.


15.12

Equipment

Mobile and fixed equipment additions planned over the LOM include the following:


Front end loader


Cat 745C articulated haul truck (leased)


Air compressor


Portal truck weigh scale


Back-up generator


September 2026


SRK Consulting (U.S.), Inc.

SEC Technical Report Summary – Granite Creek

   Page 350


16

Market Studies

Ore will be predominantly processed at the Lone Tree processing facility where the final product will be doré, which will be refined through a certified refinery (North American or global) and sold to any one of several financial institutions at the spot gold price on public markets. There is also a small revenue stream from gold-bearing carbon fines and slags, which are byproducts of the doré production process. These products are purchased by third parties at the spot price at contracted payable rates with associated fees for treatment.

Prior to refurbishment and restarting up of the Lone Tree facility, the material will be processed via a third party. A toll milling agreement is currently in place, governing the terms of the processing of Granite Creek sulfide material when being processed by the third party. Oxide material from Granite Creek will be sold to a third party until Lone Tree is operational.


16.1

Market Information

Market Demand

A report (World Gold Council, 2025) by the World Gold Council in November 2025 summarized the global demand for gold as follows:

“Economic, social and geopolitical trends have contributed to fundamental shifts in demand for gold. Across the globe, rising tensions and financial market uncertainties are fueling interest among institutional investors and retails savers, supported by increased ease of access to physical gold and gold-backed funds. Among central banks, there has been sustained gold buying since the Global Financial Crisis, accelerating still further in recent years. In China and India, rising wealth has fostered retail appetite for bars, coins and jewelry, reinforcing gold’s cultural and financial significance across Asia. In industry, gold’s durability, conductivity and malleability make it a core component of AI infrastructure and other advanced technologies.”

The distribution of demand for gold is illustrated in Figure 16-1. As the demand for gold is high, and the product is in a highly refined form, the gold produced at Lone Tree from the Granite Creek Project is not exposed to material market risk in terms of its ability to sell products or receive competitive terms. The toll milling contract is effective until December 31, 2027, at which point it is expected that the Lone Tree processing facility will be operational and capable of processing the refractory ore from Granite Creek.


September 2026


SRK Consulting (U.S.), Inc.

SEC Technical Report Summary – Granite Creek

   Page 351


LOGO

Source: World Gold Council, 2025

Figure 16-1: Average Annual Demand for Gold – by Sector

Gold Price Assumptions

The selection of gold prices for the purpose of delineating Mineral Resources and Mineral Reserves is described below.

Figure 16-2 shows the daily spot gold price since January 2020, along with the three-year trailing average. At the end of July 2026, the spot gold price was US$4,042/oz and the three-year trailing average price was US$3,099/oz.


LOGO

Source: i-80, 2026

Figure 16-2: Daily Spot Gold Price


September 2026


SRK Consulting (U.S.), Inc.

SEC Technical Report Summary – Granite Creek

   Page 352


In accordance with industry accepted practices, higher metal prices are used for the MREs ensuring the mineral Reserves are a subset of, and not constrained by, the Mineral Resources, and which satisfies the test of reasonable prospects for economic extraction.

For the Project, the following gold prices were assumed:


US$3,000/oz for Mineral Resources


US$2,750/oz for the economic model


US$2,500/oz for Mineral Reserves


16.2

Contracts and Status

Dore and Byproducts

i-80 Gold has treatment and refining contracts in place with their respective service providers for the processing of doré and associated byproducts. The terms of these contracts are typical of other gold mining companies in Nevada and globally.

Toll Milling Autoclave Contract

The agreement that i-80 Gold currently has in place allows for the Company to process ore at a third-party processing facility at a rate of approximately 30,000 tonnes (33,069.3 st) per month provided the material meets the specifications for such material set out in the contract. The Company will be credited with gold recovered from this material during processing and pay for processing based on a fee schedule of costs required to process the material.

Key specifics of the contract are as follows:


Mass of material will be determined by net truck weights of material delivered and moisture content determined by sampling, monthly


Gold grade of material will be determined by the mean of assays of a split sample of each truck delivery, by i-80 and the third-party processor, with the option to use a third umpire sample assay to settle difference outside the splitting limit of 5%, monthly


Gold recovery of material from Granite Creek, processed by the third-party processor will be determined from bench top autoclave tests and CIL bottle roll tests replicating plant conditions, and reconciled to the actual recovery obtained during the time period of processing, monthly


Silver production credit will be allocated quarterly based on the silver produced and the delivered mass and grade of material from Granite Creek during that quarter


Costs of processing under the Tolling Agreement will be determined monthly as follows:


Costs for processing, annual downtime and maintenance, selling, tailings storage and disposal, sustaining capital and G&A costs are determined for each monthly processing lot


Additional costs are incurred if the material is determined to be non-conforming to the specifications of the contract


Tolling charges are determined based on the prevailing gold price for the month of processing and range between US$53.92 and US$238.88 per tonne of ore processed


September 2026


SRK Consulting (U.S.), Inc.

SEC Technical Report Summary – Granite Creek

   Page 353


Specifications for conforming material include the following:


CO3 less than 15%


Organic carbon less than 0.5%


Sulfide sulfur above 1.0%


Moisture less than 8%


Preg-rob value less than 40%


Maximums on certain constituents including the following:


Mercury, 50 ppm


Arsenic, 5,000 ppm


Lead, 150 ppm


Zinc, 200 ppm


Total Copper, 0.25%


Selenium, 3 ppm


Barium, 500 ppm


Chromium, 100 ppm


Cadmium, 3 ppm


Cyanide Soluble Copper, 250 ppm


Antimony, 1,500 ppm


Free gold, none


Iron, 8%


Tramp metal and plastic, none

Ore Purchase Agreement

The ore purchase agreement that i-80 currently has with the third party enables i-80 to sell the oxide material produced from the Granite Creek mine. It is purchased by the buyer at a pre-determined payable rate dependent on the gold grade, the sulfide content and the gold price. The range of payable rates is 40% to 75%, with a minimum accepted grade of 0.075 oz/t, a 3.4 point decrease in payable rate with every 0.1% increase in sulfide sulfur and a maximum accepted sulfide content of 1.0%. The measurement of trucks and associated samples, along with mill scale readings and samples are used to determine the gold content sold by i-80.


September 2026


SRK Consulting (U.S.), Inc.

SEC Technical Report Summary – Granite Creek

   Page 354


17

Environmental Studies, Permitting, and Plans, Negotiations, or Agreements with Local Individuals or Groups

The site is a producing underground operation built on a historical mine site that has been impacted by operations and exploration since the 1940’s. The majority of historical surface disturbances have been reclaimed in accordance with state and federal requirements. In the valley to the east of the site, there are several center-pivot irrigation systems that are utilized for growing alfalfa. These adjacent water users may be beneficially impacted by the mine contributing groundwater to the rapid infiltration basins (RIBs). They are located at distance (and in the opposite direction of the prevailing wind), thus making them unlikely to be impacted by noise or dust from current operations.


17.1

Environmental Study Results

The original Pinson Mine was seeking authorization from the U.S. Department of the Interior - Bureau of Land Management (BLM) in 1975, just six years after the promulgation of the National Environmental Policy Act (NEPA). As such, the BLM was required to prepare an Environmental Assessment (EA) analyzing the potential impacts associated with the mine operations. The Environmental Assessment, Pinson Project, Humboldt County, Nevada, for Lacanex Mining Company, Ltd. (Dames & Moore, 1975) examined the baseline conditions and potential environmental impacts for a number of resources, including: socioeconomics, geology, soils, hydrology and hydrogeology, ecology, meteorology, and archeology.

A subsequent EA was prepared in 1992 (Environmental Management Associates, 1992) for an expansion of the Pinson Mine which examined: physiography, geology, soils, hydrology and hydrogeology, air quality, vegetation and range resources, wildlife, cultural and paleontological resources, visuals, noise, land use, and socioeconomics. A third EA was prepared (JBR, 2003) for an amendment to the closure and reclamation plans of the Pinson Mine with respect to the CX Pit and long-term management of discharge of Granite Creek, which was being diverted through a series of pipes and culverts through the mining area. In addition to a reexamination of the previously analyzed resources, environmental justice was added to the assessment.

Based on the previous analyses conducted on the older Pinson Mine, the BLM found that the amendment to the existing Plan of Operations by Osgood for the Granite Creek Underground Project (which only has a small surface footprint and nexus to federal public lands) had been sufficiently analyzed to allow for a Determination of NEPA Adequacy (DNA) and approval by the BLM.

The remaining activities associated with the Granite Creek Underground Project are being conducted on private lands under jurisdiction and purview of the Nevada Division of Environmental Protection - Bureau of Mining Regulation and Reclamation (NDEP-BMRR). The following section discusses more recent environmental studies relevant to the current Granite Creek Project.

Geochemistry

The site has had limited geochemical characterization throughout its history. Most of the geochemical characterization test work was performed by Water Management Consultants, Inc. (WMC) in 1998. This study involved acid-base accounting (ABA), metals enrichment by acid-digestion and ICP-MS, and kinetic tests. Fifty-one rock samples were tested statically, and 15 of those samples were selected for kinetic humidity cell testing (HCT). Samples were selected from a variety of lithologies and locations but were designed to primarily focus on the Mag and CX future pit wall material (WMC, 1998).


September 2026


SRK Consulting (U.S.), Inc.

SEC Technical Report Summary – Granite Creek

   Page 355


Results from the ICP-MS analysis showed that major element abundance was controlled by rock type, with calcium abundant in carbonate-bearing rocks, and silica and aluminum concentrations abundant in silici-clastic rocks. Arsenic was found to be elevated in three samples and associated with hydrothermal deposits. ABA results indicated that the rock had low acid-generating potential (AP). Tested rocks had low sulfur, neutral paste pH, and abundant neutralization potential (NP) that resulted in 49 out of 51 samples being classified as non-acid generating based on the Canada Centre for Mineral and Energy Technology (CANMET) standards of NP / AP >3 (WMC, 1998).

Kinetic cells were run for a minimum of 20 weeks, with some running for a total of 28 weeks. Rates of acid rock drainage (ARD) generation were tracked weekly, and the change in acidity and alkalinity was used to provide a quantitative estimate of whether the retained alkalinity would outlast the acid generation. Only one cell showed potential for acid generation: an argillite with 0.47% sulfur. This sample had consistently acidic pHs (4 to 2.2 S.U.) with sulfate in the hundreds to thousands of mg/L range. All other kinetic cells had neutral to basic pH (7 to 9 S.U.), alkalinity between 20 to 40 mg/L, and no quantifiable acidity. Monthly leachate analyses largely confirmed the weekly results. Metals in leachate were generally within the reference values, but some samples showed elevated levels of antimony and arsenic multiple times after the initial stabilization period. Additionally, the two cells that were uncertain under the acid-generation calculation showed levels of aluminum, antimony, arsenic, copper, iron, lead, and thallium after the initial stabilization period that were above NDEP Profile I reference values at the time. While the remaining cells were not over the reference value at the time, the arsenic and antimony reference values were lowered in 2006 to 0.006 and 0.010 mg/L, respectively, which makes all the cells retrospectively over the new reference values. However, there was not a particular rock type that was consistently exhibiting acid generating or metal leaching potential (WMC, 1998).

Since 1998, the site has performed periodic sampling characterizing waste rock authorized for disposal by backfill to the bottom of the CX pit. In the sample set taken from 2005 to 2022, theNP / AP ratio of this rock has varied from 2.5 to 568, confirming the presence of limestone layers within the Comus Sediments (see Section 7.0), that will readily neutralize any acid generated from the dissolution of sulfide minerals . In addition to ABA tests, Meteoric Water Mobility Procedure (MWMP) tests have been performed on the waste rock deposited in the bottom of the CX Pit. The minimum and maximum MWMP concentrations of constituents in exceedance of NDEP Profile I reference values is tabulated in Table 17-1 (Stantec Consulting Services, 2023).

Table 17-1: MWMP Results of Rock Placed in CX Pit 2005 to 2022


Analyte


NDEP Profile I Reference Value

   Maximum    Minimum

Antimony (mg/L)

   0.006    0.070    0.001

Arsenic (mg/L)

   0.010    2.200    0.015

Nitrate (mg/L)

   10    150.0    0.6

Sulfate (mg/L)

   500    800    3

Total Dissolved Solids (TDS) (mg/L)

   1000    1,900    27

Quarterly sampling of the waste rock for the sample set taken from 2023 to 2025 indicates theNP / AP ratio of this rock has varied from 12.7 to 62.4, confirming that the materials remain consistent with previous characterization data. Additionally, MWMP tests have been conducted on the waste rock deposited in the bottom of the CX Pit. The MWMP results for the rock placed in the CX pit are tabulated in Table 17-2.


September 2026


SRK Consulting (U.S.), Inc.

SEC Technical Report Summary – Granite Creek

   Page 356


Table 17-2: MWMP Results of Rock Placed in CX Pit 2023 to 2025


Analyte

   NDEP Profile I
Reference Value
     Maximum      Minimum  

Antimony (mg/L)

     0.006        0.601        <0.003  

Arsenic (mg/L)

     0.010        1.3        <0.005  

Nitrate (mg/L)

     10        57.4        0.2  

TDS (mg/L)

     1,000        1,970        300  

Note: Data was not available to calculate the weighted average. The geometric mean and mean were calculated for comparative purposes.

The project, with the current quarterly geochemical data, is consistent with the historical assessment that the backfilled rock does not appear to pose an ARD risk and only appears to pose minimal metal leaching (ML) risk in regard to antimony and arsenic release.

Onsite Water Quality

Water is sampled from many sources:


Underground dewatering wells (APW1, BPW3, BPW5, GCW-06)


Background groundwater wells


Underground mine sumps


Contact Water


Surface water


Mag Pit lake


RIBs


Influent and effluent from the WTP

Bedrock groundwater from the underground dewatering wells has variable chemistry, which is reflective of the variable groundwater flow between different mineralized and unmineralized geologic units. In general, the groundwater from unmineralized blocks has lower arsenic and antimony than from mineralized blocks. The pH of bedrock groundwater ranges between 6.8 to 8.4 S.U., with TDS from 180 to 1,500 mg/L and alkalinity between 74 and 134 mg/L. Some bedrock groundwater also exceeds the NDEP Profile I reference values for some metals, particularly for arsenic, cadmium, iron, manganese, nickel, and zinc (Osgood Mining Company LLC, 2023).

The site has maintained continuous bedrock groundwater quality monitoring for the purposes of compliance with NDEP-BMRR Water Pollution Control Permits (WPCP). A summary of the most recent water quality data for antimony and arsenic is compiled in Table 17-3.

Table 17-3: Water Quality April 2023 to January 2025


Location ID


Antimony Ranges (mg/L)


Arsenic Range (mg/L)

APW1

   0.0025 – 0.0041    0.029 – 0.059

BPW3

   0.0025    0.02 – 0.027

BPW5

   0.0025    0.012 – 0.037

GCW-06

   0.0035 – 0.0085    0.33 – 1.0

RIB Distribution Pipeline

   0.0025    0.023 – 0.028

WTP Effluent

   0.0025 – 0.003    0.005 – 0.015


September 2026


SRK Consulting (U.S.), Inc.

SEC Technical Report Summary – Granite Creek

   Page 357


Most natural water meets NDEP Profile I reference values for antimony, though there are occasional exceedances. The majority of bedrock groundwater onsite exceeds NDEP Profile I reference values for arsenic; however, the WTP effluent water quality demonstrates the WTP’s ability to meet arsenic reference values. An arsenic attenuation study is ongoing to address the high arsenic concentrations found in most groundwater.

Underground mine water is most impacted by metal leaching with analyzed samples collected from April to August 2024 exhibiting NDEP Profile I reference value exceedances for arsenic (ranging from 0.03 mg/L to 0.375 mg/L), antimony (ranging from 0.015 mg/L to 0.115 mg/L) and thallium (ranging from 0.003 mg/L to 0.014 mg/L). Range-front background alluvial groundwater quality has historically been relatively consistent over the period of record, with few exceedances of NDEP Profile I reference values, and some indication that natural chemical attenuation is occurring (Enviroscientists, Inc. Water Management Consultants, 2005). Alluvial groundwater on the project is monitored by numerous wells and is well understood. Onsite alluvial groundwater generally meets NDEP Profile I water quality reference values, with most trace metals at or below analytical laboratory limits (Osgood Mining Company LLC, 2023).

Granite Creek is located adjacent to the site and flows ephemerally during the spring and summer in response to snow melt and precipitation events. It is currently diverted through a series of pipes and culverts around the southern rim of the CX Pit to the original stream channel location downgradient of the pit. The water quality is consistently good, with all constituent concentrations below the NDEP Profile I reference values for surface water (Osgood Mining Company LLC, 2020).

The Mag Pit lake water quality has been monitored consistently since 2015. Samples have been taken from the top, middle, and bottom of the water column to establish any chemical differences in water quality with depth. Over 10 years of sampling, the average arsenic surface concentration of the Mag Pit is 0.029 mg/L, the middle of the water column in the Mag Pit has 0.029 mg/L arsenic, and the bottom of the Mag Pit has 0.032 mg/L arsenic. All layers show consistently high TDS (around 1,000 mg/L) and sulfate (490 to 580 mg/L). The bottom of the Mag Pit also appears to be elevated in manganese up to maximum of 0.53 mg/L in 2021 (LRE Water, 2024).

An Ecological Risk Assessment (SRK, 2025) conducted using the historical Mag Pit lake water quality results concluded that harmful effects to potential receptors, as a result of exposure to existing water in the Mag Pit lake, are not likely.

Pit Lake Future Water Quality

The current mine plan assumes that the CX Pit will be backfilled and will have a pit lake. LRE work has supported the post-closure formation of the CX Pit lake. An investigation of future CX Pit wall material and backfill was conducted by WMC in 1998. This was followed up by a pit lake model to predict future pit lake water quality. WMC found that the majority of future pit wall rock were acid-neutralizing, with paste pH >7 S.U. and average sulfur content of 0.053% weight. Most rock had significant neutralization potential, with an average of 115 tons of CaCO3 per 1,000 tons of rock.

The lake will behave as a hydrologic sink with no discharge of impounded waters to the surface or groundwater. The waste rock backfilled to the bottom of the CX Pit will be inundated by rising post-mining pit lake waters to an estimated minimum depth of approximately 9 m (30 ft). Inundation of the backfill will cut off the oxygen supply and reduce or eliminate the potential for the backfill to generate acidic conditions. Pit lake predictive modeling reports indicate that long-term post-mining lake water will be in compliance with WPCP NEV2005103, with many metals concentrations less than the analytical laboratory reporting limit, significantly below Nevada reference values except arsenic (0.019 mg/L).


September 2026


SRK Consulting (U.S.), Inc.

SEC Technical Report Summary – Granite Creek

   Page 358


Ongoing work from LRE (unpublished as of the effective date) addresses the post-closure formation of a lake in the Mag pit which shows that it will also be a hydraulic sink. The results of post-closure water quality model simulations (Piteau, 2023) indicate that no parameters are likely to exceed NDEP Profile III reference values (established to assess post-closure pit lakes in the State of Nevada) over the course of the 100-year simulation time frame. The CX Pit lake is predicted to be slightly alkaline with TDS on the order of 1,612 mg/L to 4,290 mg/L.

In the event that post-mining arsenic concentrations rise above acceptable levels, the modeling predicts that the addition of ferric sulfate solution (Fe2(SO4)3) at a rate of 0.23 grams per gallon would reduce the concentrations of arsenic to below the analytical laboratory reporting limit in the short and long term. The model result is well supported by the ferric sulfate dosing program that was tested at the CX Pit lake in 2001 to help reduce arsenic concentrations reported in the pit lake at that time (Beale & Feehan, 2005).

Known Environmental Issues

SRK is not currently aware of any known environmental issues that could materially impact the Osgood’s ability to extract the Mineral Resources or Mineral Reserves of the Granite Creek Underground Project.

However, there does exist an environmental issue that may impact project economics. Petroleum Contaminated Soils (PCS) were discovered in 2025 within the CX Pit waste rock backfill material. While Osgood estimates that only about 290 to 320 cubic yards of PCS material was disposed of in the backfill, it is not known precisely where that material was placed, resulting in the possibility that most, if not all, of the 1.17 million tons of waste rock will need to be rehandled and sampled for contamination. Osgood is currently working with the NDEP-BMRR on the preparation of a PCS Management Plan and remedial efforts to address this issue.


17.2

Requirements and Plans for Waste and Tailings Disposal, Site Monitoring, and Water Management During Operations and After Mine Closure

Environmental management plans have been prepared as part of the state and federal permitting processes authorizing the Granite Creek Project. Requisite state environmental management plans which are part of the WPCP and Reclamation Permit programs under Nevada Administrative Code (NAC) 445A.398 and NAC 519A.270, respectively, include:


September 2026


SRK Consulting (U.S.), Inc.

SEC Technical Report Summary – Granite Creek

   Page 359


Fluid management plan


Monitoring plan


Emergency response plan


PCS management plan (pending)


Temporary and seasonal closure plans


Tentative plan for permanent closure


Reclamation plan

Federal environmental management plans incorporate many of the same plans as are required by the State of Nevada; these are specified in Title 43 of the Code of Federal Regulations Part 3809.401(b) (43 CFR § 3809.401(b)) and include:


Water management plan


Rock characterization and handling plan


Spill contingency plan


Quality assurance plan


Reclamation plan


Monitoring plan


Interim management plan

The state environmental management plans were originally submitted to the NDEP-BMRR as part of the WPCP and Reclamation Permit applications. Most of the management plans were updated and resubmitted as part of amendments to the Granite Creek Underground Project.

Ore Handling

No onsite processing occurs at the Granite Creek Underground Project at this time. All mineral ore mined at the site is transported offsite for processing under agreement at other permitted facilities. Ore-grade mineralized material encountered during exploration activities is transported to the surface, crushed or remain as run of mine material, and stockpiled in a temporary stockpile on the mineralized material stockpile pad or clay-lined ore storage pad. The stockpiled material is then transported offsite to a permitted precious metal processing facility for recovery of precious metals. Transport for offsite processing is contracted to a locally based trucking firm.

Waste Rock Management

Non-ore rock (waste rock) is transported from the underground by trucks to the surface. Under the terms and conditions of the WPCP (NEV2005103), placement of non-ore rock is authorized for the placement into CX and C pits. The non-ore rock from the CX decline has been, and will continue to be, end-dumped over the edge of the 4760 bench towards the bottom of the CX Pit.

There are no plans at present to commence construction of a decline originating in the southwest highwall on the 4700 bench of the Mag Pit. However, if such construction is initiated at some point in the future, the Mag decline may produce non-ore rock which may also be placed in the approved but not yet constructed engineered waste rock dump located southeast of the existing Mag Pit or within the Mag Pit on private lands. Non-ore rock will be dumped to construct ten-foot lifts built with an overall slope of three horizontal to one vertical (3H:1V) to facilitate reclamation. The non-ore rock will be dumped at the angle of repose. To eliminate run-on and minimize potential surface water degradation, the non-ore rock will not be constructed within ephemeral drainage channels.


September 2026


SRK Consulting (U.S.), Inc.

SEC Technical Report Summary – Granite Creek

   Page 360


The WPCP requires monthly and/or quarterly monitoring of non-ore rock, as well as non-ore rock specifically originating in the CX Underground Development and ore. The non-ore rock sampling program at the Project includes collection of composite samples of non-ore rock and ore mined during the quarter and analysis by a State-certified analytical laboratory for NDEP Profile I constituents via MWMP testing, and static ABA to assess the potential for the non-ore rock to generate acid. Results of the required periodic monitoring will be analyzed to ensure protection of the waters of the State, and alert Osgood to the need, if necessary, to alter non-ore rock handling and storage procedures.

Tailings Management

See Item 15 (Infrastructure), Tailings Disposal, for the Project’s tailings disposal status.

Water Management

Mine Dewatering

Mine dewatering is discussed in Item 15 (Infrastructure), Power, Water and Pipelines.

Water Treatment Plant

Treatment of dewatering water is discussed in Item 15 (Infrastructure), Power, Water and Pipelines.

An additional WTP (a modular twin of the existing system) will be designed and built to accommodate the greater water disposal needs of the project.

Stormwater

As required by NAC 445A.433(1)(c), stormwater from the watershed upgradient of the Project is diverted around the Project utilizing the Granite Creek ephemeral drainageway, including twin 8-inch diameter HDPE pipes through which surface water flows for a time generally during the first two quarters of the year and in relation to snowmelt occurring in the bowl near the top of the Osgood Mountains west of the Project. Osgood continues to maintain the diversion and monitor the flow as required by the Permit to ensure the integrity and adequacy of the diversion system. The Mining Stormwater General Permit for Facility ID MSW-266 will remain active until the facility is permanently closed, reclamation is completed, and bonding is released, thus ensuring continued erosion and sedimentation control.


September 2026


SRK Consulting (U.S.), Inc.

SEC Technical Report Summary – Granite Creek

   Page 361


Monitoring Requirements

Monitoring of the Granite Creek Mine / Project is accomplished on multiple levels and across various regulatory programs; these include:


Water Quality pursuant to NAC 445A.398(3)(a) and (c) and WPCPs, including baseline and operational, surface and groundwater water quality, ponds, pit lake (as applicable), stormwater, etc.


Waste Rock generated during the quarter will be analyzed for meteoric water mobility procedures (MWMP), NDEP Profile I parameters, and geochemical properties.


Air Quality and emissions monitoring through the Surface Disturbance Permit and Class II Air Quality Operating Permit.


Surface disturbances, reclamation, and revegetation monitoring through the plan of operations and reclamation permit.


Stormwater flows in Granite Creek and inspections of the facility, including Best Management Practices (BMPs), structural controls, and high-risk, non-contact offsite discharge areas.

Currently, the site has been executing all environmental monitoring requirements required to maintain the permits associated with the underground operation. All permit monitoring requirements are up to date.

Human Health and Safety

Public safety will be maintained throughout the life of the Project. All equipment and other facilities will be maintained in a safe and orderly manner. The Project area will remain fenced during the life of the Project to ensure public safety. Site access will be restricted to employees and authorized visitors by not allowing unauthorized visitors into the Project Area. The site has a plan for responding to emergencies. The intent of this plan is to outline and establish responsibilities and guidelines for actions to be taken by Project personnel in the event of a spill or pollutant release on the Project property.


17.3

Project Permitting

The Granite Creek Project includes both public and private lands within Humboldt County, Nevada. Therefore, the project falls under the jurisdiction and permitting requirements of Humboldt County, the State of Nevada (principally the various bureaus within the NDEP), and federally through the BLM (though a limited nexus to federal jurisdiction exists at this time). Table 17-4 presents the list of permits and authorizations under which the Osgood Mining Company is currently permitted to carry out mining operations and reclamation activities at Granite Creek.


September 2026


SRK Consulting (U.S.), Inc.

SEC Technical Report Summary – Granite Creek

   Page 362


Table 17-4: Granite Creek Mine Project Permits


Permit Name


Agency


Permit Number

Plan of Operations Granite Creek Mine Project    BLM    NVNV105956928 (Legacy Serial # NVN-064101)
Class II Air Quality Operating Permit    NDEP-BAPC    AP1041-3086.02
Mercury Operating Permit to Construct    NDEP-BAPC    MOPTC AP1041-3089 (de minimis)
Water Pollution Control Permit - Rapid Infiltration Basins    NDEP-BMRR    NEV2005102
Water Pollution Control Permit - Granite Creek Mine    NDEP-BMRR    NEV2005103
Granite Creek Mine Nevada Reclamation Permit    NDEP-BMRR    0047
Granite Creek UG Mine Nevada Reclamation Permit    NDEP-BMRR    0242
Mining Stormwater General Permit    NDEP-BWPC    NVR300000: MSW-42365
Onsite Sewage Disposal System    NDEP-BWPC    GNEVOSDS09S0177
Hazardous Materials Permit    Nevada State Fire Marshal    133539 (renews annually)
Waters of the United States Jurisdictional Determination    USACE    Approved Jurisdictional Determination (AJD) received from USACE November 19, 2025 (valid until November 19, 2030)

Water Rights

The Nevada Division of Water Resources (NDWR) is responsible for quantifying existing water rights, monitoring water use, and distributing water in accordance with:


Court decrees


Reviewing water availability


Reviewing the construction and operation of dams (among other regulatory activities)

Water appropriations are managed through the NDWR and the State Engineer’s office; this is important to the Granite Creek Project because the Kelly Creek Area hydrographic basin (Area No. 0) in which the operations are located, has been designated through NDWR Order No. O-536. Groundwater basins are typically designated as needing increased regulation and administration by the State Engineer when the total quantity of committed groundwater resources (water rights permits) approach or exceed the estimated perennial yield (average annual groundwater recharge) from the basin. By designating a basin, the State Engineer is granted additional authority in the administration of groundwater resources within the designated basin. Designation of a water basin by the State Engineer does not necessarily mean that the groundwater resources are being depleted, only that the appropriated water rights exceed the estimated perennial yield.

Osgood Mining Company, LLC’s water rights at the Granite Creek Mine have a total combined duty of 3,746 ha (9,256 acre)-feet annually (AFA), of which 1,149 AFA is for consumptive use (Osgood, 2024). Water usage for the Project is managed via three certificated water rights (798 AFA) and 12 permits (8,458 AFA), three of which are block permits. All water rights are subject to State Engineer’s Order 1087 (Block Order). An additional 1,364 AFA are currently ‘Ready For Action’ by the NDWR under permits 94443 and 94864. All use from the mine, including consumptive and non-consumptive use, is reported monthly on a site pumpage report and the specific meter readings are recorded and subsequently uploaded monthly to NDWR’s online meter database.


September 2026


SRK Consulting (U.S.), Inc.

SEC Technical Report Summary – Granite Creek

   Page 363


Current Permitting Activities

There are currently no pending permitting actions before the NDEP nor the BLM with respect to the Granite Creek Underground Project.

Performance or Reclamation Bonding

Pursuant to state and federal regulations, any operator who conducts mining operations under an approved plan of operations and/or reclamation permit must furnish a bond in an amount sufficient for stabilizing and reclaiming all areas disturbed by the operations. Bonding amounts are based on the operator complying with all applicable operating and reclamation requirements as outlined in the regulations at 43 CFR § 3809.420 and NAC 519A.350 et seq. Section 17.5 provides additional details on the currently calculated financial assurance estimate for the operations. Current reclamation cost estimates (RCEs) will remain in effect until updated as part of a state and federal permitting action (pending) or next 3-year bond review (anticipated in 2028 and 2029).


17.4

Local Individuals and Groups

Osgood Mining currently has no plans, formal negotiations, or executed agreements with local communities or individuals as part of the technical and economic factors necessary to demonstrate reasonable prospects for economic extraction of Granite Creek Project Mineral Resources.

Stakeholder Engagement

The following information on community relations and stakeholder consultation has been provided by Osgood Mining personnel (2026).

Mining activities at the Granite Creek property (formerly known as the Pinson Mine) date back to the 1940s, with intermittent periods of operation continuing to the present day. Throughout its history, the operation has played an important role in the economic development of Humboldt County by creating employment opportunities and generating both direct and indirect economic benefits for the region.

Osgood Mining Company periodically hosts Town Hall meetings in Winnemucca, Nevada, to provide local stakeholders with operational updates and opportunities for open dialogue. The company also partners with the Nevada 95-80 Regional Development Authority during its annual economic development conference and collaborates with the Humboldt County School District, Great Basin College and the Mining Industry Foundation, to support educational initiatives that strengthen opportunities for local students and the broader community.

Beyond these partnerships, Osgood Mining places a high priority on maintaining positive, long-term relationships with local government officials, ranchers, neighboring landowners, and other community stakeholders, ensuring their perspectives are heard, respected, and considered throughout the development process. Through these ongoing efforts, Osgood Mining strives to be a responsible and trusted community partner, supporting the long-term well-being of the region and its residents throughout the life of the Granite Creek Project.


September 2026


SRK Consulting (U.S.), Inc.

SEC Technical Report Summary – Granite Creek

   Page 364


17.5

Mine Closure

Closure Planning

Mine closure and reclamation requirements in the State of Nevada are addressed on several levels and by several authorities:


Federal requirements are generally covered in the plan of operations under the BLM’s 43 CFR § 3809.401(b)(3) which state that, at the earliest feasible time, the operator shall reclaim the area disturbed, except to the extent necessary to preserve evidence of mineralization, by taking reasonable measures to prevent or control on-site and off-site damage to the federal lands.


State of Nevada requirements are stipulated in both the WPCP’s tentative plans for permanent closure (TPPC) and final plans for permanent closure (FPPC) under NAC 445A.396 and 445A.446 / .447, respectively, and the reclamation permit requirements under NAC 519A.


The Humboldt County Regional Master Plan outlines broad goals encouraging responsible mining operations that minimize environmental footprints and protect the county’s natural capital. It supports projects that remain compatible with long term land use planning but relies on external agencies to mandate the actual technical reclamation.

The state closure and stabilization requirements under the WPCP pertain to process and non-process components (sources), such as mill components, heap leach pads, tailings impoundments, pits, pit lakes, waste rock dumps, ore stockpiles, fueling facilities, and any other associated mine components that, if not properly managed during operation and closure, could potentially lead to the degradation of waters of the State. A mining facility operator / permittee must submit a TPPC as part of any application for a new WPCP or modification of an existing permit. A FPPC must be submitted to the agency at least two years prior to the anticipated closure of the mine site, or any component (source) thereof. This plan must provide closure goals and a detailed methodology of activities necessary to achieve chemical stabilization of all known and potential contaminants at the site or component, as applicable. The FPPC must include a detailed description of proposed monitoring that will be conducted to demonstrate how the closure goals will be met.

Disturbance on both public and private land is subject to state mine reclamation regulations (NAC 519A). Reclamation of disturbed areas resulting from activities associated with the facilities will be completed in accordance with NDEP and BLM regulations. The objectives of the reclamation work include the following:


Ensure public safety


Reduce or eliminate potential environmental impacts


Return the site to a condition that will support future use


Control infiltration, erosion, sedimentation, and related degradation of existing drainages in an effort to minimize off-site impacts


Employ reclamation practices using proven methods that do not require ongoing maintenance


Considering these objectives, reclamation activities are designed to:


Stabilize the disturbed areas to a safe condition


Protect both disturbed and undisturbed areas from unnecessary and undue degradation


September 2026


SRK Consulting (U.S.), Inc.

SEC Technical Report Summary – Granite Creek

   Page 365


To the extent practicable, reclamation and closure activities will be conducted concurrently to reduce the overall reclamation and closure costs, minimize environmental liabilities, and limit financial assurance exposure. The revegetation release criteria for reclaimed areas are presented in the “Guidelines for Successful Revegetation for the Nevada Division of Environmental Protection, the Bureau of Land Management, and the U.S.D.A. Forest Service” (NDEP, 2016). The revegetation goal is to achieve the plant cover similar to adjacent lands as soon as possible, which, on a denuded salt playa, is relatively simple.

Mine Closure Design Criteria

The following design criteria and assumptions were applied by Mountain Valley Professionals (MVP, 2026) in the development of the mine closure cost estimate:


All key regulatory reclamation and closure requirements will be met.


All regrading of mine waste structures will be performed during operations.


An approved rangeland grass mix will be used. Grassland and wildlife habitat with grazing is the anticipated post-mining land use.


All buildings, power lines, and other infrastructure will be removed.


The RIBs will be filled in and reclaimed.


Granite Creek will be restored to a channel similar to the pre-mining flow path.


The future water quality in the post-closure Mag Pit lake should meet NDEP Profile III reference values (SRK, 2025) under the current closure scenario (i.e., no open pit mining, independent pits at closure). The lake will be a terminal sink for water; therefore, a long-term risk to groundwater quality has not been identified.


Other than the issues discussed above, there are no other potential water quality or water quantity impacts at the Granite Creek Mine upon closure.

Closure Cost Estimate

This current estimate for the reclamation and closure of the Granite Creek Project (US$8.64 million) (MVP, 2026) was prepared in the Nevada Standardized Reclamation Cost Estimator (SRCE), Version 1.4.1 Build 17c. The SRCE model has been in use since 2006 in the State of Nevada after validation by both state and federal regulators and mining industry representatives. The estimate utilized a cost data file (CDF) prepared by the NDEP-BMRR, which was released on August 1, 2025. The CDF utilizes the unit rates below:


Labor rates from federally mandated Davis-Bacon rates


Rental equipment rates quoted from Cashman Caterpillar in Reno, Nevada


Miscellaneous unit rates from Nevada mining vendor quotes (e.g., seeding, well abandonment, etc.)


Costs for some activities and supplies are from the 2024 RS Means Heavy Construction database (where activities include labor, they are modified to use the Davis-Bacon wages)

The SRCE model utilizes first principles to calculate various costs for activities related to mining operations. Inputs for these equations range from equipment efficiencies, labor efficiencies, fuel consumption rates, area calculations, unit rates for labor / equipment / consumables, etc. Some costs estimated in the SRCE model (such as those for demolition) are estimated based on productivities and crews from the RS Means Heavy Construction database but use the standardized labor and equipment rates included in the CDF. Other, site-specific costs may be calculated by the operator and included in one of the user sheets.


September 2026


SRK Consulting (U.S.), Inc.

SEC Technical Report Summary – Granite Creek

   Page 366


The rates for the CDF are supplied by the NDEP-BMRR and vetted for usage in reclamation estimates throughout the state of Nevada, as well as several surrounding jurisdictions. Davis-Bacon labor rates are based on government contracts with select labor unions and may be higher than those that would be incurred by an operator in a self-performed closure scenario where in-house or non-union contract labor can be used. The costs within a reclamation estimate prepared for a regulatory agency often have additional overhead costs related to government oversight of the closure project; the same is true of the values associated with equipment. The rates within the government-prepared CDF are leased rates (which include capital and operating costs), as opposed to an owner / operator fleet already having a majority of the equipment on hand and partially or fully amortized or potentially easier access to equipment. The bond cost estimate includes 10% for contractor overhead and profit, 6% for engineering and design, 6% for contingency, 6% for government project management, and 4% for bonding and insurance. The total indirect markup of the reclamation bond estimate is 37%. While this total markup is likely sufficient to cover the project management and overhead (G&A) costs in a self-performed closure, they are not detailed enough to make a judgement whether they are adequate in this case. Normally, a self-performed LoM closure cost will include a project-specific list of G&A costs for both management and overhead items like telephones, office supplies, electricity, etc.

Limitation on the Closure Cost Estimate

The government required reclamation cost estimate was utilized to provide a basis for financial assurance. This type of estimate reflects the cost that the government agency responsible for closing the site would be responsible for in the event that an operator fails to meet their obligation. If Osgood, rather than the government, closes the site in accordance with their current mine plan and approved closure plan, the cost of closure is likely to be different from the financial assurance cost estimate approved by the government. There are a number of costs that are included in the financial assurance estimate that would only be incurred by the government, such as government contract administration. Other costs (such as head office costs, a number of human resource costs, taxes, fees, and other operator-specific costs that are not included in the financial assurance cost estimate) would likely be incurred by Osgood during closure of the site.

Furthermore, because closure of the site is not expected until 2032, based on the forecast reserve production plan, the closure cost estimate represents future costs based on current expectations of site conditions at that date. In all probability, site conditions at closure will be different from currently expected; therefore, the current estimate of closure costs is unlikely to reflect the actual closure cost that will be incurred in the future.


17.6

Adequacy of Plans

Given the robust state and federal regulatory requirements in Nevada and review of the available documentation, it is SRK’s opinion that the current plans are adequate to address any issues related to environmental compliance, permitting, and local individuals or groups.


17.7

Commitments to Ensure Local Procurement and Hiring

i-80 Gold Corp. maintains specific corporate governance policies for all its operations, including those at Granite Creek, including providing and supporting access to employment and procurement opportunities for communities and Indigenous groups (i-80 Gold Supply Chain Policy, March 31, 2025).


September 2026


SRK Consulting (U.S.), Inc.

SEC Technical Report Summary – Granite Creek

   Page 367


18

Capital and Operating Costs


18.1

Underground


18.1.1

Expected Accuracy of Cost Estimates

Estimation of capital and operating costs is essential to the evaluation of the economic viability of a prospective project. These factors, combined with revenue and other expense projections, form the basis for the financial analysis. Capital (CAPEX) and operating (OPEX) costs for Granite Creek were estimated based on actual data from i-80, the life of mine plan described above, estimates of materials and labor based on that design, predicted consumption of power and supplies, budgetary quotes for major equipment, labor requirements, and estimates from contractors.


18.1.2

Capital Cost Estimates

The mining capital cost estimate is based on a first principal cost model buildup and actual costs from i-80. The total capital estimate is US$60.74 million. A 5% contingency, or US$2.77 million, is included in the total CAPEX.

The CAPEX estimate includes lateral and vertical capital development, mine infrastructure, mobile equipment and infill drilling.

Development costs are derived from the mining schedule prepared by SRK. The prepared mining schedule includes footages of development combined with unit costs and is based on site specific data to estimate the cost of these development activities. The breakdown of the estimated capital costs is shown in Table 18-1.

Table 18-1: Estimated Mining Capital Cost


Item

   US$M  

Capital Lateral Development Cost

     9.34  

Capital Vertical Development Cost

     12.71  

Mine Infrastructure and Equipment

     4.75  

Rebuilds

     0.90  

Infill Drilling

     30.27  

Contingency (5%)

     2.77  

Total

     60.74  

Source: SRK, 2024

US$M: US$ million


18.1.3

Operating Cost Estimates

The life of mine operating costs are US$408.13 million. SRK estimated the required mining equipment fleet, required production operating hours, and manpower to arrive at an estimate of the mining costs that the mining operations would incur. The mining costs were developed from first principles with client inputs on actual cost data and contractor quotes. The mining operating costs are presented in the following categories:


Drilling


Blasting


Mucking


Hauling


Backfill


September 2026


SRK Consulting (U.S.), Inc.

SEC Technical Report Summary – Granite Creek

   Page 368


Support Equipment Operations


Miscellaneous Operations (various support operations, etc.)


Mine Engineering (mine technical personnel and technical consulting)


Mine Administration and Supervision (mine and maintenance supervision, etc.)


Contractor Equipment Rental

A summary of the LoM unit mine operating costs is presented in Table 18-2.

Table 18-2: Mining Operating Costs


Category

   US$M      US$/st      US$/t  

Operating Development

     157.68        65.07        71.73  

Backfill

     48.74        20.11        22.17  

Truck Haulage

     36.16        14.92        16.45  

Mine Services and Maintenance

     70.53        29.10        32.08  

Power

     12.15        5.01        5.52  

Technical Services and Management

     13.07        5.39        5.94  

Contractor Equipment Rental

     69.81        28.81        31.76  

Total

     408.13        168.42        185.65  

Source: SRK, 2026

US$M: US$ million

Figure 18-1 shows the OPEX cost profile for the life of mine.


LOGO

Source: SRK, 2026

Figure 18-1: Yearly Mine Operating Cost Profile


September 2026


SRK Consulting (U.S.), Inc.

SEC Technical Report Summary – Granite Creek

   Page 369


Key inputs and assumptions used to estimate the OPEX cost are as follows:


Development and production are performed by contractors. Contractors provide labor and equipment. The Owner provides the consumables such as diesel, explosives, ground support, etc.


Backfill costs assume the haulage and placement of rockfill to the stopes. Costs for operating the backfill plant and aggregate costs are estimated separately.


Material movement assumes haulage of material from the stope to the portal ore pad.


Power costs only assume the additional power needed to support the life of mine plan. The current power requirement is estimated separately.


18.1.4

Closure and Reclamation

Total reclamation costs are estimated at US$8.6M. An additional approximately US$4M is estimated for environmental clean up and reclamation for a total closure cost estimate of US$12.7M. Reclamation costs are only for the underground mine-related disturbance. Legacy reclamation costs are included in the open pit estimates.


18.1.5

Infrastructure

PMC constructed significant infrastructure prior to i-80’s acquisition of the Granite Creek Project. Work is ongoing for the completion of RIBs one and four, water treatment plant #2, and wells GCW-14 and GCW-15. Estimated capital spending remaining for the Project as of June 1, 2026, are shown inTable 18-3. Capital estimates are from existing construction contracts, current and prior purchase orders, and OMC engineering estimates.

Table 18-3: Infrastructure Capital Cost Estimates1


Area


Capex Remaining1 ($M)


Source

WTP#2

  $ 6.7      Forsgren

Dewatering Wells GCW14 & GCW15

  $ 2.6      OMC

Monitoring Wells Rehab

  $ 1.7      OMC

RIBs 1&4 and Rib Monitoring Wells

  $ 0.5      OMC

Potable Water Treatment System

  $ 0.8      OMC

Electrical Distribution

  $ 0.3      OMC

Equipment

  $ 1.3     

Mobile Equipment

  $ 1.9      OMC

Light Vehicles

  $ 1.0      OMC


Total

  $ 16.6     


Source: Practical Mining, 2026

(1) As of June 1, 2026

US$M: US$ million

For purposes of the economic analysis, Surface Mine Capital also includes approximately US$5.6 million of costs capitalized in connection with underground mine development. These costs are incremental to the US$16.6 million infrastructure capital cost estimate presented in Table 18-3.


18.2

Surface Operating Costs

Operating costs for the surface infrastructure and support functions were derived from historical costs during the period from January 2024 through May 2026 and engineering estimates as appropriate (Table 18-4).


September 2026


SRK Consulting (U.S.), Inc.

SEC Technical Report Summary – Granite Creek

   Page 370


Surface labor totals 23 hourly, supervisory and contract personnel tasked with WTP operation and maintenance, well operation and maintenance, ore waste and backfill aggregate movement to and from the portals, screen plant operation, haul road maintenance, and maintenance of all site buildings and facilities.

Electrical power consumption was calculated from historic billed kwh plus new surface loads planned during the life-of-mine (Table 18-5). New electric loads added in the underground mine are captured with the underground mining costs. Existing power demand for the underground mine is included with the infrastructure baseline demand. Power costs are estimated at the historic average of US$0.077/kwh.

Table 18-4: Infrastructure Unit Operating Cost Estimates


Area


Operating
(US$/ore
ton)


Operating
(US$/ore
tonne)


Source

WTP#1

     3.83        4.22      Veolia

WTP#2

     17.06        18.80      Forsgren

Electrical

     8.61        9.49      OMC

Surface Labor

     9.56        10.53      OMC

Surface Support Equipment and Supplies

     8.67        9.56      OMC

Backfill Aggregate

     10.11        11.14      OMC


Total

     57.83        63.75     


Source: Practical Mining, 2026

Table 18-5: Annual Infrastructure Operating Costs (US$000’s)


Area


2026


2027


2028


2029


2030


2031


2032


2033


2034


Total


Surface Labor

     1,356        2,776        2,782        2,777        2,777        2,777        2,784        2,776        2,077        22,883  

Surface Support

     1,655        2,046        2,822        2,990        2,883        3,094        2,682        1,846        739        20,758  

WTP1

     889        936        988        1,078        1,112        1,112        1,112        1,112        834        9,171  

WTP2

     1,965        4,500        4,621        5,042        5,202        5,202        5,202        5,202        3,902        40,839  

Electrical

     1,117        2,205        2,327        2,538        2,618        2,618        2,620        2,618        1,962        20,623  

Backfill Aggregate

     1,160        3,223        3,713        3,739        3,745        3,793        3,374        1,084        369        24,200  


Total

     8,143        15,686        17,252        18,164        18,338        18,596        17,775        14,638        9,882        138,474  


Source: Practical Mining, 2026

Operating costs for over-the-road haulage of ore from Granite Creek to either Lone Tree or third-party processors are part of a contracting agreement with a commercial hauler, with rates as follows:


US$5.44 per wet ton for ore transport


US$175 per hour for travel time


Additional fuel surcharge

Costs for transporting ore to the destinations for processing is shown in Table 18-6, based on historic 2026 invoices received.


September 2026


SRK Consulting (U.S.), Inc.

SEC Technical Report Summary – Granite Creek

   Page 371


Table 18-6: Unit Costs for Over-the-Road Ore Haulage


Destination


Operating

(US$/ore ton)


Operating

(US$/ore tonne)


Lone Tree

     16.21        17.87  

Third-Party Ore Processing Plant

     7.10        7.83  

Source: i-80 Gold, 2026


18.2.1

Autoclave Capital Cost Allocation (Processing Fee)

i-80 plans to operate their mines in a hub and spoke arrangement. i-80’s plan is to ship ore to the Lone Tree Mill acting as the hub. This is analogous to third-party ore or concentrate processing that is currently being used for ore being mined from Granite Creek (i.e. Nevada Gold Mines). Given that Lone Tree is not a captive processing facility, i-80 has elected to use the mill as a toll treatment facility both internally and potentially externally. As the Lone Tree Mill will be operating in a toll treatment capacity, i-80 intends to allocate the Lone Tree Mill’s refurbishment capital cost to each of the mine sites.

The capital cost estimate was developed by an experienced team of engineers, designers and cost estimators from Hatch.

The capital costs for the project have been prepared in accordance with standard industry practices and guidelines provided by the Association for the Advancement of Cost Engineering (AACE) international recommended practice 47R-11. Using the guidelines provided in practice 47R-11, the cost estimate is considered to be an AACE Class 3 estimate.

Basis of Estimate

The estimate is inclusive of the entire mill scope from feed ore stockpile to filtered tails material placement in the tailings storage facility.


September 2026


SRK Consulting (U.S.), Inc.

SEC Technical Report Summary – Granite Creek

   Page 372


The estimate includes the following key components:


Labor costs comprised of unit manhours, productivity adjustments and contractor-provided labor rates.


Equipment and bulk material costs for permanently installed equipment and facilities.


Costs associated with relocation, replacement and refurbishment items based on the site findings to bring the process operations up to name plate production.


Construction indirect costs for the support and maintenance of the site during the construction period.


Other indirect costs such as EPCM, freight, first fills, and spares.


Contingency has been applied in accordance with AACE Class 3 Guidelines and a Qualitative Risk Assessment of the estimate.


Owner’s Cost provided by i-80 for inclusion in the capital cost estimate.


Forward escalation has been excluded from the capital cost estimate.


All costs are expressed in Q3 2025 United States Dollars.

Estimate Classification

The Mill estimate follows established guidelines for producing a CAPEX according to the Hatch procedures in alignment with AACE estimating standard practice. The estimate was completed to a high-definition AACE Class 3 estimate with an intended accuracy of -15% to +15%.

Direct Costs

Direct costs are generally quantity based and include all the permanent equipment, materials, labor, and subcontractor costs associated with the physical construction of the permanent facility / asset.

Discipline Estimates, Quantity Development, and MTOs

The following section outlines the basis for how the engineering discipline cost estimates and quantities were developed by the engineering team. The cost estimates for all tagged equipment and some contracts were generally developed through the use of technical specifications and the use of firm or budgetary bid packages. The material quantities were developed from the 3D model, new drawings, and engineering calculations and lists, supported by existing drawings information collected during site visits. The cost estimates for MTOs were obtained using budget pricing.

All engineering input to the estimate was controlled through the use of estimate control sheets and material take-off forms.

The disciplines involved in direct input to the estimate are as follows: Civil, Architectural, Structural, Mechanical, Piping, Electrical, and Instrumentation & Controls.

Indirect Costs

Indirect costs include items that are necessary for the completion of the project but are not directly related to the direct construction costs. These costs are detailed in the section below and were generated by the project management and estimating team with input from i-80.

The indirect costs categories used within this estimate are as follows: Construction Indirects, Vendor Representatives, Spare Parts, First Fills, Freight and EPCM.


September 2026


SRK Consulting (U.S.), Inc.

SEC Technical Report Summary – Granite Creek

   Page 373


Capital Cost Summary

The estimated capital cost is presented in Table 18-7. The total Lone Tree Mill Restart project capital cost estimate is US$430 million USD as of Q3 2025.

Table 18-7:Capital Cost Summary


Capital Cost Estimate Summary


Description


Total Amount (US$M)


Subtotal Direct Cost

     252.6  

Subtotal Indirect Cost

     109.3  

Total Direct + Indirect Cost

     361.9  

Contingency

     43.4  

Subtotal Cost (Excluding Owner’s Cost)

     405.3  

Owner’s Cost

     25.0  

Total Project Cost

     430.3  

Source: Hatch, 2026

US$M: US$ million

Capital Cost Conversion to Sustaining CAPEX Cost

As i-80 intends to operate the Lone Tree Mill in a toll treatment arrangement, the overall capital cost must be converted into a sustaining cost per ton of processed ore. The calculated yearly operating cost for the refurbishment can be attributed to each operating mine based on their throughput.

To convert from a fixed capital cost estimate to an sustaining cost estimate the following assumptions were used:


Nameplate capacity for each year of operation


Design mine life of 20 years


Discount rate set to 0%


Cost equally attributed to each ton of ore processed

These assumptions have the potential to have a significant effect on the capital attribution to each year. For instance, should the mill operate for 25 years the effective cost per ton processed would decrease. In any year when the design tons to be processed are not processed this will inflate the effective operating cost per ton.

The selected assumptions align with the design and are to the best of the Authors knowledge accurate for the operating life of the Mill.

The Financial mine life for the CAPEX conversion was set by i-80 at 20 years. This is in contrast with the project’s design life of 15 years. This financial mine life was set based on i-80’s operating experience and the benchmarking of the other Autoclave facilities in Northern Nevada. The expectation is that the sustaining capital and maintenance costs included in the Lone Tree Mill operating cost estimate cover the expected expenses to keep the plant operating for 20 years (Table 18-8).

Table 18-8: Sustaining CAPEX Assumptions for Lone Tree


Description


Units

   Value  

Capital Cost

   US$M Q3 2025      430  

Life of Mine

   Years      20  

Solids Throughput

   st / annum      912,500  

Design Life Solids processed

   Millions of st      18.25  

Sustaining Processing Cost

   US$ / st      23.56  

Source: Hatch, 2026


September 2026


SRK Consulting (U.S.), Inc.

SEC Technical Report Summary – Granite Creek

   Page 374


The sustaining cost for the refurbishment of the Lone Tree Mill is US$23.56/st. This cost is applicable to every ton processed at Lone Tree.

Processing Costs – Lone Tree

The operating cost for the Lone Tree Processing Facility has been summarized by component as shown in Table 18-9.

Table 18-9: Lone Tree Processing Facility Operating Cost Summary


Category


Unit Cost

(US$/tonne)


Unit Cost

(US$/ton)


Power

     14.61        13.25  

Labor

     13.62        12.36  

Maintenance

     7.86        7.13  

Consumables

     61.87        56.13  

Facility

     7.21        6.54  

Total

     105.16        95.4  


Source: Hatch, 2026

Power

The electrical power requirements are estimated by plant area based on the equipment sizing for all equipment included on the electrical load list. A unit power cost of US$0.10/kWh has been assumed based on NV Energy rate sheet and preliminary contract with i-80.

Electrical costs are summarized in Table 18-10.

Table 18-10: Lone Tree Pressure Oxidation-CIL Power Costs


Area


Annual Consumption

(MWh)


Annual Cost

(US$)


Unit Cost

(US$/ton)


Unit Cost

(US$/tonne)


Comminution

     26,628        2,662,900        2.92        3.22  

POX and Utilities

     19,412        1,941,200        2.13        2.34  

CIL, Elution and Refinery

     11,206        1,120,600        1.23        1.35  

Tailings

     19,898        1,989,900        2.18        2.40  

Ancillary

     22,775        2,277,600        2.50        2.75  

Oxygen Plant

     20,998        2,099,800        2.30        2.54  


Total

     120,917        12,092,000        13.25        14.61  


Source: Hatch, 2026

Labor

Labor costs include the salaries, taxes, and wages for 90 staff members required to directly support the restart of the Lone Tree processing facility, including administration, operations, maintenance, and technical services personnel. Additional roles required to support the entire site and the management office at Lone Tree have been captured separately by i-80 and are excluded from the cost estimate.

The organizational structure for plant personnel is shown in Figure 18-2.


September 2026


SRK Consulting (U.S.), Inc.

SEC Technical Report Summary – Granite Creek

   Page 375


LOGO

Source: i-80 Gold, 2026

Figure 18-2: Organizational Chart for Lone Tree Pressure Oxidation-CIL

Labor costs are summarized in Table 18-11.


September 2026


SRK Consulting (U.S.), Inc.

SEC Technical Report Summary – Granite Creek

   Page 376


Table 18-11: Lone Tree Pressure Oxidation-CIL Labor Costs


Area

   Total Headcount      Annual Cost
(US$)
     Unit Cost
(US$/tonne)
     Unit Cost
(US$/ton)
 

Shared Personnel

     23        3,640,000        4.40        3.99  

Comminution

     14.3        1,648,000        1.99        1.81  

POX and Utilities

     10.3        1,208,000        1.46        1.32  

CIL, Elution and Refinery

     16.3        1,850,000        2.23        2.03  

Tailings

     26.3        2,936,000        3.55        3.22  

Ancillary

     0        —         —         —   

Oxygen Plant

     0        —         —         —   


Total

     90        11,282,000        13.63        12.36  


Source: i-80 Gold, 2026

Maintenance

Maintenance material costs are calculated based on previous experience and similar sized plants. The maintenance costs are estimated as annual costs based on the partial direct costs from the capital cost estimate. Partial direct costs exclude install labor, architectural, steel, concrete, and earthworks costs.

Maintenance costs are summarized in Table 18-12.

Table 18-12: Lone Tree Pressure Oxidation-CIL Maintenance Costs.


Area

   Annual Cost
(US$)
     Unit Cost
(US$/tonne)
     Unit
Cost

(US$/ton)
 

Comminution

     366,900        0.44        0.40  

POX and Utilities

     3,622,000        4.38        3.97  

CIL, Elution and Refinery

     639,800        0.77        0.70  

Tailings

     831,800        1.00        0.91  

Ancillary

     1,049,600        1.27        1.15  

Oxygen Plant

     —         —         —   


Total

     6,510,100        7.86        7.13  


Source: i-80 Gold, 2026

Consumables

Consumable costs are estimated based on a reagent list prepared using the process flow diagrams and design criteria. Reagent consumption rates were obtained from the mass balance and used to calculate the annual cost. Most of the consumable unit costs were provided by i-80 via vendor quotes or actual pricing from the currently operating Lone Tree plant, while others were estimated based on assumptions, online database, and reference projects.

Consumables costs are summarized in Table 18-13.

Table 18-13: Lone Tree Pressure Oxidation-CIL Consumable Costs


Area

   Annual Cost
(US$)
     Unit Cost
(US$/tonne)
     Unit Cost
(US$/ton)
 

Comminution

     3,253,700        3.93        3.57  

POX and Utilities

     32,397,500        39.14        35.50  

CIL, Elution and Refinery

     320,000        0.39        0.35  

Tailings

     736,600        0.89        0.81  

Ancillary

     16,347,200        19.75        17.91  


Total

     53,055,000        64.09        58.14  


Source: i-80 Gold, 2026


September 2026


SRK Consulting (U.S.), Inc.

SEC Technical Report Summary – Granite Creek

   Page 377


The key consumables for the operation and their cost information are shown in Table 18-14.

Table 18-14: Key Consumables Costs for Lone Tree Pressure Oxidation-CIL


Consumable

   Annual Cost
(US$)
     Unit Cost
(US$/tonne)
     Unit Cost
(US$/ton)
     Unit Price
(US$)
 

Sulfuric Acid (93%)

     31,896,400        38.53        34.95        220/tonne  

Quicklime

     9,638,700        11.64        10.56        354/tonne  

Propane

     3,703,900        4.47        4.06        0.412/L  

Ammonium Bisulfite (65%)

     1,122,500        1.36        1.23        0.579/L  

Sodium Cyanide

     801,600        0.97        0.88        3.06/kg  

Source: i-80 Gold, 2026

Facilities

Facility costs include operation of the oxygen plant under the ‘sale of gas’ agreement, mobile support equipment for the plant and site services including allowances for health and safety supplies and training.

Facility costs are summarized in Table 18-15.

Table 18-15: Lone Tree Pressure Oxidation-CIL Facility Costs


Area

   Annual Cost
(US$)
     Unit Cost
(US$/tonne)
     Unit Cost
(US$/ton)
 

Oxygen Plant

     2,460,000        2.97        2.70  

Mobile Equipment

     2,175,300        2.63        2.38  

Site Services

     109,200        0.13        0.12  


Total

     4,744,500        5.73        5.20  


Source: i-80 Gold, 2026

CIL at Lone Tree (Oxide Processing)

The operating cost estimate for oxide processing at Lone Tree was derived from the operating cost estimate for the sulfides with adjustments made due to bypassing of the autoclave and lower demand on ancillary facilities. The modified operating costs are shown in Table 18-16.

Table 18-16: Lone Tree Processing Facility Operating Cost Summary


Category

   Unit Cost
(US$/tonne)
     Unit Cost
(US$/ton)
 

Power

     9.30        8.44  

Labor

     11.11        10.08  

Maintenance

     3.14        2.85  

Consumables

     7.09        6.43  

Facility

     3.34        3.03  


Total

     33.97        30.82  


Source: i-80 Gold, 2026

Third-Party Autoclave Facility Operating Costs

Costs for third-party processing of sulfide material are covered by the toll milling agreement and consist of costs incurred by the third party for processing, a treatment charge that varies based on the gold price and any penalties for material that does not meet the specifications of the contract.


September 2026


SRK Consulting (U.S.), Inc.

SEC Technical Report Summary – Granite Creek

   Page 378


18.2.3

General and Administrative Costs

General and Administrative costs for this analysis are based on current Granite Creek actuals and forecasts and are categorized as follows:


Environmental - material, licenses, training and professional services


G&A – G&A payroll expenses, material, property tax and other general costs


Health and Safety - material, licenses, professional services and training


Human Resources – recruiting and human resources


Information Technology – information technology material, licenses and professional services.

General and Administrative staff at the operation consists of five personnel. Corporate costs are allocated to site where appropriate when support is provided.

A summary of the average annual G&A cost build-up is presented in Table 18-17. The LoM total G&A spend is US$49.9 million.

Table 18-17: Average Annual G&A Spend


Area

   Unit      Value  

Environmental

   US$ M        0.7  

G&A

   US$ M        4.6  

Health and Safety

   US$ M        0.3  

Human Resources

   US$ M        0.0  

Information Technology

   US$ M        0.3  


Total

   US$ M        5.9  


Source: SRK, 2026

US$M: US$ million


September 2026


SRK Consulting (U.S.), Inc.

SEC Technical Report Summary – Granite Creek

   Page 379


19

Economic Analysis


19.1

General Description

A cash flow model was prepared to evaluate the Granite Creek Project on a real basis. The model was developed on a monthly basis to match the mine plan generated for this exercise from provided start date through the exhaustion of the Mineral Reserves. The indicative model results are summarized on an annual basis and presented in this section alongside the main assumptions used in the model. The model results are presented in U.S. dollars (US$), unless otherwise stated. While the model inputs are primarily in imperial units, the model summary and results have been calculated in metric units. For the avoidance of confusion, both unit systems are provided in the tables in this section.

The economic model is based on mine plans and other inputs that were prepared as outlined in previous sections.

Capital and operating costs were developed in previous section and the build-ups and the associated accuracy and contingencies can be found in those sections.

All results and technical and cost information are presented in this section on a 100% basis reflective of i-80 Gold’s ownership unless otherwise stated.

As with capital and operating cost and pricing forecasts, the economic analysis is inherently a forward-looking exercise. These estimates rely upon a range of assumptions and forecasts that are subject to change depending upon macroeconomic conditions, operating strategy and new data collected through future study and operation.

Basic Model Parameters

Key criteria used in the analysis are presented throughout this section. Basic model parameters are summarized in Table 19-1.

Table 19-1: Basic Model Parameters


Description

   Value

TEM Time Zero Start Date

   May 1, 2026

Operations Start

   May 1, 2026

Mine Life

   8.3 years

Discount Rate

   5%

Source: SRK, 2026

All costs incurred prior to the model start date are considered sunk costs. The potential impact of these costs on the economics of the Project is not evaluated. This includes contributions to depreciation and working capital as these items are assumed to have a zero balance at model start.

Closure costs are assumed to be incurred as a single cost at the end of the mine life.

The selected Project discount rate is 5%, as directed by i-80 Gold.

Foreign exchange impacts were deemed negligible as most, if not all, costs and revenues are denominated in US dollars.


September 2026


SRK Consulting (U.S.), Inc.

SEC Technical Report Summary – Granite Creek

   Page 380


External Factors

Pricing

Modeled prices are based on the prices developed in the Market Study section of this report. The prices are modeled as US$2,750/oz over the life of the Project.

All product streams produced by the operation are modeled as being subject to the price presented above.

Taxes and Royalties

As modeled, the Project is subject to a federal income tax rate estimated at 21%. All expended capital is subject to depreciation. All capital depreciation in the model occurs via straight line method over an eight-year period.

Taxable income is adjusted by depletion which is calculated via cost depletion methodology and percentage depletion methodology appropriate to the operation and varies depending upon the period of operation.

The property is subject to the Nevada Commerce Tax which is modeled at a rate of 0.051% of the gross proceeds.

The Project is also subject to the Nevada Net Proceeds of Minerals Tax which is a sliding scale tax applied to the net proceeds of the operation. The sliding scale is calculated from a ratio of net proceeds to gross proceeds. The applicable tax rate is presented in Table 19-2.

Table 19-2: Net Proceeds of Mineral Tax Sliding Scale


NP/GP Lower Limit
(%)

   NP/GP Upper Limit
(%)
   Tax Rate
(%)
10    —     2.0
18    10    2.5
26    18    3.0
34    26    3.5
42    34    4.0
50    42    4.5

50

      4.5

Source: State of Nevada

Property tax has been included in the model and is captured in the G&A cost.

i-80 Gold has indicated that approximately US$46.7 million in existing loss carryforwards will apply to the property. This amount is modeled as a loss carryforward opening balance.

The Project is subject to a number of royalties as outlined in previous sections. These royalties vary in rate and area of influence. For modeling purposes a combined royalty rate of 7.5% is applied to all material through 2030. All material after that date is subject to a royalty of 9.0%. Royalty costs total US$104 million over the life of the Project as modeled for this analysis.

Working Capital

The assumptions used for working capital in this analysis are as follows:


Accounts Receivable (A/R): 1 month delay


Accounts Payable (A/P): 1 month delay


Zero opening balance for A/R and A/P


September 2026


SRK Consulting (U.S.), Inc.

SEC Technical Report Summary – Granite Creek

   Page 381


Technical Factors

Mining Profile

The modeled mining profile was developed by SRK. The details of mining profile are presented previously in this report. No modifications were made to the profile for use in the economic model. The modeled profile is presented in Figure 19-1 and Figure 19-2.


LOGO

Source: SRK, 2026

Figure 19-1: Granite Creek Mining Profile (imperial)


LOGO

Source: SRK, 2026

Figure 19-2: Granite Creek Mining Profile (metric)

Table 19-3 is a summary of the estimated mine production over a 9-year mine life for the operation. Ore mined refers to Proven and Probable Mineral Reserves.


September 2026


SRK Consulting (U.S.), Inc.

SEC Technical Report Summary – Granite Creek

   Page 382


Table 19-3: Life-of-Mine Production Summary


LOM Mining

   Unit    Value  

Autoclave Ore Mined

   tons      2,358,273  

Oxide Ore Mined

   tons      36,171  

Total Ore Mined

   tons      2,394,444  

Autoclave Ore Mined

   tonnes      2,139,392  

Oxide Ore Mined

   tonnes      32,814  

Total Ore Mined

   tonnes      2,172,206  

Average Mined Autoclave Ore Grade

   oz/ton      0.23  

Average Mined Oxide Ore Grade

   oz/ton      0.29  

Average Mined Ore Grade

   oz/ton      0.23  

Average Mined Autoclave Ore Grade

   g/t      7.85  

Average Mined Oxide Ore Grade

   g/t      10.02  

Average Mined Ore Grade

   g/t      7.88  

Contained Autoclave Gold

   ounces      539,738  

Contained Oxide Gold

   ounces      10,573  

Contained Ore Gold

   ounces      550,311  

Stockpile

   tons      28,930  

Stockpile

   tonnes      26,245  

Stockpile Grade

   oz/ton      0.21  

Stockpile Grade

   g/t      7.33  

Stockpile Contained Gold

   ounces      6,181  

Source: SRK, 2026

Processing Profile

Material from the Project is processed at either NGM facilities or i-80 gold facilities through an autoclave circuit or an oxide ore circuit. As i-80 Gold completes their processing facilities, ore will stop being shipped to NGM facilities for processing and will instead be shipped to i-80 Gold’s facilities for processing. The i-80 Gold processing facility is expected to be operational in January 2028. In July 2027, Granite Creek will stop shipping ore to NGM facilities and ore will instead be stockpiled at thei-80 processing facility. Once the facility comes on-line with an expected 2,500 tons per day capacity the stockpile will be drawn down and processed alongside the direct feed ore. All ore mined or in stockpiles is processed as outline above. The resulting production profile is presented in Figure 19-3.


September 2026


SRK Consulting (U.S.), Inc.

SEC Technical Report Summary – Granite Creek

   Page 383


LOGO

Source: SRK, 2026

Figure 19-3: Granite Creek Processing Profile

A summary of the modeled LoM processing profile is presented in Table 19-4.

Table 19-4: Granite Creek Processing Summary


LOM Processing

   Unit    Value

Autoclave


Ore Ounces Processed

   ounces    545,919

Recovery

   %    87.6%

Recovered Ore Ounces

   ounces    478,095

Oxide


Ore Ounces Processed

   ounces    10,573

Recovery

   %    68.9%

Recovered Ore Ounces

   ounces    7,284

Total


Total Ounces Processed

   ounces    556,492

Recovery

   %    87.2%

Total Ounces Recovered

   ounces    485,379

Source: SRK, 2026

Operating Costs

Operating costs are modeled in US dollars and can be categorized as mining, surface, power, processing and G&A costs. No contingency amounts have been added to the operating costs within the model. A summary of the operating costs over the life of the operation is presented in Figure 19-4. Operating costs total US$900.7 million over life of mine at a rate of US$371.67/ton processed (US$409.69/t processed).


September 2026


SRK Consulting (U.S.), Inc.

SEC Technical Report Summary – Granite Creek

   Page 384


LOGO

Source: SRK, 2026

Figure 19-4: LoM Operating Cost Summary

The contributions of the different operating cost segments over the life of the operation are presented in Figure 19-5.


LOGO

Source: SRK, 2026

Figure 19-5: LoM Operating Cost Contributions


September 2026


SRK Consulting (U.S.), Inc.

SEC Technical Report Summary – Granite Creek

   Page 385


Mining

The mining cost profile was developed external to the model and incorporated into the model as a fixed cost. The result of this approach is presented in Table 19-5.

Table 19-5: Granite Creek Mining Cost Summary


LoM Mining Costs

   Unit      Value  

Mining Cost (w/o power)

     US$M        395.98  
   US$ /ton mined        165.38  
   US$ /t mined        182.30  

Source: SRK, 2026

US$M: US$ million

Processing

Processing costs were developed external to the model and incorporated into the model as variable costs. Ore transportation costs were included in the processing costs for modelling purposes. The result of this approach is presented in Table 19-6.

Table 19-6: Granite Creek Processing Costs


LoM Processing Costs

   Unit      Value  

Processing Cost

   US$ M        304.21  
   US$ /ton processed        125.53  
   US$ /t processed        138.37  

Source: SRK, 2026

US$M: US$ million

Surface Costs

Surface Costs were developed external to the model and incorporated on a fixed basis. The result of this approach is presented in Table 19-7.

Table 19-7: Granite Creek Surface Costs


LoM Surface Costs

   Unit      Value  

Surface Cost (w/o power)

   US$ M        117.85  
   US$ /ton mined        49.22  
   US$ /t mined        54.25  

Source: SRK, 2026

US$M: US$ million

Power Costs

Power consumption for surface and underground was calculated external to the model and incorporated into the model on a fixed basis. A power cost of US$0.08/kwH was applied in the model. The result of this approach is presented in Table 19-8.

Table 19-8: Granite Creek Power Costs


LoM Power Costs

   Unit      Value  

Power Cost

   US$ M        32.77  
   US$ /ton mined        13.69  
   US$ /t mined        15.09  

Source: SRK, 2026

US$M: US$ million


September 2026


SRK Consulting (U.S.), Inc.

SEC Technical Report Summary – Granite Creek

   Page 386


G&A

G&A was calculated external to the model and incorporated into the model on a fixed basis. The result of this approach is presented in Table 19-9.

Table 19-9: Granite Creek G&A Costs


LoM G&A Costs

   Unit      Value  

G&A Cost

   US$ M        49.87  
   US$ /ton processed        20.58  
   US$ /t processed        22.68  

Source: SRK, 2026

US$M: US$ million

Selling Costs

Selling costs consist of the transport costs associated with moving the operation’s product to the selling point refining charges incurred. Doré refining and freight costs are modeled as follows:


99.75% payable Au


US$1.77/troy oz Au refining cost


US$3.69/troy ounce transportation cost

Capital Costs

Sustaining capital estimates were developed external to the model as outlined in the previous sections. No additional contingency has been included in the model. General closure costs are modeled as sustaining capital and are captured as a one-time payment the year following cessation of operations.

Total sustaining capital is presented in Table 19-10.

Table 19-10: Modeled Sustaining Capital


Capital Costs

   Unit      Value  

Mine Capex

   US$ M        60.74  

Autoclave Capex Allocation

   US$ M        49.33  

Surface Capitalized Costs

   US$ M        22.19  

Closure

   US$ M        12.66  


Total

   US$ M        144.92  


Source: SRK, 2026

The modeled capital profile is presented in Figure 19-6.


September 2026


SRK Consulting (U.S.), Inc.

SEC Technical Report Summary – Granite Creek

   Page 387


LOGO

Source: SRK, 2026

Figure 19-6: Granite Creek Sustaining Capital Profile


19.2

Results

The economic analysis metrics are prepared on annual after-tax basis in US dollars. The results of the analysis are presented in Table 19-11. The results indicate that at a gold price of US$2,750 the after tax NPV @ 5% is US$118 million. As the Project is in operation, IRR and payback timeframe are not relevant metrics.

Table 19-11: Indicative Economic Results


LOM Cash Flow

   Unit      Value  

Total Revenue

   US$ M        1,328.81  

Royalty

   US$ M        (104.47

Total Opex

   US$ M        (900.68

Operating Margin

   US$ M        323.65  

Operating Margin Ratio

     %        24

Taxes Paid

   US$ M        (25.35

Free Cash Flow

   US$ M        153.38  

Before Tax


Free Cash Flow

   US$ M        178.73  

NPV @ 5%

   US$ M        137.66  

NPV @ 7.5%

   US$ M        120.98  

NPV @ 10%

   US$ M        106.39  

After Tax


Free Cash Flow

   US$ M        153.38  

NPV @ 5%

   US$ M        117.55  

NPV @ 7.5%

   US$ M        102.97  

NPV @ 10%

   US$ M        90.19  

Source: SRK, 2026

US$M: US$ million

The Project does not generate positive free cashflow in 2026 and 2027 largely due to the higher processing costs incurred as a result of third-party processing of ore and a six-month stockpiling period in 2027. Cashflow is forecast to be negative at the end of the operational life as the operation winds down, and closure costs are incurred.


September 2026


SRK Consulting (U.S.), Inc.

SEC Technical Report Summary – Granite Creek

   Page 388


This estimated cash flow is inherently forward-looking and dependent upon numerous assumptions and forecasts, such as macroeconomic conditions, mine plans and operating strategy, that are subject to change.

The life of mine AISC cost is estimated at US$2,375/oz Au.

The economic result and back-up chart information for the charts withing this section are presented on an annual basis in Table 19-12 and Figure 19-7.


September 2026


SRK Consulting (U.S.), Inc.

SEC Technical Report Summary – Granite Creek

   Page 389


Table 19-12: Economic Results – Tabular Data


Cashflow Model Data Summary


Granite Creek


Period Start


    1-May-26       1-Jan-27       1-Jan-28       1-Jan-29       1-Jan-30       1-Jan-31       1-Jan-32       1-Jan-33       1-Jan-34  

Period End


    31-Dec-26       31-Dec-27       31-Dec-28       31-Dec-29       31-Dec-30       31-Dec-31       31-Dec-32       31-Dec-33       31-Dec-34  

Calendar Year


     Total       2026       2027       2028       2029       2030       2031       2032       2033       2034  

Cashflow


Income


Net Revenue

     USD        1,328,812,296       97,853,880       64,222,781       275,823,877       198,447,769       181,837,035       204,880,336       167,489,136       104,443,793       33,813,689  

Total

     USD        1,328,812,296       97,853,880       64,222,781       275,823,877       198,447,769       181,837,035       204,880,336       167,489,136       104,443,793       33,813,689  

Operational Expenditure


Fixed

     USD        (563,700,553     (43,427,268     (59,957,658     (73,417,431     (78,752,715     (77,217,002     (79,732,922     (69,599,378     (53,205,072     (28,391,108

Variable

     USD        (336,984,135     (42,858,496     (33,990,592     (56,739,659     (44,889,267     (39,861,250     (45,734,756     (37,837,640     (25,792,531     (9,279,945

Total

     USD        (900,684,688     (86,285,764     (93,948,250     (130,157,090     (123,641,981     (117,078,251     (125,467,678     (107,437,017     (78,997,603     (37,671,052

Royalty

     USD        (104,473,217     (7,251,737     (4,641,556     (20,029,635     (14,427,325     (13,253,919     (17,983,111     (14,697,023     (9,203,789     (2,985,125

Working Capital Adjustment

     USD        0       (5,311,948     10,960,294       (7,793,197     (1,214,654     (6,589,214     (1,682,841     9,844,588       (1,211,660     2,998,633  

Capital Costs


Mine Capex

     USD        (60,739,069     (16,606,202     (11,785,494     (10,306,973     (6,693,201     (4,364,800     (4,364,800     (4,364,800     (2,252,800     —   

Autoclave Capex Allocation

     USD        (49,326,013     —        (2,952,940     (8,577,679     (8,568,711     (7,505,803     (8,743,674     (7,106,626     (4,568,008     (1,302,572

Surface Capitalized Costs

     USD        (22,194,094     (15,617,998     (3,370,385     (1,708,365     (612,736     (524,157     (345,033     (15,419     —        —   

Closure

     USD        (12,660,000     —        —        —        —        —        —        —        —        (12,660,000

Total

     USD        (144,919,176     (32,224,199     (18,108,819     (20,593,017     (15,874,648     (12,394,760     (13,453,508     (11,486,845     (6,820,808     (13,962,572

Cashflow Before Funding

     USD        178,730,749       (33,219,769     (41,515,550     97,250,781       43,288,839       32,520,495       46,292,558       43,710,407       8,209,683       (17,806,693

Cashflow Before Tax

     USD        178,730,749       (33,219,769     (41,515,550     97,250,781       43,288,839       32,520,495       46,292,558       43,710,407       8,209,683       (17,806,693

Tax Paid

     USD        (25,352,526     (169,482     (167,309     (5,099,687     (3,232,502     (4,586,767     (6,543,604     (5,279,478     (184,483     (89,216

Net Cashflow

     USD        153,378,223       (33,389,251     (41,682,859     92,151,094       40,056,337       27,933,729       39,748,954       38,430,929       8,025,200       (17,895,909

Ounces Payable

     ounces        484,166       35,654       23,400       100,499       72,306       66,254       74,650       61,026       38,055       12,320  

Gold Price

    
USD/
oz

 
     2,750       2,750       2,750       2,750       2,750       2,750       2,750       2,750       2,750       2,750  

Cash Cost


Royalty and Operating Cost

     USD        1,005,157,905       93,537,501       98,589,806       150,186,725       138,069,306       130,332,171       143,450,789       122,134,040       88,201,392       40,656,177  

Cash Cost

     USD        1,005,157,905       93,537,501       98,589,806       150,186,725       138,069,306       130,332,171       143,450,789       122,134,040       88,201,392       40,656,177  

Cash Cost

    
USD/
oz

 
     2,076       2,623       4,213       1,494       1,910       1,967       1,922       2,001       2,318       3,300  

All-in Sustaining Cost


Cash Cost

     USD        1,005,157,905       93,537,501       98,589,806       150,186,725       138,069,306       130,332,171       143,450,789       122,134,040       88,201,392       40,656,177  

Sustaining Capital

     USD        144,919,176       32,224,199       18,108,819       20,593,017       15,874,648       12,394,760       13,453,508       11,486,845       6,820,808       13,962,572  

All-in Sustaining Cost

     USD        1,150,081,546       125,761,700       116,698,625       170,779,899       153,944,276       142,727,326       156,904,937       133,623,317       95,022,450       54,619,015  

All-in Sustaining Cost

    
USD/
oz

 
     2,375       3,527       4,987       1,699       2,129       2,154       2,102       2,190       2,497       4,433  

Project Cashflow (unfinanced)


Revenue

     USD        1,328,812,296       97,853,880       64,222,781       275,823,877       198,447,769       181,837,035       204,880,336       167,489,136       104,443,793       33,813,689  

Operating Cost

     USD        (900,684,688     (86,285,764     (93,948,250     (130,157,090     (123,641,981     (117,078,251     (125,467,678     (107,437,017     (78,997,603     (37,671,052

Working Capital Adjustment

     USD        0       (5,311,948     10,960,294       (7,793,197     (1,214,654     (6,589,214     (1,682,841     9,844,588       (1,211,660     2,998,633  

Royalty

     USD        (104,473,217     (7,251,737     (4,641,556     (20,029,635     (14,427,325     (13,253,919     (17,983,111     (14,697,023     (9,203,789     (2,985,125

Sustaining Capital

     USD        (144,919,176     (32,224,199     (18,108,819     (20,593,017     (15,874,648     (12,394,760     (13,453,508     (11,486,845     (6,820,808     (13,962,572

Tax Paid

     USD        (25,352,526     (169,482     (167,309     (5,099,687     (3,232,502     (4,586,767     (6,543,604     (5,279,478     (184,483     (89,216


September 2026


SRK Consulting (U.S.), Inc.

SEC Technical Report Summary – Granite Creek

   Page 390


Project Net Cashflow

     USD        153,378,223        (33,389,251     (41,682,859     92,151,094        40,056,337        27,933,729        39,748,954        38,430,929        8,025,200        (17,895,909

Cumulative Net Cashflow

     USD           (33,389,251     (75,072,111     17,078,984        57,135,320        85,069,049        124,818,003        163,248,932        171,274,132        153,378,223  

Operating Cost (LOM)


Mining Cost

     USD        395,983,226        33,170,017       40,658,268       52,583,668        56,857,053        55,329,645        57,780,356        48,306,983        35,362,501        15,934,735  

Surface Costs

     USD        117,851,064        7,026,057       13,480,558       14,925,111        15,626,448        15,719,939        15,978,152        15,154,514        12,020,119        7,920,165  

G&A

     USD        49,866,263        3,231,194       5,818,831       5,908,652        6,269,214        6,167,417        5,974,413        6,137,881        5,822,452        4,536,208  

Power Costs

     USD        32,773,646        1,836,886       3,328,773       3,711,340        4,126,599        4,174,254        4,179,053        4,154,765        4,152,659        3,109,316  

Processing Costs

     USD        304,210,489        41,021,610       30,661,819       53,028,319        40,762,668        35,686,995        41,555,702        33,682,875        21,639,872        6,170,629  

Total Opex

     USD        900,684,688        86,285,764       93,948,250       130,157,090        123,641,981        117,078,251        125,467,678        107,437,017        78,997,603        37,671,052  

Mining Profile


Autoclave Ore Mined

     tons        2,358,273        178,372       211,605       364,078        363,697        318,582        371,124        301,639        193,888        55,287  

Oxide Ore Mined

     tons        36,171        8,531       12,885       5,147        3,623        2,764        2,862        359        —         —   

Autoclave Ore Mined

     tonnes        2,139,392        161,816       191,965       330,286        329,941        289,013        336,678        273,643        175,893        50,156  

Oxide Ore Mined

     tonnes        32,814        7,739       11,689       4,669        3,287        2,508        2,596        326        —         —   

Autoclave Ore Grade

     oz/ton        0.23        0.22       0.22       0.22        0.22        0.23        0.23        0.23        0.24        0.27  

Oxide Ore Grade

     oz/ton        0.29        0.34       0.24       0.35        0.26        0.31        0.28        0.09        —         —   

Autoclave Ore Grade

     g/t        7.85        7.52       6.11       6.31        6.35        6.63        6.48        6.62        6.66        7.57  

Oxide Ore Grade

     g/t        10.02        9.72       6.89       9.97        7.47        8.86        7.99        2.58        —         —   

Autoclave Ore Ounces Mined

     ounces        539,738        39,139       45,825       81,471        81,810        74,850        85,274        70,767        45,768        14,835  

Oxide Ore Ounces Mined

     ounces        10,573        2,939       3,145       1,818        959        868        811        33        —         —   

Production Profile


Autoclave Gold Recovered

     ounces        478,095        34,352       22,138       98,172        71,766        65,778        74,231        61,158        38,150        12,351  

Oxide Gold Recovered

     ounces        7,284        1,392       1,321       2,579        721        643        606        22        —         —   

Gold Price

    
USD/
oz

 
     2,750        2,750       2,750       2,750        2,750        2,750        2,750        2,750        2,750        2,750  

Cash Cost

    
USD/
oz

 
     2,076        2,623       4,213       1,494        1,910        1,967        1,922        2,001        2,318        3,300  

AISC

    
USD/
oz

 
     2,375        3,527       4,987       1,699        2,129        2,154        2,102        2,190        2,497        4,433  

Capital Cost


Mine Capex

     USD        60,739,069        16,606,202       11,785,494       10,306,973        6,693,201        4,364,800        4,364,800        4,364,800        2,252,800        —   

Autoclave Capex Allocation

     USD        49,326,013        —        2,952,940       8,577,679        8,568,711        7,505,803        8,743,674        7,106,626        4,568,008        1,302,572  

Surface Capitalized Costs

     USD        22,194,094        15,617,998       3,370,385       1,708,365        612,736        524,157        345,033        15,419        —         —   

Closure

     USD        12,660,000        —        —        —         —         —         —         —         —         12,660,000  


Total

     USD        144,919,176        32,224,199       18,108,819       20,593,017        15,874,648        12,394,760        13,453,508        11,486,845        6,820,808        13,962,572  


Source: SRK, 2026


September 2026


SRK Consulting (U.S.), Inc.

SEC Technical Report Summary – Granite Creek

   Page 391


LOGO

Source: SRK, 2026

Figure 19-7: Annual Cash Flow Summary


19.3

Sensitivity Analysis

A sensitivity analysis was performed to determine the relative sensitivity of the Project’s NPV to a number of key parameters (Figure 19-8). This is accomplished by flexing each parameter upwards and downwards by 10%. Within the constraints of this analysis, the Project appears to be most sensitive to metal price recovery assumptions within the processing plant and mined grades.

SRK cautions that this sensitivity analysis is for information only and notes that these parameters were flexed in isolation within the model and are assumed to be uncorrelated with one another which may not be reflective of reality. Additionally, the amount of flex in the selected parameters may violate physical or environmental constraints present at the operation.


September 2026


SRK Consulting (U.S.), Inc.

SEC Technical Report Summary – Granite Creek

   Page 392


LOGO

Source: SRK, 2026

Figure 19-8: Sensitivity Analysis


September 2026


SRK Consulting (U.S.), Inc.

SEC Technical Report Summary – Granite Creek

   Page 393


20

Adjacent Properties

Most of the mineral rights surrounding Granite Creek are owned or controlled by Nevada Gold Mines. The only reported mining activities adjacent to Granite Creek were conducted by Nevada Gold Mines at the Turquoise Ridge Complex (TRC) where approximately 28 Moz Au have been produced since 1938 to 2023 (Figure 20-1). The TRC is in Humboldt County, approximately 64 km (40 mi) northeast of Winnemucca and approximately 10 km (6 mi) north of the Granite Creek Mine. Historic and current production at TRC includes open-pit and underground mining.


LOGO

Source: Barrick, 2024

Figure 20-1: Summary of Gold Production at Turquoise Ridge (as reported by Barrick 2024)

Deposits that compose the TRC are Carlin-type, structurally and stratigraphically controlled and sediment-hosted. They contain disseminated micrometer-sized gold occurring on arsenic-rich pyrite rims, primarily within decalcified, carbonaceous rocks. Preferred host lithologies for gold mineralization are the Comus Formation, followed by the Valmy and Etchart Formations. Sub-microscopic gold mineralization is associated with arsenian pyrite, quartz, calcite, realgar, and orpiment. Gold mineralization is likely Eocene in age, and it is overprinted in some areas by a late stage of realgar, orpiment, and calcite. Gold-bearing zones can be located close to granodiorite and dacite dikes and beneath basaltic sills, evidencing the importance of rheologic contacts to mineralization (Barrick., 2024). The most recent public disclosure of the Mineral Resources and Mineral Reserves for the Project are reported in the technical report entitled “NI 43-101 Technical Report on the Turquoise Ridge Complex Humbolt County, Nevada, USA”, dated March 15, 2024, with an effective date of December 31, 2023. A summary of the Mineral Resource and Mineral Reserve statements are shown in Figure 20-2 and Figure 20-3. The QP has been unable to verify the information on production,


September 2026


SRK Consulting (U.S.), Inc.

SEC Technical Report Summary – Granite Creek

   Page 394


mineral resources and mineral reserves included for the adjacent properties. This type of adjacent property information is not necessarily indicative of the mineralization at Granite Creek. In addition, the QP is not aware of any declared mineral resource that might have an impact on Granite Creek’s Mineral Resources, Mineral Reserves or mining operations.


LOGO

Source: Barrick, 2024

Figure 20-2: Barrick Mineral Resource Statement for Turquoise Ridge (effective date December 31, 2023) – reported on 100% basis


LOGO

Source: Barrick, 2024

Figure 20-3: Barrick Mineral Reserve Statement for Turquoise Ridge (effective date December 31, 2023) – reported on 100% basis


September 2026


SRK Consulting (U.S.), Inc.

SEC Technical Report Summary – Granite Creek

   Page 395


21

Other Relevant Data and Information

There is no other relevant data or information necessary to make this Technical Report Summary understandable and not misleading beyond what has already been disclosed in the preceding items of this report.


September 2026


SRK Consulting (U.S.), Inc.

SEC Technical Report Summary – Granite Creek

   Page 396


22

Interpretation and Conclusions

Drilling

A total of 2,083 drillholes for 291,312 m (955,748 ft) have been completed at the Property since 1970 by successive operators, including PMC and its predecessors, Homestake, Barrick, and Atna. Since acquiring the Property in 2021, i-80 Gold has completed a further 1,083 drillholes for 123,804 m (406,181 ft) within the current property boundary, comprising 438 core holes for 93,552 m (306,929 ft) (including RC pre-collars with core tails) and 645 RC holes for 30,252 m (99,252 ft).

The i-80 drilling has completed definition and infill of the underground Ogee, Otto, and SPZ mineralization, and has expanded substantially year on year: approximately 69 holes in 2021, 154 in 2022, 278 in 2023, 185 in 2024, and 379 in 2025, the latter marking the introduction of underground production drilling alongside continuing surface drilling. Drilling continued into Q1 2026 as the tail of the 2025 deep SPZ infill campaign together with the start of a new exploration program targeting the Ogee, Otto, Adam Peak, and Range Front fault systems. All holes supporting the current estimate were drilled between April 2021 and January 2026, with complete assay results returned by February 17, 2026, the database cut-off date for this study.

Surface holes are generally pre-collared using RC to the water table and completed with HQ-diameter core; underground holes have been drilled entirely as HQ core. Two RC water wells and one RC piezometer were also drilled and sampled. Short-term ore-control RC drilling completed with a Cubex rig is used by mine geologists for grade-control decisions only and is not merged into the resource database.

A separate geotechnical drilling program of approximately 6,100 m (20,000 ft) across 40 holes has been completed to support underground mine design, incorporating Rock Mass Rating logging, acoustic televiewer surveys in 11 holes, and dedicated geotechnical holes for the VR1 and VR2 vent raises.

Core recovery across the i-80 programs is reported at 99% or greater, with recorded core loss limited to short intervals where voids are present in the stratigraphy. Sample intervals are assigned by the project geologist and are not permitted to cross geological, alteration, or oxidation boundaries, and do not exceed 3.05 m (10 ft); average core sample length from 2023 through Q1 2026 has been 1.25 to 1.46 m (4.1 to 1.5 m (4.8 ft)), with nominal 0.61 to 1.52 m (2 to 2 m (5 ft)) intervals through mineralized zones. Downhole surveys are completed on all holes at 15.25 m (50 ft) intervals by an independent contractor using north-seeking gyroscopic tools, and all geological and geotechnical logging is recorded directly into the acQuire database management system. Sample security and chain of custody are maintained from the drill site through to the laboratory, with no chain-of-custody breaches reported over the period.

No QA/QC data is available for the pre-2005 portion of the historical dataset; however, the volume of subsequent drilling completed under the modern QA/QC framework is sufficient to support the MRE without exclusive reliance on the unverified historical data, and therefore it is the QP’s opinion that it is not material.

Drilling programs completed at the Property between 2005 and 2015 incorporated QA/QC monitoring through the insertion of CRMs, blanks, and duplicates. These programs were reviewed by the prior QPs, most recently by GRE (2025), which found no material errors and concluded the historical assay database to be acceptable for Mineral Resource estimation, subject to observations on insertion rates and duplicate precision typical of programs of that era. The QP has also reviewed this data and agrees with these conclusions.


September 2026


SRK Consulting (U.S.), Inc.

SEC Technical Report Summary – Granite Creek

   Page 397


Since 2021, and formalized from the 2023 program onward, i-80 has operated a four-stream QA/QC program comprising CRMs, coarse blanks, field duplicates, and preparation duplicates, supplemented by independent third-party check assays. The program targets an overall control-sample insertion rate of 20% of submitted samples. The 2021 and 2022 programs operated under a transitional framework at aggregate rates of approximately 13% to 21%. Sample preparation and analysis have been performed throughout by independent ISO/IEC 17025-accredited commercial laboratories, being ALS through 2024 and MSA Labs as principal laboratory from 2025.

CRM performance, assessed at two and three standard deviations of the certified mean, showed no consistent bias across the principal standards used. i-80 2,353 blanks inserted over the i-80 era, 89.8% returned values below the 5x lower-limit-of-detection design threshold; applying a materiality floor at 10x detection limit, consistent with the QP’s assessment of what constitutes material contamination, raises the effective pass rate to >92.5% with the majority of the failures concentrated in batches assayed at the Lone Tree in-house laboratory rather than distributed across the independent commercial laboratories.

Duplicate performance was assessed against tolerance envelopes derived using the Thompson and Howarth (1978) framework, with preparation duplicates returning an R-squared of 0.99 across the program and 0.9997 in Q1 2026, which indicates a strong correlation between laboratories. There is, a gap in Third-party check assays programs between 2023 and early 2024, which the QP discussed with i-80, and it was noted as a datatype labelling issue in the database versus a lack of submissions. This is recommended to be addressed in the database. The program recommenced, and the data labelling fixed from 2025; across the full population of 543 check samples from 49 holes, the mean bias is -6.5% and the median -3.5% relative to the primary assay, with 75.3% of pairs agreeing within plus or minus 10%, which the QP on review has deemed acceptable.

The transition of the primary gold method from conventional fire assay to Chrysos Photon Assay in 2025 was independently validated by the QP in a three-way comparison against conventional Fire Assay and Screen Fire Assay, returning coefficients of determination in excess of 0.994 against both reference methods with a small positive bias in the Photon Assay results that is mechanistically explained by, and consistent with, the substantially larger effective sample mass analyzed. The QP separately compared the assay database against original laboratory certificates across 138 certificate files and 14,127 sample rows, confirming a 99.90% match on gold values for the 7,188 directly comparable samples; the small number of residual items were resolved as laboratory re-run reconciliations or database ingest gaps of negligible grade impact and have been provided to i-80 for correction.

It is the QP’s opinion that the drilling and sampling completed at Granite Creek are of a type, quantity, quality, and spatial distribution appropriate to the style of mineralization, and that the drilling, sampling, sample preparation, analytical, and security procedures applied across both the historical and i-80 programs are adequate and reasonable for use in the Mineral Resource estimation process. The QP further considers the resulting database adequate to support the Mineral Reserve estimate and the technical disclosures presented in this Report, consistent with Society for Mining, Metallurgy and Exploration (2017) and the disclosure requirements of S-K 1300.


September 2026


SRK Consulting (U.S.), Inc.

SEC Technical Report Summary – Granite Creek

   Page 398


Environmental and Permitting

The environmental and permitting information reviewed indicates that Granite Creek is well characterized and currently operating under an established, in-good-standing permit base, supporting reasonable confidence that environmental and permitting factors will not materially disrupt continued operations or the reliability of the underlying resource and reserve estimates. The principal uncertainty affecting projected economic outcomes is the 2025 discovery of petroleum-contaminated soil in the CX Pit backfill: because the extent of contamination is not precisely known, remediation could require re-handling of up to 1.17 million tons of waste rock at a cost that is not yet quantified, and this remains an open-ended exposure until Osgood and NDEP-BMRR finalize a management plan. A related, lower-order uncertainty is the site’s reclamation and closure cost estimate (US$8.64 million), which reflects a government cost model rather than Osgood’s actual self-performed costs, will be revised at the next three-year bond review (2028 to 2029), and may shift further as site conditions evolve ahead of the anticipated 2032 closure. Ongoing management of elevated arsenic and antimony in site water, and the designated status of the Kelly Creek hydrographic basin under Nevada water law, add continuing operating costs and a modest constraint on securing incremental water rights, respectively, but neither is expected to limit the project’s ability to operate under its existing permits. None of these risks and uncertainties are considered reasonably likely to threaten the project’s overall economic viability, as they are cost and scheduling matters addressable through established treatment technologies and routine regulatory processes rather than threats to continued permitting, access, or operation of the Project.

Metallurgy

Granite Creek underground samples were refractory with baseline CIL gold recoveries ranging from 9% to 46%, averaging 31%;

Shake flask tests with gold cyanide spikes were used to determine preg robbing index. The average preg-robbing index was 17.9%, ranging from 4.4% to 54.1%.;

Bench top autoclave batch pressure oxidation tests were completed on all samples with 2 sets of acid conditions and four sets of alkaline conditions. Acid conditions resulted in higher sulfur oxidations and higher gold recoveries;

Three continuous pressure oxidation runs were completed with two acid and one alkaline sets of conditions based on the batch results. The continuous results followed the results of the batch tests with the acid conditions producing higher sulfur oxidations and gold recoveries. High acid additions required for high carbonate samples resulted in lower sulfide oxidation and pressure oxidation viscosity issues;

Overall gold recoveries increased with increasing sulfur oxidation;

Cyanide destruction tests on CIL tailings using the SO2/air process reduced weak acid dissociable cyanide concentrations to below 5 mg/L using established reagent addition rates and retention time;

Thickening and filtration tests on CIL tailings showed high thickening unit area requirements and low filtration rates.

Arsenic concentrations in the samples averaged 0.29%, largely occurring as arsenian pyrite with only trace amounts of arsenopyrite.

Sulfide minerals were predominantly pyrite with some marcasite.


September 2026


SRK Consulting (U.S.), Inc.

SEC Technical Report Summary – Granite Creek

   Page 399


Mercury concentrations ranged from 31 ppm to 138 ppm, averaging 81 ppm. These concentrations will require mercury capture and abatement equipment in the process flowsheet.

Sample Representativity

Samples were selected to provide spatial and grade representation of three zones in the Granite Creek underground deposit as seen in Figure 10-16 and Figure 10-17. The samples’ metallurgical response is likely to represent the zone’s general behavior, but additional sampling of each zone to confirm the metallurgical response will reduce uncertainty. The 33 samples tested in the FLS and SGS programs provide the required coverage for this study. Grade distributions of the samples as outlined in section 13.2.2, reflect grade distributions with the resource.

Test Work on Underground Samples

The two recent testwork programs and one historical program confirm that refractory Granite Creek samples are amenable to pressure oxidation followed by CIL to provide acceptable gold recoveries. While the samples respond to both alkaline and acid pressure oxidation, superior recoveries were achieved with acid pressure oxidation. The results confirm that Granite Creek production can be processed through the Lone Tree acid pressure oxidation conditions once restarted. The testwork also confirmed that Granite Creek production can be processed through acid pressure oxidation at third party processors.

Mineral Resources

The Mineral Resource for the Granite Creek deposit comprises both open pit and underground components. These have been estimated separately by GRE (open pit) and SRK (underground) using block modeling methods appropriate to each mining environment.

The open pit Mineral Resource was estimated by GRE and remains unchanged in terms of input technical information, drilling and sampling from the previously disclosed estimate; however, GRE has updated the assessment of reasonable prospects for economic extraction (RPEE) to reflect the updated resource gold price. The Mineral Resources for the Granite Creek open pit mine project were estimated in conformity with the Society for Mining, Metallurgy and Exploration (2017) guidelines and are reported in accordance with the S-K 1300. This mineral resource estimate includes Inferred Mineral Resources. Inferred resources are defined as resources that are “…reasonably expected that the majority of the Inferred Mineral Resources could be upgraded to indicated.” by additional drilling. There is also no certainty that the Inferred Mineral Resources will be converted to the Measured or Indicated categories through further drilling or into Mineral Reserves, once economic considerations are applied. Mineral Resources are not Mineral Reserves and do not have demonstrated economic viability. There is no certainty that all or any part of the mineral resource will be converted into Mineral Reserves. The project presently has no Mineral Reserves. Whittle Pit optimization was applied to the open pit mineral resource estimate to assess the reasonable prospects for economic extraction for the resource.

In the opinion of the QP, the Mineral Resource model presented in this report is representative of the informing data, which is of sufficient quality and quantity to support the Mineral Resource estimate to the classifications applied.

The underground Mineral Resource has been estimated by SRK Consulting. SRK completed the MRE process using the updated exploration database which targeted the underground operation completed by i-80.


September 2026


SRK Consulting (U.S.), Inc.

SEC Technical Report Summary – Granite Creek

   Page 400


The open pit Mineral Resource was estimated by GRE, and remains unchanged in terms of input technical information, drilling and sampling from the previously disclosed estimate; however, GRE has updated the assessment of reasonable prospects for economic extraction (RPEE) to reflect the updated resource gold price. The effective date of both the open pit and underground MREs is March 31, 2026.

For the underground Mineral Resource, which is the focus of current mining and near-term development, mineralization is modeled within three principal structurally controlled domains: Ogee, Otto, and the SPZ, with a fourth smaller domain defined in the SPZhw, located above the CX West Fault. Each of these is subdivided into high-grade (HG) and low-grade (LG) sub-domains.

Domain boundaries were defined using indicator grade shells at a nominal 0.5 g/t (0.015 oz/st) Au threshold for the low-grade and 1.5 to 2.5 g/t (0.073 oz/st) Au for the high-grade (refined using an ISO-value of approximately 0.44 to 0.45 probability). The domains have been constrained geologically by key structural elements including the CX West Fault, Range Front Fault, and the interpreted domain boundaries A, B, and C. These interpretations were cross-checked against underground grade-control data and verified during the QP’s site inspection of active mine headings.

Gold grades were estimated using capped 1.53 m (5 ft) composites and a combination of Ordinary Kriging and Inverse Distance Weighting. Search orientations and variogram models were aligned with the principal fault and vein orientations that control each domain. Gold grade continuity supports the use of orientated domain-specific variogram models for the Ogee, Otto, and SPZ (HG and LG) domains. Whereas sample density in the SPZhw sub-domain was insufficient to support a robust directional variograms and therefore omni-directional variograms were applied. Estimation parameters were refined using Kriging Neighborhood Analysis (KNA), resulting in a first-pass search using 9–12 composites (maximum 4 composites per hole, reduced to 3 in the final pass, which equates to a minimum of 3 holes in the first pass and 2 holes in the second and third passes).

Geometallurgical parameters (cyanide-soluble gold, total organic carbon [TOC], preg-robbing indices [PregRob], sulfide sulfur, and carbonate [CO₃]) were estimated within the same domain framework and using the same orientation concepts as gold. These estimates were supplemented with underground muck-sample data to improve local coverage, particularly in the upper Ogee and Otto areas where exploration-drilling coverage for these parameters is limited. Oxide and sulfide boundaries have been defined based on visual logging of the drilling which were interpretated using indicator values for the highest oxidation state, which was then combined with additional oxide domain models provided by i-80, with the results compared to the logging and sulfur grades for confirmation.

Block model validation, including visual checks, statistical comparisons, and swath-plot comparisons against composites and Nearest Neighbor (NN) estimates, indicates no material local bias existed based on the comparison of the declustered composite mean, nearest neighbor and block estimates. High-grade domain estimates are within approximately 5% of declustered composite means.

Mineral Resources are classified as Measured, Indicated, or Inferred in accordance with the SME Definition Standards (SME, 2017), based on drilling density, the number of composites and drillholes informing each block estimate, and geostatistical confidence measures (estimation variance and slope of regression).


September 2026


SRK Consulting (U.S.), Inc.

SEC Technical Report Summary – Granite Creek

   Page 401


Resources are reported on a diluted basis within stope shapes generated MSO (Deswik MSO), at an average cut-off grade of 3.38 to 9.81 g/t (0.286 oz/st) Au, based on a gold price of US$3,250/oz, variable recoveries (range between 37.2 % to 97.0 % for the autoclave and 30.0 % to 86.5 % for the oxide material) and reasonable assumptions for mining, processing, and general and administrative costs.

It is the QP’s opinion that the underground and open pit MREs for Granite Creek are based on adequate exploration and production data, utilize estimation methods and classification criteria appropriate for the style of mineralization, and are reasonable for public disclosure as Mineral Resources under NI 43-101. Mineral Resources that are not Mineral Reserves do not have demonstrated economic viability.

Mineral Reserves

Mineral Reserves were classified using the Society for Mining, Metallurgy and Exploration (2017) Standards for Mineral Resources and Mineral Reserves. Indicated Mineral Resources were converted to Probable Mineral Reserves by applying the appropriate modifying factors, as described herein, to potential mining shapes created during the mine design process. In the same manner, Measured Mineral Resources were converted to Proven Mineral Reserves.

Mineral Reserves are subject to risks typically associated with drift and fill operations. These risks could affect the reserves and include, but are not limited to, the following:


Differences between the Mineral Reserves metal price assumption and actual metal prices.


Changes in the interpretation of the deposit geometry and continuity.


Changes to the estimated gold grades for the deposit.


Changes to mining, processing, and G&A costs used to determine the cut-off grade.


Changes to metallurgical recovery rates.


Changes in the geotechnical assumptions leading to potential impacts to schedule, dilution and/or mining recovery.


Changes to mining method in portions of the deposit.


Assumptions related to ongoing access to the site, retention of mineral tenure, obtaining necessary environmental, mining, and other regulatory permits, and maintaining a social license to operate with relevant stakeholders.

Mining and Infrastructure

Mining

Mine infrastructure has been completed. Production ramp up has reached approximately 600 ore tons per day. The mining contractor is in place with the full complement of equipment and personnel.

Decline development has accessed 700 vertical ft of mineralization of the Otto and Ogee zones. Development has reached the top of the SPZ allowing additional active production stopes.

The drill lateral drift over the SPZ has been completed.

Reconciliation of the model to mill indicates process head ounces exceed model by 19%. This appears to be from mining in a larger low-grade halo around high grade core.

Processed grade is lower than the life-of-mine planned grade due to extensive mining of marginal mineralization below the economic cut-off grade.


September 2026


SRK Consulting (U.S.), Inc.

SEC Technical Report Summary – Granite Creek

   Page 402


Mine Ventilation

After a comprehensive review of ventilation data and analysis, WSP concludes that the recommendations in this report are adequate to support pre-feasibility level design. WSP’s experience indicate that these methods and design parameters are in line with best practices at other successful operations in the region. i-80 has been operating the Granite Creek Mine since 2022 without major complications. In addition, the technical staff and mining workforce draw from extensive experience in the region, further increasing the confidence in successfully mining the South Pacific Ore body. Outside adjustments made within normal mining practices, WSP does not foresee any major complications that would drastically impact the pre-feasibility estimates proposed in this report.

Infrastructure

Previous operators of the Granite Creek Project constructed a large portion of the infrastructure required to operate the Granite Creek underground mine. This includes:


Connection to the NV Energy grid


5 MW substation


13.8 kV distribution network


Administration building


Dry facilities


Three of the active dewatering wells


Two of the four permitted rapid infiltration basins

Since acquisition of the project, i-80 has added to the existing infrastructure with completion of:


Dewatering well GCW5


Deepening of well BPW5 to 677 m (2,220 ft)


Expansion of the dry facilities to accommodate 176 personnel


Installation of a rental Water Treatment Plant to treat 800 gpm of dewatering water for discharge to the ribs

Infrastructure construction in progress includes:


Drilling and completion of dewatering wells GCW14 and GCW15


Construction of a 3,300 gpm water treatment plant


Construction of the two remaining permitted RIBs


Expansion of the contact water handling system and tie-in into the water treatment circuit

After completion of the infrastructure construction currently underway, the electrical power distribution, dewatering, water treatment, administrative and related support infrastructure will be adequate to support the planned underground mine operations.

Economics

The Granite Creek operation consists of an underground mine with no onsite processing facility that mines and transports gold ore to offsite processing facilities. The operational life as modeled for this analysis is approximately 9 years. Under the forward-looking assumptions modeled and documented in this report, the operation is forecast to generate positive cumulative cash flow. However, the Project does not generate positive free cashflow in 2026 and 2027 largely due to the higher processing costs incurred as a result of third-party processing of ore and a six-month stockpiling period in 2027.


September 2026


SRK Consulting (U.S.), Inc.

SEC Technical Report Summary – Granite Creek

   Page 403


Cashflow is forecast to be negative at the end of the operational life as the operation winds down, and closure costs are incurred. This estimated cash flow is inherently forward-looking and dependent upon numerous assumptions and forecasts, such as macroeconomic conditions, mine plans and operating strategy, that are subject to change.

The results demonstrate that at a gold price of US$2,750/oz the after-tax NPV @ 5% is US$118 million.

The sensitivity analysis performed indicates that the operation’s NPV is most sensitive to metal price, recovery assumptions and mined grades.

Risks and Uncertainties

Risks

Environmental and Permitting


Petroleum-contaminated soil discovered in 2025 within CX pit backfill – location not precisely known, so remediation could require re-handling of up to 1.17 million tons of waste rock at a cost that isn’t yet quantified.


Reclamation / closure cost estimate (US$8.64 million) is based on a government cost model, not Osgood’s actual self-performed costs, and is due for revision at the next three-year bond review (2028 to 2029) – actual future liability could differ.


Ongoing reliance on water treatment for dewatering water discharged to the RIBs could impact operating cost that continues for the operational life of mine.


Kelly Creek hydrographic basin is designated for closer administration by the Nevada State Engineer, which could make it harder to secure additional water rights if the project needs more in the future.


Regulatory reference values can tighten over time (arsenic/antimony standards were lowered in 2006), which is a precedent for future standards potentially affecting compliance costs.

Recovery Methods

While acid pressure oxidation provides higher gold recoveries and alkaline pressure oxidation, testing of Granite Creek samples showed high acid additions required for high carbonate samples results in low sulfide oxidation and slurry viscosity problems. Careful blending of Granite Creek production will be required to ensure these problems do not occur at the Lone Tree pressure oxidation facility during operations.

Lone Tree tailings management will rely on filtered tailings disposal. Testing has shown low filtration rates for tailings samples. Efficient operation and maintenance of the tailings filters will be required to ensure design operating time is achieved to avoid unplanned downtime.

Opportunities

Mining


Upgrade of some or all the Inferred Mineral Resources to higher-confidence classification categories, with additional drilling and supporting studies, such that this higher confidence material could potentially be converted to mineral reserves.


Exploration and step out drilling for the potential to expand the mineral resource inventory, with potential resource to reserve conversion.


September 2026


SRK Consulting (U.S.), Inc.

SEC Technical Report Summary – Granite Creek

   Page 404


There is potential for a positive impact to the operating cost by considering owner operated operation instead of the current contractor operated operation.

Environmental and Permitting


All permits required for current operations are already held and in good standing, with no permitting actions pending before the BLM or NDEP – low near-term permitting risk.


Legacy tailings storage facilities have already been reclaimed and released from financial assurance, removing a common source of closure liability.


Attenuation study to support site specific discharge requirements to reduce WTP operational costs.


Improvement of productivity/production rates as dewatering operations are implemented, and passive inflow to the underground workings is decreased.


Arsenic treatment technology (WTP, ferric sulfate dosing) is already proven at this site, de-risking the main long-term water quality contingency.


No onsite processing or new tailings generation under the current plan, which limits the project’s environmental footprint and closure complexity relative to a milling operation.


Nearly three decades of consistent geochemical data (1998 to 2025) show waste rock is reliably non-acid-generating, supporting confidence in the mine plan without unexpected ARD-related costs.


Established, positive community relations track record (town halls, regional partnerships) with no unresolved stakeholder conflicts.


An additional 1,364 AFA of water rights is currently ‘Ready for Action’ with NDWR and could be secured to support future expansion.


September 2026


SRK Consulting (U.S.), Inc.

SEC Technical Report Summary – Granite Creek

   Page 405


23

Recommendations


23.1

Recommended Work Programs

Metallurgical Testing


Conduct additional variability sampling using the most recent mine plan to select samples to provide additional recovery information to further populate recovery models.


Testing should attempt to establish head grade and extraction relationships for use in more detailed resource modelling;


Mineralogy impacts need to be established and geologic domains within each resource need to be determined;


Testing of additional samples to provide comminution data to assess hardness variability within the zones and any potential impacts on throughput in the Lone Tree process plant.


The estimated cost for the suggested next phase metallurgical program is US$150,000 based on current market pricing.

Geology

The QP considers that the drilling and sampling information is sufficiently reliable to interpret the boundaries of the mineralized structures and domain interpretations, and that the sample grade data are sufficiently reliable to support the MRE.

The 2027–2028 exploration program targets five zones at Granite Creek: the CX Fault depth/north extension, Rangefront and Adam Peak, the Ogee Zone, SPZ infill and depth extension, and the SPZ/ Rangefront /Mag structural intersection.

The combined drill program comprises 128 planned drillholes totaling 32,614 m (107,000 ft). plus associated CX Fault underground development and a gravity survey at the SPZ/Rangefront/Mag intersection. The proposed work program has an estimated cost of US$16M based on current conditions and is defined in Table 23-1.

In the opinion of the Qualified Person, the proposed program is technically reasonable and appropriately sequenced, with Rangefront and Ogee prioritized ahead of active and planned underground development to reduce the risk of mining ahead of drill data, while the CX Fault program advances the known oxide-to-sulfide transition at depth. If successful, the program has the potential to add additional mineral resources at Rangefront, Adam Peak, Ogee, and the SPZ / Rangefront / Mag intersection, and to upgrade a portion of the existing SPZ inferred resource to the indicated category. In addition, mineralization drilled at the CX fault target could result in this area being brought into the mine plan in the near future, allowing flexibility in the mine plan for more active faces and mined tonnage.

Upon completion of the above items, an update to the geologic model and MRE should be conducted, along with updated metallurgical updated recovery assumptions.

Environmental and Permitting


The ongoing metals attenuation study should be completed, and its findings used to support site specific discharge requirements to optimize operational WTP costs.


September 2026


SRK Consulting (U.S.), Inc.

SEC Technical Report Summary – Granite Creek

   Page 406


The unpublished LRE post-closure Mag Pit Lake modeling should be finalized to firm up long-term closure water quality predictions.


Given the Kelly Creek basin’s designated status, Osgood should evaluate whether to proactively secure its 1,364 AFA of “Ready for Action” water rights before basin administration tightens further.


Ahead of the next three-year bond review (2028 to 2029), SRK recommends Osgood develops an independent, self-performed closure cost estimate, incorporating updated PCS remediation costs once known, to better anticipate the Project’s actual future reclamation liability rather than relying solely on the government SRCE model used for financial assurance.

None of these programs are expected to be material in cost relative to the Project, and none are prerequisites to continued operation under existing permits.

Infrastructure

The following recommendations are offered for improving costs and optimizing operations of the Granite Creek Underground Mine.


Perform a cost / benefit analysis for installing power factor correction at the Granite Creek electrical substation.


Install power meters to assist with optimization of costs by at a minimum distinguishing between underground and surface electrical consumption.


Evaluate the installation of a real time monitoring system with adequate flow meters, piezometers, and any other required instrumentation to optimize mine dewatering efficiency and costs.


Investigate the acquisition of a real time highwall monitoring system to provide early warning of a potential fall of ground, protecting workers, equipment and infrastructure.

Granite Creek Open Pit Technical Study

The Granite Creek open pit Mineral Resources were not included in the Mineral Reserve estimate or economic analysis presented in this Pre-Feasibility Study. Although the Open Pit was evaluated as part of the 2025 IA, the engineering and supporting technical information available as of the effective date of this Technical Report were not sufficiently advanced to support development of a PFS- or FS-level mine plan.

Since completion of the IA, additional trade-off work has been completed to evaluate alternative processing routes, production capacities, mine sequence, capital requirements, and development strategies for the open pit. This work was intended to support selection of a preferred development pathway and subsequent project advancement rather than establish a feasibility-level mine plan. The recent trade-off study specifically describes its purpose as evaluating realistic development pathways and relative performance rather than defining a feasibility-level mine plan.

Additional technical work is ongoing to advance the open pit towards a PFS level of definition. This work includes geotechnical characterization and design of proposed process and mine waste management facilities, evaluation of pit slope stability and development of appropriate geotechnical design criteria, further development of the selected processing configuration, additional drilling and testing, an updated MRE, mine planning and continued environmental and permitting activities. The current infrastructure program includes PFS-level HLF and TSF design supported by site characterization and geotechnical investigation.


September 2026


SRK Consulting (U.S.), Inc.

SEC Technical Report Summary – Granite Creek

   Page 407


It is recommended that the ongoing technical studies be completed and integrated into an updated open pit mine design, production schedule, capital and operating cost estimates, and economic analysis. Completion of this work will provide the technical basis required to evaluate the potential conversion of applicable open pit Mineral Resources to Mineral Reserves and potential incorporation of the open pit into a future Granite Creek development plan. The estimated cost of the recommended work program is summarized in Table 23-1.

The estimated costs presented in Table 23-1 are budgetary and are intended to provide an order-of-magnitude estimate of the expenditures required to advance the Granite Creek Open Pit to the next level of study. The PFS engineering and Technical Report estimate is based on recent comparable study proposals and excludes the separately identified geotechnical investigations, pit slope evaluation, and additional drilling and testing and metallurgical testing.

Ventilation

It is recommended that i-80 should monitor conditions and implement controls as necessary based on actual results to comply with MSHA regulations and provide a safe working environment. WSP recommends, in accordance with the cost specified in this report, that all headings are ventilated directly from the intake raises for better control of DPM and silica dust exposure, with the ductwork passing over air doors placed in the crosscuts that connect the decline to the intake raises. This method provides fresh air directly to working faces for an improved working environment. Additional investment could be made in enclosed cabs for the equipment items which currently have open cabs and in a study for the optimization of future raise locations. The investment in closed cab equipment would be the responsibility of the contract miner SMD, and it is assumed costs would not be passed through to i-80. WSP recommends a raise optimization ventilation study and estimates the cost to be approximately US$50,000. Further recommendations related to the geotechnical and construction risks and costs of the raise development are outlined in the Geotechnical portion of this section.

Geotechnical

Opportunities may exist to optimize the primary ventilation system and reduce capital costs through evaluation of alternate primary vent raise alignments. Potential alternatives could include shorter raise lengths and alignments located within more competent ground conditions, which may reduce construction complexity, ground improvement requirements, and long-term support needs. Advancement of an alternative raise alignment would require additional geotechnical investigation, including drilling of a dedicated geotechnical cover hole, televiewer logging, and completion of a geotechnical stability assessment to confirm feasibility and support design development.

The estimated cost of evaluating a 1000 ft alignment is US$210,000, comprising approximately US$150,000 for drilling, US$10,000 for televiewer surveying, and US$50,000 for geotechnical engineering assessment and reporting. This investigation would provide additional information to support optimization of the ventilation raise design and associated project capital costs.


23.2

Recommended Work Program Costs

Table 23-1 summarizes the costs for recommended work programs.


September 2026


SRK Consulting (U.S.), Inc.

SEC Technical Report Summary – Granite Creek

   Page 408


Table 23-1: Summary of Costs for Open Pit and Underground Recommended Work Programs


Recommended Work

   Estimated Cost
(US$M)
     Estimate Basis

Open Pit Focused Work

Open Pit PFS Engineering and Technical Report

     2.00      Budgetary
estimate based on
recent
comparable study
proposals

Infrastructure and Facility Geotechnical Studies

     0.54      Current proposal

Pit Slope Geotechnical Evaluation

     0.25      Budgetary
allowance

Additional Drilling and Testing

     3.00      Estimated footage
and unit rates

Additional Metallurgical Testing

     0.35      Budgetary
allowance based
on comparable
metallurgical test
programs

SubTotal

     6.14     

Underground Focused Work Programs

Exploration Drilling and Infill

     16.0      Estimated @
US$4 M per
annum

Raise optimization ventilation study

     0.05     

Ventilation Raise Alignment Geotechnical Evaluation

     0.21      Budgetary
estimate

SubTotal

     16.26     

US$M: US$ million


September 2026


SRK Consulting (U.S.), Inc.

SEC Technical Report Summary – Granite Creek

   Page 409


24

References

AMC, (2020). Technical Report Getchell Project NI 43-101 Technical Report, prepared for Premier Gold Mines Limited / Premier Gold Mines, USA, Inc., by AMC Consultants Pty Ltd, Nussipakynova, D., Humboldt County, Nevada, USA, July 23, 2020 / October 16, 2020, 200 pp.

AMC, (2019). Technical Report, Osgood Pinson Deposit NI 43-101 Technical Report, prepared for Osgood Mining Company, LLC, by AMC Mining Consultants (Canada) Ltd., Humboldt County, Nevada, USA, October 17, 2019, 219 pages.

Atna (2007). Technical Report Update Pinson Gold Property, Humboldt County, Nevada, USA, prepared for Atna Resources Ltd., by Mine Development Associates, Scott E. Wilson, Reno, Nevada, June 1, 2007, 122 p.

Barrick, (2008). Pinson Geological / Geophysical Targeting, prepared for Pinson Mining Company, by Barrick Gold Corporation, Elko, Nevada, 2008, Internal Exploration Report.

Beale, G., Feehan, T., (2005). Hydrology Related to the Proposed Pinson Declines, Reno, NV, Water Management Consultants, 2005.

Bieniawski, Z.T., (1976). Rock Mass Classifications in Rock Engineering, Johannesburg, Proceedings of the Symposium on Exploration for Rock Engineering, November 1976, 106p.

BLM, (2001). Granite Creek Administrative Draft Environmental Assessment N63-EA01-xx, prepared for Pinson Mining Company, by Bureau of Land Management, Winnemucca Field Office, Nevada, 2001,

Chadwick, T. H., (2002). Plate 1: Structure and Lithology of the CS, C and Portions of the A Pits, Humboldt Co., NV, Barrick Gold Exploration Inc. Pinson Mine, April 2002.

Chevillon, V. E., et al., (2000). Geologic Overview of the Getchell Gold Mine Geology, Exploration and Ore Deposits, Humboldt County, Nevada. [ed.] A. E.J. Crafford. Geology and Ore Deposits 2000: The Great Basin and Beyond, Geological Society of Nevada Symposium Proceedings. 2000, pp. 113-121.

Costmine Intelligence, (2024). Mine & Mill Equipment Cost Guide 2024 Underground Equipment, prepared for Costmine Intelligence, by InfoMine USA, Inc., Spokane Valley, 2024, Underground Equipment Volume.

Dames and Moore, (1975). Environmental Assessment, Pinson Project, Humboldt County, Nevada, Prepared for Lacanex Mining Company Ltd., Stored with William Harvey Gross Papers (Collection No. 09675). American Heritage Center, University of Wyoming, Laramie, WY.

Dawson, (2005). Dawson Autoclave Leach Report, prepared for Atna Resources Ltd., by Dawson Metallurgical Laboratories Inc., Salt Lake City, Utah, November 3, 2005, Report No. DML P-2895

Dawson, (2006a). Pinson Underground Project, Results of Head Analyses and Autoclave/Cyanide Leach Tests on Samples from the Atna-Pinson Project, Project No. P-2895A, B & C, April 14. 2006a.

Dawson, (2006b). Results of Sample Preparation and Head Analysis on Ogee Samples from the Atna-Pinson Project, Project No. P-2895D, April 24, 2006b.


September 2026


SRK Consulting (U.S.), Inc.

SEC Technical Report Summary – Granite Creek

   Page 410


Edmondo, G., McDonald, D. and Stanley, W. R., (2007). Technical Report Update Pinson Gold Property, Humboldt County, Nevada USA, June 2007, National Instrument 43-101 (NI 43-101) Technical Report.

Environmental Management Associates. 1992.

Enviroscientists, Inc., (2005). Water Pollution Control Permit Application – Pinson Exploration Infiltration Project, prepared for Atna Resources, by Enviroscientists, Inc. Water Management Consultants, 2005.

Fiddes, C., Langhans, J., Schmiesing, P., Becker, J., Webber, T., and Bottoms, S. (2024). NI 43-101 technical report on the Turquoise Ridge Complex, Humboldt County, Nevada, USA [Technical report]. Barrick Gold Corporation. https://s25.q4cdn.com/322814910/files/doc_downloads/operations/ngm/Turquoise-Ridge-Technical-Report-March2024.pdf, March 15, 2024

FLS, (2023). Osgood Mining Company - Granite Creek Thickening and Filtration Testing Report, prepared for Osgood Mining Company, by FLSmidth Inc., Jan. 25, 2023.

FLS, (2023). Osgood Mining Company - Granite Creek Pressure Oxidation, Carbon-in-leach Testing, Preg-Rob Testing, prepared for Osgood Mining Company, by FLSmidth Inc., Midvale, Utah, March 6, 2023.

Forsgren Associates Inc., (2025). Granite Creek Mine WTP-2 Process Flow Diagram, prepared for i-80 Gold Corp., by Forsgren Associates Inc., Engineering Design Team, Humboldt County, Nevada, October 2025, Sheet 1 of 1.

Forsgren Associates Inc. 2026.

Foster, J. M. and Kretschmer, E. L., (1991). Geology of the Mag Deposit, Pinson Mine, Humboldt County, Nevada. [ed.] G. L. Raines, et al. Geology and Ore Deposits of the Great Basin: Geological Society of Nevada 1990 Symposium Proceedings. 1991, pp. 845-856.

Foster, J. M., (1994). Gold in Arsenian Framboidal Pyrite in Deep CX Core Hole DDH-1541, Humboldt County, Nevada, Pinson Mining Company Internal Report, Unpublished.

Fritz Geophysics, (2007). Data Processing and Interpretation of Gravity Data, Pinson Property, Elko County, Nevada, prepared for Pinson Mining Company (Atna Resources Ltd.), Fort Collins, Colorado, 2007, Internal Corporate Technical Report

GRE, (2021). Preliminary Economic Assessment NI 43-101 Technical Report, Granite Creek Mine Project, Humboldt County, Nevada, USA, prepared for i-80 Gold Corp., by Global Resource Engineering, Ltd., Humboldt County, Nevada, USA, November 8, 2021, 237 pages.

GRE (Global Resource Engineering). 2026.

Golder, (2014). NI 43-101 Technical Report, Pinson Project, Preliminary Feasibility Study, Humboldt County, Nevada, prepared for Atna Resources Ltd., by Golder Associates Inc., Humboldt County, Nevada, June 30, 2014.

Gustavson Associates LLC, (2012). NI 43-101 Technical Report on the Mineral Resources of the Pinson Mine, Humboldt County, Nevada, prepared for Atna Resources Ltd., by Donald E. Hulse and Terre A. Lane, Lakewood, Colorado, March 30, 2012, 143 p.


September 2026


SRK Consulting (U.S.), Inc.

SEC Technical Report Summary – Granite Creek

   Page 411


HGL, (2022b). i-80 Gold Granite Creek Mine – Summary of 2022 VWP Installations and Preliminary Monitoring Results, prepared for i-80 Gold Corp., by HydroGeoLogica, Inc., Lakewood, CO, November 1, 2022.

HGL, (2023). Dewatering Well GCW-06, Granite Creek Mine, Humboldt County, Nevada, prepared for i-80 Gold Corp, by HydroGeoLogica, Inc., Humboldt County, Nevada, June 7, 2023.

HGL, (2023). Groundwater Flow Model Results for Assessing Dewatering and Passive Inflow of Planned Underground Mine Workings, prepared for i-80 Gold Corp., by HydroGeoLogica, Inc., Humboldt County, NV, August 14, 2023.

Hofstra, A. H. and Cline, J. S., (2000). Characteristics and Models for Carlin-Type Gold Deposits. Society of Economic Geologists Reviews. 2000, Vol. 13, pp. 163-220.

Hotz, P. E. and Willden, R., (1964). Geology and Mineral Deposits of the Osgood Mountains Quadrangle, Humboldt County, Nevada: U.S. Geological Survey Professional Paper 431. 1964.

Infomine, (2020). costs.infomine.com, online, December 2020, https://costs.infomine.com/.

JBR. 2003.

Jones, A. E., (1991). Tectonic Significance of Paleozoic and Early Mesozoic Terrane Accretion in Northern Nevada, Berkeley, California, University of California, Berkeley, Ph.D. dissertation. 1991, 256 p.

Kretschmer, E. L., (1985). Geology of the Mag Deposit, Humboldt County, Nevada, Pinson Mining Company Internal Report, Unpublished Internal Report, 1985, Nevada Bureau of Mines and Geology Digital Mining District Files Collection ID 36800069.

Kretschmer, E.L., (1984). Geology of the Pinson and Preble Gold Deposits, Humboldt County, Nevada, Tucson, Arizona, Arizona Geological Society Digest, 1984, Vol. 15, pp. 59-66.

LRE Water, (2024). Granite Creek Mine Dewatering Updated, PowerPoint Presentation prepared for i-80 Gold Corp, by LRE Water, Denver, CO, 2024.

LRE Water, (2025). Results of Deepening and Testing Dewatering Well BPW-5, Granite Creek Mine, Humboldt County, Nevada, prepared for i80 Gold Corp., by LRE Water, Humboldt County, Nevada, 2025.

Lupo, J. F., (2005). Heap Leach Facility Liner Design, Lakewood, Colorado, Golder Associates, Inc., 2005.

Magee Geophysical Services, (2006). Detailed Gravity Survey over the Pinson Property, prepared for Atna Resources Ltd., by Magee Geophysical Services LLC, Reno, Nevada, October 2006, 2,587 gravity readings covering approximately 27 sq km.

McClelland, D., (1999b). Report on Heap Leach Cyanidation, Column Leach Tests - Pinson Mine CX Pit Bulk Ore Samples, Sparks, NV, McClelland Laboratories, Inc., June 16, 1999b, MLI Job No. 2630

McClelland, D., (1999a). Report on Heap Leach, Direct and CIL Cyanidation and “Preg-Robbing” Tests - Various Mag Pit Samples and Composites, and CX Pit ‘bulk Ore, Sparks, NV, McClelland Laboratories, Inc., March 1999a, MLI Job No. 2532, Addendum, and C.O. #1, 2 and 3, i80gold.com


September 2026


SRK Consulting (U.S.), Inc.

SEC Technical Report Summary – Granite Creek

   Page 412


McClelland, (2014). Summary Report on Heap Leach Cyanidation Testing - Mag Pit Pinson Drill Core composites, prepared for Atna Resources Ltd., by McClelland Laboratories, Inc., McClelland, D., Sparks, NV, January 16, 2014, MLI Job No. 3746.

McClelland, (2013). Summary Report on Ore Variability Testing - Mag Pit Pinson Drill Core Composites, prepared for Atna Resources Ltd., by McClelland Laboratories, Inc., McClelland, D., Sparks, NV, February 7, 2013, MLI Job No. 3746.

McLachlan, C. D., Struhsacker, E. M. and Thompson, W. F., (2000). The Gold Deposits of Pinson Mining Company: A Review of the Geology and Mining History through 1999, Humboldt County, Nevada, GSN Symposium Proceedings, May 2000, pp. 1043–1058.

Crafford, A. E. J., (2000). Geology and Ore Deposits 2000: The Great Basin and Beyond, Reno, Nevada, Geological Society of Nevada Symposium Proceedings, May 15-18, 2000, pp. 123-153, gsnv.org.

Mine Safety and Health Administration, (2025). Engine Approvals, prepared for United States Department of Labor, by Mine Safety and Health Administration, Washington DC, 2025.

Muntean, J. L., Cline, J. S., Simon, A. C., Longo, A. A., (2011). Magmatic-Hydrothermal Origin of Nevada’s Carlin-type Gold Deposits, London, Nature Geoscience, January 23, 2011, Vol. 4, pp. 122-127, nature.com.

MVP (Mountain Valley Professionals). 2026.

NDEP, (2016). Attachment A: Guidance for surety release in mining projects [Bureau of Mining Regulation and Reclamation Guidance Document]. Nevada Department of Conservation and Natural Resources.nv.gov, September 2016

Nevada Gold Mines LLC., NGM, (2020). Technical Report on the Turquoise Ridge Complex, State of Nevada, U.S.A., prepared for Barrick Gold Corporation and Newmont Corporation, by Nevada Gold Mines LLC, Humboldt County, Nevada, March 25, 2020, NI 43-101 Report.

Osgood Mining LLC, (2016). Pinson Narrative, prepared for Osgood Mining LLC, by Osgood Mining LLC, R. W. Leonardson, Humboldt County, Nevada, November 2016, Unpublished Company Report.

OMC, (2020). Fact Sheet, Osgood Mining Company, Pinson Mining Project, Permit No. Nev2005103 (Renewed 2018), prepared for Nevada Division of Environmental Protection, by Osgood Mining Company, LLC, Carson City, Nevada, 2020.

OMC, (2020). Fact Sheet for Pinson Rapid Infiltration Basins Water Pollution Control Permit NEV2005102, prepared for Nevada Division of Environmental Protection, by Osgood Mining Company, LLC, Humboldt County, Nevada, 2020.

OMC (2019). OMC Pinson Metallurgy Summary, prepared for Osgood Mining Company, LLC, by Osgood Mining Company, LLC, Nevada, April 2019.

OMC, (2016). Leonardson, R. W. Pinson, Narrative, Nov 2016, Unpublished Osgood Mining LLC Company Report.

OMC, (2023). Application to Renew Water Pollution Control Permit NEV2005103, prepared for Osgood Mining Company, LLC, by Osgood Mining Company, LLC, Humboldt County, Nevada, May 2023, 1-125.


September 2026
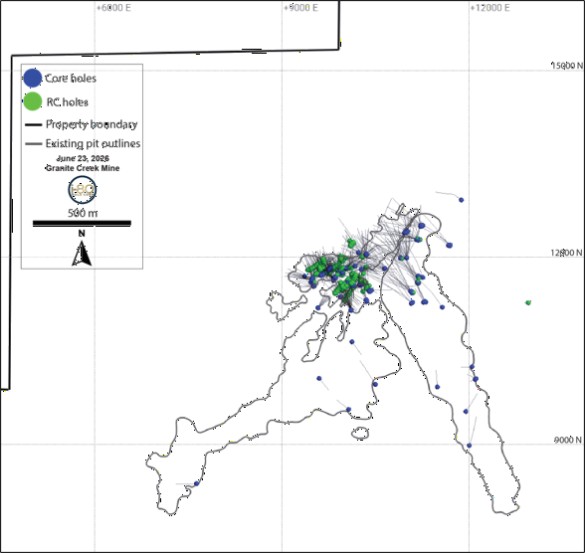

SRK Consulting (U.S.), Inc.

SEC Technical Report Summary – Granite Creek

   Page 413


OMC, (2024).

OMC, (2026). Osgood Mining Company Internal Memorandum, prepared for Osgood Mining Company, by Osgood Mining Company, Trevor Jones, Humboldt County, April 2026.

PMC, (2015). Internal Ore and Ore Stockpile Tracking and Control, prepared for Atna Resources Ltd., by Pinson Mining Company, Humboldt County, Nevada, October 5, 2015.

Piteau Associates, (2018). Mag and CX Pits Updated Pit Lake Models, prepared for Osgood Mining Company LLC, by Piteau Associates, Reno, NV, September 10, 2018.

Piteau Associates, (2023). Mag and CX Pit Updated Pit Lake Models, Project 4797, prepared for Osgood Mining Company, LLC, by Piteau Associates USA Ltd., Reno, Nevada, November 2023.

Practical Mining LLC, (2023). Granite Creek LOM Development and Stopes. Email communication and files received July 6, 2023, from Dagny Odell (Practical Mining) to Daniel Weber (HGL). Drawing files (.dwg): GraniteCreekLOMDev.dwg and GraniteCreekLOMStopes.dwg.

Spheros Environmental, (2026). Granite Creek Numerical Model Update, Denver, CO, Spheros Environmental, January 2026.

Radtke, A.S., (1985). Geology of the Carlin Gold Deposit, Nevada, Reston, Virginia, U.S., Geological Survey Professional Paper, 1267, 1985, 124 p., https://usgs.gov.

Ridgley, V., et al., (2005). Project Update Pinson Gold Project, Humboldt County, Nevada, USA. [ed.] H. N. Rhoden, R. C. Steinenger and P. G. Vikre. Symposium 2005, Window to the World: Geological Society of Nevada 2005 Symposium Proceedings, May 2005, p. 103.

Sandbak, L. A., Urcheck, J., & Warren, S. N., (2020). Basin and range extensional tectonics and back analysis of modeling studies at the Turquoise Ridge underground mine, In Proceedings of the 54th U.S. Rock Mechanics / Geomechanics Symposium, American Rock Mechanics Association (ARMA). [Paper No. ARMA-2020-1926].

SWS, (2014). CX Pit Lake Modeling Update. Prepared for Atna Resources Inc., Golconda, Nevada, by Schlumberger Water Services, February 19, 2014, 5298/R1.

SGS Canada Inc., (2026). An Investigation into Metallurgical Test Work on Granite Creek South Pacific Zone Ore from the Granite Creek Mine. Jun. 11, 2026

Silberman, M. L., Berger, B. R. and Koski, R. A., (1974). K-Ar Age Relations of Granodiorite Emplacement and Tungsten and Gold Mineralization Near the Getchell Mine, Humboldt County, Nevada, Lancaster, Pennsylvania, Economic Geology, August 1, 1974, Vol. 69, No. 5, pp. 646-656, doi.org.

Sim, R., (2005). Revised Technical Report on the Pinson Gold Property, Humboldt County, Nevada, Vancouver, British Columbia, Atna Resources Ltd. and Pinson Mining Company (via SEDAR), October 11, 2005, Technical Report (NI 43-101), 93 pages, sedarplus.ca.

SRK Consulting (U.S.), Inc. (SRK). 2025. Granite Creek Mine, Ecological Risk Assessment for Pit Lakes. Prepared for Osgood Mining Company, LLC: Reno, Nevada. Project number: USPR001947. Issued August 2025.


September 2026
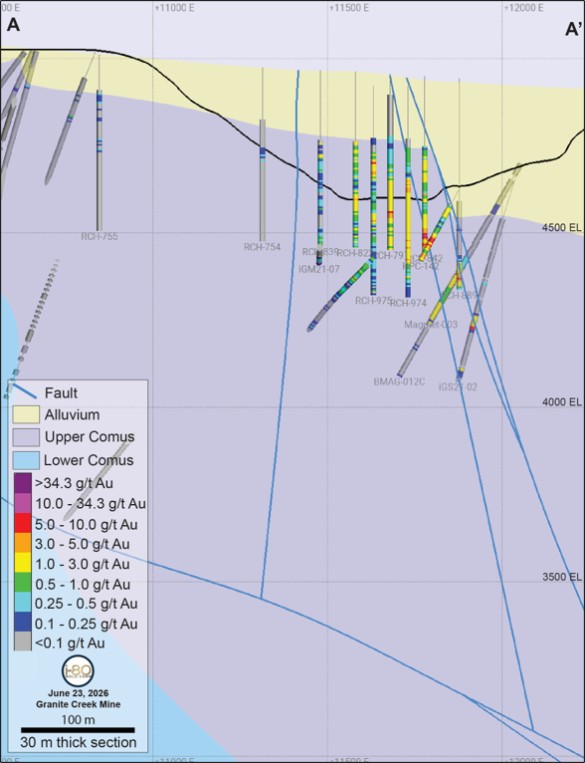

SRK Consulting (U.S.), Inc.

SEC Technical Report Summary – Granite Creek

   Page 414


Smee, B.W., Bloom, L., Arne, D. and Heberlein, D., (2024). Practical applications of quality assurance and quality control in mineral exploration, resource estimation and mining programmes: a review of recommended international practices, London, Geochemistry: Exploration, Environment, Analysis, April 23, 2024, Volume 24, Issue 2, https://pubs.geoscienceworld.org/gsl/geea/article/24/2/geochem2023-046/638622/Practical-applications-of-quality-assurance-and.

Stantec Consulting Services, (2023). Waste Rock Management Plan - Granite Creek Mining Project prepared for Osgood Mining LLC, by Stantec Consulting Services Inc., s.l., 2023.

Stenger, D. P., et al., (1998). Deposition of Gold in Carlin-type Deposits: The Role of Sulfidation and Decarbonation at Twin Creeks, Nevada, Economic Geology, 1998, Vol. 93, pp. 201-215.

Stoker, P. T., (2006). Newmont Australia Technical Services Sampling Notes, prepared for Newmont Australia Technical Services, by AMC Consultants, January 2006.

Thompson, M. and Howarth, R.J., (1978). A new approach to the estimation of analytical precision, Journal of Geochemical Exploration, March 1978, Volume 9, Issue 1, Pages 23-30, https://doi.org/10.1016/0375-6742(78)90035-3

Thompson, W. F., (2003). Geologic Stoping Report for the Pinson Properties: Internal Company Report, Humboldt County, Nevada, Internal Company Report, 2 March. 2003.

Tingley, J. V., (1998). Mining districts of Nevada (2nd ed., Report 47), Reno, Nevada, Nevada Bureau of Mines and Geology, 1998, 305 p. unr.edu

Wallace, A. and Wittkopp, R. W., (1983). The Mode of Occurrence of Gold at the Pinson Mine as Determined by Microprobe Analyses, and Metallurgical Implications: Unpublished Pinson Mining Company Report. 1983.

WMC, (1998). Results of Hydrogeologic and Geochemical Studies at Pinson and Provisional Closure Plan for the CX and Mag Pits, prepared for Pinson Mining Company, by Water Management Consultants, Inc., Winnemucca, Nevada, July 1998, Report No. 2163/R2.

WMC, (2000). Amended Closure Plan for the CX Pit, prepared for Pinson Mining Company, by Water Management Consultants, Inc., Humboldt County, Nevada, September 19, 2000.

WMC, (1998). Results of Hydrogeologic and Geochemical Studies at Pinson and Provisional Closure Plan for the CX Pit, Geochemical Test Work, prepared for Pinson Mining Company, by Water Management Consultants, Inc., Denver, CO, 1998, Chapter 4.

WMC, (2002). Pinson Mining Company - CX Pit Status Report on Closure and Updated Pit Lake Modeling Predictions, prepared for Pinson Mining Company, by Water Management Consultants, Inc., Winnemucca, Nevada, January 2002, Report No. 2163/R9.

WMC, (2005). Hydrology Related to the Proposed Pinson Declines. Technical Memorandum, prepared for Enviroscientists, Inc. by Water Management Consultants, Inc., Reno, Nevada, August 24, 2005.

Wilmot, (2006). Met Testwork Results Atna-Pinson Project, prepared for Atna Resources Ltd. (the project operators at the time), by Wilmot, 2006, Internal Metallurgical Report

Woolever, Dakota, (2026) First Electric Assessment of Granite Creek Site Electrical Loads, July 2026.

World Gold Council, (2025) Gold in the Global Economy: Market, Mining and Modernisation, World Gold Council, Nov. 2025, www.gold.org/about-gold/gold-global-economy.


September 2026
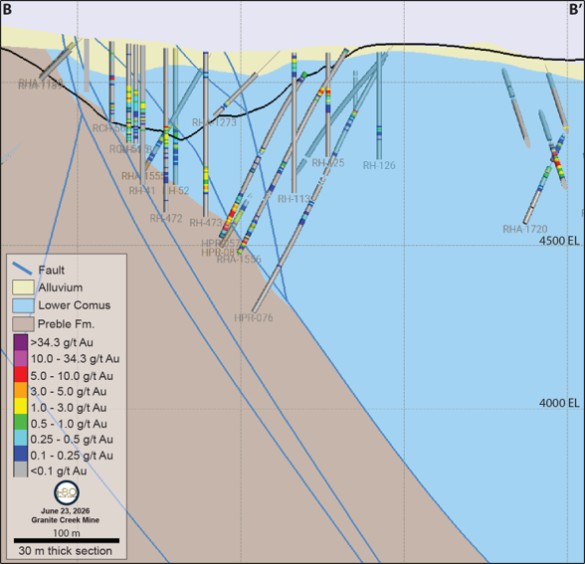

SRK Consulting (U.S.), Inc.

SEC Technical Report Summary – Granite Creek

   Page 415


25

Reliance on Information Provided by the Registrant

In compliance to the SEC S-K regulation Subpart 1302 (f)(1), SRK may rely on information provided by the registrant in preparing its findings and conclusions regarding the following aspects of modifying factors:

(i) Macroeconomic trends, data, and assumptions, and interest rates;

(ii) Marketing information and plans within the control of the registrant;

(iii) Legal matters outside the expertise of the qualified person, such as statutory and regulatory interpretations affecting the mine plan;

(iv) Environmental matters outside the expertise of the qualified person;

(v) Accommodations the registrant commits or plans to provide to local individuals or groups in connection with its mine plans; and

(vi) Governmental factors outside the expertise of the qualified person.

The Consultant’s opinion contained herein is based on information provided to the Consultants by i-80 throughout the course of the investigations. Table 25 1 of this section of the Technical Report Summary will:

(i) Identify the categories of information provided by the registrant;

(ii) Identify the particular portions of the Technical Report Summary that were prepared in reliance on information provided by the registrant pursuant to Subpart 1302 (f)(1), and the extent of that reliance; and

(iii) Disclose why the qualified person considers it reasonable to rely upon the registrant for any of the information specified in Subpart 1302 (f)(1).

The Consultant’s opinion contained herein is based on information provided to the Consultants by i-80 throughout the course of the investigations. SRK has relied upon the work of other consultants in the project areas in support of this Technical Report.

The Consultants used their experience to determine if the information from previous reports was suitable for inclusion in this technical report and adjusted information that required amending. This report includes technical information, which required subsequent calculations to derive subtotals, totals and weighted averages. Such calculations inherently involve a degree of rounding and consequently introduce a margin of error. Where these occur, the Consultants do not consider them to be material.

These items have not been independently reviewed by SRK and SRK did not seek an independent legal opinion of these items.


September 2026
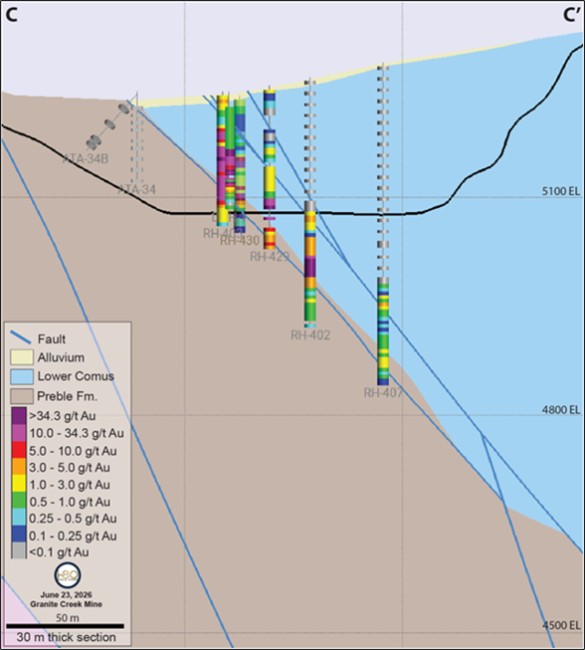

SRK Consulting (U.S.), Inc.

SEC Technical Report Summary – Granite Creek

   Page 416


Table 25-1: Reliance on Information Provided by the Registrant


Category


Report Item/ Portion


Portion of

Technical Report

Summary


Disclose why the Qualified Person
considers it reasonable to rely upon the
registrant

Macroeconomic trends, data, and assumptions, and interest rates    Item 19 – Economic Analysis (External Factors: Pricing, Taxes and Royalties)    Gold price assumptions and discount rate used in the economic model    Corporate pricing decks, tax structuring, and discount rate assumptions are set at the registrant’s corporate finance level and are outside the QP’s mining/geological expertise.
Marketing information and plans within the control of the registrant    Item 16 – Market Studies and Contracts (Contracts and Status)\    Toll Milling Autoclave Contract, Ore Purchase Agreement, and doré/byproduct offtake arrangements    These are registrant-negotiated commercial agreements; the QP relies on the registrant’s own account of contract terms rather than independently verifying them.
Legal matters outside the expertise of the qualified person, such as statutory and regulatory interpretations affecting the mine plan    Item 3 – Property Description (Encumbrances / royalty burdens)    Mineral tenure status and the 5 disclosed royalty interests    Interpretation of property tenure and royalty legal standing is outside the QP’s expertise; consistent with the source report’s own statement that SRK did not seek an independent legal opinion of these items (see verbatim text above).
Environmental matters outside the expertise of the qualified person    Item 17 – Environmental Studies, Permitting and Social or Community Impact (Environmental Management and Planning; Mine Closure)    Environmental compliance status, closure cost/bonding basis, and the Petroleum Contaminated Soils remediation approach    Environmental regulatory compliance assessment relies on the registrant’s environmental staff and consultants, outside the mining QP’s direct expertise.
Accommodations the registrant commits or plans to provide to local individuals or groups in connection with its mine plans    Item 17 – Environmental Studies, Permitting and Social or Community Impact (Plans, Negotiations, or Agreements with Local Individuals or Groups)    Community agreements and accommodations    Commitments to local stakeholders are registrant-controlled business decisions, not independently verifiable technical facts.
Governmental factors outside the expertise of the qualified person   

Item 17 – Environmental Studies, Permitting and Social or Community Impact (Project Permitting)

Item 19 – Economic Analysis

   Permitting status, current permitting activities, and performance/reclamation bonding. Application tax and the impact of existing loss carryforward balances.    Interpretation of governmental regulatory requirements and permitting status relies on the registrant’s own compliance representations. Registrant control over the applicability of tax losses


September 2026
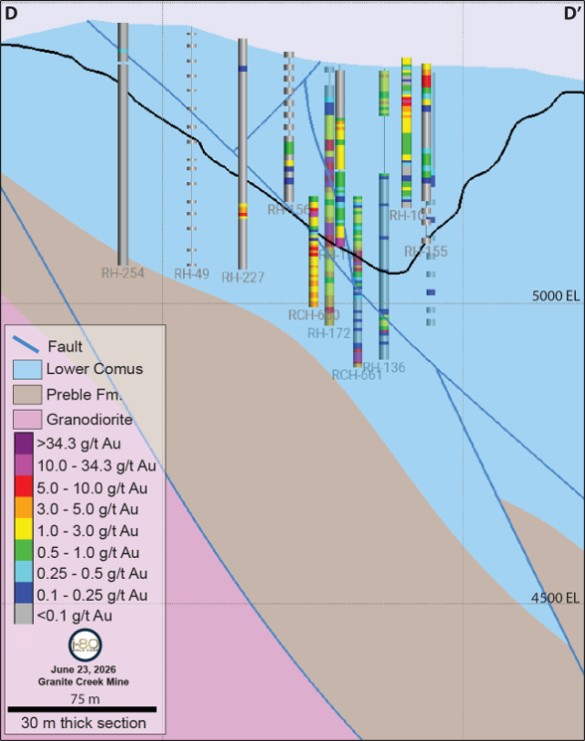

SRK Consulting (U.S.), Inc.

SEC Technical Report Summary – Granite Creek

   Page 417


26

Date and Signature Page


Signed on this 21st Day of September, 2026.


Prepared by


/s/ SRK Consulting (U.S.), Inc,      


SRK Consulting (U.S.), Inc,


Prepared by


/s/ Global Resource Engineering       


Global Resource Engineering (GRE)


Prepared by


/s/ TR Raponi Consulting Ltd.        


TR Raponi Consulting Ltd.


Prepared by


/s/ WSP                 


WSP


Prepared by


/s/ Practical Mining             


Practical Mining


September 2026
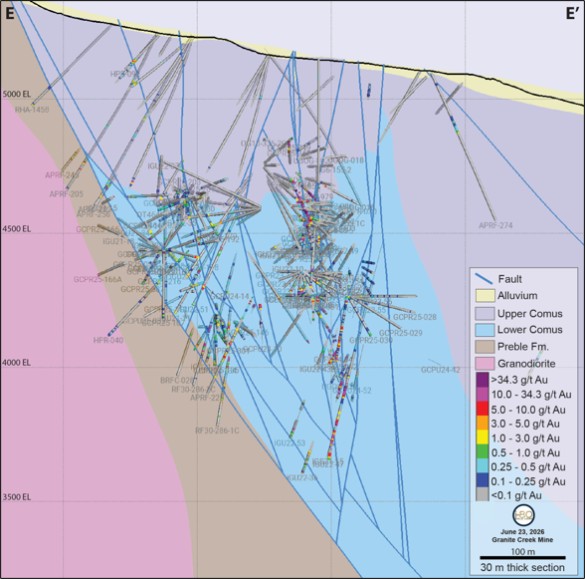

SRK Consulting (U.S.), Inc.

SEC Technical Report Summary – Granite Creek

   Page 418


Prepared by


/s/ i-80 Gold Corp.              


i-80 Gold Corp.

Prepared by


/s/ Hatch Ltd.                


Hatch Ltd.

All data used as source material plus the text, tables, figures, and attachments of this document have been reviewed and prepared in accordance with generally accepted industry practices.


September 2026
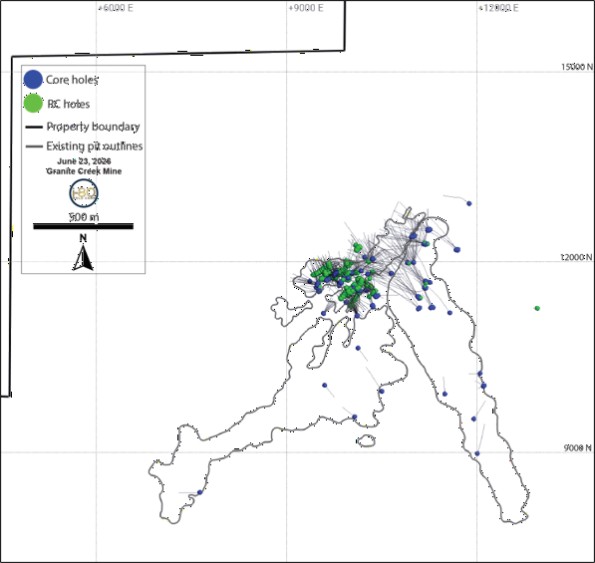

SRK Consulting (U.S.), Inc.

SEC Technical Report Summary – Granite Creek

   Page 419


Appendices


September 2026
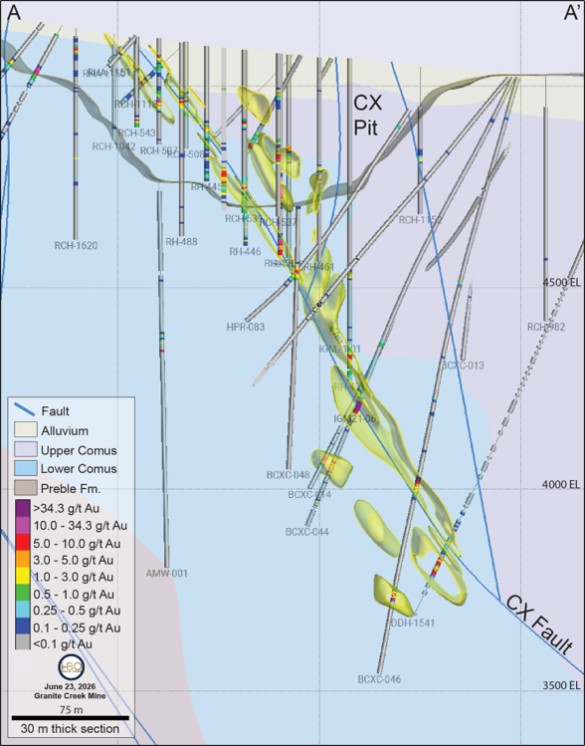

SRK Consulting (U.S.), Inc.

SEC Technical Report Summary – Granite Creek

   Page 420


Appendix A: Consent Letter


September 2026