
Exhibit 96.1
Kitsault Valley Project Technical Report Summary and updated Mineral Resource Estimate 2026
S-K 1300 Report
| Prepared by: | Contango Silver and Gold |
| 516 2nd Ave, Suite 401 | |
| Fairbanks, AK 99701 |
Qualified Person:
| Dave Larimer, CPG | 21 September 2026 |
Qualified Person Statement and Signature
Kitsault Valley Project
Report title: Kitsault Valley Project Technical Report Summary, and Updated Mineral Resource Estimate 2026
TRS issue date: September 21, 2026
Mineral resource effective date: September 11, 2026
I, Dave Larimer, CPG, am Vice President Exploration of Contango Silver & Gold Inc. (the Company). I am an employee of the Company and am not independent of the registrant.
I am a Certified Professional Geologist with the American Institute of Professional Geologists, certificate number CPG-11862, and a Certified Professional Geologist in the State of Alaska, certificate number 115316. Both certifications were awarded in 2016, and currently in good standing with both. I hold a bachelor’s degree in geology from the University of Colorado Boulder, awarded in 2000. My relevant professional experience comprises 20 years of geological work, including exploration, advanced exploration, and development-stage project evaluation for underground and surface mining; metallurgical, geometallurgical, and infrastructure risk integration; and mineral resource and reserve governance. My areas of specialization include geological modeling, geostatistics, variography, geochemistry, ore control, resource drilling, exploration targeting, structural interpretation, and database management. On this basis, I meet the definition of a Qualified Person under 17 CFR 229.1300 for the responsibilities undertaken in this report.
I am the sole Qualified Person responsible for all sections of this Technical Report Summary (TRS). I prepared or supervised its preparation, reviewed the technical information and conclusions adopted in it, and accept responsibility for the report, subject to the specific reliance on information provided by the registrant identified in Chapter 25 pursuant to 17 CFR 229.1302(f).
I personally inspected the Project on September 14, 2025, and July 21–24, 2026. The nature and scope of those inspections, my data-verification procedures and any limitations are described in Chapter 9.
The Company supplied the project database and supporting records. Technical contributions, including Sims Resources’ modeling assistance, metallurgical specialist review by Jeff Austin of International Metallurgy and Environmental, and market study input for Chapter 16 from Jim Cowley, are described in Chapter 25 and identified in the report. I retain responsibility for the technical work and conclusions I adopted from these contributions.
Based on my review and knowledge, the TRS fairly presents the technical information and conclusions for which I am responsible, together with the material assumptions, limitations and uncertainties described in the report. My signature below applies to the final TRS identified above.
| Signature: | /s/ DAVE LARIMER | (18SEP26) Dave Larimer, CPG |
| Vice President Exploration, Contango Silver & Gold Inc. | ||
| Date signed: September 18, 2026 | ||
Table of Contents
| Qualified Person Statement and Signature | 2 | |
| Table of Contents | 3 | |
| List of Figures | 9 | |
| List of Tables | 13 | |
| 1 EXECUTIVE SUMMARY | 18 | |
| 1.1 | Purpose and Principal Conclusions | 18 |
| 1.2 | Property Description and Ownership | 18 |
| 1.3 | Geological Setting and Mineralization | 19 |
| 1.4 | Exploration and Data Verification | 21 |
| 1.5 | Mineral Resource Estimate | 21 |
| 1.6 | Estimation and Classification | 25 |
| 1.7 | Mineral Processing and Metallurgical Testing | 26 |
| 1.8 | Mining Concept and Resource Reporting Basis | 26 |
| 1.9 | Access Infrastructure Environmental Matters and Permitting | 27 |
| 1.10 | Qualified Person Conclusions and Recommendations | 27 |
| 2 INTRODUCTION | 30 | |
| 2.1 | Purpose and Terms of Reference | 30 |
| 2.2 | Project and Deposit Scope | 30 |
| 2.3 | Qualified Person and Technical Contributions | 30 |
| 2.4 | Sources of Information | 31 |
| 2.5 | Relationship to Previous Reporting | 32 |
| 2.6 | Personal Inspection | 32 |
| 2.7 | Effective Date and Information Cut-offs | 32 |
| 2.8 | Units, Currencies and Reporting conventions | 33 |
| 3 PROPERTY DESCRIPTION | 34 | |
| 3.1 | Description and Location | 34 |
| 3.2 | Fee Simple Service Lots | 47 |
| 3.3 | Royalties and Agreements | 49 |
| 3.4 | Environmental Liabilities, Permitting and Significant Factors | 49 |
| Contango Silver and Gold – Kitsault Valley Project | Page 3 of 253 |
| Technical Report Summary and updated Mineral Resource Estimate 2026 |
| 4 ACCESSIBILITY, CLIMATE, LOCAL RESOURCES, INFRASTRUCTURE AND PHYSIOGRAPHY | 51 | |
| 4.1 | Accessibility | 51 |
| 4.2 | Physiography, Elevation and Vegetation | 53 |
| 4.3 | Climate and Operating Season | 53 |
| 4.4 | Local Resources | 54 |
| 4.5 | Infrastructure | 54 |
| 5 HISTORY | 56 | |
| 5.1 | Overview and Sources | 56 |
| 5.2 | Dolly Varden Area | 56 |
| 5.3 | Homestake Ridge Area | 59 |
| 5.4 | Consolidation of the Kitsault Valley Project | 61 |
| 5.5 | Historical Mineral Resource and Mineral Reserve Estimates | 62 |
| 6 GEOLOGICAL SETTING, MINERALIZATION, AND DEPOSIT models | 65 | |
| 6.1 | Regional Geology | 65 |
| 6.2 | Property and Local Geology | 68 |
| 6.3 | Mineralization and Material Deposits | 73 |
| 6.4 | Deposit Models | 78 |
| 7 EXPLORATION | 80 | |
| 7.1 | Scope, Attribution, and Source Basis | 80 |
| 7.2 | Exploration Other Than Drilling | 80 |
| 7.3 | Drilling Methods and Factors Affecting Reliability | 86 |
| 7.4 | Drilling — Dolly Varden, 2011–2018 | 87 |
| 7.5 | Drilling — 2019–2022 | 89 |
| 7.6 | Drilling — 2023–2025 | 91 |
| 7.7 | Hydrogeological and Geotechnical Data | 103 |
| 7.8 | QP Interpretation and Limitations | 103 |
| 8 SAMPLE PREPARATION, ANALYSES, AND SECURITY | 104 | |
| 8.1 | Scope and Qualified Person Review | 104 |
| 8.2 | Sample Populations and QA/QC Compilations | 104 |
| 8.3 | Drill Core Handling and Sampling | 104 |
| 8.4 | Sample Security and Chain of Custody | 105 |
| 8.5 | Laboratories, Preparation and Analytical Methods | 106 |
| 8.6 | Surface, Lithogeochemical and Density Samples | 107 |
| Contango Silver and Gold – Kitsault Valley Project | Page 4 of 253 |
| Technical Report Summary and updated Mineral Resource Estimate 2026 |
| 8.7 | Quality Assurance and Quality Control | 107 |
| 8.8 | Completion of the 2023 and 2023–2025 Programs | 113 |
| 8.9 | Data Acceptance and Exceptions | 113 |
| 8.10 | Qualified Person Opinion | 114 |
| 9 DATA VERIFICATION | 115 | |
| 9.1 | Introduction and Scope | 115 |
| 9.2 | Data Sources and Database Environment | 115 |
| 9.3 | Summary of QP Verification Procedures | 116 |
| 9.4 | Qualified Person Site Visits | 117 |
| 9.5 | Drillhole Database and Geological Record Verification | 117 |
| 9.6 | Collar, Downhole Survey and Spatial Verification | 118 |
| 9.7 | Assay Database and Analytical QA/QC Verification | 118 |
| 9.8 | Sample Custody, Laboratory Status and Record Reconciliation | 119 |
| 9.9 | Historical Data Verification and MRE Inclusion | 119 |
| 9.10 | Limitations on Data Verification | 119 |
| 9.11 | Data-Governance and Continuing Verification Measures | 120 |
| 9.12 | Qualified Person Opinion on Data Adequacy | 120 |
| 10 MINERAL PROCESSING AND METALLURGICAL TESTING | 121 | |
| 10.1 | Introduction and Scope | 121 |
| 10.2 | Summary of Metallurgical Test Work Programs | 121 |
| 10.3 | Homestake Area Prior to Metallurgical Test Work | 124 |
| 10.4 | Dolly Varden and Torbrit 2019 Metallurgical Test Work | 126 |
| 10.5 | Wolf and Kitsol 2025/2026 Metallurgical Test Work | 131 |
| 10.6 | Processing Implications by Mineralized Area | 136 |
| 10.7 | Material Processing Risks, Deleterious Elements, and Recovery Assumptions | 137 |
| 10.8 | Adequacy of the Metallurgical Data | 138 |
| 10.9 | Recommended Follow-up Work | 138 |
| 11 MINERAL RESOURCE ESTIMATES | 140 | |
| 11.1 | Introduction and Basis of Estimate | 140 |
| 11.2 | Resource Database and Data Preparation | 142 |
| 11.3 | Project-wide Estimation and Reporting Conventions | 145 |
| 11.4 | Economic Basis and Resource Reporting Assumptions | 148 |
| Contango Silver and Gold – Kitsault Valley Project | Page 5 of 253 |
| Technical Report Summary and updated Mineral Resource Estimate 2026 |
| 11.5 | Homestake Region Mineral Resource Estimates | 150 |
| 11.6 | Dolly Varden Area Mineral Resource Estimates | 165 |
| 11.7 | Consolidated Kitsault Valley Mineral Resource Statement | 194 |
| 11.8 | Comparison with Previously Reported Estimates | 196 |
| 11.9 | Resource Sensitivity | 198 |
| 11.10 | Uncertainty, Limitations and Material Risks | 201 |
| 11.11 | QP Conclusions on the Mineral Resource Estimate | 203 |
| 12 MINERAL RESERVE ESTIMATES | 204 | |
| 13 MINING METHODS | 205 | |
| 14 PROCESSING AND RECOVERY METHODS | 206 | |
| 15 INFRASTRUCTURE | 207 | |
| 15.1 | Scope and Reporting Basis | 207 |
| 15.2 | Infrastructure Setting and Status | 207 |
| 15.3 | Transportation and Access | 209 |
| 15.4 | Current Exploration-Support Facilities | 211 |
| 15.5 | Water, Waste, Tailings, Dams, and Pipelines | 212 |
| 15.6 | Future Project Infrastructures Requirements | 212 |
| 15.7 | QP Interpretation and Limitations | 214 |
| 16 MARKET STUDIES | 215 | |
| 16.1 | Lead Concentrate | 215 |
| 16.2 | Copper Concentrate | 215 |
| 16.3 | Zinc Concentrate | 216 |
| 16.4 | Summary | 216 |
| 17 ENVIRONMENTAL STUDIES, PERMITTING, AND COMMUNITY | 217 | |
| 17.1 | Scope, Reporting Basis, and Project Stage | 217 |
| 17.2 | Environmental and Social Setting | 217 |
| 17.3 | Current Exploration Permitting | 217 |
| 17.4 | Environmental Studies and Baseline Information | 222 |
| 17.5 | Wildlife, Vegetation, and Aquatic Protection | 224 |
| 17.6 | Archaeology and Cultural Heritage | 225 |
| 17.7 | Indigenous Nations, Communities, and Agreements | 225 |
| 17.8 | Waste, Tailings, Monitoring, and Water Management | 226 |
| Contango Silver and Gold – Kitsault Valley Project | Page 6 of 253 |
| Technical Report Summary and updated Mineral Resource Estimate 2026 |
| 17.9 | Future Project Permitting Framework | 226 |
| 17.10 | Closure and Reclamation | 228 |
| 17.11 | QP Interpretation, Risks, and Finalization | 228 |
| 18 CAPITAL AND OPERATING COSTS | 229 | |
| 19 ECONOMIC ANALYSIS | 230 | |
| 20 ADJACENT PROPERTIES | 231 | |
| 20.1 | Scope and Reporting Basis | 231 |
| 20.2 | Regional Setting and Property Reconciliation | 231 |
| 20.3 | Red Mountain Gold Project | 233 |
| 20.4 | Golddigger Property and Surebet Discovery | 233 |
| 20.5 | Kisault Molybdenum Project | 233 |
| 20.6 | Other Surrounding Tenure | 234 |
| 20.7 | Qualified Person Interpretation | 234 |
| 21 OTHER RELEVANT DATA AND INFORMATION | 235 | |
| 22 INTERPRETATION AND CONCLUSIONS | 236 | |
| 22.1 | Basis and Principal Conclusions | 236 |
| 22.2 | Exploration Data and Verification | 236 |
| 22.3 | Geological Interpretation by Area | 237 |
| 22.4 | Estimation and Classification | 237 |
| 22.5 | Mineral Resource Outcome | 238 |
| 22.6 | Metal Prices and Metallurgical Assumptions | 239 |
| 22.7 | Mining Concept and Reasonable Prospects of Economic Extraction | 239 |
| 22.8 | Infrastructure, Environment and Permitting | 240 |
| 22.9 | Significant Risks and Uncertainties | 240 |
| 22.10 | Overall QP Conclusion | 241 |
| 23 RECOMMENDATIONS | 242 | |
| 23.1 | Recommended Program | 242 |
| 23.2 | Stage 1 – 2026 Drill Close-out, 2027 MRE Update and Initial Assessement | 242 |
| 23.3 | Stage 2 – Three Program Toward Pre-Feasibility Study (PFS) | 242 |
| 23.4 | Proposed Budget and Sequence | 243 |
| 24 REFERENCES | 245 | |
| Contango Silver and Gold – Kitsault Valley Project | Page 7 of 253 |
| Technical Report Summary and updated Mineral Resource Estimate 2026 |
| 25 RELIANCE ON REGISTRANT | 251 | |
| 25.1 | Registrant and Scope | 251 |
| 25.2 | Land Status Permitting and Environmental Information | 251 |
| 25.3 | Historical Reports and Public Disclosures | 252 |
| 25.4 | Company Technical Data and QP Review | 252 |
| 25.5 | Metallurgical Information Market Studies and Specialist Review | 252 |
| 25.6 | Extent of Reliance | 253 |
| Contango Silver and Gold – Kitsault Valley Project | Page 8 of 253 |
| Technical Report Summary and updated Mineral Resource Estimate 2026 |
List of Figures
| Figure 1-1 Location of the Kitsault Valley resource deposits. Red outlines show the resource deposits. Coordinates are NAD83 / UTM Zone 9N, in meters | 20 |
| Figure 1-2. Drilling coverage supporting the mineral resource estimate. A: Homestake area. B: Dolly Varden area. Gray traces show historical drilling; red traces identify drilling incorporated in the estimate. South Reef is labeled “Silver Reef” in the source image | 23 |
| Figure 3-1. Dolly Varden Property mineral leases and Crown-granted mineral claims | 45 |
| Figure 3-2. Dolly Varden Property mineral tenures | 46 |
| Figure 3-3. Dolly Varden fee simple surface lots in Alice Arm | 48 |
| Figure 4-1. Kitsault Valley Project regional location and access | 52 |
| Figure 6-1. Terrane setting of the Kitsault Valley Project in the Canadian Cordillera | 66 |
| Figure 6-2. Regional geology and location of the Kitsault Valley Project | 67 |
| Figure 6-3. Property level geology and location of the Kitsault Valley Project | 69 |
| Figure 6-4. Simplified time-stratigraphic and mineralization column for the Dolly Varden area (modified from Higgs and Giroux [2015] and Sebert [2013]) | 70 |
| Figure 6-5. Property geology of the Dolly Varden claim block | 71 |
| Figure 6-6. Property geology of the Homestake claim block | 73 |
| Figure 6-7. Locations of the principal Kitsault Valley Project deposits | 77 |
| Figure 6-8. Longitudinal section along the Kitsault Valley trend showing the relative positions of the principal ore bodies | 78 |
| Figure 6-9. Conceptual hybrid bimodal-felsic/siliciclastic mineralization model (after Galley et al., 2007) | 79 |
| Figure 7-1. LiDAR coverage over the Dolly Varden claim block, 2017 | 82 |
| Figure 7-2. LiDAR coverage over the Homestake claim block and southern Kitsault Valley, 2022 | 85 |
| Figure 7-3. Kitsault Valley Project drilling locations, 2019–2025 (source: current Chapter 7 working record) | 100 |
| Figure 7-4. Homestake area drilling locations, 2022–2025 (source: current Chapter 7 working record) | 101 |
| Figure 7-5. Dolly Varden area drilling locations, 2019–2025 (source: current Chapter 7 working record) | 102 |
| Figure 8-1. Routine certified reference material (CRM), blank, and field duplicate counts for the 2023–2025 programs at the Dolly Varden (DV) and Homestake Ridge (HR) properties. Counts are from the summary tabs of the January and February 2026 QA/QC compilations | 108 |
| Figure 8-2. Representative silver CRM control charts for (A) CDN-ME-2314 at Dolly Varden and (B) CDN-ME-2203 at Homestake Ridge. The plots show certified values and ±3 standard-deviation limits; isolated excursions were evaluated at the batch level as described in the text | 110 |
| Contango Silver and Gold – Kitsault Valley Project | Page 9 of 253 |
| Technical Report Summary and updated Mineral Resource Estimate 2026 |
| Figure 8-3. Gold results for compiled 2023-2025 mafic-intrusive coarse blanks at (A) Dolly Varden and (B) Homestake Ridge. The plots include repeat or resubmitted determinations and therefore contain more points than the routine insertion counts in Table 8-4. The dashed line is the 0.015 ppm review limit used in the QA/QC compilation | 111 |
| Figure 8-4. Original versus one-third-core field-duplicate silver results for 2023-2025. Axes are logarithmic and the dashed line is the 1:1 relationship | 112 |
| Figure 8-5. Comparison of original ALS assay versus Bureau Veritas check-assay silver results. Axes are logarithmic and the dashed red line is the 1:1 relationship | 113 |
| Figure 10-1. Comparison of the 2016 Homestake Main and Homestake Silver metallurgical process concepts | 125 |
| Figure 10-2. Historical development of the Torbrit processing flowsheet, illustrating the transition from cyanidation of native silver to flotation recovery of galena and ruby silver minerals (Turner and McConchie, 1960) | 126 |
| Figure 10-3. Historical polished-section images from Torbrit showing: (A) crustiform barite–galena–sphalerite mineralization; (B) galena with inclusions of sphalerite, pyrite, and pyrargyrite; (C) pyrargyrite (ruby silver) replacing galena in calcite–barite gangue; and (D) chalcopyrite with galena and sphalerite in barite gangue. Mineral abbreviations: Ba = barite; Gn = galena; Sp = sphalerite; Py = pyrite; Prg = pyrargyrite (ruby silver); Ccp = chalcopyrite; and Cal = calcite. Images are qualitative and are not representative of quantitative mineralogy. Source: adapted from Mortensen (1960) | 128 |
| Figure 10-4. Simplified flowsheet evaluated during the 2019 Torbrit differential lead-zinc flotation program. The flowsheet represents preliminary batch testing and is not a selected process design | 129 |
| Figure 10-5. Silver cyanidation kinetics for selected Dolly Varden and Torbrit composites. A – Dolly Varden whole-ore cyanidation kinetics; B – Torbrit whole-ore Cyanidation Kinetics; C – Flotation-tail cyanidation kinetics (Dolly Varden and Torbrit). Summarized results of the 2019 Blue Coast Research Ltd. metallurgical test work | 130 |
| Figure 10-6. Comparative recovery of silver, lead, and zinc by process route and deposit. Recoveries are based on selected composite test work and represent the maximum recoveries achieved under the conditions shown. Whole-ore cyanidation recoveries for Ag, Pb, and Zn were calculated from head assays and leach residues. Flotation-tail cyanidation reports Ag recovery only. Source: Blue Coast Research Ltd. (2019) | 131 |
| Figure 11-1. Regional location of the Kitsault Valley resource deposits | 141 |
| Figure 11-2. Drilling and sample coverage supporting the Mineral Resource estimates. A – Homestake northern region. B – Dolly Varden southern region. Historical drilling in gray with red drill traces representing holes included in this MRE | 145 |
| Figure 11-3. Homestake Main geological domains and representative sections. Deposit views of Homestake Main showing the four modeled domains used in this MRE. A – Plan view, B – Longitudinal view (looking SW), C – Cross-sectional view (looking NW) | 151 |
| Figure 11-4. Homestake Main Resource Classification geometry: A – Plan view, B – Longitudinal view (looking SW), C – Cross-sectional view looking NW. Red solid represents Indicated classification and blue Inferred classification | 155 |
| Contango Silver and Gold – Kitsault Valley Project | Page 10 of 253 |
| Technical Report Summary and updated Mineral Resource Estimate 2026 |
| Figure 11-5. Homestake Silver domain geometry and representative sections showing the 13 modeled domains. A – Plan view, B – Longitudinal view (looking southwest), C – Cross-sectional view looking west | 157 |
| Figure 11-6. Homestake Silver Mineral Resource Classification: A – Plan view, B – Longitudinal view (looking southwest), C – Cross-sectional view looking west. Red solid represents Indicated classification and blue Inferred classification | 163 |
| Figure 11-7. Wolf domain geometry and representative sections showing the two modeled domains: A – Plan view, B – Longitudinal view (looking northwest), C – Cross-sectional view of the shallower Wolf Vein systems looking northeast, D – Cross-sectional view of the Wolf Deep system looking northeast | 167 |
| Figure 11-8. Wollf Mineral Resource classification geometry A – Plan view, B – Longitudinal view (looking northwest), C – Cross-sectional view of the shallower Wolf Vein systems looking northeast, D – Cross sectional view of the Wolf Deep system looking northeast. Red solid represents Indicated classification and blue Inferred classification | 170 |
| Figure 11-9. Kitsol domain geometry and representative sections showing the modeled domains. A – Plan view, B – Longitudinal view (looking west), C – Cross- sectional view looking northeast | 172 |
| Figure 11-10. Kitsol Mineral Resource Classification geometry: A – Plan view, B – Longitudinal view (looking west), C – Cross- sectional view looking northeast. Red solid represents Indicated classification and blue Inferred classification | 175 |
| Figure 11-11. Torbrit domain geometry and representative sections showing the 11 modeled domains: A – Plan view, B – Longitudinal view (looking northeast), C – Cross-sectional view looking northwest | 177 |
| Figure 11-12. Torbrit Mineral Resource Classification geometry: A – Plan view, B – Longitudinal view (looking northeast), C – Cross- sectional view looking northwest. Red solid represents Indicated classification and blue Inferred classification | 182 |
| Figure 11-13. Final mineralized unmined model (purple) and historical underground workings and mined out (depleted) areas (black) | 183 |
| Figure 11-14. Dolly Varden geometry and representative sections showing the modeled domain. A – Plan View, B – Longitudinal view (looking northeast), C – Cross-sectional view (looking northwest) | 185 |
| Figure 11-15. Dolly Varden Mineral Resource Estimate geometry: A – Plan view, B – Longitudinal view (looking northeast), C – Cross-sectional view looking northwest. Red solid represents Indicated classification and blue Inferred classification | 188 |
| Figure 11-16. Final mineralized unmined model (purple) and historical underground workings and mined out (depleted) areas (black) | 189 |
| Figure 11-17. Northstar geometry and representative sections showing the modeled domain. A – Plan View, B – Longitudinal view (looking northeast), C – Cross-sectional view (looking northwest) | 190 |
| Figure 11-18. Northstar Mineral Resource classification geometry. A – Plan view, B – Longitudinal view (looking northeast), C – Cross-sectional view (looking northwest). Red solid represents Indicated classification and blue Inferred classification | 193 |
| Figure 11-19. Northstar final mineralized unmined model (purple) and historical underground workings and mined out (depleted) areas (black) | 194 |
| Contango Silver and Gold – Kitsault Valley Project | Page 11 of 253 |
| Technical Report Summary and updated Mineral Resource Estimate 2026 |
| Figure 11-20. Change in reported AgEq by deposit and resource category. Values are on their respective reporting bases, including different cut-offs, metal prices and recoveries. This is not a constant-assumption revaluation. Torbrit and Kitsol are combined to match the preceding reporting unit. South Reef has no Indicated resource | 198 |
| Figure 15-1. Regional access and transportation setting, Kitsault Valley Project (source: initial Chapter 15 infrastructure working draft, June 2026) | 210 |
| Figure 15-2. Project-scale infrastructure setting, showing regional roads, transmission lines, Alice Arm and Kitsault logistics nodes, historic hydroelectric works, and Stewart port (source: initial Chapter 15 infrastructure working draft, June 2026) | 214 |
| Figure 17-1. Principal exploration permit areas and historical infrastructure in the core Kitsault Valley corridor | 219 |
| Figure 17-2. Broader exploration permit setting. Boundaries and permit identifiers are informational and require reconciliation with the final Chapter 4 property boundary and executed permits | 221 |
| Figure 20-1. Kitsault Valley Project and selected adjacent mineral tenure. Tenure ownership and boundaries are based on the June 2026 Company compilation | 232 |
| Contango Silver and Gold – Kitsault Valley Project | Page 12 of 253 |
| Technical Report Summary and updated Mineral Resource Estimate 2026 |
List of Tables
| Table 1-1. Mineral resource summary by area and classification | 22 |
| Table 1-2. Indicated mineral resource grades and contained metals | 24 |
| Table 1-3. Inferred mineral resource grades and contained metals | 24 |
| Table 1-4. Adopted recovery assumptions for the seven updated deposits. South Reef retains its historical reporting basis and is not included in this recovery matrix | 26 |
| Table 1-5. Proposed program budget in U.S. dollars | 29 |
| Table 2-1. Deposits included in the mineral resource statement for the Kitsault Project, northwestern British Columbia | 30 |
| Table 2-2. Sources of information used in this report | 31 |
| Table 2-3. Reporting milestones | 32 |
| Table 3-1. Kitsault Valley Project mineral leases | 34 |
| Table 3-2. Kitsault Valley Project mineral claims | 34 |
| Table 3-3. Kitsault Valley Project Crown-granted mineral claims | 43 |
| Table 3-4. Kitsault Valley Project 2026 Mineral Tax fee simple lots | 47 |
| Table 4-1. Principal access and logistics routes | 51 |
| Table 4-2. Regional climate statistics reported in the 2023 Technical Report | 54 |
| Table 4-3. Existing and required infrastructure | 55 |
| Table 5-1. Summary of historical exploration of regional prospects in the Dolly Varden area | 58 |
| Table 5-2. Summary of principal previous operators and work programs – Dolly Varden area | 59 |
| Table 5-3. Summary of principal previous operators and work programs – Homestake Ridge area | 61 |
| Table 5-4. Historical mineral estimates reported for the Dolly Varden area | 62 |
| Table 5-5. Homestake Ridge area historical estimates – reported tonnage and gold-equivalent cutoff grade | 63 |
| Table 5-6. Homestake Ridge area historical estimates – reported metal grades and sources | 64 |
| Table 6-1. Summary of host setting, mineralization style, and principal geological controls by deposit, Kitsault Valley Project | 74 |
| Table 7-1. Summary of Dolly Varden drilling, 2011–2018 | 88 |
| Table 7-2. Selected representative drilling results, Dolly Varden, 2011–2018 | 89 |
| Table 7-3. Summary of Kitsault Valley Project drilling, 2019–2022 | 89 |
| Table 7-4. Selected representative drilling results, 2019–2022 | 91 |
| Table 7-5. Reported drilling totals and target areas, 2023–2025 | 92 |
| Table 7-6. Selected representative exploration drill intercepts disclosed during 2023–2025 | 95 |
| Contango Silver and Gold – Kitsault Valley Project | Page 13 of 253 |
| Technical Report Summary and updated Mineral Resource Estimate 2026 |
| Table 7-7. Target-level drilling allocations, 2023–2025 | 99 |
| Table 8-1. QA/QC compilation totals | 104 |
| Table 8-2. Sample security controls and QP verification | 106 |
| Table 8-3. Summary of drill sample preparation and analytical procedures | 107 |
| Table 8-4. Current program drill and routine control statistics | 108 |
| Table 8-5. QP review and disposition framework | 114 |
| Table 9-1. Principal verification evidence reviewed by the QP | 115 |
| Table 9-2. QP verification procedures and determinations | 116 |
| Table 9-3. Site inspections relevant to data verification | 117 |
| Table 9-4. Continuing verification and data-governance measures | 120 |
| Table 10-1. Summary of principal metallurgical test work programs. Summarized from Shouldice and Coombs (2016), Middleditch (2019), Hough et al. (2022), Turner and Hough (2023), Fuse Advisors (2026), and Hall (2026a) | 122 |
| Table 10-2. Metallurgical laboratory and specialist disclosure summary. Prepared from Shouldice and Coombs (2016), Middleditch (2019), Hough et al. (2022), Turner and Hough (2023), Fuse Advisors (2026), and Hall (2026a) | 123 |
| Table 10-3. Homestake 2016 composite head grades reported from duplicate head cuts. Summarized from Hough et al. (2022) and Turner and Hough (2023) | 124 |
| Table 10-4. Dolly Varden and Torbrit composite head assays | 127 |
| Table 10-5. Preliminary silver recovery estimates from 2019 Dolly Varden and Torbrit test work | 130 |
| Table 10-6. Wolf and Kitsol sample selection summary | 132 |
| Table 10-7. Wolf and Kitsol 2026 composite head assays | 132 |
| Table 10-8. Selected final open-circuit cleaner concentrate grades from 2026 Wolf and Kitsol tests | 134 |
| Table 10-9. Selected final open-circuit cleaner flotation recoveries from 2026 Wolf and Kitsol tests | 134 |
| Table 10-10. Wolf and Kitsol 2026 cyanidation test results | 135 |
| Table 10-11. Selected deleterious elements in 2026 final cleaner concentrates | 136 |
| Table 11-1. Deposit scope and reporting basis | 140 |
| Table 11-2. Drill hole header inventory by deposit | 142 |
| Table 11-3. Merged interval inventory and analytical coverage by deposit | 143 |
| Table 11-4. Merged interval analytical coverage by deposit and domain | 144 |
| Table 11-5. Density measurement support and resource assignments | 146 |
| Table 11-6. Selected classification thresholds and raw AvgD equivalents | 147 |
| Table 11-7. Commodity prices for the 2026 updated estimates | 148 |
| Table 11-8. Recovery factors used in the updated metal-equivalent calculations | 149 |
| Contango Silver and Gold – Kitsault Valley Project | Page 14 of 253 |
| Technical Report Summary and updated Mineral Resource Estimate 2026 |
| Table 11-9. Homestake Main estimation domains | 151 |
| Table 11-10. Homestake Main caps and capped input statistics | 153 |
| Table 11-11. Homestake Main global block-model bounds | 154 |
| Table 11-12. Homestake Main search and sample parameters | 154 |
| Table 11-13. Homestake Main Mineral Resource grades | 156 |
| Table 11-14. Homestake Main contained metals | 156 |
| Table 11-15. Homestake Silver estimation domains | 157 |
| Table 11-16. Homestake Silver caps and capped input statistics | 159 |
| Table 11-17. Homestake Silver global block-model bounds | 161 |
| Table 11-18. Homestake Silver search and sample parameters | 162 |
| Table 11-19. Homestake Silver Mineral Resource grades | 164 |
| Table 11-20. Homestake Silver contained metals | 164 |
| Table 11-21. South Reef Mineral Resource grades | 165 |
| Table 11-22. South Reef contained metals | 165 |
| Table 11-23. Wolf estimation domains | 166 |
| Table 11-24. Wolf caps and capped input statistics | 168 |
| Table 11-25. Wolf global block-model bounds | 169 |
| Table 11-26. Wolf search and sample parameters | 169 |
| Table 11-27. Wolf Mineral Resource grades | 171 |
| Table 11-28. Wolf contained metals | 171 |
| Table 11-29. Kitsol estimation domains | 171 |
| Table 11-30. Kitsol caps and capped input statistics | 173 |
| Table 11-31. Kitsol global block-model bounds | 173 |
| Table 11-32. Kitsol search and sample parameters | 174 |
| Table 11-33. Kitsol Mineral Resource grades | 176 |
| Table 11-34. Kitsol contained metals | 176 |
| Table 11-35. Torbrit estimation domains | 177 |
| Table 11-36. Torbrit caps and capped input statistics | 178 |
| Table 11-37. Torbrit global block-model bounds | 180 |
| Table 11-38. Torbrit search and sample parameters | 181 |
| Table 11-39. Torbrit Mineral Resource grades | 183 |
| Table 11-40. Torbrit contained metals | 183 |
| Contango Silver and Gold – Kitsault Valley Project | Page 15 of 253 |
| Technical Report Summary and updated Mineral Resource Estimate 2026 |
| Table 11-41. Dolly Varden estimation domains | 184 |
| Table 11-42. Dolly Varden caps and capped input statistics | 186 |
| Table 11-43. Dolly Varden global block-model bounds | 186 |
| Table 11-44. Dolly Varden search and sample parameters | 187 |
| Table 11-45. Dolly Varden Mineral Resource grades | 189 |
| Table 11-46. Dolly Varden contained metals | 189 |
| Table 11-47. North Star estimation domains | 190 |
| Table 11-48. North Star caps and capped input statistics | 191 |
| Table 11-49. North Star global block-model bounds | 192 |
| Table 11-50. North Star search and sample parameters | 192 |
| Table 11-51. North Star Mineral Resource grades | 194 |
| Table 11-52. North Star contained metals | 194 |
| Table 11-53. Indicated Mineral Resource tonnes and grades | 195 |
| Table 11-54. Indicated Mineral Resource contained metals | 195 |
| Table 11-55. Inferred Mineral Resource tonnes and grades | 195 |
| Table 11-56. Inferred Mineral Resource contained metals | 196 |
| Table 11-57. Regional and project totals by resource category | 196 |
| Table 11-58. Indicated comparison with the preceding resource statement | 197 |
| Table 11-59. Inferred comparison with the preceding resource statement | 197 |
| Table 11-60. Homestake Main classification-distance sensitivity | 199 |
| Table 11-61. Homestake Silver classification-distance sensitivity | 199 |
| Table 11-62. Wolf classification-distance sensitivity | 199 |
| Table 11-63. Kitsol classification-distance sensitivity | 199 |
| Table 11-64. Torbrit classification-distance sensitivity | 200 |
| Table 11-65. Dolly Varden classification-distance sensitivity | 200 |
| Table 11-66. North Star classification-distance sensitivity | 200 |
| Table 11-67. Principal sources of resource uncertainty and their treatment | 202 |
| Table 15-1. Existing infrastructure and future-project requirement or status | 208 |
| Table 15-2. Infrastructure definition required for a future project study | 213 |
| Table 16-1. Commercial terms used in economic analysis for Pb concentrate | 215 |
| Table 16-2. Commercial terms used in economic analysis for Cu concentrate | 216 |
| Table 16-3. Commercial terms used in economic analysis for Zn concentrate | 216 |
| Contango Silver and Gold – Kitsault Valley Project | Page 16 of 253 |
| Technical Report Summary and updated Mineral Resource Estimate 2026 |
| Table 17-1. Principal exploration permits for the core Kitsault Valley area (2026 management register; verify against executed permits) | 218 |
| Table 17-2. Other exploration permits shown in the working record | 220 |
| Table 17-3. Management-reported operating authorizations and arrangements | 222 |
| Table 17-4. Reported 2012 reconnaissance water-sample locations | 223 |
| Table 17-5. Environmental baseline status and principal gaps for future development | 224 |
| Table 17-6. Engagement context reported in the working record | 225 |
| Table 17-7. Indicative future permitting framework | 227 |
| Table 20-1. Adjacent properties selected for regional context | 231 |
| Table 22-1. Mineral resource summary by area and classification | 238 |
| Table 22-2. Principal uncertainties affecting resource confidence and further evaluation | 241 |
| Table 23-1. Proposed staged work-program budget in U.S. dollars | 244 |
| Table 25-1. Company information relied upon for land status, permitting and environmental matters | 251 |
| Contango Silver and Gold – Kitsault Valley Project | Page 17 of 253 |
| Technical Report Summary and updated Mineral Resource Estimate 2026 |
| 1 | EXECUTIVE SUMMARY |
| 1.1 | Purpose and Principal Conclusions |
This Technical Report Summary (TRS), dated September 21, 2026, presents the updated mineral resource estimate and supporting technical information for the Kitsault Valley Project located in northwestern British Columbia, Canada. The report has been prepared for Contango Silver & Gold Inc. (the Company) under Subpart 1300 of Regulation S-K. The mineral resource effective date is September 11, 2026[RV1.1][DL1.2]. Dave Larimer, CPG, Vice President Exploration, is the sole Qualified Person (QP) responsible for all sections of the report. He is an employee of the Company and is not independent.
Mr. Larimer holds American Institute of Professional Geologists certification CPG-11862 and State of Alaska Certified Professional Geologist certification 115316, both in good standing. His 20 years of relevant professional experience and qualifications are described on the QP statement and signature page.
The Project contains Indicated mineral resources of 7.660 million metric tons (Mt), containing 58.698 million ounces (Moz) of silver, 394.700 thousand ounces (koz) of gold or 89.545 Moz of silver equivalent (AgEq), and Inferred mineral resources of 6.305 Mt, containing 22.804 Moz of silver, 620.817 koz of gold or 64.920 Moz AgEq. Indicated and Inferred resources are reported separately. No Measured mineral resources or mineral reserves are reported. Mineral resources are not mineral reserves and do not have demonstrated economic viability.
The update establishes a larger Indicated inventory and incorporates a substantially revised geological interpretation at Homestake Main and Homestake Silver. Additional drilling has improved the definition of mineralized domains and the understanding of geometry and continuity relative to the framework underlying the preceding resource statement reported in 2023. The larger Indicated inventory provides a stronger basis for subsequent technical evaluation; it does not imply that all additional Indicated material represents conversion from the previous Inferred estimate.
| 1.2 | Property Description and Ownership |
The Kitsault Valley Project lies approximately 39 km southeast of Stewart and 27 km northeast of Alice Arm, in the Skeena Mining District of British Columbia. The resource estimate covers two areas: the Homestake area, comprising Homestake Main, Homestake Silver and South Reef; and the Dolly Varden area, comprising Wolf, Kitsol, Torbrit, Dolly Varden and North Star. Figure 1-1 shows the relative locations of the eight deposits for which resources have been estimated.
The Company holds its interest through its subsidiaries following completion of the merger with Dolly Varden Silver Corporation on March 26, 2026. Project mineral rights are held through mineral claims, mineral leases and Crown-granted mineral claims. Company-owned surface parcels at Alice Arm support exploration facilities, offices and core storage. Mineral tenure and surface rights are distinct, and maintaining rights requires the applicable rents, taxes, assessment work or payments. Certain property portions are subject to net smelter return royalties and other contractual obligations, as detailed in Chapter 3. The scope of the resource estimate is the eight deposits identified above; broader regional exploration holdings are not additional mineral resources.
| Contango Silver and Gold – Kitsault Valley Project | Page 18 of 253 |
| Technical Report Summary and updated Mineral Resource Estimate 2026 |
| 1.3 | Geological Setting and Mineralization |
The Project lies within the Stikine Terrane and Stewart Complex of the Canadian Cordillera. The principal host rocks are Jurassic Hazelton Group volcanic, volcaniclastic, sedimentary and subvolcanic units. Mineralization reflects both stratigraphic and structural controls, including synvolcanic faults, hydrothermal brecciation, veining, replacement and later deformation. A single deposit model does not adequately describe all of the different styles of mineralization.
The Dolly Varden area is predominantly silver-rich, with variable lead, zinc, gold and copper. Torbrit and North Star include stratabound silica–barite–sulfide mineralization and locally reworked or structurally overprinted material. Wolf and Kitsol are principally structurally controlled epithermal-style vein and breccia systems. Homestake Main contains gold–silver–copper mineralization in silicified lenses and hydrothermal breccias; Homestake Silver comprises silver–gold-bearing breccia and vein zones with lead and zinc; and South Reef consists of relatively narrow gold-bearing zones associated with quartz–chlorite alteration and sulfides.
| Contango Silver and Gold – Kitsault Valley Project | Page 19 of 253 |
| Technical Report Summary and updated Mineral Resource Estimate 2026 |
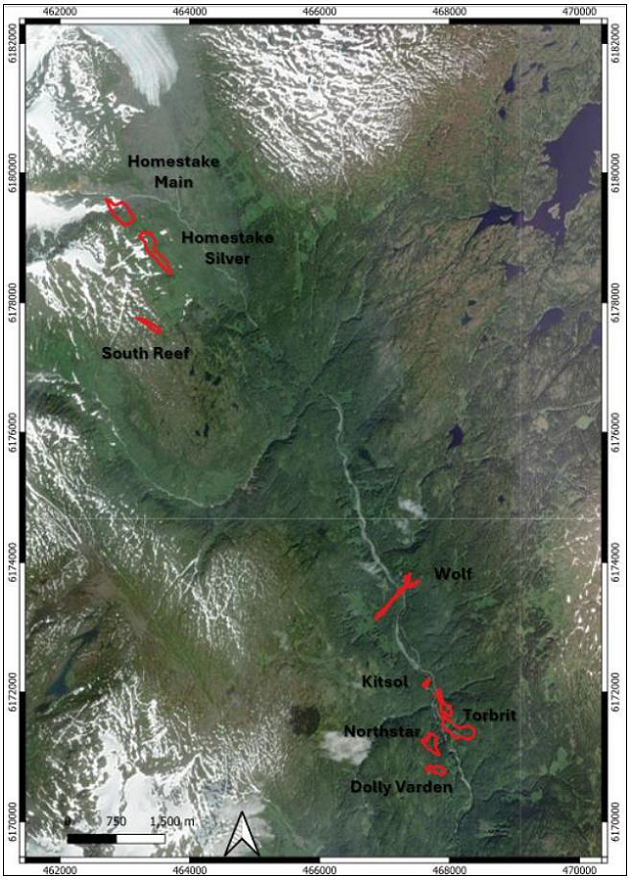
Figure 1-1 Location
of the Kitsault Valley resource deposits. Red outlines show the resource
deposits. Coordinates are NAD83 / UTM Zone 9N, in meters.
| Contango Silver and Gold – Kitsault Valley Project | Page 20 of 253 |
| Technical Report Summary and updated Mineral Resource Estimate 2026 |
| 1.4 | Exploration and Data Verification |
Exploration has included geological and structural mapping, surface geochemistry, airborne and ground geophysics, terrain surveys, historical-core review and diamond drilling. Modern drilling has tested extensions of known mineralization, improved geological interpretation and increased local drill support. Historical workings at Dolly Varden, Torbrit and North Star provide additional geological context and require appropriate treatment of mined-out volumes.
The estimate uses the accepted historical and modern drilling and assay database, incorporating all drilling through the completed 2025 program. The assay dataset was locked at the start of January 2026. Geological-solid updates and database review continued through March 2026, and the QP finalized, checked and certified the databases and supporting information on April 13, 2026. The final resource statement, classifications and supporting assumptions were accepted as complete and current on September 11, 2026, the mineral resource effective date.
All drilling completed in 2026 falls outside the accepted estimation dataset is to be incorporated in the next resource update described in Section 1.10
The eight-deposit header inventory contains 1,454 holes totaling 328,638.18 meters. The seven updated deposits have merged Leapfrog exports covering 34 geological domains, with 24,120 intervals totaling 29,842.13 meters. Of these, 23,264 intervals totaling 27,176.00 meters from 947 distinct hole identifiers contain at least one populated metal result. These merged intervals are distinct from original assay samples and final composites. South Reef is excluded from the seven-export inventory and retains its preceding estimation basis. Chapter 11, Section 11.2 documents these data populations; Figure 1-2 shows the drilling coverage.
The QP’s verification included review of drilling, logging, sampling, survey and analytical procedures; selected comparisons of original drill logs and assay certificates against digital records; review of analytical quality control; and checks for overlapping intervals, records extending beyond hole depth, missing fields, inconsistent codes and unit-conversion errors. The QP personally inspected the Project on September 14, 2025, and July 21–24, 2026, including review of core handling, logging, sampling and geological observations. The inspection scope and verification work are described in Chapter 9. Some historical assay certificates remain unavailable; those records were assessed using prior verification, internal consistency and comparison with surrounding drilling. The QP considers the accepted data adequate for the geological interpretation and mineral resource estimation purposes described in this TRS.
| 1.5 | Mineral Resource Estimate |
Table 1-1 summarizes the mineral resources by area and category. Tables 1-2 and 1-3 present the deposit grades and contained silver, gold, copper, lead and zinc, together with silver-equivalent totals. The complete resource statement, classification criteria and reporting assumptions are presented in Chapter 11.
| Contango Silver and Gold – Kitsault Valley Project | Page 21 of 253 |
| Technical Report Summary and updated Mineral Resource Estimate 2026 |
Table 1-1. Mineral resource summary by area and classification.
| Area | Category | Tonnage (Mt) |
Ag (Moz) |
Au (koz) |
Cu (Mlb) |
Pb (Mlb) |
Zn (Mlb) |
AgEq (Moz) |
| Homestake | Indicated | 2.140 | 6.133 | 387.416 | 6.32 | 5.96 | 7.02 | 33.275 |
| Dolly Varden | Indicated | 5.520 | 52.565 | 7.285 | 3.06 | 72.20 | 81.83 | 56.270 |
| Project total | Indicated | 7.660 | 58.698 | 394.700 | 9.38 | 78.16 | 88.85 | 89.545 |
| Homestake | Inferred | 4.595 | 7.965 | 615.824 | 4.24 | 16.86 | 14.69¹ | 48.501 |
| Dolly Varden | Inferred | 1.710 | 14.839 | 4.993 | 1.80 | 23.38 | 33.92 | 16.419 |
| Project total | Inferred | 6.305 | 22.804 | 620.817 | 6.04 | 40.24 | 48.61¹ | 64.920 |
The resources are reported in situ within the accepted resource domains, after exclusion of modeled historical mined-out material where applicable, and before mining dilution or mining recovery. Contained metals are not recovered or payable metal. Totals may differ due to rounding. South Reef is carried forward from the previous estimate and retains its separate reporting basis. All reported quantities in this summary follow the final statement in Chapter 11, Section 11.7. Mlb = million pounds. ¹ Zinc totals exclude South Reef, where zinc is not reported.
| Contango Silver and Gold – Kitsault Valley Project | Page 22 of 253 |
| Technical Report Summary and updated Mineral Resource Estimate 2026 |
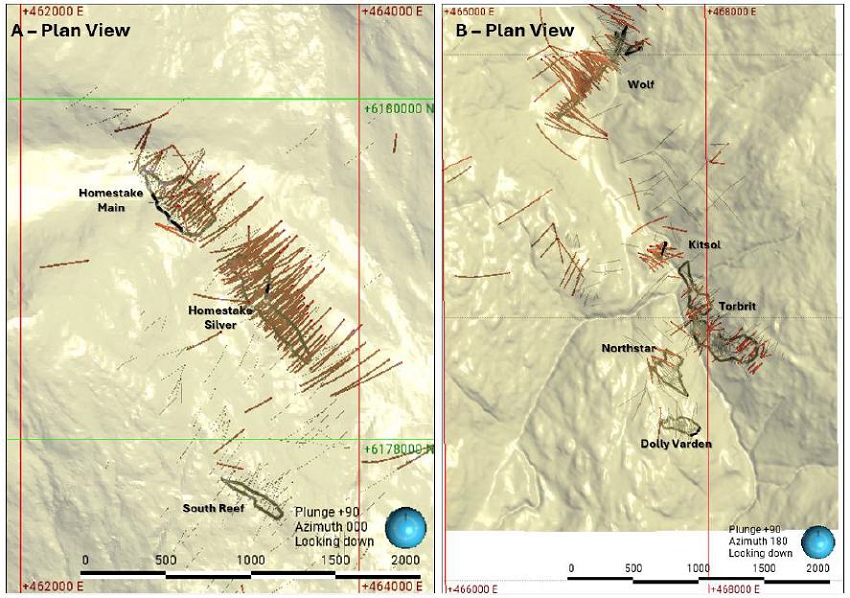
Figure 1-2. Drilling coverage supporting the mineral resource estimate. A: Homestake area. B: Dolly Varden area. Gray traces show historical drilling; red traces identify drilling incorporated in the estimate. South Reef is labeled “Silver Reef” in the source image.
| Contango Silver and Gold – Kitsault Valley Project | Page 23 of 253 |
| Technical Report Summary and updated Mineral Resource Estimate 2026 |
Indicated mineral resources
Table 1-2. Indicated mineral resource grades and contained metals.
| Deposit | Tonnage (Mt) |
Ag (g/t) |
Au (g/t) |
Cu (%) |
Pb (%) |
Zn (%) |
Ag (Moz) |
Au (koz) |
Cu (Mlb) |
Pb (Mlb) |
Zn (Mlb) |
AgEq (Moz) |
| Homestake Main | 1.430 | 49.55 | 6.350 | 0.181 | 0.058 | 0.112 | 2.277 | 292.009 | 5.71 | 1.83 | 3.53 | 23.308 |
| Homestake Silver | 0.710 | 168.26 | 4.160 | 0.039 | 0.263 | 0.222 | 3.856 | 95.407 | 0.61 | 4.13 | 3.49 | 9.968 |
| Torbrit | 3.250 | 295.43 | 0.014 | 0.018 | 0.546 | 0.440 | 30.847 | 1.428 | 1.29 | 39.06 | 31.52 | 32.394 |
| Kitsol | 0.290 | 301.13 | 0.030 | 0.029 | 0.368 | 0.300 | 2.766 | 0.231 | 0.18 | 2.32 | 1.89 | 2.876 |
| Dolly Varden | 0.090 | 426.44 | 0.020 | 0.025 | 0.432 | 1.459 | 1.235 | 0.056 | 0.05 | 0.86 | 2.90 | 1.321 |
| Wolf | 1.530 | 301.90 | 0.050 | 0.027 | 0.714 | 0.864 | 14.850 | 2.246 | 0.92 | 24.09 | 29.15 | 16.108 |
| North Star | 0.360 | 249.18 | 0.290 | 0.079 | 0.744 | 2.076 | 2.866 | 3.322 | 0.62 | 5.87 | 16.37 | 3.571 |
Inferred mineral resources
Table 1-3. Inferred mineral resource grades and contained metals.
| Deposit | Tonnage (Mt) |
Ag (g/t) |
Au (g/t) |
Cu (%) |
Pb (%) |
Zn (%) |
Ag (Moz) |
Au (koz) |
Cu (Mlb) |
Pb (Mlb) |
Zn (Mlb) |
AgEq (Moz) |
| Homestake Main | 0.520 | 11.09 | 4.610 | 0.143 | 0.056 | 0.127 | 0.186 | 77.211 | 1.64 | 0.64 | 1.46 | 5.770 |
| Homestake Silver | 3.630 | 65.88 | 3.550 | 0.028 | 0.203 | 0.165 | 7.680 | 414.413 | 2.24 | 16.22 | 13.23 | 34.132 |
| South Reef | 0.445 | 4.90 | 8.680 | 0.040 | 0.001 | NR | 0.100 | 124.200 | 0.36 | 0.00 | NR | 8.600 |
| Torbrit | 0.760 | 235.77 | 0.013 | 0.034 | 0.545 | 0.250 | 5.747 | 0.329 | 0.57 | 9.10 | 4.18 | 6.057 |
| Kitsol | 0.140 | 303.04 | 0.020 | 0.033 | 0.434 | 0.316 | 1.323 | 0.101 | 0.10 | 1.30 | 0.94 | 1.380 |
| Dolly Varden | 0.140 | 328.78 | 0.030 | 0.048 | 0.506 | 1.519 | 1.456 | 0.149 | 0.15 | 1.54 | 4.61 | 1.604 |
| Wolf | 0.440 | 381.40 | 0.030 | 0.030 | 0.707 | 1.100 | 5.390 | 0.411 | 0.30 | 6.85 | 10.66 | 5.790 |
| North Star | 0.230 | 123.99 | 0.540 | 0.134 | 0.898 | 2.650 | 0.923 | 4.002 | 0.68 | 4.59 | 13.53 | 1.587 |
The seven updated deposits are reported at a cut-off grade of 132 g/t AgEq. South Reef retains a cut-off of 2.0 g/t AuEq. The underground extraction concept considers mechanized mining, including longhole stoping where deposit geometry and ground conditions permit. The reporting constraints and reasonable-prospects assessment are summarized in Section 1.8 and described in Chapter 11, Section 11.4. Mlb = million pounds; NR = not reported.
| Contango Silver and Gold – Kitsault Valley Project | Page 24 of 253 |
| Technical Report Summary and updated Mineral Resource Estimate 2026 |
Comparison with the previous estimate
Relative to the preceding statement presented in the 2023 combined report, Indicated tonnage increases from 4.153 to 7.660 Mt, an increase of 84.4%, and Indicated AgEq increases from 46.368 to 89.545 Moz, an increase of 93.1%. Inferred tonnage decreases from 6.831 to 6.305 Mt, a decrease of 7.7%, and Inferred AgEq decreases from 86.725 to 64.920 Moz, a decrease of 25.1%. These are net comparisons on their respective reporting bases and do not measure block-by-block category conversion. The changes combine drilling, geological domains, capping, interpolation, density, classification, depletion and reporting assumptions. Kitsol is combined with Torbrit for comparison with the earlier reporting unit, and gold was not reported for the southern deposits in the earlier baseline.
AgEq values retain the adopted reporting basis of each deposit. Tables 1-2 and 1-3 include copper, lead and zinc grades and contained metals; Table 1-4 summarizes the base-metal grades by category. These metals contribute to equivalent grades for the seven updated deposits. NR = not reported. South Reef retains 0.445 Mt at 8.68 g/t Au and 4.90 g/t Ag, containing 124.200 koz Au and 0.100 Moz Ag. Its 8.600 Moz AgEq is a retained comparative metric; the historical resource has not been re-estimated using the 2026 Homestake Silver equation or a 132 g/t AgEq filter. Displayed tonnages, grades and contents are rounded independently.
| 1.6 | Estimation and Classification |
The seven updated estimates were prepared in Leapfrog Geo version 2026.1.2 with the Edge extension, using hard geological domains, prepared assay datasets, compositing and grade capping by domain and element. Each metal was estimated independently using inverse-distance-cubed weighting. Leapfrog declustering was applied by domain and element in every estimator. Grade-search orientations, ranges and sample-selection controls were configured by domain, with variable orientation where appropriate. The models use 5 × 5 × 5 meter parent blocks and minimum sub-blocks of 0.5 × 0.5 × 0.5 meters in NAD83 / UTM Zone 9N coordinates.
Target composite lengths are 2.0 meters for Homestake Main, Homestake Silver, Wolf and Torbrit; 1.25 meters for Dolly Varden Main; and 1.5 meters for Kitsol and North Star. Compositing used the within-boundary setting and hard domain boundaries, with residual end lengths below 1.0 meter distributed equally and no additional compositing weight. Density assignments are 2.77 t/m³ for Homestake Main and Homestake Silver, 2.90 t/m³ for Wolf, 3.10 t/m³ for Torbrit, and 3.00 t/m³ for Dolly Varden, North Star and Kitsol. South Reef retains its historical estimation and density basis (Table 1-4).
Classification reflects the QP’s assessment of geological and grade continuity, data reliability and independent drill-hole support. Grade-estimation searches and classification searches serve separate purposes. The selected nominal Indicated/Inferred limits include 38/100 meters for Homestake Main and Homestake Silver, 45/100 meters for Wolf, 35/100 meters for Torbrit, 35/70 meters for Kitsol and 30/70 meters for Dolly Varden and North Star. These limits use classification AvgD divided by 0.707, an approximate nominal-spacing indicator rather than measured drill-hole spacing. Dolly Varden has a separate remnant-resource classification review. Detailed criteria and sensitivity results are presented in Chapter 11.
The 2026 equivalent-metal assumptions use prices of US$53/oz Ag, US$3,500/oz Au, US$5.00/lb Cu, US$1.25/lb Zn and US$0.90/lb Pb. These prices were selected for resource evaluation, with management concurrence in May 2026. The selection rationale and applicable time frame are described in Chapter 11.
| Contango Silver and Gold – Kitsault Valley Project | Page 25 of 253 |
| Technical Report Summary and updated Mineral Resource Estimate 2026 |
Table 1-4. Adopted recovery assumptions for the seven updated deposits. South Reef retains its historical reporting basis and is not included in this recovery matrix.
| Recovery group | Ag % | Au % | Cu % | Zn % | Pb % |
| Dolly Varden area | 85 | 75 | 70 | 80 | 85 |
| Homestake Main | 80 | 85 | 65 | 70 | 75 |
| Homestake Silver | 85 | 80 | 65 | 75 | 80 |
Dolly Varden area: AgEq = Ag + 58.27Au + 53.27Cu + 15.22Zn + 11.64Pb.
Homestake Main: AgEq = Ag + 70.17Au + 52.56Cu + 14.15Zn + 10.92Pb.
Homestake Silver: AgEq = Ag + 62.15Au + 49.47Cu + 14.27Zn + 10.96Pb.
In these equations, Ag and Au grades are in g/t and Cu, Zn and Pb grades are in percent. AgEq is expressed in g/t. The coefficients reflect relative prices and assumed metallurgical recoveries and do not represent net payable revenue after commercial deductions.
| 1.7 | Mineral Processing and Metallurgical Testing |
The metallurgical database includes the 2016 Base Metallurgical Laboratories work on Homestake composites, the 2019 Blue Coast Research program on Dolly Varden and Torbrit, and the 2025 sample-selection and testwork program extending modern coverage to Wolf and Kitsol. The work evaluated mineralogy, flotation, gravity concentration where applicable, whole-ore cyanidation and cyanidation of selected flotation products or tails. The tested material responds to conventional processing methods, but the results do not establish a single finalized flowsheet for all deposits.
The adopted recovery assumptions reflect differing mineralogy and allowance for downstream processing losses. Some values are preliminary proxies rather than measured integrated whole-feed recoveries. Arsenic, antimony and mercury in some tested concentrates may affect product specifications, penalties or treatment requirements. These factors remain material to subsequent economic evaluation. The planned 2026–2027 program will evaluate five representative composites using characterization, comminution, sequential lead–zinc flotation, locked-cycle testing, leaching and detailed product analysis. Chapter 24 defines the recommended program and budget. This future work has not been used to claim completed testing or improved recoveries in the current estimate.
| 1.8 | Mining Concept and Resource Reporting Basis |
The estimate is intended to support continued evaluation of potential underground extraction. Longhole stoping is a conceptual option for appropriately shaped and sufficiently continuous portions of the mineralization; it is not a demonstrated mining solution for every domain. Mining widths, dilution, recovery, geotechnical conditions, access development and the treatment of isolated mineralized volumes must be considered together with grade.
The updated resources are constrained within underground mineralized shapes developed in Leapfrog and reported at 132 g/t AgEq. These shapes delineate spatially continuous mineralization considered potentially amenable to future mechanized underground mining. Historical workings at Torbrit, Dolly Varden and North Star and unclassified material are excluded. The grade threshold and spatial constraints form part of the QP’s assessment of reasonable prospects for economic extraction. That assessment also considers access, processing and marketability, infrastructure, environmental and permitting requirements. The QP considers the identified technical issues capable of resolution through further work, as discussed in Chapter 11, Sections 11.4 and 11.11.
| Contango Silver and Gold – Kitsault Valley Project | Page 26 of 253 |
| Technical Report Summary and updated Mineral Resource Estimate 2026 |
The resource-stage work summarized in this TRS does not establish a project-level construction capital estimate, a definitive operating-cost estimate or a development cash-flow valuation. No mineral reserves, mine production schedule, project net present value or internal rate of return are declared in this summary.
| 1.9 | Access Infrastructure Environmental Matters and Permitting |
Alice Arm provides the current exploration base, with seasonal camp, geology and core-handling facilities. Regional supplies and personnel are mobilized through northwestern British Columbia service centers. Roads reach Kitsault, while marine transport and helicopter support provide access to Alice Arm and field locations. A historical road or trail corridor extends northward into the lower Kitsault Valley; the upper valley and Homestake deposits are accessed principally by helicopter. Rugged terrain, glaciers, heavy precipitation, snow and avalanche exposure affect field operations and future infrastructure design.
Existing facilities support exploration. Future mining would require evaluation of road upgrades, bridges, power supply, water management, processing and waste facilities, accommodation and product transport. Regional grid infrastructure and third-party ports provide options for study, but project capacity, access rights and commercial arrangements are not established by their proximity.
The core exploration areas are administered under the Dolly Varden and Homestake exploration permits, MX-1-860 and MX-1-603, respectively. Exploration activities remain subject to permit-specific disturbance limits, reporting, reclamation, security and operating conditions. Exploration authorizations do not constitute approval to construct or operate a mine. A future development proposal would require a project-specific permitting and assessment process, including applicable provincial and federal requirements and engagement with affected Indigenous Nations and communities.
Environmental work includes historical and renewed water-quality observations, meteorological monitoring, wildlife-management planning and archaeological screening. The Kitsault River watershed, fish habitat, steep terrain and seasonal runoff are important considerations. Historical workings, the former plant site and waste-rock accumulations require continued management and characterization. Existing baseline work is not a complete development-stage environmental assessment. Further hydrology, hydrogeology, geochemistry, aquatic and terrestrial studies are required to support facility selection, effects assessment and closure planning.
Engagement with Nisga’a Lisims Government and other Indigenous Nations and regional communities is an integral part of exploration planning and future project evaluation. Consultation associated with exploration permits should not be interpreted as consent to a future mine. Engagement commitments and the effective-date status of permits and agreements are described in Chapter 17.
| 1.10 | Qualified Person Conclusions and Recommendations |
The QP considers the accepted geological, drilling, sampling, analytical and density information adequate to support the estimates at the confidence levels assigned. The geological domains, high-grade controls, estimation parameters and classification framework described in Chapter 11 appropriately reflect the mineralized systems and available data. The revised Homestake framework and larger Indicated inventory support continued technical evaluation. Based on the geological setting and available drilling, the QP reasonably expects that the majority of Inferred resources should be upgraded through continued exploration; actual upgrading depends on the results and is not assured.
| Contango Silver and Gold – Kitsault Valley Project | Page 27 of 253 |
| Technical Report Summary and updated Mineral Resource Estimate 2026 |
Material uncertainties include local geological and grade continuity, high-grade sample influence, historical data and mined-out geometry, density variability, metallurgical response and product quality, mining dimensions and ground conditions, access and infrastructure requirements, water and waste management, permitting, and commodity-price and operating-cost assumptions. The magnitude of the resource does not remove these uncertainties. Inferred material remains less certain than Indicated material and cannot be assumed to convert to a higher resource category or mineral reserves.
The QP recommends the staged program summarized in Chapter 23. Stage 1 should complete the current 2026 drilling program, receive and validate the remaining assays, update the current MRE in 2027 with accepted 2026 drilling, and complete the planned 2026-2027 metallurgical program described technically in Chapter 10. After the 2027 MRE update is complete, the Company should proceed to an S-K 1300 Initial Assessment with preliminary capital and operating costs, cash-flow analysis and sensitivities. If assay receipt, MRE updating and metallurgical inputs progress as expected, the Initial Assessment could target completion near the end of Q2 2027; that target remains conditional on the timing and quality of the required inputs.
Stage 2 should advance the Project toward a pre-feasibility study over approximately the next three years. The work should focus on the PFS rollout rather than duplicating the current drilling program, and should include staged geotechnical and hydrogeological drilling, geotechnical testing and instrumentation, hydrology, hydrogeology, environmental baseline, geochemistry, permitting, access, infrastructure and closure-related field and engineering studies. These activities should be released through decision points tied to the Initial Assessment results, the updated geological model, metallurgical results, permitting priorities and field-season access.
Table 1-5 summarizes the staged planning allowances. Stage 1 includes metallurgy, the 2027 MRE update and the Initial Assessment; it excludes the cost of the already-authorized 2026 drilling program. Stage 2 includes the additional technical, environmental, permitting and engineering work required to support the PFS path.
| Contango Silver and Gold – Kitsault Valley Project | Page 28 of 253 |
| Technical Report Summary and updated Mineral Resource Estimate 2026 |
Table 1-5. Proposed program budget in U.S. dollars.
| Stage | Work item and timing | US$ Estimate | Budget basis |
| Stage 1 | Complete 2026 drilling, assay receipt and QA/QC close-out. 2026 to early 2027. | 0 | No new incremental allowance in this table; complete under the approved current program. |
| Stage 1 | Metallurgical program. Fall 2026 through 2027. | 200,000–300,000 | Representative composites, comminution, flotation, leaching, locked-cycle/product-quality testing and coordination. |
| Stage 1 | 2027 MRE update and QP reporting. After receipt and validation of 2026 assays. | 160,000–240,000 | Update the current MRE with accepted 2026 drilling and preserve the September 11, 2026 estimate as the baseline. |
| Stage 1 | Initial Assessment with economic analysis. After the 2027 MRE; target end of Q2 2027 if timing allows. | 800,000–1,200,000 | S-K 1300 Initial Assessment with preliminary mining, processing, infrastructure, environmental, permitting, capital, operating cost and sensitivity work. |
| Stage 2 | Geotechnical and hydrogeological drilling - up to 5,000 meters. Staged as engineering needs are confirmed. | 2,800,000–4,200,000 | Support access, underground design, water inflow, ground conditions and PFS-level engineering. |
| Stage 2 | Geotechnical testing and instrumentation. With staged geotechnical drilling. | 350,000–500,000 | Laboratory testing, instrumentation, monitoring and specialist interpretation. |
| Stage 2 | PFS engineering, environmental, hydrology, permitting and field studies. Approximately three years after the Initial Assessment. | 2,800,000–4,200,000 | Engineering trade-off studies, baseline expansion, hydrology/hydrogeology, geochemistry, access/infrastructure field work, permitting strategy and reporting. |
| Stage 1 subtotal | 1,160,000–1,750,000 | Planning sensitivity only; not a formal estimate-class accuracy range. | |
| Stage 2 subtotal | 6,000,000–9,000,000 | Planning sensitivity only; not a formal estimate-class accuracy range. | |
| Total proposed staged allowance | 7,160,000–10,750,000 | Planning sensitivity only; not a formal estimate-class accuracy range. |
Budget basis. Amounts are conceptual planning allowances in U.S. dollars and remain subject to Company approval, final scopes, contractor pricing, laboratory schedules and exchange-rate assumptions. The estimates reflect +/-20% planning sensitivity and are not presented as a formal estimate-class accuracy range. The retained Stage 2 drilling allowance is limited to geotechnical and hydrogeological drilling at US$712.50 per meter, including normal field logistics; specialist testing and instrumentation are separate.
The QP recommends staged expenditure against confirmed scopes and results. This work supports further evaluation; it does not establish additional mineral resources, mineral reserves or economic returns, or commit the Project to development.
| Contango Silver and Gold – Kitsault Valley Project | Page 29 of 253 |
| Technical Report Summary and updated Mineral Resource Estimate 2026 |
| 2 | INTRODUCTION |
| 2.1 | Purpose and Terms of Reference |
This Technical Report Summary (TRS) has been prepared for Contango Silver & Gold Inc. (Contango or the Company) to support disclosure of the updated mineral resource estimate for the Kitsault Valley Project (the Project), British Columbia, Canada, under Subpart 1300 of Regulation S-K. The report summarizes the scientific and technical information, interpretations and conclusions supporting the estimate and the associated resource-stage assessment. The mineral resource effective date is September 11, 2026. The TRS issue date is identified on the report title page.
The purpose of the work is to estimate and classify mineral resources, document the geological and estimation basis, assess the technical and economic assumptions relevant to reasonable prospects of economic extraction, and identify further work required to advance the Project. The scope includes review of exploration and drilling data, sampling and analytical quality, data verification, geological modeling, metallurgical information, resource estimation and classification, and relevant property, infrastructure and environmental information. This TRS does not declare mineral reserves or present a preliminary or final feasibility study.
| 2.2 | Project and Deposit Scope |
The Project is situated in northwestern British Columbia, approximately 39 km southeast of Stewart and 27 km northeast of Alice Arm. The Company holds its interests through subsidiaries following completion of the merger with Dolly Varden Silver Corporation on March 26, 2026 (Contango, 2026a). The mineral resource estimate covers eight deposits grouped into two areas (Table 2-1). Property boundaries, tenure, royalties and access rights are described in the Property Description chapter.
Table 2-1. Deposits included in the mineral resource statement for the Kitsault Project, northwestern British Columbia.
| Area | Deposits included in the mineral resource statement |
| Homestake | Homestake Main; Homestake Silver; South Reef |
| Dolly Varden | Wolf; Kitsol; Torbrit; Dolly Varden; North Star |
The current work updates seven deposit models. South Reef is carried forward as an Inferred resource at its preceding 2.0 g/t AuEq cut-off; no additional drilling is incorporated into that retained estimate. The seven updated deposits use a 132 g/t AgEq cut-off and the underground reporting constraints described in Chapter 11. Regional targets outside these eight deposits are excluded from reported resources.
The final statement in Chapter 11 reports 7.660 Mt Indicated containing 58.698 Moz Ag, 394.700 koz Au and 89.545 Moz AgEq, and 6.305 Mt Inferred containing 22.804 Moz Ag, 620.817 koz Au and 64.920 Moz AgEq. The categories are reported separately. South Reef is included in the Inferred totals on its retained reporting basis.
| 2.3 | Qualified Person and Technical Contributions |
Dave Larimer, CPG, Vice President Exploration of Contango, is the Qualified Person (QP) responsible for the mineral resource estimate and the technical conclusions presented in this TRS. Mr. Larimer is an employee of the Company and is not independent. The Company identifies him as a QP under Regulation S-K 1300 (Contango, 2026b). His qualifications and responsibilities are set out in the report’s QP identification and signature information.
| Contango Silver and Gold – Kitsault Valley Project | Page 30 of 253 |
| Technical Report Summary and updated Mineral Resource Estimate 2026 |
Company geological personnel supplied the exploration database, geological records and supporting project information. Sims Resources assisted with geological modeling, statistical evaluation and implementation in Leapfrog Geo version 2026.1.2 with Edge under the QP’s supervision. The QP reviewed and accepted the model inputs, estimation parameters, validation and classification and takes responsibility for the adopted estimates. Technical assistance does not replace that responsibility.
| 2.4 | Sources of Information |
This TRS is based on Company records, prior technical reports, laboratory and specialist reports, geological and block models, and the QP’s review and personal observations. The principal source groups are summarized in Table 2-2 below. Detailed references and source-specific limitations are provided in the relevant technical chapters and the References chapter.
Table 2-2. Sources of information used in this report.
| Source group | Information used and principal records |
| Previous project reporting | Technical Report on the Combined Kitsault Valley Project, British Columbia, Canada, dated March 23, 2023, effective September 28, 2022; earlier reports and assessment records cited in that report and in the current technical chapters. |
| Exploration and analytical data | Accepted historical and modern collars, downhole surveys, geological logs, merged intervals, assays, analytical certificates and density records. Chapter 11 distinguishes the 1,454-hole, 328,638.18-meter deposit header inventory from the seven merged exports: 24,120 intervals across 34 domains, including 23,264 intervals with metal results from 947 distinct hole identifiers. |
| Quality control and verification | Company sampling and analytical procedures, laboratory quality-control records, and the Dolly Varden and Homestake quality-control compilations dated January 30 and February 2, 2026, respectively; QP verification records. |
| Geological and resource models | Chapter 11 Mineral Resource Estimates and its final resource statement; Leapfrog Geo 2026.1.2 / Edge models and September 11, 2026 exports; domain, compositing, capping and declustering records; density assignments; grade and classification estimators; validation, sensitivity and historical-depletion evaluations. |
| Metallurgical information | Base Metallurgical Laboratories work on Homestake composites (2016); Blue Coast Research work on Dolly Varden and Torbrit (2019); and the 2025–2026 Wolf and Kitsol testwork, including Blue Coast project PJ-5599, dated April 29, 2026, and associated interpretations cited in the Metallurgy chapter. |
| Property and project context | Company tenure and ownership records, historical operating information, exploration infrastructure descriptions, environmental and permitting records, and information on Indigenous and community engagement, as identified in the relevant chapters. |
The QP’s data review included selected comparisons with original records and checks of the digital data and model inputs. Some historical assay certificates were unavailable. The treatment of those records, the verification performed and the resulting limitations are discussed in the Data Verification chapter. The QP considers the accepted database adequate for the geological interpretation and mineral resource estimation purposes described in this TRS.
| Contango Silver and Gold – Kitsault Valley Project | Page 31 of 253 |
| Technical Report Summary and updated Mineral Resource Estimate 2026 |
| 2.5 | Relationship to Previous Reporting |
The previous combined-project report is titled Technical Report on the Combined Kitsault Valley Project, British Columbia, Canada, dated March 23, 2023, with an effective date of September 28, 2022. Those dates are confirmed in Andrew Turner’s consent filed by Contango on June 22, 2026 (Turner, 2026). References in this TRS to the “2023 baseline” mean the resource disclosure presented in that report; the publication year should not be interpreted as the effective date of all underlying estimates.
| 2.6 | Personal Inspection |
Mr. Larimer personally inspected the Project on September 14th 2025, and July 21–24, 2026. The inspections included review of core handling, geological logging and sampling practices, and geological observations relevant to the interpretation of the mineralized systems. These observations informed his assessment of the exploration procedures and the suitability of the information used in the resource estimate. The scope of the inspection and the supporting verification work are described in the Data Verification chapter.
The QP’s conclusions on data adequacy consider these field observations together with the verification procedures and limitations documented in this TRS.
| 2.7 | Effective Date and Information Cut-offs |
The effective date of the resource estimate is distinct from the dates on which the database, geological models and reporting files were prepared or approved. The following dates define the preparation sequence used for this update (Table 2-3).
Table 2-3. Reporting milestones.
| Milestone | Date or reporting basis |
| Resource effective date | September 11, 2026; QP acceptance of the completed resource statement, classifications and supporting assumptions. |
| TRS issue date | As stated on the report title page; distinct from the resource effective date. |
| Estimation database coverage | Accepted historical and modern data, including the completed 2025 program; assay dataset locked at the start of January 2026. |
| Database certification | April 13, 2026; databases and supporting information finalized, checked and certified by the QP. |
| Geological-solid updates and database review | Continued through March 2026 before database certification. |
| Metal-price assumptions | Management concurrence in May 2026; QP-accepted prices and recovery assumptions are disclosed in Chapter 11, Section 11.4. |
| Final model exports and resource statement | Final exports locked and generated September 11, 2026; resource quantities are reported in Chapter 11, Section 11.7. |
Exploration information obtained after the estimation database cut-off is excluded from the estimate unless specifically identified as incorporated into the accepted model inputs. Material information relevant to the report’s conclusions is addressed through the effective-date review. The dates of the data lock, model preparation and personal inspection therefore serve different purposes.
| Contango Silver and Gold – Kitsault Valley Project | Page 32 of 253 |
| Technical Report Summary and updated Mineral Resource Estimate 2026 |
| 2.8 | Units, Currencies and Reporting conventions |
Unless otherwise stated, distances are reported in meters, areas in metric units and tonnages in metric tons (t), with one metric ton equal to 1,000 kilograms. Precious-metal grades are expressed in grams per metric ton (g/t), and base-metal grades in percent (%), except where source fields are explicitly in parts per million (ppm). For gold and silver, 1 ppm is numerically equal to 1 g/t; base-metal ppm values are divided by 10,000 to obtain percent. Precious-metal contents use 31.1034768 grams per troy ounce, and base-metal conversions use 2,204.62262 pounds per metric ton. Mt denotes million metric tons, koz thousand troy ounces and Moz million troy ounces.
US$ denotes United States dollars and C$ denotes Canadian dollars. Commodity-price and cost assumptions identify their currency, and any exchange rate used is disclosed with the relevant assumptions. The resource database and models use NAD83 / UTM Zone 9N coordinates, with eastings, northings and elevations expressed in meters. The QP verified the coordinate-reference information used for the estimate.
AgEq and AuEq denote silver-equivalent and gold-equivalent grades or contents. For the seven updated deposits, AgEq is calculated for each block using the adopted metal prices and relative metallurgical recoveries before applying the reporting cut-off. South Reef retains its historical AuEq cut-off and its separately disclosed comparative AgEq content. Equivalent values are not additional metal to be added to individual commodity contents. Resources are reported in situ within accepted domains, after modeled historical depletion where applicable and before mining dilution and mining recovery. Contained metal is not recovered or payable metal. No Measured resources or mineral reserves are reported; Indicated and Inferred resources remain separate and totals may differ due to rounding. Mineral resources do not have demonstrated economic viability.
| Contango Silver and Gold – Kitsault Valley Project | Page 33 of 253 |
| Technical Report Summary and updated Mineral Resource Estimate 2026 |
| 3 | PROPERTY DESCRIPTION |
| 3.1 | Description and Location |
The Kitsault Valley Project is located near the central west coast of British Columbia (BC), approximately 39 km southeast of Stewart and 27 km northeast of Alice Arm, BC. The Project sits within National Topographic System Sheets 103P05, 103P06, 103P11, 103P12, 103P13, and 103P14 in the Skeena Mining District and Cassiar Land District. The Property encompasses 7 mineral leases, 253 mineral claims and 57 Crown granted mineral claims (Crown grants) listed in Tables 3-1, 3-2 and 3-3, respectively. The Property area totals 163 square km, with non-owned land removed. The Dolly Varden mineral leases, Crown grants and mineral claims are shown in Figures 3-1 and 3-2.
Table 3-1. Kitsault Valley Project mineral leases.
| Tenure Number | Registered Owner (100%) | Valid Until | Area (ha) |
| 254534 | Dolly Varden | 2027/JUL/06 | 53.397 |
| 254535 | Dolly Varden | 2027/FEB/04 | 8.681 |
| 254536 | Dolly Varden | 2027/APR/05 | 37.213 |
| 254537 | Dolly Varden | 2027/APR/05 | 11.892 |
| 254538 | Dolly Varden | 2027/APR/05 | 17.301 |
| 254542 | Dolly Varden | 2027/JUL/08 | 41.010 |
| 254579 | Dolly Varden | 2026/OCT/15 | 14.452 |
Mineral Leases have a 30-year term and are maintained through yearly rent payments. The seven mineral leases on the project were renewed with the Chief Gold Commissioner in 2024 for another 30-year term.
Table 3-2. Kitsault Valley Project mineral claims.
| Project Name | Title Number | Claim Name | Good
To Date |
Area (ha) |
| Big Bulk | 250684 | BIG BULK | 2035/DEC/03 | 400 |
| Big Bulk | 254242 | SKUCH 12 | 2035/DEC/03 | 225 |
| Big Bulk | 254243 | SKUCH 13 | 2035/DEC/03 | 300 |
| Big Bulk | 523826 | DOLLY 3 | 2035/DEC/03 | 237.364 |
| Big Bulk | 523830 | DOLLY 7 | 2035/DEC/03 | 18.23 |
| Big Bulk | 526114 | BIG BULK 1 | 2035/DEC/03 | 456.161 |
| Big Bulk | 570084 | DOLLY VARDEN BIG BULK 1 | 2035/DEC/03 | 1003.362 |
| Big Bulk | 385586 | KL 2 | 2032/JUL/14 | 400 |
| Big Bulk | 385587 | KL 3 | 2032/JUL/14 | 500 |
| Contango Silver and Gold – Kitsault Valley Project | Page 34 of 253 |
| Technical Report Summary and updated Mineral Resource Estimate 2026 |
| Project Name | Title Number | Claim Name | Good
To Date |
Area (ha) |
| Big Bulk | 385591 | LAVENDER 3 | 2032/JUL/14 | 300 |
| Big Bulk | 385592 | LAVENDER 4 | 2032/JUL/14 | 450 |
| Big Bulk | 385602 | LAVENDER 5 | 2032/JUL/14 | 500 |
| Big Bulk | 385603 | LAVENDER 6 | 2032/JUL/14 | 500 |
| Big Bulk | 385604 | LAVENDER 7 | 2032/JUL/14 | 375 |
| Dolly Varden | 383279 | TIGER 2 | 2035/DEC/03 | 500 |
| Dolly Varden | 383281 | TIGER 4 | 2035/DEC/03 | 500 |
| Dolly Varden | 384022 | EVINDSON 2 | 2035/DEC/03 | 500 |
| Dolly Varden | 523825 | DOLLY 2 | 2035/DEC/03 | 218.884 |
| Dolly Varden | 538780 | DOLLY CROWN 3 | 2035/DEC/03 | 127.574 |
| Dolly Varden | 538781 | DOLLY CROWN 4 | 2035/DEC/03 | 163.998 |
| Dolly Varden | 538782 | DOLLY CROWN 5 | 2035/DEC/03 | 18.223 |
| Dolly Varden | 538783 | DOLLY CROWN 6 | 2035/DEC/03 | 91.161 |
| Dolly Varden | 538784 | DOLLY CROWN 7 | 2035/DEC/03 | 182.283 |
| Dolly Varden | 538785 | DOLLY CROWN 8 | 2035/DEC/03 | 437.658 |
| Dolly Varden | 538786 | DOLLY CROWN 9 | 2035/DEC/03 | 72.971 |
| Dolly Varden | 538787 | DOLLY CROWN 10 | 2035/DEC/03 | 127.709 |
| Dolly Varden | 538788 | DOLLY CROWN 11 | 2035/DEC/03 | 109.477 |
| Dolly Varden | 538804 | DOLLY CROWN 15 | 2035/DEC/03 | 36.442 |
| Dolly Varden | 538805 | DOLLY CROWN 16 | 2035/DEC/03 | 18.232 |
| Dolly Varden | 538806 | DOLLY CROWN 17 | 2035/DEC/03 | 164.25 |
| Dolly Varden | 538899 | DOLLY CROWN 19 | 2035/DEC/03 | 18.2268 |
| Dolly Varden | 538900 | DOLLY CROWN 20 | 2035/DEC/03 | 18.2248 |
| Dolly Varden | 538901 | DOLLY CROWN 21 | 2035/DEC/03 | 18.2249 |
| Dolly Varden | 538902 | DOLLY CROWN 22 | 2035/DEC/03 | 18.2229 |
| Dolly Varden | 538904 | DOLLY CROWN 24 | 2035/DEC/03 | 18.2307 |
| Dolly Varden | 538906 | DOLLY CROWN 26 | 2035/DEC/03 | 18.2403 |
| Dolly Varden | 564163 | DOLLY CROWN 27 | 2035/DEC/03 | 18.2384 |
| Dolly Varden | 564240 | DOLLY CROWN 28 | 2035/DEC/03 | 18.2402 |
| Dolly Varden | 569857 | DOLLY VARDEN EAST 1 | 2035/DEC/03 | 637.293 |
| Dolly Varden | 569859 | DOLLY VARDEN EAST 2 | 2035/DEC/03 | 655.9154 |
| Contango Silver and Gold – Kitsault Valley Project | Page 35 of 253 |
| Technical Report Summary and updated Mineral Resource Estimate 2026 |
| Project Name | Title Number | Claim Name | Good
To Date |
Area (ha) |
| Dolly Varden | 569871 | DOLLY VARDEN EAST 3 | 2035/DEC/03 | 473.5278 |
| Dolly Varden | 569872 | DOLLY VARDEN NORTH 1 | 2035/DEC/03 | 436.943 |
| Dolly Varden | 569873 | DOLLY VARDEN NORTH 2 | 2035/DEC/03 | 364.2831 |
| Dolly Varden | 569874 | DOLLY VARDEN NORTH 3 | 2036/APR/21 | 273.2914 |
| Dolly Varden | 570074 | DOLL A | 2035/DEC/03 | 18.2229 |
| Dolly Varden | 570075 | DOLL B | 2035/DEC/03 | 18.2268 |
| Dolly Varden | 570076 | DOLL C | 2035/DEC/03 | 36.4632 |
| Dolly Varden | 570080 | DOLLY VARDEN WEST 1 | 2035/OCT/21 | 419.2429 |
| Dolly Varden | 570081 | DOLLY VARDEN WEST 2 | 2035/DEC/03 | 109.3779 |
| Dolly Varden | 570082 | DOLLY VARDEN WEST 3 | 2036/APR/21 | 510.6939 |
| Dolly Varden | 570083 | DOLLY VARDEN WEST 4 | 2035/DEC/03 | 237.1939 |
| Dolly Varden | 589602 | DOLLY VARDEN - NORTH STAR | 2035/DEC/03 | 18.2384 |
| Homestake | 251427 | CAMBRIA 1 | 2036/APR/21 | 100 |
| Homestake | 251428 | CAMBRIA 2 | 2036/APR/21 | 75 |
| Homestake | 377241 | WK 1 | 2036/APR/21 | 250 |
| Homestake | 377242 | WK 2 | 2036/APR/21 | 500 |
| Homestake | 377243 | WK 3 | 2036/APR/21 | 400 |
| Homestake | 380949 | WK 4 | 2036/APR/21 | 450 |
| Homestake | 380950 | WK 5 | 2036/APR/21 | 450 |
| Homestake | 380951 | KW 1 | 2036/APR/21 | 25 |
| Homestake | 380952 | KW 2 | 2036/APR/21 | 25 |
| Homestake | 380953 | KW 3 | 2036/APR/21 | 25 |
| Homestake | 383016 | KW 5 | 2036/APR/21 | 25 |
| Homestake | 383017 | KW4 | 2036/APR/21 | 25 |
| Homestake | 383037 | WK 6 | 2036/APR/21 | 150 |
| Homestake | 383038 | WK 7 | 2036/APR/21 | 400 |
| Homestake | 537435 | HR | 2036/APR/21 | 127.45 |
| Homestake | 537436 | HRMARGIN 1 | 2036/APR/21 | 109.25 |
| Homestake | 537437 | HRMARGIN2 | 2036/APR/21 | 54.599 |
| Homestake | 538791 | HOMESTAKE RIDGE 1 | 2036/APR/21 | 18.209 |
| Homestake | 540533 | HOMESTAKE RIDGE 2 | 2036/APR/21 | 18.2035 |
| Contango Silver and Gold – Kitsault Valley Project | Page 36 of 253 |
| Technical Report Summary and updated Mineral Resource Estimate 2026 |
| Project Name | Title Number | Claim Name | Good
To Date |
Area (ha) |
| Homestake | 540540 | HOMESTAKE RIDGE 3 | 2036/APR/21 | 18.2074 |
| Homestake | 545945 | HOMESTAKE RIDGE 4 | 2036/APR/21 | 18.2036 |
| Homestake | 565708 | HOMESTAKE RIDGE 5 | 2036/APR/21 | 36.4169 |
| Homestake | 565709 | HOMESTAKE RIDGE 6 | 2036/APR/21 | 18.2055 |
| Homestake | 565710 | HOME STAKE 7 | 2036/APR/21 | 18.2036 |
| Homestake | 598667 | VANGUARD GOLD | 2036/APR/21 | 18.2133 |
| Homestake | 598668 | VANGUARD EXTENSION | 2036/APR/21 | 54.663 |
| Homestake | 950714 | BRAVO N1 | 2036/APR/21 | 327.4891 |
| Homestake | 950719 | BRAVO N2 | 2036/APR/21 | 436.5113 |
| Homestake | 950722 | BRAVO N3 | 2036/APR/21 | 436.5046 |
| Homestake | 950724 | BRAVO N4 | 2036/APR/21 | 272.8082 |
| Homestake | 950725 | BRAVO N5 | 2036/APR/21 | 381.8186 |
| Homestake | 950726 | BRAVO N6 | 2036/APR/21 | 418.0394 |
| Homestake | 950727 | BRAVO N7 | 2036/APR/21 | 417.955 |
| Homestake | 1011645 | KN HSR 1 | 2036/APR/21 | 273.8619 |
| Homestake | 1015450 | KINSKUCH NW2 | 2036/APR/21 | 1039.181 |
| Homestake | 1015588 | HS SOUTH 1 | 2036/APR/21 | 36.442 |
| Homestake | 1061421 | NR | 2036/APR/21 | 18.1958 |
| Kinskuch | 1105020 | GLEB01 | 2035/DEC/03 | 454.992 |
| Kinskuch | 1105023 | GLEB02 | 2035/DEC/03 | 454.8574 |
| Kinskuch | 1105026 | GLEB03 | 2035/DEC/03 | 454.9309 |
| Kinskuch | 1105029 | GLEB04 | 2035/DEC/03 | 454.8791 |
| Kinskuch | 1105032 | GLEB05 | 2035/DEC/03 | 454.8242 |
| Kinskuch | 1105035 | GLEB06 | 2035/DEC/03 | 454.8324 |
| Kinskuch | 1105038 | GLEB07 | 2035/DEC/03 | 454.7061 |
| Kinskuch | 1105041 | GLEB08 | 2035/DEC/03 | 454.9873 |
| Kinskuch | 1105044 | GLEB09 | 2035/DEC/03 | 455.1056 |
| Kinskuch | 1105047 | GLEB10 | 2035/DEC/03 | 455.0987 |
| Kinskuch | 1105050 | GLEB11 | 2035/DEC/03 | 455.1276 |
| Kinskuch | 1105054 | GLEB12 | 2035/DEC/03 | 455.3719 |
| Kinskuch | 1105057 | GLEB13 | 2035/DEC/03 | 455.3618 |
| Contango Silver and Gold – Kitsault Valley Project | Page 37 of 253 |
| Technical Report Summary and updated Mineral Resource Estimate 2026 |
| Project Name | Title Number | Claim Name | Good
To Date |
Area (ha) |
| Kinskuch | 1105060 | JADE 1 | 2035/DEC/03 | 91.0605 |
| Kinskuch | 1105065 | GLEB14 | 2035/DEC/03 | 455.2397 |
| Kinskuch | 1105066 | JADE 2 | 2035/DEC/03 | 18.2101 |
| Kinskuch | 1105092 | GLEB15 | 2035/DEC/03 | 455.389 |
| Kinskuch | 1105095 | GLEB16 | 2035/DEC/03 | 437.3459 |
| Kinskuch | 1105098 | GLEB17 | 2035/DEC/03 | 455.6003 |
| Kinskuch | 1105101 | GLEB18 | 2035/DEC/03 | 455.6016 |
| Kinskuch | 1105104 | GLEB19 | 2035/DEC/03 | 455.3952 |
| Kinskuch | 1105107 | GLEB20 | 2035/DEC/03 | 437.456 |
| Kinskuch | 1105110 | GLEB20A | 2035/DEC/03 | 455.8045 |
| Kinskuch | 1105113 | GLEBX 1 | 2035/DEC/03 | 437.6296 |
| Kinskuch | 1105116 | GLEB21 | 2035/DEC/03 | 455.8357 |
| Kinskuch | 1105119 | GLEB23 | 2035/DEC/03 | 455.7809 |
| Kinskuch | 1105122 | GLEB24 | 2035/DEC/03 | 455.8772 |
| Kinskuch | 1105125 | GLEB25 | 2035/DEC/03 | 455.9786 |
| Kinskuch | 1105128 | GLEB26 | 2035/DEC/03 | 456.1687 |
| Kinskuch | 1105131 | GLEB27 | 2035/DEC/03 | 456.4401 |
| Kinskuch | 1105134 | GLEB28 | 2035/DEC/03 | 456.647 |
| Kinskuch | 1105137 | GLEB29 | 2035/DEC/03 | 456.635 |
| Kinskuch | 1105141 | GLEB30 | 2035/DEC/03 | 456.8963 |
| Kinskuch | 1105144 | GLEB31 | 2035/DEC/03 | 456.8556 |
| Kinskuch | 1105147 | GLEB32 | 2035/DEC/03 | 457.1528 |
| Kinskuch | 1105150 | GLEB33 | 2035/DEC/03 | 457.3952 |
| Kinskuch | 1105153 | GLEB34 | 2035/DEC/03 | 457.6379 |
| Kinskuch | 1105156 | GLEB36 | 2035/DEC/03 | 457.88 |
| Kinskuch | 1105159 | ILLY 7 | 2035/DEC/03 | 402.3718 |
| Kinskuch | 1105162 | GLEB34A | 2035/DEC/03 | 420.5602 |
| Kinskuch | 1105165 | ILLY 10 | 2035/DEC/03 | 274.4895 |
| Kinskuch | 1105171 | GLEB35 | 2035/DEC/03 | 457.5257 |
| Kinskuch | 1105174 | GLEB39 | 2035/DEC/03 | 458.2964 |
| Kinskuch | 1105177 | GLEB38 | 2035/DEC/03 | 458.1243 |
| Contango Silver and Gold – Kitsault Valley Project | Page 38 of 253 |
| Technical Report Summary and updated Mineral Resource Estimate 2026 |
| Project Name | Title Number | Claim Name | Good
To Date |
Area (ha) |
| Kinskuch | 1105180 | GLEB40 | 2035/DEC/03 | 458.0259 |
| Kinskuch | 1105183 | GLEB41 | 2035/DEC/03 | 458.1559 |
| Kinskuch | 1105186 | GLEB41 | 2035/DEC/03 | 458.2662 |
| Kinskuch | 1105189 | KITSAULT SOUTH 3 | 2035/DEC/03 | 458.2899 |
| Kinskuch | 1105192 | GLEB23A | 2035/DEC/03 | 458.0882 |
| Kinskuch | 1105195 | GLEB44 | 2035/DEC/03 | 457.8863 |
| Kinskuch | 1105198 | GLEB45 | 2035/DEC/03 | 457.6578 |
| Kinskuch | 1105201 | GLEB46 | 2035/DEC/03 | 439.2692 |
| Kinskuch | 1105204 | GLEB47 | 2035/DEC/03 | 457.5816 |
| Kinskuch | 1105207 | ILLY16 | 2035/DEC/03 | 164.7841 |
| Kinskuch | 1105210 | GLEB48 | 2035/DEC/03 | 439.4265 |
| Kinskuch | 1105213 | GLEB49 | 2035/DEC/03 | 457.7444 |
| Kinskuch | 1105216 | RED BLUFF 3 | 2035/DEC/03 | 201.3713 |
| Kinskuch | 1105219 | GLEB50 | 2035/DEC/03 | 457.7931 |
| Kinskuch | 1105221 | GLEB51 | 2035/DEC/03 | 457.5793 |
| Kinskuch | 1105222 | SILVER CORD | 2035/DEC/03 | 18.306 |
| Kinskuch | 1105224 | GLEB52 | 2035/DEC/03 | 420.8514 |
| Kinskuch | 1105225 | IXL | 2035/DEC/03 | 18.3002 |
| Kinskuch | 1105228 | GLEB53 | 2035/DEC/03 | 457.2427 |
| Kinskuch | 1105231 | ILLY 8 | 2035/DEC/03 | 219.5074 |
| Kinskuch | 1105234 | GLEB55 | 2035/DEC/03 | 457.0572 |
| Kinskuch | 1105237 | ILLY 4 | 2035/DEC/03 | 73.1315 |
| Kinskuch | 1105240 | ILLY 5 | 2035/DEC/03 | 456.9824 |
| Kinskuch | 1105243 | GLEB56 | 2035/DEC/03 | 274.1288 |
| Kinskuch | 1105246 | GLEB56A | 2035/DEC/03 | 456.1801 |
| Kinskuch | 1105249 | GLEB62 | 2035/DEC/03 | 456.427 |
| Kinskuch | 1105252 | EAST DOLLY 1 | 2035/DEC/03 | 456.5502 |
| Kinskuch | 1105255 | GLEB57 | 2035/DEC/03 | 456.2774 |
| Kinskuch | 1105258 | GLEB60 | 2035/DEC/03 | 456.5191 |
| Kinskuch | 1105261 | GLEB59 | 2036/APR/21 | 456.3689 |
| Kinskuch | 1105264 | KITGOLD 1 | 2035/DEC/03 | 401.9519 |
| Contango Silver and Gold – Kitsault Valley Project | Page 39 of 253 |
| Technical Report Summary and updated Mineral Resource Estimate 2026 |
| Project Name | Title Number | Claim Name | Good
To Date |
Area (ha) |
| Kinskuch | 1105267 | GLEB61 | 2035/DEC/03 | 456.6629 |
| Kinskuch | 1105273 | GLEB63 | 2035/DEC/03 | 456.5369 |
| Kinskuch | 1105274 | ZORKA | 2035/DEC/03 | 18.2616 |
| Kinskuch | 1105277 | GLEB64 | 2035/DEC/03 | 456.7166 |
| Kinskuch | 1105280 | 2035/DEC/03 | 402.028 | |
| Kinskuch | 1105283 | GLEB65 | 2035/DEC/03 | 456.6985 |
| Kinskuch | 1105286 | GLEB66 | 2035/DEC/03 | 438.4397 |
| Kinskuch | 1105288 | GLEB67 | 2035/DEC/03 | 456.9251 |
| Kinskuch | 1105289 | HENDERSONS | 2035/DEC/03 | 18.2751 |
| Kinskuch | 1105292 | GLEB69 | 2035/DEC/03 | 457.6007 |
| Kinskuch | 1105295 | GLEB68 | 2035/DEC/03 | 457.3609 |
| Kinskuch | 1105298 | GLEB83 | 2035/DEC/03 | 54.889 |
| Kinskuch | 1105300 | GLEB70 | 2035/DEC/03 | 457.4573 |
| Kinskuch | 1105301 | EAGLE | 2035/DEC/03 | 18.2905 |
| Kinskuch | 1105304 | GLEB72 | 2035/DEC/03 | 456.8227 |
| Kinskuch | 1105307 | GLEB71 | 2035/DEC/03 | 456.744 |
| Kinskuch | 1105310 | GLEB72A | 2035/DEC/03 | 457.2692 |
| Kinskuch | 1105313 | GLEB73 | 2035/DEC/03 | 457.4402 |
| Kinskuch | 1105325 | GLEB76 | 2035/DEC/03 | 457.164 |
| Kinskuch | 1105328 | GLEB74 | 2035/DEC/03 | 456.9179 |
| Kinskuch | 1105331 | GLEB75 | 2035/DEC/03 | 438.7854 |
| Kinskuch | 1105334 | GLEB78 | 2035/DEC/03 | 329.0577 |
| Kinskuch | 1105337 | GLEB76A | 2035/DEC/03 | 457.1176 |
| Kinskuch | 1105339 | GLEB77 | 2035/DEC/03 | 292.5717 |
| Kinskuch | 1105340 | RIVERSIDE | 2035/DEC/03 | 18.2887 |
| Kinskuch | 1105344 | GLEB80 | 2035/DEC/03 | 457.7967 |
| Kinskuch | 1105347 | COPPER CREST | 2035/DEC/03 | 36.623 |
| Kinskuch | 1105350 | GLEB81 | 2035/DEC/03 | 384.6607 |
| Kinskuch | 1105353 | GLEB81A | 2035/DEC/03 | 457.8399 |
| Kinskuch | 1105356 | KITSAULT SOUTH 9 | 2035/DEC/03 | 458.2146 |
| Kinskuch | 1105359 | GLEB82 | 2035/DEC/03 | 348.1087 |
| Contango Silver and Gold – Kitsault Valley Project | Page 40 of 253 |
| Technical Report Summary and updated Mineral Resource Estimate 2026 |
| Project Name | Title Number | Claim Name | Good
To Date |
Area (ha) |
| Kinskuch | 1105362 | GLEB X2 | 2035/DEC/03 | 437.5087 |
| Kinskuch | 1105365 | GLEB X3 | 2035/DEC/03 | 437.3884 |
| Kinskuch | 1105368 | GLEB X4 | 2035/DEC/03 | 437.268 |
| Kinskuch | 1105371 | GLEB X5 | 2035/DEC/03 | 437.1475 |
| Kinskuch | 1105374 | GLEB X6 | 2035/DEC/03 | 437.027 |
| Kinskuch | 1105377 | GLEB X7 | 2035/DEC/03 | 436.9064 |
| Kinskuch | 1105380 | 2035/DEC/03 | 511.7981 | |
| Kinskuch | 1105383 | DOLLY CAMP 1 | 2035/DEC/03 | 73.135 |
| Kinskuch | 1105386 | RIFT 01 | 2035/DEC/03 | 437.7241 |
| Kinskuch | 1105389 | RIFT 02 | 2035/DEC/03 | 437.8516 |
| Kinskuch | 1105392 | RIFT 03 | 2035/DEC/03 | 437.919 |
| Kinskuch | 1105395 | RIFT 04 | 2035/DEC/03 | 437.998 |
| Kinskuch | 1105398 | RIFT 5 | 2035/DEC/03 | 456.3232 |
| Kinskuch | 1105401 | RIFT 6 | 2035/DEC/03 | 438.1567 |
| Kinskuch | 1105404 | RIFT 07 | 2035/DEC/03 | 438.2376 |
| Kinskuch | 1105412 | RIFT 08 | 2035/DEC/03 | 438.3481 |
| Kinskuch | 1105414 | RIFT 09 | 2035/DEC/03 | 438.4587 |
| Kinskuch | 1105415 | VMS | 2035/DEC/03 | 18.273 |
| Kinskuch | 1105419 | RIFT 10 | 2035/DEC/03 | 420.2961 |
| Kinskuch | 1105422 | RIFT 11 | 2035/DEC/03 | 438.6798 |
| Kinskuch | 1105425 | RIFT 12 | 2035/DEC/03 | 438.7902 |
| Kinskuch | 1105428 | RIFT 13 | 2035/DEC/03 | 438.8785 |
| Kinskuch | 1105431 | KINSAULT SOUTH 1 | 2035/DEC/03 | 219.9121 |
| Kinskuch | 1105434 | CARL | 2035/DEC/03 | 36.6425 |
| Kinskuch | 1105437 | KINSAULT SOUTH 2 | 2035/DEC/03 | 458.3685 |
| Kinskuch | 1105440 | KINSAULT SOUTH 4 | 2035/DEC/03 | 439.7818 |
| Kinskuch | 1105443 | KINSAULT SOUTH 5 | 2035/DEC/03 | 403.1737 |
| Kinskuch | 1105446 | KINSAULT SOUTH 8 | 2035/DEC/03 | 146.6097 |
| Kinskuch | 1105450 | KINSAULT SOUTH 6 | 2035/DEC/03 | 458.0821 |
| Kinskuch | 1105453 | KINSAULT SOUTH 7 | 2035/DEC/03 | 403.0214 |
| Kinskuch | 1105570 | KITSAULT SOUTH 10 | 2035/DEC/03 | 439.8487 |
| Contango Silver and Gold – Kitsault Valley Project | Page 41 of 253 |
| Technical Report Summary and updated Mineral Resource Estimate 2026 |
| Project Name | Title Number | Claim Name | Good
To Date |
Area (ha) |
| Kinskuch | 1105573 | KITSAULT SOUTH 12 | 2035/DEC/03 | 440.0493 |
| Kinskuch | 1105576 | 2035/DEC/03 | 896.3284 | |
| Kinskuch | 1105579 | RED BLUFF 1 | 2035/DEC/03 | 109.7725 |
| Kinskuch | 1105581 | RED BLUFF 5 | 2035/DEC/03 | 36.5927 |
| Kinskuch | 1105582 | RED BLUFF 2 | 2035/DEC/03 | 18.2983 |
| Kinskuch | 1105585 | RED BLUFF 4 | 2035/DEC/03 | 164.7709 |
| Kinskuch | 1105590 | RED BUFF A | 2035/DEC/03 | 128.2222 |
| Kinskuch | 1105593 | ILLY2 | 2035/DEC/03 | 420.242 |
| Kinskuch | 1105595 | ILLY1 | 2035/DEC/03 | 219.2534 |
| Kinskuch | 1105596 | ILLY1A | 2035/DEC/03 | 18.2691 |
| Kinskuch | 1105599 | ILLY5 | 2035/DEC/03 | 457.209 |
| Kinskuch | 1105602 | ILLY6 | 2035/DEC/03 | 347.4506 |
| Kinskuch | 1105605 | ILLY11 | 2035/DEC/03 | 457.8309 |
| Kinskuch | 1105608 | ILLY9 | 2035/DEC/03 | 457.5587 |
| Kinskuch | 1105611 | ILLY12 | 2035/DEC/03 | 439.5922 |
| Kinskuch | 1105614 | ILLY13 | 2035/DEC/03 | 109.9069 |
| Kinskuch | 1105617 | RIFT XX1 | 2035/DEC/03 | 54.87 |
| Kinskuch | 1105620 | ILLY15 | 2035/DEC/03 | 457.5044 |
| Kinskuch | 1105623 | ILLY14 | 2035/DEC/03 | 457.3259 |
| Theia | 1102912 | THEIA2 | 2036/APR/21 | 1635.443 |
| Theia | 1102913 | THEIA 1 | 2036/APR/21 | 1814.93 |
| Theia | 1102914 | 2036/APR/21 | 1708.085 | |
| Theia | 1102916 | THEIA# | 2036/APR/21 | 471.9937 |
| Theia | 1102918 | THEIA 2 | 2036/APR/21 | 1816.439 |
| Theia | 1102921 | FLAT GOLD | 2036/APR/21 | 54.5337 |
| Theia | 1102922 | FLAT GOLD 2 | 2036/APR/21 | 54.528 |
| Theia | 1102950 | 2036/APR/21 | 617.927 |
| Contango Silver and Gold – Kitsault Valley Project | Page 42 of 253 |
| Technical Report Summary and updated Mineral Resource Estimate 2026 |
Table 3-3. Kitsault Valley Project Crown-granted mineral claims.
| Project Name | Lot Number | Claim Name | Ownership | Area (ha) |
| Dolly Varden | 934 | ANGLO | Dolly Varden 100% | 5.7744 |
| Dolly Varden | 4068 | ARMES | Dolly Varden 100% * | 18.25 |
| Dolly Varden | 4066 | ATHOS | Dolly Varden 100% * | 13.06022 |
| Dolly Varden | 4217 | BLUEBERRY | Dolly Varden 100% | 16.01978 |
| Dolly Varden | 4070 | BONANZA FRACTION | Dolly Varden 100% * | 17.26693 |
| Dolly Varden | 3806 | COPPER CLIFF | Dolly Varden 100% | 18.52409 |
| Dolly Varden | 3807 | COPPER CLIFF NO. 1 | Dolly Varden 100% | 17.16805 |
| Dolly Varden | 3808 | COPPER CLIFF NO. 2 | Dolly Varden 100% | 15.59502 |
| Dolly Varden | 3798 | COPPER CLIFF NO. 3 | Dolly Varden 100% | 16.30057 |
| Dolly Varden | 3825 | DAN PATCH | Dolly Varden 100% | 17.69157 |
| Dolly Varden | 4071 | D’ARTAGNON | Dolly Varden 100% * | 11.78304 |
| Dolly Varden | 4069 | D’ARTAGNON NO. 1 | Dolly Varden 100% * | 9.429956 |
| Dolly Varden | 3194 | DOLLY VARDEN M.C. | Dolly Varden 100% | 17.01527 |
| Dolly Varden | 3192 | DOLLY VARDEN NO. 1 | Dolly Varden 100% | 11.92451 |
| Dolly Varden | 3193 | DOLLY VARDEN NO. 2 | Dolly Varden 100% | 12.93685 |
| Dolly Varden | 3195 | DOLLY VARDEN NO. 4 | Dolly Varden 100% | 11.34692 |
| Dolly Varden | 3196 | DOLLY VARDEN NO. 5 M.C. | Dolly Varden 100% | 14.75147 |
| Dolly Varden | 3197 | DOLLY VARDEN NO. 6 | Dolly Varden 100% | 14.69214 |
| Dolly Varden | 3198 | DOLLY VARDEN NO. 7 | Dolly Varden 100% | 4.773376 |
| Dolly Varden | 3815 | KITSOL NO. 1 | Dolly Varden 100% | 16.12156 |
| Dolly Varden | 3814 | KITSOL NO. 2 | Dolly Varden 100% | 14.3449 |
| Dolly Varden | 937 | LAMB | Dolly Varden 100% | 7.36939 |
| Dolly Varden | 3613 | LION | Dolly Varden 100% | 15.57007 |
| Dolly Varden | 3827 | LUE DILLON | Dolly Varden 100% | 10.66612 |
| Dolly Varden | 3817 | MAUD MCPHEE | Dolly Varden 100% | 19.10728 |
| Dolly Varden | 936 | MOOSE | Dolly Varden 100% | 14.58834 |
| Dolly Varden | 1241 | MOOSE NO. 1 | Dolly Varden 100% | 17.17196 |
| Dolly Varden | 1242 | MOOSE NO. 2 | Dolly Varden 100% | 18.28269 |
| Dolly Varden | 1243 | MOOSE NO. 6 | Dolly Varden 100% | 16.39161 |
| Dolly Varden | 4265 | MUTT AND JEFF FRACTION | Dolly Varden 100% | 20.54905 |
| Dolly Varden | 3826 | NANCY HANKS | Dolly Varden 100% | 17.85157 |
| Contango Silver and Gold – Kitsault Valley Project | Page 43 of 253 |
| Technical Report Summary and updated Mineral Resource Estimate 2026 |
| Project Name | Lot Number | Claim Name | Ownership | Area (ha) |
| Dolly Varden | 3634 | NORTH STAR | Dolly Varden 100% | 8.52548 |
| Dolly Varden | 4211 | NORTH STAR FRACTION | Dolly Varden 100% | 6.916129 |
| Dolly Varden | 3615 | PLUTUS FRACTION | Dolly Varden 100% | 0.047709 |
| Dolly Varden | 4067 | PORTHES | Dolly Varden 100% | 10.32379 |
| Dolly Varden | 3810 | RED POINT EXTENSION | Dolly Varden 100% | 18.60226 |
| Dolly Varden | 3809 | RED POINT NO. 1 | Dolly Varden 100% | 14.09369 |
| Dolly Varden | 4210 | RUBY | Dolly Varden 100% | 11.31651 |
| Dolly Varden | 3816 | SPORTSMAN | Dolly Varden 100% | 19.57567 |
| Dolly Varden | 3818 | SUNSET NO. 1 | Dolly Varden 100% | 4.640988 |
| Dolly Varden | 3819 | SUNSET NO. 2 | Dolly Varden 100% | 18.34724 |
| Dolly Varden | 4335 | SURPRISE | Dolly Varden 100% | 11.20392 |
| Dolly Varden | 4336 | SWIFTWATER | Dolly Varden 100% | 14.53467 |
| Dolly Varden | 3614 | TIGER | Dolly Varden 100% | 16.76311 |
| Dolly Varden | 935 | TORIC | Dolly Varden 100% | 11.78887 |
| Dolly Varden | 4337 | UIST | Dolly Varden 100% | 20.45016 |
| Dolly Varden | 3795 | WOLF | Dolly Varden 100% | 20.21308 |
| Dolly Varden | 3794 | WOLF NO. 2 | Dolly Varden 100% | 19.02368 |
| Dolly Varden | 3796 | WOLF NO. 3 | Dolly Varden 100% | 18.02279 |
| Dolly Varden | 3797 | WOLVERINE | Dolly Varden 100% | 14.86634 |
| Homestake Ridge | 3979 | HOMESTAKE FRACTION | Homestake 100% | 0.918 |
| Homestake Ridge | 6322 | MILLSITE | Homestake 100% | 20.915 |
| Homestake Ridge | 3978 | HOMESTAKE NO. 3 | Homestake 100% | 13.922 |
| Homestake Ridge | 3977 | HOMESTAKE NO. 2 | Homestake 100% | 15.053 |
| Homestake Ridge | 3980 | HOMESTAKE NO. 1 FRACTION | Homestake 100% | 4.740 |
| Homestake Ridge | 3976 | HOMESTAKE NO. 1 | Homestake 100% | 20.300 |
| Homestake Ridge | 3975 | HOMESTAKE | Homestake 100% | 20.921 |
* from Musketeer option
| Contango Silver and Gold – Kitsault Valley Project | Page 44 of 253 |
| Technical Report Summary and updated Mineral Resource Estimate 2026 |
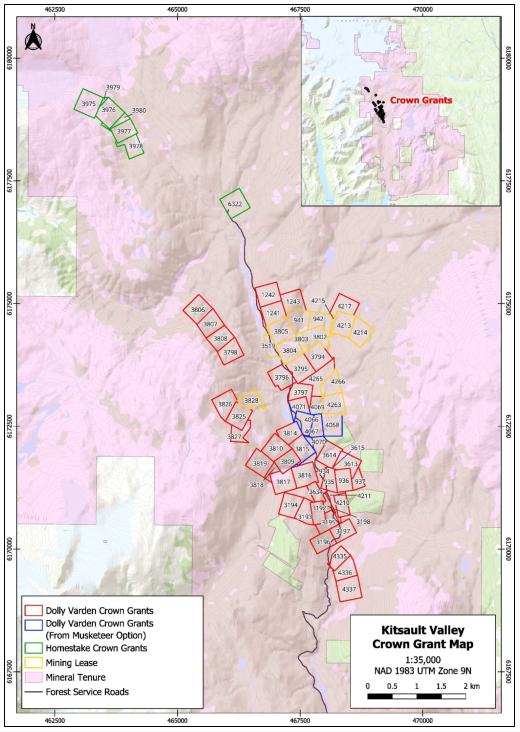
Figure 3-1. Dolly Varden Property mineral leases and Crown-granted mineral claims.
| Contango Silver and Gold – Kitsault Valley Project | Page 45 of 253 |
| Technical Report Summary and updated Mineral Resource Estimate 2026 |
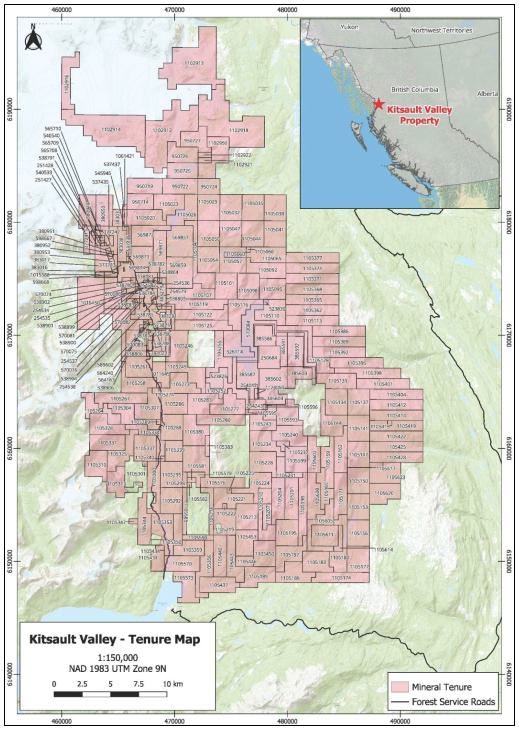
Figure 3-2. Dolly Varden Property mineral tenures.
| Contango Silver and Gold – Kitsault Valley Project | Page 46 of 253 |
| Technical Report Summary and updated Mineral Resource Estimate 2026 |
Within the Crown grant list, 11 fee simple Mining Lands exist with Mineral Land Tax notices paid annually (Table 3-4).
Table 3-4. Kitsault Valley Project 2026 Mineral Tax fee simple lots.
Dolly Varden Silver
Mineral Land Tax
NOA for Tax Year 2026 | |||
| Folio | Tax / utility account | Letter ID | Amount |
| 067105 | MLT-1059-3149 | L0111970976 | 129.11 |
| 067237 | MLT-1056-6308 | L0396053152 | 87.78 |
| 069337 | MLT-1052-3957 | L0690784928 | 132.31 |
| 069680 | MLT-1057-2533 | L1895697056 | 40.38 |
| 069892 | MLT-1054-0829 | L0672238240 | 95.58 |
| 069930 | MLT-1056-8693 | L1160284832 | 84.20 |
| 070041 | MLT-1053-9338 | L2062191264 | 134.11 |
| 070114 | MLT-1053-2754 | L1861487264 | 117.03 |
| 070866 | MLT-1055-9707 | L10559707 | 100.11 |
| 920.61 | |||
Homestake Resource Corporation
Mineral Land Tax
NOA for Tax Year 2026 | |||
| Folio | Tax / utility account | Letter ID | Amount |
| 070483 | MLT-1052-5598 | L1313147552 | 94.75 |
| 074845 | MLT-1059-3186 | L0383290016 | – |
| 94.75 | |||
| Total | 1015.36 | ||
| 3.2 | Fee Simple Service Lots |
Dolly Varden Silver Corporation is the registered owner of several fee simple surface lots in the village of Alice Arm (Figure 3-3). The exploration camp, geology offices and core storage are located on the owned lots. Include in the Alice Arm lots is a water access frontage on the road to the Alice Arm dock facilities. Annual municipal property taxes are due on these lots.
| Contango Silver and Gold – Kitsault Valley Project | Page 47 of 253 |
| Technical Report Summary and updated Mineral Resource Estimate 2026 |
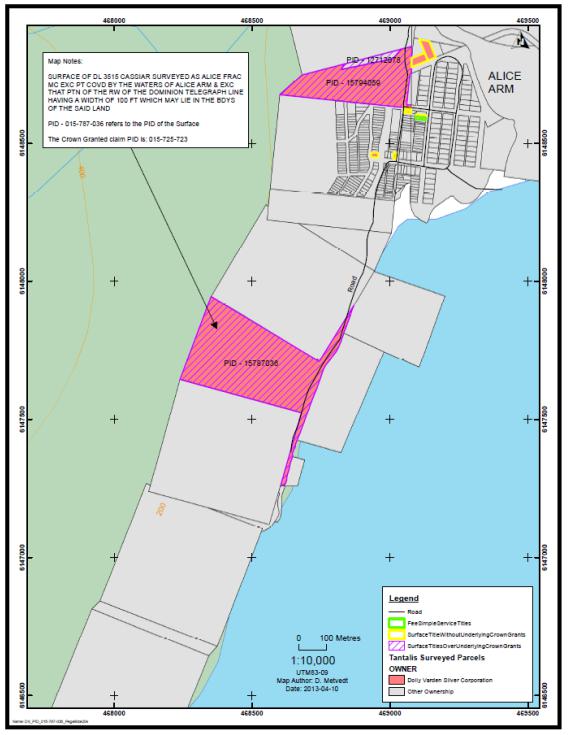
Figure 3-3. Dolly Varden fee simple surface lots in Alice Arm.
| Contango Silver and Gold – Kitsault Valley Project | Page 48 of 253 |
| Technical Report Summary and updated Mineral Resource Estimate 2026 |
| 3.3 | Royalties and Agreements |
The Kitsault Valley Project is encumbered with several royalty agreements covering separate yet contiguous portions of the property in the form of standard Net Smelter Return (NSR) royalty agreements.
The Company entered into an NSR royalty agreement on March 18, 2011 with 0897287 B.C. Ltd. in consideration of title transfer for the majority of the Property, except for the “Musketeer Option” area as described below. By an agreement dated April 1, 2011, 0897287 B.C. Ltd. sold and assigned the Royalty Rights to 0907105 B.C. Ltd. The Musketeer Option area is subject to a 2% NSR owed to 0907105 B.C. Ltd. of which one half can be repurchased by the Company for CDN$1,000,000 at any time (Dolly Varden Silver Corp., 2019b; Higgs and Giroux, 2015).
The second NSR agreement is with Musketeer Holdings et al. (“Musketeer”). The initial agreement was for the Company to acquire 100% interest in the Musketeer Crown Grants (Figure 3-1) for a purchase price of CDN$1,050,000 payable over four years, subject to a 2% NSR to Musketeer. The Option Agreement with Musketeer has been completed through aggregate option payments by the Company of CDN$350,000, CDN$233,333 in 2013 and 2014, respectively. In 2015, the final two payments were renegotiated to defer CDN$100,000 until February 2018 plus a renegotiation fee of CDN$10,000 to be included with the 2015 payment (Dolly Varden Silver Corporation, 2015). The agreement was renegotiated again in February 2016 with CDN$81,000 plus a renegotiation fee of CDN$10,000 paid on February 12, 2016 (Dolly Varden Silver Corporation, 2016). The final two payments of CDN$102,334 and CDN$100,000 were made in 2017 and 2018, respectively.
Upon completion of the Option Agreement the Company entered into an NSR royalty agreement with Musketeer on May 16, 2018, for the 2% NSR royalty. On or before May 16, 2021, Dolly Varden can deliver notice to the NSR holders with the intent to re-purchase 50% of the 2% royalty for CDN $1,750,000. After May 16, 2021, the NSR holders have no obligation to accept an offer to buy back 1% of the NSR.
The Coombes Claims, part of the original Homestake claim block (including Cambria 1, Cambria 2, KW1, KW2, KW3, KW4, KW5, WK1, WK3, WK4, WK6 and WK7), are subject to a 2 percent NSR royalty by virtue of an option agreement dated July 5, 2000. The royalty includes a purchase right in favour of the Company for C$1,000,000.
The Homestake crown grants (including DL 3975, DL 3976, DL 3977, DL 3978, DL 3979, DL 3980, and DL 6322) are subject to a 2 percent NSR royalty which includes an annual advanced minimum royalty of C$50,000 in favour of Alice Sullivan and Mildred Keller.
| 3.4 | Environmental Liabilities, Permitting and Significant Factors |
Exploration Permits MX-1-860, MX-1-603, MX-1-990, MX-1-784, MX-1868 and MX-1-189 are a 5-year Multi Year, Area Based (MYAB) application that is submitted either every 5 years or if the allotted disturbance and activities have been reached. At the end of each year an Annual Summary of Exploration Activities (AESA) is filed which states the area disturbed, the area reclaimed and other activities completed that year. These are subtracted from the MYAB allowance, and the remaining allowances are calculated.
| Contango Silver and Gold – Kitsault Valley Project | Page 49 of 253 |
| Technical Report Summary and updated Mineral Resource Estimate 2026 |
A Wildlife Management Plan and Archaeological Overview Assessment (AOA) were amended in 2025 by ERM Consultants Canada Ltd. (ERM) over the Dolly Varden project and the Homestake Project. The Wildlife Management Plan comprises protocols to address possible goat, bear and marbled murrelet encounters and outlines protected areas in the region. No protected areas are located within the Dolly Varden Property, although there are protected areas along the fly route to access the Property. The AOA includes a desktop study outlining high probability chance discovery areas and culturally modified tree (CMT) high probability areas. The Company must take pre-cautions when planning drill programs near or within these areas. Both the Wildlife Management Plan and AOA included a consultation with the Nisga’a Lisims Government. Earlier Dolly Varden versions of these documents were prepared by ERM Consultants Canada Ltd. (2018a, 2018b).
Regarding environmental liabilities associated with the Dolly Varden Property, a historic plant site and numerous historic workings and waste rock dump piles are located within the permit area. The Ministry of Energy, Mines and Petroleum Resources is aware of these historic sites, and the Company has closed off access to these sites as a safety pre-caution. No compounded tailings have been identified to exist from the 1949 to 1959 plant site. Furthermore, acid rock drainage (ARD) testing has been conducted on water outflow locations within the Property and all results returned are within acceptable levels.
| Contango Silver and Gold – Kitsault Valley Project | Page 50 of 253 |
| Technical Report Summary and updated Mineral Resource Estimate 2026 |
| 4 | ACCESSIBILITY, CLIMATE, LOCAL RESOURCES, INFRASTRUCTURE AND PHYSIOGRAPHY |
This chapter describes access to the Kitsault Valley Project (the Property), the physical setting and climate, and the regional availability of personnel and supplies. Historical facilities are described as such; their current condition, capacity, ownership and suitability for future development have not been established by engineering studies.
| 4.1 | Accessibility |
The Property is located near the central west coast of British Columbia, approximately 27 km north of Alice Arm and 39 km southeast of Stewart. Primary access to the Property is by helicopter from Alice Arm, Kitsault or Stewart. Dolly Varden personnel typically access the Property by helicopter from the Company’s exploration camp at Alice Arm or from a staging point at kilometre 19 on the Kitsault River Road (Table 4-1, Figure 4-1).
Road access from Terrace to Kitsault is via the Nisga’a Highway (Highway 113) and the Kitsault Mine Road, a reported total distance of approximately 167 km. Kitsault is located on Alice Arm of Observatory Inlet. Marine transport by boat or barge is used to cross the inlet between Kitsault and Alice Arm. Alice Arm and Kitsault may also be reached from Prince Rupert by privately contracted seaplane, boat or barge.
From Alice Arm, the Kitsault Valley Road follows the Kitsault River along the alignment of the former railway constructed to service the Dolly Varden mine. The source reports identify an old rail bed but do not identify an operating railway serving the Property. The current condition, ownership, maintenance responsibility, bridge capacity and suitability of the historical road system for heavy or all-season traffic have not been established in the source reports.
Table 4-1. Principal access and logistics routes.
| Mode or Route | Source-Reported Access | Current Limitation or Qualification |
| Road to Kitsault | Terrace to Kitsault via Highway 113 and the Kitsault Mine Road; approximately 167 km. | Provides regional road access to Kitsault, not direct all-season road access to the deposits. |
| Marine | Boat or barge between Kitsault and Alice Arm; contracted marine access is also available from Prince Rupert. | Service is privately contracted and is subject to marine and weather conditions. |
| Helicopter | Primary Property access from Alice Arm, Kitsault or Stewart; routine staging from Alice Arm camp or kilometre 19. | Surface exploration is helicopter supported and dependent on ceiling, visibility and weather. |
| Seaplane | Privately contracted access to Alice Arm or Kitsault from Prince Rupert. | Seasonal and weather dependent; no scheduled service is identified in the source reports. |
| Internal road | Kitsault Valley Road follows the Kitsault River and the former Dolly Varden railway alignment. | Road and bridge condition and heavy-haul suitability require confirmation. |
Surface exploration is generally conducted from May through October, with the start and end of the field season adjusted for snow and weather. Snow cover, steep terrain and variable flying conditions can restrict access to drill sites and other work areas.
| Contango Silver and Gold – Kitsault Valley Project | Page 51 of 253 |
| Technical Report Summary and updated Mineral Resource Estimate 2026 |
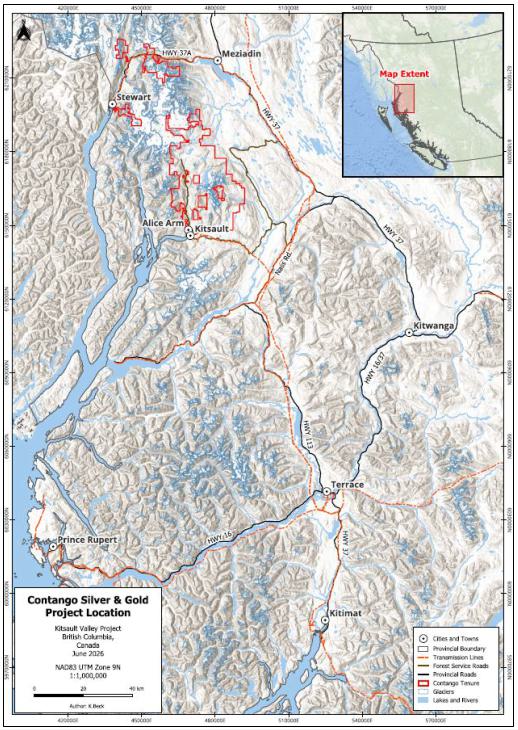
Figure 4-1. Kitsault Valley Project regional location and access.
| Contango Silver and Gold – Kitsault Valley Project | Page 52 of 253 |
| Technical Report Summary and updated Mineral Resource Estimate 2026 |
| 4.2 | Physiography, Elevation and Vegetation |
The Property is situated in the Coast Mountains and is characterized by rugged, glaciated terrain. Elevations within the Property range from approximately 300 m to 1,300 m above sea level. The Kitsault River flows south through the Property within a glacially formed U-shaped valley. The Homestake area deposits are near the headwaters of the Kitsault River below the Homestake and Kitsault glaciers. Southward past the Wolf deposit and the Dolly Varden area deposits, including Dolly Varden, Torbrit and North Star, the valley is deeply incised with steep forested slopes before opening into a broader valley south of the Property.
The landscape includes steep slopes, narrow valleys, ridgelines, cirques, hanging valleys, glacial till and moraines. Drainage is well developed and generally follows steep gradients toward Alice Arm and the coastal fjord system. The Kitsault River is the principal drainage through the Property.
The Property lies within the Coastal Western Hemlock biogeoclimatic zone and the wet submaritime subzone (Pojar et al., 1991). Lower and middle elevations are generally forested. Reported tree species include western hemlock, Douglas-fir, spruce, western red cedar, mountain ash and cottonwood, with devil’s club, huckleberry and blueberry common in the understorey. Vegetation grades to subalpine communities and then to alpine tundra, exposed rock, permanent snow and ice at higher elevations.
Dense vegetation and glacial overburden limit bedrock exposure at lower elevations. Outcrop is generally more abundant at higher elevations, where access may instead be constrained by steep slopes, snow and ice. These conditions affect the seasonal timing and logistics of geological mapping, geophysical surveys and drilling.
| 4.3 | Climate and Operating Season |
The Property has a Coast Mountains climate characterized by cool to mild, wet summers and cold, snowy winters. Turner and Hough (2023) cite Canadian Climate Normals 1981-2010 station data published in 2018 and report the regional statistics summarized in Table 4-2. The source chapter does not identify the station name or station elevation in the chapter text; the representativeness of these values across the Property’s approximately 1,000 m elevation range should therefore be considered when using the data for design purposes.
| Contango Silver and Gold – Kitsault Valley Project | Page 53 of 253 |
| Technical Report Summary and updated Mineral Resource Estimate 2026 |
Table 4-2. Regional climate statistics reported in the 2023 Technical Report.
| Parameter | Reported Value | Source Context |
| Mean annual temperature | 5.6 degrees C | Canadian Climate Normals 1981-2010 dataset cited by Turner and Hough (2023). |
| Reported January average high | –8.7 degrees C | Value reproduced from the 2023 technical report and should be checked against the underlying station record. |
| Reported July average high | 21.3 degrees C | Value reproduced from the 2023 technical report. |
| September precipitation | 117 mm | Reported monthly average. |
| October precipitation | 150 mm | Reported monthly average and highest reported rainfall month. |
| January maximum snow accumulation | Up to 85 cm | Terminology reproduced from the 2023 technical report. |
| Mean annual precipitation | 1,091.9 mm | Reported annual average. |
Precipitation increases during the autumn and early winter, and persistent snow commonly restricts surface work outside the May-to-October field season. Helicopter-supported work is also affected by cloud ceiling, visibility and rapidly changing mountain weather. The source reports do not establish that surface exploration can be conducted year-round.
| 4.4 | Local Resources |
The Company’s exploration camp is located at Alice Arm on privately owned land leased by the Company. Food, fuel, equipment and general exploration supplies are mobilized through the regional service centres of Prince Rupert, Terrace and Smithers and transported onward by road, marine vessel, aircraft or the historical access road, depending on the destination and seasonal conditions. The source reports do not establish direct road delivery from Terrace or Smithers to the Alice Arm camp without a marine transfer.
Prince Rupert, Terrace and Smithers are full-service communities with established resource-sector businesses and access to food, fuel, equipment, contractors and general supplies. Terrace and Smithers have regional airports with scheduled connections to Vancouver and Prince George, and the three communities are connected to the provincial highway network. Helicopter, seaplane and marine services are available on a contract basis in northwestern British Columbia.
The regional mining and exploration industry provides an experienced labour and contractor base for exploration programs. The source reports consider field personnel and exploration support services to be available from the regional centres. Project-specific requirements for construction and operations personnel, accommodation, emergency response and long-term service capacity have not yet been defined.
| 4.5 | Infrastructure |
Existing infrastructure is principally exploration-related or historical (Table 4-3). The Property contains historical surface and underground mine workings, access alignments and waste rock dumps associated with the former Dolly Varden and Torbrit operations. Turner and Hough (2023) also identify a historical plant site. These facilities should not be assumed to be operational or suitable for future development without condition assessments and engineering review.
| Contango Silver and Gold – Kitsault Valley Project | Page 54 of 253 |
| Technical Report Summary and updated Mineral Resource Estimate 2026 |
Table 4-3. Existing and required infrastructure.
| Infrastructure | Source-Reported Status | Qualification or Future Requirement |
| Alice Arm exploration camp | Company exploration camp on privately owned land leased by the Company. | Supports exploration activities; capacity and suitability for construction or operations are not established in the source reports. |
| Kitsault Valley Road and former rail alignment | Historical access follows the Kitsault River toward the Property. | Condition, ownership, maintenance, bridge capacity and all-season heavy-haul suitability require confirmation. |
| Electrical power | Connection to the BC provincial grid is reported at Kitsault. | No source evidence establishes an operating grid connection to the deposits; routing, voltage, capacity and required upgrades remain to be determined. |
| Historical hydroelectric facilities | A historical dam and access road are reported near Kitsault Lake, with historical interconnections to BC Hydro. | Ownership, operating status, water rights, capacity, condition and interconnection availability have not been established. |
| Water | The Upper Kitsault River and Kitsault Lake have supplied or are available for exploration activities. | Exploration use does not establish permitted supply, seasonal yield, water quality or suitability for future processing and domestic demand. |
| Historical mine and plant areas | Historical workings, a plant site and waste rock dumps are present; the 2023 report states that no impounded tailings were identified at the 1949-1959 plant site. | Safety, geotechnical, geochemical and environmental conditions are addressed elsewhere in the TRS and require current verification. |
| Production infrastructure | No current mine, processing plant or production-scale site infrastructure is identified. | Potential development would require engineered access, power distribution, water systems, camp and maintenance facilities, waste rock and tailings management, communications and product transport systems. |
Infrastructure concepts and requirements for any future project will need to be developed and evaluated in appropriate engineering and economic studies.
Environmental liabilities, waste and tailings management, water management, permitting and closure requirements are discussed in the applicable environmental section of the TRS.
| Contango Silver and Gold – Kitsault Valley Project | Page 55 of 253 |
| Technical Report Summary and updated Mineral Resource Estimate 2026 |
| 5 | HISTORY |
| 5.1 | Overview and Sources |
This chapter summarizes previous operations and the type, amount, quantity, and general results of exploration and development work completed by previous owners and operators within the area now comprising the Kitsault Valley Project. The Project consolidates the Dolly Varden and Homestake Ridge areas. For historical continuity, those areas are discussed separately below; they are not treated as separate current projects.
The history has been compiled principally from Garrow (2011), Higgs and Giroux (2015), Turner and Nicholls (2019), Macdonald and Rennie (2016), Ross and Chamois (2017), Chamois et al. (2020) Hough et al. (2022), and Turner and Hough (2023), together with government and assessment-report sources cited in those reports. Much of the early information is derived from secondary historical summaries and has not been independently verified by the Qualified Persons.
Exploration completed by or on behalf of Dolly Varden Silver Corporation and subsequent registrant entities is described in Chapter 7.
| 5.2 | Dolly Varden Area |
5.2.1 Early Claim Staking, Development, and Production (1910–1959)
The first recorded claim staking in the Dolly Varden area occurred in 1910 with the location of the Red Point No. 1 copper-gold prospect. Claims covering silver occurrences in the Dolly Varden mine area were staked in 1911. The Sportsman and North Star claims were staked in 1912 and 1914, respectively.
Prospecting, test pitting, and underground drifting were completed during the following years. The Dolly Varden silver deposit entered production in 1919. Between 1919 and 1921, the Dolly Varden and North Star mines reportedly produced approximately 1.305 Moz of silver from 36,000 short tons at an average historical grade of 35.66 oz/short ton Ag (approximately 1,109 g/t Ag). The material was direct-shipped without beneficiation, principally to the Granby Mines smelter at Anyox (Leigh and Thompson, 1981).
Torbrit Silver Mines Ltd. subsequently developed and operated the Torbrit Mine. From 1949 to 1959, historical records report production of 18,706,847 oz of silver (approximately 18.7 Moz) and 10.8 million lb of lead. The same historical summaries report approximately 1,377,632 tonnes processed at an average grade of 466.3 g/t Ag and 0.38% Pb. Production was reported as a silver-lead concentrate and silver bullion.
Note: The historically reported Torbrit tonnes and average silver grade imply approximately 20.65 Moz of contained silver and therefore do not arithmetically reconcile with the reported 18.7 Moz of silver production. This may reflect recovery, concentrate accounting, rounding, conversion, or inconsistent historical records. The figures are presented as separate historical production metrics and should be confirmed against primary production records before final filing.
During Torbrit production, exploration and development continued at North Star and Wolf, with lesser work at Moose-Lamb, Tiger, and Surprise. Three holes drilled at North Star in 1957–1958 intersected a mineralized horizon; hole NS-17 reportedly returned 3.50 m grading 72.3 g/t Ag, 3.38% Pb, and 16.48% Zn.
| Contango Silver and Gold – Kitsault Valley Project | Page 56 of 253 |
| Technical Report Summary and updated Mineral Resource Estimate 2026 |
5.2.2 Exploration and Development (1960–1990)
Sunshine Mining Company, while holding an option on Dolly Varden Mines Ltd. interests, completed 310.9 m of drifting and crosscutting and 3,137.9 m of surface and underground diamond drilling at Wolf in 1964. Dolly Varden Mines Ltd. completed an additional 97.5 m of percussion drilling at Wolf in 1968.
From 1969 to 1973, Dolly Varden Mines Ltd. completed soil geochemistry over the Copper Belt on the west side of the Kitsault Valley and diamond drilling in several prospect areas. Consultants working for Dolly Varden Minerals Inc. subsequently completed drilling and historical estimate work from 1979 to 1981. Geological interpretations developed during the mid-1980s emphasized a possible volcanogenic origin for the Dolly Varden–North Star–Torbrit mineralization and the importance of silver with associated zinc, lead, and copper.
Tecucomp Geological Inc., the predecessor of Cambria Geosciences Inc., conducted mapping, geochemical sampling, and drilling on behalf of Dolly Varden Minerals Inc. in 1989 and 1990. The 1989 North Star program comprised six holes totalling 2,397 m; all six holes intersected the targeted mineralized horizon. The 1990 program comprised 18 holes totalling 7,095.9 m across North Star, Dolly Varden, Torbrit, and the V Vein. Additional work at Red Point during the 1989–1990 period included approximately 2,256 m of drilling. These programs tested a volcanogenic massive-sulphide exploration model and improved understanding of stratigraphic and structural controls.
5.2.3 Exploration (1991–2010)
Available Mines Branch Notice of Work records indicate that no material exploration was completed at the principal Dolly Varden, North Star, Red Point, and Torbrit areas from 1991 through 2009.
In 2010, Dolly Silver Corporation and Dolly Varden Silver Ltd., a predecessor of Dolly Varden Silver Corporation, commissioned Geotech Ltd. to complete a helicopter-borne geophysical survey using versatile time-domain electromagnetic (VTEM), gamma-ray spectrometry, and aeromagnetic methods. The survey comprised 941.7 line-km flown at 100 m line spacing and covered approximately 90% of the then-current claim block (Garrow, 2011). The survey provided regional geophysical coverage for target identification and subsequent exploration planning.
| Contango Silver and Gold – Kitsault Valley Project | Page 57 of 253 |
| Technical Report Summary and updated Mineral Resource Estimate 2026 |
5.2.4 Regional Prospects
Historical exploration completed at selected regional prospects in the Dolly Varden area is summarized in Table 5-1.
Table 5-1. Summary of historical exploration of regional prospects in the Dolly Varden area.
| Prospect | Principal period | Type and amount of work | General result |
| Ace-Galena | 1951 and 1968 | Historical drilling reported as approximately 1,845 m. | Selected historical results included 0.5 m at 12.8 oz/short ton Ag and 8.8 m at 6.0 oz/short ton Ag. |
| Kitsol | 1918; 1969–1973 | Early trenching and underground work; three holes totalling approximately 505 m in 1972–1973. | Reported drilling included up to 4.88 m at 380.57 g/t Ag; trench sampling included up to 4.11 m at 626.4 g/t Ag. |
| Chance / Victory | 1918–1975 | Trenching, underground work, and approximately 1,893.4 m of historical drilling. | Work outlined silver-bearing veins and several historical estimates; selected drill results included 15.2 m at 607.2 g/t Ag. |
| Moose-Climax | 1916–1967 | Trenching and underground work; 22 holes totalling approximately 1,654 m in 1964 and 1967. | Selected drilling included 2.44 m at 360.0 g/t Ag and 12.5 m at 257.14 g/t Ag. |
| Sault | 1966–1990 | Geological, geochemical, and geophysical surveys; eight holes totalling 1,269.2 m, followed by approximately 992 m of additional drilling. | Work tested a stratiform barite-realgar-celestite occurrence and associated Ag-Pb-Zn mineralization. |
| Contango Silver and Gold – Kitsault Valley Project | Page 58 of 253 |
| Technical Report Summary and updated Mineral Resource Estimate 2026 |
5.2.5 Summary of Principal Previous Operators – Dolly Varden Area
The principal previous operators, work completed, and general results for the Dolly Varden area are summarized in Table 5-2.
Table 5-2. Summary of principal previous operators and work programs – Dolly Varden area.
| Period | Owner / operator | Work completed | General result |
| 1910–1921 | Early prospectors and Dolly Varden/North Star operators | Claim staking, prospecting, pits, underground development, and production. | Dolly Varden and North Star reportedly produced approximately 1.305 Moz Ag. |
| 1949–1959 | Torbrit Silver Mines Ltd. | Underground mine development, production, and exploration at Torbrit, North Star, Wolf, and nearby prospects. | Approximately 18.7 Moz Ag and 10.8 million lb Pb historically reported as produced. |
| 1964–1968 | Sunshine Mining Company; Dolly Varden Mines Ltd.; Silver Butte Mines Ltd. | Underground development and surface/underground drilling at Wolf and regional prospects. | Extended and tested Wolf, Moose-Climax, and other mineralized occurrences. |
| 1969–1981 | Dolly Varden Mines Ltd.; Dolly Varden Minerals Inc. and consultants | Geochemistry, mapping, drilling, and historical estimate work. | Tested principal deposits and regional prospects and reassessed historical mineralization. |
| 1989–1990 | Dolly Varden Minerals Inc.; Tecucomp Geological Inc./Cambria Geosciences | Mapping, geochemistry, and more than 9,000 m of reported drilling across major programs. | Intersected mineralized horizons and advanced stratigraphic, structural, and volcanogenic massive-sulphide interpretations. |
| 2010 | Dolly Silver Corporation and Dolly Varden Silver Ltd. | 941.7 line-km helicopter-borne VTEM, radiometric, and magnetic survey. | Established regional geophysical coverage for later exploration. |
| 5.3 | Homestake Ridge Area |
5.3.1 Early Exploration (1914–2000)
Claims in the Homestake group were first staked between 1914 and 1917 and were bonded to the Mineral Claims Development Company (MCDC) in 1918. The company was reorganized as Homestake Development in 1921. Limited surface and underground work followed, and portions of the claim group were granted Crown Grant status in 1925. Subsequent early work included surface trenching, limited underground development, and seven short drill holes totalling approximately 58.2 m on the Lucky Strike and Cascade claims.
Canex Aerial Exploration Ltd. completed prospecting, geochemical sampling, electromagnetic surveying, and chip sampling in the Vanguard area in 1966. Amax Exploration examined and extended the Vanguard work in 1967 but did not continue. Newmont Exploration of Canada Ltd. optioned the Wilberforce group in 1979 and completed magnetic and Max-Min geophysical surveys, mapping, trenching, 595 soil samples, and 82 rock samples before terminating the option in 1980.
| Contango Silver and Gold – Kitsault Valley Project | Page 59 of 253 |
| Technical Report Summary and updated Mineral Resource Estimate 2026 |
Caulfield Resources Ltd. collected 102 soil samples and completed 5.25 line-km of ground magnetic surveying in 1981. Cambria Resources Ltd. later completed mapping, lithogeochemical sampling, trenching, and 4.3 line-km of induced-polarization and resistivity surveying. From 1989 to 1991, Noranda Exploration Company Limited consolidated several claim groups, established a 44.3 km grid, completed magnetic and induced-polarization surveys and geological mapping, collected 1,930 rock samples and 1,943 soil and silt samples, and drilled 12 holes totalling 1,450.05 m.
5.3.2 Teck, Bravo/Homestake Resource, and Agnico Eagle (2000–2016)
Teck acquired interests in the Homestake claim block in 2000 through option agreements and staking. From 2000 to 2002, Teck completed geological and geochemical surveys, trenching, and 21 NQ diamond drill holes totalling 4,374.6 m. The program produced 618 core samples, 778 rock samples analyzed for multi-element geochemistry and gold, and 31 whole-rock samples. The work tested a volcanogenic massive-sulphide exploration model.
Bravo Ventures Group optioned the Teck and Crown Grant claims in 2003. Bravo was subsequently reorganized and renamed Homestake Resource Corporation on April 12, 2012. Eleven confirmatory holes totalling 1,002.39 m were completed in 2003. The 2004 program included 313 soil samples, 39 rock samples, approximately 25 line-km of magnetic surveying, and mapping. Bravo completed 11 holes totalling 1,646.09 m in 2005 and 28 holes totalling approximately 6,488 m in 2006.
Homestake Resource continued systematic drilling with 28 holes totalling 9,323 m in 2007; 42 holes totalling 8,724 m in 2008; 48 holes totalling 13,548 m in 2009; 48 holes totalling 18,083 m in 2010; and 23 holes totalling 7,366 m in 2011. Surface exploration from 2010 to 2012 included mapping, soil and rock sampling, and 13.54 line-km of induced-polarization surveying. Three holes drilled in 2011 tested the South Reef target and all three reportedly intersected intervals exceeding 30 g/t Au. Two phases of 2012 drilling further delineated the target over an interpreted area approximately 250 m by 250 m before the mineralized trend met or was offset by a major fault.
Agnico Eagle Mines Limited optioned the claims in 2012. In 2013, Agnico Eagle completed mapping, 785 soil samples, approximately 21 line-km of induced-polarization/resistivity and magnetic surveying, and ten holes totalling 3,947.24 m outside the Homestake Main and Homestake Silver deposits. In 2014, Agnico Eagle completed reconnaissance work, 57 rock samples, and six holes totalling 2,578 m at the Slide Zone. The drilling supported an interpretation that the Slide Zone is broadly concordant with the Homestake Main and Homestake Silver zones.
5.3.3 Auryn Resources and Fury Gold Mines (2016–2021)
Auryn Resources Inc. acquired the Homestake claims through its acquisition of Homestake Resource Corporation on September 7, 2016. Auryn completed mapping, rock and soil-talus sampling, portable X-ray fluorescence and short-wave infrared surveys, induced-polarization surveying, relogging of historical core, geochronological studies, airborne VTEM and magnetic surveying, and reprocessing of historical geophysical data.
The 2017 ground geophysical program comprised 17.5 line-km of pole-dipole induced-polarization surveying at 50 m dipole spacing. Data were integrated with the 2013 survey and used to produce three-dimensional resistivity and chargeability models. The 2017 and 2019 surface programs collected 274 rock samples and 4,029 soil-talus samples. Five geochronology samples were also collected. These programs refined structural and geological interpretations and identified geochemical anomalies around Homestake Main, Homestake Silver, South Reef, and regional targets.
Auryn completed 43 drill holes totalling approximately 17,300 m in 2017, principally as step-outs along the Homestake Main and Homestake Silver structures. Selected gold-bearing intervals were reported; however, the Homestake Main extension drilling was described as not returning significant results. No subsequent drilling was reported from 2018 through 2021, although surface sampling and interpretive work continued, including the 2019 sampling program summarized above.
| Contango Silver and Gold – Kitsault Valley Project | Page 60 of 253 |
| Technical Report Summary and updated Mineral Resource Estimate 2026 |
On October 9, 2020, the Auryn reorganization and acquisition of Eastmain Resources were completed, resulting in the formation of Fury Gold Mines Limited. Fury thereby became the owner of the Homestake Ridge Project before its later sale to Dolly Varden.
5.3.4 Summary of Principal Previous Operators — Homestake Ridge Area
The principal previous operators, work completed, and general results for the Homestake Ridge area are summarized in Table 5-3.
Table 5-3. Summary of principal previous operators and work programs – Homestake Ridge area.
| Period | Owner / operator | Work completed | General result |
| 1914–1967 | Early claimholders; MCDC/Homestake Development; Canex; Amax | Claim staking, limited underground work, trenching, short drilling, prospecting, geochemistry, and electromagnetic surveying. | Established early mineral occurrences and claim-group history. |
| 1979–1991 | Newmont; Caulfield; Cambria; Noranda | Mapping, trenching, geochemistry, magnetic/IP surveys, grid establishment, and 12 Noranda holes totalling 1,450.05 m. | Advanced regional targeting and drill-tested the consolidated claim groups. |
| 2000–2002 | Teck | Geology, geochemistry, trenching, and 21 holes totalling 4,374.6 m. | Tested VMS-style targets and generated modern drill and geochemical data. |
| 2003–2012 | Bravo Ventures / Homestake Resource | Systematic surface work and more than 230 reported holes from 2003 through 2012. | Defined and expanded Homestake Main, Homestake Silver, and South Reef mineralization. |
| 2013–2014 | Agnico Eagle Mines Limited | Mapping, soil and rock sampling, approximately 21 line-km geophysics, and 16 holes totalling 6,525.24 m. | Tested regional and Slide Zone targets. |
| 2016–2021 | Auryn Resources / Fury Gold Mines | Geophysics, surface sampling, core relogging, geochronology, and 43 holes totalling approximately 17,300 m in 2017. | Refined geological models and tested deposit extensions and regional targets. |
| 5.4 | Consolidation of the Kitsault Valley Project |
Dolly Varden announced the acquisition of the Homestake Ridge Project from Fury Gold Mines in December 2021 and completed the transaction in February 2022. The transaction consolidated the Dolly Varden and Homestake Ridge areas as the Kitsault Valley Project. Exploration completed by or on behalf of Dolly Varden following consolidation, and other registrant exploration relevant to the current technical assessment, is presented in Chapter 7.
Current mineral tenure, ownership, agreements, and encumbrances are described in Chapter 3. The historical claim-block names used in this chapter are retained only to identify the location and operator associated with prior work.
| Contango Silver and Gold – Kitsault Valley Project | Page 61 of 253 |
| Technical Report Summary and updated Mineral Resource Estimate 2026 |
| 5.5 | Historical Mineral Resource and Mineral Reserve Estimates |
Note: The estimates summarized in this section are historical estimates prepared before the effective date of this TRS. They have not been prepared or verified as mineral resources or mineral reserves under Regulation S-K 1300, are not current estimates, and are not relied upon for the current mineral resource estimate. Historical classifications are shown only as originally reported and must not be interpreted as S-K mineral-resource or mineral-reserve classifications. The current mineral-resource estimate is presented in Chapter 11.
The historical estimates are included solely to document the progression of previous technical work. They were prepared using different databases, cutoff grades, metal prices, estimation methods, assumptions, and classification systems. The estimates should not be added together or directly compared with the current mineral-resource estimate. Selected historical mineral estimates reported for deposits and prospects in the Dolly Varden area are summarized in the following sections. The estimates retain the classifications and terminology used in the original sources and are not current S-K 1300 mineral-resource estimates.
5.5.1 Dolly Varden Area Historical Estimates
Table 5-4 presents the reported historical mineral estimates for the Dolly Varden area.
Table 5-4. Historical mineral estimates reported for the Dolly Varden area.
| Deposit | Year | Historical classification as originally reported |
Ag
cutoff (g/t) |
Tonnes | Ag
grade (g/t) |
Contained
Ag (oz) |
Source |
| Dolly Varden | 1964 / 1974 | Proven & Probable | 171 | 42,638 | 754.3 | 1,034,000 | Skerl (1964); Mann (1974) |
| North Star | 1981 | Proven & Probable | 137 | 128,437 | 401.5 | 1,657,867 | Thompson & Pearson (1981) |
| Torbrit | 1983 | Possible | 171 | 786,531 | 312.0 | 7,889,700 | Leigh & Thompson (1983) |
| Wolf No. 1 | 1981 | Proven & Probable | 171 | 77,932 | 395.0 | 989,626 | Thompson & Pearson (1981) |
| Wolf No. 2 | 1981 | Proven & Probable | 171 | 218,512 | 285.9 | 2,008,839 | Thompson & Pearson (1981) |
| Wolf No. 2 | 1981 | Possible | 171 | 100,295 | 279.4 | 901,031 | Thompson & Pearson (1981) |
| Last Chance | 1967 | Possible | Not reported | 42,160 | 373.9 | 459,581 | Mitchell (1976) |
| Moose-Climax | 1964 | Possible | Not reported | 30,000 | 308.7 | 270,000 | Mitchell (1976) |
| Contango Silver and Gold – Kitsault Valley Project | Page 62 of 253 |
| Technical Report Summary and updated Mineral Resource Estimate 2026 |
5.5.2 Homestake Ridge Area Historical Estimates
Historical estimates were prepared for Homestake Main (HSM), Homestake Silver (HSS), and South Reef (SR) between 2006 and 2017 using reported gold-equivalent (AuEq) cutoffs. Because the original source tables combine multiple classifications within some rows, Table 5-5 presents the reported tonnage and gold-equivalent cutoff grade as separate entries by year, deposit, and historical classification.
Table 5-5. Homestake Ridge area historical estimates – reported tonnage and gold-equivalent cutoff grade.
| Year | Deposit | Historical classification as originally reported | AuEq cutoff (g/t) | Tonnes (million) |
| 2006 | HSM | Inferred | 0.5 | 11.90 |
| 2006 | HSM | Inferred | 5.0 | 1.30 |
| 2010 | HSM | Indicated | 3.0 | 0.89 |
| 2010 | HSM | Inferred | 3.0 | 1.14 |
| 2010 | HSS | Inferred | 3.0 | 1.20 |
| 2011 | HSS | Inferred | 3.0 | 2.90 |
| 2012 | HSM | Indicated | 2.0 | 0.60 |
| 2012 | HSM | Inferred | 2.0 | 2.03 |
| 2012 | HSS | Inferred | 2.0 | 4.40 |
| 2012 | SR | Inferred | 2.0 | 0.33 |
| 2017 | HSM | Indicated | 2.0 | 0.60 |
| 2017 | HSM | Inferred | 2.0 | 2.098 |
| 2017 | HSS | Inferred | 2.0 | 4.81 |
| 2017 | SR | Inferred | 2.0 | 0.337 |
The corresponding reported gold, silver, and copper grades, together with source of each historical estimate are presented in Table 5-6.
| Contango Silver and Gold – Kitsault Valley Project | Page 63 of 253 |
| Technical Report Summary and updated Mineral Resource Estimate 2026 |
Table 5-6. Homestake Ridge area historical estimates – reported metal grades and sources.
| Year | Deposit | Au grade (g/t) | Ag grade (g/t) | Cu grade (%) | Source |
| 2006 | HSM | 2.36 | 15.0 | 0.11 | Folk & Makepeace (2007) |
| 2006 | HSM | 10.61 | 38.3 | 0.37 | Folk & Makepeace (2007) |
| 2010 | HSM | 6.69 | 47.2 | 0.15 | Rennie et al. (2010) |
| 2010 | HSM | 5.02 | 50.9 | 0.25 | Rennie et al. (2010) |
| 2010 | HSS | 4.25 | 158.0 | 0.02 | Rennie et al. (2010) |
| 2011 | HSS | 3.69 | 123.4 | Not available | Rennie (2011) |
| 2012 | HSM | 6.40 | 48.3 | 0.31 | Macdonald & Rennie (2016) |
| 2012 | HSM | 5.65 | 28.6 | 0.18 | Macdonald & Rennie (2016) |
| 2012 | HSS | 2.85 | 130.4 | 0.03 | Macdonald & Rennie (2016) |
| 2012 | SR | 13.04 | 3.6 | 0.04 | Macdonald & Rennie (2016) |
| 2017 | HSM | 6.25 | 47.9 | 0.18 | Ross & Chamois (2017) |
| 2017 | HSM | 5.53 | 28.0 | 0.30 | Ross & Chamois (2017) |
| 2017 | HSS | 2.71 | 124.4 | 0.02 | Ross & Chamois (2017) |
| 2017 | SR | 12.88 | 3.6 | 0.04 | Ross & Chamois (2017) |
| Contango Silver and Gold – Kitsault Valley Project | Page 64 of 253 |
| Technical Report Summary and updated Mineral Resource Estimate 2026 |
| 6 | GEOLOGICAL SETTING, MINERALIZATION, AND DEPOSIT models |
This chapter describes the regional- and property-scale geological setting of the Kitsault Valley Project, the material styles and zones of mineralization, and the deposit models used to guide geological interpretation. The discussion is based on previous project reports and geological studies, including Garrow (2011), Higgs and Giroux (2015), McCuaig and Sebert (2017), Ross and Chamois (2017), Atkinson and Gunson (2018), Turner and Nicholls (2019), Hough et al. (2022), Turner and Hough (2023), and the regional work of Monger et al. (1982), Alldrick (1993), Lewis et al. (2001), and Gagnon et al. (2012). Historical interpretations are identified where they require reconciliation with the current geological model.
| 6.1 | Regional Geology |
The Kitsault Valley Project is located within the Stikine Terrane (Stikinia) of the Intermontane Belt of the Canadian Cordillera (Figure. 6-1). Stikinia is an accreted island-arc terrane that extends from southern Yukon to south-central British Columbia and is bounded by the Cache Creek Terrane to the east and the Alexander Terrane to the west (Figure. 6-2). The project lies within the Stewart Complex, a northwest-trending metallogenic belt that hosts precious-metal veins, porphyry, skarn, and volcanogenic massive sulphide occurrences and deposits (Monger et al., 1982; Alldrick, 1993; Gagnon et al., 2012).
The principal regional rock packages are Upper Triassic volcanic and marine sedimentary rocks of the Stuhini Group; Lower to Middle Jurassic volcanic, volcaniclastic, sedimentary, and intrusive rocks of the Hazelton Group; Middle to Upper Jurassic sedimentary rocks of the Bowser Lake Group; and Mesozoic to Cenozoic intrusive rocks. The Hazelton Group records the transition from Early Jurassic arc volcanism to waning volcanism, subsidence, local rifting, and basin development during the Early to Middle Jurassic. This transition created favourable volcanic, sedimentary, structural, and hydrothermal environments for the mineralization recognized on the project.
| Contango Silver and Gold – Kitsault Valley Project | Page 65 of 253 |
| Technical Report Summary and updated Mineral Resource Estimate 2026 |
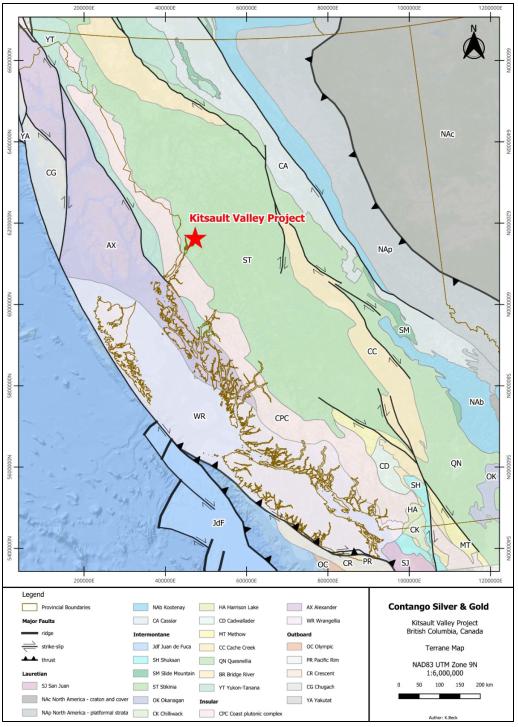
Figure 6-1. Terrane setting of the Kitsault Valley Project in the Canadian Cordillera.
| Contango Silver and Gold – Kitsault Valley Project | Page 66 of 253 |
| Technical Report Summary and updated Mineral Resource Estimate 2026 |
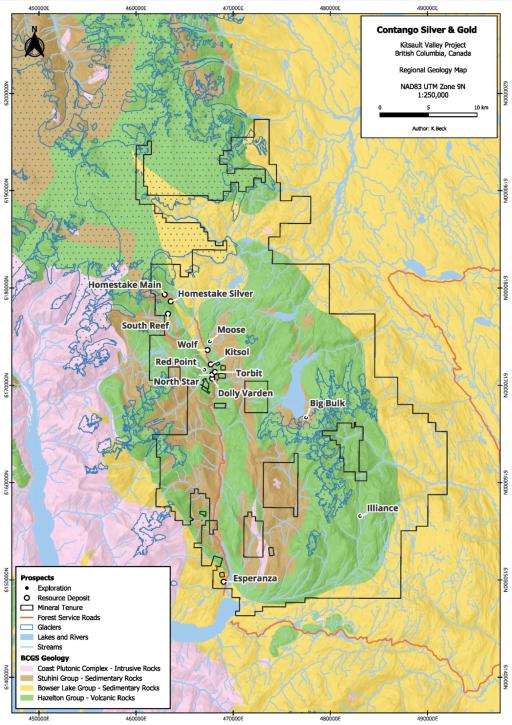
Figure 6-2. Regional geology and location of the Kitsault Valley Project.
| Contango Silver and Gold – Kitsault Valley Project | Page 67 of 253 |
| Technical Report Summary and updated Mineral Resource Estimate 2026 |
6.1.1 Hazelton Group
The Hazelton Group is a compositionally and environmentally diverse succession deposited in subaerial to subaqueous volcanic-arc and basin settings. Abrupt lateral facies changes, interfingering volcanic and sedimentary units, growth faults, and later deformation complicate formation-level correlation. The Lower Hazelton Group broadly comprises Early Jurassic intermediate to felsic arc volcanic and volcaniclastic rocks, including Betty Creek Formation-equivalent units. The Upper Hazelton Group contains a greater proportion of sedimentary and tuffaceous strata deposited during regional subsidence and extension, locally with continued intermediate, felsic, and mafic volcanism.
In the Kitsault area, hydrothermal activity was focused by synvolcanic basin-bounding faults and cross-faults. These structures provided fluid pathways and localized volcanic centres, brecciation, alteration, and mineralization. This setting is important to the interpretation of both stratiform/exhalative and structurally controlled epithermal-style mineralization on the project.
6.1.2 Intrusive and Stuctural Activity
Regional Mesozoic magmatism includes Late Triassic Stikine plutonic-suite intrusions (approximately 228–221 Ma), Early Jurassic Texas Creek-suite intrusions (approximately 195–190 Ma), and Early to Middle Jurassic intrusions associated spatially and temporally with Hazelton Group volcanism and basin development (Macdonald et al., 1996).
Two broad deformation periods are material to the project interpretation. Early to Middle Jurassic synvolcanic extension and growth faulting influenced volcanic facies, basin architecture, and hydrothermal fluid flow. Cretaceous contraction produced broad folds, thrust faults, cleavage, and structural repetition. Later faults and dykes locally offset or overprint earlier stratigraphy, alteration, and mineralization.
| 6.2 | Property and Local Geology |
The Kitsault Valley Project is underlain principally by Stuhini, Hazelton, and Bowser Lake group rocks and associated intrusive rocks (Figure. 6-3). The known mineral deposits occur mainly within Hazelton Group volcanic, volcaniclastic, sedimentary, and subvolcanic units. The Dolly Varden and Homestake claim blocks occupy different parts of the regional stratigraphic and structural framework and are described separately below (Figure. 6-4).
| Contango Silver and Gold – Kitsault Valley Project | Page 68 of 253 |
| Technical Report Summary and updated Mineral Resource Estimate 2026 |
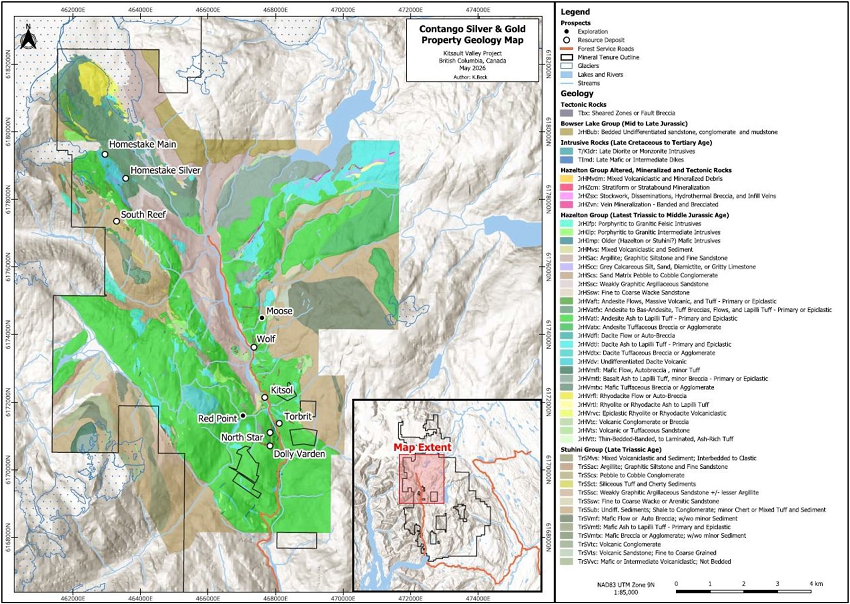
Figure 6-3. Property level geology and location of the Kitsault Valley Project.
| Contango Silver and Gold – Kitsault Valley Project | Page 69 of 253 |
| Technical Report Summary and updated Mineral Resource Estimate 2026 |
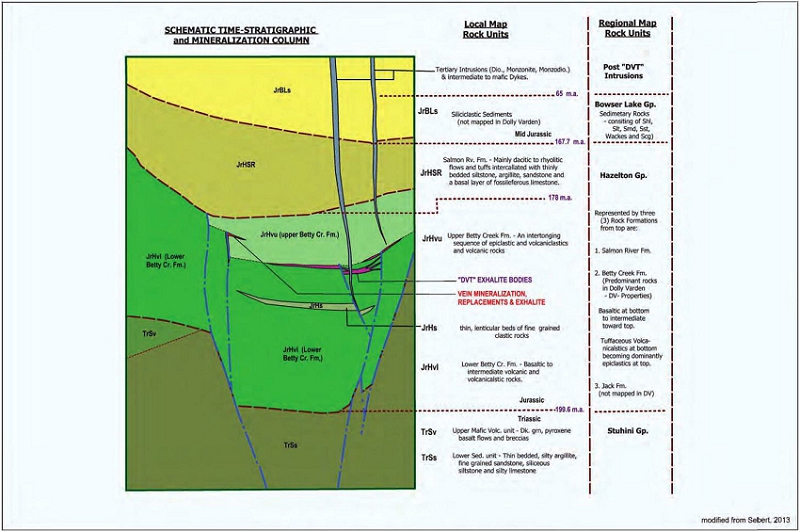
Figure 6-4. Simplified time-stratigraphic and mineralization column for the Dolly Varden area (modified from Higgs and Giroux [2015] and Sebert [2013]).
6.2.1 Dolly Varden Claim Block
The oldest mapped units are Upper Triassic Stuhini Group mafic volcanic rocks and marine sedimentary rocks. Mafic units include dark green pyroxene-bearing basalt flows and breccias. Sedimentary rocks include thinly bedded silty argillite, fine-grained sandstone, siliceous siltstone, and local silty limestone. Hazelton Group rocks unconformably overlie or are faulted against the Stuhini Group and host the principal silver-rich deposits and prospects in the southern part of the project (Figure. 6-5).
Hazelton Group volcanic and volcaniclastic rocks are dominated by subaqueously deposited and commonly reworked andesitic to dacitic tuffs, lapilli tuffs, tuff breccias, volcanic sandstones, and conglomerates. Local felsic units occur in the footwall of the Wolf deposit and in the Sault stratigraphy. Sedimentary intervals include black siltstone and argillite, argillaceous sandstone, conglomerate, fossiliferous calcareous sandstone, and graphitic argillite. Lower Jurassic hornblende–feldspar-phyric subvolcanic intrusions occur locally and may be affected by quartz–sericite–pyrite alteration.
The Dolly Varden area is characterized by broad north- to northwest-trending folds and large north- to northwest-trending, generally west-dipping faults. The Mitchell Creek fault lies west of the Dolly Varden deposit and Kitsol prospect and dips approximately 60° west. The Moose Lamb fault lies east of Torbrit, strikes northwest, and dips west. Available geological evidence indicates that some structures were active during Hazelton deposition and were reactivated or offset during later deformation. Northeast-trending faults, fractures, and dykes are also important locally and are associated with mineralization at Wolf, Kitsol, and other prospects.
| Contango Silver and Gold – Kitsault Valley Project | Page 70 of 253 |
| Technical Report Summary and updated Mineral Resource Estimate 2026 |
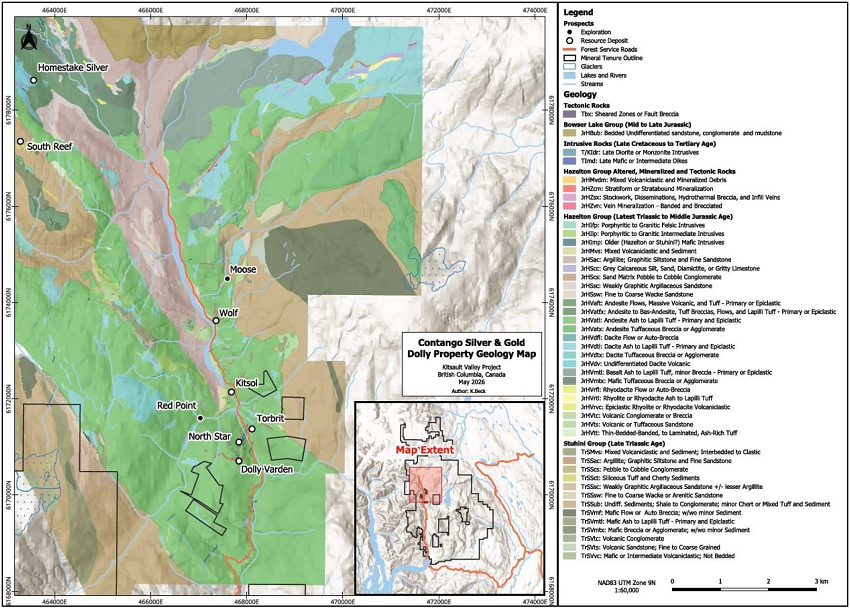
Figure 6-5. Property geology of the Dolly Varden claim block.
6.2.2 Homestake Claim Block
The Homestake area covers the transition from Upper Triassic to Lower Jurassic Stuhini Group sedimentary and volcanic rocks, through Lower to Middle Jurassic Hazelton Group volcanic, volcaniclastic, sedimentary, and intrusive rocks, into Middle to Upper Jurassic Salmon River and Bowser Lake sedimentary rocks (Figure. 6-6). The Hazelton succession records a transition from a volcanic-dominated lower stratigraphy through a depositional hiatus into tuffs and sediments with bimodal volcanic components, followed by fine-grained basin sedimentation. Sulphide occurrences and extensive alteration are concentrated in the Lower to Middle Jurassic stratigraphy.
| Contango Silver and Gold – Kitsault Valley Project | Page 71 of 253 |
| Technical Report Summary and updated Mineral Resource Estimate 2026 |
Geological mapping and geophysical interpretation in the 2023 combined report defined four northwest-trending domains from southwest to northeast:
| 1. | Domain 1 comprises Stuhini Group sedimentary and volcaniclastic rocks and fault panels of pervasively altered Early Jurassic andesitic volcanic and volcaniclastic rocks. These rocks are intruded and locally silicified by rhyolitic and porphyritic monzonite sills, dykes, and plugs. |
| 2. | Domain 2 comprises Early Jurassic Betty Creek andesite and dacite and Brucejack Lake-member rhyolitic to monzonitic rocks. The western margin is structurally juxtaposed against Domain 1 and the domain is unconformably overlain to the northwest by younger sedimentary rocks. |
| 3. | Domain 3 comprises varied Lower to Middle Jurassic Hazelton Group volcanic and volcaniclastic rocks. Fine-grained to feldspar–hornblende-phyric andesitic to latitic/trachytic units, with local hypabyssal monzonite, form the host and footwall sequences to Homestake Main, Homestake Silver, and South Reef. The lower succession is capped locally by volcanic breccia, debris-flow, tuffaceous, mudstone, and sandstone units and by maroon to green andesitic and dacitic volcaniclastic rocks. |
| 4. | Domain 4 comprises Salmon River/Quock Formation and overlying Bowser Lake Group sedimentary rocks. Fine-grained carbonaceous and sulphidic horizons can produce strong chargeability responses and are locally affected by slip and shear zones. North-northwest- and northeast-trending dykes crosscut the sedimentary succession. |
Structure in the Homestake area reflects multiple deformation events. Northwest-trending stratigraphic and fold fabrics are crosscut by north- and northeast-striking faults and dykes. The Vanguard fault is a northwest-trending, approximately 60° southwest-dipping, northeast-verging structure characterized locally by up to approximately 50 m of variably sheared quartz–sericite–pyrite-altered rock. Northwest-southeast normal faults along the northeastern slopes of Homestake Ridge have been interpreted as basin-bounding structures active during Early to Middle Jurassic volcanism. These structures are interpreted to have channelled mineralizing fluids, although their timing and displacement require confirmation in the current model.
| Contango Silver and Gold – Kitsault Valley Project | Page 72 of 253 |
| Technical Report Summary and updated Mineral Resource Estimate 2026 |
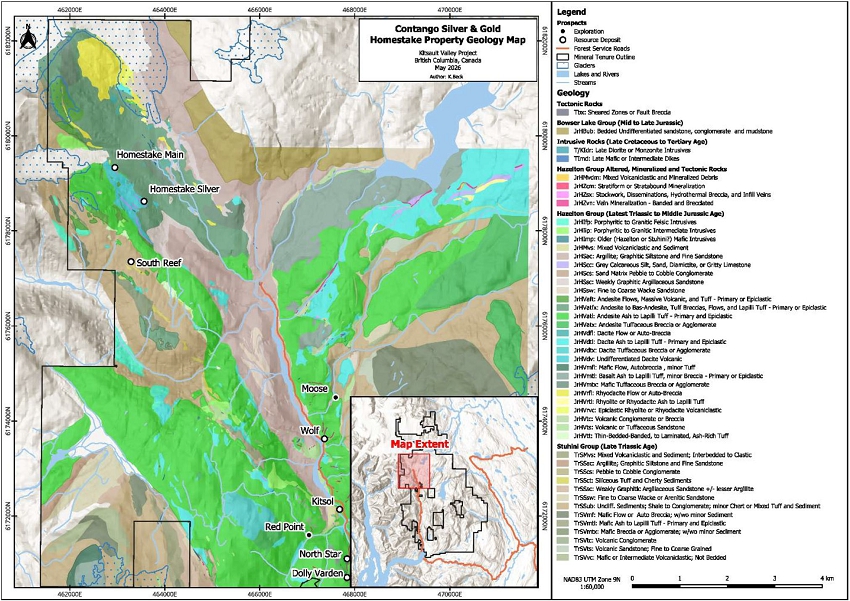
Figure 6-6. Property geology of the Homestake claim block.
| 6.3 | Mineralization and Material Deposits |
Mineralization on the Kitsault Valley Project includes stratiform and stratabound exhalative silver–lead–zinc mineralization, reworked or debris-flow mineralization, structurally controlled epithermal silver and gold mineralization, quartz–sericite–pyrite-associated stockwork and breccia mineralization, and porphyry-style copper–gold mineralization at Big Bulk if that occurrence remains within scope. Individual deposits may contain more than one style or record structural and hydrothermal overprinting.
6.3.1 Principal Mineralization Styles
| · | Exhalative stratiform silica–sulphide mineralization containing variable quartz, chalcedony, barite, carbonate, jasper, galena, sphalerite, pyrargyrite, and other silver-bearing minerals in the Dolly Varden–Torbrit horizon at North Star and Torbrit. |
| · | Exhalative pyrite–sphalerite–galena–chert–carbonate mineralization at Sault and in the upper Trout Horizon. |
| · | Stratabound infill and replacement silver-sulphosalt mineralization in the lower Trout Horizon. |
| Contango Silver and Gold – Kitsault Valley Project | Page 73 of 253 |
| Technical Report Summary and updated Mineral Resource Estimate 2026 |
| · | Quartz–silica–carbonate ± barite epithermal mineralization containing galena, sphalerite, pyrite, and lesser tetrahedrite, pyrargyrite, argentite/acanthite, and native silver. Colloform to crustiform banding, bladed carbonate or barite, hydrothermal brecciation, and late veining occur locally at Wolf, Kitsol, and Dolly Varden. |
| · | Quartz–sericite–pyrite-altered zones with Cu–Ag ± Au in quartz-sulphide stockworks, veins, and hydrothermal breccias, including local chalcopyrite, sphalerite, galena, and sulphosalts. |
| · | Homestake mineralization with both epithermal and volcanogenic characteristics, including stratabound, replacement, vein, and hydrothermal-breccia styles associated with sericite–pyrite, silica, carbonate, and chlorite alteration. |
6.3.2 Deposit Summary
The mineral deposits of the Kitsault Valley Project occur within Hazelton Group volcanic and volcaniclastic rocks and exhibit a range of stratabound, replacement, vein, breccia, and epithermal mineralization styles. Deposit geometry and continuity are principally controlled by favourable stratigraphic horizons, hydrothermal brecciation, veining, and northwest- to northeast-trending structures. The host setting, mineralization style, and principal geological controls for each deposit are summarized in Table 6-1.
Table 6-1. Summary of host setting, mineralization style, and principal geological controls by deposit, Kitsault Valley Project.
| Deposit/zone | Host setting | Style | Principal controls |
| Dolly Varden | Hazelton volcanic/ volcaniclastic rocks; DVT horizon | Exhalative silica–sulphide and structurally overprinted epithermal Ag | Stratigraphy, brecciation, veins, faults |
| North Star | Hazelton rocks; DVT horizon | Silica–carbonate–sulphate–sulphide Ag–Pb–Zn | Favourable horizon; NE to NNE structures |
| Torbrit | Hazelton rocks; DVT horizon | Barite-rich stratabound infill, exhalative/debris-flow and vein Ag–Pb–Zn | Stratigraphy, reworking, faults and veining |
| Wolf | Hazelton volcanic/ volcaniclastic rocks | Structurally hosted epithermal Ag | NE-trending structure; veins and breccias |
| Homestake Main | Lower Hazelton feldspar–hornblende-phyric volcanic rocks | Silica to silica–carbonate–chlorite lenses and hydrothermal breccias; Au–Ag–Cu | NW strike; moderate NE dip; lenses/feeders |
| Homestake Silver | Lower Hazelton volcanic rocks | Steep hydrothermal breccias and veins; Ag–Au–Pb–Zn | Parallel NW-striking structural zones |
| South Reef | Lower Hazelton volcanic rocks | Quartz–chlorite–pyrite-associated Au zones | Two NW-striking, steep NE-dipping tabular zones |
| Contango Silver and Gold – Kitsault Valley Project | Page 74 of 253 |
| Technical Report Summary and updated Mineral Resource Estimate 2026 |
6.3.3 Dolly Varden-Area Deposits
Dolly Varden
Mineralization at Dolly Varden includes silica–sulphide exhalative material and structurally controlled quartz–silica–carbonate mineralization within Hazelton Group volcanic and volcaniclastic rocks. Reported minerals include pyrite, sphalerite, galena, pyrargyrite and other silver minerals, with variable quartz, carbonate, and barite. Brecciation, open-space filling textures, and later veins record multiple hydrothermal and structural events. (see Figure. 6-7 and Figure. 6-8).
North Star
North Star is associated with the prospective Dolly Varden–Torbrit horizon and includes silica–carbonate–sulphate–sulphide mineralization containing silver, sphalerite, galena, pyrite, and minor chalcopyrite in quartz–calcite–barite gangue. Sericite–pyrite alteration is reported around the deposit, and northeast to north-northeast structures may influence geometry. The final description should distinguish stratigraphic continuity from fault repetition and add verified current-model dimensions and depth extent.
Torbrit
Torbrit comprises a combination of barite-rich semi-conformable pod-like stratabound infill, sheet-like veining, reworked debris-style mineralization, and local stratiform lenses of thin-bedded barite and silica-rich exhalite. Mineralization includes silver minerals with sphalerite, galena, pyrite, quartz, carbonate, barite, hematite, and jasper. The deposit is affected by large northwest-trending faults and local structural repetition. The final TRS should provide current upper- and lower-zone geometry, true-thickness ranges, depth extent, and continuity supported by the effective-date model.
Wolf and Kitsol
Wolf and Kitsol are principally structurally hosted epithermal-style silver zones developed in northeast-trending structures. Mineralization occurs in quartz–silica–carbonate ± barite veins, fissure fills, and breccias with galena, sphalerite, pyrite, and silver minerals. Colloform to crustiform banding, bladed carbonate or barite, repeated hydrothermal brecciation, and later veining occur locally. Wolf is a material deposit and requires verified current-model dimensions, depth extent, and continuity. Kitsol should be described at comparable detail only if material to the updated TRS.
6.3.4 Homestake Deposits
The principal Homestake deposits are Homestake Main, Homestake Silver, and South Reef. Mineralization displays both epithermal and volcanogenic characteristics and includes Au, Ag, Cu, Pb, Zn, As, Sb, and locally Hg. Mineralization is spatially associated with Early Jurassic feldspar–hornblende-phyric volcanic and subvolcanic rocks and commonly occurs within sericite–pyrite alteration. The deposits have been interpreted to show vertical metal zonation from an upper Au–Ag-rich, relatively base-metal-poor association to an Ag-rich, base-metal-bearing association over an approximate vertical interval of 250–350 m.
Homestake Main
Homestake Main comprises northwest-striking, moderately northeast-dipping silica to silica–carbonate–chlorite-altered lenses and hydrothermal breccias. Gold and silver mineralization occurs with pyrite, chalcopyrite, and lesser galena and sphalerite, principally within strongly silicified or brecciated zones developed in sericite–pyrite-altered feldspar–hornblende-phyric volcanic rocks. Native gold, pyrargyrite, and acanthite have been observed in quartz veins and quartz-carbonate hydrothermal breccias. The 2023 report described the zone as approximately 700 m long, traced approximately 500 m down dip, and up to approximately 60 m in true width. Mineralization is diffuse in places and the deposit may comprise faulted lenses with related steep feeders. These dimensions and the interpreted southeast extension require update and QP confirmation.
| Contango Silver and Gold – Kitsault Valley Project | Page 75 of 253 |
| Technical Report Summary and updated Mineral Resource Estimate 2026 |
Homestake Silver
Homestake Silver lies southeast of Homestake Main and comprises a cluster of parallel, northwest-trending, steeply dipping hydrothermal-breccia and structurally controlled zones (see Figure 6-7 and Figure. 6-8). Mineralization is characterized by silver with galena and sphalerite and is generally less copper-rich than Homestake Main. The 2023 model described an overall strike extent of approximately 700 m and down-dip extent of approximately 550 m. Individual subzones strike approximately 140°, have near-vertical dips, and rarely exceed approximately 3 m true thickness. The broader zone had been traced by drilling for approximately 600 m vertically and just under 800 m along strike. These overlapping extent descriptions should be reconciled to the current model before finalization.
South Reef
South Reef is located approximately 800 m south-southwest of Homestake Silver. Gold mineralization is associated with quartz–chlorite alteration, pyrite, minor base-metal sulphides, and intervals of sericite–pyrite alteration. The 2023 report described two narrow, subparallel, tabular zones striking approximately 120–130° and dipping approximately 70°–80° northeast. Reported thicknesses are approximately 1–3 m, with approximately 300 m of vertical and 400 m of strike extent. Characterization was considered preliminary because relatively few holes intersected significant mineralization. The current model should update the geometry, continuity, and degree of uncertainty.
| Contango Silver and Gold – Kitsault Valley Project | Page 76 of 253 |
| Technical Report Summary and updated Mineral Resource Estimate 2026 |
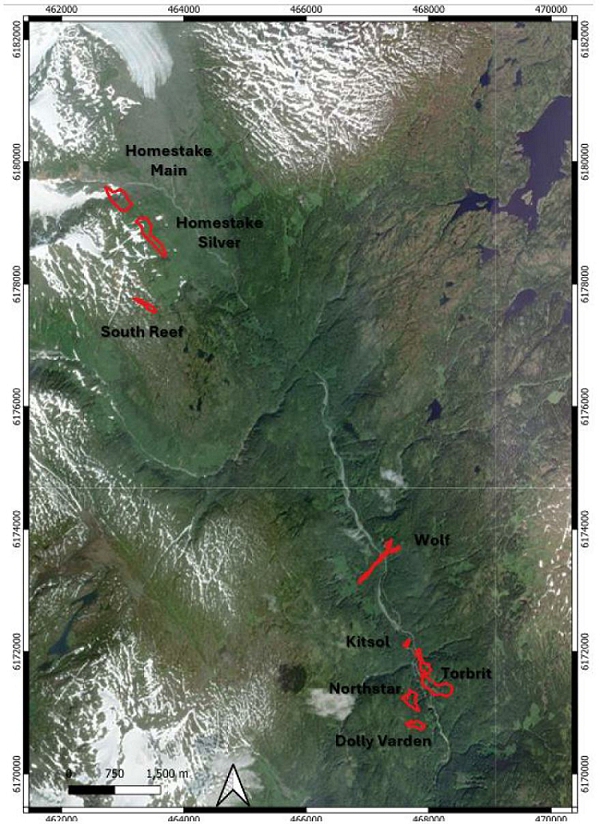
Figure 6-7. Locations of the principal Kitsault Valley Project deposits.
| Contango Silver and Gold – Kitsault Valley Project | Page 77 of 253 |
| Technical Report Summary and updated Mineral Resource Estimate 2026 |
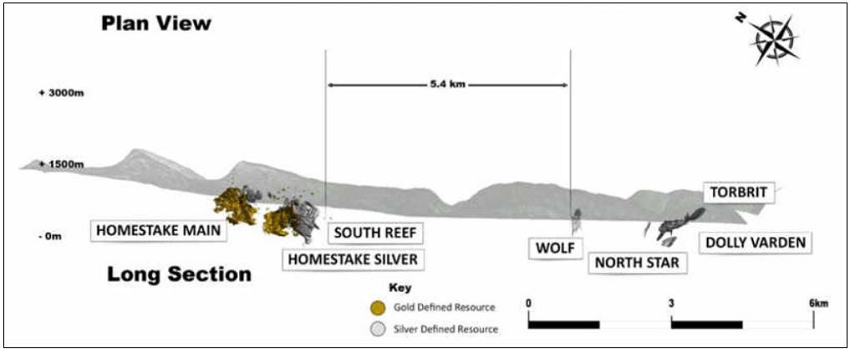
Figure 6-8. Longitudinal section along the Kitsault Valley trend showing the relative positions of the principal ore bodies.
| 6.4 | Deposit Models |
The project is not represented by a single deposit model. The current interpretation should integrate the observed stratigraphic, structural, mineralogical, textural, alteration, and metal-zonation evidence and recognize that some zones may be transitional or overprinted. The models below are exploration and interpretation frameworks and do not establish continuity or economic significance.
6.4.1 Exhalative and VMS-Related Model
Volcanogenic massive sulphide (VMS) deposits form at or near the seafloor through focused hydrothermal-fluid discharge in submarine volcanic environments. Typical deposits are stratabound, locally mound- or lens-shaped, and may overlie discordant stockwork or feeder zones with alteration halos. The Dolly Varden–Torbrit horizon contains stratiform silica, sulphide, barite, carbonate, jasper, and related debris-flow facies that support an exhalative or VMS-related component. Local reworking, replacement, faulting, and later veining complicate a simple syngenetic interpretation (Figure 6-9).
Dolly Varden-area deposits have been compared with precious-metal-rich hybrid bimodal-felsic/siliciclastic systems, including Eskay Creek-type models, because they formed in Hazelton arc stratigraphy during waning volcanism, local basin development, and shallow subaqueous hydrothermal activity. The comparison is useful where supported by stratiform mineralization, exhalative textures, epithermal-suite elements, synvolcanic structures, and volcanic-sedimentary facies; it should not be presented as evidence that the project deposits are direct analogues of Eskay Creek.
| Contango Silver and Gold – Kitsault Valley Project | Page 78 of 253 |
| Technical Report Summary and updated Mineral Resource Estimate 2026 |
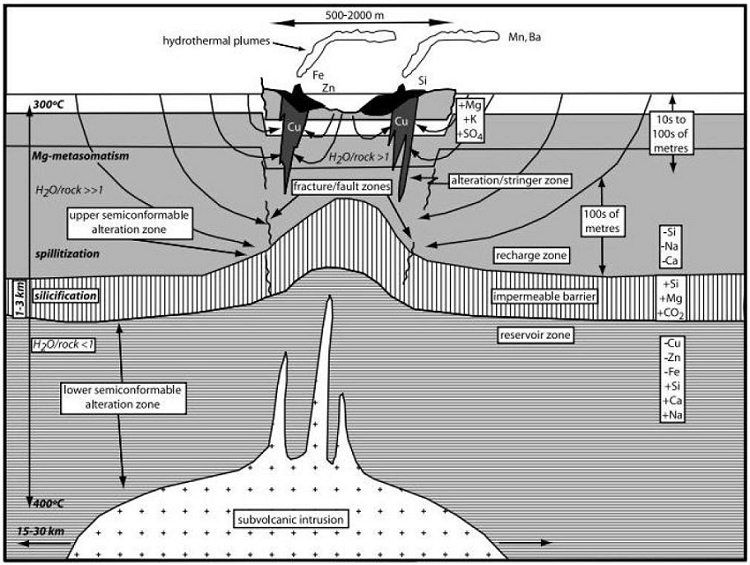
Figure 6-9. Conceptual hybrid bimodal-felsic/siliciclastic mineralization model (after Galley et al., 2007).
6.4.2 Epithermal Model
Epithermal deposits form at shallow crustal levels in volcanic and subvolcanic environments and occur as veins, fissure fills, stockworks, breccias, and replacements. Wolf, Kitsol, and parts of Dolly Varden and Torbrit display features consistent with epithermal mineralization, including open-space filling, colloform and crustiform banding, bladed gangue textures, hydrothermal brecciation, repeated sealing and veining, and Ag–Pb–Zn–Sb–As mineral associations. The occurrence of both stratiform/exhalative and epithermal features supports a transitional or overprinted hydrothermal system in parts of the project.
6.4.3 Homestake Hybrid Model
Homestake Main, Homestake Silver, and South Reef contain stratabound, replacement, vein, and hydrothermal-breccia mineralization associated with Lower Hazelton volcanic and subvolcanic rocks, sericite–pyrite alteration, synvolcanic basin structures, and later faults. The combination of volcanic-hosted, structurally focused, and vertically zoned Au–Ag–base-metal mineralization supports a hybrid volcanogenic–epithermal interpretation. The relative timing of intrusive activity, volcanism, alteration, mineralization, and fault reactivation remains an important control and uncertainty.
| Contango Silver and Gold – Kitsault Valley Project | Page 79 of 253 |
| Technical Report Summary and updated Mineral Resource Estimate 2026 |
| 7 | EXPLORATION |
| 7.1 | Scope, Attribution, and Source Basis |
| 7.2 | Exploration Other Than Drilling |
7.2.1 Dolly Varden Claim Block, 2010–2014
In 2010, Dolly Silver Corporation and Dolly Varden Silver Ltd., predecessors of Dolly Varden Silver Corporation, commissioned Geotech Ltd. to complete a helicopter-borne survey using versatile time-domain electromagnetic (VTEM), gamma-ray spectrometric, and aeromagnetic methods. Approximately 941.7 line-km were flown at 100 m line spacing, covering about 90% of the then property. A 694 line-km Z-axis tipper electromagnetic (ZTEM) and magnetometer survey followed in 2012. Ground electromagnetic and induced-polarization (IP) surveys were completed over three grids in 2014, together with downhole electromagnetic and IP surveys at the Dolly Varden deposit.
Geological mapping in 2011 included surface and underground work at Wolf. The 2012 program included regional mapping at Moose Lamb, Red Point, Kitsol, and Surprise and underground mapping at the Torbrit Mine. That work identified prospective growth faults at Moose Lamb and in the Tiger–Evindsen area and documented intense hydrothermal alteration at Red Point. Surface and underground mapping continued at Torbrit in 2013, and property-scale structural and lithological mapping in 2014 supported regional drill targeting.
Between 2011 and 2014, 804 rock samples, 2,412 soil samples, and 36 silt samples were collected. These datasets provided geochemical context for deposit-area and regional targets. Because individual grab, chip, and soil samples are selective and may not be representative of average grades, they are used as targeting information rather than as estimates of mineralized width or grade.
7.2.2 Dolly Varden Claim Block, 2010–2014
In 2010, Dolly Silver Corporation and Dolly Varden Silver Ltd., predecessors of Dolly Varden Silver Corporation, commissioned Geotech Ltd. to complete a helicopter-borne survey using versatile time-domain electromagnetic (VTEM), gamma-ray spectrometric, and aeromagnetic methods. Approximately 941.7 line-km were flown at 100 m line spacing, covering about 90% of the then property. A 694 line-km Z-axis tipper electromagnetic (ZTEM) and magnetometer survey followed in 2012. Ground electromagnetic and induced-polarization (IP) surveys were completed over three grids in 2014, together with downhole electromagnetic and IP surveys at the Dolly Varden deposit.
Geological mapping in 2011 included surface and underground work at Wolf. The 2012 program included regional mapping at Moose Lamb, Red Point, Kitsol, and Surprise and underground mapping at the Torbrit Mine. That work identified prospective growth faults at Moose Lamb and in the Tiger–Evindsen area and documented intense hydrothermal alteration at Red Point. Surface and underground mapping continued at Torbrit in 2013, and property-scale structural and lithological mapping in 2014 supported regional drill targeting.
Between 2011 and 2014, 804 rock samples, 2,412 soil samples, and 36 silt samples were collected. These datasets provided geochemical context for deposit-area and regional targets. Because individual grab, chip, and soil samples are selective and may not be representative of average grades, they are used as targeting information rather than as estimates of mineralized width or grade.
| Contango Silver and Gold – Kitsault Valley Project | Page 80 of 253 |
| Technical Report Summary and updated Mineral Resource Estimate 2026 |
7.2.3 Dolly Varden Claim Block, 2015–2018
In 2015, structural and lithological examinations were completed underground at the Torbrit and North Star mines and on surface at Musketeer, Ace–Galena, and Kitsol. In 2016, mapping focused on Summit Ridge, Ace–Galena–Trout, Chance Creek, the Trout hanging-wall, the northeast sediment–volcanic contact, and Medallion. Lithogeochemical sampling accompanied the mapping: 254 rock samples were collected in 2015 and 242 in 2016. More reconnaissance-oriented mapping and sampling in 2017 and 2018 produced 235 and 229 rock samples, respectively. Geological observations without analytical samples were recorded at 370 geostations in 2015, 121 in 2016, 233 in 2017, and 216 in 2018.
The 2015 soil program collected 1,810 samples over Wolf, Silver Horde, Chance, and Ace–Galena–Trout. Most samples were collected at 25 m spacing on lines 100 m apart. Silver, lead, zinc, antimony, and barium anomalies outlined the Wolf–Silver Horde corridor and an anomaly extending northeast toward Ace–Galena–Trout; copper responses generally coincided with a lithological change along the eastern grid margin. Gold responses were less coherent. A ten-sample portable-XRF orientation line at Ace–Galena in 2016 returned weak to moderate relative copper and zinc responses. Portable-XRF results are semi-quantitative and were used only for relative pattern recognition.
In early 2017, Geotech Ltd., CW Geophysics Inc., and Dolly Varden re-evaluated the 2010 VTEM and 2011/2012-era ZTEM datasets. The study concluded that the principal lead–zinc-rich, copper-poor VMS-style mineralization was not readily distinguishable in the VTEM response, while ZTEM resistivity patterns more clearly outlined broad high-resistivity regions around known deposits. Rugged topography and variable flight height were identified as limitations on the controlled-source survey response. The data remain useful for regional geological and alteration interpretation but are not treated as direct ore detectors.
McElhanney Consulting Services Ltd. completed a LiDAR survey over the Dolly Varden claim block on August 7, 2017 using an Optech Galaxy system mounted on a Piper Navajo fixed-wing aircraft (Figure 7-1). The reported ground resolution was approximately 25 cm. The resulting terrain model supports topographic control, geological mapping, collar planning, and surface interpretation.
| Contango Silver and Gold – Kitsault Valley Project | Page 81 of 253 |
| Technical Report Summary and updated Mineral Resource Estimate 2026 |
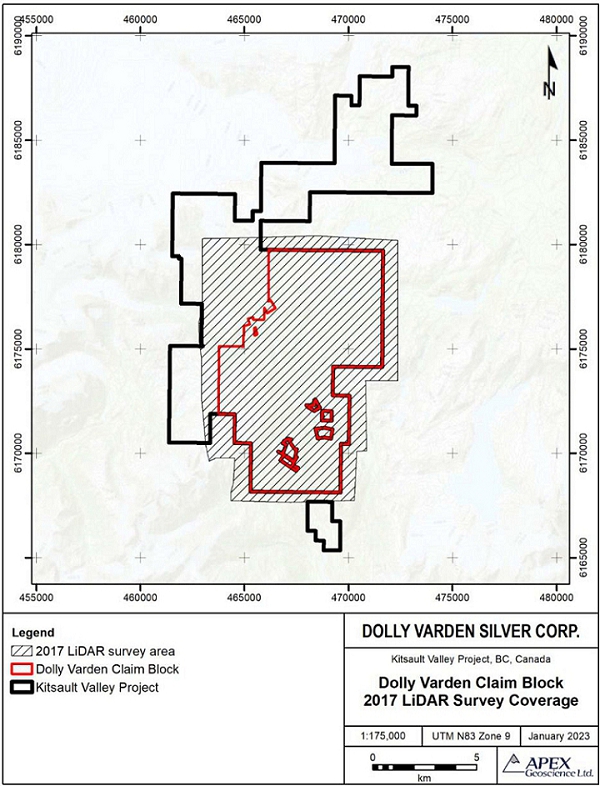
Figure 7-1. LiDAR coverage over the Dolly Varden claim block, 2017.
| Contango Silver and Gold – Kitsault Valley Project | Page 82 of 253 |
| Technical Report Summary and updated Mineral Resource Estimate 2026 |
7.2.4 Dolly Varden Claim Block, 2019–2022
Rock sampling was completed in 2019, 2020, and 2022; no rock sampling was reported in 2021. Three samples were collected in 2019 at Goldbelt and Fisher/Silver Tip. Seventeen samples were collected in 2020 at Red Point, Goldbelt/Starlight–Racehorse, and Surprise. Twenty-nine samples were collected in 2022 at Kitsol, Red Point, Starlight, Surprise, V-Vein, and the 44 Zone. The 2022 program also recorded 96 geostations. Results confirmed localized precious- and base-metal-bearing veins and alteration at several targets, but selective rock samples are not necessarily representative of target-scale grade.
Lithogeochemical sampling was used to characterize lithology and alteration. The programs collected 184 samples in 2019, five in 2020, none in 2021, and seven in 2022. The 2023 technical report stated that integration and interpretation of the combined dataset remained in progress. These data should therefore be used as supporting vectors together with mapped geology and drilling rather than as a stand-alone target ranking.
7.2.5 Homestake Claim Block, 2017–2019
Auryn Resources completed integrated mapping, geochemical sampling, portable-XRF and shortwave-infrared (SWIR) surveys, IP, historical-core relogging, geochronology, and airborne geophysics across the Homestake claim block. These legacy datasets are material because they informed the geological models and targets subsequently inherited by Dolly Varden.
A total of 274 channel, chip, and grab rock samples were collected during the 2017 and 2019 programs. Sampling tested gossanous ridges north of Homestake Main, historical occurrences around Homestake Main and South Reef, and newly exposed areas at Kombi. The programs returned anomalous precious- and base-metal values at Kombi, Bria, and KNHSR. Sample selection was based on favourable lithology or visible mineralization; therefore, the results indicate prospectivity but are not representative of average grade.
The 2017 and 2019 soil programs collected 1,032 Ah-horizon samples and 2,997 B-, C-, and talus-fines samples. Ah-horizon sampling was used to test for responses through younger cover southeast of Homestake. Talus-fines samples were composited along 10 m sections, field screened, and supported by inserted standards and duplicates. B-horizon samples were collected from test pits, screened to remove coarse material, documented digitally, and also supported by standards and duplicates. The results outlined anomalies interpreted as possible extensions of Homestake Silver and South Reef and identified regional precious- and base-metal anomalies at Bria, Kombi, and KNHSR.
In 2017, 17.5 line-km of pole–dipole IP surveying were completed at 50 m dipole spacing. The new data were combined with the 2013 IP survey, and resistivity and chargeability depth slices were incorporated into three-dimensional inversion models. The inversions, together with drill logging, supported interpretation of an extensional structural setting and graben geometry.
A historical-core relogging program captured alteration, brecciation, faulting, sulphide, and SWIR mineral data not consistently recorded in the original logs. Features associated with mineralization included strong texturally destructive silicification, elevated sulphide content, hematite, hydrothermal chlorite, multi-phase brecciation, high-crystallinity kaolinite and sericite, higher-wavelength white mica, and Mg-rich chlorite. The relogging supported a model in which faults bound down-dropped blocks and acted as mineralizing conduits.
Five geochronology samples were analyzed using U–Pb zircon, Ar–Ar step-heating, and galena Pb-isotope methods to constrain intrusive, volcanic, cooling, and mineralization ages. Geotech Ltd. also completed a 574 line-km VTEM and magnetic survey over two Homestake blocks, using 50 m traverse lines and 500 m tie lines. Computational Geosciences Inc. produced individual and joint inversions integrating AeroTEM 2009, VTEM 2010, ZTEM 2012, and VTEM 2019 datasets. The inversions helped define NNE- and NNW-trending regional structures and refine intrusive-body geometry, particularly at Kombi.
| Contango Silver and Gold – Kitsault Valley Project | Page 83 of 253 |
| Technical Report Summary and updated Mineral Resource Estimate 2026 |
7.2.6 Consolidated 2022 Mapping, Sampling, and Terrain Data
On the Homestake claim block, the 2022 program collected 119 rock samples from historical workings, trenches, waste piles, and outcrop at Vanguard, Homestake Camp, Old Homestake Camp, Rambler, and other target areas, and recorded 502 geostations. Forty-four additional samples were submitted for whole-rock geochemical analysis to characterize lithologies and alteration at the main Homestake area and East Valley. As reported in the 2023 technical report, final lithogeochemical interpretation remained pending.
McElhanney Ltd. acquired LiDAR and aerial photography over the Homestake area and southern Kitsault Valley on July 27–28, 2022 using a Leica TerrainMapper-2 mounted on a Piper Navajo fixed-wing aircraft (Figure 7-2). Integration with the 2017 Dolly Varden dataset provided near-continuous high-resolution terrain coverage across the consolidated project and supports survey control, geomorphological interpretation, access planning, and drill-site design.
| Contango Silver and Gold – Kitsault Valley Project | Page 84 of 253 |
| Technical Report Summary and updated Mineral Resource Estimate 2026 |
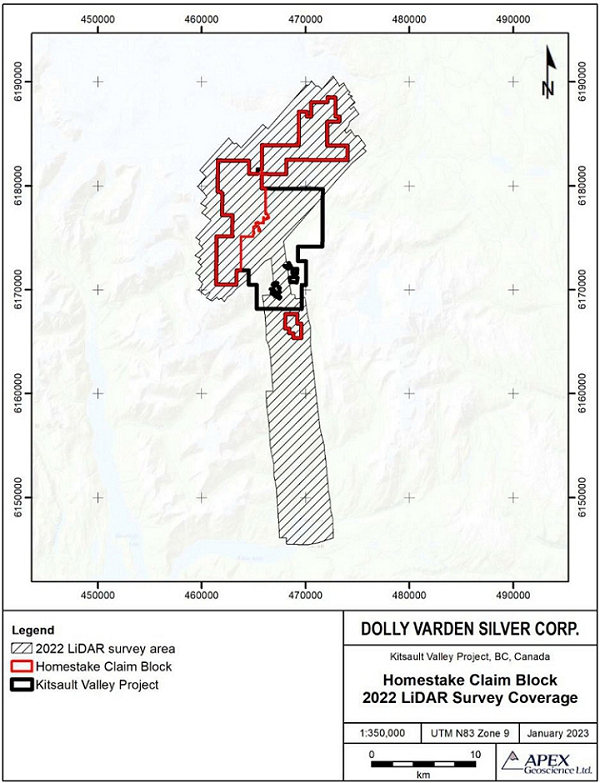
Figure 7-2. LiDAR coverage over the Homestake claim block and southern Kitsault Valley, 2022.
| Contango Silver and Gold – Kitsault Valley Project | Page 85 of 253 |
| Technical Report Summary and updated Mineral Resource Estimate 2026 |
| 7.3 | Drilling Methods and Factors Affecting Reliability |
7.3.1 Dolly Varden Drilling
Diamond drilling is the principal subsurface exploration method. For the 2014 program, NQ core was processed at TerraLogic Exploration’s Alice Arm facility. Logging included magnetic susceptibility, portable XRF, gamma-ray spectrometry, and HALO optical spectroscopy. Potassium responses, checked intermittently by whole-rock analysis, were used to outline broad alteration envelopes around epithermal systems.
For the 2015–2018 programs, drill-site inspections were completed under the supervision of Dolly Varden or TerraLogic geologists. Core placement and depth blocks were checked before boxes were transported by helicopter to the secure logging facility. Whole-core procedures included conversion to metric depth, metre marking, recovery measurement, box identification, and digital capture. Geological logs recorded lithology, alteration, brecciation, mineralization, structure, shearing, and veining. Core was photographed before sampling. Sample intervals were selected by a project geologist; a technician visually selected the cutting line to provide comparable halves, and half core was cut with a diamond saw. Detailed preparation, analytical, and QA/QC procedures are addressed in Chapter 8.
The 2019 technical report states that post-2015 collars were surveyed by differential GPS, downhole surveys were collected in all drillholes, and geological and geotechnical logs were subject to repeated validation and consistency checks. Oriented core was used in all 2020 drillholes and informed later structural and true-width interpretations. The source reports do not provide a single consolidated table of contractor, rig, core diameter, orientation tool, downhole instrument, and survey frequency for every Dolly Varden program; those fields should be confirmed from annual drill logs for the current TRS.
7.3.2 Homestake Drilling
Historical Homestake logging protocols were generally consistent after 2003. Quick logs recorded lithology, alteration, mineralogy, and significant structures. Detailed logs recorded lithology, mineralization, alteration intensity, vein mineralogy and abundance, brecciation, fracture intensity, faults, contacts, bedding, cleavage, and veins relative to the core axis. Geotechnical logging included recovery, rock-quality designation (RQD), and occasional specific gravity. The 2022 Homestake technical report characterized core recovery as generally very good and concluded that no drilling, sampling, or recovery factors materially affected accuracy or reliability.
Early collars were positioned with handheld GPS and chain-and-compass ties from known control. Early downhole control relied on acid dip tests. Beginning in 2006, RANGER Single Shot surveys were collected at approximately 30–60 m intervals; a RANGER Explorer Multi-shot tool was used in 2010–2012. Collar elevations were checked against surface topography; isolated elevation discrepancies identified in three holes were considered immaterial to the then-current resource estimate.
Auryn’s 2017 and 2018 drilling was contracted to Cyr Drilling International Ltd. using helicopter-portable Zinex A-5 hydraulic drills producing NQ2 core. Drill-pad positions were marked by handheld GPS; an Azimuth Aligner and inclinometer established initial azimuth and dip. DeviShot single-shot readings were taken initially approximately 6 m beyond casing and nominally every 50 m thereafter. Completed collars were surveyed by differential GPS. Core was sealed in wooden boxes, transported by helicopter to camp, checked and reconstructed in a secure facility, geotechnically logged in 3 m runs for recovery, RQD, and magnetic susceptibility, descriptively logged for geology and mineralization, measured by TerraSpec Halo at 3 m intervals, digitally captured, and photographed wet and dry before sampling.
| Contango Silver and Gold – Kitsault Valley Project | Page 86 of 253 |
| Technical Report Summary and updated Mineral Resource Estimate 2026 |
7.3.3 Hole Closure, Core Transport, and Storage
The 2018–2025 working draft states that casing is pulled following completion and the hole is marked. Where a completed hole produces water, the draft specifies cementing the hole. The final TRS should confirm that hole closure complied with the applicable authorization and that any exceptions are documented in the drill record.
The working draft reports that Dolly Varden core from 2017–2025 and Homestake core from 2022–2025 is cross-stacked on private lots in Alice Arm. Dolly Varden core from 2011–2016 is reported to be stored in a warehouse on Bornite Road outside Terrace. Historical Homestake and Auryn-era core is reported to be stored in a warehouse in Smithers. The draft contains an apparent year inconsistency in its description of the Auryn core; the inventory and storage locations should be verified before filing.
7.3.4 Interval Widths, Recovery, and Other Limitations
Reported drill intervals are not interchangeable. The source reports variously provide core length, downhole length, true width calculated from sections, or estimated true width based on interpreted geometry and oriented-core data. At Torbrit, reported true-width factors commonly range from about 80% to 95% of core length, although individual 2022 Kitsol and Torbrit intervals range more widely depending on intersection angle. Homestake Main and Homestake Silver true widths were reported as generally 80% to 90% of core length. True width cannot be assigned reliably where mineralized geometry is insufficiently constrained.
Known factors requiring explicit treatment include intersections of historical underground workings, holes lost before reaching target, variable historical survey methods, isolated collar-elevation discrepancies, and changing geological models. These conditions do not automatically invalidate the affected data; they require hole-specific treatment in the database and resource workflow. Detailed database validation is addressed in Chapter 9.
| 7.4 | Drilling — Dolly Varden, 2011–2018 |
Dolly Varden and its predecessor entities completed 205 diamond drillholes totalling approximately 63,883.57 m from 2011 through 2018 (Table 7-1). Program objectives progressed from verification and extension of known deposits to property-scale targeting, discovery drilling, and resource delineation.
| Contango Silver and Gold – Kitsault Valley Project | Page 87 of 253 |
| Technical Report Summary and updated Mineral Resource Estimate 2026 |
Table 7-1. Summary of Dolly Varden drilling, 2011–2018.
| Year | Area/target | Holes | Metres | Program emphasis |
| 2011 | Wolf | 21 | 4,607.36 | Verified grades and widths; tested down-dip and northern extensions. |
| 2012 | Dolly Varden–Torbrit horizon | 6 | 1,728.21 | Tested down-dip and strike extensions. |
| 2013 | Torbrit | 14 | 3,069 | Infill, verification, and step-out drilling. |
| 2014 | Six property-scale targets | 12 | 5,280 | Tested Ag–Au targets, prospective contacts, and alteration systems. |
| 2015 | Ace–Galena, Kitsol, sediment target | 10 | 2,037 | Tested geochemical, vein, structural, and stratigraphic targets. |
| 2016 | Torbrit, Ace–Galena, Chance | 13 | 2,312 | Tested deposit extensions and Pb–Zn–Ag mineralization. |
| 2017 | Dolly Varden claim block | 45 | 15,715.8 | Deposit verification plus regional reconnaissance; four new targets identified. |
| 2018 | Dolly Varden claim block | 84 | 29,134.20 | Deposit delineation/verification plus regional alteration targets. |
| Total | Dolly Varden, 2011–2018 | 205 | 63,883.57 | Subtotal reconciled to the 2023 technical report and current working chapter. |
The 2011 program at Wolf verified down-dip continuity of the central mineralized zone and identified additional mineralization along the northern extension. The 2012 drilling tested the Dolly Varden–Torbrit mineralized horizon; the source cautions that composites may exclude internal weakly mineralized intervals and that true widths were interpreted from sections. In 2013, all fourteen holes intersected the Torbrit horizon, with mineralization expressed as veins, banded zones and breccias, and carbonate–quartz–barite replacement. True widths were not estimated for the reported 2013 intervals.
The 2014 program tested Torbrit, Torbrit Northwest, Red Point, Musketeer North, Kitsol, and Wolf. Moderately anomalous to high-grade silver was intersected at all target areas, including a high-grade Kitsol intersection in DV14010. The 2015 and 2016 programs tested Ace–Galena, Kitsol, Chance, and Torbrit; the Chance holes in 2016 did not return significant mineralization, an outcome relevant to target ranking. The 2017 program identified Moose–Lamb, Torbrit North, Torbrit East, and Beginner’s Luck as new or materially advanced targets. The 2018 program emphasized resource delineation and confirmed high-grade mineralization at Torbrit, Torbrit East, Moose–Lamb, Kitsol, and Dolly Varden.
Representative drilling results are presented in Table 7-2. The complete program tables in the source technical reports include additional mineralized and non-mineralized holes. The omission of those holes from this chapter does not imply that they were excluded from geological interpretation or resource estimation.
| Contango Silver and Gold – Kitsault Valley Project | Page 88 of 253 |
| Technical Report Summary and updated Mineral Resource Estimate 2026 |
Table 7-2. Selected representative drilling results, Dolly Varden, 2011–2018.
| Year | Hole | Target | Reported interval | Grade | Selection rationale |
| 2011 | WS11-107 | Wolf No. 2 vein | 15.20 m core / 10.05 m true | 595 g/t Ag | Verified a broad high-grade vein interval. |
| 2012 | DV12-4 | DV–Torbrit horizon | 5.55 m core / 5.30 m true | 536 g/t Ag | Confirmed mineralization in the tested horizon. |
| 2013 | TB13-03 | Torbrit | 17.10 m core; true width not estimated | 509 g/t Ag | Representative broad Torbrit intersection. |
| 2014 | DV14010 | Kitsol | 23.14 m reported true width | 712.19 g/t Ag | Demonstrated high-grade Kitsol vein mineralization. |
| 2015 | DV15019 | Ace–Galena | 3.15 m core; low angle to core axis | 591 g/t Ag | High-grade result with geometry caution. |
| 2016 | DV16035 | Torbrit | 19.40 m core; true width not stated | 485.04 g/t Ag | Extended multi-zone Torbrit mineralization. |
| 2017 | DV17063 | Torbrit North | 22.74 m core / 21.37 m true | 433.3 g/t Ag | Advanced a new Torbrit North target. |
| 2018 | DV18163 | Torbrit | 75.45 m core / 65.34 m true | 418.9 g/t Ag | Representative resource-delineation intersection. |
| 7.5 | Drilling — 2019–2022 |
Table 7-3 presents a summary of all drilling at the Kitsault Valle Project between 2019 and 2022.
Table 7-3. Summary of Kitsault Valley Project drilling, 2019–2022.
| Year | Claim block | Holes | Metres | Program emphasis |
| 2019 | Dolly Varden | 44 | 11,863.5 | Twelve targets; reconnaissance, confirmation, strike and depth continuity. |
| 2020 | Dolly Varden | 40 | 11,396.6 | 19 Torbrit infill/step-out holes and 21 regional holes; oriented core. |
| 2021 | Dolly Varden | 31 | 10,506.7 | 21 Torbrit/Kitsol-area holes and 10 regional reconnaissance holes. |
| 2022 | Dolly Varden | 52 | 18,614.15 | Torbrit/Kitsol infill and step-out; Wolf and Red Point exploration. |
| 2022 | Homestake | 56 | 18,448.1 | Homestake Main and Homestake Silver infill and extension drilling. |
7.5.1 2019 Program
The 2019 program completed 44 holes totalling 11,863.5 m at twelve Dolly Varden targets. Most holes were reconnaissance tests within the potassic-alteration belt north of the resource areas and were designed to confirm historical results and test lateral and depth continuity. Chance, Silver Horde, McKay, Beginner’s Luck, and Kitsol South returned results considered to warrant follow-up. At Chance, DV19-165 intersected 26.5 m core length averaging 385.4 g/t Ag, including 9.0 m averaging 968.2 g/t Ag; estimated true widths were 24.9 m and 8.46 m, respectively.
| Contango Silver and Gold – Kitsault Valley Project | Page 89 of 253 |
| Technical Report Summary and updated Mineral Resource Estimate 2026 |
7.5.2 2020 Program
The 2020 program completed 40 holes totalling 11,396.6 m. Nineteen holes tested Torbrit by infill and step-out drilling, and 21 tested regional targets. Oriented core was used in all holes. Representative Torbrit results include DV20-222, with 6.00 m core length averaging 310 g/t Ag; DV20-244, with 45.82 m averaging 304 g/t Ag; and DV20-246, with 5.10 m averaging 306 g/t Ag. The source estimated true widths at Torbrit as approximately 80%–95% of reported core length. The drilling refined the interpreted vertical extent and internal high-grade lenses, but individual intersections are not substitutes for the three-dimensional model.
7.5.3 2021 Program
The 2021 program completed 31 holes totalling 10,506.7 m. Twenty-one holes tested Torbrit, Kitsol, and related extensions; ten reconnaissance holes tested Medallion, Red Point, Syndicate, Silver Horde, and Wolf. At Kitsol, DV21-274 returned 15.28 m core length averaging 354 g/t Ag, including 3.70 m averaging 705 g/t Ag; reported true widths were 12.28 m and 2.97 m. DV21-275 returned 23.88 m core length averaging 220 g/t Ag, with a reported true width of 18.27 m, and a separate 0.70 m core interval averaging 1,220 g/t Ag in the Torbrit extension. No significant results were reported from Medallion; including this outcome avoids selection bias in the program narrative.
7.5.4 2022 Program — Dolly Varden
Fifty-two holes totalling 18,614.15 m tested Torbrit/Kitsol, Wolf, and Red Point. At Kitsol, DV22-283 intersected 50.18 m core length averaging 414 g/t Ag (30.11 m reported true width), including multiple higher-grade zones. At Wolf, wide-spaced drilling tested the southwest extension beneath younger sedimentary cover; most holes intersected the interpreted vein system. At Red Point, three holes tested an IP chargeability anomaly and the depth extent of gold-bearing veins. All three intersected strong quartz–pyrite–sericite alteration and stockwork veining, with higher gold and copper grades where veining and brecciation intensified.
7.5.5 2022 Program — Homestake
Fifty-six holes totalling 18,448.1 m tested Homestake Main and Homestake Silver through infill and extension drilling. The 2023 report interpreted the Homestake Main results as supporting more continuous higher-grade lenses than indicated by earlier drilling and identified additional down-dip targets. At Homestake Silver, infill and step-out drilling returned mineralization consistent with the established interpretation. Representative reported results include HR22-328, with 9.16 m core length averaging 27.44 g/t Au and 463 g/t Ag, and HR22-362, with 2.50 m core length averaging 0.81 g/t Au and 1,252 g/t Ag (Table 7-4). Estimated true widths were generally reported as 80–90% of core length.
| Contango Silver and Gold – Kitsault Valley Project | Page 90 of 253 |
| Technical Report Summary and updated Mineral Resource Estimate 2026 |
Table 7-4. Selected representative drilling results, 2019–2022.
| Year | Hole | Target | Reported interval | Grade | Selection rationale |
| 2019 | DV19-165 | Chance | 26.50 m core / 24.90 m est. true | 385.4 g/t Ag | Material reconnaissance discovery/follow-up target. |
| 2020 | DV20-244 | Torbrit | 45.82 m core; 80–95% est. true | 304 g/t Ag | Broad infill/step-out result used to refine geometry. |
| 2021 | DV21-274 | Kitsol | 15.28 m core / 12.28 m true | 354 g/t Ag | Representative Kitsol infill and extension result. |
| 2022 | DV22-283 | Kitsol | 50.18 m core / 30.11 m true | 414 g/t Ag | Broad multi-zone Kitsol intersection. |
| 2022 | DV22-300 | Wolf | 19.85 m core / 13.90 m approx. true | 584 g/t Ag | Material southwest extension below cover. |
| 2022 | DV22-321 | Red Point | 49.0 m core; 75–90% est. true | 0.59
g/t Au, 13 g/t Ag |
Broad altered interval testing IP target. |
| 2022 | HR22-328 | Homestake Main | 9.16 m core; 80–90% est. true | 27.44 g/t Au, 463 g/t Ag | Representative high-grade Main-zone result. |
| 2022 | HR22-362 | Homestake Silver | 2.50 m core; 80–90% est. true | 0.81 g/t Au, 1,252 g/t Ag | Representative Silver-zone step-out result. |
| 7.6 | Drilling — 2023–2025 |
The 2023–2025 programs continued deposit expansion, infill, metallurgical, and regional exploration drilling across the consolidated Kitsault Valley Project (Table 7-5). The 2023 Homestake annual assessment report materially improves the program record and supports 59 NQ holes totalling 27,603.40 m based on its detailed target allocation (26 Homestake Main, 27 Homestake Silver, and six regional holes). This replaces the 83-hole working-draft value used previously. The assessment-report title page states 56 holes, but the detailed program narrative and target allocations sum to 59; the locked collar table should be used for final QP confirmation.
Using the detailed 2023 Homestake program allocation together with the current working record for 2024 and 2025, the 2023–2025 total is 266 holes and approximately 130,177.87 m. The supplied 2024 Dolly Varden assessment report is claim-specific: it documents the Silver Horde hole DV24-422 and does not represent the complete 41-hole Dolly Varden program. The 2025 program totals and target allocations remain based on the current corporate working record.
| Contango Silver and Gold – Kitsault Valley Project | Page 91 of 253 |
| Technical Report Summary and updated Mineral Resource Estimate 2026 |
Table 7-5. Reported drilling totals and target areas, 2023–2025.
| Year | Area | Holes | Metres | Targets / qualification |
| 2023 | Dolly Varden | 56 | 23,934.40 | Includes 2 metallurgical holes (310 m); exploration/resource subtotal 23,624.40 m. |
| 2023 | Homestake | 59 | 27,603.40 | 26 Main, 27 Silver, and 6 regional holes; detailed annual-report allocation. |
| 2024 | Dolly Varden | 41 | 19,429.41 | Wolf, Red Point, Silver Horde, North Star, Chance, Moose–Climax, Ace–Galena. |
| 2024 | Homestake | 28 | 16,147.66 | Homestake Silver, Vanguard, and Blue Ribbon. |
| 2025 | Dolly Varden | 49 | 23,006 | Wolf, Musketeer, North Star, Chance, Moose–Climax, and Red Point. |
| 2025 | Homestake | 31 | 18,011 | Homestake Silver and Homestake Main. |
| 2025 | Big Bulk | 2 | 2,046 | Big Bulk drilling; purpose classification to be confirmed. |
7.6.1 Contractors, Equipment, and Operating Procedures
The 2023 Homestake program was drilled by Omineca Diamond Drilling of Burns Lake, British Columbia, using NQ core and was supported by three Bell 407 helicopters operated by Summit Helicopters of Terrace. The program operated from April 30 to October 19, 2023 from the Alice Arm camp. The supplied 2024 Dolly Varden assessment report also identifies Omineca Diamond Drilling and Summit Helicopters. At the QP’s direction, this draft assumes that these drill and helicopter contractors remained the same for the 2024 and 2025 programs unless the final annual records show otherwise.
Drill sites were inspected at cross-shift, generally near 07:00 and 19:00 when weather permitted, to confirm safety and permit compliance, correct placement of core and depth markers, and the absence of grease or other drill additives on the core. Core boxes were lidded and secured in metal baskets and transported by helicopter to the Alice Arm processing facility, where the box sequence and depth blocks were checked before logging.
Geotechnical processing included metric depth conversion, one-metre marking, run-by-run recovery measurement, RQD, and core orientation using the ACTIII system. Bottom-of-hole marks were extended through connected core, assigned quality rankings, and used with beta corrections for alpha, beta, and gamma structural measurements. The 2023 equipment record identifies a Reflex downhole survey tool, a Reflex core-orientation tool, and differential GPS; the DV24-422 survey record specifically lists Reflex Multi-shot readings. Collar and downhole survey files should be reconciled to the locked database.
Project geologists selected sample intervals based on lithology, alteration, veining, and mineralization. The standard interval was modified as required within a reported range of 0.50–2.00 m. Logging captured alteration, brecciation, lithology, mineralization, structure, shearing, veins, and vein intervals in the project database. Whole core was photographed, and half-core samples were cut with a diamond saw to provide comparable mineralized halves. The recorded drillhole dataset included recovery, sample, oriented-core, RQD, geology, magnetic-susceptibility, photograph, and specific-gravity records. Detailed analytical methods, laboratory QA/QC, and security remain in Chapter 8.
Core from the 2023 Homestake program was stored at the Dolly Varden property in Alice Arm. Consistent with the working draft, this chapter assumes the same Alice Arm processing and storage workflow for the 2024–2025 programs, subject to confirmation against the final core inventory and storage register.
| Contango Silver and Gold – Kitsault Valley Project | Page 92 of 253 |
| Technical Report Summary and updated Mineral Resource Estimate 2026 |
7.6.2 2023 Dolly Varden Program
The 2023 Dolly Varden program completed 56 NQ holes totalling 23,934.40 m between April 30 and October 25. Approximately two-thirds of the program focused on resource expansion and metallurgical drilling at Wolf, Torbrit, and Kitsol, and approximately one-third tested Moose–Climax, Red Point, North Star, Surprise, and southwest Wolf exploration targets. Two metallurgical holes totalled 310 m. The annual report cited total program expenditures of approximately $10.47 million.
At Moose–Climax, four holes totalling 705 m tested down-dip extensions of the Moose Vein. DV23-371 intersected 7.65 m core length averaging 269 g/t Ag from 140.75–148.40 m, including 1.00 m averaging 712 g/t Ag. Three Red Point holes totalling 1,680 m followed the 2022 IP anomaly and DV22-321 mineralization. DV23-360 intersected 120.62 m of quartz–sericite–pyrite alteration and stockwork veining averaging 0.05 g/t Au and 3 g/t Ag, including 2.30 m averaging 7.25 g/t Au and 15 g/t Ag. Higher gold values were associated with increased veining and brecciation.
Two North Star holes totalling 844 m tested the northwestern extension of the vein and intersected stratabound and vein/breccia mineralization. DV23-358 returned 7.43 m core length averaging 345 g/t Ag, 5.92 g/t Au, 2.75% Pb, and 1.60% Zn. Two Surprise holes totalling 918 m did not intersect significant silver, lead, or zinc mineralization at the targeted contact; localized anomalous copper occurred in brecciated quartz–carbonate veining. This negative result is retained because it affects target ranking.
At Wolf, exploration and expansion drilling tested the steeply dipping multi-phase vein and breccia system. DV23-379 returned 18.21 m core length averaging 247 g/t Ag from 719.89–738.10 m. Expansion hole DV23-368 returned 29.34 m averaging 381 g/t Ag from 711.84–741.18 m, including 16.97 m averaging 583 g/t Ag. The program extended high-grade silver mineralization to a reported dip extent of more than 857 m and more than 500 m from the historic Wolf Mine.
Kitsol drilling included exploration and six expansion holes. DV23-336 returned 18.00 m core length averaging 342 g/t Ag from 70.00–88.00 m, including 0.50 m averaging 2,270 g/t Ag. At Torbrit, two expansion holes totalled 300 m; DV23-348 returned 3.50 m averaging 334 g/t Ag from the interpreted lower Torbrit horizon, while DV23-350 intersected mafic dykes at the expected target depth and returned no anomalous precious- or base-metal grades.
7.6.3 2023 Homestake Program
The detailed annual report describes 59 NQ holes totalling 27,603.40 m. At Homestake Main, 26 holes totalled 11,281.40 m: 17 infill holes (6,535.90 m) targeted definition and potential upgrading of Inferred material, and nine exploration holes (4,745.50 m) tested the northern and southern extents of the mineralized lenses. HR23-390 returned 50.30 m core length averaging 1.92 g/t Au and 4 g/t Ag from 167.70–218.00 m, including 0.50 m averaging 129 g/t Au and 218 g/t Ag. The high-grade shoot remained open down dip in the annual interpretation.
At Homestake Silver, 27 holes totalled 14,630 m. Thirteen infill holes (5,823 m) tested the central lens cluster and fourteen step-out/exploration holes (8,807 m) tested northern and southern extensions. HR23-416 returned 1.02 m core length averaging 55.40 g/t Au and 4,830 g/t Ag. Southern step-out HR23-411 returned 10.55 m averaging 369 g/t Ag and 0.91 g/t Au, including 0.55 m averaging 1,925 g/t Ag and 1.73 g/t Au. The northern drilling identified additional high-grade gold in irregular quartz–carbonate veins.
Six regional holes totalling 1,692 m tested Tip Top, Fox Reef, Slide Zone, South Reef, Dilly, and Rambler. The holes intersected faulting and generally low-density quartz–carbonate veining. HR23-424 at Fox Reef returned 0.50 m averaging 5.72 g/t Au and 21.5 g/t Ag; HR23-423 at Rambler returned 1.10 m averaging 1.37 g/t Au and 0.60 g/t Ag. Regional results were weaker than those from Homestake Main and Silver but improved the structural and alteration framework.
| Contango Silver and Gold – Kitsault Valley Project | Page 93 of 253 |
| Technical Report Summary and updated Mineral Resource Estimate 2026 |
7.6.4 2023 Magnetotelluric Surveys
Simcoe Geoscience Ltd. completed three-dimensional ultra-wideband magnetotelluric surveys on both claim blocks. At Homestake, 97 sites covered a centralized 17 line-km grid between August 2 and September 21, 2023. The survey was designed to identify resistivity and conductivity responses at depth, refine northwest-trending structural and lithological interpretations, and generate drill targets. At Dolly Varden, eight MT sites over 1.5 lines covered approximately 4.6 line-km. The Dolly Varden inversion outlined northwest–southeast conductive features interpreted as possible intrusions and helped map subparallel faults and lineaments associated with alteration and anomalous metal responses.
7.6.5 2024 Program
The current corporate working record reports 69 holes and 35,577.07 m in 2024: 41 holes and 19,429.41 m at Dolly Varden and 28 holes and 16,147.66 m at Homestake. The Dolly Varden program was distributed among Wolf, Red Point, Silver Horde, North Star, Chance, Moose–Climax, and Ace–Galena; the Homestake program focused on Homestake Silver, Vanguard, and Blue Ribbon.
The supplied 2024 Dolly Varden assessment report documents only the Silver Horde component credited to claim 538781 and is not a complete annual-program report. It records DV24-422 as an NQ hole at Silver Horde, with 100 m reported for assessment-credit purposes; the narrative also describes the hole as reaching 468 m, an internal inconsistency that should be checked against the collar table. The hole tested extensions of silver-bearing veins identified in 2019 and 2021. The reported analytical highlight was 1.00 m averaging 36 g/t Ag from 177.00–178.00 m. The report concluded that the hole did not reach the intended target depth and returned no material result for the planned target, supporting additional three-dimensional modelling before further drilling.
7.6.6 2025 Program
The current working record reports 82 holes and 43,063 m in 2025. Dolly Varden drilling comprised 49 holes and 23,006 m: 32 holes (16,482 m) at Wolf, eight holes (2,739 m) distributed among Musketeer, North Star, and Chance, and nine holes (3,785 m) at Moose–Climax and Red Point. Homestake drilling comprised 31 holes and 18,011 m, dominated by 29 holes (16,813 m) at Homestake Silver and two holes (1,198 m) at Homestake Main. Two Big Bulk holes totalled 2,046 m.
Under the QP-directed assumption that contractors and controlled procedures were unchanged, the 2025 drilling is described using the Omineca/Summit helicopter-supported NQ workflow and the TerraLogic/Dolly Varden logging, ACTIII orientation, Reflex survey, recovery/RQD, photography, specific-gravity, and half-core sampling procedures summarized in Section 7.6.1. The supplied report package does not contain a complete 2025 analytical-results report. Accordingly, Table 7-6 includes selected 2025 intercepts only from approved corporate disclosures; those results remain subject to reconciliation to the locked 2025 assay database and are presented as representative rather than exhaustive results.
Table 7-6 provides a QP-selected compilation of representative exploration drill intercepts from results disclosed during 2023 through 2025. The selection spans the Homestake Ridge area, principal Dolly Varden deposits and prospects, and other exploration targets, and is intended to illustrate the range of mineralization, interval widths, target styles, and exploration outcomes encountered during the campaigns.
| Contango Silver and Gold – Kitsault Valley Project | Page 94 of 253 |
| Technical Report Summary and updated Mineral Resource Estimate 2026 |
Table 7-6. Selected representative exploration drill intercepts disclosed during 2023–2025.
| Drill Year | Property Area | Location / Deposit |
Hole ID | Interval
Class |
Length (m) | Ag (g/t) | Au (g/t) | AgEq (g/t) | AuEq (g/t) | Pb (g/t) | Zn (g/t) | Cu (g/t) | Context / Significance |
| 2022 | Homestake Ridge | Homestake Main | HR22-333 | Main composite | 25 | 70 | 46.31 | — | — | — | — | 0.19 | Highlighted main interval |
| 2022 | Homestake Ridge | Homestake Main | HR22-336 | Separate interval | 3.9 | 1,844 | 6.19 | — | — | — | — | — | Highlighted separate interval |
| 2022 | Homestake Ridge | Homestake Main | HR22-345 | Main composite | 29.54 | 12 | 8.73 | — | — | — | — | — | Highlighted main interval |
| 2022 | Homestake Ridge | Homestake Silver | HR22-361 | Main composite | 1.2 | 2,500 | 15.04 | — | — | — | — | 0.17 | Highlighted interval |
| 2023 | Homestake Ridge | Homestake Silver | HR23-416 | Main composite | 93.95 | 213 | 1.74 | 357 | — | — | — | — | Mineralized envelope |
| 2023 | Homestake Ridge | Homestake Silver | HR23-416 | Included interval | 1.02 | 4,830 | 55.4 | 9,422 | — | — | — | — | Highest-grade emphasized subinterval |
| 2023 | Homestake Ridge | Homestake Silver | HR23-389 | Main composite | 12.45 | 60 | 79.49 | — | 80.21 | — | — | — | New gold-rich zone |
| 2023 | Homestake Ridge | Homestake Silver | HR23-399 | Separate interval | 1.75 | 418 | 40.33 | — | 45.37 | — | — | — | Highlighted high-grade vein |
| 2024 | Homestake Ridge | Homestake Silver | HR24-432 | Broad envelope | 48.23 | 5 | 8.85 | — | — | — | — | — | Mineralized envelope |
| 2024 | Homestake Ridge | Homestake Silver | HR24-435 | Included interval | 34.93 | 84 | 12.23 | — | — | — | — | — | Stronger breccia-vein interval |
| 2024 | Homestake Ridge | Homestake Silver | HR24-431 | Main composite | 8.72 | 27 | 21.55 | — | — | — | — | — | North step-out |
| 2024 | Homestake Ridge | Homestake Silver | HR24-433 | Broad envelope | 29.5 | 13 | 3.48 | — | — | — | — | — | Eastern lens |
| 2024 | Homestake Ridge | Homestake Silver | HR24-437 | Main composite | 10.2 | 97 | 5.54 | — | — | — | — | — | South infill |
| Contango Silver and Gold – Kitsault Valley Project | Page 95 of 253 |
| Technical Report Summary and updated Mineral Resource Estimate 2026 |
| Drill Year | Property Area | Location / Deposit |
Hole ID | Interval
Class |
Length (m) | Ag (g/t) | Au (g/t) | AgEq (g/t) | AuEq (g/t) | Pb (g/t) | Zn (g/t) | Cu (g/t) | Context / Significance |
| 2025 | Homestake Ridge | Homestake Silver | HR25-456 | Broad envelope | 120 | 3 | 3.34 | — | — | — | — | — | 45 m step-out along strike |
| 2025 | Homestake Ridge | Homestake Silver | HR25-469 | Main composite | 14.76 | 34 | 26.74 | — | — | 0.77 | 0.9 | — | Large open area |
| 2025 | Homestake Ridge | Homestake Silver | HR25-464 | Main composite | 6.65 | 2 | 9.22 | — | — | — | — | — | Newly recognized stockwork zone |
| 2025 | Homestake Ridge | Homestake Silver | HR25-475 | Main composite | 21.18 | 75 | 14.5 | — | — | 0.76 | 1.1 | — | Assay-table and introductory length used; highlight bullet states 21.60 m |
| 2022 | Dolly Varden | Wolf | DV22-329 | Main composite | 15.94 | 1,499 | — | — | — | 1.89 | 0.46 | — | 50 m step-out; east offset |
| 2022 | Dolly Varden | Wolf | DV22-320 | Main composite | 12.85 | 321 | — | — | — | 0.84 | 0.84 | — | 63 m down-plunge step-out |
| 2022 | Dolly Varden | Kitsol | DV22-323 | Main composite | 15 | 301 | — | — | — | 0.23 | 0.56 | — | 85 m down-plunge step-out |
| 2023 | Dolly Varden | Kitsol | DV23-334 | Main composite | 8.32 | 297 | — | — | — | 0.28 | 0.22 | — | Near-surface extension |
| 2023 | Dolly Varden | Kitsol | DV23-336 | Main composite | 18 | 342 | — | — | — | 0.58 | 0.57 | — | Near-surface extension |
| 2023 | Dolly Varden | Kitsol | DV23-337 | Main composite | 9.57 | 496 | — | — | — | 0.78 | 0.38 | — | 41 m up-plunge step-out |
| 2023 | Dolly Varden | Torbrit | DV23-348 | Main composite | 3.5 | 334 | 0.13 | — | — | 0.03 | 0.05 | — | South extension |
| 2023 | Dolly Varden | Wolf | DV23-368 | Main composite | 29.34 | 381 | 0.09 | 418 | — | 0.46 | 0.39 | — | 75 m down-plunge step-out |
| 2023 | Dolly Varden | Wolf | DV23-375 | Main composite | 26.99 | 296 | — | 461 | — | 1.68 | 3.01 | — | 81 m step-out; AgEq includes Ag, Au, Pb and Zn |
| 2024 | Dolly Varden | Wolf | DV24-404 | Main composite | 9.38 | 1,091 | 0.06 | — | — | 1.35 | 1.4 | — | 40 m southwest step-out |
| Contango Silver and Gold – Kitsault Valley Project | Page 96 of 253 |
| Technical Report Summary and updated Mineral Resource Estimate 2026 |
| Drill Year | Property Area | Location / Deposit |
Hole ID | Interval
Class |
Length (m) | Ag (g/t) | Au (g/t) | AgEq (g/t) | AuEq (g/t) | Pb (g/t) | Zn (g/t) | Cu (g/t) | Context / Significance |
| 2024 | Dolly Varden | Wolf | DV24-412 | Main composite | 16.2 | 606 | — | — | — | 0.61 | 1.43 | — | Body/table length used; release title states 16.38 m |
| 2024 | Dolly Varden | Wolf | DV24-414 | Broad envelope | 15.02 | 254 | — | — | — | 0.86 | 1.34 | — | Wide vein-breccia zone |
| 2024 | Dolly Varden | Wolf | DV24-416 | Main composite | 21.48 | 654 | — | — | — | 0.47 | 0.57 | — | Upper vertical extension |
| 2024 | Dolly Varden | Wolf | DV24-408 | Main composite | 27.19 | 513 | — | — | — | 2.95 | 1.82 | — | Lower vertical extension |
| 2024 | Dolly Varden | Wolf | DV24-421 | Main composite | 21.69 | 379 | — | — | — | 0.64 | 0.66 | — | 120 m step-out |
| 2025 | Dolly Varden | Wolf | DV25-446 | Main composite | 21.7 | 1,422 | 0.51 | — | — | 3.05 | 1.42 | — | 105 m up-plunge from DV24-421 |
| 2025 | Dolly Varden | Wolf | DV25-446 | Included interval | 1 | 10,700 | 2.54 | — | — | 4.33 | 1.68 | — | Highest-grade included interval |
| 2022 | Dolly Varden | Red Point | DV22-321 | Broad interval | 49 | 13 | 0.59 | — | — | — | — | — | Broad altered interval |
| 2022 | Dolly Varden | Red Point | DV22-321 | Included interval | 5 | 83 | 2.94 | — | — | — | — | 1.65 | Included in broader system |
| 2022 | Dolly Varden | Red Point | DV22-321 | Included interval | 1 | 244 | 8.1 | — | — | — | — | 5.16 | Highest-grade included interval |
| 2022 | Dolly Varden | Red Point | DV22-322 | Separate interval | 1.15 | 23 | 17.2 | — | — | 0.07 | 0.13 | 1.93 | Assay table value used; highlight text lists 1.65% Cu |
| 2023 | Dolly Varden | Moose | DV23-371 | Main composite | 7.55 | 269 | — | 285 | — | 0.38 | 0.13 | — | Initial Moose drilling |
| 2023 | Dolly Varden | Moose | DV23-371 | Included interval | 1 | 712 | — | 728 | — | 0.29 | 0.19 | — | Highest-grade included interval |
| 2024 | Dolly Varden | Moose | DV24-387 | Main composite | 5 | 977 | — | — | — | — | — | — | Headline rounds to 978 g/t Ag; table/highlight states 977 g/t Ag |
| Contango Silver and Gold – Kitsault Valley Project | Page 97 of 253 |
| Technical Report Summary and updated Mineral Resource Estimate 2026 |
| Drill Year | Property Area | Location / Deposit |
Hole ID | Interval
Class |
Length (m) | Ag (g/t) | Au (g/t) | AgEq (g/t) | AuEq (g/t) | Pb (g/t) | Zn (g/t) | Cu (g/t) | Context / Significance |
| 2024 | Dolly Varden | Moose | DV24-387 | Included interval | 0.79 | 3,670 | — | — | — | — | — | — | Highest-grade included interval |
| 2024 | Dolly Varden | Chance | DV24-388 | Main composite | 23.03 | 206 | — | — | — | — | — | — | First 2024 Chance result |
| 2024 | Dolly Varden | Chance | DV24-388 | Included interval | 0.5 | 749 | — | — | — | — | — | — | Highest-grade emphasized subinterval |
| 2024 | Dolly Varden | North Star | DV24-423 | Broad envelope | 22.78 | 124 | 0.13 | — | — | 0.5 | 2.83 | — | Newly reported exploration result |
| 2024 | Dolly Varden | North Star | DV24-423 | Included interval | 3.04 | 432 | — | — | — | 1.39 | 5.28 | — | Silver-rich layer |
| 2024 | Dolly Varden | Red Point | DV24-400 | Broad envelope | 20.15 | — | 0.79 | — | — | — | — | — | Newly reported broad stockwork zone |
| 2024 | Dolly Varden | Red Point | DV24-400 | Included interval | 0.5 | — | 21.1 | — | — | — | — | — | Highest-grade included interval |
| 2024 | Dolly Varden | Red Point | DV24-395 | Broad envelope | 59.09 | — | 0.5 | — | — | — | — | — | Newly reported broad stockwork zone |
| 2024 | Dolly Varden | Red Point | DV24-395 | Included interval | 3.11 | — | 2.99 | — | — | — | — | — | Highest-grade included interval |
Notes: This is a selected and representative compilation and is not a complete assay or drill-hole database. Drill year is shown in the first column; certain 2022 drilling results were disclosed in 2023. Reported lengths are drill-core or downhole lengths unless the applicable source expressly reports an estimated true width. Included intervals are contained within broader reported intervals and must not be summed with their parent intervals. AgEq and AuEq values are reproduced only where reported and depend on the metal-price, recovery, and formula assumptions stated in the applicable disclosure. The selected results do not, by themselves, demonstrate continuity or support mineral-resource classification.
| Contango Silver and Gold – Kitsault Valley Project | Page 98 of 253 |
| Technical Report Summary and updated Mineral Resource Estimate 2026 |
7.6.7 Target Allocations and Reconciliation
The following target allocations combine the detailed 2023 Homestake annual report with the current 2023–2025 corporate working record (Table 7-7, Figures 7-3 to 7-5). The 2024 and 2025 allocations are retained pending final reconciliation to the locked collar and purpose-classification tables.
Table 7-7. Target-level drilling allocations, 2023–2025.
| Year | Area | Target allocation | Holes | Metres |
| 2023 | Dolly Varden | Wolf | 32 | 16,712.40 |
| 2023 | Dolly Varden | Red Point / Surprise / Moose | 9 | 3,303 |
| 2023 | Dolly Varden | North Star / Kitsol / Torbrit | 13 | 3,609 |
| 2023 | Dolly Varden | Metallurgical | 2 | 310 |
| 2023 | Homestake | Homestake Main | 26 | 11,281.40 |
| 2023 | Homestake | Homestake Silver | 27 | 14,630 |
| 2023 | Homestake | Tip Top / Slide / South Reef / Dilly / Rambler / Fox Reef | 6 | 1,692 |
| 2024 | Dolly Varden | Wolf | 22 | 13,614.06 |
| 2024 | Dolly Varden | Red Point / Silver Horde / North Star / Chance | 11 | 3,898.35 |
| 2024 | Dolly Varden | Moose–Climax / Ace–Galena | 8 | 1,917 |
| 2024 | Homestake | Homestake Silver | 25 | 15,403.7 |
| 2024 | Homestake | Vanguard / Blue Ribbon | 2 | 744 |
| 2025 | Dolly Varden | Wolf | 32 | 16,482 |
| 2025 | Dolly Varden | Musketeer / North Star / Chance | 8 | 2,739 |
| 2025 | Dolly Varden | Moose–Climax / Red Point | 9 | 3,785 |
| 2025 | Homestake | Homestake Silver / Homestake Main | 31 | 18,011 |
| 2025 | Big Bulk | Big Bulk | 2 | 2,046 |
The detailed 2023 Homestake allocation reconciles to 59 holes and 27,603.40 m. The assessment-report title page lists 56 holes, while its body, individual target allocations, and results sections consistently support 59. For 2024 Homestake, the working-draft target rows account for 27 holes, one fewer than the stated 28, while metres reconcile within rounding. The 2024 Dolly Varden and 2025 allocations reconcile to the stated headline counts and metres.
The working record further reports 25,420 core samples and 682 mapping rock samples for 2023; 16,314 core samples and 291 mapping rock samples for 2024; and 23,289 core samples and 329 mapping rock samples for 2025. The 2023 Homestake count includes 682 re-samples from 2022 drilling. These counts should be retained only after “core sample” is defined and original samples, re-samples, QA/QC insertions, and metallurgical samples are separated consistently.
| Contango Silver and Gold – Kitsault Valley Project | Page 99 of 253 |
| Technical Report Summary and updated Mineral Resource Estimate 2026 |
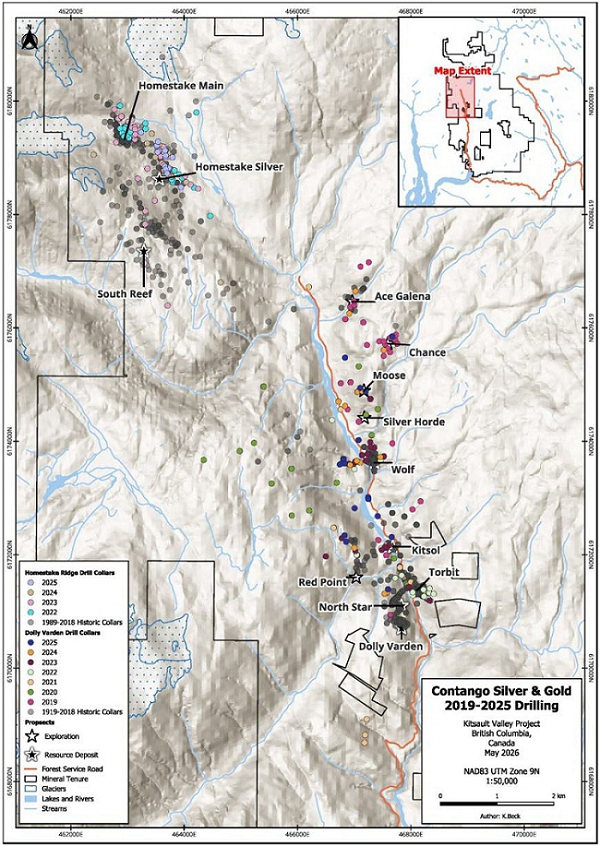
Figure 7-3. Kitsault Valley Project drilling locations, 2019–2025 (source: current Chapter 7 working record).
| Contango Silver and Gold – Kitsault Valley Project | Page 100 of 253 |
| Technical Report Summary and updated Mineral Resource Estimate 2026 |
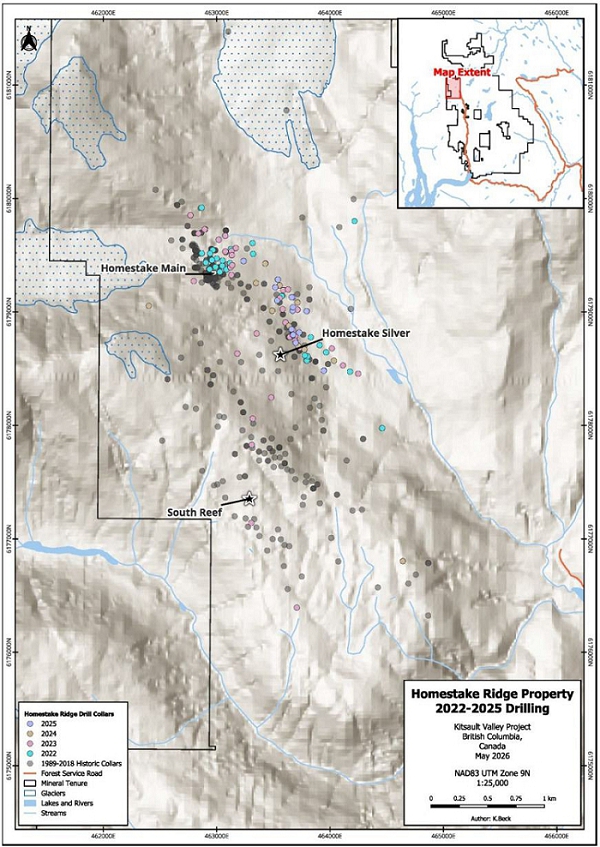
Figure 7-4. Homestake area drilling locations, 2022–2025 (source: current Chapter 7 working record).
| Contango Silver and Gold – Kitsault Valley Project | Page 101 of 253 |
| Technical Report Summary and updated Mineral Resource Estimate 2026 |
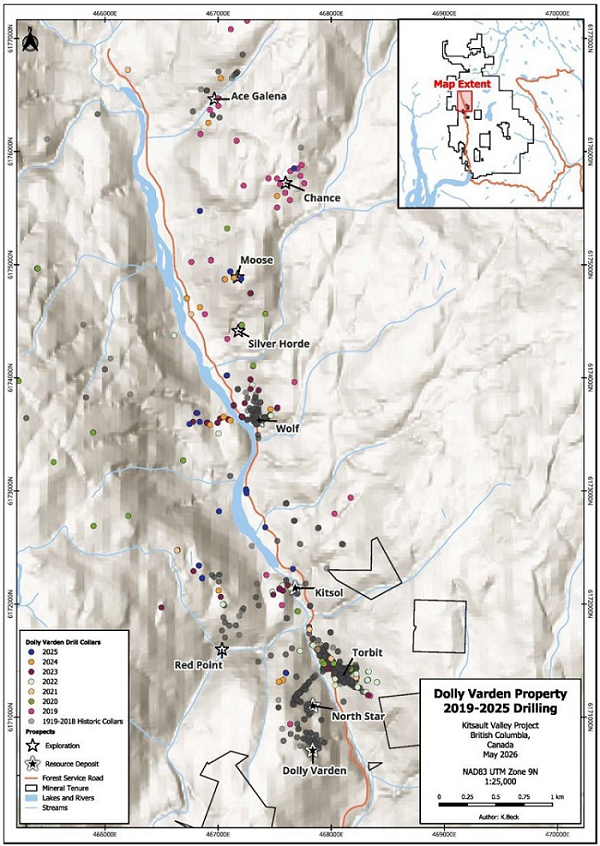
Figure 7-5. Dolly Varden area drilling locations, 2019–2025 (source: current Chapter 7 working record).
| Contango Silver and Gold – Kitsault Valley Project | Page 102 of 253 |
| Technical Report Summary and updated Mineral Resource Estimate 2026 |
| 7.7 | Hydrogeological and Geotechnical Data |
Geotechnical information collected during routine drilling includes core recovery, RQD, fracture and structural observations, and, in some programs, specific gravity and magnetic susceptibility. The historical Homestake programs and Auryn’s 2017–2018 drilling explicitly recorded recovery and RQD; Dolly Varden’s post-2015 procedures explicitly recorded recovery and detailed structural information. These data support geological interpretation and identify intervals affected by poor recovery or structural complexity.
The source reports reviewed for this chapter do not describe a standalone project-scale hydrogeological drilling, packer-testing, pumping-testing, or groundwater-monitoring program, nor do they present a feasibility-level geotechnical domain model. At the current exploration/resource stage, the absence of such a program does not affect the reporting of exploration results, but dedicated hydrogeological and geotechnical investigations will be required if the project advances to mine design and economic assessment.
| 7.8 | QP Interpretation and Limitations |
The combined exploration record demonstrates progressive testing of known deposits, favourable stratigraphic horizons, structural corridors, alteration systems, geochemical anomalies, and geophysical targets. At Dolly Varden, the programs refined the Torbrit–Kitsol system, extended Wolf beneath cover, advanced North Star and related connectors, and tested regional alteration corridors. At Homestake, integrated surface geochemistry, geophysics, relogging, and drilling refined the structural and alteration framework around Homestake Main, Homestake Silver, South Reef, and regional targets.
The principal limitations are: selective surface samples are not representative of average target grade; some historical procedure records are incomplete; interval reporting alternates between core length and true width; true-width confidence depends on local geometry and oriented-core control; historical collar and downhole survey methods changed through time; certain holes encountered workings or were lost; and geological interpretations evolved as drilling density increased. These limitations are manageable when they are carried through the validated database and geological model and disclosed consistently.
No conclusion regarding continuity or resource classification is based on a single high-grade intersection. Representative results in this chapter were selected to demonstrate material program outcomes and include at least one negative or cautionary result where relevant. Complete hole populations, including non-significant intersections, remain part of the project database and resource workflow.
| Contango Silver and Gold – Kitsault Valley Project | Page 103 of 253 |
| Technical Report Summary and updated Mineral Resource Estimate 2026 |
| 8 | SAMPLE PREPARATION, ANALYSES, AND SECURITY |
| 8.1 | Scope and Qualified Person Review |
The QP reviewed the procedures and results for the former Dolly Varden and Homestake Ridge properties, now components of the Kitsault Valley Project (the Project). The QP's review included the prior technical and assessment reports cited in Section 8.11, analytical certificates and dispatch records available for the modern programs, the Dolly Varden QAQC Compilation dated January 30, 2026, and the Homestake Ridge QAQC Compilation dated February 2, 2026. The two workbooks contain annual drill and sample statistics, CRM control charts, blank results, field-duplicate pairs, and interlaboratory check-assay results.
The QP also reviewed the completion status of previously outstanding assays, laboratory independence and accreditation, sample custody and receipt reconciliation, and the inclusion or exclusion of historical data in the mineral-resource database. Based on that review, the QP has replaced the provisional action items in the earlier draft with the determinations and conclusions set out below.
Note: This chapter addresses preparation, analysis, QA/QC and custody of geological samples. Drill methods and sample representativeness are addressed in Chapter 7; database verification is addressed in Chapter 9; metallurgical samples are addressed in Chapter 10; and Appendix A will identify the drill intercepts and analytical records used in the current mineral-resource estimate (MRE). Final cross-references should follow the filed TRS numbering.
| 8.2 | Sample Populations and QA/QC Compilations |
The analytical database includes diamond-drill core, surface rock and soil samples, lithogeochemical samples, density specimens and historical samples collected by several operators. The MRE relies principally on validated drill-core assays. Surface geochemical and portable-XRF results support exploration targeting and geological interpretation and are not treated as substitutes for resource-supporting drill assays.
The QA/QC compilations summarize 519 Dolly Varden holes and 507 Homestake Ridge holes (Table 8-1). Together, they cover approximately 352,010 m of drilling and 150,763 reported samples, with 6,135 CRM insertions, 5,248 blanks, 2,758 field duplicates and 3,513 check-assay determinations. These are workbook compilation totals and include historical programs with different operators, procedures and check-assay objectives.
Table 8-1. QA/QC compilation totals.
| Area | Compiled period | Holes | Metres | Reported samples | CRMs | Blanks | Field duplicates | Checks |
| Dolly Varden | 2011-2025 | 519 | 172,126.4 | 67,706 | 2,664 | 2,134 | 918 | 552 |
| Homestake Ridge | 2002-2025 | 507 | 179,883.9 | 83,057 | 3,471 | 3,114 | 1,840 | 2,961 |
| Combined | 2002-2025 | 1,026 | 352,010.3 | 150,763 | 6,135 | 5,248 | 2,758 | 3,513 |
| 8.3 | Drill Core Handling and Sampling |
Drill core is placed in labelled boxes at the drill, inspected under Company or geological-contractor supervision and transported to the Alice Arm camp. For recent remote programs, core was transported by helicopter in metal baskets. At the secured logging facility, personnel inspect the core; record summary, geological and geotechnical logs; measure recovery and rock-quality designation; mark metre intervals and sample boundaries; attach box and sample tags; collect digital photographs; and enter the information into the project database.
| Contango Silver and Gold – Kitsault Valley Project | Page 104 of 253 |
| Technical Report Summary and updated Mineral Resource Estimate 2026 |
A project geologist selects sample intervals with reference to lithology, alteration, structure, veining and mineralization. Recent procedures generally use nominal one-metre intervals modified at geological contacts, commonly within reported limits of approximately 0.5 m to 2.0 m. Historical Homestake intervals extended to 3 m, while the 2016-2020 Auryn programs generally used continuous two-metre intervals. The QP considered these differences when determining whether each population was suitable for its intended use.
Core is cut longitudinally with a diamond saw. The technician orients the cut so that submitted and retained halves comparably represent visible mineralization. One half is placed in a pre-labelled plastic bag and the other half is returned to the core box as a permanent record. The saw is cleaned between sample intervals. Individual bags are sealed, ordered and checked against the sample log and manifest before being packed into labelled woven rice bags. Remaining core is stored at Alice Arm or, for portions of the historical Homestake collection, in secure storage in Prince Rupert.
8.3.1 Historical Sampling Limitations
Written procedures for some pre-2003 Homestake work are incomplete. Previous reviews dismissed samples whose locations could not be verified and did not use historical trench or underground samples in the MRE. The QP confirmed that historical data not used in the current MRE have been excluded from the resource database. Appendix A will identify the drill intercepts used in the MRE and provide the auditable boundary between accepted and excluded records.
| 8.4 | Sample Security and Chain of Custody |
Modern samples remain under Company or contractor control through drill-site handling, logging, cutting, bagging and dispatch. Individual sample bags and outer rice bags are sealed. Sample identifiers, dates and bag numbers are recorded, and dispatch manifests accompany shipments. Surface samples are returned to camp daily, organized, dried where applicable, catalogued and shipped separately from drill-core samples.
Samples have been transported by helicopter, Company personnel, expeditors and commercial freight carriers to the applicable preparation facility. On receipt, the laboratory logs the shipment into its tracking system and identifies discrepancies or condition issues. The QP reviewed and spot-checked modern custody records for each year from 2011 onward. The QP's checks reconciled dispatch logs to laboratory receipts, including sample counts, bag counts, missing or damaged bags, relabelling, rejects and resubmissions. The spot-checked records reconciled correctly, and the QP identified no unresolved custody exception that would materially affect the validity of the analytical database.
Sample security controls and QP verification procedures are summarized in Table 8-2).
| Contango Silver and Gold – Kitsault Valley Project | Page 105 of 253 |
| Technical Report Summary and updated Mineral Resource Estimate 2026 |
Table 8-2. Sample security controls and QP verification.
| Custody stage | Control | QP determination |
| Drill site to camp | Labelled boxes, supervised transfer and recorded core intervals | Spot checks of modern records completed; no unresolved exception |
| Logging and cutting | Restricted work area, sample tags, digital/sample logs and retained half core | Sample identities and interval sequences reconciled |
| Dispatch | Sealed sample and rice bags, manifests and bag-sequence checks | Dispatch logs reconciled to laboratory receipts |
| Transport | Helicopter/staging, expeditor and commercial freight | Bag counts, missing/damaged bags and relabelling reviewed |
| Laboratory receipt | Computerized receipt, preparation tracking and pulp transfer | Rejects, resubmissions and receipt exceptions reviewed and resolved |
| 8.5 | Laboratories, Preparation and Analytical Methods |
8.5.1 Laboratory Independence and Certification
ALS Canada Ltd. (ALS) is the principal recent laboratory. Preparation facilities reported for the modern database include Terrace, Kamloops, Vancouver and Yellowknife, Canada, with some 2019 preparation in Elko, Nevada. Analytical work was performed principally in Vancouver, British Columbia, with some work in Reno, Nevada. Bureau Veritas Mineral Laboratories (Bureau Veritas) was used for earlier primary assays, lithogeochemistry, check assays and umpire work. Historical work also used Acme Analytical Laboratories Ltd., Eco-Tech Laboratories Ltd., International Plasma Labs Ltd., AGAT Laboratories and Activation Laboratories Ltd.
The QP confirmed the locations and independence from the registrant of the assay laboratories materially supporting the current database. The QP also confirmed that the current laboratories are ISO-certified commercial facilities and that the applicable certifications are current. Historical accreditation was not documented for every early facility; the QP considered that limitation together with the available check assays, control results and database verification when assessing the relevant historical data.
8.5.2 Current 2023–2025 Procedures
The QP confirmed that the sample counts, custody controls, laboratory preparation, analytical suite, over-limit treatment and QA/QC procedures were materially the same for the 2023, 2024 and 2025 programs (Table 8-3). Samples were prepared at ALS, principally at Terrace, by logging and drying the samples, crushing the entire sample to the specified passing size, splitting and pulverizing the analytical portion to the specified fine fraction. Pulps were submitted to ALS analytical facilities for the methods described below.
The primary suite comprised a four-acid digestion followed by multi-element ICP-MS (reported as ME-MS61) and a 30 g gold fire assay with atomic-absorption finish (Au-AA23). Ore-grade silver, copper, lead and zinc were rerun using four-acid digestion with ICP-AES finish (ME-OG62). High-silver samples were rerun by gravimetric fire assay. The QP reconciled the earlier 1,000 ppm versus 1,500 ppm narrative discrepancy and the Ag-GRA21/Ag-GRAV21 notation against the applicable dispatches, certificates and program procedures; the final database reflects the correct program-specific over-limit result and method. These procedures are conventional mineral-industry methods for the commodities and grade ranges reported.
| Contango Silver and Gold – Kitsault Valley Project | Page 106 of 253 |
| Technical Report Summary and updated Mineral Resource Estimate 2026 |
Table 8-3. Summary of drill sample preparation and analytical procedures.
| Program | Laboratory | Reported preparation | Principal analytical procedures |
| 2003-2006 Homestake | Acme; Eco-Tech in 2003 | ~80% passing 10 mesh; ~250 g split; ~85% passing 150 mesh | Au/Ag fire assay with ICP-AES; gravimetric and base-metal over limits; ICP-MS |
| 2007-2008 Homestake | Acme and IPL | ~80% passing 10 mesh; 250 g split; ~90% passing 150 mesh | One-assay-ton fire assay/AA; gravimetric Au over limit; aqua-regia ICP |
| 2009-2012 Homestake | Acme | 1 kg crushed; 500 g split; ~85% passing 150/200 mesh | Au/Ag fire assay/ICP-ES; gravimetric over limits; ICP-MS and base metals |
| 2013 Homestake | ALS | Commercial preparation at Terrace/Vancouver | Au-AA23 and ME-MS61; CRM, blank, field and preparation duplicates |
| 2016-2020 Homestake | ALS | >90% passing 2 mm; 250 g split to >85% passing 75 micrometres | Au fire assay/AAS; Au and Ag over limits; four-acid 48-element ICP-MS |
| 2015-2022 Dolly Varden | Bureau Veritas, then principally ALS | Generally >70% passing 2 mm; split to >85% passing 75 micrometres | Au fire assay/AAS; four-acid ICP-MS; ore-grade and gravimetric over limits |
| 2023-2025 Project | ALS; Bureau Veritas checks | Common current preparation procedure confirmed for all three years | ME-MS61, Au-AA23, ME-OG62 and certificate-specific gravimetric Ag reruns |
| 8.6 | Surface, Lithogeochemical and Density Samples |
Rock samples are generally 1 kg to 2 kg of material placed in heavy plastic bags. Field coordinates, geology, alteration and other observations are recorded, and the sample site is marked. Soil samples are generally collected from the B horizon where available, with depth, slope, sample quality and site observations recorded. Soil samples are dried before shipment. Rock and soil samples are packed and shipped separately.
Recent rock samples were prepared by crushing, splitting and pulverizing under ALS or Bureau Veritas procedures and analyzed using fire-assay, multi-element and ore-grade methods as required. Lithogeochemical samples were prepared for whole-rock major-oxide XRF and trace-element ICP-MS. Portable-XRF work is semi-quantitative exploration information and is not treated as accredited laboratory assay data.
Density specimens were selected at wider spacing in unaltered or unmineralized rock and at closer spacing through altered and mineralized intervals. Intact core pieces were photographed, dried and measured by water immersion using weights in air and water. The QP addresses the use and verification of density data in the resource-estimation and data-verification chapters.
| 8.7 | Quality Assurance and Quality Control |
8.7.1 2023–2025 Control Counts
The current programs inserted CRMs and blanks at approximately one in every 20 routine samples, staggered in the sample stream, and field duplicates at approximately one in every 50 samples. Additional blanks were inserted around high-grade intervals or at the geologist's discretion. The 2023–2025 workbooks summarize 58,881 reported samples and 6,221 routine external controls, comprising 2,554 CRMs, 2,428 blanks and 1,239 field duplicates (Table 8-4, Figure 8-1). Routine controls therefore represent approximately 10.6% of the reported sample count.
| Contango Silver and Gold – Kitsault Valley Project | Page 107 of 253 |
| Technical Report Summary and updated Mineral Resource Estimate 2026 |
Table 8-4. Current program drill and routine control statistics.
| Area | Year | Holes | Metres | Reported samples |
CRMs | Blanks | Field dups |
Routine controls |
Controls
/ samples |
| Dolly Varden | 2023 | 56 | 26,396.81 | 7,595 | 339 | 342 | 157 | 838 | 11.0% |
| Dolly Varden | 2024 | 41 | 15,549.50 | 5,145 | 246 | 111 | 114 | 471 | 9.2% |
| Dolly Varden | 2025 | 50 | 22,889.00 | 12,030 | 482 | 491 | 237 | 1,210 | 10.1% |
| Homestake Ridge | 2023 | 59 | 27,593.40 | 14,654 | 652 | 658 | 326 | 1,636 | 11.2% |
| Homestake Ridge | 2024 | 28 | 16,180.65 | 9,514 | 431 | 426 | 209 | 1,066 | 11.2% |
| Homestake Ridge | 2025 | 32 | 18,011.00 | 9,943 | 404 | 400 | 196 | 1,000 | 10.1% |
| Combined | 2023–2025 | 266 | 126,620.36 | 58,881 | 2,554 | 2,428 | 1,239 | 6,221 | 10.6% |
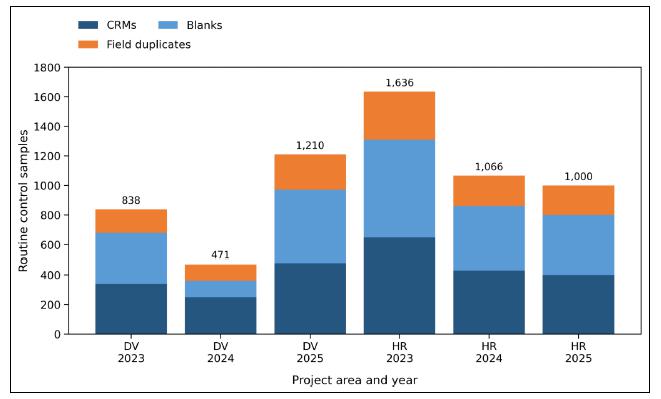
Figure 8-1. Routine certified reference material (CRM), blank and field duplicate counts for the 2023–2025 programs at the Dolly Varden (DV) and Homestake Ridge (HR) properties. Counts are from the summary tabs of the January and February 2026 QA/QC compilations.
| Contango Silver and Gold – Kitsault Valley Project | Page 108 of 253 |
| Technical Report Summary and updated Mineral Resource Estimate 2026 |
8.7.2 Certified Reference Materials
The CRM suite spans silver, gold and base-metal grades relevant to the Project. The QP reviewed the control charts by CRM, analyte, laboratory batch and program year. The charts contain isolated results outside the workbook's ±3 standard-deviation limits and, for some CRMs, method- or analyte-specific patterns (Figure. 8-2). The QP did not treat every isolated excursion as evidence that all results in a batch were invalid. The QP reviewed the applicable certificate, adjacent CRMs and blanks, laboratory internal controls, method suitability and re-assay results.
Where a control failure affected a resource-relevant analyte, the affected batch was investigated and rerun or otherwise resolved before acceptance. The QP accepted data when repeat analysis resolved the failure, surrounding controls and laboratory controls supported the batch, or the excursion concerned an analyte or method for which that CRM was not the acceptance control. Rejected or superseded determinations were not used as final MRE assays. The QP identified no unresolved CRM failure that causes a material systematic bias in the accepted database.
| Contango Silver and Gold – Kitsault Valley Project | Page 109 of 253 |
| Technical Report Summary and updated Mineral Resource Estimate 2026 |
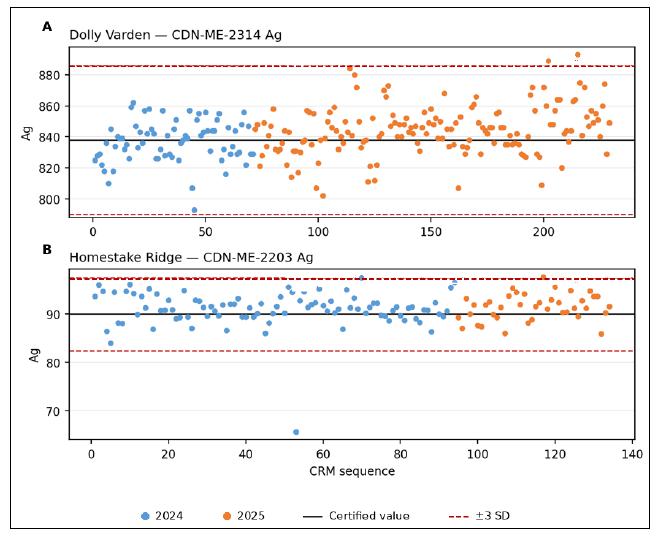
Figure 8-2. Representative silver CRM control charts for (A) CDN-ME-2314 at Dolly Varden and (B) CDN-ME-2203 at Homestake Ridge. The plots show certified values and ±3 standard-deviation limits; isolated excursions were evaluated at the batch level as described in the text.
| Contango Silver and Gold – Kitsault Valley Project | Page 110 of 253 |
| Technical Report Summary and updated Mineral Resource Estimate 2026 |
8.7.3 Blanks and Contamination
The current coarse blank is mafic intrusive material. The QP reviewed blank results in sequence and relative to preceding mineralized samples. The compiled 2023-2025 determination sheets contain 1,074 Dolly Varden and 1,509 Homestake gold determinations, including repeat or resubmitted determinations; routine inserted blank counts are those in Table 8-4. Eleven compiled gold determinations exceeded the 0.015 ppm review line—one in the Dolly Varden compilation and ten in the Homestake compilation (Figure. 8-3). The QP reviewed these isolated exceptions and their associated batches. Corrective work and surrounding controls did not indicate persistent preparation contamination, and no unresolved blank issue materially affects the accepted assay database.
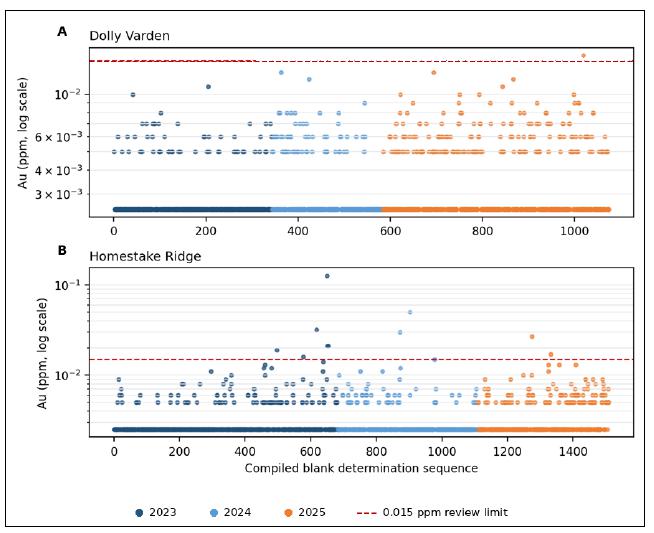
Figure 8-3. Gold results for compiled 2023-2025 mafic-intrusive coarse blanks at (A) Dolly Varden and (B) Homestake Ridge. The plots include repeat or resubmitted determinations and therefore contain more points than the routine insertion counts in Table 8-4. The dashed line is the 0.015 ppm review limit used in the QA/QC compilation.
| Contango Silver and Gold – Kitsault Valley Project | Page 111 of 253 |
| Technical Report Summary and updated Mineral Resource Estimate 2026 |
8.7.4 Field Duplicates
Current field duplicates are one-third-core pairs generated by retaining approximately one third of the core and dividing the remaining material between the original and duplicate samples. The 2023-2025 compilations contain 508 usable Dolly Varden and 731 usable Homestake Ridge silver pairs. Pearson correlations for silver are 0.954 and 0.948, respectively (Figure 8-4). Copper, lead and zinc duplicate correlations are also strong overall; gold precision varies more in low-grade Dolly Varden samples because many results are near detection and because coarse precious-metal mineralization introduces sampling variance.
The QP reviewed the duplicate plots by grade range and did not identify a systematic high or low bias between original and duplicate samples. Scatter increases at low grades and in locally coarse or nuggety mineralization, as expected for field duplicates. The duplicate performance is adequate for the intended geological and resource-estimation uses when considered with CRM, blank, check-assay and geological controls.
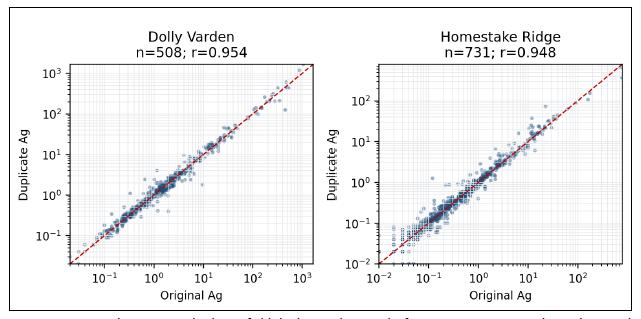
Figure 8-4. Original versus one-third-core field-duplicate silver results for 2023-2025. Axes are logarithmic and the dashed line is the 1:1 relationship.
8.7.5 Check Assays and Re-assays
The workbooks compile interlaboratory and historical check programs. The modern ALS-Bureau Veritas datasets contain 140 paired Dolly Varden samples and 202 paired Homestake Ridge samples. Silver results show very strong agreement, with Pearson correlations of 0.998 and approximately 1.000, respectively (Figure 8-5). The paired copper, lead and zinc results also show strong agreement. The QP evaluated gold checks using method-, unit- and detection-limit-appropriate comparisons because the pooled historical and modern gold fields include different reporting conventions.
The QP reviewed re-assays, over-limit results, rejected determinations and corrective actions in conjunction with the control charts. The final database uses the accepted result after completion of the applicable rerun, over-limit or corrective-action sequence. Superseded results are retained for auditability but are not used as the final MRE assay. The QP found no material between-laboratory bias in the accepted silver or base-metal data.
| Contango Silver and Gold – Kitsault Valley Project | Page 112 of 253 |
| Technical Report Summary and updated Mineral Resource Estimate 2026 |
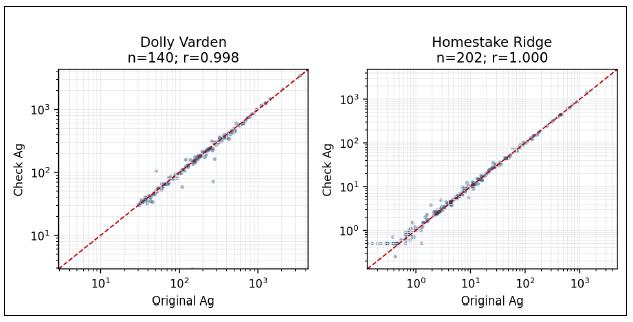
Figure 8-5. Comparison of original ALS assay versus Bureau Veritas check-assay silver results. Axes are logarithmic and the dashed red line is the 1:1 relationship.
| 8.8 | Completion of the 2023 and 2023–2025 Programs |
The February 2023 technical report identified some 2022 assays as outstanding at the time of writing. The QP confirmed that all of those assays were subsequently received, passed the applicable QA/QC review and were loaded correctly into the database. There is no remaining 2022 analytical-completion limitation.
The QP confirmed that the 2023, 2024 and 2025 programs used materially the same sample-handling, custody, preparation, analytical, over-limit and QA/QC procedures described in this chapter. The QP compiled and reviewed the actual control counts, control charts, duplicate and check-assay figures, re-assays, corrective actions, accepted exceptions and final assay status by program. The QP found no unresolved exception that requires exclusion of an otherwise accepted 2023-2025 program from the current database.
| 8.9 | Data Acceptance and Exceptions |
The QP's acceptance review was conducted at the laboratory-batch and program level. A plotted point outside a control line was treated as a review trigger, not automatically as proof that every result in the batch was invalid. The QP considered the CRM's certified analytes and grade range, analytical method, adjacent control samples, blank response, laboratory internal standards, duplicate behavior, preceding sample grade, re-assay or over-limit result and the materiality of the affected analyte to the MRE (Table 8-5).
| Contango Silver and Gold – Kitsault Valley Project | Page 113 of 253 |
| Technical Report Summary and updated Mineral Resource Estimate 2026 |
Table 8-5. QP review and disposition framework.
| Review trigger | QP action | Disposition |
| CRM outside control limits | Review certificate, adjacent controls and method fitness; request rerun where resource-relevant | Accepted only after resolution or supported batch-level justification |
| Elevated blank | Review preceding samples and preparation sequence; reassay affected interval/batch as appropriate | No unresolved systematic contamination identified |
| Duplicate variance | Assess grade, detection limit, mineral texture and pair identity | Accepted where variance is consistent with sampling heterogeneity and no directional bias |
| Check-assay variance | Confirm sample pairing, units, method and detection limits; repeat or exclude mismatched pair | Final accepted result retained; superseded result remains auditable |
| Custody discrepancy | Reconcile dispatch, bag count, receipt, relabelling, reject and resubmission records | No unresolved material custody exception |
| Historical unsupported data | Exclude from current resource database unless specifically validated | Excluded data identified through Appendix A boundary |
| 8.10 | Qualified Person Opinion |
In the QP's opinion, the sample preparation, analytical methods, sample-security measures and QA/QC programs used for the material drill data supporting this TRS are appropriate for the styles of mineralization and commodities at the Project. The current commercial laboratories are independent of the registrant and operate under current ISO-certified quality systems. The analytical procedures relied upon are conventional mineral-industry methods.
The QP has confirmed receipt, QA/QC acceptance and correct database loading of the assays that were outstanding when the February 2023 report was issued. The QP has also confirmed the common 2023-2025 procedures, reviewed annual custody reconciliation from 2011 onward, evaluated the 2023-2025 control results and corrective actions, and confirmed exclusion of unsupported historical data from the MRE database. Isolated control excursions and expected duplicate scatter do not indicate a material systematic analytical bias or unresolved sample-security issue.
Accordingly, the QP considers the accepted sample preparation, security and analytical data adequate for the exploration interpretations and MRE purposes for which they are used in this TRS. This opinion should be read together with the drill-sampling discussion in Chapter 7, the data-verification work in Chapter 9, the resource-estimation discussion, and the accepted drill-intercept population in Appendix A.
| Contango Silver and Gold – Kitsault Valley Project | Page 114 of 253 |
| Technical Report Summary and updated Mineral Resource Estimate 2026 |
| 9 | DATA VERIFICATION |
| 9.1 | Introduction and Scope |
The QP's review was directed to information material to the geological interpretation and MRE, including drillhole collars and downhole surveys; geological, geotechnical and density logging; sample intervals and assay results; analytical quality-control records; laboratory and sample-custody documentation; and the transfer, validation and use of those data in the resource database and geological models. Verification was performed on a representative and risk-based basis and was supplemented by prior QP verification work where the source records and procedures remained relevant.
| 9.2 | Data Sources and Database Environment |
The Project database contains historical and current collar, downhole survey, geological logging, geotechnical, sample interval, assay, density and analytical quality-control information for the former Dolly Varden and Homestake Ridge project areas. Geovia GEMS has served as the principal drilling and assay database through the effective date of this working draft. Controlled comma-separated-value exports are imported into Leapfrog Geo for geological interpretation, project tracking and model review. The QP reviewed the relationship between the source records, the controlled database and the modelling exports to determine whether the data lineage was sufficiently auditable for MRE use (Table 9-1).
The January 30, 2026 Dolly Varden and February 2, 2026 Homestake Ridge QA/QC compilations summarize 1,026 drillholes, approximately 352,010 m of drilling and 150,763 reported samples. Those workbook totals provide the broad verification population; they are not, by themselves, the final MRE assay population. The accepted MRE population is the validated subset identified through the resource database and Appendix A.
Table 9-1. Principal verification evidence reviewed by the QP.
| Evidence category | Information reviewed | Verification purpose |
| Primary database | GEMS collar, survey, interval, geology, assay, density and QA/QC tables | Internal consistency, completeness, relational integrity and export control |
| Original records | Drill logs, survey files, analytical certificates, dispatches and laboratory receipts | Selected comparison to corresponding digital records |
| Physical evidence | Selected drill core, drill sites/collars and core-processing facilities | Comparison of observed location, geology, alteration and mineralization with recorded information |
| QA/QC compilations | Dolly Varden and Homestake Ridge workbooks through 2025 | Control counts, control charts, duplicates, blanks, checks, re-assays and final disposition |
| Prior technical reports | 2015, 2019, 2022 and 2023 technical reports | Historical verification procedures, certificate comparisons and prior QP check sampling |
| Recent operating reports | 2023 Homestake Ridge and 2024 Dolly Varden assessment reports | Current logging, sampling, analytical and database procedures |
| Contango Silver and Gold – Kitsault Valley Project | Page 115 of 253 |
| Technical Report Summary and updated Mineral Resource Estimate 2026 |
| 9.3 | Summary of QP Verification Procedures |
The QP completed or reviewed the procedures summarized in Table 9-2. The source-document selections were intended to test material data pathways and representative drilling populations rather than to duplicate every record in the database. The QP considered both the result of each test and whether exceptions indicated an isolated transcription issue or a systematic condition capable of affecting the MRE.
Table 9-2. QP verification procedures and determinations.
| Verification area | Procedure | QP determination |
| Site inspection | Inspected Project facilities, field procedures, selected drill core and geological records; discussed workflows with Project personnel | Observed procedures and selected records were consistent; no material issue identified |
| Drill logs | Compared original logs for an approximately 10% representative selection of Project drillholes with digital records | No material discrepancy identified in the reviewed population |
| Assay certificates | Compared certificates for an approximately 10% representative selection of drillholes where source certificates were available | No material data-entry error identified in the reviewed population |
| Database validation | Tested interval overlaps, end-of-hole exceedances, missing or inconsistent fields, missing assays and invalid codes | Material validation exceptions were resolved or excluded before MRE use |
| Survey review | Reviewed collar and downhole survey procedures, coordinate reasonableness and anomalous survey records | No material unresolved collar or downhole survey issue identified |
| Custody reconciliation | Spot-checked each modern program year from 2011 onward against dispatch and laboratory receipt records | No unresolved material custody exception identified |
| Analytical QA/QC | Reviewed CRMs, blanks, field duplicates, check assays, re-assays, over-limits and corrective actions | No unresolved systematic bias or contamination issue identified in accepted data |
| Database acceptance | Confirmed final accepted results, superseded-result treatment and exclusion of unsupported historical records | Accepted database considered suitable for the current MRE |
Earlier verification provides additional support. For the Dolly Varden database, prior QPs compared 60 analytical certificates representing approximately 18% of available certificates and approximately 15% of assay intervals reviewed for the 2019 MRE. For Homestake Ridge, prior verification compared approximately 5,000 certificate values, reported as approximately 12% of the then-current database. Prior QP site inspections in 2018, 2022, 2025, and 2026 included collar checks, observation of logging and sampling, and independent check sampling. The current QP reviewed those programs as supporting evidence and did not rely on them as a substitute for the current verification described in this chapter.
| Contango Silver and Gold – Kitsault Valley Project | Page 116 of 253 |
| Technical Report Summary and updated Mineral Resource Estimate 2026 |
| 9.4 | Qualified Person Site Visits |
Table 9-3 outlines in person site visits from prior and current QPs and to what degree the data collection visit was used for.
Table 9-3. Site inspections relevant to data verification.
| Date | QP status | Principal scope | Use in this TRS draft |
| October 1–2, 2018 | Prior QP | Dolly Varden area; field procedures, collars, core and six independent check samples | Completed; supporting historical verification |
| January 20, 2022 | Prior QP | Homestake Ridge area; physiography, historical core and six half-core check samples | Completed; supporting historical verification |
| September 28–29, 2022 | Prior QP | Combined Project; Alice Arm logging/sampling, collars and six check samples | Completed; supporting historical verification |
| September 14, 2025 | Current QP | Active Project operations, procedures, selected core and database discussions | Completed; relied upon in this chapter |
| August 21–24, 2026 | Current QP | Planned follow-up inspection and confirmation of current operations | Completed; relied upon in this chapter |
9.4.1 September 14, 2025, QP Site Visit
The QP visited the Project on September 14, 2025, during active operations. The visit included discussions with Project personnel; observation of core receipt, handling, logging, marking, cutting and sampling activities; review of sample dispatch and database-management procedures; inspection of selected drill core; and comparison of observed lithology, alteration, mineralization and structural characteristics with the corresponding geological records. The QP also reviewed the physical setting of the Project and the relationship of the operating areas to the principal deposits and exploration targets.
The selected geological records reasonably reflected the core inspected by the QP. The observed core-handling, logging, sampling and data-capture procedures were consistent with the written procedures reviewed for the modern programs. The QP identified no material condition during the September 14, 2025, visit that would preclude use of the accepted data for geological interpretation or the current MRE.
9.4.2 July 21–24, 2026, QP Site Visit
A further QP site visit was conducted on July 21–24, 2026. In this visit follow-up inspection of active drilling and core-processing operations, review of any material workflow changes, examination of selected 2026 core and records, and confirmation that the procedures described in Chapters 7 through 9 remain current. The QP identified no material condition during the July 2026 visit that would preclude use of the accepted data for geological interpretation or the current MRE.
| 9.5 | Drillhole Database and Geological Record Verification |
The QP reviewed the controls applied to the principal database tables and modelling exports. Validation tests included intervals extending beyond end-of-hole depth, overlapping intervals, gaps or missing mandatory fields, inconsistent sample intervals, absent or duplicate sample identifiers, missing assays, invalid or non-standard lithology and alteration codes, unreasonable collar coordinates or elevations, and anomalous downhole survey entries. Exceptions were evaluated against source records and were corrected, documented or excluded as appropriate before the data were used for the MRE.
| Contango Silver and Gold – Kitsault Valley Project | Page 117 of 253 |
| Technical Report Summary and updated Mineral Resource Estimate 2026 |
Original drill logs for an approximately 10% representative selection of Project drillholes were compared with corresponding database records, including lithology codes and interval boundaries. The QP also compared selected physical core with recorded lithology, alteration, mineralization and structure. No material transcription issue or systematic coding problem was identified in the reviewed population. Minor interpretive differences typical of geological logging do not materially affect the geological model.
The centralized database, defined data formats and validation queries provide an appropriate framework for the Project. To preserve auditability, the database version used for the MRE, its extraction date, the export files provided to the resource modeller and material post-export changes should be retained together in the MRE archive.
| 9.6 | Collar, Downhole Survey and Spatial Verification |
The QP reviewed collar survey procedures and available collar records. Modern and selected historical collars have been surveyed or resurveyed using differential GPS equipment where applicable, and prior QP site inspections compared selected field positions with database coordinates. The current verification included reasonableness checks for coordinate system, easting, northing, elevation, azimuth, dip and total depth, together with spatial review against topography, drilling patterns and known workings.
The QP reviewed downhole survey procedures and the storage of survey data in the Project database. Validation included checks for missing surveys, duplicate depths, survey stations beyond end-of-hole, implausible azimuth or inclination changes and inconsistent survey sequences. Where a questionable record was identified, the survey was compared with the available source file and adjacent stations before acceptance or correction. The QP identified no unresolved material collar or downhole survey issue affecting the accepted MRE database.
| 9.7 | Assay Database and Analytical QA/QC Verification |
The QP compared selected digital assays with original laboratory certificates where certificates were available and reviewed interval continuity, unit conventions, detection limits, over-limit replacement, resubmissions and the treatment of null, below-detection, rejected and superseded determinations. The QP confirmed that the assays reported as outstanding in the February 2023 technical report were subsequently received, passed the applicable QA/QC review and were loaded correctly into the database. No 2022 analytical-completion limitation remains.
For the 2023, 2024 and 2025 programs, the QP confirmed materially consistent custody, sample preparation, analytical, over-limit and QA/QC procedures. The program workbooks summarize 58,881 reported samples and 6,221 routine external controls, comprising 2,554 CRMs, 2,428 blanks and 1,239 field duplicates. The QP reviewed control charts and batch-level exceptions, including re-assays and corrective actions, and confirmed that the final database contains the accepted result after the applicable resolution sequence.
The 2023-2025 compilations contain 508 usable Dolly Varden and 731 usable Homestake Ridge silver field-duplicate pairs, with Pearson correlations of 0.954 and 0.948, respectively. The modern ALS-Bureau Veritas check datasets contain 140 paired Dolly Varden and 202 paired Homestake Ridge samples; silver correlations are 0.998 and approximately 1.000, respectively. Eleven compiled 2023-2025 gold blank determinations exceeded the 0.015 ppm review line, but review of the associated batches, adjacent controls and corrective work did not indicate persistent preparation contamination. The QP identified no unresolved systematic analytical bias or contamination issue in the accepted data. Detailed QA/QC results and figures are presented in Chapter 8.
| Contango Silver and Gold – Kitsault Valley Project | Page 118 of 253 |
| Technical Report Summary and updated Mineral Resource Estimate 2026 |
| 9.8 | Sample Custody, Laboratory Status and Record Reconciliation |
The QP reviewed and spot-checked custody records for each modern program year from 2011 onward. The checks reconciled dispatch logs to laboratory receipts and included sample counts, bag counts, missing or damaged bags, relabelling, rejects, resubmissions and final receipt status. The spot-checked documentation reconciled correctly, and the QP identified no unresolved custody exception that would materially affect the analytical database.
The QP confirmed the locations and independence from the registrant of the assay laboratories materially supporting the current database and confirmed that the current laboratories operate under current ISO-certified quality systems. Historical accreditation is not documented for every early facility; the QP considered that limitation together with historical check assays, prior verification, database consistency and the current MRE inclusion criteria.
| 9.9 | Historical Data Verification and MRE Inclusion |
Historical records vary in completeness. Some original certificates, drill logs or survey records are unavailable for portions of the early drilling, and certain early data were reconstructed from mine plans, sections or surviving records. Previous technical reports document substantial historical compilation and verification, including source-record comparisons, coordinate checks and independent check assays. The QP reviewed that prior work and considered it together with the current database checks, spatial and grade continuity, retained core where available, and the use or exclusion of each data population in the current MRE.
The QP confirmed that historical data not accepted for the current MRE have been excluded from the resource database used for estimation. Historical trench, underground or drill records that lack adequate support may be retained for exploration context, but they are not treated as MRE assays unless specifically validated and accepted. Appendix A will identify the drill intercepts used in the MRE and provide the auditable boundary between accepted and excluded records.
| 9.10 | Limitations on Data Verification |
The principal limitation is the incomplete availability of original certificates and other primary source records for some historical drilling. This limits direct record-by-record verification of those specific records. The QP mitigated the limitation by reviewing prior verification, comparing available certificates and logs, testing database consistency, examining spatial and grade continuity, reviewing historical check assays and retained core where available, and excluding unsupported records from the MRE database.
The QP's program was representative and risk-based rather than a complete audit of every Project record. The verification therefore provides reasonable assurance regarding material reliability but is not a guarantee that the database contains no immaterial transcription or coding errors. The QP identified no failure to conduct verification and no unresolved limitation that materially impairs use of the accepted database for the current MRE.
| Contango Silver and Gold – Kitsault Valley Project | Page 119 of 253 |
| Technical Report Summary and updated Mineral Resource Estimate 2026 |
| 9.11 | Data-Governance and Continuing Verification Measures |
Table 9-4 summarizes the continuing verification and data-governance measures recommended to maintain database integrity, traceability and auditability for future mineral resource updates.
Table 9-4. Continuing verification and data-governance measures.
| Control area | Measure | Purpose |
| Historical source records | Continue locating, cataloguing and reconciling recovered certificates, logs and survey files | Preserves source-document auditability and may permit validation of additional historical records |
| MRE database freeze | Archive the final GEMS database, extraction date, validation report, export files and checksum/version identifiers | Establishes the exact data population used by the resource modeller |
| Change control | Maintain an auditable change log for material edits, including reason, source, approver and affected records | Supports traceability between verification and estimation |
| Pre-estimation validation | Repeat database, collar, survey, interval, assay and QA/QC validation before each MRE update | Confirms that later drilling and edits have not introduced material exceptions |
| 9.12 | Qualified Person Opinion on Data Adequacy |
In the QP's opinion, the drilling, collar, downhole survey, geological logging, sampling, assay, density and analytical quality-control data accepted for the Kitsault Valley Project MRE were collected, recorded, validated and managed using procedures appropriate for the current stage of Project evaluation. The QP considers the completed verification procedures appropriate for the purposes of this TRS.
The QP identified no material data-entry, survey, logging, sampling, analytical, custody or database-integrity issue that would invalidate use of the accepted Project database for geological interpretation or the 2026 MRE. The incomplete availability of some historical primary records is a recognized limitation, but it does not materially impair the current MRE because the QP considered corroborating verification evidence and confirmed that unsupported historical data were excluded from the estimation database.
Accordingly, the QP considers the accepted data sufficiently reliable for the geological modelling and mineral resource estimation purposes for which they are used in this TRS. This opinion should be read together with the sampling and QA/QC conclusions in Chapters 7 and 8, the resource-estimation validation, and the final accepted drill-intercept population.
| Contango Silver and Gold – Kitsault Valley Project | Page 120 of 253 |
| Technical Report Summary and updated Mineral Resource Estimate 2026 |
| 10 | MINERAL PROCESSING AND METALLURGICAL TESTING |
| 10.1 | Introduction and Scope |
This chapter summarizes mineral processing and metallurgical testing information reviewed for the Kitsault Valley Project and identifies how the available work informs preliminary process concepts, recovery assumptions, processing risks, and additional work requirements. The discussion incorporates prior NI 43-101 technical report summaries, historical metallurgical programs, the 2019 Blue Coast Research Ltd. work on Dolly Varden and Torbrit, the 2026 Fuse Advisors metallurgical sample selection and results presentation, and the 2026 Blue Coast Research Ltd. Wolf and Kitsol metallurgical testwork report.
The available test work is sufficient to demonstrate that the principal mineralized areas tested to date respond to conventional mineral processing methods, principally selective flotation, whole-ore cyanidation, and cyanidation of flotation tails. However, the database remains insufficient by itself for final flowsheet selection, detailed plant design, mineral reserve conversion, or reserve-level recovery estimates. The principal gaps are locked-cycle flotation, comminution variability, geometallurgical variability, leach optimization, environmental characterization, and concentrate marketing.
The most material new work since the prior chapter draft is the 2025/2026 metallurgical program on Wolf and Kitsol composites. This new work materially reduces a prior data gap because the earlier technical reports noted that no recent metallurgical test work had been completed on Wolf or North Star and that the Dolly Varden/Torbrit work did not cover all resource areas. The 2026 program specifically extends the modern test-work basis to Wolf and Kitsol using a scope similar to the 2019 Dolly Varden/Torbrit program.
| 10.2 | Summary of Metallurgical Test Work Programs |
Table 10-1 summarizes the principal metallurgical programs reviewed for this chapter. Additional older work may exist in historical project files; however, the programs below are the principal datasets described in the source technical reports and recent metallurgical work reviewed for this draft.
| Contango Silver and Gold – Kitsault Valley Project | Page 121 of 253 |
| Technical Report Summary and updated Mineral Resource Estimate 2026 |
Table 10-1. Summary of principal metallurgical test work programs. Summarized from Shouldice and Coombs (2016), Middleditch (2019), Hough et al. (2022), Turner and Hough (2023), Fuse Advisors (2026), and Hall (2026a).
| Area / deposits | Laboratory
/ consultant and timing |
Program scope | Disclosure use and key limitations |
| Homestake Main and Homestake Silver domains | Base Metallurgical Laboratories Ltd. (Base Met Labs), Kamloops, British Columbia; 2016 program completed for a prior owner | Gravity concentration, selective sulphide flotation, cleaner flotation, cyanide leaching of selected flotation products, and limited concentrate-quality assays | Prior-owner test work. Useful for preliminary flowsheet definition and risk identification. Not a complete variability program and not sufficient by itself for final flowsheet selection or reserve-level recovery assumptions. |
| Dolly Varden and Torbrit deposits | Blue Coast Research Ltd., Parksville, British Columbia; 2019 program completed for Dolly Varden Silver Corporation | Head assays, QEMSCAN mineralogy, Bond Ball Work Index testing for Torbrit, flotation, whole-ore cyanidation, cyanidation of flotation tails, and gravity-recoverable silver testing | Preliminary modern test work on selected composites. Useful for scoping-level process-response assessment. Additional variability, locked-cycle flotation, leach optimization, environmental, and concentrate-marketing work required. |
| Wolf and Kitsol deposits | Fuse Advisors sample selection work in 2025/2026 and Blue Coast Research Ltd. project PJ-5599, final report dated April 29, 2026 | Composite selection from assay rejects, sample preparation and characterization, TESCAN TIMA mineralogy, bulk and sequential rougher flotation, cleaner flotation, whole-ore cyanidation, and flotation tails cyanidation | New modern test work that materially expands metallurgical coverage to Wolf and Kitsol. Results are positive and support sequential Pb-Zn flotation and cyanidation as process options. The work remains open-circuit and preliminary; locked-cycle, comminution, variability, and concentrate marketing work are required. |
10.2.1 Laboratory Relationship, Quality-System, and Certification Disclosure
The metallurgical laboratories and consultants identified in the source reports are summarized in Table 10-2 below. For an exploration/initial assessment-level TRS, the laboratory identity and general work scope are sufficient to support a preliminary discussion of metallurgical response. For final filing, the QP should confirm and document each laboratory or specialist relationship to the registrant, any relevant certification or accreditation, and any limitations on QA/QC, chain-of-custody, or sample representativeness.
| Contango Silver and Gold – Kitsault Valley Project | Page 122 of 253 |
| Technical Report Summary and updated Mineral Resource Estimate 2026 |
Table 10-2. Metallurgical laboratory and specialist disclosure summary. Prepared from Shouldice and Coombs (2016), Middleditch (2019), Hough et al. (2022), Turner and Hough (2023), Fuse Advisors (2026), and Hall (2026a).
| Laboratory
/ specialist |
Work summarized | Location stated in source |
Relationship
/ independence status for draft |
Certification
/ quality-system status for draft |
| Blue Coast Research Ltd. | 2019 Dolly Varden/Torbrit and 2025/2026 Wolf/Kitsol metallurgical test work, including sample preparation, characterization, flotation, cyanidation, and selected concentrate analyses. | Parksville, British Columbia | Third-party metallurgical testwork laboratory retained for project test work; no ownership interest or affiliation is identified in the source reports reviewed for this draft. | Certification/accreditation status is not stated in the source summaries reviewed. QP/lab confirmation is required before final filing. |
| Base Metallurgical Laboratories Ltd. / Base Met Labs | 2016 Homestake Main and Homestake Silver process development work including flotation, gravity, cyanidation of flotation products, and limited concentrate-quality assays. | Kamloops, British Columbia | Third-party metallurgical testwork laboratory retained for prior-owner test work; no ownership interest or affiliation is identified in the source summaries reviewed for this draft. | Certification/accreditation status is not stated in the source summaries reviewed. QP/lab confirmation is required before final filing. |
| Fuse Advisors | 2026 metallurgical sample selection review, program planning, and summary presentation for Wolf and Kitsol work. | Not applicable / consulting presentation | Technical advisor/consultant role based on the presentation reviewed; relationship, independence, and reliance basis should be confirmed by the issuer and QP. | Not a testing laboratory in the materials reviewed. Certification status is not applicable unless the QP relies on specialist opinions beyond sample selection and program coordination. |
| TESCAN TIMA mineralogical analysis as reported by Blue Coast Research | Mineralogical characterization, modal mineralogy, deportment, grain size, and liberation work for Wolf and Kitsol composites. | Reported within Blue Coast Research work program | Performed as part of the Blue Coast Research testwork package; specific subcontractor or internal laboratory status should be confirmed if material to disclosure. | Quality-system and instrument calibration documentation should be confirmed by the QP if relied upon for final filing. |
| Contango Silver and Gold – Kitsault Valley Project | Page 123 of 253 |
| Technical Report Summary and updated Mineral Resource Estimate 2026 |
| 10.3 | Homestake Area Prior to Metallurgical Test Work |
10.3.1 Program Status and Source
The Homestake metallurgical information summarized in the 2023 Kitsault Valley technical report was extracted from prior technical reports, including Ross and Chamois (2017) and Chamois et al. (2020)and is supported by the 2016 Base Met Labs program. Because the work was completed for previous owners, it should be described as prior test work and used with appropriate qualification regarding data verification, laboratory records, and sample representativeness.
The 2016 program evaluated a hybrid process concept consisting of sulphide flotation followed by cyanide leaching of selected flotation products. The primary objective was to maximize precious metal recovery while producing potentially saleable base-metal concentrates where mineralogy and grade supported that approach.
10.3.2 Composite Samples and Representativeness
The composites appear appropriate for initial process-response testing of the specific mineralization types selected (Table 10-3). The available summaries do not demonstrate that the composites cover all material grade ranges, lithologies, mineralized domains, alteration intensity, oxidation state, or sulphide assemblage variability. Additional variability testing is therefore required before recovery assumptions are applied broadly across the Homestake resource domains.
Table 10-3. Homestake 2016 composite head grades reported from duplicate head cuts. Summarized from Hough et al. (2022) and Turner and Hough (2023).
| Composite | Reported mineralization represented |
Au (g/t) | Ag (g/t) | Representativeness note |
| Main composite | Copper-dominant portion of the Homestake Main deposit | 4.62 | 6 | Represents a specific copper-dominant metallurgical domain; available summaries do not demonstrate full project-scale variability coverage. |
| Silver composite | Higher silver-lead-zinc mineralization | 7.76 | 198 | Materially higher in Ag, Pb, and Zn than the Main composite; represents a distinct metallurgical response that should not be generalized to all Homestake mineralization without additional testing. |
10.3.3 Flowsheet Concepts and Results
For the Main composite, the 2016 test work evaluated sequential recovery of a gravity concentrate, copper concentrate by flotation, gold-bearing pyrite concentrate by flotation, and cyanide leaching of combined copper cleaner tailings and pyrite concentrate. For the Silver composite, the copper stage was replaced with sequential lead, zinc, and gold-bearing pyrite flotation. Tests were completed both with and without gravity concentration. The contrasting process concepts evaluated for the Homestake Main and Homestake Silver composites are compared in Figure 10-1.
| Contango Silver and Gold – Kitsault Valley Project | Page 124 of 253 |
| Technical Report Summary and updated Mineral Resource Estimate 2026 |
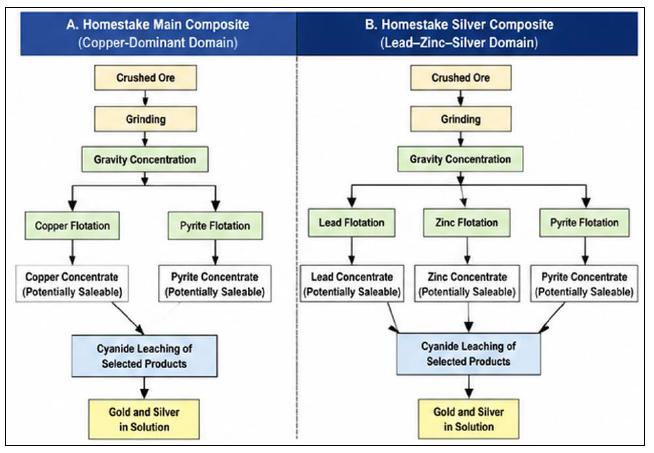
Figure 10-1. Comparison of the 2016 Homestake Main and Homestake Silver metallurgical process concepts.
| · | Gravity concentration recovered approximately 21% of feed gold from the Main composite into a concentrate grading about 83 g/t Au and approximately 28% of feed gold from the Silver composite into a concentrate grading about 249 g/t Au. Gravity was not consistently beneficial to total downstream performance and should be re-evaluated in future integrated testing. |
| · | Main composite rougher flotation achieved approximately 85% to 90% copper recovery at rougher mass recoveries of approximately 6% to 10%. Combined recovery of gold to gravity, copper rougher, and pyrite concentrate was approximately 95% at about 30% mass recovery. Silver recovery to concentrates was approximately 90% at about 30% mass recovery. |
| · | Main composite cleaner flotation recovered approximately 70% of copper to final cleaner concentrate, with concentrate grades up to approximately 28% Cu. Without gravity in the circuit, approximately 50% to 55% of feed gold and 40% to 45% of feed silver were expected to report to final copper concentrate. |
| · | Silver composite rougher flotation recovered up to approximately 80% of lead to the lead rougher concentrate. Gold recovery to all concentrates was approximately 95% at about 20% mass recovery, and silver recovery to all concentrates ranged from approximately 90% to 95% at about 20% mass recovery. |
| · | Silver composite cleaner flotation, without gravity concentration, recovered approximately 65% of lead to a concentrate grading approximately 30% Pb. Gold recovery to final lead concentrate ranged from approximately 66% to 68%, with silver recovery ranging from approximately 23% to 50%. |
| Contango Silver and Gold – Kitsault Valley Project | Page 125 of 253 |
| Technical Report Summary and updated Mineral Resource Estimate 2026 |
| · | Cyanide leaching of pyrite concentrate and cleaner-tailings streams recovered additional precious metals, but the leach tests were limited to 24 hours and kinetics were incomplete, particularly for silver. For the Main composite, leaching without gravity achieved approximately 73% gold extraction and 57% silver extraction. For the Silver composite, average concentrate leach extractions without gravity were approximately 80% gold and 65% silver. |
| · | Limited concentrate assays indicated arsenic, antimony, and mercury at levels that may attract smelter penalties. Additional concentrate generation, multi-element assaying, and marketing review are required. |
| 10.4 | Dolly Varden and Torbrit 2019 Metallurgical Test Work |
10.4.1 Program Status and Source
In January 2019, selected samples from the Torbrit and Dolly Varden deposits were submitted to Blue Coast Research Ltd. in Parksville, British Columbia, for preliminary metallurgical assessment. The program included feed characterization by head assay, QEMSCAN mineralogy, Bond Ball Work Index testing, froth flotation, whole-ore cyanidation, cyanidation of flotation tails, and gravity-recoverable silver testing. Historical development of the Torbrit processing approach, including the transition from cyanidation to flotation, is summarized in Figure 10-2.
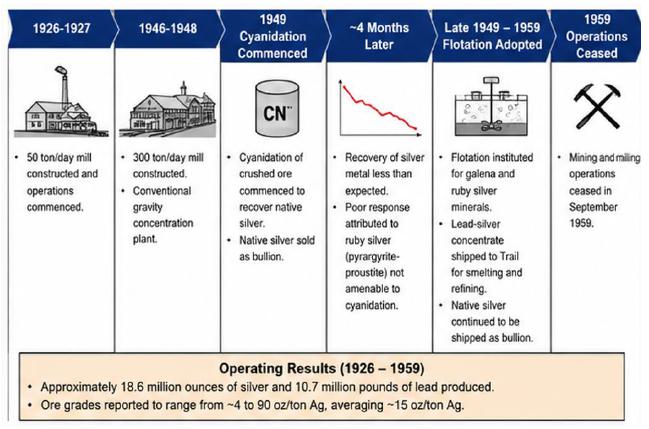
Figure 10-2. Historical development of the Torbrit processing flowsheet, illustrating the transition from cyanidation of native silver to flotation recovery of galena and ruby silver minerals (Turner and McConchie, 1960).
| Contango Silver and Gold – Kitsault Valley Project | Page 126 of 253 |
| Technical Report Summary and updated Mineral Resource Estimate 2026 |
The program was appropriate for evaluating whether the selected mineralization responded to conventional silver-lead-zinc flotation and cyanidation process options. It was not designed as a full variability program and should not be treated as sufficient by itself for final flowsheet selection, detailed plant design, or reserve-level recovery assumptions. The preliminary program proposal and final testwork report are documented by Middleditch (2018, 2019)
10.4.2 Composite Samples, Head Grades, and Mineralogy
The 2019 metallurgical program evaluated separate composites representing the Dolly Varden and Torbrit deposits. Table 10-4 summarizes the head assays for these composites, including their silver, base-metal, iron and total sulfur contents.
Table 10-4. Dolly Varden and Torbrit composite head assays.
| Composite | Cu (%) | Pb (%) | Zn (%) | Fe (%) | Ag (g/t) | Total S (%) |
| Dolly Varden | 0.03 | 0.35 | 1.11 | 8.29 | 347 | 7.67 |
| Torbrit | 0.02 | 0.55 | 0.39 | 4.44 | 290 | 8.23 |
QEMSCAN analysis indicated that lead and zinc were primarily hosted in galena and sphalerite, respectively, while silver occurred as native silver, acanthite, and polybasite. These minerals are generally amenable to conventional froth flotation. At a nominal primary grind size of approximately 120 μm, galena and sphalerite liberation were poor, indicating that finer primary grinding and/or regrinding would likely be required for improved metal recovery and concentrate quality. Historical polished-section images illustrating intergrowths among barite, galena, pyrargyrite, sphalerite, and associated sulphides are presented in Figure 10-3.
| Contango Silver and Gold – Kitsault Valley Project | Page 127 of 253 |
| Technical Report Summary and updated Mineral Resource Estimate 2026 |
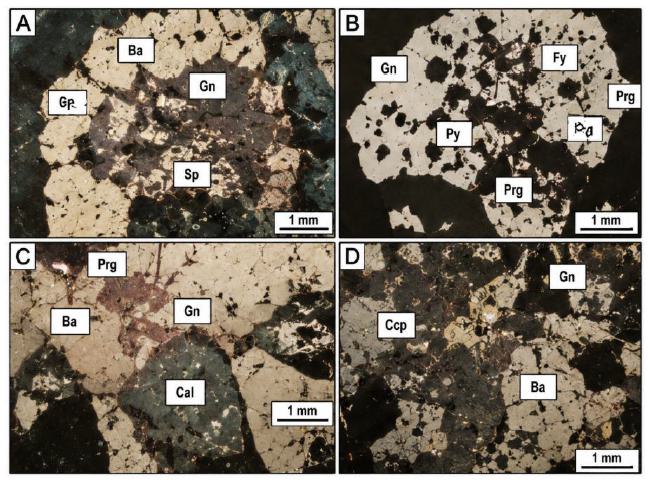
Figure 10-3.
Historical polished-section images from Torbrit showing: (A) crustiform barite–galena–sphalerite mineralization; (B) galena
with inclusions of sphalerite, pyrite, and pyrargyrite; (C) pyrargyrite (ruby silver) replacing galena in calcite–barite gangue;
and (D) chalcopyrite with galena and sphalerite in barite gangue. Mineral abbreviations: Ba = barite; Gn = galena; Sp = sphalerite;
Py = pyrite; Prg = pyrargyrite (ruby silver);
Ccp = chalcopyrite; and Cal = calcite. Images are qualitative and are not representative of quantitative mineralogy. Source: adapted
from Mortensen (1960).
10.4.3 Key Results
| · | Torbrit material was relatively soft based on a single Bond Ball Work Index test, which returned 9.5 kWh/t at a closing size of 106 μm and measured product P80 of 78 μm. |
| · | Torbrit differential flotation was successful in the best test, producing a high-grade lead-silver concentrate grading approximately 58% Pb, 25,000 g/t Ag, and 3% Zn at approximately 76% Pb recovery and 64% Ag recovery. A zinc concentrate grading approximately 36% Zn and 2,700 g/t Ag was produced at approximately 64% zinc recovery and 7% silver recovery, for total silver recovery by flotation of approximately 71%. The simplified differential lead-zinc flotation flowsheet evaluated for Torbrit is shown in Figure 10-4. |
| Contango Silver and Gold – Kitsault Valley Project | Page 128 of 253 |
| Technical Report Summary and updated Mineral Resource Estimate 2026 |
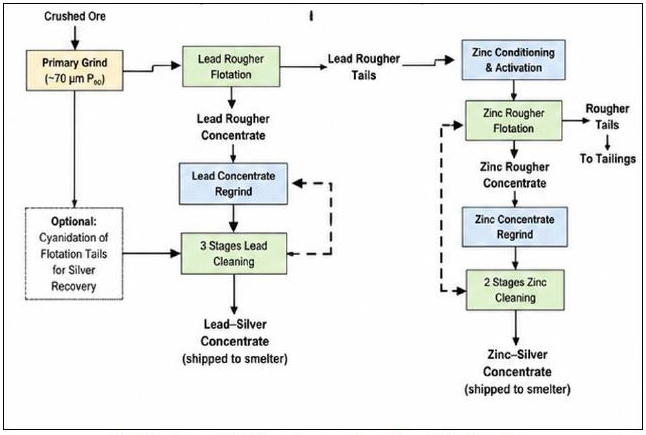
Figure 10-4. Simplified flowsheet modified from the 2019 Torbrit differential lead-zinc flotation program. The flowsheet represents preliminary batch testing and is not a selected process design.
| · | Dolly Varden differential lead-zinc flotation was more challenging due to the higher zinc-to-lead ratio in the feed. The best test produced a bulk concentrate grading approximately 21% Pb, 23% Zn, and 22,000 g/t Ag at recoveries of approximately 59% Pb, 21% Zn, and 65% Ag. The concentrate was high grade in silver but may not attract favorable smelter payment terms without further separation or marketing support. |
| · | Whole-ore cyanidation produced silver extractions ranging from approximately 63% to 86% for the Dolly Varden composite and approximately 54% to 87% for the Torbrit composite. The highest extractions required fine grind sizes, longer retention times, and cyanide consumptions of approximately 7.5 kg/t to 8.0 kg/t. |
| · | Cyanidation of flotation tails recovered approximately 54% of silver from Dolly Varden tails and approximately 59% of silver from Torbrit tails (Table 10-5). Calculated combined silver recoveries were approximately 84% for Dolly Varden and 88% for Torbrit. The whole-ore and flotation-tail silver cyanidation kinetics for the Dolly Varden and Torbrit composites are shown in Figure 10-5. |
| Contango Silver and Gold – Kitsault Valley Project | Page 129 of 253 |
| Technical Report Summary and updated Mineral Resource Estimate 2026 |
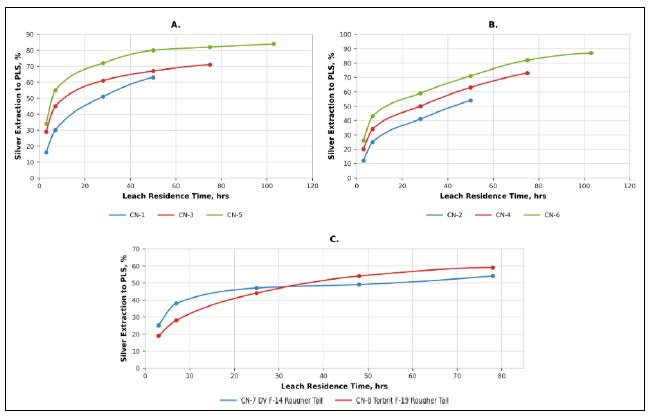
Figure 10-5. Silver cyanidation kinetics for selected Dolly Varden and Torbrit composites. A – Dolly Varden whole-ore cyanidation kinetics; B – Torbrit whole-ore Cyanidation Kinetics; C – Flotation-tail cyanidation kinetics (Dolly Varden and Torbrit). Summarized results of the 2019 Blue Coast Research Ltd. metallurgical test work.
Table 10-5. Preliminary silver recovery estimates from 2019 Dolly Varden and Torbrit test work.
| Zone | Flotation
only - lead concentrate (%) |
Flotation
only - zinc concentrate (%) |
Cyanidation
of flotation tails (%) |
Flotation
+ cyanidation (%) |
Whole-ore cyanidation (%) |
| Dolly Varden | 65 | Not tested | 54 | 84 | 86 |
| Torbrit | 64 | 7 | 59 | 88 | 87 |
Source: Summarized from Turner and Hough (2023) and Middleditch (2019).
| Contango Silver and Gold – Kitsault Valley Project | Page 130 of 253 |
| Technical Report Summary and updated Mineral Resource Estimate 2026 |
Figure 10-6 compares selected silver, lead, and zinc recoveries achieved by process route for the Dolly Varden and Torbrit composites.
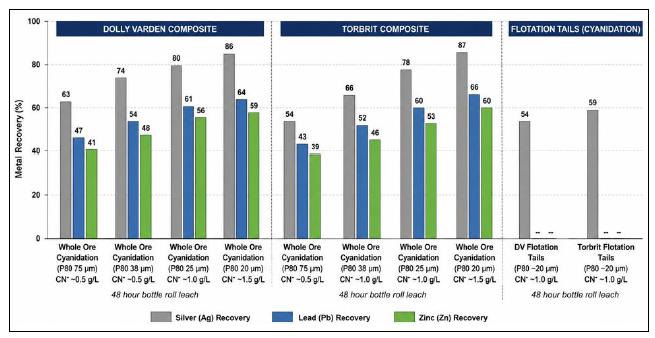
Figure 10-6. Comparative recovery of silver, lead, and zinc by process route and deposit. Recoveries are based on selected composite test work and represent the maximum recoveries achieved under the conditions shown. Whole-ore cyanidation recoveries for Ag, Pb, and Zn were calculated from head assays and leach residues. Flotation-tail cyanidation reports Ag recovery only. Source: Blue Coast Research Ltd. (2019).
| 10.5 | Wolf and Kitsol 2025/2026 Metallurgical Test Work |
10.5.1 Program Objective and Status
Fuse Advisors prepared a metallurgical sample selection presentation for the Kitsault Valley Project dated April 30, 2026. The stated objective was to complete a metallurgical test-work program to better define processing requirements for the Dolly Varden resource, particularly the Wolf and Kitsol deposits, and to ensure that each major Dolly Varden and Homestake Ridge deposit has metallurgical test work sufficient to support a future preliminary economic assessment. The stated test-work focus included mineralogy, comminution, cyanidation, flotation, preliminary flowsheet development, and investigation of antimony as a potential saleable product where warranted.
Blue Coast Research Ltd. was contracted by Dolly Varden Silver, c/o Fuse Advisors, to complete metallurgical test work on two composites from the Kitsault Valley Project. The final Blue Coast Research report, project PJ-5599, is dated April 29, 2026. The program incorporated sample characterization, mineralogy, flotation, whole-ore cyanidation, and flotation tails cyanidation. It was designed at a similar level of scope to the prior Blue Coast Research program completed on Dolly Varden and Torbrit.
| Contango Silver and Gold – Kitsault Valley Project | Page 131 of 253 |
| Technical Report Summary and updated Mineral Resource Estimate 2026 |
10.5.2 Sample Selection and Representativeness
The 2026 sample selection work targeted composite grades broadly aligned with estimated mineral resource grades, with silver as the primary metal and lead and zinc as secondary metals. The sample selection considered Dolly Varden-recommended drill intervals, MRE grade targets, grade trimming to align with target grades, lithology, grain size, and available sample mass. Sample selection was from a combination of 2022-2024 drill holes for Wolf and 2021-2023 drill holes for Kitsol (Table 10-6). Fuse Advisors noted that no suitable drilling had been completed at North Star for metallurgical testing.
Table 10-6. Wolf and Kitsol sample selection summary.
| Composite | Selected
drill intervals / sources |
Approximate
mass selected |
Selection comments |
| Kitsol | DV21274
134.85-146.8 m; DV22291 121.72-132.7 m; DV22298 25.45-40.0 m; DV23336 74-88 m |
Approximately 80 kg selected; Blue Coast sample preparation inventory reports 88.9 kg in the final Kitsol composite | Composite grade was mass-weighted and trimmed to align with a 425 g/t Ag target. Spatial representation was described as acceptable, with a good range of lithology and grain size. Large internal grade swings may indicate potential for ore sorting or pre-concentration. |
| Wolf | DV22300
325.5-354.7 m; DV22320 647.9-661.25 m; DV23375 746.15-777 m; DV24416 662.52-685.66 m; DV24421 757.37-779.06 m |
Approximately 161 kg selected; Blue Coast sample preparation inventory reports 147.7 kg in the final Wolf composite | Composite grade was mass-weighted and trimmed to align with a 400 g/t Ag target. Spatial representation was described as good, with a good range of lithology and grain size. The larger composite mass was retained to preserve grade and lithology variability. |
Source: Summarized from Fuse Advisors (2026) and Hall (2026a).
The selected composites are appropriate for preliminary process-response testing of Wolf and Kitsol material. However, Blue Coast Research stated that its interpretations are based on samples made available by the client and that no assurance can be made on representativeness. Therefore, the composites should not be treated as fully representative of all spatial, mineralogical, lithological, oxidation, and grade variability within the deposits.
10.5.3 Sample Preparation and Head Assays
A total of approximately 230 kg of assay reject material was submitted to Blue Coast Research in Parksville, British Columbia, in October 2025. The samples were inventoried, weighed, stage crushed to 100% passing 6 mesh (3.35 mm), homogenized through a rotary splitter, and split into head assay subsamples and replicate charges for metallurgical testing. Gold was analyzed by fire assay with ICP finish; silver, lead, zinc, and iron by four-acid digest with ICP finish; and total sulphur by combustion IR using an ELTRA carbon-sulphur analyzer. The resulting head assays for the Wolf and Kitsol composites are summarized in Table 10-7.
Table 10-7. Wolf and Kitsol 2026 composite head assays.
| Sample ID | Au (g/t) | Ag (g/t) | Pb (%) | Zn (%) | Fe (%) | Total S (%) |
| Wolf | 0.08 | 397 | 0.60 | 0.78 | 7.35 | 4.46 |
| Kitsol | 0.10 | 387 | 0.38 | 0.32 | 9.65 | 6.04 |
Source: Hall (2026a).
| Contango Silver and Gold – Kitsault Valley Project | Page 132 of 253 |
| Technical Report Summary and updated Mineral Resource Estimate 2026 |
The Wolf composite silver grade was close to the target grade of 400 g/t Ag. The Kitsol composite silver grade was lower than the 425 g/t Ag target but close to the grade predicted during sample selection. Zinc and lead grades for both composites were close to the predicted sample-selection values.
10.5.4 Mineralogy and Liberation
Mineralogical analysis was completed using TESCAN TIMA. Each composite was ground to a target of 75 μm and screened into +75 μm, –75/+38 μm, and –38 μm size fractions. Polished sections were prepared from each fraction. The predominant sulphide minerals were pyrite, sphalerite, and galena. Quartz, feldspar, chlorite, and carbonates were the predominant non-sulphide minerals.
| · | Both sphalerite and galena are fine grained and have low liberation in the +75 μm fraction. This indicates that a coarse primary grind would constrain flotation recovery and concentrate quality. |
| · | Sphalerite and galena grain-size statistics showed P80 values ranging from approximately 28 to 35 μm. |
| · | Zinc deportment was entirely to sphalerite and lead deportment was entirely to galena in the TIMA data. |
| · | Sulphur was overwhelmingly hosted in pyrite. Kitsol was more pyrite-dominant than Wolf, while Wolf showed relatively higher sphalerite content. |
The new mineralogical data support a primary grind near or finer than 75 μm for flotation testing, with regrinding used to improve cleaner concentrate quality.
10.5.5 Floatation Test Work
The flotation program targeted silver, lead, and zinc recovery using both bulk and sequential lead-zinc flowsheet concepts. A total of eight rougher tests and ten cleaner tests were completed. Silver was reported to be strongly associated with lead; therefore, in the sequential flowsheet, silver recovery to the lead concentrate is preferred, although silver may reach payable levels in zinc concentrate.
| · | Bulk rougher flotation at approximately 75 μm P80 produced lower lead, silver, and zinc recoveries than sequential flotation, especially for Kitsol. The bulk flowsheet was not pursued further and is not expected to provide strong concentrate payabilities. |
| · | Sequential rougher flotation achieved better results than the bulk flowsheet. Initial sequential rougher tests showed promising recoveries, generally higher for Wolf than Kitsol. |
| · | A coarser primary grind of approximately 125 μm on Wolf reduced recovery and increased zinc misplacement to the lead rougher concentrate. The coarser grind was not pursued further. |
| · | Testing of a stainless-steel mill on Kitsol was intended to address negative oxidation-reduction potential but adversely affected lead-zinc selectivity and did not improve Pb/Zn/Ag recoveries. The program reverted to mild steel grinding. |
| · | Increasing zinc depressants in the lead circuit reduced zinc misplacement to the lead concentrate. The increased depressant regime was carried forward into cleaner tests. |
| · | Cleaner flotation optimization included increased regrind time, circulation of lead cleaner 1 tails to the zinc cleaner circuit, increased zinc regrind time, and copper sulphate addition in the zinc cleaner circuit. |
| Contango Silver and Gold – Kitsault Valley Project | Page 133 of 253 |
| Technical Report Summary and updated Mineral Resource Estimate 2026 |
Selected final concentrate grades from the optimized open-circuit cleaner tests are summarized in Table 10-8.
Table 10-8. Selected final open-circuit cleaner concentrate grades from 2026 Wolf and Kitsol tests.
| Test ID | Sample ID | Product | Ag (g/t) | Pb (%) | Zn (%) | S (%) |
| F-17 | Wolf | Pb Cln 3 Conc | 29,230 | 51.5 | 5.8 | 22.53 |
| F-17 | Wolf | Zn Cln 3 Conc | 2,912 | 1.7 | 56.0 | 33.48 |
| F-18 | Kitsol | Pb Cln 3 Conc | 42,053 | 56.9 | 2.8 | 18.93 |
| F-18 | Kitsol | Zn Cln 3 Conc | 7,504 | 2.9 | 53.1 | 32.89 |
Source: Hall (2026a).
The corresponding silver, lead and zinc recoveries from these tests are summarized in Table 10-9.
Table 10-9. Selected final open-circuit cleaner flotation recoveries from 2026 Wolf and Kitsol tests.
| Test ID | Sample ID | Product | Ag recovery (%) | Pb recovery (%) | Zn recovery (%) |
| F-17 | Wolf | Pb Cln 3 Conc | 70.5 | 77.7 | 6.6 |
| F-17 | Wolf | Zn Cln 3 Conc | 8.4 | 3.0 | 76.4 |
| F-18 | Kitsol | Pb Cln 3 Conc | 43.2 | 65.5 | 3.5 |
| F-18 | Kitsol | Zn Cln 3 Conc | 4.6 | 2.0 | 39.5 |
Source: Hall (2026a).
The optimized open-circuit cleaner tests achieved final lead and zinc concentrate grades above the target grades used by Blue Coast Research. The Wolf composite showed stronger flotation recovery than Kitsol, especially in zinc recovery. Kitsol may require blending or further optimization if production of a separate zinc concentrate is considered material, because its lower zinc head grade limits zinc units available to the circuit.
Locked-cycle tests were not included in the 2026 test-work program. Accordingly, the cleaner test results should be treated as open-circuit performance indicators and not final metallurgical projections. Locked-cycle testing is required to evaluate circulating-load effects, final concentrate quality, and steady-state recoveries.
10.5.6 Cyanidation Test Work
Eight cyanidation tests were completed on whole ore and flotation tails. Each cyanidation test maintained sodium cyanide concentration at 3.0 g/L, 40% solids, and pH 10.5 to 11 using lime. Kinetic samples were taken at 2, 6, 24, and 48 hours, with 72-hour duration for two extended tests. Table 10-10 summarizes the cyanidation test purposes, reagent consumptions, grind sizes and resulting silver recoveries for the Wolf and Kitsol composites
| Contango Silver and Gold – Kitsault Valley Project | Page 134 of 253 |
| Technical Report Summary and updated Mineral Resource Estimate 2026 |
Table 10-10. Wolf and Kitsol 2026 cyanidation test results.
| Test ID | Composite | Purpose | NaCN consumption (kg/t) |
CaO consumption (kg/t) |
P80 (um) | Ag recovery (%) |
| CN-1 | Wolf | Baseline whole-ore bottle roll | 10.70 | 0.42 | 49 | 81.8 |
| CN-2 | Kitsol | Baseline whole-ore bottle roll | 12.29 | 0.44 | 51 | 83.0 |
| CN-3 | Wolf | Flotation tails cyanidation | 3.89 | 0.21 | 74 | 57.9 |
| CN-4 | Kitsol | Flotation tails cyanidation | 4.96 | 0.27 | 76 | 50.9 |
| CN-5 | Wolf | Pre-aeration, 72-hour leach | 6.81 | 0.85 | 49 | 85.1 |
| CN-6 | Kitsol | Pre-aeration, 72-hour leach | 6.19 | 1.21 | 53 | 79.1 |
| CN-7 | Wolf | Fine grind and pre-aeration | 6.18 | 0.52 | 42 | 82.6 |
| CN-8 | Kitsol | Fine grind and pre-aeration | 6.72 | 0.58 | 44 | 76.1 |
Source: Hall (2026a).
| · | Baseline whole-ore cyanidation at approximately 50 μm P80 recovered approximately 82% Ag from Wolf and 83% Ag from Kitsol. Cyanide consumption was high at approximately 10.7 kg/t for Wolf and 12.3 kg/t for Kitsol. |
| · | Pre-aeration reduced cyanide consumption materially. For Wolf, pre-aeration plus extended leach time increased silver recovery to approximately 85.1% while reducing cyanide consumption to approximately 6.8 kg/t. For Kitsol, pre-aeration reduced cyanide consumption to approximately 6.2 kg/t but silver recovery was approximately 79.1%. |
| · | A finer primary grind near 40 μm did not improve silver recovery for either composite, unlike the behavior previously observed for Dolly Varden and Torbrit. |
| · | Flotation tails cyanidation recovered a moderate amount of residual silver, approximately 57.9% from Wolf flotation tails and 50.9% from Kitsol flotation tails. |
| · | Kitsol and Torbrit appear to have slower silver leach kinetics than Wolf and Dolly Varden, based on the 2026 presentation comparison of leach residence-time curves. |
10.5.7 Concentrate Quality and Deleterious Elements
The final lead and zinc concentrates from tests F-17 and F-18 were submitted for selected assays for deleterious elements (Table 10-11). Sample mass was limited, and not all analyses were performed. The results indicate that future concentrate marketing and penalty-element assessment are material work items.
| Contango Silver and Gold – Kitsault Valley Project | Page 135 of 253 |
| Technical Report Summary and updated Mineral Resource Estimate 2026 |
Table 10-11. Selected deleterious elements in 2026 final cleaner concentrates.
| Test ID | Sample
ID |
Product | Hg (ppm) | Cd (ppm) | Se (ppm) | Sb (ppm) | W (ppm) | Cl (%) | F (%) |
| F-17 | Wolf | Pb Cln 3 Conc | 51 | 1,017 | 414 | 8,996 | 533 | 0.02 | <0.01 |
| F-17 | Wolf | Zn Cln 3 Conc | 23 | 8,522 | 11 | 533 | 5,263 | 0.01 | <0.01 |
| F-18 | Kitsol | Pb Cln 3 Conc | 86 | 659 | 78 | 18,399 | 252 | 0.03 | <0.01 |
| F-18 | Kitsol | Zn Cln 3 Conc | 38 | 8,064 | <10 | 4,827 | 4,872 | – | <0.01 |
Source: Hall (2026a).
The antimony, mercury, cadmium, selenium, tungsten, chlorine, and fluorine results should be considered preliminary because they were generated from limited open-circuit concentrate mass. However, the reported antimony, mercury, cadmium, and tungsten values are sufficiently material that locked-cycle concentrate generation and formal concentrate marketing review should be considered mandatory before any economic assumptions are adopted.
10.5.8 Principal Conclusions from the New Wolf and Kitsol Work
| · | The 2026 program demonstrates that Wolf and Kitsol mineralization responds to conventional sequential Pb-Zn flotation and cyanidation process options. |
| · | Sequential flotation is clearly preferred over bulk flotation for both composites based on rougher recovery and likely concentrate payability. |
| · | A primary grind near 75 μm performed better than a coarser grind of approximately 125 μm. Mineralogy indicates that sphalerite and galena liberation improves at finer sizes, supporting grind-size optimization around the 75 μm range and regrinding of cleaner feeds. |
| · | Open-circuit cleaner testing produced above-target Pb and Zn concentrate grades for both composites. Wolf showed better overall flotation response than Kitsol, especially for zinc recovery. |
| · | Whole-ore cyanidation can achieve approximately 80% silver recovery for both composites, but cyanide consumption is high. Pre-aeration reduces cyanide consumption and should be included in further optimization. |
| · | Flotation tails cyanidation recovers residual silver and may support a combined flotation-plus-leach flowsheet, but integrated locked-cycle flotation and tails leach testing is required. |
| · | Deleterious elements in final concentrates require further evaluation. The new work identifies a clear concentrate-quality and marketing workstream, particularly for Sb, Hg, Cd and W. |
| 10.6 | Processing Implications by Mineralized Area |
10.6.1 Homestake
The Homestake test work indicates that the tested material responds to selective sulphide flotation and cyanide leaching. Homestake Main behaves principally as a copper-gold-silver system, while Homestake Silver behaves more as a lead-zinc-silver-gold system. Potentially high-value precious-metal-bearing copper and lead concentrates were produced in batch tests, but additional work is required to confirm locked-cycle performance, concentrate quality, smelter penalties, and marketability.
| Contango Silver and Gold – Kitsault Valley Project | Page 136 of 253 |
| Technical Report Summary and updated Mineral Resource Estimate 2026 |
10.6.2 Dolly Varden and Torbrit
The 2019 Blue Coast Research program indicates that Dolly Varden and Torbrit respond to conventional metallurgical processes, but their flotation behavior differs materially. Torbrit appears more favorable for differential lead-zinc flotation. Dolly Varden requires additional lead-zinc separation development due to zinc misplacement to the lead or bulk concentrate. Whole-ore cyanidation and flotation plus tailings cyanidation produced encouraging preliminary silver recoveries, but cyanide consumption and environmental management remain important trade-offs.
10.6.3 Wolf and Kitsol
The 2026 Wolf and Kitsol program is the most important new addition to the metallurgical database. Wolf appears to respond well to sequential Pb-Zn flotation, with strong silver deportment to lead concentrate and improved zinc recovery in optimized cleaner testing. Kitsol can produce high-grade lead and zinc concentrates in open-circuit tests, but its lower zinc head grade and lower zinc recovery make zinc concentrate economics more sensitive to blending strategy, payability, penalty terms, and circuit configuration.
For both Wolf and Kitsol, whole-ore cyanidation provides an alternative or complementary recovery path, but high cyanide consumption means that cyanidation should be assessed in an integrated economic and environmental framework rather than as a recovery metric alone. Pre-aeration is a meaningful optimization lever and should be incorporated into future leach testing.
| 10.7 | Material Processing Risks, Deleterious Elements, and Recovery Assumptions |
The following risk discussion is framed for exploration/initial assessment-level use. The recovery values in this chapter are not proposed as final recovery assumptions. They are laboratory-scale indications of metallurgical response and are appropriate for identifying processing opportunities, constraints, and follow-up work. Any economic model that uses these values should clearly identify them as preliminary and subject to change after locked-cycle, variability, comminution, environmental, and marketing work.
The prior and recent metallurgical programs demonstrate that mineralization tested to date can respond to conventional flotation and cyanidation process options. However, the test work also identifies processing risks that should be reflected in recovery assumptions and project risk evaluation.
| · | Sample representativeness: The tested composites represent selected mineralization types and target grades but do not constitute a complete variability database across all relevant deposits and domains. |
| · | Flowsheet maturity: Most flotation results are based on batch and open-circuit tests. Locked-cycle flotation and integrated flotation-leach tests are required to confirm recirculating-load effects, final concentrate quality, and metal deportment. |
| · | Lead-zinc separation: Dolly Varden, Homestake Silver, Wolf, and Kitsol each require additional separation optimization to determine whether separate zinc concentrate production is economically justified under realistic smelter terms. |
| Contango Silver and Gold – Kitsault Valley Project | Page 137 of 253 |
| Technical Report Summary and updated Mineral Resource Estimate 2026 |
| · | Comminution: Only limited Bond Ball Work Index data are available from prior Torbrit testing, and the 2026 Wolf/Kitsol program did not include full grindability test work. JK Drop Weight/SMC, Bond Ball Work Index, and Abrasion Index testing are required for process design. |
| · | Cyanide consumption and leach kinetics: Whole-ore and concentrate cyanidation can achieve encouraging precious-metal extraction, but cyanide consumption and incomplete or variable kinetics are material issues for operating costs, detoxification, permitting, and tailings management. |
| · | Concentrate quality: Arsenic, antimony, mercury, cadmium, selenium, tungsten, chlorine, and fluorine require confirmation using sufficient locked-cycle concentrate mass and appropriate analytical methods. |
| · | Environmental characterization: Cyanidation residues, flotation tailings, sulphide-bearing tailings, WAD cyanide formation, acid rock drainage potential, and metal leaching potential require environmental and geochemical characterization before final process selection. |
| · | Recovery assumptions: Recovery values from batch and open-circuit tests should not be applied as reserve-level assumptions without locked-cycle confirmation, variability testing, and geometallurgical domain support. |
| 10.8 | Adequacy of the Metallurgical Data |
In the opinion of the QP, the metallurgical database is adequate for an exploration/initial assessment-level TRS to describe preliminary processing response and material process risks. It is not adequate for mineral reserve conversion, final plant design, or final project-level recovery projections.
Based on the source summaries and recent reports reviewed for this chapter, the available metallurgical data are adequate to demonstrate preliminary metallurgical response for selected Homestake, Dolly Varden, Torbrit, Wolf, and Kitsol mineralization. The new Wolf and Kitsol test work materially improves the project metallurgical coverage because it adds modern data for deposits that were not covered by the 2019 Blue Coast Research program.
The available metallurgical database is not yet considered sufficient, by itself, to support final flowsheet selection, detailed plant design, mineral reserve conversion, final concentrate marketing assumptions, or reserve-level recovery estimates. Before the metallurgical assumptions are used for reserve-level disclosure or detailed economic analysis, additional confirmatory and variability test work should be completed under an approved metallurgical test plan.
| 10.9 | Recommended Follow-up Work |
The following follow-up work is recommended to advance the metallurgical basis for the Kitsault Valley Project. The work should be organized into phases with budgets and decision points consistent with the overall level of study. The recommended scope should be finalized against the applicable laboratory quotations and proposals (ALS Canada Ltd., 2026; Hall, 2026b)
Phase 1 - Confirmatory and Design-Basis Testing
| · | Develop a geometallurgical composite selection plan covering Homestake Main, Homestake Silver, South Reef, Dolly Varden, Torbrit, Wolf, Kitsol, North Star, and other relevant domains where applicable. |
| · | Complete grindability testing to support comminution design, including JK Drop Weight/SMC, Bond Ball Work Index, and Abrasion Index testing. |
| Contango Silver and Gold – Kitsault Valley Project | Page 138 of 253 |
| Technical Report Summary and updated Mineral Resource Estimate 2026 |
| · | Complete locked-cycle flotation tests on representative composites to validate sequential flotation performance and generate metallurgical projections. |
| · | Generate sufficient final concentrate mass for detailed multi-element concentrate characterization, deleterious-element deportment, and concentrate marketing review. |
| · | Optimize primary grind and regrind sizes for flotation recovery, concentrate grade, liberation, leach response, and energy consumption. |
Phase 2 - Variability and Flowsheet Optimization
| · | Complete variability testing by deposit, lithology, grade range, mineralized domain, alteration intensity, sulphide assemblage, oxidation state, and spatial location. |
| · | Optimize lead-zinc separation, especially for Dolly Varden, Homestake Silver, Wolf, and Kitsol, and determine whether zinc concentrate production has economic value in each domain or requires blending. |
| · | Optimize cyanidation parameters, including grind size, residence time, cyanide concentration, oxygenation, pre-aeration, pH control, lead nitrate or other additives, and detoxification requirements. |
| · | Evaluate combined flotation plus tailings cyanidation under integrated conditions rather than as isolated batch tests. |
| · | Investigate pre-concentration or ore sorting potential where large grade swings exist within mineralized intervals, particularly where indicated by the Kitsol sample selection review. |
Phase 3 - Environmental, Marketing, and Model Integration
| · | Complete environmental characterization of flotation tailings, cyanidation residues, sulphide-bearing materials, WAD cyanide potential, acid rock drainage potential, and metal leaching potential. |
| · | Complete independent concentrate marketing review using locked-cycle concentrate products and realistic payable, penalty, treatment, refining, and freight terms. |
| · | Investigate antimony deportment and the potential for antimony to represent either a saleable product opportunity or a penalty/liability. |
| · | Prepare metallurgical recovery models supported by test work and geometallurgical domains for use in resource optimization, process design, and future economic evaluation. |
| · | Confirm laboratory QA/QC, chain-of-custody, sample storage, and laboratory quality-system information for all test-work programs used to support disclosure. |
| Contango Silver and Gold – Kitsault Valley Project | Page 139 of 253 |
| Technical Report Summary and updated Mineral Resource Estimate 2026 |
| 11 | MINERAL RESOURCE ESTIMATES |
| 11.1 | Introduction and Basis of Estimate |
This chapter presents the 2026 Mineral Resource estimates for the Kitsault Valley Project. The Homestake region comprises Homestake Main, Homestake Silver and South Reef. The Dolly Varden area comprises Wolf, Kitsol, Torbrit, Dolly Varden and North Star. Seven deposits have updated geological and resource models. South Reef is retained as an Inferred Mineral Resource on its preceding estimation and reporting basis.
The Project contains 7.66 Mt of Indicated Mineral Resources with 58.698 Moz Ag and 394.700 koz Au, reported as 89.545 Moz AgEq, and 6.305 Mt of Inferred Mineral Resources with 22.804 Moz Ag and 620.817 koz Au, reported as 64.920 Moz AgEq. Copper, lead and zinc grades and contained quantities are disclosed with individual deposits. The Inferred totals include the carried-forward South Reef estimate. Indicated and Inferred resources are reported separately because their levels of confidence differ.
Dave Larimer is the Qualified Person responsible for the Mineral Resource estimates and this chapter. Mr. Larimer is employed by the Company and is not independent. Sims Resources assisted with geological modeling, statistical evaluation and implementation of the Leapfrog resource models under the QP’s supervision. The QP reviewed and accepted the model inputs, estimation parameters, validation and classification and takes responsibility for the estimates. Qualifications and responsibilities are described in Chapter 2.
The reporting reference point is in-situ mineralized material within the accepted resource domains, above the applicable reporting cut-off and after removal of modeled historical depletion, before mining dilution and mining recovery. Estimated metallurgical recoveries enter the metal-equivalent calculation but are not deductions from the individually reported in-situ contained metals. No Measured Mineral Resources or Mineral Reserves are reported. Mineral Resources are not Mineral Reserves and do not have demonstrated economic viability.
The effective date of the Mineral Resource estimate is September 11th, 2026. The resource databases and supporting information were locked, checked and certified by the QP as of that date. Subsequent model-archive and parameter-export dates are documentation dates and do not change the effective date.
Table 11-1 summarizes the estimation scope. The resource table in Section 11.7 retains the final approved quantities and reporting cut-offs, including South Reef’s separate basis. See Figure 11-1 for deposit location map.
Table 11-1. Deposit scope and reporting basis.
| Region | Deposit | Estimation status | Reporting cut-off |
| Homestake | Homestake Main | Updated 2026 model | 132 g/t AgEq |
| Homestake | Homestake Silver | Updated 2026 model | 132 g/t AgEq |
| Homestake | South Reef | Carried-forward Inferred estimate | 2.0 g/t AuEq |
| Dolly Varden | Wolf | Updated 2026 model | 132 g/t AgEq |
| Dolly Varden | Kitsol | Updated 2026 model | 132 g/t AgEq |
| Dolly Varden | Torbrit | Updated 2026 model | 132 g/t AgEq |
| Dolly Varden | Dolly Varden | Updated 2026 model | 132 g/t AgEq |
| Dolly Varden | North Star | Updated 2026 model | 132 g/t AgEq |
| Contango Silver and Gold – Kitsault Valley Project | Page 140 of 253 |
| Technical Report Summary and updated Mineral Resource Estimate 2026 |
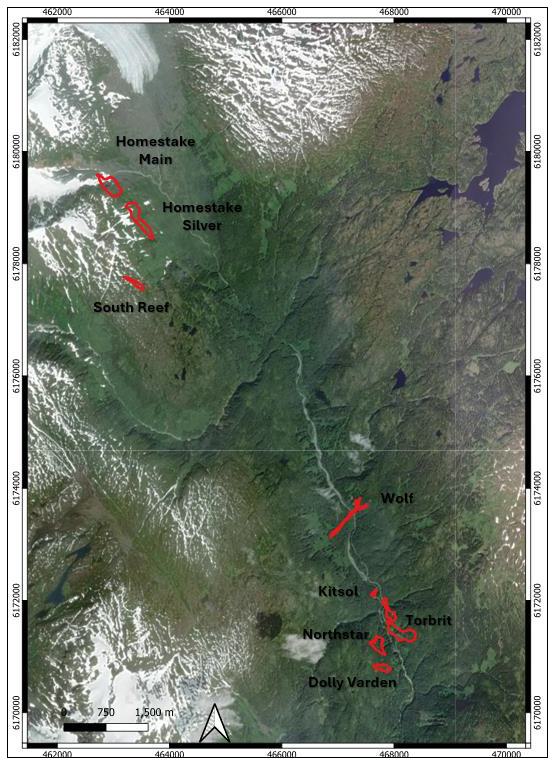
Figure 11-1. Regional location of the Kitsault Valley resource deposits. Red outlines show the resource deposits. Coordinates are NAD83 / UTM Zone 9N, in meters.
| Contango Silver and Gold – Kitsault Valley Project | Page 141 of 253 |
| Technical Report Summary and updated Mineral Resource Estimate 2026 |
| 11.2 | Resource Database and Data Preparation |
The Mineral Resource database comprises drill-hole collar locations, downhole surveys, geological logging, analytical results and bulk-density measurements assembled for the Kitsault Valley Project. The Qualified Person (QP) reviewed and accepted the database for resource estimation, including the consistency of collar and survey information, interval definitions, analytical units, missing or invalid values, and the relationship of samples to the interpreted geological domains. Drilling and sampling procedures are described in Chapter 7, analytical methods and quality control in Chapter 8, and data verification in Chapter 9.
The assay dataset was locked at the start of January 2026 following receipt and incorporation of the results accepted for the estimate. Geological-solid updates and database review continued through March 2026. The resource databases and supporting information were finalized, checked and certified by the QP on April 13th, 2026 and is the database certification date. The final resource statement, classifications and supporting technical and economic assumptions were accepted by the QP as complete and current on September 11, 2026, the Mineral Resource effective date.
The database and resource models use NAD83 / UTM Zone 9N coordinates, with eastings, northings and elevations expressed in meters. The QP verified the coordinate-reference information used for the estimate. Gold and silver in the merged exports are reported in parts per million (ppm), numerically equivalent to grams per tonne (g/t). Gold fields labelled AU_PPM or Au_ppm are already in these units. Copper, lead and zinc are stored in ppm and are divided by 10,000 when expressed as percentages.
The project header inventory contains 1,873 holes totaling 433,933.73 m. Of these, 1,454 holes totaling 328,638.18 m are assigned to the eight resource-reporting deposits; the remaining 419 holes, totaling 105,295.55 m, are assigned to other or unmapped prospects. Table 11-2 summarizes the deposit header inventory and the drilling recorded from each prior resource effective-date year onward. Drilled meters are the full lengths recorded in the header database. The interval populations selected within the geological models are summarized separately in Tables 11-3 and 11-4.
Table 11-2. Drill hole header inventory by deposit.
| Deposit | All holes | All
drilled meters |
Underlying
prior MRE date |
Post-effective- date holes |
Post-effective- date meters |
| Homestake Main | 228 | 57,945.18 | 2019-12-31 | 72 | 25,410.34 |
| Homestake Silver | 151 | 77,712.01 | 2019-12-31 | 90 | 53,530.43 |
| South Reef | 47 | 16,128.51 | 2019-12-31 | 1 | 222.00 |
| Wolf | 231 | 84,465.75 | 2019-05-08 | 117 | 71,308.92 |
| Kitsol | 35 | 10,965.46 | 2019-05-08 | 22 | 7,532.00 |
| Torbrit | 540 | 51,289.11 | 2019-05-08 | 58 | 13,257.68 |
| Dolly Varden | 78 | 12,351.50 | 2019-05-08 | 1 | 390.00 |
| North Star | 144 | 17,780.66 | 2015-05-18 | 10 | 3,834.35 |
| Total | 1,454 | 328,638.18 | Deposit-specific | 371 | 175,485.72 |
| Contango Silver and Gold – Kitsault Valley Project | Page 142 of 253 |
| Technical Report Summary and updated Mineral Resource Estimate 2026 |
The estimation-input inventory was compiled from merged interval tables exported directly from Leapfrog for Homestake Main, Homestake Silver, Wolf, Kitsol, Torbrit, Dolly Varden and North Star. The seven exports contain 24,120 intervals totaling 29,842.13 m from 1,023 distinct hole identifiers. Of these, 23,264 intervals totaling 27,176.00 m, from 947 distinct hole identifiers, contain at least one populated result for Ag, Au, Cu, Pb or Zn. The remaining 856 intervals, totaling 2,666.13 m, have no populated result for these metals. All exported hole identifiers were matched to the project header inventory.
Table 11-3 summarizes analytical coverage by deposit. Each metal has its own input population because analytical coverage varies, particularly in historical southern-deposit data. Interval meterage is calculated from the exported start and end depths.
Table 11-3. Merged interval inventory and analytical coverage by deposit.
| Deposit | Export holes |
Holes
with results |
Ag results |
Au results |
Cu results |
Pb results |
Zn results |
Assayed meters |
| Homestake Main | 176 | 174 | 6,552 | 6,552 | 6,552 | 6,552 | 6,552 | 8,535.30 |
| Homestake Silver | 114 | 114 | 7,429 | 7,429 | 7,429 | 7,429 | 7,429 | 7,950.11 |
| Wolf | 145 | 139 | 2,040 | 1,428 | 1,428 | 1,475 | 1,470 | 1,576.43 |
| Kitsol | 17 | 16 | 377 | 377 | 377 | 377 | 377 | 289.20 |
| Torbrit | 417 | 354 | 5,630 | 1,713 | 1,713 | 1,910 | 1,969 | 7,291.51 |
| Dolly Varden | 54 | 51 | 453 | 358 | 358 | 378 | 378 | 618.10 |
| North Star | 100 | 99 | 783 | 110 | 281 | 401 | 416 | 915.34 |
| Total | 1,023 | 947 | 23,264 | 17,967 | 18,138 | 18,522 | 18,591 | 27,176.00 |
Table 11-4 summarizes analytical coverage within 34 exported geological domains. Domain-level hole counts are not additive because a hole may intersect several domains. Merged tables can split original assay intervals at geological or other table boundaries, so row counts differ from original sample and final composite counts. Geological-model fields define the grouping; secondary vein fields were retained for traceability and were not used as an additional exclusion filter.
| Contango Silver and Gold – Kitsault Valley Project | Page 143 of 253 |
| Technical Report Summary and updated Mineral Resource Estimate 2026 |
Table 11-4. Merged interval analytical coverage by deposit and domain.
| Deposit | Domain | Holes
with results |
Ag results |
Au results |
Cu results |
Pb results |
Zn results |
Assayed meters |
| Homestake Main | FW | 72 | 541 | 541 | 541 | 541 | 541 | 592.54 |
| Homestake Main | HW | 103 | 677 | 677 | 677 | 677 | 677 | 715.73 |
| Homestake Main | LOWGRADE | 174 | 5,173 | 5,173 | 5,173 | 5,173 | 5,173 | 7,093.45 |
| Homestake Main | MIDLENS | 37 | 161 | 161 | 161 | 161 | 161 | 133.58 |
| Homestake Silver | HS1 | 62 | 671 | 671 | 671 | 671 | 671 | 560.34 |
| Homestake Silver | HS2 | 28 | 264 | 264 | 264 | 264 | 264 | 223.43 |
| Homestake Silver | HS3 | 9 | 48 | 48 | 48 | 48 | 48 | 34.15 |
| Homestake Silver | HS4 | 4 | 45 | 45 | 45 | 45 | 45 | 44.14 |
| Homestake Silver | HS5 | 37 | 277 | 277 | 277 | 277 | 277 | 238.45 |
| Homestake Silver | HS6 | 7 | 35 | 35 | 35 | 35 | 35 | 30.78 |
| Homestake Silver | HS7 | 10 | 65 | 65 | 65 | 65 | 65 | 55.86 |
| Homestake Silver | HS8 | 4 | 21 | 21 | 21 | 21 | 21 | 14.61 |
| Homestake Silver | HS9 | 9 | 44 | 44 | 44 | 44 | 44 | 40.31 |
| Homestake Silver | HS10 | 5 | 12 | 12 | 12 | 12 | 12 | 8.73 |
| Homestake Silver | HS11 | 4 | 22 | 22 | 22 | 22 | 22 | 14.63 |
| Homestake Silver | HS12 | 9 | 49 | 49 | 49 | 49 | 49 | 38.81 |
| Homestake Silver | LG_HALO | 114 | 5,876 | 5,876 | 5,876 | 5,876 | 5,876 | 6,645.90 |
| Wolf | Upper veins | 76 | 850 | 238 | 238 | 285 | 280 | 761.14 |
| Wolf | Deep | 63 | 1,190 | 1,190 | 1,190 | 1,190 | 1,190 | 815.29 |
| Kitsol | Kitsol vein | 16 | 377 | 377 | 377 | 377 | 377 | 289.20 |
| Torbrit | TB_A | 265 | 3,761 | 847 | 847 | 969 | 1,030 | 5,082.39 |
| Torbrit | TB_B clip A | 54 | 561 | 106 | 106 | 109 | 109 | 745.84 |
| Torbrit | TB_C clip A | 35 | 286 | 105 | 105 | 126 | 121 | 354.25 |
| Torbrit | TB_D clip A | 30 | 183 | 23 | 23 | 23 | 23 | 245.12 |
| Torbrit | TB_E clip A | 18 | 235 | 85 | 85 | 136 | 139 | 304.08 |
| Torbrit | TB_F | 15 | 192 | 192 | 192 | 192 | 192 | 190.85 |
| Torbrit | TB_G | 14 | 90 | 90 | 90 | 90 | 90 | 69.42 |
| Torbrit | TB_H | 12 | 76 | 76 | 76 | 76 | 76 | 64.19 |
| Torbrit | TB_I | 10 | 115 | 115 | 115 | 115 | 115 | 105.27 |
| Torbrit | TB_J | 6 | 31 | 31 | 31 | 31 | 31 | 23.01 |
| Torbrit | TB_K | 22 | 100 | 43 | 43 | 43 | 43 | 107.10 |
| Dolly Varden | DV_Main | 48 | 384 | 305 | 305 | 318 | 318 | 534.89 |
| Dolly Varden | DV_HW | 12 | 69 | 53 | 53 | 60 | 60 | 83.21 |
| North Star | North Star vein | 99 | 783 | 110 | 281 | 401 | 416 | 915.34 |
| Contango Silver and Gold – Kitsault Valley Project | Page 144 of 253 |
| Technical Report Summary and updated Mineral Resource Estimate 2026 |
The export reconciliation identified no duplicate hole–from–to records, non-positive interval lengths or internal interval overlaps. All exported intervals were retained for the inventory, with missing analytical coverage identified. These checks complement the QP verification in Chapter 9.
South Reef remains a carried-forward Inferred Mineral Resource. Its header inventory appears in Table 11-2. The seven merged exports do not include South Reef; its retained estimation basis is described in Section 11.5.4.
The QP considers the verified database and preparation procedures adequate for resource estimation. Drilling and sample coverage are to be illustrated in Figure 11-2.
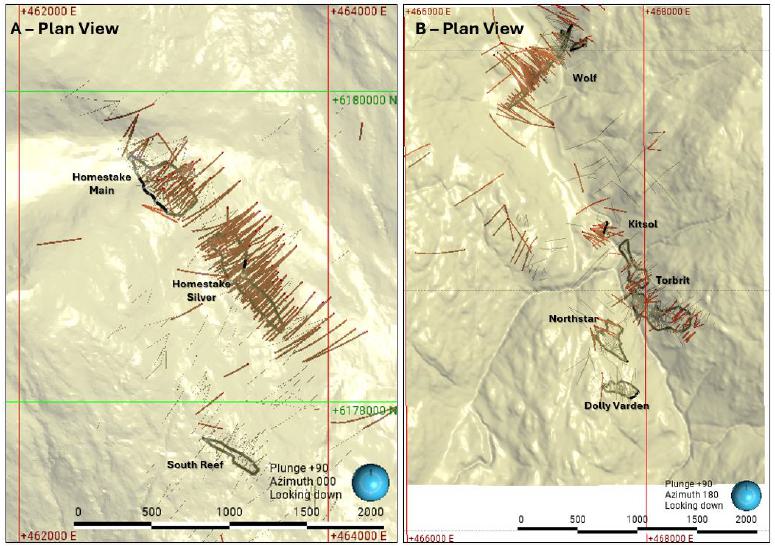
Figure 11-2. Drilling and sample coverage supporting the Mineral Resource estimates. A – Homestake northern region. B – Dolly Varden southern region. Historical drilling in gray with red drill traces representing holes included in this MRE.
11.3 Project-wide Estimation and Reporting Conventions
The seven block models were created in Leapfrog Geo version 2026.1.2, with the resource-estimation functionality provided by the Edge extension. Final Exports are locked and generated on September 11, 2026.
The common workflow comprises geological interpretation, selection of samples within mineralized domains, compositing and high-grade treatment, declustering by domain and element, independent estimation of each metal, evaluation onto sub-blocked models, density assignment, resource classification, depletion where relevant and application of the reporting cut-off. Geological boundaries determine the populations available to an estimator. Search ellipsoids control which eligible samples can inform an estimate. Classification then describes the confidence in that estimate. A block passing a grade cut-off is not a Mineral Resource unless it also meets the geological, spatial and classification requirements.
| Contango Silver and Gold – Kitsault Valley Project | Page 145 of 253 |
| Technical Report Summary and updated Mineral Resource Estimate 2026 |
Block model.
The updated models use 5 × 5 × 5 m parent blocks and minimum sub-blocks of 0.5 × 0.5 × 0.5 m. Sub-blocking represents domain and depletion boundaries more closely; it does not create additional sample support or justify a higher resource category. Block tonnage is the accepted mineralized volume multiplied by the assigned density. Contained precious metal is calculated from tonnes and g/t using 31.1034768 grams per troy ounce. Base-metal reporting uses 2,204.62262 pounds per metric tonne and the stated grade units.
Density Assignment
Bulk-density measurements were obtained from intact drill-core specimens using the Archimedes water-immersion method. Core was weighed in air and submerged in water; density was calculated from the mass in air divided by the difference between the air and submerged masses. The reported BULK_DENS and SG_FIELD values were used in the statistical review, with recalculated densities retained as a quality-control check where both mass measurements were available. Numerically, g/cm³ and t/m³ are equivalent.
The reviewed populations support validation but do not automatically represent the volume-weighted density of the final mineralized domains. Historical and current counts overlap and are not additive. Changes in count are not identified as new measurements without reconciliation of sample identifiers, dates and domain membership. Table 11-5 summarizes the screened density measurements, supporting drill holes, screened mean densities and resource density assignments for each deposit.
Table 11-5. Density measurement support and resource assignments
| Deposit | Screened measurements |
Supporting holes |
Screened
mean (t/m³) |
Resource
density (t/m³) |
| Homestake Main | 926 | 48 | 2.759 | 2.77 |
| Homestake Silver | 2612 | 51 | 2.751 | 2.77 |
| South Reef | 77 | 14 | 2.970 | 3.01 |
| Wolf | 31 | 15 | 2.898 | 2.90 |
| Kitsol | 33 | 11 | 2.890 | 3.00 |
| Torbrit | 389 | 72 | 3.337 | 3.10 |
| Dolly Varden | 156 | 22 | 2.977 | 3.00 |
| North Star | 0 | – | – | 3.00² |
Grade Capping
Capping is selected by element within each domain using the distribution of grades, the influence of extreme values and their geological and spatial context. The current grade-capping worksheet reports the capped input count, cap, number affected, input-metal reduction and resulting statistics. The percentage of records capped is calculated as the number affected divided by the domain count. Its Metal Loss % column is an input-data statistic; it is not the percentage of resource ounces removed by capping. Resource-metal effects require paired evaluations with the same sample selection, interpolation settings, block population, cut-off and depletion constraints. Each deposit capping by domain is described below in their respective section.
| Contango Silver and Gold – Kitsault Valley Project | Page 146 of 253 |
| Technical Report Summary and updated Mineral Resource Estimate 2026 |
Sample Compositing
Target composite lengths of 2.0 m for Homestake Main, Homestake Silver, South Reef, Wolf and Torbrit; 1.25 m for Dolly Varden Main (DV_Main); and 1.5 m for Kitsol and North Star. All deposits used the within boundary (hard boundary) compositing setting with hard domain boundaries. Residual end lengths of less than 1.0 m were distributed equally within the boundary interval. No additional weighting was applied during compositing. These compositing settings are distinct from the deposit-specific interpolation and declustering settings described below.
Interpolation
IDW with power 3 is used in the updated parameter sets. Search directions are either fixed dip/dip-azimuth/pitch values or variable-orientation fields that follow local mineralized geometry. Search limits are not interchangeable with classification thresholds.
Declustering
Declustering was evaluated and applied in every estimator for all deposits used in Leapfrog’s declustering program. Declustering was performed separately within each estimation domain for each element, and the resulting declustering weights were applied in the respective estimators. Declustering during estimation is separate from the compositing procedure, for which no additional weighting was applied. The capping tables report capped arithmetic input statistics, not declustered means.
Classification Distances
The classification calculations for Homestake Main, Homestake Silver, Wolf, Torbrit, Kitsol and North Star use the average distance (AvgD) to samples from dedicated classification estimators, divided by 0.707 (Table 11-6). This is an approximate nominal-spacing indicator derived from idealized sampling geometry, not a direct measurement of actual hole spacing. It is also not an anisotropic distance. The raw AvgD field remains the mean sample-to-block distance in meters. Geological continuity and independent drill-hole support are assessed in addition to the numerical thresholds.

Table 11-6. Selected classification thresholds and raw AvgD equivalents.
| Deposit | Nominal
Indicated limit (m) |
Nominal
Inferred limit (m) |
Raw
AvgD Indicated limit (m) |
Raw
AvgD Inferred limit (m) |
| Homestake Main | 38 | 100 | 26.866 | 70.700 |
| Homestake Silver | 38 | 100 | 26.866 | 70.700 |
| Wolf | 45 | 100 | 31.815 | 70.700 |
| Kitsol | 35 | 70 | 24.745 | 49.490 |
| Torbrit | 35 | 100 | 24.745 | 70.700 |
| North Star | 30 | 70 | 21.210 | 49.490 |
| Dolly Varden | 30 | 70 | 21.210 | 49.490 |
| Contango Silver and Gold – Kitsault Valley Project | Page 147 of 253 |
| Technical Report Summary and updated Mineral Resource Estimate 2026 |
| 11.4 | Economic Basis and Resource Reporting Assumptions |
11.4.1 Conceptual Mining and Processing Scenario
The reporting scenario is potential underground extraction of the mineralized lenses and veins. Mechanized long-hole stoping is a conceptual method where thickness, dip, continuity and rock conditions support it. Narrow or geometrically complex portions may require more selective methods or may not form reportable mining volumes. The resource model is intended to support further engineering evaluation; it is not a mine design or a production schedule.
The processing concept builds on the flotation and leaching test work discussed in Chapter 10. Recovery assumptions distinguish the silver-dominant southern deposits from Homestake Main and Homestake Silver. The inclusion of multiple metals assumes compatible recovery routes and marketable products. Regional recovery factors do not establish that every metal recovery has been demonstrated simultaneously in an integrated circuit or that a common plant has been designed for all deposits.
11.4.2 Commodity Prices and Selection Basis
The QP reviewed and accepted the long-term commodity-price assumptions used in the 2026 resource models. Senior management concurred with the price basis in May 2026. The selected gold and silver prices imply a gross gold-to-silver price ratio of approximately 66:1. The QP considers these prices reasonable for resource evaluation and intended to moderate the elevated spot-price environment at the time the assumptions were established (Table 11-7).
Table 11-7. Commodity prices for the 2026 updated estimates
| Commodity | Assumed price | Price unit |
| Silver | 53.00 | US$/troy oz |
| Gold | 3,500.00 | US$/troy oz |
| Copper | 5.00 | US$/lb |
| Zinc | 1.25 | US$/lb |
| Lead | 0.90 | US$/lb |
11.4.3 Metallurgical Recovery Assumptions
The recovery matrix reflects available metallurgical and geometallurgical information through 2025 and the differing metal associations in the three regional metallurgical groups (Table 11-8). The QP accepted the factors for this resource evaluation. Some non-silver recoveries in the southern area, and Pb and Zn recoveries at Homestake Main, are judgmental proxy assumptions. The Homestake Silver factors are rounded interpretations of available rougher, cleaner and leach results, rather than a single measured whole-feed integrated recovery.
| Contango Silver and Gold – Kitsault Valley Project | Page 148 of 253 |
| Technical Report Summary and updated Mineral Resource Estimate 2026 |
Table 11-8. Recovery factors used in the updated metal-equivalent calculations
| Deposit group | Ag (%) | Au (%) | Cu (%) | Pb (%) | Zn (%) |
| Dolly Varden area | 85 | 75 | 70 | 85 | 80 |
| Homestake Main | 80 | 85 | 65 | 75 | 70 |
| Homestake Silver | 85 | 80 | 65 | 80 | 75 |
The southern Ag assumption of 85% is lower than the 90% used previously. Homestake Main assumptions of 85% Au, 80% Ag and 65% Cu are lower than the earlier 92%, 88% and 87.5% assumptions. The reductions allow for the difference between individual test-stage recoveries and overall recovery through a potential operating circuit. Recovery, payability and marketability are distinct. Further variability testing, concentrate characterization and assessment of treatment charges, refining charges and penalties are required as the Project advances.
11.4.4 Metal Equivalent Formulae
AgEq expresses the estimated metals on a common silver-value basis using their prices and relative metallurgical recoveries. Silver and gold grades are in g/t; copper, lead and zinc grades in the equations below are percentages. Because the equations are normalized to recovered silver value, the Ag coefficient is one. The recoveries are therefore already embedded in the relative coefficients and must not be applied again to those contributions when interpreting the AgEq grade.

For a precious-metal term, the conversion coefficient is the metal price multiplied by its recovery, divided by the silver price multiplied by silver recovery. For a base-metal grade expressed as percent, the conversion also includes 22.0462262 lb per tonne for each 1% grade and 31.1034768 g per troy ounce. If base-metal model fields remain in ppm, they must be divided by 10,000 before applying the coefficients shown above. AgEq is calculated from individual block grades before selection at the reporting cut-off.
The approved South Reef row reports 8.60 Moz AgEq as a retained comparative metric. Its physical tonnage and grades are carried forward at 2.0 g/t AuEq. That 8.60 Moz value has not been presented as the result of applying the 2026 Homestake Silver equation or a 132 g/t AgEq filter to the South Reef block model.
11.4.5 Unit Costs and Cut-off Grade Derivation
The seven updated deposits are reported at 132 g/t AgEq. This reporting threshold is separate from the equivalent-grade conversion. At the adopted prices, 2.0 g/t Au has a gross metal value equivalent to approximately 132.08 g/t Ag. Mineral resources for the updated deposits are reported from three-dimensional block models constrained within underground shapes developed in Leapfrog, using an adopted reporting cut-off of 132 grams per metric ton silver equivalent (g/t AgEq). These shapes delineate spatially continuous mineralization, considered potentially amenable to future mechanized underground mining. Silver-equivalent grades incorporate the adopted metal prices and assume metallurgical recoveries. The grade threshold and underground constraints form part of the assessment of reasonable prospects for economic extraction at the project’s current exploration stage.
| Contango Silver and Gold – Kitsault Valley Project | Page 149 of 253 |
| Technical Report Summary and updated Mineral Resource Estimate 2026 |
11.4.6 Spatial and Technical Constraints on Resource Reporting
The updated resource calculations use mineralized domains, accepted classifications, the AgEq cut-off and mined/unmined coding where applicable.
Historical mine workings are excluded from Torbrit, Dolly Varden and North Star. Cat4 or otherwise unclassified material is excluded from all reported resources, even where its estimated grade exceeds the cut-off. Small, disconnected blocks and narrow unsupported projections are considered in the QP’s spatial review. Mineralized model volumes outside the supported classified resource are not included in the resource statement.
11.4.7 Reasonable Prospects for Economic Extraction
The QP’s assessment of reasonable prospects considers underground access, geometry and continuity, processing options, recovery and marketability, infrastructure, environmental and permitting requirements, and the economic assumptions used to select the reporting cut-off. The established mining district, available regional access and services, historical underground operations in the southern area and metallurgical response provide a basis for continued evaluation. Historical production and prior conceptual studies support the assessment but do not demonstrate the economic viability of the current resources.
In the QP’s opinion, the identified technical issues can be addressed through further drilling, metallurgical testing and engineering evaluation. Permitting, environmental management, access and community-related factors are addressed in the relevant TRS chapters. No mine development decision or Mineral Reserve is established by this Mineral Resource estimate.
| 11.5 | Homestake Region Mineral Resource Estimates |
11.5.1 Regional Overview and Shared Methodology
The Homestake region contains structurally controlled gold-silver mineralization at Homestake Main, Homestake Silver and South Reef. Updated grade-shell and lens interpretations are used for Homestake Main and Homestake Silver. Both employ hard boundaries, capped five-metal inputs, IDW with power 3, 2.77 t/m³ density and 38/100 nominal classification thresholds. Their recovery matrices differ. South Reef is carried forward and retains its original domain densities, classification and AuEq cut-off.
The two updated models require separate consideration of high-grade lenses and broader lower-grade envelopes. Changes in the proportions of those domains can alter tonnage and average grade even where the total drilled mineralized footprint is similar. The geological basis and estimation procedures are described for each deposit below.
11.5.2 Homestake Main
11.5.2.1 Estimation Basis and Input Data
The Homestake Main estimate uses the SRs HS Main Grade Shell GM interpretation and the HS Capped_DGL estimation dataset. The current interpretation incorporates the drilling and geological review completed for the 2026 update. The preceding estimate was accepted with an underlying effective date of January 20, 2022 and was subsequently reviewed in the 2023 combined Kitsault Valley report. The 2026 estimate replaces that estimate for Homestake Main.
| Contango Silver and Gold – Kitsault Valley Project | Page 150 of 253 |
| Technical Report Summary and updated Mineral Resource Estimate 2026 |
The deposit header inventory contains 228 holes totaling 57,945.18 m. Of these, 29 holes totaling 14,024.76 m fall in years after the preceding effective-date year; a further 43 holes totaling 11,385.58 m are in the boundary year. These are inventory counts, with the estimation-input population defined by domain and assay acceptance as described in Section 11.2.
11.5.2.2 Geological Interpretation and Estimation Domains
Mineralization is organized into hanging-wall, footwall and middle lenses within a broader lower-grade envelope (Table 11-9). The modeled system follows a northwest-trending structural corridor and has a sigmoidal geometry with a northwest plunge. Higher-grade lenses are associated with stronger silicification, quartz veining and brecciation, and sulphide development. Broader sericite-pyrite alteration and stockwork veining support the lower-grade envelope. The domains separate populations with different grade distributions and geological continuity. They also prevent the broad low-grade population from diluting the higher-grade lenses during interpolation. The spatial relationships and geometry of the four modeled Homestake Main domains are illustrated in plan, longitudinal and cross-sectional views in Figure 11-3.
Table 11-9. Homestake Main estimation domains.
| Model domain | Geological role |
| HM_2026_FW | Footwall mineralized lens |
| HM_2026_HW | Hanging-wall mineralized lens |
| HM_2026_LOWGRADE | Lower-grade envelope around and between the principal lenses |
| HM_2026_MIDLENS | Middle mineralized lens |
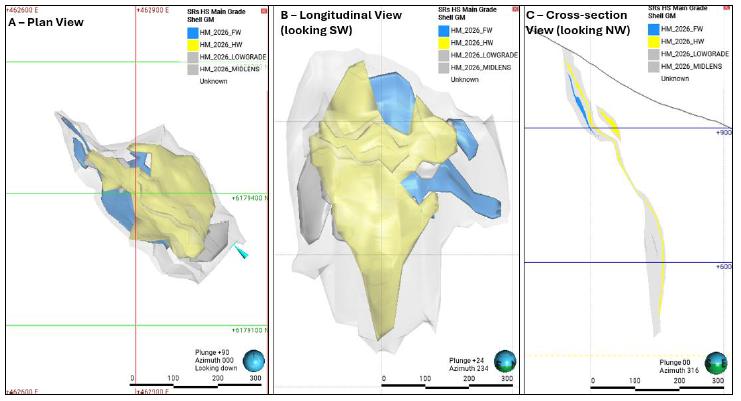
Figure 11-3. Homestake Main geological domains and representative sections. Deposit views of Homestake Main showing the four modeled domains used in this MRE. A – Plan view, B – Longitudinal view (looking SW), C – Cross-sectional view (looking NW).
| Contango Silver and Gold – Kitsault Valley Project | Page 151 of 253 |
| Technical Report Summary and updated Mineral Resource Estimate 2026 |
11.5.2.3 Sample Statistics and Compositing
The domain capping populations comprise 305 records in FW, 361 in HW, 3,569 in LOWGRADE and 73 in MIDLENS for each of the five estimated elements. The 17,610-record parent population includes material outside these four domain populations and is not the count of informing composites within the reported resource domains. Capped mean gold grades are approximately 5.34 g/t in FW, 5.57 g/t in HW, 0.42 g/t in LOWGRADE and 2.89 g/t in MIDLENS. The much larger low-grade population illustrates why a project-wide arithmetic mean is not an appropriate validation target for the higher-grade lenses.
Homestake Main samples were composited to a target length of 2.0 m using the within boundary setting and hard domain boundaries. Residual end lengths of less than 1.0 m were distributed equally within the boundary interval. No additional weighting was applied during compositing. The following capping table reports capped input means and coefficients of variation. The capped arithmetic input statistics are distinct from declustered statistics and volume-weighted block grades.
11.5.2.4 Grade Capping
Gold caps are 70 g/t in FW, 80 g/t in HW, 7 g/t in LOWGRADE and 22 g/t in MIDLENS. Silver caps are 100, 1,750, 70 and 60 g/t, respectively. The caps reflect the different grade distributions within each domain. The MIDLENS silver cap is 60 g/t in the current capping schedule, superseding the 61 g/t example in the initial chapter draft. Gold input-metal reductions range from 9.61% to 22.89%. Base-metal distributions are more sensitive in some domains, particularly MIDLENS, where Pb and Zn input-metal reductions are 77.37% and 89.38%. These large percentages concern small, highly skewed input populations and are not equivalent to percentage reductions in the deposit resource. Table 11-10 reports the caps and capped input statistics for Homestake Main.
| Contango Silver and Gold – Kitsault Valley Project | Page 152 of 253 |
| Technical Report Summary and updated Mineral Resource Estimate 2026 |
Table 11-10. Homestake Main caps and capped input statistics.
| Domain | Metal | Input
N |
Cap | Capped N |
Capped (%) |
Input
metal loss (%) |
Capped mean |
CV |
| FW | Ag | 305 | 100 | 5 | 1.64 | 16.36 | 9.96 | 1.64 |
| HW | Ag | 361 | 1,750 | 6 | 1.66 | 9.01 | 80.09 | 3.25 |
| LOWGRADE | Ag | 3,569 | 70 | 8 | 0.22 | 20.03 | 3.58 | 2.01 |
| MIDLENS | Ag | 73 | 60 | 2 | 2.74 | 1.54 | 6.92 | 1.64 |
| FW | Au | 305 | 70 | 4 | 1.31 | 22.89 | 5.338 | 2.04 |
| HW | Au | 361 | 80 | 3 | 0.83 | 11.12 | 5.573 | 2.13 |
| LOWGRADE | Au | 3,569 | 7 | 7 | 0.20 | 10.18 | 0.416 | 1.61 |
| MIDLENS | Au | 73 | 22 | 2 | 2.74 | 9.61 | 2.888 | 1.39 |
| FW | Cu | 305 | 4,200 | 38 | 12.46 | 29.06 | 955.05 | 1.49 |
| HW | Cu | 361 | 14,000 | 12 | 3.32 | 19.10 | 1,454.69 | 2.27 |
| LOWGRADE | Cu | 3,569 | 7,700 | 20 | 0.56 | 15.73 | 230.57 | 3.68 |
| MIDLENS | Cu | 73 | 5,200 | 7 | 9.59 | 41.68 | 826.07 | 1.94 |
| FW | Pb | 305 | 2,200 | 8 | 2.62 | 28.36 | 284.74 | 1.80 |
| HW | Pb | 361 | 4,900 | 17 | 4.71 | 29.69 | 601.95 | 2.16 |
| LOWGRADE | Pb | 3,569 | 3,200 | 25 | 0.70 | 27.29 | 108.80 | 3.44 |
| MIDLENS | Pb | 73 | 1,000 | 6 | 8.22 | 77.37 | 136.93 | 2.01 |
| FW | Zn | 305 | 3,500 | 19 | 6.23 | 40.32 | 553.54 | 1.74 |
| HW | Zn | 361 | 11,500 | 12 | 3.32 | 20.13 | 1,149.20 | 2.22 |
| LOWGRADE | Zn | 3,569 | 12,000 | 14 | 0.39 | 14.26 | 310.77 | 3.60 |
| MIDLENS | Zn | 73 | 400 | 8 | 10.96 | 89.38 | 141.20 | 0.81 |
11.5.2.5 Bulk Density Assignment
A constant bulk density of 2.77 t/m³ is applied to the four domains. The mineralized-sample review contains 926 measurements from 48 drill holes with an arithmetic mean of 2.759 t/m³. The assignment is approximately 0.4% above that screened mean and is consistent with the earlier mineralized-zone mean of approximately 2.75 t/m³. The QP considers 2.77 t/m³ appropriate for the current estimate. Density should continue to be assessed by final domain because the screened average does not quantify the relative volumes of individual lenses.
11.5.2.6 Block Model Definition
The model is fully sub-blocked, with 116 × 117 × 150 = 2,035,800 nominal parent cells, 5 × 5 × 5 m parent dimensions and minimum 0.5 × 0.5 × 0.5 m sub-blocks. The Leapfrog base point is 462663.5543706773, 6179100.853788124, 1140 m. Its local boundary dimensions are 580, 585, 750 m and its rotation is azimuth 0°, dip 0° and pitch 0°. The reported base-point elevation is the upper Z boundary; the model extends downward from that elevation (Table 11-11).
| Contango Silver and Gold – Kitsault Valley Project | Page 153 of 253 |
| Technical Report Summary and updated Mineral Resource Estimate 2026 |
Table 11-11. Homestake Main global block-model bounds.
| Axis | Minimum (m) | Maximum (m) |
| X / Easting | 462,663.554 | 463,243.554 |
| Y / Northing | 6,179,100.854 | 6,179,685.854 |
| Z / Elevation | 390.000 | 1,140.000 |
11.5.2.7 Grade Interpolation and Estimation Parameters
Ag, Au, Cu, Pb and Zn are estimated independently using inverse-distance cubed weighting within hard boundaries. Variable-orientation fields follow the local geometry of each domain. The grade estimators require 4 to 20 composites and limit contributions to two samples per drill hole. Dedicated classification estimators use three samples with a one-sample-per-hole limit. The classification searches are intentionally broader than the grade searches and provide distance-support information rather than the reported grades. Leapfrog declustering was applied separately by domain and element in every Homestake Main estimator. The variogram sheet contains no fitted variogram parameters; the estimate uses IDW with power 3. Table 11-12 summarizes the search geometries, orientation controls, sample-selection limits and per-hole restrictions applied to the Homestake Main grade and classification estimators.
Table 11-12. Homestake Main search and sample parameters.
| Domain | Metal | Estimator purpose |
Ranges
(m) major × inter. × minor |
Orientation | Samples min–max |
Max
per hole |
| FW | Ag | Classification | 150 × 75 × 50 | VO | 3–3 | 1 |
| HW | Ag | Classification | 200 × 100 × 75 | VO | 3–3 | 1 |
| LOWGRADE | Ag | Classification | 150 × 75 × 50 | VO | 3–3 | 1 |
| MIDLENS | Ag | Classification | 150 × 75 × 50 | VO | 3–3 | 1 |
| FW | Ag/Au/Cu/Pb/Zn | Grade | 72 × 43.2 × 14.4 | VO | 4–20 | 2 |
| HW | Ag/Au/Cu/Pb/Zn | Grade | 80 × 48 × 16 | VO | 4–20 | 2 |
| LOWGRADE | Ag/Au/Cu/Pb/Zn | Grade | 80 × 48 × 16 | VO | 4–20 | 2 |
| MIDLENS | Ag/Au/Cu/Pb/Zn | Grade | 72 × 43.2 × 14.4 | VO | 4–20 | 2 |
Source: parameters Homestake Main.xlsx, Search and Interpolant. All listed current estimators are IDW, power 3. VO = variable orientation; fixed values are dip / dip azimuth / pitch in degrees. Per-sector drill-hole-limit option is enabled.
11.5.2.8 Model Validation
Validation focused on separation of the higher-grade lenses from the lower-grade envelope, the influence of high-grade gold and silver observations, and continuity through the sigmoidal structure. The QP reviewed the geological coding, capped input distributions, block grades and classification volumes and considered the model suitable for resource reporting at the assigned confidence levels. The different silver response of the hanging-wall lens and the lower silver grades in FW and MIDLENS require domain-based validation. In particular, the high base-metal capping losses in MIDLENS should be interpreted alongside its small contribution to reported tonnage and metal.
| Contango Silver and Gold – Kitsault Valley Project | Page 154 of 253 |
| Technical Report Summary and updated Mineral Resource Estimate 2026 |
11.5.2.9 Mineral Resource Classification
The QP selected nominal spacing thresholds of 38 m for Indicated and 100 m for Inferred, applied to the dedicated classification AvgD divided by 0.707. These correspond to raw AvgD limits of 26.866 m and 70.700 m. Classification also considers the continuity of each lens, the spatial distribution of the informing holes and the coherence of classified volumes. Inferred material is principally the continuation of established domains into areas with less direct drilling support. The QP expects that the majority of this material could be upgraded through appropriately located infill drilling, subject to confirmation of the interpreted lens geometry and grade continuity.
In the classification review model, reducing the Indicated threshold from 38 to 35 m transferred approximately 173,061 t and 2.566 Moz AgEq from Indicated to Inferred. Increasing it from 38 to 42 m transferred approximately 180,274 t and 2.562 Moz AgEq in the opposite direction. Reducing the Inferred threshold from 100 to 75 m left the Indicated inventory unchanged and removed approximately 14,081 t and 0.086 Moz AgEq from the classified inventory. These tests support the selected confidence boundary when read with the spatial review. The resulting Indicated and Inferred classification geometry for Homestake Main is shown in plan, longitudinal and cross-sectional views in Figure 11-4.
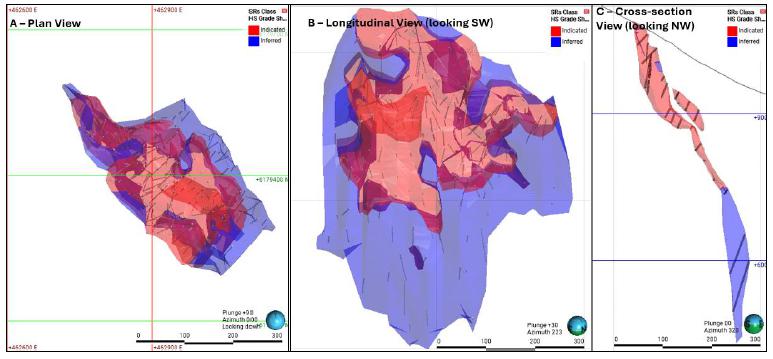
Figure 11-4. Homestake Main Resource Classification geometry: A – Plan view, B – Longitudinal view (looking SW), C – Cross-sectional view looking NW. Red solid represents Indicated classification and blue Inferred classification.
11.5.2.10 Depletion, Exclusions and Reporting Constraints
No historical production depletion is applied to the Homestake Main resource. Reporting is limited to classified mineralization within the accepted domain model and above the 132 g/t AgEq cut-off. The lower-grade envelope contributes resources only where the estimated block grades satisfy the reporting cut-off and the QP accepts their spatial continuity. Geological inclusion within LOWGRADE alone is insufficient for resource reporting.
| Contango Silver and Gold – Kitsault Valley Project | Page 155 of 253 |
| Technical Report Summary and updated Mineral Resource Estimate 2026 |
11.5.2.11 Deposit Mineral Resource Statement
The final estimate contains more Indicated material and less Inferred material than the preceding estimate (Table 11-13 and 11-14). Indicated gold grade decreases from 7.02 to 6.35 g/t, while Indicated gold content increases from 166,000 to 292,009 oz. Inferred gold content decreases from 355,600 to 77,211 oz. These changes reflect the combined effects of the new geological interpretation, additional data, capping, interpolation, classification and reporting assumptions. They cannot be represented as a measured one-for-one conversion of the previous Inferred blocks to Indicated.
Table 11-13. Homestake Main Mineral Resource grades.
| Category | Tonnes (Mt) |
Ag (g/t) |
Au (g/t) |
Cu (%) |
Pb (%) |
Zn (%) |
| Indicated | 1.43 | 49.55 | 6.350 | 0.181 | 0.058 | 0.112 |
| Inferred | 0.52 | 11.09 | 4.610 | 0.143 | 0.056 | 0.127 |
Table 11-14. Homestake Main contained metals.
| Category | Ag (Moz) |
Au (koz) |
Cu (Mlb) |
Pb (Mlb) |
Zn (Mlb) |
AgEq (Moz) |
| Indicated | 2.277 | 292.009 | 5.71 | 1.83 | 3.53 | 23.308 |
| Inferred | 0.186 | 77.211 | 1.64 | 0.64 | 1.46 | 5.770 |
11.5.3 Homestake Silver
11.5.3.1 Estimation Bias and Input Data
The Homestake Silver estimate uses the SRs HS Silver GM 2026 geological model and the HS Silver Capped DGL estimation dataset. It replaces the estimate with an underlying effective date of January 20, 2022 that was reviewed in the 2023 combined report. The current model reports an Indicated population in addition to Inferred resources, whereas the preceding Homestake Silver resource was entirely Inferred.
The deposit header inventory contains 151 holes totaling 77,712.01 m. Of these, 78 holes totaling 47,061.43 m fall in years after the preceding effective-date year; a further 12 holes totaling 6,469.00 m are in the boundary year. These are inventory counts, with the estimation-input population defined by domain and assay acceptance as described in Section 11.2.
11.5.3.2 Geological Interpretation and Estimation Domains
The deposit consists of a steep, structurally controlled mineralized corridor containing twelve numbered lenses and a surrounding lower-grade halo (Table 11-15, Figure 11-5). The higher-grade lenses and halo are modeled separately to respect their different geological controls and grade distributions. The 2026 lens arrangement is more detailed than the nine high-grade lenses described for the preceding model. Fixed and variable search orientations are used according to local lens geometry. The modeling thresholds that define the lenses and halo are geological guides and are distinct from the 132 g/t AgEq reporting cut-off.
| Contango Silver and Gold – Kitsault Valley Project | Page 156 of 253 |
| Technical Report Summary and updated Mineral Resource Estimate 2026 |
Table 11-15. Homestake Silver estimation domains.
| Model domain | Geological role |
| HS1 | Mineralized lens 1 |
| HS2 | Mineralized lens 2 |
| HS3 | Mineralized lens 3 |
| HS4 | Mineralized lens 4 |
| HS5 | Mineralized lens 5 |
| HS6 | Mineralized lens 6 |
| HS7 | Mineralized lens 7 |
| HS8 | Mineralized lens 8 |
| HS9 | Mineralized lens 9 |
| HS10 | Mineralized lens 10 |
| HS11 | Mineralized lens 11 |
| HS12 | Mineralized lens 12 |
| LG_HALO | Lower-grade envelope associated with the lens system |
Source: current parameter and model rollup files; descriptive geological context from the initial Chapter 11 draft and the accepted interpretation.
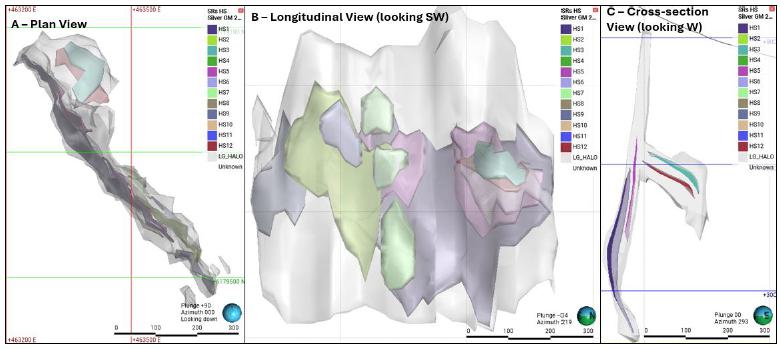
Figure 11-5. Homestake Silver domain geometry and representative sections showing the 13 modeled domains. A – Plan view, B – Longitudinal view (looking southwest), C – Cross-sectional view looking west.
| Contango Silver and Gold – Kitsault Valley Project | Page 157 of 253 |
| Technical Report Summary and updated Mineral Resource Estimate 2026 |
11.5.3.3 Sample Statistics and Compositing
The thirteen domain populations contain 4,118 capping-input records for each of the five elements. LG_HALO accounts for 3,330 records, while individual lens populations range from six records in HS10 to 283 in HS1. Small populations in several lenses limit the stability of distribution statistics and are an important source of uncertainty. Capped mean grades and coefficients of variation are reported with the capping schedule. They characterize the prepared input populations and are not tonnage-weighted resource grades.
Homestake Silver samples were composited to a target length of 2.0 m using the Within boundary setting and hard domain boundaries. Residual end lengths of less than 1.0 m were distributed equally within the boundary interval. No additional weighting was applied during compositing. The following capping table reports capped input means and coefficients of variation. The capped arithmetic input statistics are distinct from declustered statistics and volume-weighted block grades.
11.5.3.4 Grade Capping
Grade caps are assigned separately by element and lens (Table 11-16). Silver caps range from 7 g/t in HS4 to 2,270 g/t in HS2, with 405 g/t applied to LG_HALO. Gold caps range from 0.463 g/t in HS3 to 37 g/t in HS1, with 12.7 g/t in LG_HALO. Several small lens populations have substantial input-metal reductions: Au decreases by 84.04% in HS3 and 82.96% in HS12, and Ag by 51.46% in HS9. These results reflect the influence of a small number of extreme observations. The QP has retained the domain-specific caps to control extrapolation of those values, with the geological and spatial evidence considered alongside the statistics.
| Contango Silver and Gold – Kitsault Valley Project | Page 158 of 253 |
| Technical Report Summary and updated Mineral Resource Estimate 2026 |
Table 11-16. Homestake Silver caps and capped input statistics.
| Domain | Metal | Input N |
Cap | Capped N |
Capped (%) |
Input
metal loss (%) |
Capped mean |
CV |
| HS1 | Ag | 283 | 350 | 5 | 1.77 | 9.82 | 23.17 | 2.53 |
| HS2 | Ag | 116 | 2,270 | 4 | 3.45 | 9.86 | 239.22 | 1.99 |
| HS3 | Ag | 19 | 350 | 4 | 21.05 | 9.59 | 178.79 | 0.73 |
| HS4 | Ag | 22 | 7 | 3 | 13.64 | 10.78 | 3.17 | 0.69 |
| HS5 | Ag | 121 | 300 | 3 | 2.48 | 5.18 | 40.48 | 1.68 |
| HS6 | Ag | 17 | 266 | 3 | 17.65 | 44.35 | 69.04 | 1.37 |
| HS7 | Ag | 29 | 183 | 4 | 13.79 | 36.87 | 79.14 | 0.79 |
| HS8 | Ag | 7 | 174 | 3 | 42.86 | 5.60 | 104.46 | 0.67 |
| HS9 | Ag | 20 | 269 | 7 | 35.00 | 51.46 | 155.34 | 0.66 |
| HS10 | Ag | 6 | 108 | 2 | 33.33 | 22.97 | 68.31 | 0.57 |
| HS11 | Ag | 7 | 20.2 | 2 | 28.57 | 16.15 | 15.60 | 0.35 |
| HS12 | Ag | 21 | 250 | 3 | 14.29 | 8.86 | 62.71 | 1.38 |
| LG_HALO | Ag | 3,330 | 405 | 12 | 0.36 | 10.99 | 14.80 | 2.59 |
| HS1 | Au | 283 | 37 | 6 | 2.12 | 24.96 | 3.907 | 1.61 |
| HS2 | Au | 116 | 18 | 7 | 6.03 | 15.32 | 3.770 | 1.28 |
| HS3 | Au | 19 | 0.463 | 5 | 26.32 | 84.04 | 0.221 | 0.84 |
| HS4 | Au | 22 | 3.74 | 4 | 18.18 | 13.17 | 2.315 | 0.46 |
| HS5 | Au | 121 | 22.6 | 5 | 4.13 | 14.06 | 4.293 | 1.30 |
| HS6 | Au | 17 | 2.29 | 4 | 23.53 | 53.01 | 1.291 | 0.50 |
| HS7 | Au | 29 | 8.37 | 3 | 10.34 | 48.34 | 1.819 | 1.32 |
| HS8 | Au | 7 | 1.66 | 2 | 28.57 | 1.74 | 1.078 | 0.44 |
| HS9 | Au | 20 | 4.39 | 2 | 10.00 | 9.54 | 1.081 | 1.21 |
| HS10 | Au | 6 | 12.1 | 2 | 33.33 | 18.64 | 6.994 | 0.59 |
| HS11 | Au | 7 | 1.85 | 1 | 14.29 | 0.62 | 1.404 | 0.16 |
| HS12 | Au | 21 | 27.3 | 2 | 9.52 | 82.96 | 5.174 | 1.56 |
| LG_HALO | Au | 3,330 | 12.7 | 9 | 0.27 | 11.51 | 0.359 | 2.55 |
| HS1 | Cu | 283 | 2,390 | 6 | 2.12 | 2.48 | 347.92 | 1.53 |
| HS2 | Cu | 116 | 2,430 | 3 | 2.59 | 3.14 | 366.76 | 1.45 |
| HS3 | Cu | 19 | 210 | 4 | 21.05 | 26.55 | 109.61 | 0.64 |
| HS4 | Cu | 22 | 297 | 4 | 18.18 | 5.81 | 141.45 | 0.71 |
| HS5 | Cu | 121 | 1,600 | 5 | 4.13 | 5.41 | 271.19 | 1.50 |
| HS6 | Cu | 17 | 389 | 2 | 11.76 | 13.97 | 88.34 | 1.37 |
| HS7 | Cu | 29 | 1,310 | 5 | 17.24 | 19.75 | 376.95 | 1.24 |
| Contango Silver and Gold – Kitsault Valley Project | Page 159 of 253 |
| Technical Report Summary and updated Mineral Resource Estimate 2026 |
| Domain | Metal | Input N |
Cap | Capped N |
Capped (%) |
Input
metal loss (%) |
Capped mean |
CV |
| HS8 | Cu | 7 | 148 | 2 | 28.57 | 2.74 | 87.44 | 0.55 |
| HS9 | Cu | 20 | 380 | 2 | 10.00 | 33.45 | 147.15 | 0.79 |
| HS10 | Cu | 6 | 195 | 2 | 33.33 | 9.13 | 116.53 | 0.56 |
| HS11 | Cu | 7 | 1,540 | 2 | 28.57 | 22.44 | 674.38 | 0.90 |
| HS12 | Cu | 21 | 742 | 2 | 9.52 | 5.96 | 164.61 | 1.28 |
| LG_HALO | Cu | 3,330 | 1,280 | 10 | 0.30 | 1.95 | 61.51 | 2.06 |
| HS1 | Pb | 283 | 18,800 | 5 | 1.77 | 14.50 | 1,462.09 | 2.24 |
| HS2 | Pb | 116 | 61,900 | 3 | 2.59 | 5.60 | 4,952.39 | 2.31 |
| HS3 | Pb | 19 | 3,150 | 3 | 15.79 | 11.78 | 1,259.96 | 0.87 |
| HS4 | Pb | 22 | 2,870 | 4 | 18.18 | 35.22 | 668.11 | 1.64 |
| HS5 | Pb | 121 | 27,500 | 3 | 2.48 | 13.61 | 2,239.68 | 2.42 |
| HS6 | Pb | 17 | 3,120 | 2 | 11.76 | 3.50 | 733.27 | 1.28 |
| HS7 | Pb | 29 | 30,000 | 2 | 6.90 | 10.03 | 3,353.82 | 2.35 |
| HS8 | Pb | 7 | 895 | 2 | 28.57 | 1.57 | 603.94 | 0.49 |
| HS9 | Pb | 20 | 11,300 | 2 | 10.00 | 19.61 | 2,408.26 | 1.44 |
| HS10 | Pb | 6 | 2,210 | 2 | 33.33 | 15.21 | 1,267.52 | 0.83 |
| HS11 | Pb | 7 | 295 | 2 | 28.57 | 12.20 | 172.39 | 0.55 |
| HS12 | Pb | 21 | 16,100 | 2 | 9.52 | 44.05 | 3,361.26 | 1.49 |
| LG_HALO | Pb | 3,330 | 7,300 | 13 | 0.39 | 11.90 | 276.09 | 2.85 |
| HS1 | Zn | 283 | 33,100 | 3 | 1.06 | 5.09 | 1,534.12 | 2.96 |
| HS2 | Zn | 116 | 20,800 | 6 | 5.17 | 15.08 | 2,795.83 | 1.86 |
| HS3 | Zn | 19 | 4,520 | 3 | 15.79 | 3.23 | 1,563.09 | 1.01 |
| HS4 | Zn | 22 | 5,150 | 2 | 9.09 | 12.64 | 755.11 | 2.03 |
| HS5 | Zn | 121 | 21,300 | 4 | 3.31 | 22.49 | 1,958.09 | 2.40 |
| HS6 | Zn | 17 | 6,900 | 2 | 11.76 | 16.90 | 1,234.19 | 1.78 |
| HS7 | Zn | 29 | 12,200 | 2 | 6.90 | 33.84 | 1,906.87 | 1.75 |
| HS8 | Zn | 7 | 1,550 | 2 | 28.57 | 9.68 | 798.40 | 0.68 |
| HS9 | Zn | 20 | 7,610 | 2 | 10.00 | 46.32 | 1,722.37 | 1.41 |
| HS10 | Zn | 6 | 1,260 | 2 | 33.33 | 12.31 | 635.12 | 0.85 |
| HS11 | Zn | 7 | 251 | 2 | 28.57 | 1.56 | 161.41 | 0.47 |
| HS12 | Zn | 21 | 3,780 | 3 | 14.29 | 47.51 | 835.89 | 1.59 |
| LG_HALO | Zn | 3,330 | 4,250 | 20 | 0.60 | 15.77 | 240.51 | 2.08 |
| Contango Silver and Gold – Kitsault Valley Project | Page 160 of 253 |
| Technical Report Summary and updated Mineral Resource Estimate 2026 |
11.5.3.5 Bulk Density Assignment
A bulk density of 2.77 t/m³ is applied throughout the estimated Homestake Silver domains. The screened mineralized population contains 2,612 measurements from 51 drill holes and has an arithmetic mean of 2.751 t/m³. The selected assignment is approximately 0.7% higher than this mean and is consistent with the earlier mineralized-zone mean of approximately 2.76 t/m³. The QP considers the assignment appropriate for the current estimate, while recognizing that density variation among individual lenses remains a subject for continuing domain-based review.
11.5.3.6 Block Model Definition
The model is fully sub-blocked, with 200 × 200 × 200 = 8,000,000 nominal parent cells, 5 × 5 × 5 m parent dimensions and minimum 0.5 × 0.5 × 0.5 m sub-blocks. The Leapfrog base point is 463180, 6178390, 1030 m. Its local boundary dimensions are 1000, 1000, 1000 m and its rotation is azimuth 0°, dip 0° and pitch 0°. The reported base-point elevation is the upper Z boundary; the model extends downward from that elevation (Table 11-17).
Table 11-17. Homestake Silver global block-model bounds.
| Axis | Minimum (m) | Maximum (m) |
| X / Easting | 463,180.000 | 464,180.000 |
| Y / Northing | 6,178,390.000 | 6,179,390.000 |
| Z / Elevation | 30.000 | 1,030.000 |
Source: model rollup, block model data. For rotated models, global axis-aligned bounds differ from local boundary dimensions. Nominal parent-cell count is not mineralized-block count. Horizontal coordinates: NAD83 / UTM Zone 9N (meters).
11.5.3.7 Grade Interpolation and Estimation Parameters
All five metals are estimated using inverse-distance cubed weighting and hard boundaries. Grade searches use 4 to 10 composites with a maximum of two samples per drill hole. Classification searches use three samples and a maximum of one sample per hole. The parameter export contains material element-specific orientation differences: HS1 silver uses a 200 × 150 × 40 m grade search, while its Au, Cu, Pb and Zn searches are 140 × 100 × 35 m. HS9 Ag, Cu, Pb and Zn use a fixed orientation, while Au uses a variable-orientation field. These distinctions are preserved in the parameter table. Leapfrog declustering was applied separately by domain and element in every Homestake Silver estimator. Search and sample parameters are presented in Table 11-18.
| Contango Silver and Gold – Kitsault Valley Project | Page 161 of 253 |
| Technical Report Summary and updated Mineral Resource Estimate 2026 |
Table 11-18. Homestake Silver search and sample parameters.
| Domain | Metal | Estimator purpose |
Ranges
(m) major × inter. × minor |
Orientation | Samples min–max |
Max
per hole |
| HS10 | Ag | Classification | 70 × 68 × 20 | 85/39.4/110.11 | 3–3 | 1 |
| HS11 | Ag | Classification | 65 × 56 × 20 | 85/44/90 | 3–3 | 1 |
| HS12 | Ag | Classification | 140 × 84 × 28 | 35/30/63 | 3–3 | 1 |
| HS1 | Ag | Classification | 140 × 100 × 35 | VO | 3–3 | 1 |
| HS2 | Ag | Classification | 200 × 200 × 50 | VO | 3–3 | 1 |
| HS3 | Ag | Classification | 120 × 80 × 35 | 43/40/65 | 3–3 | 1 |
| HS4 | Ag | Classification | 120 × 70 × 35 | 87.78/19/90 | 3–3 | 1 |
| HS5 | Ag | Classification | 140 × 85 × 30 | VO | 3–3 | 1 |
| HS6 | Ag | Classification | 100 × 60 × 20 | 85/41/70 | 3–3 | 1 |
| HS7 | Ag | Classification | 140 × 85 × 30 | 85/48/90 | 3–3 | 1 |
| HS8 | Ag | Classification | 70 × 50 × 30 | 80/45/90 | 3–3 | 1 |
| HS9 | Ag | Classification | 180 × 105 × 35 | 85/51/100 | 3–3 | 1 |
| LG_HALO | Ag | Classification | 150 × 100 × 80 | 90/44/90 | 3–3 | 1 |
| HS10 | Ag/Au/Cu/Pb/Zn | Grade | 70 × 68 × 20 | 85/39.4/110.11 | 4–10 | 2 |
| HS11 | Ag/Au/Cu/Pb/Zn | Grade | 65 × 56 × 20 | 85/44/90 | 4–10 | 2 |
| HS12 | Ag/Au/Cu/Pb/Zn | Grade | 140 × 84 × 28 | 35/30/63 | 4–10 | 2 |
| HS1 | Ag | Grade | 200 × 150 × 40 | VO | 4–10 | 2 |
| HS2 | Ag/Au/Cu/Pb/Zn | Grade | 140 × 100 × 35 | VO | 4–10 | 2 |
| HS3 | Ag/Au/Cu/Pb/Zn | Grade | 120 × 80 × 35 | 43/40/65 | 4–10 | 2 |
| HS4 | Ag/Au/Cu/Pb/Zn | Grade | 120 × 70 × 35 | 87.78/19/90 | 4–10 | 2 |
| HS5 | Ag/Au/Cu/Pb/Zn | Grade | 140 × 85 × 30 | VO | 4–10 | 2 |
| HS6 | Ag/Au/Cu/Pb/Zn | Grade | 100 × 60 × 20 | 85/41/70 | 4–10 | 2 |
| HS7 | Ag/Au/Cu/Pb/Zn | Grade | 140 × 85 × 30 | 85/48/90 | 4–10 | 2 |
| HS8 | Ag/Au/Cu/Pb/Zn | Grade | 70 × 50 × 30 | 80/45/90 | 4–10 | 2 |
| HS9 | Ag/Cu/Pb/Zn | Grade | 180 × 105 × 35 | 85/51/100 | 4–10 | 2 |
| LG_HALO | Ag/Au/Cu/Pb/Zn | Grade | 150 × 100 × 80 | 90/44/90 | 4–10 | 2 |
| HS1 | Au/Cu/Pb/Zn | Grade | 140 × 100 × 35 | VO | 4–10 | 2 |
| HS9 | Au | Grade | 180 × 105 × 35 | VO | 4–10 | 2 |
| Contango Silver and Gold – Kitsault Valley Project | Page 162 of 253 |
| Technical Report Summary and updated Mineral Resource Estimate 2026 |
11.5.3.8 Model Validation
Validation considered the continuity and mutual separation of the lenses, the behavior of the broad halo and the influence of extreme observations in the smallest populations. The QP reviewed the resource model against geological interpretation and sample support and considers the overall estimation approach appropriate. The Indicated inventory is concentrated in the better-supported portions of the lens system. Low sample counts and substantial local cap effects remain relevant to uncertainty even where aggregate deposit statistics appear stable.
11.5.3.9 Mineral Resource Classification
The selected classification thresholds are 38 m nominal spacing for Indicated and 100 m for Inferred, equivalent to raw AvgD limits of 26.866 m and 70.700 m. The distance measure is calculated using the dedicated classification estimators, then reviewed within the accepted geological model. Numerical thresholds do not override poor lens continuity or inadequate spatial support. Most of the deposit remains Inferred. The QP considers that the majority of the Inferred resources have a reasonable prospect of upgrading through continued infill drilling, particularly where the drilling can resolve lens thickness, structural offsets and the relationship between the lenses and halo.
The review-model
35/100 case contains approximately 0.564 Mt Indicated, compared with 0.891 Mt in the selected 38/100 case and 1.352 Mt in the 42/100
case. Reducing the Inferred threshold from 100 to 75 m removes approximately 465,056 t and 3.544 Moz AgEq from the classified inventory.
This is a materially larger peripheral response than at Homestake Main. The QP retained the 100 m nominal threshold only where the mineralized
domains remain geologically coherent and supported by estimation. The resulting Indicated and Inferred classification geometry for Homestake
Silver is shown in plan, longitudinal and cross-sectional views in
Figure 11-6.
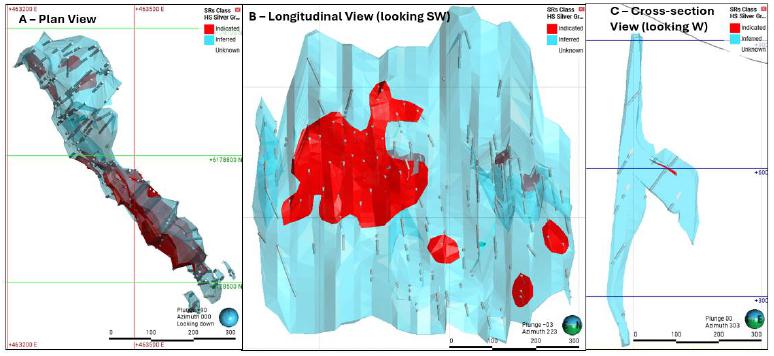
Figure 11-6. Homestake Silver Mineral Resource Classification: A – Plan view, B – Longitudinal view (looking southwest), C – Cross-sectional view looking west. Red solid represents Indicated classification and blue Inferred classification.
| Contango Silver and Gold – Kitsault Valley Project | Page 163 of 253 |
| Technical Report Summary and updated Mineral Resource Estimate 2026 |
11.5.3.10 Depletion, Exclusions and Reporting Constraints
No historical production depletion is applied. Resources are reported within accepted mineralized domains at or above 132 g/t AgEq and with Indicated or Inferred classification. HS4, HS8 and HS11 do not contribute Indicated resources in the final domain report. A very small Inferred contribution from HS11 rounds to 0.00 Mt in the domain export; rounding does not make it a separate material resource population.
11.5.3.11 Deposit Mineral Resource Statement
The final estimate establishes 0.71 Mt of Indicated resources at 168.26 g/t Ag and 4.16 g/t Au (Table 11-19 and 11-20). The Inferred estimate contains 3.63 Mt at 65.88 g/t Ag and 3.55 g/t Au. Relative to the preceding entirely Inferred estimate, the Inferred silver grade decreases from 146.0 to 65.88 g/t, while Inferred gold grade increases from 3.13 to 3.55 g/t. The different response of the two metals is consistent with changes to the modeled lens and halo populations and their allocation between categories. A controlled model reconciliation would be required to isolate each contributing effect.
Table 11-19. Homestake Silver Mineral Resource grades.
| Category | Tonnes (Mt) |
Ag (g/t) |
Au (g/t) |
Cu (%) |
Pb (%) |
Zn (%) |
| Indicated | 0.71 | 168.26 | 4.160 | 0.039 | 0.263 | 0.222 |
| Inferred | 3.63 | 65.88 | 3.550 | 0.028 | 0.203 | 0.165 |
Source: approved Roll Up_USE worksheet. Cut-off: 132 g/t AgEq. In-situ, unmined resource before mining dilution and recovery. Mineral Resource effective date: September 11, 2026.
Table 11-20. Homestake Silver contained metals.
| Category | Ag (Moz) |
Au (koz) |
Cu (Mlb) |
Pb (Mlb) |
Zn (Mlb) |
AgEq (Moz) |
| Indicated | 3.856 | 95.407 | 0.61 | 4.13 | 3.49 | 9.968 |
| Inferred | 7.680 | 414.413 | 2.24 | 16.22 | 13.23 | 34.132 |
Contained metals are in situ. NR means not reported, not zero. Rounding may cause apparent differences.
| 11.5.4 | South Reef |
11.5.4.1 Estimation Bias and Input Data
The South Reef Inferred Mineral Resource is carried forward at 0.445 Mt grading 8.68 g/t Au and 4.90 g/t Ag, with 124,200 oz Au and 100,000 oz Ag as reported in the approved rollup. The underlying estimate was accepted with an effective date of January 20, 2022 and was reviewed in the combined technical report dated February 23, 2023, effective September 28, 2022. The historical estimation model derives from the Homestake work described by Chamois et al. (2020). No 2026 re-estimation or re-filtering at 132 g/t AgEq is claimed.
| Contango Silver and Gold – Kitsault Valley Project | Page 164 of 253 |
| Technical Report Summary and updated Mineral Resource Estimate 2026 |
11.5.4.2 Mineral Resource Classification
South Reef remains entirely Inferred. No Indicated category has been created by applying the 2026 Homestake distance rules. The classification reflects the lower level of drilling support and the confidence in the retained geological model. Additional drilling is expected to permit upgrading of the majority of the resource where it confirms the interpreted vein geometry and grade continuity. The expectation of upgrading is not a guarantee of conversion to Indicated resources or Mineral Reserves.
11.5.4.3 Depletion, Exclusions and Reporting Constraints
The retained resource uses 2.0 g/t AuEq cut-off. The 2023 report identifies the original commodity assumptions as US$1,300/oz Au, US$20/oz Ag and US$2.50/lb Cu, with recoveries of 92% Au, 88% Ag and 87.5% Cu. No current historical-production depletion deduction is identified for South Reef. The original cut-off and reporting constraints are preserved; the estimate is not represented as recalculated under the current Homestake Silver recovery matrix.
No historical stope tonnage is reported here as a reserve or production inventory.
11.5.4.4 Deposit Mineral Resource Statement
South Reef quantities and grades are unchanged from the preceding physical-resource statement. Zinc is not reported. The change from 8.585 Moz AgEq in the comparison column to 8.60 Moz in the approved 2026 column is a presentation/conversion matter and is not mineral-resource growth or evidence of new drilling in the estimate.
Table 11-21. South Reef Mineral Resource grades.
| Category | Tonnes (Mt) |
Ag (g/t) |
Au (g/t) |
Cu (%) |
Pb (%) |
Zn (%) |
| Inferred | 0.445 | 4.90 | 8.680 | 0.040 | 0.001 | NR |
Source: approved Roll Up_USE worksheet. Cut-off: 2.0 g/t AuEq; carried forward. Mineral Resource effective date: September 11, 2026.
Table 11-22. South Reef contained metals.
| Category | Ag (Moz) |
Au (koz) |
Cu (Mlb) |
Pb (Mlb) |
Zn (Mlb) |
AgEq (Moz) |
| Inferred | 0.100 | 124.200 | 0.36 | 0.00 | NR | 8.600 |
Contained metals are in situ. NR means not reported, not zero. Rounding may cause apparent differences. The approved South Reef AgEq value is retained pending insertion of its conversion basis.
| 11.6 | Dolly Varden Area Mineral Resource Estimates |
11.6.1 Regional Overview and Shared Methodology
The southern area contains five separately reported deposits. Their principal resource commodity is silver, with Au, Cu, Pb and Zn estimated where supported by the accepted data. Each uses the southern recovery matrix and a 132 g/t AgEq cut-off. The models share 5 m parent blocks, 0.5 m minimum sub-blocks and IDW with power 3, but their domain geometries, cap values, density assignments, search orientations, sample coverage and classification distances differ.
| Contango Silver and Gold – Kitsault Valley Project | Page 165 of 253 |
| Technical Report Summary and updated Mineral Resource Estimate 2026 |
Historical underground mining affects Torbrit, Dolly Varden and North Star. The current resource statement uses the unmined populations for those deposits. Kitsol is separately reported in 2026, requiring its recombination with Torbrit for comparison with the preceding reporting unit. Historic assays in parts of the region emphasize silver, so confidence in non-silver credits is assessed independently of silver sampling density.
| 11.6.2 | Wolf |
11.6.2.1 Estimation Bias and Input Data
The Wolf estimate uses the Wolf GMs 2026 geological model and DGL_Wolf Grade Capped 2026 input dataset. Two estimation domains, the combined upper veins and Wolf Deep, provide the current resource. The estimate replaces Wolf resource with an underlying effective date of May 8, 2019. The large amount of subsequent drilling provides a substantially expanded geological and grade-estimation basis.
The deposit header inventory contains 231 holes totaling 84,465.75 m. Of these, 111 holes totaling 69,194.82 m fall in years after the preceding effective-date year; a further 3 holes totaling 878.20 m are in the boundary year. These are inventory counts, with the estimation-input population defined by domain and assay acceptance as described in Section 11.2.
11.6.2.2 Geological Interpretation and Estimation Domains
The model separates WOLF_1_2_3_VEINS_CLIPPED from WOLF_DEEP (Table 11-23, Figure 11-7). The upper domain combines the interpreted vein system after clipping overlaps, while the deep domain represents the deeper continuation defined by later drilling. This separation respects differences in geometry, metal distribution and available sample support. In particular, the deep domain has appreciably higher Pb and Zn grades than the combined upper veins. Hard boundaries restrict interpolation to the applicable domain.
Table 11-23. Wolf estimation domains.
| Model domain | Geological role |
| WOLF_1_2_3_VEINS_CLIPPED | Combined and clipped upper vein domains |
| WOLF_DEEP | Deeper mineralized domain |
| Contango Silver and Gold – Kitsault Valley Project | Page 166 of 253 |
| Technical Report Summary and updated Mineral Resource Estimate 2026 |
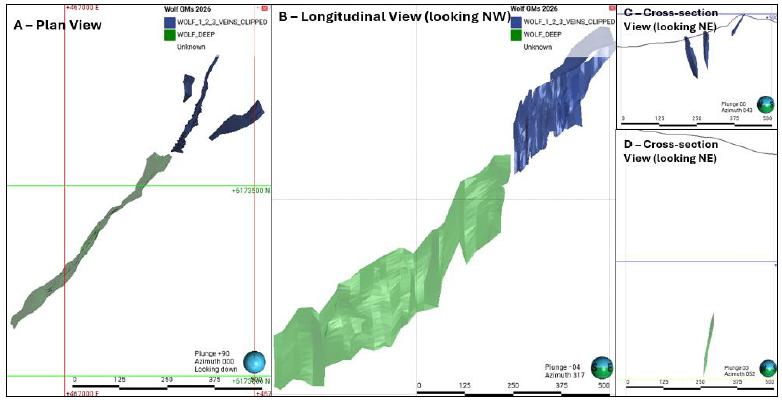
Figure 11-7. Wolf domain geometry and representative sections showing the two modeled domains: A – Plan view, B – Longitudinal view (looking northwest), C – Cross-sectional view of the shallower Wolf Vein systems looking northeast, D – Cross-sectional view of the Wolf Deep system looking northeast.
11.6.2.3 Sample Statistics and Compositing
The capping statistics include 406 Ag records in the combined upper veins and 415 in Wolf Deep. The upper-vein Au and Cu populations contain only 98 records each, compared with 121 Pb and 117 Zn records. Wolf Deep has 415 records for every estimated element. This imbalance demonstrates the more limited historical coverage of gold and base metals in the upper veins. It is carried into the assessment of equivalent-grade uncertainty and is not treated as evidence that missing assays have zero metal content.
Wolf samples were composited to a target length of 2.0 m using the Within boundary setting and hard domain boundaries. Residual end lengths of less than 1.0 m were distributed equally within the boundary interval. No additional weighting was applied during compositing. The following capping table reports capped input means and coefficients of variation. The capped arithmetic input statistics are distinct from declustered statistics and volume-weighted block grades.
11.6.2.4 Grade Capping
Silver caps are 2,260 g/t for the combined upper veins and 2,060 g/t for Wolf Deep (Table 11-24). They affect four records in each domain, or approximately 0.99% and 0.96%, respectively, and reduce input silver metal by 6.71% and 6.95%. A gold cap of 0.20 g/t applies to both domains. Base-metal caps are lower in the upper-vein population than in Wolf Deep, consistent with their differing distributions. The Pb caps are 20,000 and 56,000 ppm, and Zn caps are 5,900 and 72,000 ppm, respectively.
| Contango Silver and Gold – Kitsault Valley Project | Page 167 of 253 |
| Technical Report Summary and updated Mineral Resource Estimate 2026 |
Table 11-24. Wolf caps and capped input statistics.
| Domain | Metal | Input N |
Cap | Capped N |
Capped (%) |
Input
metal loss (%) |
Capped mean¹ |
CV |
| Upper veins | Ag | 406 | 2,260 | 4 | 0.99 | 6.71 | 280.67 | 1.52 |
| Wolf Deep | Ag | 415 | 2,060 | 4 | 0.96 | 6.95 | 246.91 | 1.35 |
| Upper veins | Au | 98 | 0.2 | 4 | 4.08 | 22.87 | 0.022 | 1.91 |
| Wolf Deep | Au | 415 | 0.2 | 20 | 4.82 | 20.05 | 0.049 | 1.02 |
| Upper veins | Cu | 98 | 500 | 4 | 4.08 | 3.09 | 133.70 | 0.95 |
| Wolf Deep | Cu | 415 | 2,000 | 8 | 1.93 | 6.93 | 315.51 | 1.37 |
| Upper veins | Pb | 121 | 20,000 | 5 | 4.13 | 16.80 | 2,911.95 | 1.55 |
| Wolf Deep | Pb | 415 | 56,000 | 10 | 2.41 | 11.02 | 7,882.58 | 1.50 |
| Upper veins | Zn | 117 | 5,900 | 5 | 4.27 | 7.88 | 1,676.92 | 0.92 |
| Wolf Deep | Zn | 415 | 72,000 | 9 | 2.17 | 6.69 | 10,687.03 | 1.45 |
11.6.2.5 Bulk Density Assignment
A constant density of 2.90 t/m³ applies to both Wolf domains. The screened density population contains 31 measurements from 15 drill holes, with an arithmetic mean of 2.898 t/m³. The close agreement supports the selected value, although the small population should be expanded as drilling continues into the deep domain. The current screened population and historical density datasets overlap and should not be added together as independent population measurement.
11.6.2.6 Block Model Definition
The model is fully sub-blocked, with 177 × 200 × 211 = 7,469,400 nominal parent cells, 5 × 5 × 5 m parent dimensions and minimum 0.5 × 0.5 × 0.5 m sub-blocks. The Leapfrog base point is 466740, 6172931, 612 m. Its local boundary dimensions are 885, 1000, 1055 m and its rotation is azimuth 0°, dip 0° and pitch 0°. The reported base-point elevation is the upper Z boundary; the model extends downward from that elevation (Table 11-25).
| Contango Silver and Gold – Kitsault Valley Project | Page 168 of 253 |
| Technical Report Summary and updated Mineral Resource Estimate 2026 |
Table 11-25. Wolf global block-model bounds.
| Axis | Minimum (m) | Maximum (m) |
| X / Easting | 466,740.000 | 467,625.000 |
| Y / Northing | 6,172,931.000 | 6,173,931.000 |
| Z / Elevation | -443.000 | 612.000 |
Source: model rollup, block model data. For rotated models, global axis-aligned bounds differ from local boundary dimensions. Nominal parent-cell count is not mineralized-block count. Horizontal coordinates: NAD83 / UTM Zone 9N (meters).
11.6.2.7 Grade Interpolation and Estimation Parameters
Grades use IDW with power 3. Upper-vein Ag uses a fixed 150 × 100 × 40 m search at dip 87°, dip azimuth 294° and pitch 90°, with 3 to 15 samples. Upper-vein Au and base metals use the same ranges, 4 to 20 samples and a fixed 87.76° / 294.03° / 90° orientation. Wolf Deep uses a variable-orientation 100 × 60 × 20 m search with 4 to 15 samples. Grade estimators allow two samples per hole. Classification uses three samples, one per hole, with fixed 150 × 100 × 40 m searches. Leapfrog declustering was applied separately by domain and element in every Wolf estimator. Search and sample parameters are presented in Table 11-26.
Table 11-26. Wolf search and sample parameters.
| Domain | Metal | Estimator purpose |
Ranges
(m) major × inter. × minor |
Orientation | Samples min–max |
Max
per hole |
| Upper veins | Ag | Classification | 150 × 100 × 40 | 87/294/90 | 3–3 | 1 |
| Wolf Deep | Ag | Classification | 150 × 100 × 40 | 89/136/76 | 3–3 | 1 |
| Upper veins | Ag | Grade | 150 × 100 × 40 | 87/294/90 | 3–15 | 2 |
| Wolf Deep | Ag/Au/Cu/Pb/Zn | Grade | 100 × 60 × 20 | VO | 4–15 | 2 |
| Upper veins | Au/Cu/Pb/Zn | Grade | 150 × 100 × 40 | 87.76/294.03/90 | 4–20 | 2 |
11.6.2.8 Model Validation
The QP reviewed the connection between the upper veins and Wolf Deep, the consistency of block grades with their respective input populations and the influence of isolated high-grade silver observations. Validation considers the differing metal associations and sample coverage in the two domains. The final domain report attributes approximately 12.233 Moz of the Indicated AgEq inventory to Wolf Deep and 3.875 Moz to the combined upper veins. This concentration makes validation of deep-domain continuity and orientation
11.6.2.9 Mineral Resource Classification
Wolf uses selected nominal spacing thresholds of 45 m for Indicated and 100 m for Inferred, equivalent to raw AvgD thresholds of 31.815 m and 70.700 m. The QP considered the coherent geometry of the mineralized system, the distribution of the informing holes and the spatial continuity of the classified volumes. The Inferred category covers lower-confidence extensions within the interpreted domains. Targeted infill drilling is expected to increase the majority of the Inferred resource where the interpreted continuity is confirmed.
| Contango Silver and Gold – Kitsault Valley Project | Page 169 of 253 |
| Technical Report Summary and updated Mineral Resource Estimate 2026 |
In the classification review model, reducing the Indicated threshold from 45 to 40 m transfers approximately 214,611 t and 2.341 Moz AgEq to Inferred. Increasing it from 45 to 50 m transfers approximately 160,308 t and 1.758 Moz AgEq to Indicated. Reducing the Inferred threshold from 100 to 75 m removes approximately 10,549 t and 0.100 Moz AgEq without changing Indicated resources. The QP selected 45/100 based on geological confidence and spatial support, with sensitivity tests illustrating the effect of neighboring choices. The resulting Indicated and Inferred classification geometry for the Wolf deposit, including the shallower vein systems and Wolf Deep domain, is shown in Figure 11-8.
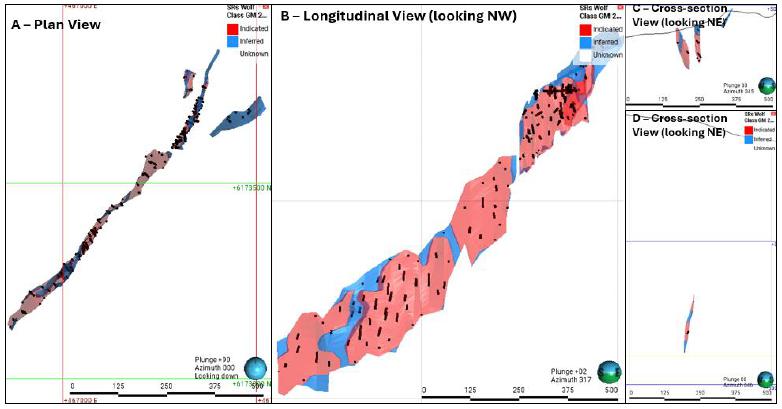
Figure 11-8. Wollf Mineral Resource classification geometry A – Plan view, B – Longitudinal view (looking northwest), C – Cross-sectional view of the shallower Wolf Vein systems looking northeast, D – Cross sectional view of the Wolf Deep system looking northeast. Red solid represents Indicated classification and blue Inferred classification.
11.6.2.10 Depletion, Exclusions and Reporting Constraints
No mined-out deduction is identified in the final Wolf resource report. The reported resource includes only Indicated and Inferred material above 132 g/t AgEq in the two accepted domains. Unclassified material is excluded. Geological extensions beyond the supported estimation and classification limits remain exploration potential and are not included as Mineral Resources.
11.6.2.11 Deposit Mineral Resource Statement
Wolf shows the largest increase in Indicated AgEq among the separately reported deposits, from 3.834 Moz to 16.108 Moz (Table 11-27 and 11-28). Indicated tonnage increases from 0.402 Mt to 1.53 Mt, with silver grade changing from 296.6 to 301.90 g/t. Inferred tonnage increases from 0.010 Mt to 0.44 Mt. The increase is consistent with the expanded drilled footprint and development of the deep domain, but the net change also includes updated density, capping, classification and reporting assumptions.
| Contango Silver and Gold – Kitsault Valley Project | Page 170 of 253 |
| Technical Report Summary and updated Mineral Resource Estimate 2026 |
Table 11-27. Wolf Mineral Resource grades.
| Category | Tonnes (Mt) |
Ag (g/t) |
Au (g/t) |
Cu (%) |
Pb (%) |
Zn (%) |
| Indicated | 1.53 | 301.90 | 0.050 | 0.027 | 0.714 | 0.864 |
| Inferred | 0.44 | 381.40 | 0.030 | 0.030 | 0.707 | 1.100 |
Table 11-28. Wolf contained metals.
| Category | Ag (Moz) |
Au (koz) |
Cu (Mlb) |
Pb (Mlb) |
Zn (Mlb) |
AgEq (Moz) |
| Indicated | 14.850 | 2.246 | 0.92 | 24.09 | 29.15 | 16.108 |
| Inferred | 5.390 | 0.411 | 0.30 | 6.85 | 10.66 | 5.790 |
Contained metals are in situ. NR means not reported, not zero. Rounding may cause apparent differences.
| 11.6.3 | Kitsol |
11.6.3.1 Estimation Bias and Input Data
Kitsol is estimated and reported as a separate deposit in the current update. It was included in the Torbrit reporting unit in the preceding estimate, so comparisons use the May 8, 2019 Torbrit effective date and combine Torbrit and Kitsol when assessing like-for-like reporting totals. The current model is Kitsol GM 2026 and the input is SRs Kitsol Estimation Dataset Capped, retaining the source object spelling for traceability.
The deposit header inventory contains 35 holes totaling 10,965.46 m. Of these, 20 holes totaling 6,639.00 m fall in years after the preceding effective-date year; a further 2 holes totaling 893.00 m are in the boundary year. These are inventory counts, with the estimation-input population defined by domain and assay acceptance as described in Section 11.2.
11.6.3.2 Geological Interpretation and Estimation Domains
The resource is constrained to the Kitsol_VN mineralized vein domain (Table 11-29, Figure 11-9). It is evaluated independently of Torbrit for grade estimation, density assignment and classification. The domain boundary is hard. This treatment recognizes the local geological geometry and avoids assigning resource confidence solely by association with the adjacent Torbrit system.
Table 11-29. Kitsol estimation domains.
| Model domain | Geological role |
| Kitsol_VN | Kitsol mineralized vein domain |
| Contango Silver and Gold – Kitsault Valley Project | Page 171 of 253 |
| Technical Report Summary and updated Mineral Resource Estimate 2026 |
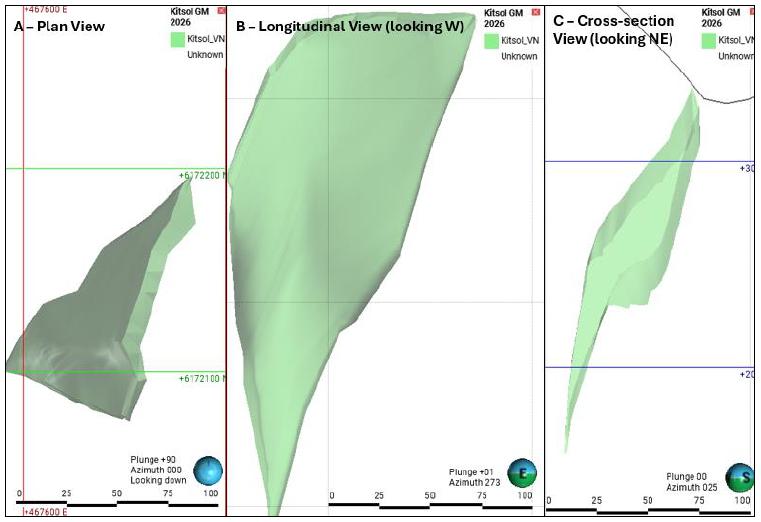
Figure 11-9. Kitsol domain geometry and representative sections showing the modeled domains. A – Plan view, B – Longitudinal view (looking west), C – Cross- sectional view looking northeast.
11.6.3.3 Sample Statistics and Compositing
The capping schedule contains 194 records for each of Ag, Au, Cu, Pb and Zn. The current estimator reads a prepared capped dataset using the QP-confirmed compositing settings below. The capped mean silver grade is 290.18 g/t with a coefficient of variation of 0.83. Capped mean gold grade is 0.0364 g/t.
Kitsol samples were composited to a target length of 1.5 m using the Within boundary setting and hard domain boundaries. Residual end lengths of less than 1.0 m were distributed equally within the boundary interval. No additional weighting was applied during compositing. The following capping table reports capped input means and coefficients of variation. The capped arithmetic input statistics are distinct from declustered statistics and volume-weighted block grades.
11.6.3.4 Grade Capping
The current caps are 800 g/t Ag, 0.30 g/t Au, 1,000 ppm Cu, 17,500 ppm Pb and 10,500 ppm Zn (Table 11-30). These supersede the earlier draft values where they differ. The silver cap affects 18 of 194 records, or 9.28%, and removes 12.86% of input silver metal. The gold cap affects five records and removes 53.57% of input gold metal. This large relative gold change has limited influence on a resource dominated by silver, but the gold credit still requires consistent treatment and disclosure.
| Contango Silver and Gold – Kitsault Valley Project | Page 172 of 253 |
| Technical Report Summary and updated Mineral Resource Estimate 2026 |
Table 11-30. Kitsol caps and capped input statistics.
| Domain | Metal | Input N |
Cap | Capped N |
Capped (%) |
Input
metal loss (%) |
Capped mean¹ |
CV |
| Kitsol_VN | Ag | 194 | 800 | 18 | 9.28 | 12.86 | 290.18 | 0.83 |
| Kitsol_VN | Au | 194 | 0.3 | 5 | 2.58 | 53.57 | 0.036 | 1.63 |
| Kitsol_VN | Cu | 194 | 1,000 | 11 | 5.67 | 21.32 | 268.70 | 1.06 |
| Kitsol_VN | Pb | 194 | 17,500 | 7 | 3.61 | 7.25 | 3,534.48 | 1.20 |
| Kitsol_VN | Zn | 194 | 10,500 | 6 | 3.09 | 5.52 | 2,937.12 | 0.83 |
Source: Model rollups for all in progress.xlsx, grade capping. ¹Ag and Au in g/t; Cu, Pb and Zn in ppm. Means and CV describe capped inputs. Input metal loss is the exported data statistic, not loss of classified resource metal. Domain names abbreviated in this table are defined above. None means no numerical cap is specified.
11.6.3.5 Bulk Density Assignment
The QP assigned 3.00 t/m³ to Kitsol, consistent with the Dolly Varden assignment. The mineralized density screen contains 33 measurements from 11 drill holes and has a mean of 2.890 t/m³. The assignment is approximately 3.8% higher than that mean. Its basis includes the geological setting and the representativeness of samples within the resource domain. The assignment is not inherited automatically from the 3.10 t/m³ Torbrit value, and the limited Kitsol measurement population remains a source of tonnage uncertainty.
11.6.3.6 Block Model Definition
The model is fully sub-blocked, with 24 × 30 × 61 = 43,920 nominal parent cells, 5 × 5 × 5 m parent dimensions and minimum 0.5 × 0.5 × 0.5 m sub-blocks. The Leapfrog base point is 467580, 6172060, 390 m. Its local boundary dimensions are 120, 150, 305 m and its rotation is azimuth 0°, dip 0° and pitch 0°. The reported base-point elevation is the upper Z boundary; the model extends downward from that elevation (Table 11-31).
Table 11-31. Kitsol global block-model bounds.
| Axis | Minimum (m) | Maximum (m) |
| X / Easting | 467,580.000 | 467,700.000 |
| Y / Northing | 6,172,060.000 | 6,172,210.000 |
| Z / Elevation | 85.000 | 390.000 |
Source: model rollup, block model data. For rotated models, global axis-aligned bounds differ from local boundary dimensions. Nominal parent-cell count is not mineralized-block count. Horizontal coordinates: NAD83 / UTM Zone 9N (meters).
11.6.3.7 Grade Interpolation and Estimation Parameters
The five metals use IDW with power 3 and a variable-orientation 100 × 60 × 20 m grade search, selecting 4 to 15 composites with a maximum of two samples per drill hole. Leapfrog declustering was applied separately by domain and element in every Kitsol estimator. The grade-estimator export identifies the SRs_Kitsol_Grade Capped_2026 declustering object. The dedicated Class_ID 2 estimator uses a fixed 150 × 100 × 40 m search, with dip 75.62°, dip azimuth 268.48° and pitch 90°, and selects three samples with a one-sample-per-hole limit. A nearest-neighbour Ag estimator is also present for comparison; its 100 × 60 × 35 m fixed search differs from the grade estimator and should be considered when interpreting local differences. Search and sample parameters are presented in Table 11-32.
| Contango Silver and Gold – Kitsault Valley Project | Page 173 of 253 |
| Technical Report Summary and updated Mineral Resource Estimate 2026 |
Table 11-32. Kitsol search and sample parameters.
| Domain | Metal | Estimator purpose |
Ranges
(m) major × inter. × minor |
Orientation | Samples min–max |
Max
per hole |
| Kitsol_VN | Ag | Classification | 150 × 100 × 40 | 75.62/268.48/90 | 3–3 | 1 |
| Kitsol_VN | Ag/Au/Cu/Pb/Zn | Grade | 100 × 60 × 20 | VO | 4–15 | 2 |
11.6.3.8 Model Validation
The QP reviewed sections through the Kitsol vein, the distribution of informing samples, capped and uncapped silver estimates and classification volumes. The selected 35/70 export in the distance-classification workbook reports Indicated silver of 2.766 Moz in the capped estimate and 3.237 Moz in the uncapped estimate. For Inferred, the corresponding values are 1.323 and 1.382 Moz. These differences are approximately 14.55% and 4.25% relative to the uncapped inventories.
11.6.3.9 Mineral Resource Classification
The selected nominal spacing thresholds are 35 m for Indicated and 70 m for Inferred, equivalent to raw AvgD limits of 24.745 m and 49.490 m. The QP selected these limits after reviewing the 30/60, 35/70, 40/75 and 35/50 cases with the geological model and drill support. The selected classification remains coherent, adequately supported portions of the vein as Indicated and its less directly supported continuation as Inferred. The majority of Inferred material is considered capable of upgrading with infill drilling that confirms the interpreted vein geometry and grade continuity.
The selected 35/70 case contains 285,743.63 t Indicated and 135,796.50 t Inferred, leaving 1,330.50 t unclassified in the tested above-cut-off population. Increasing the Indicated threshold to 40 m adds approximately 47,199 t to Indicated. Reducing the Inferred threshold from 70 to 50 m removes approximately 33,368 t and 0.284 Moz AgEq from Inferred. The detailed exports provide the AgEq values used here; several overview cells in the sensitivity workbook contain Ag or uncapped Ag under AgEq headings and have not been used for this comparison. The resulting Indicated and Inferred classification geometry for the Kitsol deposit is shown in plan, longitudinal and cross-sectional views in Figure 11-10.
| Contango Silver and Gold – Kitsault Valley Project | Page 174 of 253 |
| Technical Report Summary and updated Mineral Resource Estimate 2026 |
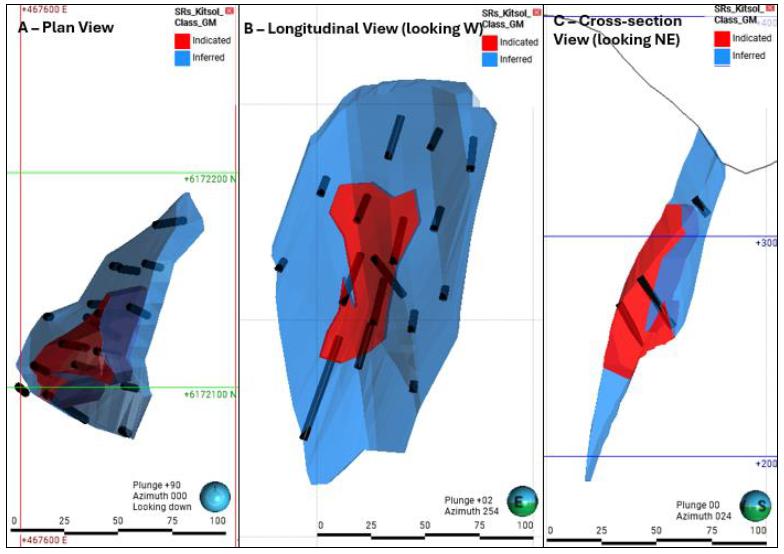
Figure 11-10. Kitsol Mineral Resource Classification geometry: A – Plan view, B – Longitudinal view (looking west), C – Cross- sectional view looking northeast. Red solid represents Indicated classification and blue Inferred classification.
11.6.3.10 Depletion, Exclusions and Reporting Constraints
No mined-out deduction is identified in the final Kitsol resource report. The report contains a small Cat4 population that is excluded from the approved resource statement. The final reported quantities are the Indicated and Inferred rows only, rather than the worksheet Total row, which includes Cat4.
11.6.3.11 Deposit Mineral Resource Statement
The standalone resource contains 0.29 Mt Indicated at 301.13 g/t Ag and 0.14 Mt Inferred at 303.04 g/t Ag (Table 11-33). The corresponding AgEq inventories are 2.876 Moz and 1.380 Moz (Table 11-34). A separate historical Kitsol resource was not reported, so a numerical change from a zero historical resource would be misleading. Section 11.8 compares the combined Torbrit–Kitsol reporting unit.
| Contango Silver and Gold – Kitsault Valley Project | Page 175 of 253 |
| Technical Report Summary and updated Mineral Resource Estimate 2026 |
Table 11-33. Kitsol Mineral Resource grades.
| Category | Tonnes (Mt) |
Ag (g/t) |
Au (g/t) |
Cu (%) |
Pb (%) |
Zn (%) |
| Indicated | 0.29 | 301.13 | 0.030 | 0.029 | 0.368 | 0.300 |
| Inferred | 0.14 | 303.04 | 0.020 | 0.033 | 0.434 | 0.316 |
Source: approved Roll Up_USE worksheet. Cut-off: 132 g/t AgEq. In-situ, unmined resource before mining dilution and recovery. Mineral Resource effective date: September 11, 2026.
Table 11-34. Kitsol contained metals.
| Category | Ag (Moz) |
Au (koz) |
Cu (Mlb) |
Pb (Mlb) |
Zn (Mlb) |
AgEq (Moz) |
| Indicated | 2.766 | 0.231 | 0.18 | 2.32 | 1.89 | 2.876 |
| Inferred | 1.323 | 0.101 | 0.10 | 1.30 | 0.94 | 1.380 |
Contained metals are in situ. NR means not reported, not zero. Rounding may cause apparent differences.
| 11.6.4 | Torbrit |
11.6.4.1 Estimation Bias and Input Data
The Torbrit estimate uses SRs Torbrit GM 2026 and the sub-blocked model compiled for the 2026 update. The current capping and estimator files replace earlier working settings in the initial chapter draft. The preceding reporting unit included Kitsol and had an underlying effective date of May 8, 2019. Current Torbrit resources are reported after excluding modeled historical mining.
The deposit header inventory contains 540 holes totaling 51,289.11 m. Of these, 57 holes totaling 13,099.68 m fall in years after the preceding effective-date year; a further 1 hole totaling 158.00 m are in the boundary year. These are inventory counts, with the estimation-input population defined by domain and assay acceptance as described in Section 11.2.
11.6.4.2 Geological Interpretation and Estimation Domains
Eleven mineralized domains define the Torbrit estimate (Table 11-35, Figure 11-11). The interpretation uses the established mineralized wireframes, including clipped domains that avoid overlapping with the principal TB_A domain. Broader control surfaces provide local orientation fields for the curving and folded mineralized geometry. Hard boundaries prevent samples in one domain from informing another. Historical workings are modeled separately from the mineralized domains so that geological volume, estimated grade and mining depletion remain distinct components of the calculation.
| Contango Silver and Gold – Kitsault Valley Project | Page 176 of 253 |
| Technical Report Summary and updated Mineral Resource Estimate 2026 |
Table 11-35. Torbrit estimation domains.
| Model domain | Geological role |
| TB_A | Principal mineralized domain |
| TB_B_Clip_A | Clipped mineralized domain |
| TB_C_Clip_A | Clipped mineralized domain |
| TB_D_Clip_A | Clipped mineralized domain |
| TB_E_Clip_A | Clipped mineralized domain |
| TB_F | Subsidiary mineralized domain |
| TB_G | Subsidiary mineralized domain |
| TB_H | Subsidiary mineralized domain |
| TB_I | Subsidiary mineralized domain |
| TB_J | Subsidiary mineralized domain |
| TB_K | Subsidiary mineralized domain |
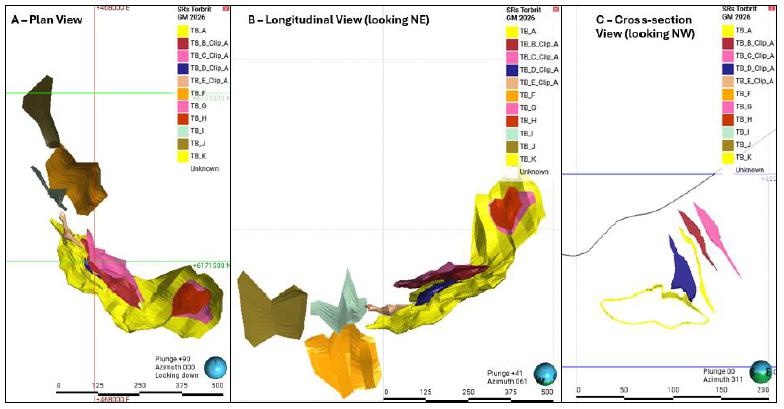
Figure 11-11. Torbrit domain geometry and representative sections showing the 11 modeled domains: A – Plan view, B – Longitudinal view (looking northeast), C – Cross-sectional view looking northwest.
| Contango Silver and Gold – Kitsault Valley Project | Page 177 of 253 |
| Technical Report Summary and updated Mineral Resource Estimate 2026 |
11.6.4.3 Sample Statistics and Compositing
The estimator export identifies SRs_Torbrit_2m_numeric_composite_2026 as its input, establishing a nominal 2.0 m composite basis. Silver coverage is substantially more extensive than Au and base-metal coverage in parts of the historical dataset. TB_A contains 2,711 Ag records but 375 Au and Cu records, 479 Pb records and 528 Zn records in the capping schedule. The Unknown population is outside the named estimation domains and is excluded from the deposit capping tables. Population-wide statistics that include Unknown are not representative of the resource-domain inputs.
Torbrit samples were composited to a target length of 2.0 m using the Within boundary setting and hard domain boundaries. Residual end lengths of less than 1.0 m were distributed equally within the boundary interval. No additional weighting was applied during compositing. The following capping table reports capped input means and coefficients of variation. The capped arithmetic input statistics are distinct from declustered statistics and volume-weighted block grades.
11.6.4.4 Grade Capping
The current silver cap for TB_A is 3,100 g/t, replacing the 2,020 g/t value in the earlier draft (Table 11-36). The TB_B_Clip_A silver cap is 1,400 g/t. The remaining domain caps range from 175 to 1,600 g/t. Silver input-metal reductions are approximately 8.00% in TB_A, 0.24% in TB_B_Clip_A, 20.78% in TB_F and 16.44% in TB_H. Base-metal caps are also domain-specific, including 130,000 ppm Pb in TB_C_Clip_A. No numerical Au top cut is specified for TB_D_Clip_A, where the schedule records no capped samples. The QP considers the variable cap treatment appropriate to the different domain distributions.
Table 11-36. Torbrit caps and capped input statistics.
| Domain | Metal | Input N |
Cap | Capped N |
Capped (%) |
Input
metal loss (%) |
Capped mean |
CV |
| TB_A | Ag | 2,711 | 3,100 | 10 | 0.37 | 8.00 | 315.65 | 1.27 |
| TB_B (clipped) | Ag | 407 | 1,400 | 4 | 0.98 | 0.24 | 281.40 | 0.86 |
| TB_C (clipped) | Ag | 187 | 1,200 | 3 | 1.60 | 1.29 | 211.54 | 1.10 |
| TB_D (clipped) | Ag | 138 | 1,600 | 2 | 1.45 | 1.16 | 262.48 | 1.03 |
| TB_E (clipped) | Ag | 157 | 500 | 6 | 3.82 | 2.80 | 145.97 | 0.93 |
| TB_F | Ag | 99 | 600 | 4 | 4.04 | 20.78 | 104.76 | 1.35 |
| TB_G | Ag | 35 | 400 | 2 | 5.71 | 1.98 | 103.09 | 1.09 |
| TB_H | Ag | 32 | 175 | 4 | 12.50 | 16.44 | 73.64 | 0.75 |
| TB_I | Ag | 52 | 800 | 2 | 3.85 | 3.19 | 137.73 | 1.53 |
| TB_J | Ag | 12 | 350 | 1 | 8.33 | 1.77 | 118.06 | 0.83 |
| TB_K | Ag | 59 | 1,100 | 2 | 3.39 | 2.07 | 217.64 | 1.22 |
| TB_A | Au | 375 | 0.2 | 4 | 1.07 | 11.02 | 0.013 | 1.79 |
| TB_B (clipped) | Au | 53 | 0.2 | 2 | 3.77 | 17.21 | 0.016 | 2.38 |
| TB_C (clipped) | Au | 51 | 0.05 | 0 | 0.00 | 0.00 | 0.010 | 0.78 |
| TB_D (clipped) | Au | 10 | None | 0 | 0.00 | 0.00 | 0.006 | 0.40 |
| TB_E (clipped) | Au | 44 | 0.05 | 1 | 2.27 | 0.92 | 0.010 | 0.94 |
| Contango Silver and Gold – Kitsault Valley Project | Page 178 of 253 |
| Technical Report Summary and updated Mineral Resource Estimate 2026 |
| Domain | Metal | Input N |
Cap | Capped N |
Capped (%) |
Input
metal loss (%) |
Capped mean |
CV |
| TB_F | Au | 99 | 0.1 | 2 | 2.02 | 5.78 | 0.012 | 1.48 |
| TB_G | Au | 35 | 0.05 | 1 | 2.86 | 1.50 | 0.014 | 0.96 |
| TB_H | Au | 32 | 0.2 | 1 | 3.12 | 16.34 | 0.024 | 1.63 |
| TB_I | Au | 52 | 0.1 | 8 | 15.38 | 6.86 | 0.035 | 1.01 |
| TB_J | Au | 12 | 0.3 | 1 | 8.33 | 1.08 | 0.041 | 2.05 |
| TB_K | Au | 17 | 0.02 | 1 | 5.88 | 0.60 | 0.008 | 0.65 |
| TB_A | Cu | 375 | 1,200 | 6 | 1.60 | 8.88 | 196.52 | 1.33 |
| TB_B (clipped) | Cu | 53 | 1,000 | 3 | 5.66 | 19.86 | 259.58 | 1.03 |
| TB_C (clipped) | Cu | 51 | 1,800 | 3 | 5.88 | 24.25 | 494.61 | 1.02 |
| TB_D (clipped) | Cu | 10 | 800 | 1 | 10.00 | 9.85 | 239.93 | 1.27 |
| TB_E (clipped) | Cu | 44 | 1,600 | 3 | 6.82 | 19.78 | 384.83 | 1.17 |
| TB_F | Cu | 99 | 700 | 8 | 8.08 | 8.33 | 198.55 | 1.03 |
| TB_G | Cu | 35 | 600 | 1 | 2.86 | 15.91 | 140.26 | 1.18 |
| TB_H | Cu | 32 | 800 | 2 | 6.25 | 10.04 | 257.85 | 0.90 |
| TB_I | Cu | 52 | 3,300 | 3 | 5.77 | 15.57 | 514.56 | 1.63 |
| TB_J | Cu | 12 | 250 | 1 | 8.33 | 1.64 | 87.66 | 0.83 |
| TB_K | Cu | 17 | 500 | 2 | 11.76 | 3.04 | 156.16 | 1.15 |
| TB_A | Pb | 479 | 49,000 | 5 | 1.04 | 3.77 | 5,465.83 | 1.58 |
| TB_B (clipped) | Pb | 56 | 13,500 | 7 | 12.50 | 8.59 | 4,281.65 | 0.96 |
| TB_C (clipped) | Pb | 69 | 130,000 | 3 | 4.35 | 6.12 | 14,115.18 | 2.14 |
| TB_D (clipped) | Pb | 10 | 11,000 | 1 | 10.00 | 4.50 | 3,199.86 | 1.14 |
| TB_E (clipped) | Pb | 87 | 30,000 | 2 | 2.30 | 3.85 | 5,974.26 | 1.27 |
| TB_F | Pb | 99 | 13,000 | 2 | 2.02 | 17.25 | 1,998.20 | 1.49 |
| TB_G | Pb | 35 | 15,500 | 1 | 2.86 | 35.13 | 2,402.35 | 1.75 |
| TB_H | Pb | 32 | 6,220 | 9 | 28.12 | 34.78 | 3,018.11 | 0.87 |
| TB_I | Pb | 52 | 38,000 | 2 | 3.85 | 18.05 | 2,784.31 | 2.71 |
| TB_J | Pb | 12 | 3,600 | 2 | 16.67 | 9.61 | 1,554.32 | 0.84 |
| TB_K | Pb | 17 | 5,000 | 1 | 5.88 | 5.23 | 1,159.13 | 1.07 |
| TB_A | Zn | 528 | 42,000 | 6 | 1.14 | 6.03 | 5,456.64 | 1.44 |
| TB_B (clipped) | Zn | 56 | 16,500 | 4 | 7.14 | 7.80 | 4,192.40 | 1.20 |
| TB_C (clipped) | Zn | 65 | 13,000 | 8 | 12.31 | 40.92 | 5,025.57 | 0.89 |
| Contango Silver and Gold – Kitsault Valley Project | Page 179 of 253 |
| Technical Report Summary and updated Mineral Resource Estimate 2026 |
| Domain | Metal | Input N |
Cap | Capped N |
Capped (%) |
Input
metal loss (%) |
Capped mean |
CV |
| TB_D (clipped) | Zn | 10 | 4,700 | 1 | 10.00 | 1.78 | 1,623.64 | 0.91 |
| TB_E (clipped) | Zn | 91 | 41,100 | 5 | 5.49 | 2.37 | 10,503.79 | 1.15 |
| TB_F | Zn | 99 | 5,278 | 2 | 2.02 | 9.84 | 1,471.20 | 0.83 |
| TB_G | Zn | 35 | 15,800 | 3 | 8.57 | 5.70 | 2,208.91 | 1.95 |
| TB_H | Zn | 32 | 6,300 | 4 | 12.50 | 12.61 | 1,958.70 | 1.11 |
| TB_I | Zn | 52 | 37,500 | 2 | 3.85 | 3.91 | 6,222.47 | 1.47 |
| TB_J | Zn | 12 | 2,940 | 2 | 16.67 | 5.42 | 1,328.03 | 0.74 |
| TB_K | Zn | 17 | 3,000 | 2 | 11.76 | 2.56 | 1,550.60 | 0.54 |
11.6.4.5 Bulk Density Assignment
Torbrit resources use 3.10 t/m³. The grade-screened density population contains 389 measurements from 72 drill holes and has a mean of 3.337 t/m³. The screened mean is about 7.6% higher than the assignment. It gives greater representation to mineralized samples and is not automatically a volume-representative density for every domain. The QP retained 3.10 t/m³ in the approved resource estimate. Domain membership, sulfide abundance and spatial support remain relevant to future refinement of this assignment.
11.6.4.6 Block Model Definition
The model is fully sub-blocked, with 98 × 225 × 148 = 3,263,400 nominal parent cells, 5 × 5 × 5 m parent dimensions and minimum 0.5 × 0.5 × 0.5 m sub-blocks. The Leapfrog base point is 468076, 6170973, 565 m. Its local boundary dimensions are 490, 1125, 740 m and its rotation is azimuth 330°, dip 0° and pitch 0°. The reported base-point elevation is the upper Z boundary; the model extends downward from that elevation (Table 11-37).
Table 11-37. Torbrit global block-model bounds.
| Axis | Minimum (m) | Maximum (m) |
| X / Easting | 467,513.500 | 468,500.352 |
| Y / Northing | 6,170,973.000 | 6,172,192.279 |
| Z / Elevation | -175.000 | 565.000 |
Source: model rollup, block model data. For rotated models, global axis-aligned bounds differ from local boundary dimensions. Nominal parent-cell count is not mineralized-block count. Horizontal coordinates: NAD83 / UTM Zone 9N (meters).
11.6.4.7 Grade Interpolation and Estimation Parameters
The exported estimators use inverse-distance cubed weighting and variable orientation. Grade searches differ among domains, with minimum sample requirements of two to four and maxima of 15 or 20 for the exported silver estimators. A two-sample-per-hole limit applies. Dedicated classification estimators use three samples and a one-sample-per-hole limit. The parameter export is incomplete for the TB_A silver estimator and for TB_B_Clip_A, so the earlier reviewed values for those two searches are identified separately instead of being represented as newly exported settings. Leapfrog declustering was applied separately by domain and element in every Torbrit estimator. Search and sample parameters are presented in Table 11-38.
| Contango Silver and Gold – Kitsault Valley Project | Page 180 of 253 |
| Technical Report Summary and updated Mineral Resource Estimate 2026 |
Table 11-38. Torbrit search and sample parameters.
| Domain | Metal | Estimator purpose |
Ranges
(m) major × inter. × minor |
Orientation | Samples min–max |
Max
per hole |
| TB_C (clipped) | Ag | Classification | 150 × 75 × 50 | VO | 3–3 | 1 |
| TB_D (clipped) | Ag | Classification | 150 × 75 × 50 | VO | 3–3 | 1 |
| TB_E (clipped) | Ag | Classification | 150 × 75 × 50 | VO | 3–3 | 1 |
| TB_F | Ag | Classification | 150 × 75 × 50 | VO | 3–3 | 1 |
| TB_G | Ag | Classification | 150 × 75 × 50 | VO | 3–3 | 1 |
| TB_H | Ag | Classification | 150 × 75 × 50 | VO | 3–3 | 1 |
| TB_I | Ag | Classification | 150 × 75 × 50 | VO | 3–3 | 1 |
| TB_J | Ag | Classification | 200 × 200 × 100 | VO | 3–3 | 1 |
| TB_K | Ag | Classification | 150 × 75 × 50 | VO | 3–3 | 1 |
| TB_C (clipped) | Ag/Au/Cu/Pb/Zn | Grade | 75 × 50 × 20 | VO | 3–20 | 2 |
| TB_D (clipped) | Ag/Au/Cu/Pb/Zn | Grade | 45 × 30 × 20 | VO | 3–20 | 2 |
| TB_E (clipped) | Ag/Au/Cu/Pb/Zn | Grade | 50 × 50 × 20 | VO | 3–20 | 2 |
| TB_F | Ag/Au/Cu/Pb/Zn | Grade | 120 × 72 × 24 | VO | 3–15 | 2 |
| TB_G | Ag/Au/Cu/Pb/Zn | Grade | 100 × 75 × 30 | VO | 2–20 | 2 |
| TB_H | Ag/Au/Cu/Pb/Zn | Grade | 100 × 60 × 25 | VO | 3–15 | 2 |
| TB_I | Ag/Au/Cu/Pb/Zn | Grade | 100 × 75 × 24 | VO | 4–15 | 2 |
| TB_J | Ag/Au/Cu/Pb/Zn | Grade | 175 × 150 × 35 | VO | 2–20 | 2 |
| TB_K | Ag/Au/Cu/Pb/Zn | Grade | 80 × 55 × 25 | VO | 4–15 | 2 |
| TB_A | Au/Cu/Pb/Zn | Grade | 150 × 75 × 50 | VO | 4–20 | 2 |
| TB_A | Ag | Earlier review¹ | 150 × 75 × 50 | VO | 4–20 | 2 |
| TB_B (clipped) | All | Earlier review¹ | 65 × 50 × 35 | VO | 3–10 | 2 |
11.6.4.8 Model Validation
Validation includes the comparison of block grades with domain composites, review of local orientation controls, capped and uncapped evaluations and reconciliation of modeled depletion to historical production. The initial technical review reports expected smoothing in the Torbrit swath comparisons without pervasive global bias. The final unmined export gives Ag grades of 295.43 g/t capped versus 305.28 g/t uncapped for Indicated, and 235.77 versus 259.23 g/t for Inferred. These are reductions of approximately 3.23% and 9.05% relative to the uncapped grades on the reported evaluation.
| Contango Silver and Gold – Kitsault Valley Project | Page 181 of 253 |
| Technical Report Summary and updated Mineral Resource Estimate 2026 |
11.6.4.9 Mineral Resource Classification
The selected Torbrit criteria use 35 m nominal spacing for Indicated and 100 m for Inferred, equivalent to raw AvgD limits of 24.745 m and 70.700 m. The distance estimate is evaluated within mineralized domains and reviewed against drilling and geological continuity. The QP applies greater confidence to coherent, well-supported volumes than to isolated numerical passes of the threshold. The inferred extensions lie within the accepted mineralized framework, and the majority are expected to be capable of upgrading with infill drilling and, where relevant, improved control on historical workings.
The 35/75 and 35/100 cases in the review model produce identical classified tonnes and AgEq ounces. Extending the Inferred threshold from 75 to 100 m therefore adds no resources in that test population. Increasing the Indicated threshold from 35 to 40 m transfers approximately 221,361 t and 2.111 Moz AgEq from Inferred to Indicated. The QP retained 35 m for Indicated based on the geological and spatial review. The test population is smaller than the final Torbrit export, so its absolute inventories are not used as final resources. The resulting Indicated and Inferred classification geometry for the Torbrit deposit is shown in plan, longitudinal and cross-sectional views in Figure 11-12.
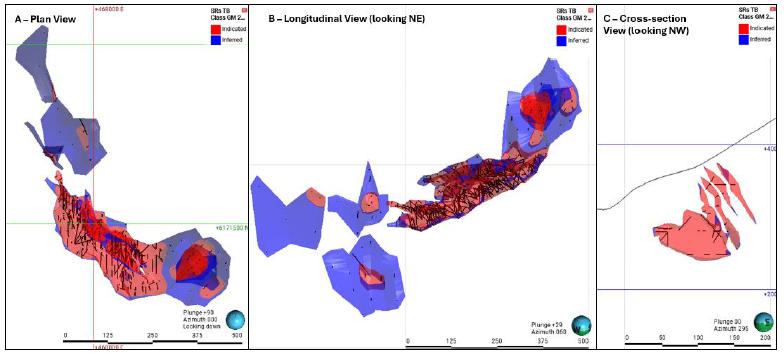
Figure 11-12. Torbrit Mineral Resource Classification geometry: A – Plan view, B – Longitudinal view (looking northeast), C – Cross- sectional view looking northwest. Red solid represents Indicated classification and blue Inferred classification.
11.6.4.10 Depletion, Exclusions and Reporting Constraints
The final resource statement uses the Unmined rows from the Torbrit export. The same report identifies approximately 1.25 Mt of mined material in the Indicated-classified portion of the model and approximately 0.01 Mt in the Inferred-classified portion. Those mined populations contain approximately 20.701 Moz and 0.145 Moz Ag, respectively, and are excluded. Historical recovered production of approximately 18.6–18.7 Moz Ag is not directly comparable with modeled in-situ contained metal. Applying the historical 84.5% recovery to production implies about 22.0 Moz Ag in mill feed. The final modeled depleted silver inventory of about 20.846 Moz is approximately 5.2% below that indicative contained-metal benchmark. This is a deposit-scale reasonableness check, not a survey reconciliation of individual stopes. Figure 11-13 illustrates the Torbrit mineralization model, distinguishing interpreted historically mined material from the remaining unmined mineralized material.
| Contango Silver and Gold – Kitsault Valley Project | Page 182 of 253 |
| Technical Report Summary and updated Mineral Resource Estimate 2026 |
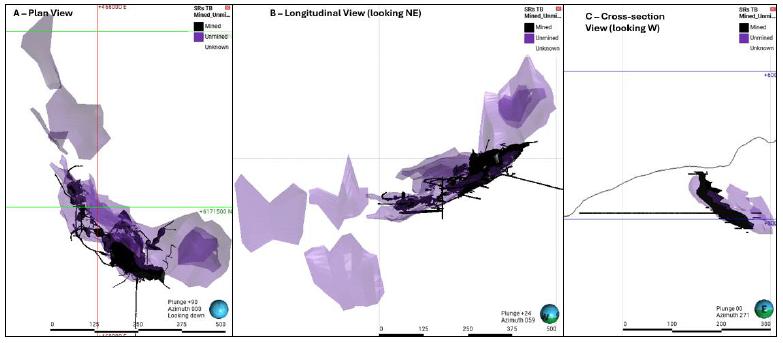
Figure 11-13. Final Torbrit mineralized unmined model (purple) and historical underground workings and mined out (depleted) areas (black).
11.6.4.11 Deposit Mineral Resource Statement
The approved unmined resource contains 3.25 Mt Indicated at 295.43 g/t Ag and 0.76 Mt Inferred at 235.77 g/t Ag (Tables 11-39 and 11-40). The historical-depletion reconciliation tab contains an earlier evaluation of 1,236,649 t and 20.386 Moz Ag. Those earlier values do not replace the mined and unmined values in the final Torbrit tab. The uncertainty in the location and extent of individual historical workings remains material to local resource interpretation.
Table 11-39. Torbrit Mineral Resource grades.
| Category | Tonnes (Mt) |
Ag (g/t) |
Au (g/t) |
Cu (%) |
Pb (%) |
Zn (%) |
| Indicated | 3.25 | 295.43 | 0.014 | 0.018 | 0.546 | 0.440 |
| Inferred | 0.76 | 235.77 | 0.013 | 0.034 | 0.545 | 0.250 |
Table 11-40. Torbrit contained metals.
| Category | Ag (Moz) |
Au (koz) |
Cu (Mlb) |
Pb (Mlb) |
Zn (Mlb) |
AgEq (Moz) |
| Indicated | 30.847 | 1.428 | 1.29 | 39.06 | 31.52 | 32.394 |
| Inferred | 5.747 | 0.329 | 0.57 | 9.10 | 4.18 | 6.057 |
Contained metals are in situ. NR means not reported, not zero. Rounding may cause apparent differences.
| Contango Silver and Gold – Kitsault Valley Project | Page 183 of 253 |
| Technical Report Summary and updated Mineral Resource Estimate 2026 |
| 11.6.5 | Dolly Varden |
11.6.5.1 Estimation Bias and Input Data
The Dolly Varden deposit estimate is complete and included in the approved 2026 resource statement. It uses DV Main GM 2026 and SRs DV_Main Estimation Dataset Capped.
The deposit header inventory contains 78 holes totaling 12,351.50 m. Of these, 0 holes totaling 0.00 m fall in years after the preceding effective-date year; a further 1 hole totaling 390.00 m are in the boundary year. These are inventory counts, with the estimation-input population defined by domain and assay acceptance as described in Section 11.2.
11.6.5.2 Geological Interpretation and Estimation Domains
The reported estimate is restricted to the DV_Main mineralized domain (Table 11-41, Figure 11-14). Historical mining is represented by a separate mined/unmined geological evaluation. The earlier classification review discusses hanging-wall and footwall meshes, but those meshes are not separate reporting domains in the final DV_Main-filtered resource export. The final chapter therefore does not assign resources to DVHW or DVFW independently of the approved reporting domain.
Table 11-41. Dolly Varden estimation domains
| Model domain | Geological role |
| DV_Main | Principal Dolly Varden mineralized domain used for reporting |
| Contango Silver and Gold – Kitsault Valley Project | Page 184 of 253 |
| Technical Report Summary and updated Mineral Resource Estimate 2026 |
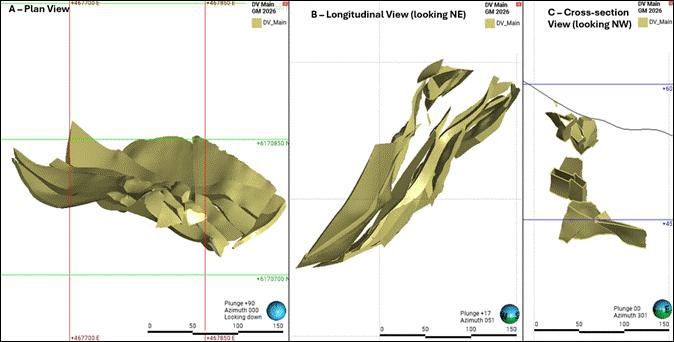
Figure 11-14. Dolly Varden geometry and representative sections showing the modeled domain. A – Plan View, B – Longitudinal view (looking northeast), C – Cross-sectional view (looking northwest).
11.6.5.3 Sample Statistics and Compositing
The prepared capping population contains 445 Ag records, 224 Au and Cu records, and 235 Pb and Zn records. The differing populations reflect the less complete historical coverage of metals other than silver. The capped mean silver grade is 246.82 g/t with a coefficient of variation of 1.99. The capped Au mean is 0.0224 g/t. The resource average is calculated from qualifying blocks and is not expected to equal the arithmetic mean of these broader input populations.
Dolly Varden Main samples were composited to a target length of 1.25 m using the Within boundary setting and hard domain boundaries. Residual end lengths of less than 1.0 m were distributed equally within the boundary interval. No additional weighting was applied during compositing. The following capping table reports capped input means and coefficients of variation. The capped arithmetic input statistics are distinct from declustered statistics and volume-weighted block grades.
11.6.5.4 Grade Capping
Caps of 3,000 g/t Ag, 0.20 g/t Au, 2,200 ppm Cu, 25,500 ppm Pb and 46,000 ppm Zn are applied in DV_Main (Table 11-42). The silver cap affects six of 445 records, or 1.35%, with an input-metal reduction of 6.30%. The Pb and Zn input-metal reductions are 38.29% and 25.37%, reflecting more pronounced upper-tail influence in those populations. The QP considers this treatment necessary to limit extrapolation of local high values through the remaining mineralized volume.
| Contango Silver and Gold – Kitsault Valley Project | Page 185 of 253 |
| Technical Report Summary and updated Mineral Resource Estimate 2026 |
Table 11-42. Dolly Varden caps and capped input statistics.
| Domain | Metal | Input N |
Cap | Capped N |
Capped (%) |
Input
metal loss (%) |
Capped mean |
CV |
| DV_Main | Ag | 445 | 3,000 | 6 | 1.35 | 6.30 | 246.82 | 1.99 |
| DV_Main | Au | 224 | 0.2 | 3 | 1.34 | 6.13 | 0.022 | 1.72 |
| DV_Main | Cu | 224 | 2,200 | 7 | 3.12 | 20.04 | 224.93 | 1.94 |
| DV_Main | Pb | 235 | 25,500 | 8 | 3.40 | 38.29 | 2,547.65 | 2.17 |
| DV_Main | Zn | 235 | 46,000 | 12 | 5.11 | 25.37 | 10,622.15 | 1.15 |
11.6.5.5 Bulk Density Assignment
The model uses 3.00 t/m³. The grade-screened density review contains 156 measurements from 22 drill holes and has a mean of 2.977 t/m³, approximately 0.8% below the selected assignment. The QP considers the density appropriate for the current resource. Interpretation of remnant mineralization near historical workings requires the density assignment and depletion model to be considered together.
11.6.5.6 Block Model Definition
The model is fully sub-blocked, with 80 × 39 × 72 = 224,640 nominal parent cells, 5 × 5 × 5 m parent dimensions and minimum 0.5 × 0.5 × 0.5 m sub-blocks. The Leapfrog base point is 467620, 6170686, 689 m. Its local boundary dimensions are 400, 195, 360 m and its rotation is azimuth 0°, dip 0° and pitch 0°. The reported base-point elevation is the upper Z boundary; the model extends downward from that elevation (Table 11-43).
Table 11-43. Dolly Varden global block-model bounds.
| Axis | Minimum (m) | Maximum (m) |
| X / Easting | 467,620.000 | 468,020.000 |
| Y / Northing | 6,170,686.000 | 6,170,881.000 |
| Z / Elevation | 329.000 | 689.000 |
Source: model rollup, block model data. For rotated models, global axis-aligned bounds differ from local boundary dimensions. Nominal parent-cell count is not mineralized-block count. Horizontal coordinates: NAD83 / UTM Zone 9N (meters).
11.6.5.7 Grade Interpolation and Estimation Parameters
Ag, Au, Cu, Pb and Zn are estimated using IDW with power 3, a variable-orientation 150 × 100 × 50 m search and hard domain boundaries. Each estimator requires 4 to 15 composites and limits contributions to two samples per hole. Leapfrog declustering was applied separately by domain and element in every Dolly Varden Main estimator. The grade-estimator export identifies the SRs DV_Main Grade Capped 2026 declustering object. The export contains the grade estimators but no separately named classification estimator, so it does not by itself establish which AvgD field was used for classification. Search and sample parameters are presented in Table 11-44.
| Contango Silver and Gold – Kitsault Valley Project | Page 186 of 253 |
| Technical Report Summary and updated Mineral Resource Estimate 2026 |
Table 11-44. Dolly Varden search and sample parameters.
| Domain | Metal | Estimator purpose |
Ranges
(m) major × inter. × minor |
Orientation | Samples min–max |
Max
per hole |
| DV_Main | Ag/Au/Cu/Pb/Zn | Grade | 150 × 100 × 50 | VO | 4–15 | 2 |
Source: parameters - DollyVarden.xlsx, Search and Interpolant. All listed current estimators are IDW, power 3. ²VO = variable orientation; fixed values are dip / dip azimuth / pitch in degrees. Per-sector drill-hole-limit option is enabled.
11.6.5.8 Model Validation
Validation emphasizes the distribution of remnant mineralization relative to historical workings, the representation of high-grade silver samples and the influence of sparse Au and base-metal data. The QP reviewed the accepted DV_Main domain and the unmined reporting population. Capped base-metal distributions are retained in the equivalent calculation, with their more limited sample support recognized as a source of uncertainty.
11.6.5.9 Mineral Resource Classification
The classification review selects 30/70 for Dolly Varden. The 30/70 selection reflects the QP’s assessment of continuity and support in the remnant mineralized domain.
The valid historical test cases compare 25/50, 30/50, 35/50 and 30/40. Their results demonstrate the sensitivity of the remnant inventory to classification boundaries, but their tonnes and ounces differ from the final DV_Main export. They are therefore reported as supporting review-model results only. The QP’s classification decision is based on geological and sample support rather than maximizing classified tonnes. Continued infill work is expected to upgrade the majority of Inferred material where the continuity and position of the remaining mineralized lenses can be confirmed. The resulting Indicated and Inferred classification geometry for the Dolly Varden deposit is shown in plan, longitudinal and cross-sectional views in Figure 11-15.
| Contango Silver and Gold – Kitsault Valley Project | Page 187 of 253 |
| Technical Report Summary and updated Mineral Resource Estimate 2026 |
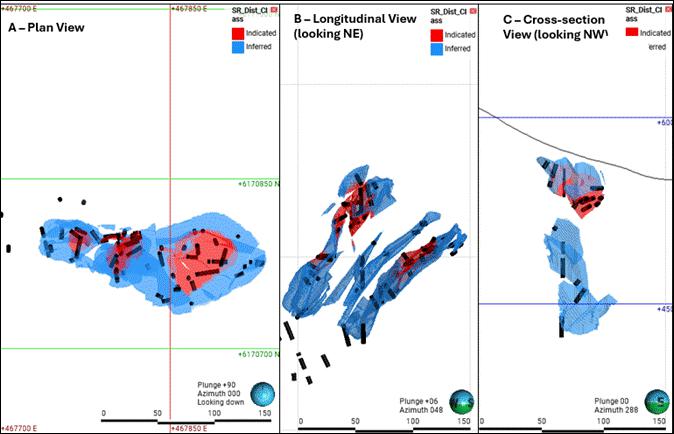
Figure 11-15. Dolly Varden Mineral Resource Estimate geometry: A – Plan view, B – Longitudinal view (looking northeast), C – Cross-sectional view looking northwest. Red solid represents Indicated classification and blue Inferred classification.
11.6.5.10 Depletion, Exclusions and Reporting Constraints
The final resource statement includes only the unmined Indicated and unmined Inferred rows under the DV_Main filter. Mined material and Cat4 are excluded. The export identifies approximately 0.1886 Moz AgEq and 0.1761 Moz Ag in the mined Indicated and Inferred populations. Those quantities are not added to the remaining resource. Additional mined Cat4 material is present in the model but has no resource classification. Figure 11-16 illustrates the Dolly Varden mineralization model, distinguishing interpreted historically mined material from the remaining unmined mineralized material.
| Contango Silver and Gold – Kitsault Valley Project | Page 188 of 253 |
| Technical Report Summary and updated Mineral Resource Estimate 2026 |
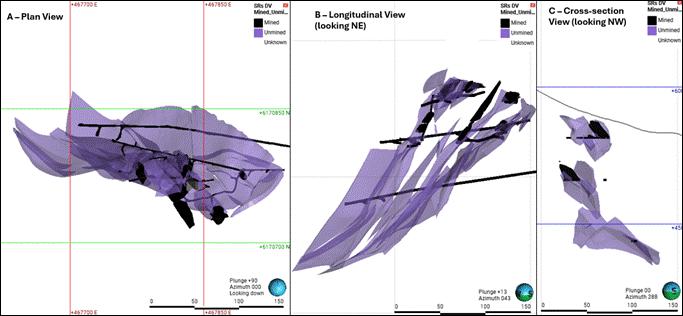
Figure 11-16. Final Dolly Varden mineralized unmined model (purple) and historical underground workings and mined out (depleted) areas (black).
11.6.5.11 Deposit Mineral Resource Statement
The approved estimate contains 0.09 Mt Indicated at 426.44 g/t Ag and 0.14 Mt Inferred at 328.78 g/t Ag (Table 11-45). Indicated AgEq decreases from 2.078 to 1.321 Moz relative to the preceding statement, while Inferred AgEq increases from 0.754 to 1.604 Moz (Table 11-46). The change reflects the revised model, remnant-volume interpretation, estimation and classification, rather than substantial newly drilled deposit expansion.
Table 11-45. Dolly Varden Mineral Resource grades.
| Category | Tonnes (Mt) |
Ag (g/t) |
Au (g/t) |
Cu (%) |
Pb (%) |
Zn (%) |
| Indicated | 0.09 | 426.44 | 0.020 | 0.025 | 0.432 | 1.459 |
| Inferred | 0.14 | 328.78 | 0.030 | 0.048 | 0.506 | 1.519 |
Source: approved Roll Up_USE worksheet. Cut-off: 132 g/t AgEq. In-situ, unmined resource before mining dilution and recovery. Mineral Resource effective date: September 11, 2026.
Table 11-46. Dolly Varden contained metals.
| Category | Ag (Moz) |
Au (koz) |
Cu (Mlb) |
Pb (Mlb) |
Zn (Mlb) |
AgEq (Moz) |
| Indicated | 1.235 | 0.056 | 0.05 | 0.86 | 2.90 | 1.321 |
| Inferred | 1.456 | 0.149 | 0.15 | 1.54 | 4.61 | 1.604 |
Contained metals are in situ. NR means not reported, not zero. Rounding may cause apparent differences.
| Contango Silver and Gold – Kitsault Valley Project | Page 189 of 253 |
| Technical Report Summary and updated Mineral Resource Estimate 2026 |
| 11.6.6 | North Star |
11.6.6.1 Estimation Bias and Input Data
The North Star estimate uses Northstar GM 2026 and the prepared SRs Northstar Estimation Dataset Capped. The approved resource export identifies the DIST 30_70 classification evaluation. It replaces the deposit estimate with an underlying effective date of May 8, 2019.
The deposit header inventory contains 144 holes totaling 17,780.66 m. Of these, 10 holes totaling 3,834.35 m fall in years after the preceding effective-date year. These are inventory counts, with the estimation-input population defined by domain and assay acceptance as described in Section 11.2.
11.6.6.2 Geological Interpretation and Estimation Domains
The mineralized volume is represented by the DV_Northstar_VN domain and a separate mined/unmined evaluation (Table 11-47, Figure 11-17). The geometry is interpreted from drilling and historical information within the silver-bearing mineralized system. The hard domain boundary limits grade interpolation to the accepted vein volume. The final model does not treat all material near the vein or within the broader bounding box as resource.
Table 11-47. North Star estimation domains.
| Model domain | Geological role |
| DV_Northstar_VN | Principal North Star mineralized vein domain |
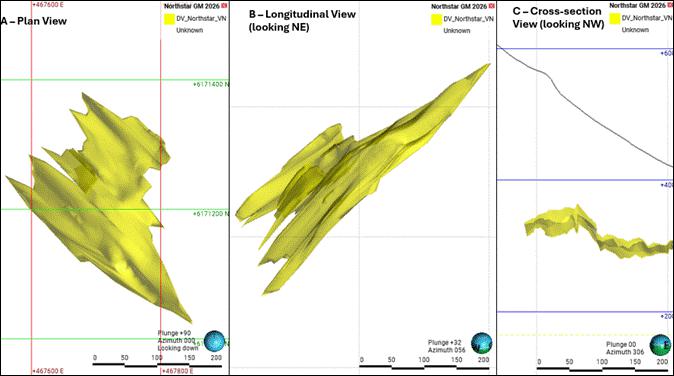
Figure 11-17. Northstar geometry and representative sections showing the modeled domain. A – Plan View, B – Longitudinal view (looking northeast), C – Cross-sectional view (looking northwest).
| Contango Silver and Gold – Kitsault Valley Project | Page 190 of 253 |
| Technical Report Summary and updated Mineral Resource Estimate 2026 |
11.6.6.3 Sample Statistics and Compositing
The prepared population contains 638 Ag records but only 61 Au records, 191 Cu records, 299 Pb records and 316 Zn records. The capped mean silver grade is 197.43 g/t with a coefficient of variation of 1.31. The much smaller gold population and incomplete base-metal coverage are material considerations because those metals contribute to AgEq, particularly in the lower-silver-grade Inferred population.
North Star samples were composited to a target length of 1.5 m using the Within boundary setting and hard domain boundaries. Residual end lengths of less than 1.0 m were distributed equally within the boundary interval. No additional weighting was applied during compositing. The following capping table reports capped input means and coefficients of variation. The capped arithmetic input statistics are distinct from declustered statistics and volume-weighted block grades.
11.6.6.4 Grade Capping
The current caps are 1,700 g/t Ag, 1.70 g/t Au, 5,400 ppm Cu, 32,000 ppm Pb and 100,000 ppm Zn (Table 11-48). The silver cap affects five of 638 records, or 0.78%, and reduces input silver metal by 1.03%. Lead has a greater input-metal reduction of 28.94%, while Au, Cu and Zn reductions are 11.31%, 12.85% and 6.10%.
Table 11-48. North Star caps and capped input statistics.
| Domain | Metal | Input N |
Cap | Capped N |
Capped (%) |
Input
metal loss (%) |
Capped mean |
CV |
| North Star vein | Ag | 638 | 1,700 | 5 | 0.78 | 1.03 | 197.43 | 1.31 |
| North Star vein | Au | 61 | 1.7 | 3 | 4.92 | 11.31 | 0.204 | 1.81 |
| North Star vein | Cu | 191 | 5,400 | 9 | 4.71 | 12.85 | 936.82 | 1.37 |
| North Star vein | Pb | 299 | 32,000 | 13 | 4.35 | 28.94 | 6,420.62 | 1.30 |
| North Star vein | Zn | 316 | 100,000 | 9 | 2.85 | 6.10 | 16,189.24 | 1.49 |
11.6.6.5 Bulk Density Assignment
The QP assigned 3.00 t/m³ by analogy with Dolly Varden and the comparable mineralized setting. The North Star source contains 42 density records, but none qualifies under the silver-greater-than-10-g/t screen used in the density review. The screen therefore provides no direct North Star mean for comparison. The assignment does not imply that no density information exists; it identifies the limited support within the selected mineralized population. Additional measurements backflagged to the resource domain are recommended.
11.6.6.6 Block Model Definition
The model is fully sub-blocked, with 99 × 88 × 87 = 757,944 nominal parent cells, 5 × 5 × 5 m parent dimensions and minimum 0.5 × 0.5 × 0.5 m sub-blocks. The Leapfrog base point is 467381.385, 6171225.407, 540 m. Its local boundary dimensions are 495, 440, 435 m and its rotation is azimuth 45°, dip 0° and pitch 0°. The reported base-point elevation is the upper Z boundary; the model extends downward from that elevation (Table 11-49).
| Contango Silver and Gold – Kitsault Valley Project | Page 191 of 253 |
| Technical Report Summary and updated Mineral Resource Estimate 2026 |
Table 11-49. North Star global block-model bounds.
| Axis | Minimum (m) | Maximum (m) |
| X / Easting | 467,381.385 | 468,042.530 |
| Y / Northing | 6,170,875.389 | 6,171,536.534 |
| Z / Elevation | 105.000 | 540.000 |
Source: model rollup, block model data. For rotated models, global axis-aligned bounds differ from local boundary dimensions. Nominal parent-cell count is not mineralized-block count. Horizontal coordinates: NAD83 / UTM Zone 9N (meters).
11.6.6.7 Grade Interpolation and Estimation Parameters
The Ag estimator uses a variable-orientation 200 × 100 × 35 m search. Au, Cu, Pb and Zn use 150 × 100 × 35 m variable-orientation searches. All grade estimators use IDW with power 3, select 4 to 15 composites and impose a two-sample-per-hole limit. Leapfrog declustering was applied separately by domain and element in every North Star estimator; the grade-estimator export identifies the North Star declustering object. The Class_ID 3 estimator uses a variable-orientation 200 × 150 × 35 m search and selects three samples with a one-sample-per-hole limit. A fixed-orientation nearest-neighbour Ag estimator is retained as a comparison. Search and sample parameters are presented in Table 11-50).
Table 11-50. North Star search and sample parameters.
| Domain | Metal | Estimator purpose |
Ranges
(m) major × inter. × minor |
Orientation | Samples min–max |
Max
per hole |
| North Star vein | Ag | Classification | 200 × 150 × 35 | VO | 3–3 | 1 |
| North Star vein | Ag | Grade | 200 × 100 × 35 | VO | 4–15 | 2 |
| North Star vein | Au/Cu/Pb/Zn | Grade | 150 × 100 × 35 | VO | 4–15 | 2 |
Source: parameters North Star.xlsx, Search and Interpolant. All listed current estimators are IDW, power 3. ²VO = variable orientation; fixed values are dip / dip azimuth / pitch in degrees. Per-sector drill-hole-limit option is enabled.
11.6.6.8 Model Validation
The QP reviewed block grades and domain boundaries in section, the distribution of historical and recent samples, and the change in the Inferred envelope under the 30/70 classification. Validation of Au and base-metal credits requires particular attention because their sample populations are smaller than the silver population. The final Inferred resource has an Ag grade of 123.99 g/t and an AgEq grade of 213.24 g/t. Its qualification at 132 g/t AgEq therefore depends materially on the other estimated metals and their assumed recoveries.
11.6.6.9 Mineral Resource Classification
The selected criteria are 30 m nominal spacing for Indicated and 70 m for Inferred, equivalent to raw AvgD limits of 21.210 m and 49.490 m. The calculation uses dedicated classification AvgD divided by 0.707. The QP retained the 30 m Indicated boundary and extended the Inferred boundary from 50 to 70 m where the vein remains geologically coherent and supported by the estimation. Isolated or unsupported projections remain unclassified. Infill drilling and improved density support are expected to permit upgrading of the majority of the Inferred resource, subject to confirming the interpreted continuity.
| Contango Silver and Gold – Kitsault Valley Project | Page 192 of 253 |
| Technical Report Summary and updated Mineral Resource Estimate 2026 |
The selected 30/70 case contains 357,735.38 t Indicated and 231,552.00 t Inferred. Compared with 30/50, the selected case adds approximately 54,627 t and 0.319 Moz AgEq to Inferred without changing Indicated. The unclassified above-cut-off inventory decreases from 77,849.25 t to 23,221.88 t. Reducing the Indicated boundary from 30 to 25 m transfers approximately 65,081 t and 0.562 Moz AgEq to Inferred; raising it to 35 m transfers approximately 66,335 t and 0.494 Moz AgEq to Indicated. These results quantify the neighboring choices but do not independently establish geological confidence. The resulting Indicated and Inferred classification geometry for the North Star deposit is shown in plan, longitudinal and cross-sectional views in Figure 11-18.
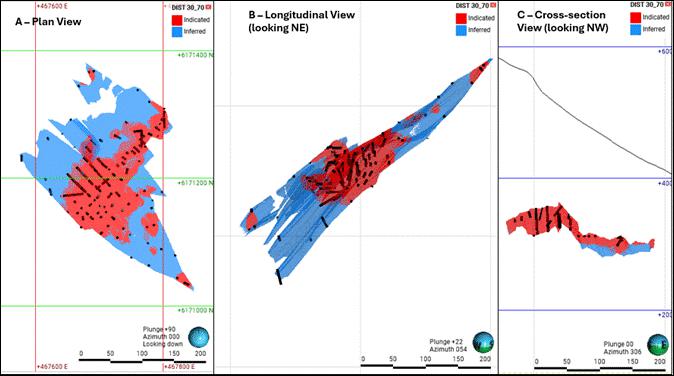
Figure 11-18. Northstar Mineral Resource classification geometry. A – Plan view, B – Longitudinal view (looking northeast), C – Cross-sectional view (looking northwest). Red solid represents Indicated classification and blue Inferred classification.
11.6.6.10 Depletion, Exclusions and Reporting Constraints
Only unmined Indicated and Inferred material is reported. The detailed selected classification export identifies 483.75 t of modeled mined material, containing approximately 3,275 oz AgEq and 2,504 oz Ag. The small modeled depletion is excluded even though its tonnage rounds to 0.00 Mt in the resource report. The Cat4 population is also excluded. Figure 11-19 illustrates the North Star mineralization model, showing the remaining unmined mineralized material in relation to the interpreted historical underground workings and depleted areas.
| Contango Silver and Gold – Kitsault Valley Project | Page 193 of 253 |
| Technical Report Summary and updated Mineral Resource Estimate 2026 |
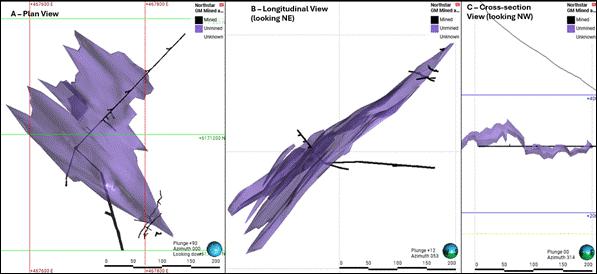
Figure 11-19. Northstar final mineralized unmined model (purple) and historical underground workings and mined out (depleted) areas (black).
11.6.6.11 Deposit Mineral Resource Statement
The final North Star estimate contains 0.36 Mt Indicated and 0.23 Mt Inferred, with AgEq inventories of 3.571 Moz and 1.587 Moz (Tables 11-51 and 11-52). Confidence in density and non-silver credits remains a specific limitation, especially for the expanded Inferred population.
Table 11-51. North Star Mineral Resource grades.
| Category | Tonnes (Mt) |
Ag (g/t) |
Au (g/t) |
Cu (%) |
Pb (%) |
Zn (%) |
| Indicated | 0.36 | 249.18 | 0.290 | 0.079 | 0.744 | 2.076 |
| Inferred | 0.23 | 123.99 | 0.540 | 0.134 | 0.898 | 2.650 |
Table 11-52. North Star contained metals.
| Category | Ag (Moz) |
Au (koz) |
Cu (Mlb) |
Pb (Mlb) |
Zn (Mlb) |
AgEq (Moz) |
| Indicated | 2.866 | 3.322 | 0.62 | 5.87 | 16.37 | 3.571 |
| Inferred | 0.923 | 4.002 | 0.68 | 4.59 | 13.53 | 1.587 |
| 11.7 | Consolidated Kitsault Valley Mineral Resource Statement |
The consolidated statement presents the final approved Mineral Resource quantities as of September 11, 2026 by region, deposit and confidence category. The consolidated Indicated and Inferred Mineral Resource tonnes, grades and contained metals are presented by deposit in Tables 11-53 through 11-56, with regional and project totals by resource category summarized in Table 11-57. The seven updated deposits use 132 g/t AgEq. South Reef retains its 2.0 g/t AuEq cut-off and original physical-resource estimate. Regional contained-metal totals are sums of the approved deposit values, with appropriate rounding.
| Contango Silver and Gold – Kitsault Valley Project | Page 194 of 253 |
| Technical Report Summary and updated Mineral Resource Estimate 2026 |
Table 11-53. Indicated Mineral Resource tonnes and grades.
| Deposit | Tonnes (Mt) |
Ag (g/t) |
Au (g/t) |
Cu (%) |
Pb (%) |
Zn (%) |
| Homestake Main | 1.43 | 49.55 | 6.350 | 0.181 | 0.058 | 0.112 |
| Homestake Silver | 0.71 | 168.26 | 4.160 | 0.039 | 0.263 | 0.222 |
| Wolf | 1.53 | 301.90 | 0.050 | 0.027 | 0.714 | 0.864 |
| Kitsol | 0.29 | 301.13 | 0.030 | 0.029 | 0.368 | 0.300 |
| Torbrit | 3.25 | 295.43 | 0.014 | 0.018 | 0.546 | 0.440 |
| Dolly Varden | 0.09 | 426.44 | 0.020 | 0.025 | 0.432 | 1.459 |
| North Star | 0.36 | 249.18 | 0.290 | 0.079 | 0.744 | 2.076 |
Table 11-54. Indicated Mineral Resource contained metals.
| Deposit | Ag (Moz) |
Au (koz) |
Cu (Mlb) |
Pb (Mlb) |
Zn (Mlb) |
AgEq (Moz) |
| Homestake Main | 2.277 | 292.009 | 5.71 | 1.83 | 3.53 | 23.308 |
| Homestake Silver | 3.856 | 95.407 | 0.61 | 4.13 | 3.49 | 9.968 |
| Wolf | 14.850 | 2.246 | 0.92 | 24.09 | 29.15 | 16.108 |
| Kitsol | 2.766 | 0.231 | 0.18 | 2.32 | 1.89 | 2.876 |
| Torbrit | 30.847 | 1.428 | 1.29 | 39.06 | 31.52 | 32.394 |
| Dolly Varden | 1.235 | 0.056 | 0.05 | 0.86 | 2.90 | 1.321 |
| North Star | 2.866 | 3.322 | 0.62 | 5.87 | 16.37 | 3.571 |
Table 11-55. Inferred Mineral Resource tonnes and grades
| Deposit | Tonnes (Mt) |
Ag (g/t) |
Au (g/t) |
Cu (%) |
Pb (%) |
Zn (%) |
| Homestake Main | 0.52 | 11.09 | 4.610 | 0.143 | 0.056 | 0.127 |
| Homestake Silver | 3.63 | 65.88 | 3.550 | 0.028 | 0.203 | 0.165 |
| South Reef | 0.445 | 4.90 | 8.680 | 0.040 | 0.001 | NR |
| Wolf | 0.44 | 381.40 | 0.030 | 0.030 | 0.707 | 1.100 |
| Kitsol | 0.14 | 303.04 | 0.020 | 0.033 | 0.434 | 0.316 |
| Torbrit | 0.76 | 235.77 | 0.013 | 0.034 | 0.545 | 0.250 |
| Dolly Varden | 0.14 | 328.78 | 0.030 | 0.048 | 0.506 | 1.519 |
| North Star | 0.23 | 123.99 | 0.540 | 0.134 | 0.898 | 2.650 |
Source: approved Roll Up_USE. Cut-off 132 g/t AgEq except South Reef at 2.0 g/t AuEq. NR = not reported. The reference point is in-situ, unmined material before mining dilution and mining recovery. Mineral Resource effective date: September 11, 2026.
| Contango Silver and Gold – Kitsault Valley Project | Page 195 of 253 |
| Technical Report Summary and updated Mineral Resource Estimate 2026 |
Table 11-56. Inferred Mineral Resource contained metals.
| Deposit | Ag (Moz) |
Au (koz) |
Cu (Mlb) |
Pb (Mlb) |
Zn (Mlb) |
AgEq (Moz) |
| Homestake Main | 0.186 | 77.211 | 1.64 | 0.64 | 1.46 | 5.770 |
| Homestake Silver | 7.680 | 414.413 | 2.24 | 16.22 | 13.23 | 34.132 |
| South Reef | 0.100 | 124.200 | 0.36 | 0.00 | NR | 8.600 |
| Wolf | 5.390 | 0.411 | 0.30 | 6.85 | 10.66 | 5.790 |
| Kitsol | 1.323 | 0.101 | 0.10 | 1.30 | 0.94 | 1.380 |
| Torbrit | 5.747 | 0.329 | 0.57 | 9.10 | 4.18 | 6.057 |
| Dolly Varden | 1.456 | 0.149 | 0.15 | 1.54 | 4.61 | 1.604 |
| North Star | 0.923 | 4.002 | 0.68 | 4.59 | 13.53 | 1.587 |
Table 11-57. Regional and project totals by resource category.
| Category and region | Tonnes (Mt) |
Ag (Moz) |
Au (koz) |
Cu (Mlb) |
Pb (Mlb) |
Zn (Mlb) |
AgEq (Moz) |
| Indicated Homestake |
2.140 | 6.133 | 387.416 | 6.32 | 5.96 | 7.02 | 33.275 |
| Indicated Dolly Varden |
5.520 | 52.565 | 7.285 | 3.06 | 72.20 | 81.83 | 56.270 |
| Indicated Project total |
7.660 | 58.698 | 394.700 | 9.38 | 78.16 | 88.85 | 89.545 |
| Inferred Homestake |
4.595 | 7.965 | 615.824 | 4.24 | 16.86 | 14.69¹ | 48.501 |
| Inferred Dolly Varden |
1.710 | 14.839 | 4.993 | 1.80 | 23.38 | 33.92 | 16.419 |
| Inferred Project total |
6.305 | 22.804 | 620.817 | 6.04 | 40.24 | 48.61¹ | 64.920 |
The resource statement is subject to the following reporting notes: the effective date is September 11, 2026; Dave Larimer is the responsible QP and an employee of the Company; no Measured resources or Mineral Reserves are reported; historical mined material and unclassified blocks are excluded; quantities and grades are rounded to reflect the precision of the estimate; mineral-equivalent grades are calculated using the disclosed prices, recoveries and units; and Mineral Resources do not have demonstrated economic viability. The Inferred category has lower confidence than Indicated and cannot be converted directly to Mineral Reserves.
| 11.8 | Comparison with Previously Reported Estimates |
The comparison is against the resources presented in the 2023 combined Kitsault Valley technical report. The underlying resource effective dates are January 20, 2022, for the Homestake deposits and May 8, 2019, for the Dolly Varden-area deposits. These are different from the effective date of September 28, 2022, effective date of the combined report. Kitsol was included in Torbrit previously, so the principal numerical comparison combines the current Torbrit and Kitsol values.
| Contango Silver and Gold – Kitsault Valley Project | Page 196 of 253 |
| Technical Report Summary and updated Mineral Resource Estimate 2026 |
The AgEq comparison columns are reproduced from the approved rollup. The earlier southern resources were reported principally as silver resources at 150 g/t Ag, while the updated models include additional metals at 132 g/t AgEq. The earlier Homestake estimates used a different AuEq price and recovery basis. Differences in equivalent ounces therefore combine physical-resource changes with changes in reporting basis. Tables 11-58 and 11-59 compare the Indicated and Inferred tonnage and contained AgEq, respectively, in the 2026 estimate with the preceding resource statement by deposit or reporting unit.
Table 11-58. Indicated comparison with the preceding resource statement.
| Deposit / reporting unit | Prior Mt |
2026 Mt |
Change Mt |
Prior
AgEq Moz |
2026
AgEq Moz |
Change Moz |
| Homestake Main | 0.736 | 1.430 | 0.694 | 13.437 | 23.308 | 9.871 |
| Homestake Silver | – | 0.710 | 0.710 | – | 9.968 | 9.968 |
| Torbrit + Kitsol | 2.623 | 3.540 | 0.917 | 25.025 | 35.269 | 10.244 |
| Wolf | 0.402 | 1.530 | 1.128 | 3.834 | 16.108 | 12.274 |
| Dolly Varden | 0.156 | 0.090 | –0.066 | 2.078 | 1.321 | –0.757 |
| North Star | 0.236 | 0.360 | 0.124 | 1.994 | 3.571 | 1.577 |
| Project total | 4.153 | 7.660 | 3.507 | 46.368 | 89.545 | 43.177 |
Table 11-59. Inferred comparison with the preceding resource statement.
| Deposit / reporting unit | Prior Mt |
2026 Mt |
Change Mt |
Prior
AgEq Moz |
2026
AgEq Moz |
Change Moz |
| Homestake Main | 1.747 | 0.520 | –1.227 | 27.820 | 5.770 | –22.050 |
| Homestake Silver | 3.354 | 3.630 | 0.276 | 38.873 | 34.132 | –4.741 |
| South Reef | 0.445 | 0.445 | 0.000 | 8.585 | 8.600 | 0.015 |
| Torbrit + Kitsol | 1.185 | 0.900 | –0.285 | 10.588 | 7.437 | –3.151 |
| Wolf | 0.010 | 0.440 | 0.430 | 0.070 | 5.790 | 5.720 |
| Dolly Varden | 0.086 | 0.140 | 0.054 | 0.754 | 1.604 | 0.850 |
| North Star | 0.005 | 0.230 | 0.225 | 0.035 | 1.587 | 1.552 |
| Project total | 6.831 | 6.305 | –0.526 | 86.725 | 64.920 | –21.805 |
Indicated tonnage increases by 3.507 Mt, or approximately 84.4%, and the approved Indicated AgEq inventory increases by 43.177 Moz, or approximately 93.1%. Inferred tonnage decreases by 0.526 Mt, or approximately 7.7%, and Inferred AgEq decreases by 21.805 Moz, or approximately 25.1%. These category changes are net comparisons of separately estimated inventories. They are not a block-by-block transition matrix.
| Contango Silver and Gold – Kitsault Valley Project | Page 197 of 253 |
| Technical Report Summary and updated Mineral Resource Estimate 2026 |
Additional drilling materially expands the database at Wolf and the Homestake deposits. At Homestake, revised lenses and low-grade envelopes, changes in high-grade treatment and a different allocation between Indicated and Inferred contribute to the reported grade changes. At Torbrit, separate Kitsol reporting and updated depletion must be considered. At Dolly Varden, the revised remnant model and classification are more important explanations than new drilling. North Star’s Inferred quantity also reflects the selected 30/70 classification and non-silver contributions to AgEq. South Reef’s physical resources remain unchanged.
The effects of geology and drilling, capping and interpolation, density, classification, depletion, metal prices, recoveries and spatial constraints are not additive unless each effect is isolated through controlled model reruns. The supplied files do not contain a common-block reconciliation that isolates all of those drivers. Consequently, no percentage of the net resource change is assigned uniquely to one driver. Figure 11-20 summarizes the change in reported AgEq by deposit and resource category between the preceding and 2026 estimates; the comparison reflects their respective reporting bases and is not a constant-assumption revaluation.
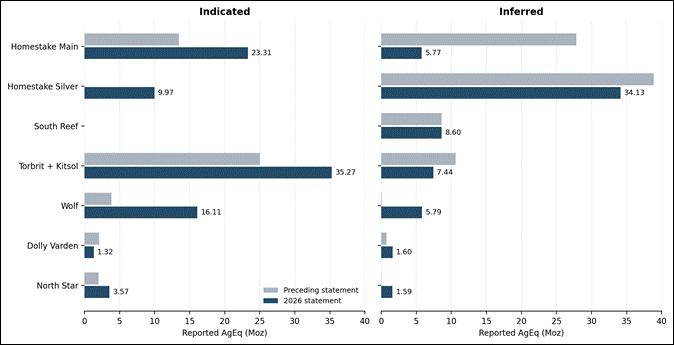
Figure 11-20. Change in reported AgEq by deposit and resource category. Values are on their respective reporting bases, including different cut-offs, metal prices and recoveries. This is not a constant-assumption revaluation. Torbrit and Kitsol are combined to match the preceding reporting unit. South Reef has no Indicated resource.
| 11.9 | Resource Sensitivity |
Sensitivity work distinguishes a change in the classification of an existing estimate from a change in the estimate itself or in the set of blocks qualifying for reporting. The supplied distance workbook contains controlled classification alternatives. North Star and Kitsol provide detailed selected scenario exports that reconcile to the final resource values. Homestake, Wolf, Torbrit and Dolly Varden review populations differ from their final exports and are retained as historical test populations supporting the QP’s decisions. Tables 11-60 through 11-66 summarize the classification-distance sensitivity analyses for Homestake Main, Homestake Silver, Wolf, Kitsol, Torbrit, Dolly Varden and North Star, respectively, showing how alternative spacing scenarios affect Indicated, Inferred and unclassified tonnage and AgEq inventories.
| Contango Silver and Gold – Kitsault Valley Project | Page 198 of 253 |
| Technical Report Summary and updated Mineral Resource Estimate 2026 |
Table 11-60. Homestake Main classification-distance sensitivity.
| Scenario¹ | Indicated Mt |
Inferred Mt |
Unclassified kt |
Indicated
AgEq Moz |
Inferred
AgEq Moz |
| 38/100 | 1.446 | 0.504 | 0.01 | 22.706 | 6.372 |
| 35/100 | 1.273 | 0.677 | 0.01 | 20.140 | 8.937 |
| 42/100 | 1.627 | 0.324 | 0.01 | 25.268 | 3.809 |
| 38/75 | 1.446 | 0.490 | 14.09 | 22.706 | 6.286 |
1. Scenario values represent the nominal average-distance thresholds, in meters, used to evaluate Indicated and Inferred classification, respectively. For example, 38/75 represents a 38 m threshold for Indicated and a 75 m threshold for Inferred..
Table 11-61. Homestake Silver classification-distance sensitivity.
| Scenario¹ | Indicated Mt |
Inferred Mt |
Unclassified kt |
Indicated
AgEq Moz |
Inferred
AgEq Moz |
| 38/100 | 0.891 | 3.367 | 70.34 | 11.240 | 32.346 |
| 35/100 | 0.564 | 3.694 | 70.34 | 7.170 | 36.417 |
| 42/100 | 1.352 | 2.906 | 70.34 | 16.203 | 27.383 |
| 38/75 | 0.891 | 2.902 | 535.40 | 11.240 | 28.802 |
1. Scenario values represent the nominal average-distance thresholds, in meters, used to evaluate Indicated and Inferred classification, respectively. For example, 38/75 represents a 38 m threshold for Indicated and a 75 m threshold for Inferred..
Table 11-62. Wolf classification-distance sensitivity.
| Scenario¹ | Indicated Mt |
Inferred Mt |
Unclassified kt |
Indicated
AgEq Moz |
Inferred
AgEq Moz |
| 45/100 | 1.337 | 0.452 | 0.34 | 16.044 | 4.315 |
| 40/100 | 1.122 | 0.666 | 0.34 | 13.702 | 6.656 |
| 50/100 | 1.497 | 0.291 | 0.34 | 17.801 | 2.557 |
| 45/75 | 1.337 | 0.441 | 10.88 | 16.044 | 4.215 |
1. Scenario values represent the nominal average-distance thresholds, in meters, used to evaluate Indicated and Inferred classification, respectively. For example, 38/75 represents a 38 m threshold for Indicated and a 75 m threshold for Inferred..
Table 11-63. Kitsol classification-distance sensitivity.
| Scenario¹ | Indicated Mt |
Inferred Mt |
Unclassified kt |
Indicated
AgEq Moz |
Inferred
AgEq Moz |
| 30/60 | 0.179 | 0.230 | 13.83 | 1.776 | 2.385 |
| 35/70 | 0.286 | 0.136 | 1.33 | 2.876 | 1.380 |
| 40/75 | 0.333 | 0.089 | 1.33 | 3.375 | 0.880 |
| 35/50 | 0.286 | 0.102 | 34.70 | 2.876 | 1.096 |
1. Scenario values represent the nominal average-distance thresholds, in meters, used to evaluate Indicated and Inferred classification, respectively. For example, 38/75 represents a 38 m threshold for Indicated and a 75 m threshold for Inferred..
| Contango Silver and Gold – Kitsault Valley Project | Page 199 of 253 |
| Technical Report Summary and updated Mineral Resource Estimate 2026 |
Table 11-64. Torbrit classification-distance sensitivity.
| Scenario¹ | Indicated Mt |
Inferred Mt |
Unclassified kt |
Indicated
AgEq Moz |
Inferred
AgEq Moz |
| 30/50 | 2.497 | 0.730 | 284.43 | 25.025 | 6.922 |
| 35/75 | 2.765 | 0.746 | 0.30 | 27.655 | 6.296 |
| 35/100 | 2.765 | 0.746 | 0.30 | 27.655 | 6.296 |
| 40/100 | 2.987 | 0.525 | 0.30 | 29.765 | 4.186 |
1. Scenario values represent the nominal average-distance thresholds, in meters, used to evaluate Indicated and Inferred classification, respectively. For example, 38/75 represents a 38 m threshold for Indicated and a 75 m threshold for Inferred..
Table 11-65. Dolly Varden classification-distance sensitivity.
| Scenario¹ | Indicated Mt |
Inferred Mt |
Unclassified kt |
Indicated
AgEq Moz |
Inferred
AgEq Moz |
| 30/50 | 0.091 | 0.144 | 76.38 | 1.340 | 1.714 |
| 25/50 | 0.032 | 0.203 | 76.38 | 0.478 | 2.577 |
| 35/50 | 0.134 | 0.101 | 76.38 | 1.992 | 1.062 |
| 30/40 | 0.091 | 0.081 | 138.60 | 1.340 | 1.082 |
1. Scenario values represent the nominal average-distance thresholds, in meters, used to evaluate Indicated and Inferred classification, respectively. For example, 38/75 represents a 38 m threshold for Indicated and a 75 m threshold for Inferred..
Table 11-66. North Star classification-distance sensitivity.
| Scenario¹ | Indicated Mt |
Inferred Mt |
Unclassified kt |
Indicated
AgEq Moz |
Inferred
AgEq Moz |
| 30/50 | 0.358 | 0.177 | 77.85 | 3.571 | 1.268 |
| 25/50 | 0.293 | 0.242 | 77.85 | 3.009 | 1.830 |
| 35/50 | 0.424 | 0.111 | 77.85 | 4.065 | 0.774 |
| 30/70 | 0.358 | 0.232 | 23.22 | 3.571 | 1.587 |
1. Scenario values represent the nominal average-distance thresholds, in meters, used to evaluate Indicated and Inferred classification, respectively. For example, 38/75 represents a 38 m threshold for Indicated and a 75 m threshold for Inferred..
The Dolly Varden 30/75 result is excluded from the sensitivity table because it changes the Indicated population relative to 30/50 while purporting to change only the Inferred threshold. The selected 30/70 conclusion is retained
Changing metal prices or recoveries has two different effects. With a fixed block population, it changes only the equivalent-value calculation and the equivalent ounces; individual metal grades, contained metals and tonnes remain unchanged. When the new AgEq values are used to reapply a reporting cut-off, blocks can enter or leave the resource and all reported averages and quantities can change. A simple revaluation of the final table therefore cannot establish the change in reportable resource tonnes.
| Contango Silver and Gold – Kitsault Valley Project | Page 200 of 253 |
| Technical Report Summary and updated Mineral Resource Estimate 2026 |
A final cut-off and economic sensitivity suite should re-evaluate the approved models at common reporting constraints and retain Indicated and Inferred separately. Useful cut-off cases bracket 132 g/t AgEq and show tonnes, individual metal grades, individual contained metals and AgEq. Recovery and price cases should distinguish their effect on equivalency from the effect of reselecting blocks. South Reef requires a separately labeled retained-basis case unless its original model is formally rerun.
| 11.10 | Uncertainty, Limitations and Material Risks |
The resource categories express the QP’s assessment of uncertainty in geological continuity, grade and quantity at the scale relevant to resource reporting. Indicated material has sufficient confidence in the interpretation and estimate to support further mine planning and economic evaluation. Inferred material has lower confidence and requires additional drilling and evaluation before it can be considered for conversion to Mineral Reserves. No numerical confidence interval or probability of conversion has been calculated from the supplied models. Table 11-67 summarizes the principal sources of uncertainty affecting the Mineral Resource estimate, their influence on estimation and classification, and the deposits for which each factor is particularly relevant.
| Contango Silver and Gold – Kitsault Valley Project | Page 201 of 253 |
| Technical Report Summary and updated Mineral Resource Estimate 2026 |
Table 11-67. Principal sources of resource uncertainty and their treatment
| Factor | Influence on estimate and classification | Deposits of particular relevance |
| Sampling and data coverage | Historical assays emphasize silver in parts of the southern area. Sparse Au/base-metal data increase uncertainty in equivalent credits. | North Star, Dolly Varden, upper Wolf, historical Torbrit |
| Geological interpretation | Lens connections, thickness and extrapolation control volume and local grade continuity. Hard domains and spatial classification review limit unsupported continuity. | Homestake Main and Silver; narrow southern veins |
| High-grade influence | Small populations and skewed distributions make some caps influential. Domain caps limit extrapolation; paired model tests are needed to quantify resource-metal effects. | Homestake Silver small lenses; Homestake Main MIDLENS; selected Torbrit domains |
| Density | Screened sample means may differ from volume-representative domain densities. Analogy or small populations add uncertainty to tonnes. | North Star and Kitsol; Torbrit domain distribution |
| Interpolation and support | IDW smoothing, orientation and clustering affect local estimates. Separate grade and classification estimators must retain their intended roles. | All updated models |
| Historical depletion | Uncertain stope position or unrecorded workings can change remnant volumes. Production reconciliation does not resolve local spatial uncertainty. | Torbrit, Dolly Varden and North Star |
| Metallurgy and payable products | Proxy recoveries, incomplete integrated testing and uncertain payable terms can change AgEq and reporting thresholds. | All deposits; non-silver credits particularly relevant |
| Economic and spatial assumptions | Unit costs, minimum mining dimensions, dilution, access and processing configuration affect reasonable extraction prospects. | All deposits |
| Retained estimate | Original model, cut-off and density must remain distinguishable from new-model assumptions. | South Reef |
| Sensitivity version control | Earlier test quantities cannot be mixed with final reporting quantities or used as a final cut-off sensitivity. | Homestake, Wolf, Torbrit and Dolly Varden |
The QP considered these factors together when assigning classification. A threshold passing the nominal-spacing test is not sufficient where geological continuity, independent sample support, density or depletion confidence is inadequate. Conversely, a coherent mineralized continuation with lower confidence can remain Inferred where it is supported by the geological and estimation evidence. Increasing a distance threshold to increase tonnes is not a classification justification.
The principal measures to reduce uncertainty are targeted infill and structural drilling, improved density coverage within the final domains, complete documentation of historical workings and selective verification of remnant areas, metallurgical variability and product testing, and engineering work that links the reporting cut-off to an accepted underground extraction scenario. These measures are carried into the TRS recommendations.
| Contango Silver and Gold – Kitsault Valley Project | Page 202 of 253 |
| Technical Report Summary and updated Mineral Resource Estimate 2026 |
| 11.11 | QP Conclusions on the Mineral Resource Estimate |
In the opinion of the Qualified Person, the accepted geological, drilling, assay and density information provides an adequate basis for the Mineral Resource estimates at the confidence levels assigned. The deposit-specific domains, high-grade controls and estimation settings appropriately reflect the mineralized systems and the available data. The updated models support Indicated and Inferred resources at the seven re-estimated deposits. South Reef is retained as an Inferred resource on its preceding physical-resource and reporting basis.
The QP considers the selected classification framework appropriate when applied with geological continuity, independent sample support and spatial review. Inferred resources represent lower-confidence parts of the accepted mineralized systems. Based on that geological setting and the nature of the available drilling, the QP reasonably expects that the majority of the Inferred resources could be upgraded through continued exploration. Actual upgrading will depend on the results of that work and is not assured.
The QP considers the identified geological, density, metallurgical and engineering issues capable of resolution through further work. The estimates do not establish Mineral Reserves or demonstrate economic viability. The material risks and recommended follow-up work should be read with the overall conclusions and recommendations in Chapters 22–23.
| Contango Silver and Gold – Kitsault Valley Project | Page 203 of 253 |
| Technical Report Summary and updated Mineral Resource Estimate 2026 |
| 12 | MINERAL RESERVE ESTIMATES |
The Kitsault Valley Project does not have any Mineral Reserves.
| Contango Silver and Gold – Kitsault Valley Project | Page 204 of 253 |
| Technical Report Summary and updated Mineral Resource Estimate 2026 |
| 13 | MINING METHODS |
This section is not applicable.
| Contango Silver and Gold – Kitsault Valley Project | Page 205 of 253 |
| Technical Report Summary and updated Mineral Resource Estimate 2026 |
| 14 | PROCESSING AND RECOVERY METHODS |
This section is not applicable.
| Contango Silver and Gold – Kitsault Valley Project | Page 206 of 253 |
| Technical Report Summary and updated Mineral Resource Estimate 2026 |
| 15 | INFRASTRUCTURE |
| 15.1 | Scope and Reporting Basis |
The Kitsault Valley Project is an exploration- and mineral-resource-stage property. No mine plan, process plant, production schedule, tailings-management facility, waste-rock management plan, or project execution plan has been selected. Accordingly, the infrastructure described as existing or currently used is adequate only for seasonal exploration support. References to possible future facilities identify categories requiring study; they do not constitute a project design, capacity commitment, construction decision, or demonstration of economic viability.
Note: Existing roads, marine landings, grid infrastructure, hydroelectric works, and third-party ports are not represented as being controlled by, reserved for, or available to the Company at any particular capacity unless expressly stated. Commercial arrangements, access rights, engineering suitability, permitting, and capacity remain to be established for any future development scenario.
| 15.2 | Infrastructure Setting and Status |
The Project extends northward from the historic Dolly Varden-Torbrit mining district in the lower and central Kitsault River valley to the Homestake deposits near the headwaters of the Kitsault River. The terrain is rugged, locally glaciated, and incised by steep streams and gullies. The lower valley contains remnants of historic mining and hydroelectric infrastructure and a historical road or tractor-trail corridor. The upper valley and Homestake areas do not have developed road access and are reached primarily by helicopter.
Alice Arm is the current exploration logistics base. Regional supplies, equipment, contractors, and personnel are mobilized through Terrace, Prince Rupert, Smithers, Stewart, and other northwestern British Columbia service centres. Kitsault and Alice Arm have few permanent residents and should not be assumed to provide municipal-scale services, labour, accommodation, or emergency-response capacity for a future mine.
Existing infrastructure and future needs are outlined in Table 15-1.
| Contango Silver and Gold – Kitsault Valley Project | Page 207 of 253 |
| Technical Report Summary and updated Mineral Resource Estimate 2026 |
Table 15-1. Existing infrastructure and future-project requirement or status.
| Element | Existing or current exploration use | Future-project requirement or status |
| Road access | Highway 113 and connecting roads reach Kitsault; a historical road/trail extends north from Alice Arm into the lower Kitsault Valley. | Road condition and continuity are insufficient for mine haulage. Upgrading, bridges, geotechnical design, avalanche and drainage controls, and access rights would require study. |
| Rail | No railway serves the Property. The Canadian National Railway main line passes through Kitwanga, about 180 km by road from Kitsault as reported in the 2022 Homestake report. | No rail connection or rail-loading concept has been selected. |
| Aviation | Scheduled air service is available at Terrace and other regional airports; helicopters support field access from Alice Arm and regional bases. | A permanent aerodrome has not been proposed. Future helicopter or emergency-aviation facilities would require design and permitting. |
| Marine and ports | Alice Arm and Kitsault have barge landing areas. Prince Rupert supports current marine supply; Stewart has a third-party deep-sea port used by regional mines. | No dedicated project port, concentrate-handling system, capacity reservation, or shipping agreement has been established. |
| Camp and buildings | Temporary seasonal camp, geology, core-logging, core-cutting, storage, and helicopter-support facilities are maintained at Alice Arm. | Permanent accommodation, administration, maintenance, warehouse, emergency, and operational buildings have not been designed. |
| Power | Current exploration facilities use portable diesel generation. Grid power is present at Kitsault, and historical hydroelectric works occur in the upper Kitsault valley. | No project load study, connection study, service agreement, transmission alignment, or generation plan has been completed. |
| Water | Surface-water sources are abundant and support permitted exploration activities. | Production demand, water rights, source reliability, treatment, storage, site-wide balance, discharge, and contact-water management have not been defined. |
| Waste and tailings | Historical Dolly Varden and Torbrit mining left limited surface waste-rock dumps; the 2023 report states that no on-site tailings were produced. No current process waste is generated. | Waste-rock, tailings, overburden, leach-pad, and water-management facilities have not been selected or designed. |
| Dams and pipelines | The historic Kitsault River hydroelectric dam and associated works are not used for current project power. No project pipelines are in service. | No new project dam or pipeline system has been designed. |
| Contango Silver and Gold – Kitsault Valley Project | Page 208 of 253 |
| Technical Report Summary and updated Mineral Resource Estimate 2026 |
| 15.3 | Transportation and Access |
15.3.1 Regional Roads and Property Access
Overland access from Terrace to Kitsault is by the Nisga'a Highway (Highway 113) and connecting forest-service and mine roads. The 2023 combined technical report reports a total road distance of approximately 167 km from Terrace to Kitsault. Older reports and annual assessment filings describe different route lengths; these values reflect different route definitions and should not be combined. Kitsault lies on the eastern side of Alice Arm, across tidewater from the Alice Arm exploration base.
From Alice Arm, the historical Kitsault Valley Road follows the former Dolly Varden railway grade north along the Kitsault River. The corridor historically served the Dolly Varden, North Star, Torbrit, and Wolf areas and was later used for exploration and hydroelectric work. Filed reports describe road or tractor-trail access into the lower valley and identify washouts, bridge loss, overgrowth, and maintenance needs. Access beyond the lower and central valley, particularly to the Homestake deposits, is primarily by helicopter. The historical grade is not a modern all-season mine road and should not be treated as such in engineering or economic studies.
Ongoing planning to repair washouts and redesign bridge crossings under a forestry-road Special Use Permit is in progress.
15.3.2 Aviation Facilities
There is no developed land-based runway at the Project. Regional scheduled air service is available at Terrace, with additional airports at Prince Rupert and Smithers. Helicopters are available from Terrace, Stewart, Prince Rupert, and other regional bases and are the primary means of moving personnel, drill crews, core, and light supplies between Alice Arm and field sites. Floatplane access to Alice Arm is possible at the marked water-access ramp when weather and water conditions permit.
The current exploration program uses a temporary helicopter staging area near the Alice Arm waterfront. The infrastructure includes two double-walled, monitored 25,000 L tanks for aviation fuel, replenished seasonally through marine and road-supported logistics, and secondary helicopter-fuelling capability at Kitsault. These facilities support exploration only.
15.3.3 Marine Logistics, Ports, and Rail
Heavy equipment, bulk fuel, and camp supplies are moved to Alice Arm by contracted tug and ramp-equipped barge, principally from Prince Rupert according to the filed Dolly Varden reports and annual assessment records. Alice Arm has a wet landing and laydown area used for current exploration logistics. A historical dry landing exists on the Kitsault side of Alice Arm; barge selection and tidal planning are material because a vessel may ground at low tide during unloading.
Stewart, at the head of Portland Canal, hosts a third-party deep-sea port that has historically handled ore and concentrate from regional mines. Prince Rupert also provides deep-water marine and intermodal services. The Project has no dedicated port, concentrate storage, shiploader, marine terminal, or contracted capacity. Port selection, shipping route, product form, handling method, environmental requirements, and commercial terms cannot be established until a mine and processing concept has been defined.
| Contango Silver and Gold – Kitsault Valley Project | Page 209 of 253 |
| Technical Report Summary and updated Mineral Resource Estimate 2026 |
No railway reaches Alice Arm or the Project. The Canadian National Railway main line and Highway 16 pass through Kitwanga, approximately 180 km by road from Kitsault as reported in the 2022 Homestake technical report. No transload location, haulage route, capacity allocation, or railway agreement has been selected. The regional access and transportation setting for the Kitsault Valley Project, including road, marine, aviation, port and rail connections, is shown in Figure 15-1.
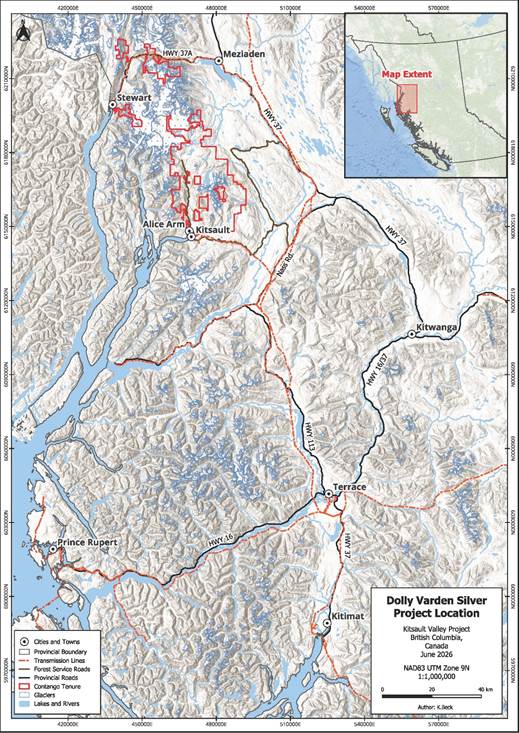
Figure 15-1. Regional access and transportation setting, Kitsault Valley Project (source: initial Chapter 15 infrastructure working draft, June 2026).
| Contango Silver and Gold – Kitsault Valley Project | Page 210 of 253 |
| Technical Report Summary and updated Mineral Resource Estimate 2026 |
| 15.4 | Current Exploration-Support Facilities |
15.4.1 Alice Arm Camp and Work Areas
Seasonal exploration is supported from private lots in Alice Arm used by the Company. The camp comprises temporary kitchen, dining, dry, washroom, sleeping, office, geology, core-logging, and core-cutting structures. The current infrastructure consists of wood-frame tent and plywood sleeping units, two approximately 20 ft by 40 ft logging buildings, an office, and a core-cutting building. Heating and electrical service are provided by diesel-fired equipment and portable generators. No permanent mine-site buildings or municipal utility services are present on the mineral property.
Currently all drill core is transported by helicopter to the Alice Arm base, received and checked by geological personnel, logged and photographed, and prepared for sampling at the logging facility. The camp and work areas are suited to seasonal exploration but have not been assessed for mine construction or production staffing.
15.4.2 Fuel, Supplies, and Storage
Camp fuel and bulk supplies are mobilized seasonally by barge and, where practicable, by road to Kitsault and then by small boat or helicopter. Fuel storage at Alice Arm supports helicopters, generators, heating, and light equipment. A rented warehouse near Terrace is used for samples and minor supplies.
The current exploration drill core is cross-stacked and covered on private lots in Alice Arm. Earlier Dolly Varden core is stored near Terrace, and historical Homestake/Auryn core is reported stored near Smithers.
15.4.3 Power Supply
Portable diesel generator sets provide current electrical power for the Alice Arm camp, office, logging, and core-cutting facilities. Current generation is temporary and sized for exploration support, not for mine or process loads.
The British Columbia electrical grid extends to Kitsault. Historical grid interconnections and a hydroelectric dam, generating station, and access road occur in the Kitsault River valley. The historical hydroelectric facilities are not in service as a Project power source, and private proposals to rehabilitate regional hydroelectric assets do not establish available Project supply. Likewise, regional transmission planning by BC Hydro does not constitute an interconnection approval or capacity commitment at this time. A future project would require a load forecast, connection and system-impact studies, route and land-access studies, reliability assessment, commercial agreement, and comparison with on-site or hybrid generation alternatives.
15.4.4 Personnel and Supply Centres
Terrace is the principal regional service centre and provides scheduled air service, accommodation, medical and commercial services, contractors, equipment, fuel, and a pool of personnel experienced in mineral exploration and construction. Prince Rupert, Smithers, and Stewart also provide specialized supplies, contractors, marine services, aviation support, and mining-experienced labour. Kitwanga provides highway and rail access. Alice Arm and Kitsault should be treated as logistics nodes rather than full-service communities.
Currently there is availability of regional exploration labour and services to support the proposed exploration work, however It does not include a production workforce plan, commuting strategy, accommodation plan, training assessment, emergency-response plan, or commitments for local procurement and hiring. Those matters would be developed with the mining and processing concepts.
| Contango Silver and Gold – Kitsault Valley Project | Page 211 of 253 |
| Technical Report Summary and updated Mineral Resource Estimate 2026 |
| 15.5 | Water, Waste, Tailings, Dams, and Pipelines |
15.5.1 Water Supply and Current Water Management
The Upper Kitsault River, Kitsault Lake, tributaries, snowmelt, and local groundwater indicate substantial regional water availability. Current exploration water use is limited to drilling and camp support and is subject to applicable authorizations. Drill-return water is managed at the drill sites using settling sumps and other permit-specific controls. The Alice Arm camp uses a septic system and local wastewater controls; solids are removed by contracted service as required by the operating plan.
No site-wide water balance, production-water demand, intake, treatment plant, raw-water reservoir, contact-water collection system, discharge system, or water pipeline has been designed. The apparent abundance of water does not establish legal availability, seasonal reliability, water quality, or acceptable environmental effects. Future studies would require hydrometric and climate data, hydrogeology, water-quality baseline data, water rights and permitting review, source and demand modelling, treatment criteria, extreme-event design, and closure considerations.
15.5.2 Waste Rock, Tailings, Leach Pads, and Dumps
Historical mining at Dolly Varden and Torbrit left limited surface waste-rock dumps and underground openings. The 2023 combined technical report states that no on-site tailings were produced because historical ore was primarily shipped from the site. No current mineral processing occurs, and the exploration program does not operate a tailings facility, leach pad, production waste-rock dump, or overburden stockpile.
No future mining method or processing route has been selected; consequently, the quantity and geochemical character of waste rock, tailings, overburden, and process residues are not defined. Facility siting, storage technology, dam consequence classification, geotechnical and seismic design, geochemical controls, water management, progressive reclamation, and closure requirements must be established in later studies.
15.5.3 Dams and Pipelines
The historic Kitsault River hydroelectric dam and associated power works are legacy infrastructure and are not represented as operating Project facilities. No new water-retaining dam, tailings dam, process-water pipeline, concentrate pipeline, fuel pipeline, or natural-gas pipeline is proposed in the current exploration plan. If a later project concept includes any such facility, its alignment, ownership, capacity, integrity management, environmental setting, permitting, and closure obligations would require project-specific engineering.
| 15.6 | Future Project Infrastructures Requirements |
A future development concept would require infrastructure sized and located to match the selected mining, processing, waste-management, and product-transport strategies. The following work packages represent the minimum infrastructure definition needed before costs, schedules, or economic conclusions could be supported (Table 15-2).
| Contango Silver and Gold – Kitsault Valley Project | Page 212 of 253 |
| Technical Report Summary and updated Mineral Resource Estimate 2026 |
Table 15-2. Infrastructure definition required for a future project study.
| Work package | Required definition |
| Access and logistics | Select the construction and operating access strategy; survey the corridor; assess terrain, avalanche, hydrology and geotechnical hazards; design roads, bridges and drainage; establish access rights and maintenance basis. |
| Marine, port, and product transport | Define product form and annual tonnage; compare Alice Arm, Stewart, Prince Rupert, road and rail interfaces; complete marine, terminal, storage, transload, capacity, and commercial studies. |
| Site layout and buildings | Define mine and plant locations, construction laydown, camp, administration, warehouse, maintenance, laboratory, explosives, fuel, emergency, and communications facilities with constructability and winterization criteria. |
| Power and fuel | Develop load lists and demand profiles; compare grid, hydroelectric, thermal, renewable and hybrid options; complete interconnection, transmission, reliability, fuel-logistics, storage, and emissions studies. |
| Water systems | Complete baseline monitoring and a site-wide water balance; define sources, rights, intakes, storage, treatment, pipelines, contact-water collection, discharge, flood and climate-change criteria. |
| Waste, tailings, and earthworks | Characterize waste and tailings; prepare siting and alternatives studies; define storage technology, dams, foundations, seepage and water controls, borrow sources, closure, and monitoring requirements. |
| Workforce and services | Prepare construction and operations workforce plans, accommodation and transport strategies, regional service and emergency-response assessments, and local procurement and training plans. |
The sequence and scope of these studies should be coordinated with the effective-date mineral resource, mine and process alternatives, environmental baseline program, Indigenous and community engagement, permitting strategy, and project risk register. Existing exploration infrastructure may provide logistical value but should not be credited as production-ready without condition assessment and fit-for-purpose engineering. Figure 15-2 provides a project-scale overview of the regional roads, transmission lines, Alice Arm and Kitsault logistics nodes, historical hydroelectric works and Stewart port relevant to future infrastructure planning.
| Contango Silver and Gold – Kitsault Valley Project | Page 213 of 253 |
| Technical Report Summary and updated Mineral Resource Estimate 2026 |
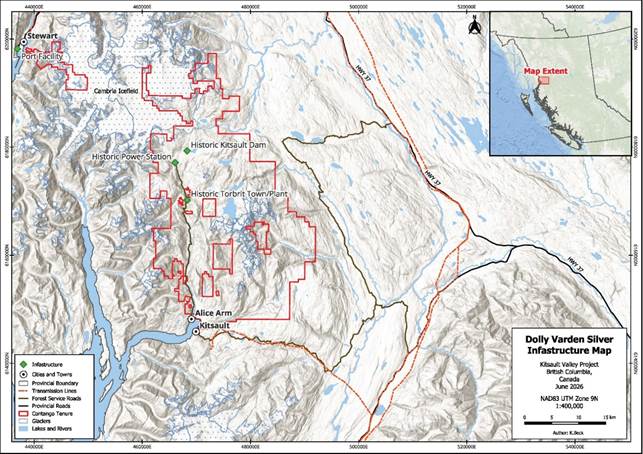
Figure 15-2. Project-scale infrastructure setting, showing regional roads, transmission lines, Alice Arm and Kitsault logistics nodes, historic hydroelectric works, and Stewart port (source: initial Chapter 15 infrastructure working draft, June 2026).
| 15.7 | QP Interpretation and Limitations |
The consolidated source record demonstrates that the Project can be supported for seasonal exploration using the Alice Arm camp, regional service centres, contracted marine transport, road access to Kitsault, and helicopter access to field sites. These arrangements have supported substantial multi-year drilling programs and are considered appropriate for the current exploration stage.
The available information is not sufficient to conclude that infrastructure required for mining and processing is technically or economically feasible. Material uncertainties include all-season access, road and bridge condition, port and rail capacity, electrical supply and interconnection, site-wide water management, waste and tailings facility selection, terrain and avalanche hazards, permanent accommodation and services, ownership and access rights, permitting, capital and operating costs, and construction schedule. No infrastructure capacities or cost credits should be carried into an economic analysis without project-specific engineering and verification.
The maps identify the regional infrastructure setting and known historical or current logistics nodes. They are not engineering layouts and do not show a selected mine, process plant, tailings facility, waste-rock facility, water-management system, transmission line, or pipeline corridor. Any such facilities shown elsewhere in the TRS should be reconciled to a single effective-date project basis.
| Contango Silver and Gold – Kitsault Valley Project | Page 214 of 253 |
| Technical Report Summary and updated Mineral Resource Estimate 2026 |
| 16 | MARKET STUDIES |
The marketability of the concentrates from this project will be determined by mineral composition and payable metal contents. Market research and pricing information confirm that the concentrates will be attractive to custom copper, lead and zinc smelters for the current and foreseeable future, though specific characteristics must be factored into commercial negotiations.
| 16.1 | Lead Concentrate |
Lead smelting profitability is driven by recovery of byproduct metals, primarily silver and gold, as well as minor elements such as antimony. China and Korea are the largest importers of seaborne lead concentrates, primarily because they operate smelting technologies capable of efficiently recovering byproduct precious metals. The high-silver lead concentrate market is currently under-supplied and is expected to continue to be in deficit for the long term. Table 16-1 defines the commercial terms used for this analysis.
Table 16-1. Commercial terms used in economic analysis for Pb concentrate.
| Pb Concentrate | ||
| Pb | 95% | Deduct 3 units |
| Gold | 97.5% | Min 1.0g/t |
| Silver | 97.5% | Min 50g/t |
| Pb TC | $50 | /dmt |
| Ag RC | $0.50 | /oz |
| Export | CIF Main Asian Port | |
| 16.2 | Copper Concentrate |
The International Copper Study Group estimates global mine supply of copper concentrate reached approximately 25 million mt in 2025, whereas global copper concentrate smelting capacity was 28 million mt. The deficit, primarily due to expansion of China’s copper smelting industry, has caused treatment and refining charges to collapse, yielding below-zero treatment and refining charges (TC/RC’s). This condition is expected to persist and result in very low TC/RC’s for the medium to long term (International Copper Study Group, n.d.). Table 16-2 defines the commercial terms used for this analysis.
| Contango Silver and Gold – Kitsault Valley Project | Page 215 of 253 |
| Technical Report Summary and updated Mineral Resource Estimate 2026 |
Table 16-2. Commercial terms used in economic analysis for Cu concentrate.
| Cu Concentrate | ||
| Gold | 97.5% | |
| Silver | 90% | |
| Copper | 96.5% | Deduct 1 unit |
| Cu TC | $50 | /dmt |
| Cu RC | $0.05 | /lb |
| Au RC | $5 | /oz |
| Ag RC | $0.50 | /oz |
| Export | CIF Main Asian Port | |
| 16.3 | Zinc Concentrate |
The zinc concentrates produced in the Kitsault Valley ores may be more challenging to market, as the most recent test-work has only produced concentrate grades of 36% zinc with as high as 21% lead, as well as high antimony and cadmium content. Standard zinc concentrates typically contain at least 45% zinc, although some smelters process zinc concentrates with as little as 25% zinc. While the global zinc concentrate market is also in deficit, (global zinc mine production of 13 million mt in 2025 vs. global zinc smelting capacity of 14 million mt), this quality may only be attractive to lead/zinc smelters with high silver recovery rates. If silver grades can be maintained at >2.7kg/mt, the concentrates are marketable in China as “silver” concentrates. Table 16-3 defines the commercial terms used for this analysis.
Table 16-3. Commercial terms used in economic analysis for Zn concentrate.
| Zn Concentrate | ||
| Silver | 95% | Minimum deduct 50g/dmt |
| Zn | 40% | If over 15% zinc |
| Pb | 95% | Minimum deduct 3 units |
| TC | $50 | /dmt |
| Ag RC | $0.10 | /troy oz. |
| Export | CIF Main Chinese Port | |
| 16.4 | Summary |
The Project’s three concentrates (Pb, Cu and Zn) show no significant issues with their overall marketability. Major suppliers and smelters worldwide form a competitive landscape where entry barriers include high capital investment, regulatory compliance, and access to infrastructure. Given the concentrates’ specifications, strategic partnerships may be necessary to optimize offtake agreements and mitigate market risks. Partnerships should be evaluated during future Pre-Feasibility and Feasibility studies.
| Contango Silver and Gold – Kitsault Valley Project | Page 216 of 253 |
| Technical Report Summary and updated Mineral Resource Estimate 2026 |
| 17 | ENVIRONMENTAL STUDIES, PERMITTING, AND COMMUNITY |
| 17.1 | Scope, Reporting Basis, and Project Stage |
The Kitsault Valley Project is an exploration- and mineral-resource-stage property. Current authorizations support exploration; no mine plan, process plant, production schedule, tailings-management facility, waste-rock management facility, site-wide water-management system, or mine closure plan has been selected. No provincial environmental assessment certificate, major-mine permit, federal impact assessment decision, or production-related discharge authorization are obtained. Consequently, future mine-permitting requirements are described as a framework and data need, not as an approved permitting pathway or schedule.
Note: This chapter is not a legal opinion and does not determine Aboriginal rights or title, treaty rights, regulatory jurisdiction, environmental-assessment reviewability, or the complete set of approvals for a future mine. Those matters depend on the project ultimately proposed and require legal, regulatory, environmental, engineering, and Indigenous-engagement review.
| 17.2 | Environmental and Social Setting |
The core Project area occupies the Kitsault River watershed from tidewater at Alice Arm northward to glaciated headwaters near the Homestake deposits. The upper watershed receives substantial snow and glacial runoff. The river passes through a confined central canyon and opens into a lower-gradient braided reach before entering Alice Arm. Tributaries below the canyon provide fish habitat, including habitat used by Pacific salmon species. The Project's other exploration holdings and permit areas extend outside the core Kitsault River corridor and require separate watershed and land-use screening.
Vegetation ranges from coastal forest in the lower valley to subalpine and alpine environments. The combined technical report identifies rugged terrain, glaciers, steep streams, heavy precipitation, and weather-dependent access as material environmental and operating conditions. These conditions affect baseline design, seasonal sampling, erosion and sediment control, water balance, road and bridge design, wildlife timing windows, reclamation, and emergency response.
The Project is within an area of longstanding Indigenous use and asserted or recognized interests. The source reports identify the Nisga'a Nation as the principal Indigenous government engaged for the core Kitsault Valley permits and also identify areas of interest or consultation involving Metlakatla, Skii km Lax Ha, and Gitanyow hereditary governance.
| 17.3 | Current Exploration Permitting |
17.3.1 Mines Act and Multi-Year Area-Based Authorizations
Mechanized exploration in British Columbia generally requires a permit under section 10 of the Mines Act. A Notice of Work application or amendment describes proposed activities and includes a program for protection and reclamation of affected land and watercourses. Multi-Year Area-Based permitting typically authorizes specified exploration activities within defined activity areas for up to five years, subject to permit conditions, disturbance limits, annual reporting, and reclamation obligations.
| Contango Silver and Gold – Kitsault Valley Project | Page 217 of 253 |
| Technical Report Summary and updated Mineral Resource Estimate 2026 |
Permit holders submit an Annual Summary of Exploration Activities (ASEA) describing work, disturbance, reclamation, and remaining authorized capacity. Financial reclamation security may be required as a permit condition and can be adjusted as liability changes. Permit closeout and return of security require completion and regulatory acceptance of reclamation; the existence of security does not cap the Company's reclamation obligation.
The core deposits are covered by two principal exploration permits: MX-1-860 over the legacy Dolly Varden area and MX-1-603 over the legacy Homestake area (Table 17-1; Figure 17-1).
Table 17-1. Principal exploration permits for the core Kitsault Valley area (2026 management register; verify against executed permits).
| Area | Permit | Authorized
disturbance (ha) |
Principal authorized activities | Security | Reported
expiry |
| Dolly Varden | MX-1-860 | 24.03 | 112 helicopter-supported drill sites; 140 line-km geophysics; 30 helicopter pads; work structures; 12 trenches; 5 km trails; 800 m Torbrit rehabilitation; 20 underground drill stations and 10 geotechnical sites. | C$99,000 | March 31, 2031 |
| Homestake | MX-1-603 | 20.06 | 200 helicopter-supported diamond drill sites; 300 helicopter-supported RC sites; 50 line-km geophysics; 6 helicopter pads; 2 km trails; camp allowance of 1.0 ha. | C$76,000 | March 31, 2030 |
The MX-1-860 amendment has been approved in early 2026. An Occupant Licence to Cut associated with the permit is renewed in 2026 for Crown timber clearing beyond the volume otherwise authorized. The Homestake area is predominantly alpine, but timber and vegetation-clearing requirements remain site-specific.
| Contango Silver and Gold – Kitsault Valley Project | Page 218 of 253 |
| Technical Report Summary and updated Mineral Resource Estimate 2026 |
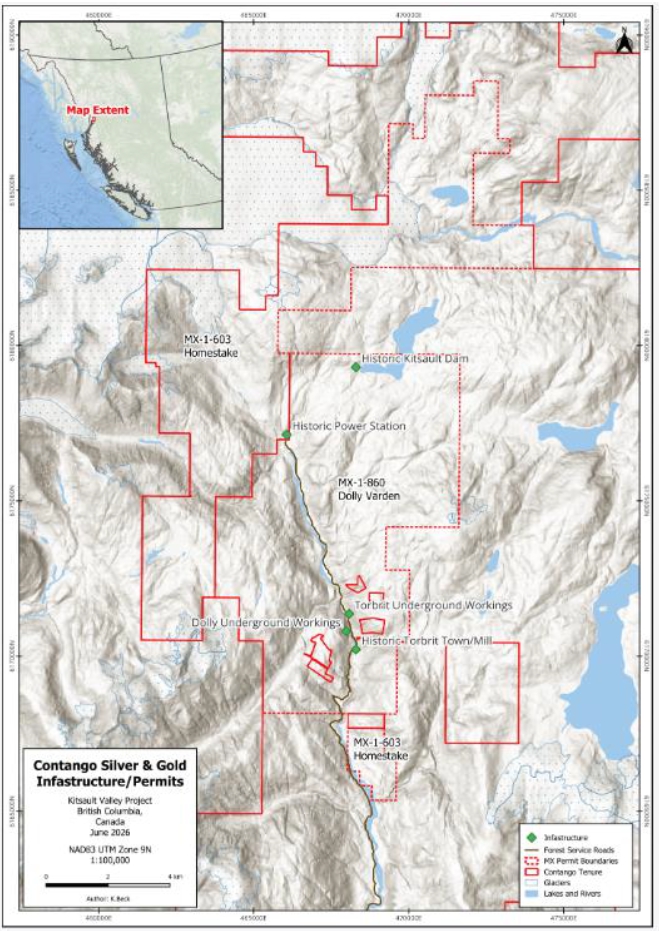
Figure 17-1. Principal exploration permit areas and historical infrastructure in the core Kitsault Valley corridor.
| Contango Silver and Gold – Kitsault Valley Project | Page 219 of 253 |
| Technical Report Summary and updated Mineral Resource Estimate 2026 |
17.3.2 Other Exploration Permits and Boundary Reconciliation
The broader permit map supplied with the draft shows additional Contango exploration permits over Big Bulk, Kinskuch, Theia, Porter, Red Cliff, and BA areas (Table 17-2; Figure 17-2).
Table 17-2. Other exploration permits shown in the working record.
| Area | Permit identifier | Disturbance (ha) | Security | Reported expiry | Status note |
| Kinskuch | MX-1-838 on map; draft register listed MX-1-868 | 0.83 | C$51,000 | March 31, 2030 | Identifier and TRS inclusion to verify |
| Big Bulk - DV | MX-1-784 | 3.74 | C$27,000 | March 31, 2030 | Current draft register |
| Big Bulk option | MX-1-990 | 3.92 | C$36,000 | March 31, 2030 | Current draft register |
| Theia portion | MX-1-186 on map; draft register listed MX-1-189 | 0.35 | C$25,878 | March 10, 2027 | Identifier and TRS inclusion to verify |
| Porter / Red Cliff / BA | MX-1-977 / MX-1-736 / MX-1-776 on map | Not supplied | Not supplied | Not supplied | Outside core corridor; scope to verify |
| Contango Silver and Gold – Kitsault Valley Project | Page 220 of 253 |
| Technical Report Summary and updated Mineral Resource Estimate 2026 |
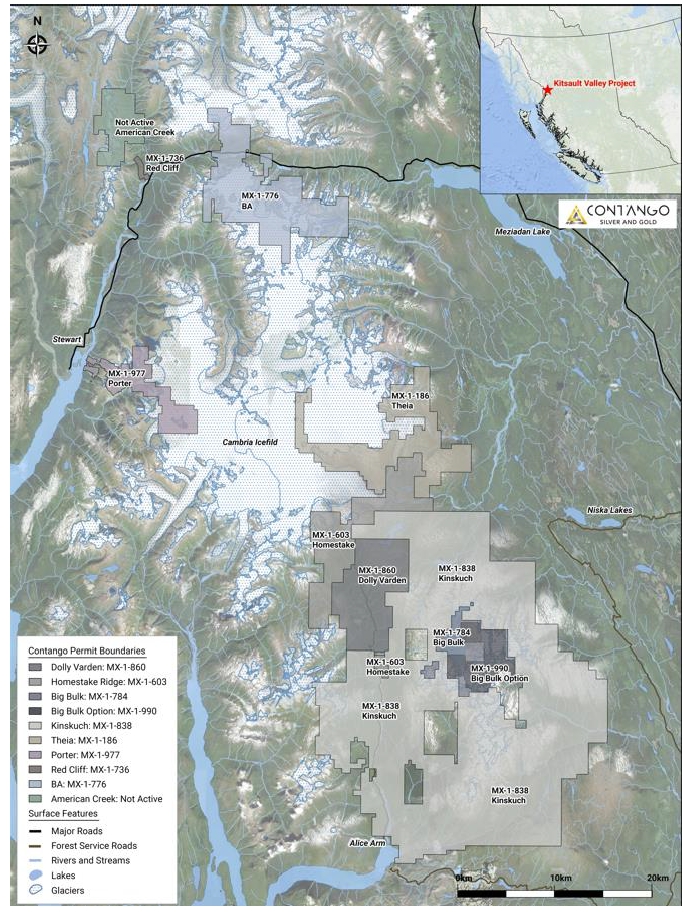
Figure 17-2. Broader exploration permit setting. Boundaries and permit identifiers are informational and require reconciliation with the final Chapter 4 property boundary and executed permits.
| Contango Silver and Gold – Kitsault Valley Project | Page 221 of 253 |
| Technical Report Summary and updated Mineral Resource Estimate 2026 |
17.3.3 Operating Authorizations and Commercial Arrangements
The Alice Arm exploration base occupies fee-simple or other private surface parcels used by the Company. Private ownership does not remove facilities from otherwise applicable mine, occupational health and safety, public health, water, waste, fire, building, or environmental requirements. Table 17-3 summarizes the management-reported operating authorizations and commercial arrangements supporting the Project’s current exploration activities and facilities.
Table 17-3. Management-reported operating authorizations and arrangements.
| Subject | Authorization or arrangement | Reported status | Effective-date verification |
| Camp water | Water Licence Authorization C035609 | Reported active with annual provincial fees | Confirm licence holder, authorized source, quantity, term, reporting, and compliance. |
| Food service and potable water | Northern Health food-service operating permit, reportedly effective from August 18, 2011 | Reported renewed annually | Confirm permit number, inspection status, monthly potable-water testing, and current results. |
| Road access | Commercial road-use agreement for the Terrace-Kitsault route | Reported active with monthly fees | Confirm parties, route, term, load and seasonal restrictions, insurance, and termination rights. |
| Alice Arm dock and landing | Arrangement administered by Alice Arm Harbour Society | Reported active with annual maintenance fee | Confirm tenure, operating authority, environmental conditions, capacity, and good standing. |
| 17.4 | Environmental Studies and Baseline Information |
17.4.1 Historical Water-Quality Programs
IEC Consultants Ltd. completed water-quality monitoring in 1981 at four Kitsault River stations: upstream of Wolf; downstream of the historical Torbrit mill and townsite; upstream of the Two Mile Creek historical site; and downstream of that site. Samples collected during high-flow autumn conditions were analyzed for physical parameters, dissolved anions and metals, solids, sewage indicators, and selected mine-drainage constituents. (IEC Consultants Ltd., 1981)
The 2015 technical report states that river samples were turbid and exceeded then-applicable objectives for total suspended solids and certain dissolved constituents during high flow. Elevated aluminum was considered potentially affected by laboratory contamination. Torbrit portal drainage was reported as mildly alkaline and chemically similar to natural surface water, with higher calcium and magnesium. The historical report concluded that mine-water discharge did not have a detectable effect on surface-water chemistry. These results are screening-level historical observations using older criteria and methods; they do not establish current compliance, absence of effects, or suitability as a future water source.
In October 2012, five reconnaissance samples were collected from Kitsault River sites upstream and downstream of the Torbrit 1025 Level portal and from Torbrit and North Star mine waters (Table 17-4). The standing and circulating mine waters as mildly alkaline and without the dissolved heavy-metal or particulate contamination of concern identified by that program.
| Contango Silver and Gold – Kitsault Valley Project | Page 222 of 253 |
| Technical Report Summary and updated Mineral Resource Estimate 2026 |
Table 17-4. Reported 2012 reconnaissance water-sample locations.
| Sample | Location |
| SW-5 | Kitsault River upstream of Torbrit 1025 Level south portal |
| SW-6 | Kitsault River downstream of Torbrit 1025 Level south portal |
| TFS | Flooded lower raise reaching the Torbrit 1025 Level |
| SW-P3 | Natural outflow at southern entrance to Torbrit 1025 Level portal |
| SWP-2 | Entrance to northeast portal of North Star Mine |
17.4.2 Homestake Environmental and Engineering Studies
The Homestake project in the 2022 technical report includes a 2011 SGS Minerals Services characterization of Homestake Ridge tailings; a 2012 Triton Environmental Consultants surface-water-quality initial site visit (Triton Environmental Consultants Ltd., 2012a); a 2012 Triton proposed-road stream assessment (Triton Environmental Consultants Ltd., 2012b); a 2012 pHase Geochemistry waste-rock field-barrel characterization (pHase Geochemistry Inc., 2012); a 2018 wildlife management and monitoring plan; preliminary geotechnical assessments; access-road studies; conceptual mine-site and hydroelectric layouts; and 2011 tailings-storage alternatives and conceptual tailings-cost work by Knight Piésold Consulting (2011a–d).
These studies demonstrate that prior operators began environmental and infrastructure screening, including preliminary acid-generation testing of waste rock and tailings. The 2022 report recommended broader testing across all major rock types, baseline monitoring of surface water, groundwater, air and climate, and a site-wide water balance. The conceptual facility studies pre-date the consolidated Project and do not represent a current mine plan, selected tailings site, approved facility, or current cost basis.
17.4.3 Current Environmental Work
ERM Consultants Canada Ltd. collected surface-water samples at four locations across the Homestake and Dolly Varden areas during 2024 and 2025 as due diligence on historical results, these were generally consistent with the historical record. A meteorological station with precipitation and wind instruments was installed near Red Point in 2024 and data are downloaded to a monitoring database (ERM Consultants Canada Ltd. [n.d.]).
This work is the start of renewed baseline collection, not as a complete baseline or a demonstration of no material effect. Table 17-5 summarizes the status of the available environmental baseline information and identifies the principal data gaps that should be addressed before future project development.
| Contango Silver and Gold – Kitsault Valley Project | Page 223 of 253 |
| Technical Report Summary and updated Mineral Resource Estimate 2026 |
Table 17-5. Environmental baseline status and principal gaps for future development.
| Discipline | Available information | Additional definition required |
| Surface hydrology | Historical spot samples and 2024-2025 reconnaissance sampling | Install representative long-term stations; measure flow, stage, sediment, seasonality, extreme events, glacier contribution, and climate-change sensitivity. |
| Surface-water quality | 1981, 2012, and reported 2024-2025 observations | Develop multi-season, multi-year program with current analytes, QA/QC, guideline comparison, load estimates, and reference/control sites. |
| Groundwater and mine water | Limited portal-water observations | Define hydrostratigraphy, groundwater levels, flow, chemistry, mine inflows, groundwater-surface-water interaction, and monitoring network. |
| Climate and air | Red Point meteorological station from 2024; historical regional climate | Complete validated meteorological record and evaluate air quality, dust, greenhouse gas, snow, icing, avalanche, and dispersion inputs. |
| Aquatic resources | Watershed and fish-habitat context; prior road-stream reconnaissance | Complete fish, fish habitat, benthic, aquatic-health, stream-crossing, and sediment baseline at project-specific locations. |
| Terrestrial ecology | Wildlife plans and species tracking | Update vegetation, wetlands, wildlife, species-at-risk, habitat-use, migratory-bird, and cumulative-effects studies. |
| Geochemistry | Preliminary waste-rock and tailings screening | Characterize all material types for acid generation, metal leaching, source terms, volumes, segregation, treatment, and closure performance. |
| Cultural heritage and land use | AOA, chance-find procedure, targeted field review | Maintain current archaeological and Indigenous land-use information and complete field studies aligned with the selected footprint. |
| 17.5 | Wildlife, Vegetation, and Aquatic Protection |
Wildlife Management Plans have accompanied exploration permit amendments. The current consolidated plan has been prepared by ERM using prior plans, desktop information, and species tracking. It contains encounter and mitigation protocols for grizzly bear, mountain goat, moose, coastal northern goshawk, marbled murrelet, and other species and identifies timing or spatial restrictions for sensitive habitat and helicopter routes.
There are no identified designated protected area lies within the legacy Dolly Varden claim block, while sensitive wildlife areas occur along access routes and elsewhere in the broader region. That statement does not replace current spatial screening for parks, conservancies, wildlife habitat areas, ungulate winter ranges, species-at-risk habitat, old-growth or ecosystem designations, or Indigenous land-use values
Exploration planning should continue to incorporate flight paths, minimum-altitude and setback requirements, nesting and breeding windows, bear attractant and waste controls, spill prevention, erosion and sediment control, stream-crossing constraints, invasive-species prevention, and progressive reclamation.
| Contango Silver and Gold – Kitsault Valley Project | Page 224 of 253 |
| Technical Report Summary and updated Mineral Resource Estimate 2026 |
| 17.6 | Archaeology and Cultural Heritage |
Archaeological Overview Assessments (AOAs) have been prepared for exploration permit amendments. An AOA is a desktop screening tool that uses known archaeological information, landform and terrain context, and other indicators to identify areas of archaeological potential. Proposed disturbances that overlap higher-potential areas may require Preliminary Field Reconnaissance or an Archaeological Impact Assessment by qualified specialists, in coordination with the relevant Indigenous Nations and the Province.
There is an archaeological chance-find procedure and an active Heritage Conservation Act inspection permit inplace. Work is to stop and the applicable notification and protection procedures are to be followed if suspected cultural material is encountered. No new archaeological sites encountered during Project exploration to date. Absence of a reported discovery is not evidence that cultural heritage resources or Indigenous cultural values are absent.
| 17.7 | Indigenous Nations, Communities, and Agreements |
17.7.1 Engagement and Consultation Record
The Crown conducts consultation in connection with Mines Act permit decisions, and the Company provides project information and responds to questions through the application and engagement process. Current engagement associated with the 2025 Wildlife Management Plan, AOA, and permit amendments involving Nisga'a Lisims Government, Metlakatla, Skii km Lax Ha, and Gitanyow hereditary governance, including the Luuxhon and Bii Yoxw wilps for areas east and north of the core watershed (Table 17-6).
Table 17-6. Engagement context reported in the working record.
| Nation
or community |
Reported context | Reported engagement | Effective-date verification or future work |
| Nisga'a Lisims Government | Core Kitsault Valley permits and regional interests identified in the working record | 2018 and 2025 wildlife/AOA and permit-amendment engagement reported | Confirm Crown record, Company correspondence, permit conditions, and any continuing commitments. |
| Metlakatla | Coastal and Great Bear Rainforest interests identified by the draft | 2025 wildlife/AOA engagement reported | Confirm geographic basis, issues record, and whether future marine or access components change engagement scope. |
| Skii km Lax Ha | Traditional-territory interests north of the core Project identified by the draft | Consultation during permit amendments reported | Confirm current governance contacts, Crown record, and applicable permit areas. |
| Gitanyow hereditary governance | Areas east and north, including Luuxhon and Bii Yoxw wilps, identified by the draft | Engagement on Kinskuch/Big Bulk and related permit amendments reported | Reconcile permit boundaries, wilp territories, correspondence, conditions, and future engagement. |
| Alice Arm, Kitsault, Terrace, Stewart and regional communities | Logistics, labour, services, transport, and potential environmental or socioeconomic interests | Operational relationships and procurement occur during exploration | Develop stakeholder register, grievance mechanism, emergency coordination, and socioeconomic baseline for any development proposal. |
| Contango Silver and Gold – Kitsault Valley Project | Page 225 of 253 |
| Technical Report Summary and updated Mineral Resource Estimate 2026 |
The permit consultations concluded without unresolved comments that prevented the reported permit approvals. That outcome is specific to the activities and decisions consulted on and should not be described as consent to a future mine, acceptance of future effects, or a waiver of rights. Engagement records, commitments, conditions, correspondence, and issues tracking should be maintained and verified for the effective date.
17.7.2 Agreements, Local Procurement, and Hiring
There are no project-wide impact-benefit agreement, exploration agreement, cooperation agreement, procurement agreement, employment agreement, or community-benefits agreement for the consolidated Project. No material negotiation or executed agreement of this type has been provided for disclosure
The Company does have a policy preference for local hiring and estimates that approximately 10% to 15% of the field workforce has been drawn from regional communities. This is historical practice rather than a quantified binding commitment unless supported by an adopted policy or agreement.
| 17.8 | Waste, Tailings, Monitoring, and Water Management |
Current exploration does not operate a process plant, leach pad, production waste-rock dump, tailings facility, or mine-water treatment plant. Drill water, cuttings, fuels, domestic wastewater, solid waste, and disturbed sites are managed under applicable exploration permits and operating procedures. Chapter 15 describes current camp and exploration-support systems; permit-specific environmental controls and annual performance should be confirmed from operating records.
Historical Dolly Varden and Torbrit mining left a plant site, underground workings, and limited waste-rock dumps. The 2023 combined technical report states that no on-site tailings were produced because historical ore was primarily shipped from site, and it reported historical acid-rock-drainage testing results within acceptable levels
No waste-rock or tailings management plan, operational monitoring plan, site-wide water balance, discharge strategy, treatment design, or post-closure monitoring plan exists for a future mine because mining and processing methods have not been selected. These systems must be developed together from representative geochemical, hydrological, hydrogeological, geotechnical, climatic, ecological, and process data in the future.
| 17.9 | Future Project Permitting Framework |
A future development proposal would require a coordinated provincial, federal, Indigenous, and local permitting strategy based on the selected project description. The following matrix identifies principal regulatory subjects, but it is not exhaustive and does not determine applicability (Table 17-7).
| Contango Silver and Gold – Kitsault Valley Project | Page 226 of 253 |
| Technical Report Summary and updated Mineral Resource Estimate 2026 |
Table 17-7. Indicative future permitting framework.
| Regulatory subject | Principal authority | Potential requirement | Current status |
| Provincial environmental assessment | Environmental Assessment Act and Reviewable Projects Regulation | Environmental assessment certificate or exemption/order if the selected project is reviewable; project notification may also apply. | No application identified; reviewability cannot be determined without a project description. |
| Mine construction, operation, reclamation and closure | Mines Act and Health, Safety and Reclamation Code | Major-mine permit and approved mine, reclamation and closure plans; security based on liability. | Exploration permits only. |
| Effluent, air emissions and waste | Environmental Management Act | Authorizations for discharges, emissions, waste handling and treatment, as applicable. | No production authorization identified. |
| Water diversion, use and works | Water Sustainability Act | Water licences, use approvals and approvals for changes in and about streams, as applicable. | Camp authorization reported; development needs undefined. |
| Land, roads, timber and foreshore | Land Act, Forest Act and related tenure authorities | Crown land tenure, road and access authorities, timber authorizations, and foreshore or marine tenure, as applicable. | Exploration arrangements reported; future footprint undefined. |
| Archaeology and heritage | Heritage Conservation Act | Heritage inspection/investigation permits and impact-management measures, as applicable. | Exploration AOA and chance-find process reported. |
| Fish, fish habitat and aquatic species | Federal Fisheries Act and Species at Risk Act | Authorizations or permits if activities affect fish, fish habitat, listed aquatic species or critical habitat. | Applicability to development unknown. |
| Federal impact assessment and other federal approvals | Impact Assessment Act, Species at Risk Act, Migratory Birds Convention Act, Canadian Navigable Waters Act and other federal laws | Assessment decision and project-specific approvals where triggered. | No federal development assessment identified. |
| Public health, buildings, fire and emergency services | Provincial and local authorities | Camp, potable water, food, sewage, building, fire, fuel and emergency approvals, as applicable. | Exploration authorizations partly reported; future needs undefined. |
Sources: British Columbia (1996a, 1996b, 1996c, 1996d, 1996e, 2003, 2004, 2014, 2018, 2019); British Columbia, Mineral Titles Branch (n.d.); British Columbia, Ministry of Mining and Critical Minerals (2026a, 2026b, n.d.); Canada (1985a, 1985b, 1994, 2002, 2019).
The permitting strategy should identify lead and participating agencies, assessment reviewability, Crown and Company engagement roles, information requirements, seasonal survey windows, Indigenous and public participation, application sequencing, decision points, permit dependencies, security, compliance systems, and realistic schedule ranges. No permitting schedule should be represented as established until the project description and regulator engagement support it.
| Contango Silver and Gold – Kitsault Valley Project | Page 227 of 253 |
| Technical Report Summary and updated Mineral Resource Estimate 2026 |
| 17.10 | Closure and Reclamation |
17.10.1 Current Exploration Remediation
Current reclamation obligations are governed by the applicable exploration permits and the Mines Act. They include stabilization and reclamation of drill sites, pads, trails, trenches, camp disturbances and other authorized work; removal or management of materials and equipment; erosion control; revegetation where applicable; annual reporting; and regulator acceptance. Progressive reclamation reduces outstanding liability but does not eliminate obligations until accepted by the Province.
The Company reports reclamation securities of C$99,000 for MX-1-860 and C$76,000 for MX-1-603. Additional securities are listed for other exploration permits in Table 17-2. These amounts are permit security, not mine-closure cost estimates and not limits on liability. Executed permit conditions, security instruments, outstanding disturbance, reclamation cost estimates, and inspection status should be verified at the effective date.
17.10.2 Historical Features and Future Mine Closure
Historical plant foundations, underground openings and waste-rock piles occur within the Project. Access to certain historical workings has been restricted for safety.
No mine closure plan or mine closure cost estimate has been prepared for the consolidated Project because no mineral reserve, mine plan, process plant, waste or tailings facility, or site-wide water-management design has been defined. A future closure plan would need to address progressive reclamation, physical and chemical stability, water treatment, infrastructure disposition, underground and surface openings, tailings and waste facilities, revegetation, habitat and land-use objectives, post-closure monitoring, adaptive management, care and maintenance, financial security, and engagement with Indigenous Nations and communities.
| 17.11 | QP Interpretation, Risks, and Finalization |
Based on the consolidated source record, exploration permitting, wildlife and archaeological planning, progressive reclamation, and regional engagement processes are established for the current stage.The current framework appears adequate to support the authorized exploration activities described in Chapter 7.
| Contango Silver and Gold – Kitsault Valley Project | Page 228 of 253 |
| Technical Report Summary and updated Mineral Resource Estimate 2026 |
| 18 | CAPITAL AND OPERATING COSTS |
This section is not applicable.
| Contango Silver and Gold – Kitsault Valley Project | Page 229 of 253 |
| Technical Report Summary and updated Mineral Resource Estimate 2026 |
| 19 | ECONOMIC ANALYSIS |
This section is not applicable.
| Contango Silver and Gold – Kitsault Valley Project | Page 230 of 253 |
| Technical Report Summary and updated Mineral Resource Estimate 2026 |
| 20 | ADJACENT PROPERTIES |
| 20.1 | Scope and Reporting Basis |
This chapter summarizes selected properties near the Kitsault Valley Project (the Project) to provide regional geologic context. The adjacent-property information is not used to estimate the Project's exploration results, mineral resources, mineral reserves, modifying factors, or economic outcomes. It does not establish continuity of geology, structure, alteration, grade, thickness, metallurgy, or economic viability across property boundaries.
Note: The QP has not visited the adjacent properties for purposes of this TRS and has been unable to independently verify the adjacent-property information summarized below. The information is not necessarily indicative of mineralization on the Kitsault Valley Project. Any third-party exploration results, historical production, mineral-resource statements, development concepts, or permit status remain statements of the adjacent-property owner or operator and are not estimates or conclusions of the Project QP.
| 20.2 | Regional Setting and Property Reconciliation |
The Project lies within the Stewart Complex of northwestern British Columbia, commonly included in the region known as the Golden Triangle. Triassic to Jurassic island-arc volcanic and sedimentary successions, younger intrusive rocks, and long-lived structures host numerous precious-metal vein, volcanogenic massive sulphide, skarn, and porphyry occurrences. This shared regional setting supports district-scale exploration concepts but does not, by itself, demonstrate that mineralization on an adjacent property continues onto the Project (Table 20-1, Figure 20-1).
Table 20-1. Adjacent properties selected for regional context.
| Property | Relative location | Reported
owner/operator |
Reported stage | Regional relevance |
| Red Mountain Gold Project | Northwest; approximately 15 km northeast of Stewart | Cambria Gold Mines Inc. (formerly Ascot Resources) | Advanced gold-silver project with historical underground development | Intrusion-related gold-silver system in Triassic-Jurassic host rocks |
| Golddigger / Surebet | West to southwest; tenure locally contiguous with the Project | Goliath Resources Limited | Exploration-stage polymetallic gold-silver discovery | Structurally controlled sulphide-rich veins and alteration zones |
| Kitsault Molybdenum Project | South of Alice Arm and adjacent to the southern Project area | Avanti Kitsault Mine Ltd. / New Moly LLC | Past-producing brownfield molybdenum project | Porphyry molybdenum stockwork system |
| Contango Silver and Gold – Kitsault Valley Project | Page 231 of 253 |
| Technical Report Summary and updated Mineral Resource Estimate 2026 |
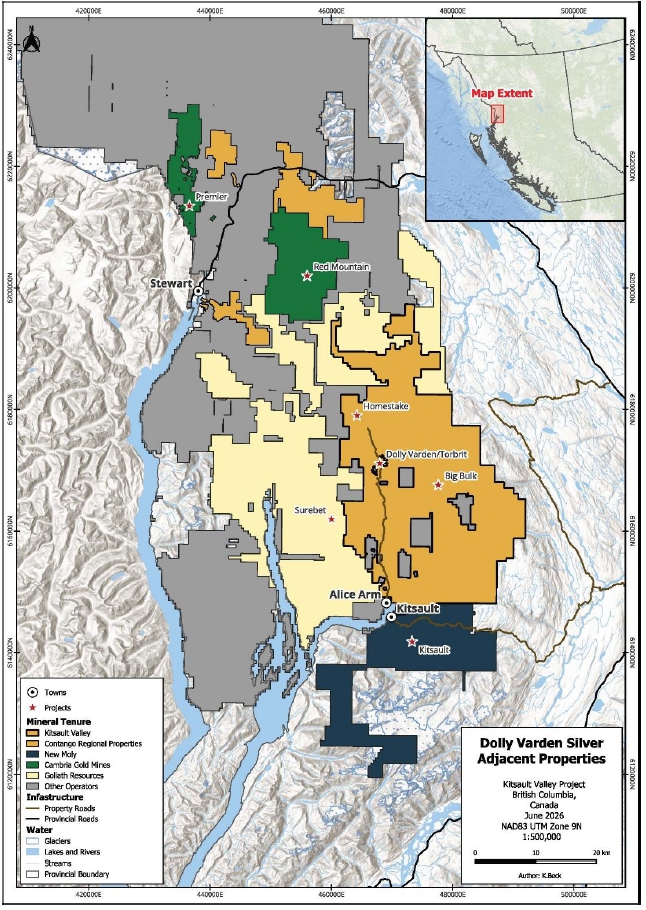
Figure 20-1. Kitsault Valley Project and selected adjacent mineral tenure. Tenure ownership and boundaries are based on the June 2026 Company compilation.
| Contango Silver and Gold – Kitsault Valley Project | Page 232 of 253 |
| Technical Report Summary and updated Mineral Resource Estimate 2026 |
| 20.3 | Red Mountain Gold Project |
The Red Mountain Gold Project is northwest of the Project and approximately 15 km northeast of Stewart, near the headwaters of Bitter Creek. The property was advanced by IDM Mining Ltd. between 2014 and 2019 and was acquired by Ascot Resources Ltd. in March 2019. The current owner identifies itself as Cambria Gold Mines. The filing QP should confirm the legal owner and corporate name as of the TRS effective date.
Owner disclosures describe Red Mountain as a gold-silver deposit hosted by multiphase Jurassic dioritic intrusive rocks that cut Triassic sedimentary rocks of the Stuhini Group. Mineralized zones are described as tabular, northwest-trending, moderately to steeply southwest-dipping pyrite-rich stockworks with local pyrrhotite, quartz-carbonate fracture filling, and strong sericite alteration. Gold is reported in native gold, electrum, telluride, and sulphosalt minerals. These characteristics differ in detail from the principal silver-rich vein and stratabound mineralization described on the Project, although both occur within the broader Stewart metallogenic setting.
Public disclosures report approximately 2,000 m of production-scale underground workings and a 2019 Canadian NI 43-101 mineral-resource update. The QP has not verified those workings, the supporting drill database, estimation assumptions, classification, or the current status of the third-party estimate. No Red Mountain mineral-resource quantity or grade is adopted in this TRS, and the Canadian estimate has not been reconciled to the definitions and disclosure requirements of S-K 1300 for purposes of this chapter.
| 20.4 | Golddigger Property and Surebet Discovery |
The Golddigger property lies west and southwest of the Project, approximately 35 km south of Stewart. Goliath Resources Limited's public disclosures describe five claim groups covering approximately 91,500 ha. Goliath announced in March 2026 that it had acquired the remaining optioned interest and held a 100% interest in the property, subject to a reported 2% net smelter return royalty. Because this ownership update post-dates some of the source reports, the filing QP should apply the status current at the TRS effective date.
Exploration since 2021 has focused on the Surebet discovery, located near the Project's western side. Operator disclosures describe a stacked, structurally controlled polymetallic vein system containing galena, sphalerite, pyrrhotite, and pyrite within silica-altered host rocks. The operator reports multiple mineralization styles elsewhere on the property, including intrusion-related and epithermal systems and targets interpreted as volcanogenic massive sulphide occurrences.
Operator disclosures report extensive drilling through 2025, but no S-K 1300 mineral resource for Golddigger or Surebet is relied upon in this TRS. The presence of mineralization on Golddigger does not demonstrate extension across the intervening tenure or onto the Project.
| 20.5 | Kisault Molybdenum Project |
The Kitsault molybdenum project is a brownfield property south of Alice Arm and immediately south of the Project area shown on Figure 20-1. Public information identifies Avanti Kitsault Mine Ltd. as the project company and New Moly LLC as its owner.
The property hosts porphyry molybdenum mineralization associated with the Alice Arm intrusive suite. Mineralization is described as molybdenite-bearing stockwork and sheeted veins in intrusive and adjacent hornfelsed rocks. Historical open-pit operations reportedly produced approximately 30 million pounds of molybdenum intermittently between the late 1960s and 1982. New Moly describes the site as having historical infrastructure and advanced development permits.
| Contango Silver and Gold – Kitsault Valley Project | Page 233 of 253 |
| Technical Report Summary and updated Mineral Resource Estimate 2026 |
A 2013 Canadian NI 43-101 technical report described mineral resources and a redevelopment concept that included an expanded open pit, process plant, access-road work, powerline upgrades, stockpiles, a waste-rock management facility, a tailings management facility, and associated water-management ponds. The QP has not verified the historical production, title, permit status, engineering assumptions, or mineral-resource estimate, and no quantity, grade, production rate, mine life, or permit conclusion from that report is adopted in this TRS. The Kitsault porphyry system provides regional geologic context but is not directly analogous to the Project's principal precious-metal deposits.
| 20.6 | Other Surrounding Tenure |
Figure 20-1 also shows mineral tenure held by other operators and regional property holdings that are not discussed individually. Their inclusion on the map indicates spatial context only. No technical inference is made from the ownership, size, shape, or proximity of those tenure blocks.
| 20.7 | Qualified Person Interpretation |
The adjacent properties demonstrate that the Stewart Complex hosts several mineralizing systems and has supported sustained regional exploration and development. They provide useful context for selecting regional geologic models and interpreting district-scale stratigraphy and structures. They do not provide direct evidence of grade, continuity, thickness, metallurgy, resource classification, modifying factors, or economic extraction on the Kitsault Valley Project.
| Contango Silver and Gold – Kitsault Valley Project | Page 234 of 253 |
| Technical Report Summary and updated Mineral Resource Estimate 2026 |
| 21 | OTHER RELEVANT DATA AND INFORMATION |
This section is not applicable.
| Contango Silver and Gold – Kitsault Valley Project | Page 235 of 253 |
| Technical Report Summary and updated Mineral Resource Estimate 2026 |
| 22 | INTERPRETATION AND CONCLUSIONS |
| 22.1 | Basis and Principal Conclusions |
The updated mineral resource estimate provides a more developed geological framework and a larger Indicated resource inventory for the Kitsault Valley Project. The principal advance at Homestake Main and Homestake Silver is the incorporation of drilling and revised mineralized domains that were not represented in the geological framework underlying the previous resource disclosure. The QP considers this improved definition of mineralized geometry and continuity to be a substantive increase in geological confidence. Changes in resource grade and contained metal also reflect the material included in the revised models and the estimation and reporting assumptions adopted for this update.
These interpretations and conclusions are based on the information and analyses presented in this TRS for the mineral resource estimate effective September 11, 2026. The conclusions address the eight deposits in the Homestake and Dolly Varden areas and the technical uncertainties relevant to their continued evaluation. No mineral reserves are declared.
| 22.2 | Exploration Data and Verification |
The accepted historical and modern drilling, sampling, analytical and geological information provides an adequate basis for the interpretation and estimation work described in this TRS. The database includes accepted results from the completed 2025 program. The assay dataset was locked at the start of January 2026, geological-solid updates and database review continued through March, and the databases and supporting information were certified by the QP on April 13, 2026. The final resource statement and supporting assumptions were accepted as complete and current on September 11, 2026.
The eight-deposit header inventory contains 1,454 holes totaling 328,638.18 meters. Separate merged exports for the seven updated deposits contain 24,120 intervals across 34 domains; 23,264 intervals totaling 27,176.00 meters from 947 distinct hole identifiers have at least one populated metal result. Exported intervals, original assays and final composites are different populations. All exported hole identifiers matched the project header inventory, and the export reconciliation identified no duplicate hole–from–to records, non-positive lengths or internal overlaps. South Reef is outside this seven-export inventory.
The QP’s assessment considers the sampling and analytical procedures, quality-control results, selected comparisons of digital records with original documentation, database integrity checks and site observations described in Chapters 8 and 9. Some original historical assay certificates remain unavailable. Confidence in accepted historical records therefore also depends on prior verification, internal consistency, location reliability and agreement with surrounding drilling. This limitation remains relevant where historical information provides a substantial portion of the local estimation support.
Additional drilling has improved local geological and spatial support, but the amount of drilling alone does not establish resource confidence. The orientation, distribution and representativeness of the intersections, together with geological and grade continuity, determine the confidence that can be assigned to individual modeled volumes.
| Contango Silver and Gold – Kitsault Valley Project | Page 236 of 253 |
| Technical Report Summary and updated Mineral Resource Estimate 2026 |
| 22.3 | Geological Interpretation by Area |
22.3.1 Homestake Area
Homestake Main comprises footwall, hanging-wall and middle mineralized lenses within a broader lower-grade envelope. Homestake Silver comprises twelve numbered lenses and a surrounding lower-grade halo. Hard domain boundaries separate the contrasting grade populations. The QP considers the revised framework more representative of the interpreted systems than retaining the earlier domain geometry without revision. Local uncertainty remains at domain margins, structural intersections, thin or irregular zones and sparsely drilled extensions.
South Reef retains the previous Inferred estimate of 0.445 Mt at 8.68 g/t Au and 4.90 g/t Ag, containing 124.200 koz Au and 0.100 Moz Ag, at a 2.0 g/t AuEq cut-off. No additional drilling is incorporated into this retained estimate. Its 8.600 Moz AgEq is a comparative metric and is not the result of applying the current Homestake Silver recovery matrix or the 132 g/t AgEq filter. Improvements elsewhere in the Homestake area do not themselves establish an upgrade at South Reef.
22.3.2 Dolly Varden Area
Torbrit, Wolf, Kitsol, Dolly Varden and North Star comprise distinct mineralized bodies with differing geometry, grade distribution and drill support. The stratigraphic and structural controls represented by these deposits support the use of separate estimation domains and local search controls. Torbrit and Wolf account for most of the area’s reported silver inventory. Historical mining at Torbrit, Dolly Varden and North Star makes the interpretation of mined-out volumes an additional control on the remaining resource.
Wolf’s upper veins and deep domain are estimated separately, reflecting their geometry, metal associations and analytical coverage. The final Kitsol 35/70 case reports 0.29 Mt Indicated and 0.14 Mt Inferred, containing 2.876 and 1.380 Moz AgEq, respectively. North Star’s selected 30/70 case reports 0.36 Mt Indicated and 0.23 Mt Inferred, containing 3.571 and 1.587 Moz AgEq. North Star’s Inferred silver grade is 123.99 g/t, so its equivalent-grade qualification depends materially on the other estimated metals and their assumed recoveries. Sparse non-silver data and density support therefore remain specific priorities.
| 22.4 | Estimation and Classification |
The seven updated estimates were prepared in Leapfrog Geo version 2026.1.2 with Edge, using hard geological domains, compositing, capping by domain and element, density assignments and domain-specific parameters. Metals were estimated independently using inverse-distance-cubed weighting, with Leapfrog declustering applied separately by domain and element in every estimator. Variable orientation follows mineralized geometry where appropriate. The sub-blocked models use 5 × 5 × 5 meter parent cells and minimum 0.5 × 0.5 × 0.5 meter sub-blocks in NAD83 / UTM Zone 9N coordinates. Final exports were locked on September 11, 2026.
The confirmed target composite lengths are 2.0 meters for Homestake Main, Homestake Silver, Wolf and Torbrit; 1.25 meters for Dolly Varden Main; and 1.5 meters for Kitsol and North Star. Within-boundary compositing used hard boundaries, equal distribution of residual end lengths below 1.0 meter and no additional compositing weight. The separate estimation declustering weights should not be confused with compositing weights. Capping input-metal losses likewise describe the input population, rather than an equivalent percentage loss of reported resource metal.
| Contango Silver and Gold – Kitsault Valley Project | Page 237 of 253 |
| Technical Report Summary and updated Mineral Resource Estimate 2026 |
The suitability of inverse-distance-cubed estimation depends on the geological controls, sample selection and model validation described in Chapter 11. The method gives greater influence to nearby samples, which can be useful in locally variable mineralization but can also make estimates sensitive to isolated high grades and uneven drilling. Grade capping, sample limits, limits on contributions from individual holes and the treatment of domain boundaries are therefore important controls. The change from historical kriging does not, by itself, demonstrate improved accuracy; the model must reproduce the supported geological and grade patterns without material unsupported extrapolation.
Resource classification reflects geological and grade continuity, data quality and independent drill-hole support. Dedicated classification estimators are distinct from grade-estimation searches. For Homestake Main, Homestake Silver, Wolf, Kitsol, Torbrit and North Star, AvgD divided by 0.707 is an approximate nominal-spacing indicator rather than measured drill-hole spacing or a numerical confidence interval. The selected limits are evaluated with domain geometry and spatial continuity.
Indicated classification expresses greater confidence in quantity, grade and continuity. A larger Indicated inventory does not demonstrate one-for-one conversion of the preceding Inferred blocks. Based on the geological setting and nature of the available drilling, the QP reasonably expects that the majority of Inferred resources could be upgraded through continued exploration. Actual upgrading requires confirmation of the interpreted continuity and other supporting assumptions and is not assured. No numerical conversion percentage or schedule is established, and Inferred resources cannot be converted directly to mineral reserves.
| 22.5 | Mineral Resource Outcome |
Table 22-1 summarizes the finalized resource statement by area and category. The complete deposit tables, individual metal grades, equivalent-metal assumptions and reporting constraints are presented in Chapter 11.
Table 22-1. Mineral resource summary by area and classification.
| Area | Category | Tonnage (Mt) |
Ag Moz | Au koz | AgEq Moz |
| Homestake | Indicated | 2.140 | 6.133 | 387.416 | 33.275 |
| Dolly Varden | Indicated | 5.520 | 52.565 | 7.285 | 56.270 |
| Project total | Indicated | 7.660 | 58.698 | 394.700 | 89.545 |
| Homestake | Inferred | 4.595 | 7.965 | 615.824 | 48.501 |
| Dolly Varden | Inferred | 1.710 | 14.839 | 4.993 | 16.419 |
| Project total | Inferred | 6.305 | 22.804 | 620.817 | 64.920 |
Chapter 11, Table 11-60; effective September 11, 2026. Mt = million metric tons; Moz = million troy ounces; koz = thousand troy ounces. Totals may differ due to rounding. Categories are reported separately. South Reef retains its separate reporting basis. AgEq is not additional metal to be added to silver and gold contents. Contained metal is not recovered or payable metal. No Measured resources or mineral reserves are reported, and mineral resources do not have demonstrated economic viability.
Relative to the preceding statement presented in the 2023 combined report, Indicated tonnage increases from 4.153 to 7.660 Mt, an increase of 84.4%, and Indicated AgEq increases from 46.368 to 89.545 Moz, an increase of 93.1%. Inferred tonnage decreases from 6.831 to 6.305 Mt, a decrease of 7.7%, and Inferred AgEq decreases from 86.725 to 64.920 Moz, a decrease of 25.1%. These are net comparisons on their respective reporting bases and do not measure block-by-block category conversion. The changes combine drilling, geological domains, capping, interpolation, density, classification, depletion and reporting assumptions. Kitsol is combined with Torbrit for comparison with the earlier reporting unit, and gold was not reported for the southern deposits in the earlier baseline.
| Contango Silver and Gold – Kitsault Valley Project | Page 238 of 253 |
| Technical Report Summary and updated Mineral Resource Estimate 2026 |
At Homestake Main, Indicated grade decreases from 7.02 to 6.35 g/t Au and from 74.8 to 49.55 g/t Ag. The increased geological confidence and lower grades are compatible outcomes: the revised resource represents a different modeled and classified population of material. Domain revision, the distribution of newly supported material, high-grade treatment, interpolation and reporting selection can all affect the mean. Their individual contributions cannot be quantified from the aggregate resource tables alone.
| 22.6 | Metal Prices and Metallurgical Assumptions |
The updated equivalent-metal calculations use QP-accepted prices of US$53/oz Ag, US$3,500/oz Au, US$5.00/lb Cu, US$1.25/lb Zn and US$0.90/lb Pb, with management concurrence in May 2026. Chapter 11, Section 11.4 describes the price basis and three recovery groups: the Dolly Varden area, Homestake Main and Homestake Silver. South Reef retains its historical basis. The relative recovery factors are embedded in each updated AgEq formula and should not be applied a second time to the individual equivalent-metal contributions.
Changes in relative metal prices and assumed recoveries alter the equivalent grade assigned to a block. They can also change which blocks meet a fixed equivalent-grade threshold, even when the underlying individual metal grades and geometry remain unchanged. The effect on metric tons and contained metal depends on the distribution and combination of metals within the blocks. A single conversion factor applied to the project total cannot reproduce that selection effect. Separating the effect of price or recovery changes from geological and estimation changes requires controlled block-level comparisons with other inputs held constant.
The metallurgical evidence includes the 2016 Homestake testing, the 2019 Dolly Varden and Torbrit program, and the 2025–2026 work extending coverage to Wolf and Kitsol. The results support continued evaluation of conventional flotation and cyanidation routes. The different mineralogy and metal associations across the deposits support differentiated recovery assumptions rather than treating all mineralization as metallurgically uniform.
The testwork does not establish a final integrated flowsheet or a demonstrated plant recovery for every domain. Some adopted recoveries remain estimates or proxies based on the available testing and interpretation. Their application is subject to sample representativeness, variability in mineralogy, downstream losses and the treatment of deleterious elements. Arsenic, antimony and mercury in some tested concentrates may affect product quality, treatment requirements or commercial terms. These matters could change the equivalent grades, reporting thresholds and potentially economic portions of the resource.
| 22.7 | Mining Concept and Reasonable Prospects of Economic Extraction |
Potential underground extraction is the basis of the reporting concept for the updated deposits. Mechanized mining, including longhole stoping where geometry and ground conditions permit, warrants further evaluation. The viability of that concept depends on mining width, continuity, dilution, mining recovery, access development, geotechnical conditions, processing performance and site costs. It cannot be established from grade or classification distance alone.
| Contango Silver and Gold – Kitsault Valley Project | Page 239 of 253 |
| Technical Report Summary and updated Mineral Resource Estimate 2026 |
The seven updated deposits are reported at 132 g/t AgEq within accepted underground mineralized shapes developed in Leapfrog. The shapes delineate spatially continuous mineralization considered potentially amenable to future mechanized underground extraction. Unclassified material and historical mined-out volumes at Torbrit, Dolly Varden and North Star are excluded. South Reef retains its separate 2.0 g/t AuEq cut-off and preceding physical-resource basis.
The grade threshold and spatial constraints form part of the QP’s assessment of reasonable prospects for economic extraction at the current exploration stage. The assessment also considers underground access, geometry and continuity, processing options, recovery and marketability, infrastructure, environmental management and permitting. The QP considers the identified geological, density, metallurgical and engineering issues capable of resolution through further drilling, testing and engineering work. Historical mining and earlier conceptual studies provide context for this assessment without demonstrating the economic viability of the current resources.
The reporting point of reference is in situ mineralized material above the applicable cut-off, after exclusion of modeled historical mined-out material where relevant, and before mining dilution or mining recovery. The resource-stage work does not establish a mine production schedule, project capital requirement, development cash flow, net present value or internal rate of return. No economic viability or conversion to mineral reserves is demonstrated by the resource statement.
| 22.8 | Infrastructure, Environment and Permitting |
Existing facilities and access arrangements support continued exploration. Rugged terrain, precipitation, snow, avalanche exposure and the separation of deposit areas affect future facility planning. Development would require evaluation of roads, power, water, processing, waste management and product transport. Nearby regional infrastructure does not establish available capacity, secured access or acceptable cost.
Exploration authorizations do not constitute approval to construct or operate a mine. Development requires additional baseline studies, engineering, assessment and permitting. Historical workings and waste, watershed conditions, water quality and closure obligations remain relevant. Tenure, royalties, permit conditions and engagement with affected Indigenous Nations and communities must be addressed with the development concept.
| 22.9 | Significant Risks and Uncertainties |
Table 22-2 summarizes the principal uncertainties identified in Chapter 11. The current estimate incorporates the QP-accepted validation and classification review. The additional work below addresses continuing uncertainty and subsequent model updates.
| Contango Silver and Gold – Kitsault Valley Project | Page 240 of 253 |
| Technical Report Summary and updated Mineral Resource Estimate 2026 |
Table 22-2. Principal uncertainties affecting resource confidence and further evaluation.
| Uncertainty | Potential effect | Work that would reduce uncertainty |
| Geological and grade continuity | Changes to domain geometry, local grades and classification, particularly near boundaries and sparsely drilled extensions. | Targeted infill drilling, structural review and domain validation. |
| Historical data and depletion | Uncertainty in locally supported grades and in the volume remaining around historical workings. | Targeted record verification and reconciliation of surveyed workings with depletion models. |
| High grades and interpolation | Sensitivity to isolated high grades, cap selection, uneven drilling and local extrapolation. | Preserve accepted capped inputs and declustering weights; use matched capped/uncapped and alternative-estimator tests where needed. Input-metal loss is not resource-metal loss. |
| Density variability | Tonnage sensitivity where sparse or grade-screened measurements do not represent domain volumes, particularly North Star, Kitsol and Torbrit. | Collect representative domain-coded measurements; expand Wolf Deep coverage and evaluate Torbrit’s domain distribution. |
| Classification support | Category changes where nominal spacing does not reflect independent hole support, continuity or remnant geometry. | Maintain final criteria and spatial checks; keep historical test populations separate from final outputs and design infill to resolve specific gaps. |
| Recovery and product quality | Changes in equivalent grades and recoverable value, especially where non-silver assay coverage or recovery evidence is limited. | Target North Star and other historical southern populations; complete variability and integrated testing, product characterization and commercial assessment. |
| Mining and reporting economics | Changes in cut-off, dilution, mineable dimensions and accessible resource volumes. | Conceptual layouts, geotechnical work, physical reporting constraints and documented cost sensitivity. |
| Infrastructure and authorizations | Changes in access, development cost, timing and the ability to advance a mining concept. | Access and facility studies, environmental baselines, permit review and continued Indigenous engagement. |
| 22.10 | Overall QP Conclusion |
The QP considers the accepted geological, drilling, assay and density information adequate for the resource estimates at the assigned confidence levels. The adopted domains, high-grade controls, estimation settings and spatial classification review appropriately reflect the mineralized systems and available data. The seven updated deposits support Indicated and Inferred resources, and South Reef remains Inferred on its retained basis. The QP reasonably expects that the majority of Inferred resources could be upgraded through continued exploration, subject to the results, and considers the identified technical issues capable of resolution through further work. The priorities in Chapter 24 address continuity, density, historical depletion, metallurgy, mining and infrastructure. The estimate supports continued evaluation and does not establish mineral reserves or demonstrated economic viability.
| Contango Silver and Gold – Kitsault Valley Project | Page 241 of 253 |
| Technical Report Summary and updated Mineral Resource Estimate 2026 |
| 23 | RECOMMENDATIONS |
| 23.1 | Recommended Program |
The QP recommends that the Kitsault Valley Project advance through a staged program from the mineral resource estimate effective September 11, 2026. The first stage should complete the 2026 drilling program, receive and validate the remaining assays, update the current mineral resource estimate in H1 2027, complete the planned 2026-2027 metallurgical program, and then proceed to an S-K 1300 Initial Assessment if the resource update .
The second stage should advance the Project toward a pre-feasibility study (PFS) over the next three years. That work should focus on staged geotechnical, hydrogeological, hydrological, environmental, permitting, access and other field investigations sufficient to support PFS-level Technical Report.
| 23.2 | Stage 1 – 2026 Drill Close-out, 2027 MRE Update and Initial Assessement |
Complete the 2026 drilling program and incorporate the 2026 drilling in a 2027 update to the current mineral resource estimate after the relevant assays have been received, validated and passed the Company's QA/QC requirements. The September 11, 2026 estimate would be the comparison baseline. The timing of the 2027 MRE update depends principally on assay receipt, validation, geological interpretation and QP review but is expected in H1 2027.
Proceed with the planned 2026-2027 metallurgical program described in Chapter 10. The program should evaluate representative composites through characterization, comminution, flotation, locked-cycle testing, leaching and detailed product-quality analysis. Results should be integrated with market, processing and environmental inputs before they are used in any economic assumptions.
Once the 2027 MRE update is complete, commission an integrated Initial Assessment under S-K 1300 that includes preliminary capital and operating cost estimates, economic analysis and sensitivity work. The study should evaluate underground mining methods, access, production scheduling, dilution and recovery together with processing or off-site treatment options, product transport and market terms. Assuming assay receipt, MRE updating and metallurgical inputs progress as expected, the Initial Assessment could target completion near the end of 2027; that target should remain conditional on the timing and quality of the required inputs.
The Initial Assessment should include environmental, infrastructure, hydrology, hydrogeology, geotechnical, permitting, water, waste and closure assessments at the level appropriate for the study. Its principal deliverables should be a development concept, a documented cost basis, a cash-flow assessment and sensitivities identifying the main drivers and outstanding risks. Resource-category treatment and any use of Inferred resources must meet S-K 1300 requirements. This work will guide the next investment decision and does not establish mineral reserves.
| 23.3 | Stage 2 – Three Program Toward Pre-Feasibility Study (PFS) |
After the Initial Assessment, advance a staged work program directed toward completion of a pre-feasibility study over approximately the next three years. The program should be released in decision points tied to the Initial Assessment results, updated geological model, metallurgical results, permitting priorities and field-season access. Stage 2 covers the additional engineering, baseline and permitting work required for the PFS path.
Retain a staged allowance for up to 5,000 meters of geotechnical and hydrogeological drilling. Its locations, timing and extent should follow engineering priorities identified in the Initial Assessment and should support underground access, stope design, groundwater inflow, water management, infrastructure siting and PFS-level risk reduction. This work is conditional on specialist design and should be scoped separately from the current drilling program.
| Contango Silver and Gold – Kitsault Valley Project | Page 242 of 253 |
| Technical Report Summary and updated Mineral Resource Estimate 2026 |
The Stage 2 field program should also expand hydrology, hydrogeology, environmental baseline, geochemistry, permitting, access, infrastructure and closure-related studies. These studies should be scheduled early enough to support PFS engineering and realistic permitting strategy, including seasonal data requirements and engagement with affected Indigenous Nations and communities.
| 23.4 | Proposed Budget and Sequence |
Table 23-1 summarizes the staged budget. The base allowances are conceptual planning amounts. The low and high columns show a ±20% planning sensitivity around the base allowances, not a formal estimate-class accuracy range. Stage 1 includes the metallurgy, 2027 MRE update and Initial Assessment allowances; it does not include the already-authorized cost of completing the 2026 drilling program. Stage 2 includes additional geotechnical, hydrogeological, engineering, environmental, hydrology, permitting, access/infrastructure and other investigations required to support a PFS over approximately three years. Note that Stage 2 may also include additional in-fill drilling if deemed necessary to upgrade resources after incorporating results of the 2026 drill program. As this amount is not currently known, there is no allocation made at this time. It will no doubt be part of the recommendations after completion of the Stage 1 Initial Assessment.
The Stage 1 base allowance is US$1,450,000, with a planning range of approximately US$1,160,000 to US$1,740,000. The Stage 2 base allowance is US$7,512,500, with a planning range of approximately US$6,010,000 to US$9,015,000. The combined staged planning allowance is US$8,962,500, with a +/-20% planning range of approximately US$7,170,000 to US$10,755,000.
The QP recommends staged expenditure against confirmed scopes and results. This work supports further evaluation; it does not establish additional mineral resources, mineral reserves or economic returns, and it does not commit the Project to development.
| Contango Silver and Gold – Kitsault Valley Project | Page 243 of 253 |
| Technical Report Summary and updated Mineral Resource Estimate 2026 |
Table 23-1. Proposed staged work-program budget in U.S. dollars.
| Stage | Work item and timing | Base US$ | Low -20% US$ | High +20% US$ | Budget basis |
| Stage 1 | Complete 2026 drilling, assay receipt and QA/QC close-out. 2026 to early 2027. | 0 | 0 | 0 | No new incremental allowance in this chapter; complete under the approved 2026 exploration program. |
| Stage 1 | Metallurgical program. Fall 2026 through 2027. | 250,000 | 200,000 | 300,000 | Five representative composites, comminution, flotation, leaching, product-quality analysis and external metallurgical coordination. |
| Stage 1 | 2027 MRE update and QP reporting. After receipt and validation of 2026 assays. | 200,000 | 160,000 | 240,000 | Update the current MRE with accepted 2026 drilling; preserve the September 11, 2026 estimate as the comparison baseline. |
| Stage 1 | Initial Assessment with economic analysis. After the 2027 MRE; target end of Q2 2027 if assays and MRE timing allow. | 1,000,000 | 800,000 | 1,200,000 | Integrated S-K 1300 Initial Assessment with mining, processing, infrastructure, environmental, hydrology, permitting, capital, operating cost and sensitivity work. |
| Stage 2 | Geotechnical and hydrogeological drilling - up to 5,000 meters. Staged as engineering needs are confirmed. | 3,562,500 | 2,850,000 | 4,275,000 | Initial and follow-up drilling to support mine access, underground design, water inflow, ground conditions and PFS-level engineering. |
| Stage 2 | Geotechnical testing and instrumentation. With staged geotechnical drilling. | 450,000 | 360,000 | 540,000 | Laboratory testing, instrumentation, monitoring and specialist interpretation. |
| Stage 2 | PFS engineering, environmental, hydrology, permitting and field studies. Over approximately three years following the Initial Assessment. | 3,500,000 | 2,800,000 | 4,200,000 | Conceptual
planning allowance for engineering trade-off studies, baseline expansion, hydrology/ hydrogeology, geochemistry, access/infrastructure field work, permitting strategy and reporting. |
| Stage 1 subtotal | 1,450,000 | 1,160,000 | 1,740,000 | Planning sensitivity only; not a formal cost-estimate accuracy range. | |
| Stage 2 subtotal | 7,512,500 | 6,010,000 | 9,015,000 | Planning sensitivity only; not a formal cost-estimate accuracy range. | |
| Total staged planning allowance | 8,962,500 | 7,170,000 | 10,755,000 | Planning sensitivity only; not a formal cost-estimate accuracy range. |
Budget basis. Amounts are conceptual planning allowances in U.S. dollars and remain subject to Company approval, final scopes, contractor pricing, laboratory schedules and exchange-rate assumptions. The low and high columns are a requested ±20% planning sensitivity and are not presented as a formal estimate-class accuracy range. Stage 1 excludes the cost of the already-authorized 2026 drilling program to avoid double counting. The retained Stage 2 drilling allowance is limited to geotechnical and hydrogeological drilling at US$712.50 per meter, including normal field logistics; specialist testing and instrumentation are separate.
| Contango Silver and Gold – Kitsault Valley Project | Page 244 of 253 |
| Technical Report Summary and updated Mineral Resource Estimate 2026 |
| 24 | REFERENCES |
References are listed alphabetically by author or organization. Bracketed titles describe sources whose formal titles were not available; “n.d.” means no confirmed publication date. Where a source was consulted through a predecessor report, that report is identified.
Alldrick, D.J. (1993). Geology and metallogeny of the Stewart mining camp, northwestern British Columbia. British Columbia Ministry of Energy, Mines and Petroleum Resources, Bulletin 85, 105 p.
Allnorth Consultants Ltd. (2009). [Road design package for the Homestake Ridge access road]. March 20, 2009. As described in Hough et al. (2022), Section 2.3.
Allnorth Consultants Ltd. (2010). [Kitsault River Road review inspection report]. August 26, 2010. As described in Hough et al. (2022), Section 2.3.
Allnorth Consultants Ltd. (2012). [Homestake Ridge mainline access road feasibility study]. March 3, 2012. As described in Hough et al. (2022), Section 2.3.
ALS Canada Ltd. (2026). Kitsault Valley metallurgical testwork. Quotation KM8127, Revision 1, August 27, 2026. ALS Metallurgy, Kamloops, British Columbia.
Arseneau, G. (2019). 2019 mineral resource update for the Red Mountain Gold Project, northwestern British Columbia, Canada. NI 43-101 technical report prepared for Ascot Resources Ltd. Effective August 30, 2019; dated November 22, 2019.
Atkinson, B., and Gunson, T. (2018). Assessment report for the Homestake Ridge Property, northwestern British Columbia. British Columbia assessment report, August 24, 2018. As cited in Hough et al. (2022) and Turner and Hough (2023).
Austin, J. (2026). RFQ and scope of work for 2026/7 metallurgy test program – Contango Au/Ag Project. International Metallurgical and Environmental Inc., memorandum, August 18, 2026.
British Columbia (1996a). Forest Act. R.S.B.C. 1996, c. 157. As amended; BC Laws consolidated text. Online source.
British Columbia (1996b). Heritage Conservation Act. R.S.B.C. 1996, c. 187. As amended; BC Laws consolidated text. Online source.
British Columbia (1996c). Land Act. R.S.B.C. 1996, c. 245. As amended; BC Laws consolidated text. Online source.
British Columbia (1996d). Mineral Tenure Act. R.S.B.C. 1996, c. 292. As amended; BC Laws consolidated text. Online source.
British Columbia (1996e). Mines Act. R.S.B.C. 1996, c. 293. As amended; BC Laws consolidated text. Online source.
British Columbia (2003). Environmental Management Act. S.B.C. 2003, c. 53. As amended; BC Laws consolidated text. Online source.
British Columbia (2004). Mineral Tenure Act Regulation. B.C. Reg. 529/2004. As amended; BC Laws consolidated text. Online source.
British Columbia (2014). Water Sustainability Act. S.B.C. 2014, c. 15. As amended; BC Laws consolidated text. Online source.
| Contango Silver and Gold – Kitsault Valley Project | Page 245 of 253 |
| Technical Report Summary and updated Mineral Resource Estimate 2026 |
British Columbia (2018). Environmental Assessment Act. S.B.C. 2018, c. 51. As amended; BC Laws consolidated text. Online source.
British Columbia (2019). Reviewable Projects Regulation. B.C. Reg. 243/2019. As amended; BC Laws consolidated text. Online source.
British Columbia, Mineral Titles Branch (n.d.). Mineral titles information and guidance. Provincial guidance concerning mineral claims, leases, tenure maintenance and surface rights. Online source.
British Columbia, Ministry of Mining and Critical Minerals (2026a). Annual reporting for mines in B.C. Provincial guidance, including annual summaries of exploration activities and multi-year area-based work program updates. Updated April 23, 2026. Online source.
British Columbia, Ministry of Mining and Critical Minerals (2026b). Health, Safety and Reclamation Code for Mines in British Columbia. 2026 edition. Online source.
British Columbia, Ministry of Mining and Critical Minerals (n.d.). Mineral and coal exploration permit applications. Provincial Notice of Work and exploration-permitting guidance. Online source.
Cambria Gold Mines Inc. (n.d.). Red Mountain Gold Project. Public project webpage. Online source.
Canada (1985a). Canadian Navigable Waters Act. R.S.C. 1985, c. N-22. As amended; Justice Laws consolidated text. Online source.
Canada (1985b). Fisheries Act. R.S.C. 1985, c. F-14. As amended; Justice Laws consolidated text. Online source.
Canada (1994). Migratory Birds Convention Act, 1994. S.C. 1994, c. 22. As amended; Justice Laws consolidated text. Online source.
Canada (2002). Species at Risk Act. S.C. 2002, c. 29. As amended; Justice Laws consolidated text. Online source.
Canada (2019). Impact Assessment Act. S.C. 2019, c. 28, s. 1. As amended; Justice Laws consolidated text. Online source.
Chamois, P., Geusebroek, P., Mioska, M., and Stone, D.M.R. (2020). Technical report, updated mineral resource estimate and preliminary economic assessment on the Homestake Ridge Gold Project, Skeena Mining Division, British Columbia. MineFill Services, Inc., prepared for Auryn Resources Inc. Effective May 29, 2020. Amended and restated version dated June 24, 2020 is identified in the Project reference record. Online source.
Christie, G., Thomas, D.G., Mendoza Reyes, R., and Lipiec, I. (2013). Kitsault Molybdenum Project, British Columbia, Canada – NI 43-101 technical report on updated feasibility study. AMEC Americas Limited, prepared for Avanti Mining Inc., Project 171424. Effective February 4, 2013; dated March 22, 2013. Online source.
Contango Silver & Gold Inc. (2026a). Contango ORE completes merger with Dolly Varden Silver. News release, March 26, 2026. Online source.
Contango Silver & Gold Inc. (2026b). Contango Silver & Gold provides project updates. News release, June 23, 2026. Online source.
Contango Silver & Gold Inc. (2026c). Current report on Form 8-K. Dated March 27, 2026; earliest event March 25, 2026. Item 2.01 reports completion of the Dolly Varden acquisition on March 26, 2026. SEC accession 0001193125-26-129496. Online source.
Cowley, J. (2026). [Market-study advice on concentrate marketability and indicative commercial terms for the Kitsault Valley Project]. Unpublished technical consultation provided to Contango Silver & Gold Inc.
| Contango Silver and Gold – Kitsault Valley Project | Page 246 of 253 |
| Technical Report Summary and updated Mineral Resource Estimate 2026 |
Cui, Y., Miller, D., Schiarizza, P., and Diakow, L.J. (2017). British Columbia digital geology. British Columbia Geological Survey, Open File 2017-08. Data version 2018-04-05. Online source.
Dolly Varden Silver Corporation (2025). [Kinskuch acquisition closing disclosure]. Public corporate disclosure, May 26, 2025.
Dolly Varden Silver Corporation (2026). Audited consolidated financial statements for the years ended December 31, 2025 and 2024. Approved for issue March 12, 2026. Note 8, exploration and evaluation assets. Included as Exhibit 99.2 to Contango Silver & Gold Inc.’s March 27, 2026 Form 8-K. Online source.
Ebert, L. (2025). 2024 technical report for exploration drilling on the Dolly Varden Property. Volumes I and II. Prepared for Dolly Varden Silver Corporation, December 15, 2025. Assessment event 6079322.
Environment and Climate Change Canada (2018). Canadian climate normals 1981–2010 station data. Station record 482, Nass Camp, British Columbia. Dataset cited in Turner and Hough (2023). Online source.
ERM Consultants Canada Ltd. (2018a). [Wildlife management plan supporting the Exploration Permit MX-1-860 amendment application]. Prepared for the Dolly Varden project. As described in Turner and Hough (2023).
ERM Consultants Canada Ltd. (2018b). [Archaeological overview assessment supporting the Exploration Permit MX-1-860 amendment application]. Prepared for the Dolly Varden project. As described in Turner and Hough (2023).
ERM Consultants Canada Ltd. (n.d.). [Surface-water monitoring, wildlife management and archaeological assessment records for the Kitsault Valley Project, 2024–2025 programs]. Unpublished external consultant work identified in the Project environmental and permitting record.
Folk, P., and Makepeace, D. (2007). Report on the Homestake Ridge Project, Skeena Mining Division, British Columbia. Prepared for Bravo Venture Group Inc., April 11, 2007; amended June 3, 2008. As cited in Hough et al. (2022).
Fuse Advisors (2026). Dolly Varden Kitsault Valley Project, Golden Triangle, British Columbia – Metallurgical sample selection. Presentation, April 30, 2026.
Gagnon, J.-F., Barresi, T., Waldron, J.W.F., Nelson, J.L., Poulton, T.P., and Cordey, F. (2012). Stratigraphy of the upper Hazelton Group and the Jurassic evolution of the Stikine terrane, British Columbia. Canadian Journal of Earth Sciences, 49(9), 1027–1052. doi:10.1139/e2012-042. Online source.
Galley, A.G., Hannington, M.D., and Jonasson, I.R. (2007). Volcanogenic massive sulphide deposits. In Mineral Deposits of Canada: A Synthesis of Major Deposit-Types, District Metallogeny, the Evolution of Geological Provinces, and Exploration Methods. Geological Association of Canada, Mineral Deposits Division, Special Publication 5, pp. 141–161.
Garrow, T. (2011). Technical report, geology and mineral exploration of the Dolly Varden Property, British Columbia, Canada. NI 43-101 technical report prepared for Dolly Varden Silver Corporation, September 5, 2011, 108 p. As cited in Turner and Nicholls (2019) and Turner and Hough (2023).
Golder Associates Ltd. (2012a). [Geotechnical assessment of the proposed new road extension for the Homestake Ridge access road]. January 24, 2012. As described in Hough et al. (2022), Section 2.3.
Golder Associates Ltd. (2012b). [Preliminary geotechnical assessment of proposed mine infrastructure sites for the Homestake Ridge Project]. February 27, 2012. As described in Hough et al. (2022), Section 2.3.
Goliath Resources Limited (2026). Goliath Resources acquires 100% ownership of the Golddigger Property hosting the high-grade Surebet gold discovery and buys down 1% of the NSR, Golden Triangle, B.C. News release, March 10, 2026. Online source.
| Contango Silver and Gold – Kitsault Valley Project | Page 247 of 253 |
| Technical Report Summary and updated Mineral Resource Estimate 2026 |
Goliath Resources Limited (n.d.). Golddigger. Public project webpage. Online source.
Government of Yukon (n.d.). GeoYukon. Online geospatial mapping application. Source of terrane mapping reproduced in the geological-setting chapter.
Hall, A. (2026a). PJ-5599 – Dolly Varden – Wolf & Kitsol metallurgical testwork. Blue Coast Research Ltd., Project PJ-5599, Version 1.0, final report, April 29, 2026.
Hall, A. (2026b). Kitsault Au/Ag Project. Blue Coast Research Ltd., project proposal PR-2026-092-R1, August 27, 2026.
Higgs, A.A. (2015). Amended 2015 technical report for the Dolly Varden Property, Skeena Mining Division, British Columbia. NI 43-101 technical report prepared for Dolly Varden Silver Corporation. Effective May 1, 2015.
Higgs, A.A., and Giroux, G. (2015). 2015 technical report for the Dolly Varden Property, Skeena Mining Division, British Columbia. NI 43-101 technical report prepared for Dolly Varden Silver Corporation. Effective September 30, 2015.
Hough, R., Stone, D.M.R., and Turner, A.J. (2022). Technical report and updated mineral resource estimate for the Homestake Ridge Gold Project, Skeena Mining Division, British Columbia. MineFill Services, Inc., and APEX Geoscience Ltd., prepared for Dolly Varden Silver Corp. Effective January 20, 2022; amended December 13, 2022.
IEC Consultants Ltd. (1981). [Water-quality monitoring of the Kitsault River and Torbrit mine drainage]. As described in Higgs and Giroux (2015).
International Copper Study Group (n.d.). [Global copper mine-production and concentrate-smelting-capacity statistics]. Statistical source identified in the Market Studies chapter.
Knight Piésold Consulting (2011a). [Preliminary power supply assessment for the Homestake Ridge Project]. April 23, 2011. As described in Hough et al. (2022), Section 2.3.
Knight Piésold Consulting (2011b). [Conceptual cost estimate for tailings disposal, Homestake Ridge Project]. May 13, 2011. As described in Hough et al. (2022), Section 2.3.
Knight Piésold Consulting (2011c). [Plant site and tailings storage facility alternatives assessment, Homestake Ridge Project]. May 19, 2011. As described in Hough et al. (2022), Section 2.3.
Knight Piésold Consulting (2011d). Homestake Ridge Project – Integration of a hydroelectric facility within the mine development concept #1. June 1, 2011. As cited in Hough et al. (2022).
Lavigne, B. (2025). 2023 technical report for the Homestake Ridge Property. Volumes I and II. TerraLogic Exploration Inc., prepared for Dolly Varden Silver Corporation, January 13, 2025. Assessment event 6041345.
Leigh, O.E., and Thompson, I.S. (1981). Report on the property of Torbrit Silver Resources Ltd., Kitsault River area, B.C. Derry, Michener & Booth and Wahl, Toronto. As cited in Higgs and Giroux (2015) and Turner and Hough (2023).
Leigh, O.E., and Thompson, I.S. (1983). Report on the property of Dolly Varden Minerals Inc., Kitsault River area, B.C. Derry, Michener & Booth and Wahl, Toronto. As cited in Higgs and Giroux (2015).
Lewis, P.D., Toma, A., and Tosdal, R.M. (compilers) (2001). Metallogenesis of the Iskut River area, northwestern British Columbia. Mineral Deposit Research Unit, University of British Columbia, Special Publication 1, June 2001. Includes P.D. Lewis, Geological maps, Chapter 6, p. 77 ff. Online source.
| Contango Silver and Gold – Kitsault Valley Project | Page 248 of 253 |
| Technical Report Summary and updated Mineral Resource Estimate 2026 |
Macdonald, A.J., Lewis, P.D., Thompson, J.F.H., Nadaraju, G., Bartsch, R., Bridge, D.J., Rhys, D.A., Roth, T., Kaip, A., Godwin, C.I., and Sinclair, A.J. (1996). Metallogeny of an Early to Middle Jurassic arc, Iskut River area, northwestern British Columbia. Economic Geology, 91(6), 1098–1114. doi:10.2113/gsecongeo.91.6.1098. Online source.
Macdonald, R.W.J., and Rennie, D.W. (2016). Technical report on the Homestake Ridge Project, an updated mineral resource, Kitsault, British Columbia. NI 43-101 technical report readdressed to Auryn Resources Inc., November 15, 2016. As cited in Hough et al. (2022) and Turner and Hough (2023).
Mann (1974). [Historical mineral inventory and assay verification for the Dolly Varden property]. As cited in Higgs and Giroux (2015).
McCuaig, M., and Sebert, C. (2017). 2016 technical report for the Dolly Varden Property, Skeena Mining Division. Prepared for Dolly Varden Silver Corporation. British Columbia Geological Survey, Assessment Report 36934, 1,123 p.
Middleditch, D.J. (2019). Metallurgical testwork report. Blue Coast Research Ltd., prepared for Dolly Varden Silver Corporation, 78 p. Dolly Varden and Torbrit test program; as cited in Turner and Hough (2023).
Miller, E.A., Kennedy, L.A., and van Straaten, B.I. (2020). Geology of the Kinskuch Lake area and Big Bulk porphyry prospect, northwestern British Columbia: Syndepositional faulting and basin formation during the Rhaetian (latest Triassic) transition from the Stuhini to the Hazelton Group. In Geological Fieldwork 2019. British Columbia Ministry of Energy, Mines and Petroleum Resources, British Columbia Geological Survey Paper 2020-01, pp. 77–99. Online source.
Miller (2023). Emplacement environment and structural modification of the Big Bulk Cu-Au porphyry system, northwestern British Columbia. Thesis, University of British Columbia, Open Collections item 1.0438619. Online source.
Mitchell, M.A. (1976). Consolidated Silver Butte Mines Ltd., Moose–Robin–Victory Group (MRV Group), Skeena Mining Division. British Columbia Assessment Report 6112A, 25 p. Online source.
Monger, J.W.H., Price, R.A., and Tempelman-Kluit, D.J. (1982). Tectonic accretion and the origin of the two major metamorphic and plutonic welts in the Canadian Cordillera. Geology, 10(2), 70–75. Online source.
Mortensen, E. (1960). Torbrit Mine, Alice Arm, B.C. Geology 409, Report 4. British Columbia Property File 600401. Online source.
New Moly LLC (n.d.). Kitsault Project. Public project webpage, as identified in the adjacent-properties source record. Online source.
One-eighty Consulting Group (2018). Homestake Ridge Mineral Exploration Project management and monitoring plan for grizzly bear, mountain goat, moose, coastal northern goshawk, and marbled murrelet. Prepared for Auryn Resources Inc., June 27, 2018. As cited in Hough et al. (2022).
pHase Geochemistry Inc. (2012). Geochemical characterization of split samples from the waste rock field barrel program, Homestake Ridge Project. Final report, October 4, 2012. As cited in Hough et al. (2022).
Pojar, J., Klinka, K., and Demarchi, D.A. (1991). Coastal western hemlock zone. In Ecosystems of British Columbia. British Columbia Ministry of Forests, Special Report Series 6, pp. 95–111. Online source.
Rennie, D. (2011). Technical report on the Homestake Ridge Project, Kitsault, British Columbia, Canada. NI 43-101 technical report prepared for Bravo Gold Corp., May 20, 2011, 145 p. As cited in Hough et al. (2022).
Rennie, D., Scott, K., and McDonough, B. (2010). Technical report on the Homestake Ridge Project, Stewart, British Columbia, Canada. NI 43-101 technical report, June 28, 2010. As cited in Hough et al. (2022).
| Contango Silver and Gold – Kitsault Valley Project | Page 249 of 253 |
| Technical Report Summary and updated Mineral Resource Estimate 2026 |
Ross, D., and Chamois, P. (2017). Technical report on the Homestake Ridge Project, Skeena Mining Division, northwestern British Columbia. Roscoe Postle Associates Inc., prepared for Auryn Resources Inc. Effective September 1, 2017; dated September 29, 2017; amended October 23, 2017.
Sangra, H., and Lucy, E. (2026). Metallurgical test program in support of Kitsault Project. Base Metallurgical Laboratories Ltd., revised quotation BL2424 (R1), August 30, 2026.
Sebert, C. (2013). 2012 geological mapping, geophysical surveying, and geological interpretation work, Dolly Varden Silver Property, northwest British Columbia. Cambria Geosciences Inc. As cited in Turner and Hough (2023).
SGS Minerals Services (2011). An investigation into environmental characterisation of Homestake Ridge tailings. Prepared for Bravo Venture Group Inc., Project 12198-001, final report, March 8, 2011. As cited in Hough et al. (2022).
Shouldice, T.W., and Coombs, H. (2016). Process development studies, Homestake Ridge gold-silver deposit. Base Metallurgical Laboratories Ltd., prepared for Auryn Resources Inc., 19 p. As cited in Hough et al. (2022).
Skerl, A.C. (1964). Dolly Varden report. May 25, 1964. British Columbia Property File 825696, Rimfire collection. Online source.
Thompson, I., and Pearson, W. (1981). Ore reserves of the North Star and Wolf deposits held by Dolly Varden Minerals Inc., Kitsault Valley, British Columbia. Volume 1. British Columbia Assessment Report 10042A. Online source.
Triton Environmental Consultants Ltd. (2012a). Homestake Ridge Project surface water quality initial site visit report. Prepared for Allnorth Consultants Ltd., February 10, 2012. As cited in Hough et al. (2022).
Triton Environmental Consultants Ltd. (2012b). Homestake Ridge Project proposed road stream assessment report. Prepared for Allnorth Consultants Ltd., January 20, 2012. As cited in Hough et al. (2022).
Turner, A.J. (2026). Consent of Andrew Turner. Exhibit 23.11 to the Contango Silver & Gold Inc. registration statement, filed June 22, 2026. Online source.
Turner, A.J., and Hough, R. (2023). Technical report on the combined Kitsault Valley Project, British Columbia, Canada. APEX Geoscience Ltd., prepared for Dolly Varden Silver Corporation. Effective September 28, 2022; report text dated February 23, 2023; signing date March 23, 2023.
Turner, A.J., and Nicholls, S.J. (2019). Technical report and mineral resource update for the Dolly Varden Property, British Columbia, Canada. APEX Geoscience Ltd., prepared for Dolly Varden Silver Corp. Effective May 8, 2019; revised December 12, 2022.
U.S. Securities and Exchange Commission (2026a). Regulation S-K, Subpart 1300 – Disclosure by registrants engaged in mining operations. 17 C.F.R. §§ 229.1300–229.1305. Electronic Code of Federal Regulations. Online source.
U.S. Securities and Exchange Commission (2026b). Regulation S-K, Item 601(b)(96) – Technical report summary. 17 C.F.R. § 229.601(b)(96). Electronic Code of Federal Regulations. Online source.
| Contango Silver and Gold – Kitsault Valley Project | Page 250 of 253 |
| Technical Report Summary and updated Mineral Resource Estimate 2026 |
| 25 | RELIANCE ON REGISTRANT |
| 25.1 | Registrant and Scope |
Contango Silver & Gold Inc. (Contango or the Company) is the registrant for which this Technical Report Summary (TRS) has been prepared for the Kitsault Valley Project, British Columbia, Canada. Dave Larimer, CPG, Vice President Exploration of Contango, is the Qualified Person (QP) responsible for this report and is an employee of the Company.
The Company provided the drill hole database, geological and exploration records, historical reports and public disclosures, and internal files concerning land status, permitting and environmental matters. These sources support information throughout the TRS. This chapter identifies the specific Company information relied upon under 17 CFR 229.1302(f), and documents the use of historical and technical sources for which the QP retains responsibility for the conclusions adopted in this report.
| 25.2 | Land Status Permitting and Environmental Information |
The QP relied on the Company’s internal records for the matters summarized in Table 25-1. The reliance applies to the identified portions of Chapters 3 and 17 and to their corresponding summaries in the Executive Summary and Interpretations and Conclusions. It also informs the consideration of property rights, environmental obligations and permitting in the assessment of reasonable prospects for economic extraction in Chapter 11.
Table 25-1. Company information relied upon for land status, permitting and environmental matters.
| Information and report location | Company source | Extent and reason for reliance |
Land status and mineral tenure Chapter 3 |
Internal land-status and tenure files. | Relied upon for the descriptions of ownership and legal tenure status, and associated rights and obligations identified in Chapter 3. Reliance is reasonable because the Company administers its Project interests through its subsidiaries and maintains the records supporting those interests. |
Permitting and governmental requirements Chapters 3 and 17 |
Internal permitting files and status information. | Relied upon reported permit status, conditions and applicable governmental requirements outside the QP’s expertise. The Company manages Project permitting and maintains the relevant records, providing a direct basis for the status information used in the report. |
Environmental matters Chapter 17 |
Internal environmental files and supporting reports. | Relied upon the descriptions of environmental conditions, obligations and management requirements outside the QP’s expertise. The Company maintains the Project environmental information and is responsible for managing the associated obligations, providing the basis for this reliance. |
| Contango Silver and Gold – Kitsault Valley Project | Page 251 of 253 |
| Technical Report Summary and updated Mineral Resource Estimate 2026 |
| 25.3 | Historical Reports and Public Disclosures |
The TRS draws on previously published technical reports and press releases, together with historical records provided through the Company, including information originating with Dolly Varden Silver Corporation and other former owners, operators and technical consultants. The originating issuer, report author and responsible QP are identified in source citations where applicable. This information supports the property and access descriptions, history, geological setting, exploration, sampling and verification discussions, resource comparisons and other chapters in which it is cited.
A principal historical source is the Technical Report on the Combined Kitsault Valley Project, British Columbia, Canada, prepared for Dolly Varden Silver Corporation by APEX Geoscience Ltd., authored by Andrew J. Turner and Rachelle Hough, signed March 23, 2023, with an effective date of September 28, 2022. That report and its cited predecessor reports provide historical context and the previously reported resource information discussed in Chapters 5 and 11. The underlying dates and methods of individual prior estimates are identified in the applicable resource discussion.
Historical sources are used within the scope of the information they document. Previously reported production, exploration results and resource estimates are distinguished from the current mineral resource statement. The QP’s assessment of historical data incorporated into the current estimate is described in Chapters 9 and 11. South Reef is carried forward on the basis expressly described in Chapter 11. Attribution to a prior author or QP identifies the source of the work and does not assign that person responsibility for this TRS. Possession of a historical report in Company files does not, by itself, bring its technical conclusions within the registrant-reliance provision.
| 25.4 | Company Technical Data and QP Review |
The Company supplied the drilling and assay database and supporting geological records used for the mineral resource estimate. The QP reviewed and verified the accepted data and considers them suitable for the geological interpretation and estimation purposes described in Chapters 9 and 11. The nature and extent of verification, together with source-specific limitations, are described in those chapters. Company custody and provision of the database do not replace the QP’s responsibility for its suitability and use in the estimate.
Sims Resources assisted with geological modeling and implementation of the Leapfrog resource models under the QP’s supervision. The QP reviewed and accepted the model inputs, estimation parameters, validation and classification and takes responsibility for the estimates presented in Chapter 11. This modeling assistance is separate from the registrant reliance in Table 25-1.
| 25.5 | Metallurgical Information Market Studies and Specialist Review |
The Company supplied the metallurgical reports and supporting information used by the QP to compile and review Chapter 10. Jeff Austin of International Metallurgical and Environmental has been asked to review the metallurgical chapter and provide specialist input on its technical content and recommendations for further work. His requested role is that of a consulting metallurgical specialist and technical reviewer.
The QP retains responsibility for the metallurgical interpretations adopted in Chapter 10, their application to the resource assumptions in Chapter 11, and the related recommendations in Chapter 24. Specialist assistance does not transfer those technical responsibilities through the registrant-reliance provision. Original testwork reports remain identified by their laboratory or author, irrespective of their provision through Company files.
| Contango Silver and Gold – Kitsault Valley Project | Page 252 of 253 |
| Technical Report Summary and updated Mineral Resource Estimate 2026 |
The Company retained Jim Cowley as a consulting specialist to provide advice on market studies for this report. The QP reviewed and adopted his input in Chapter 16 and retains responsibility for the market-study information, interpretations and conclusions adopted in that chapter, together with any related assumptions and recommendations adopted in Chapter 24. Mr. Cowley’s consulting contribution does not transfer the QP’s responsibility for the technical work and conclusions adopted in the TRS.
| 25.6 | Extent of Reliance |
The reliance described in this chapter is confined to the identified Company information and its use in the report. The QP remains responsible for the technical interpretations, estimation decisions and resource conclusions adopted in the TRS, subject to the specific reliance permitted by 17 CFR 229.1302(f). The Project’s mineral resource effective date is September 11, 2026. Source-specific conditions, limitations and uncertainties are addressed in the relevant chapters; reliance on Company permitting or environmental information does not establish that future mine-development approvals have been obtained.
| Contango Silver and Gold – Kitsault Valley Project | Page 253 of 253 |
| Technical Report Summary and updated Mineral Resource Estimate 2026 |