
Exhibit 99.3
Earnings Presentation 1H2026
DISCLAIMER – FORWARD-LOOKING STATEMENT AND NON-GAAP FINANCIAL INFORMATION Some of the statements contained in this press release include or may include "forward-looking statements" within the meaning of Section 27A of the Securities Act of 1933, as amended, and Section 21E of the Exchange Act of 1934, as amended, which are intended to be covered by the safe harbors created by those laws. These forward-looking statements include, but are not limited to, statements regarding the expectations, hopes, beliefs, intentions or strategies regarding the future. The forward-looking statements contained in this press release are based on current expectations and beliefs concerning future developments and their potential effects on Nuvini. There can be no assurance that future developments affecting Nuvini will be those that we have anticipated. Where a forward-looking statement expresses or implies an expectation or belief as to future events or results, such expectation or belief is expressed in good faith and believed to have a reasonable basis. All statements other than statements of historical fact may be forward-looking statements. The words "anticipate," "believe," "estimate," "expect," "intend," "forecast," "outlook," "aim," "target," "will," "could," "should," "may," "likely," "plan," "probably" or similar words may identify forward-looking statements, but the absence of these words does not mean that a statement is not forward-looking. Forward-looking statements contained in this press release include, but are not limited to, statements about the ability of Nuvini to: realize the benefits expected from this strategic partnership; achieve projections and anticipate uncertainties relating to the business, operations and financial performance of Nuvini, including (i) expectations with respect to financial and business performance, including financial projections and business metrics and any underlying assumptions, (ii) expectations regarding market size, future acquisitions, partnerships or other relationships with third parties, (iii) expectations on Nuvini's proprietary technology and related intellectual property rights, (iv) future capital requirements and sources and uses of cash, including the ability to obtain additional capital in the future; (v) Nuvini's ability to enhance future operating and financial results, comply with applicable laws and regulations, stay abreast of modified or new laws and regulations applying to its business, including privacy regulation, anticipate rapid technological changes, and effectively respond to general economic and business conditions; and (vi) Nuvini's ability to implement its cost saving initiatives and achieve the projected cost reductions. While forward-looking statements reflect Nuvini's good faith beliefs, they are not guarantees of future performance. Nuvini disclaims any obligation to publicly update or revise any forward-looking statement to reflect changes in underlying assumptions or factors, new information, data or methods, future events or other changes after the date of this press release, except as required by applicable law. For a further discussion of these and other factors that could cause Nuvini's future results, performance or transactions to differ significantly from those expressed in any forward-looking statement, please see the section "Risk Factors" of the Registration Statement in Form F-4 filed by Nuvini with the U.S. Securities and Exchange Commission on September 6, 2023 under number 333-272688. You should not place undue reliance on any forward-looking statements, which are based only on information currently available to Nuvini. Risk factors relevant to this period include, without limitation: the Company's ability to continue as a going concern; the outcome of the Amiens litigation and related acceleration notice; the availability and terms of additional financing; the Company's ability to restructure deferred and contingent acquisition consideration and investor loans; and the MK Solutions dispute. See the Company's Annual Report on Form 20-F for the fiscal year ended December 31, 2025 and subsequent Reports on Form 6-K. NVNI provides certain non-IFRS measures as additional information relating to its operating results as a complement to results provided in accordance with IFRS. The non-IFRS financial information presented herein should be considered together with, and not as a substitute for or superior to, the financial information presented in accordance with IFRS. There are significant limitations associated with the use of non-IFRS financial measures. Further, these measures may differ from the non-IFRS information, even where similarly titled, used by other companies and therefore should not be used to compare NVNI's performance to that of other companies. 2

01. THE CEO OVERVIEW 02. OPERATIONAL SUMMARY 03. FINANCIAL SUMMARY TABLE OF CONTENTS 3

01. THE CEO OVERVIEW 4

THE CEO OVERVIEW Pierre Schurmann Founder and Chief Executive Officer Commenting on the results for the six months ended June 30, 2026: "The first half shows what disciplined operations look like inside the portfolio: margins expanded, overhead came down by a quarter, and the businesses generated R$15 million in operating cash. Our task now is to bring the capital structure in line with the performance of the operating businesses. Deferred acquisition consideration and legacy financing continue to absorb capital, and we are pursuing a comprehensive restructuring of those obligations." Source: Nuvini Press Release – First Half 2026 Results. 5
02. FIRST HALF 2026 OPERATIONAL SUMMARY 6
OPERATIONAL OVERVIEW Rodrigo Natale Chief Financial Officer Operating performance in the first half of 2026: Margin Expansion Gross margin expanded 500 basis points to 68.1%, with cost of services provided down 14.1% to R$31.1 million. Cost Discipline General and administrative expenses were reduced 24.6% to R$31.6 million and total personnel costs were reduced 18.2% to R$43.6 million. Cash Generation Net cash from operating activities of R$15.1 million in 1H26, reversing the R$2.1 million cash outflow recorded in 1H25. Cost of services variation calculated from Form 6-K figures. Total personnel costs comprise payroll and salaries, benefits and social charges, on a consolidated basis after eliminations — see page 9. See "Disclaimer – Forward-Looking Statement and Non-GAAP Financial Information". 7
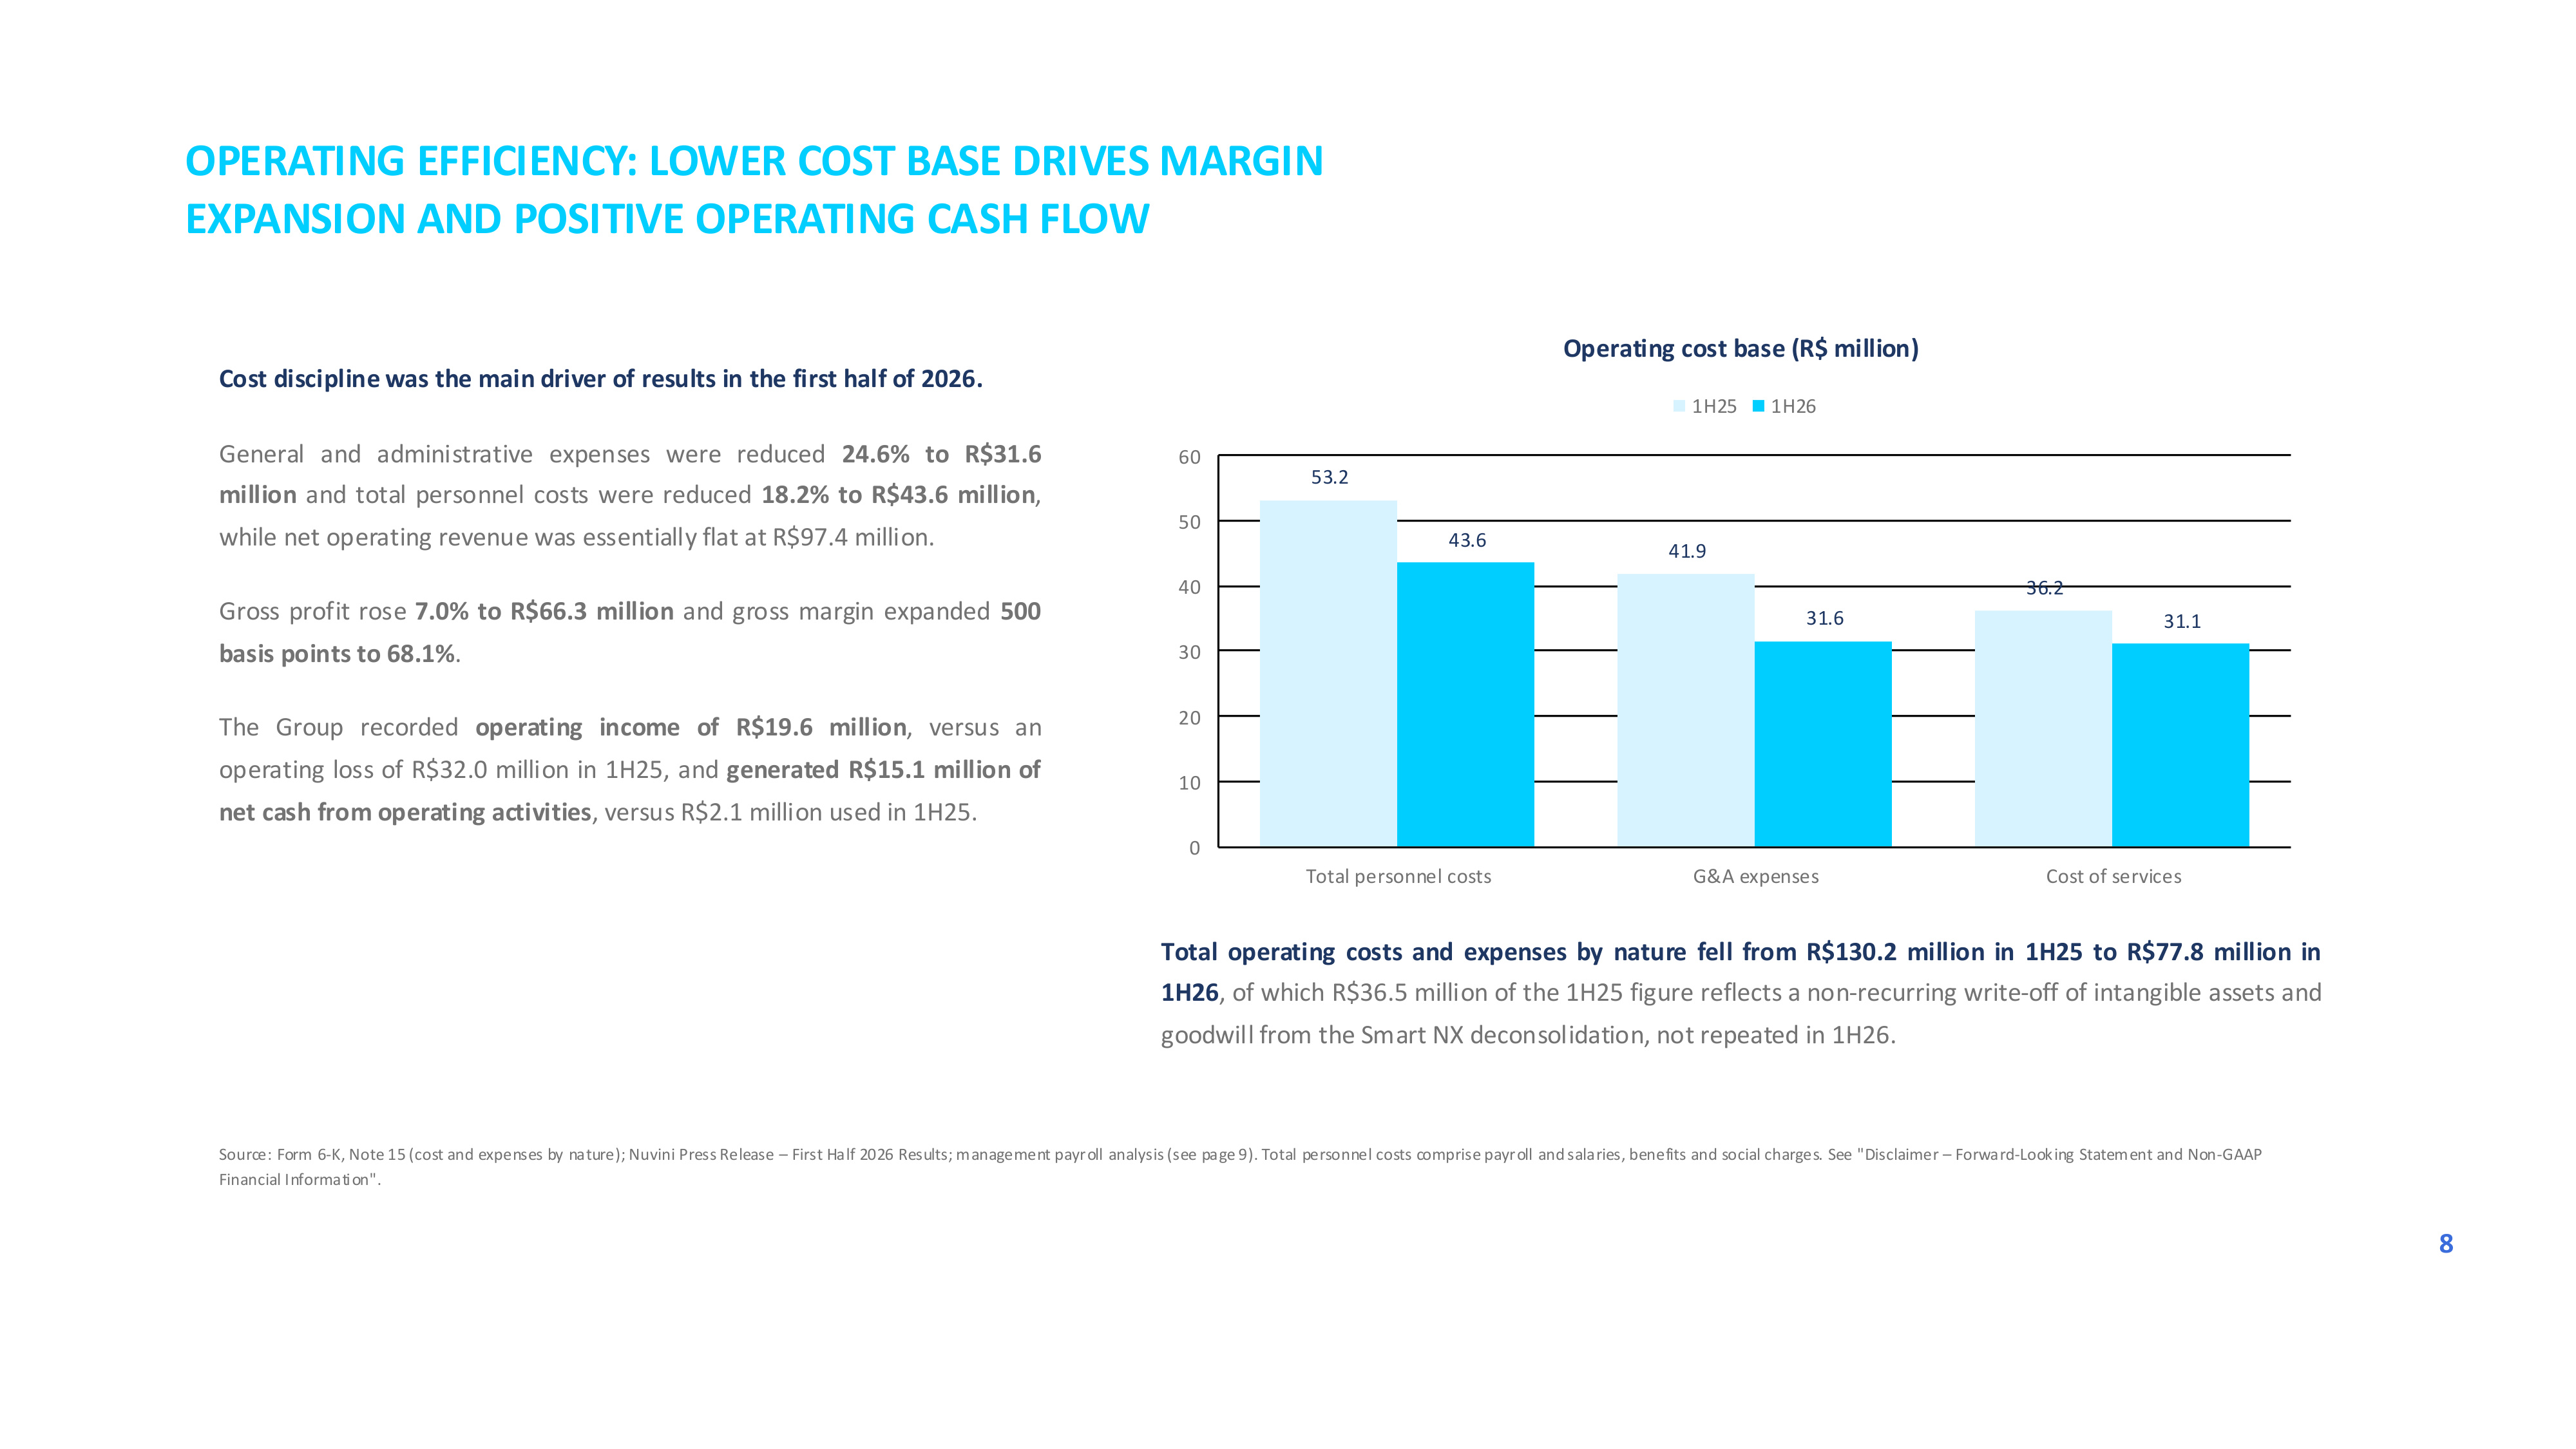
OPERATING EFFICIENCY: LOWER COST BASE DRIVES MARGIN EXPANSION AND POSITIVE OPERATING CASH FLOW Cost discipline was the main driver of results in the first half of 2026. General and administrative expenses were reduced 24.6% to R$31.6 million and total personnel costs were reduced 18.2% to R$43.6 million, while net operating revenue was essentially flat at R$97.4 million. Gross profit rose 7.0% to R$66.3 million and gross margin expanded 500 basis points to 68.1%. The Group recorded operating income of R$19.6 million, versus an operating loss of R$32.0 million in 1H25, and generated R$15.1 million of net cash from operating activities, versus R$2.1 million used in 1H25. 53.2 41.9 36.2 43.6 31.6 31.1 0 10 20 30 40 50 60 Total personnel costs G&A expenses Cost of services Operating cost base (R$ million) 1H25 1H26 Total operating costs and expenses by nature fell from R$130.2 million in 1H25 to R$77.8 million in 1H26, of which R$36.5 million of the 1H25 figure reflects a non-recurring write-off of intangible assets and goodwill from the Smart NX deconsolidation, not repeated in 1H26. Source: Form 6-K, Note 15 (cost and expenses by nature); Nuvini Press Release – First Half 2026 Results; management payroll analysis (see page 9). Total personnel costs comprise payroll and salaries, benefits and social charges. See "Disclaimer – Forward-Looking Statement and Non-GAAP Financial Information". 8
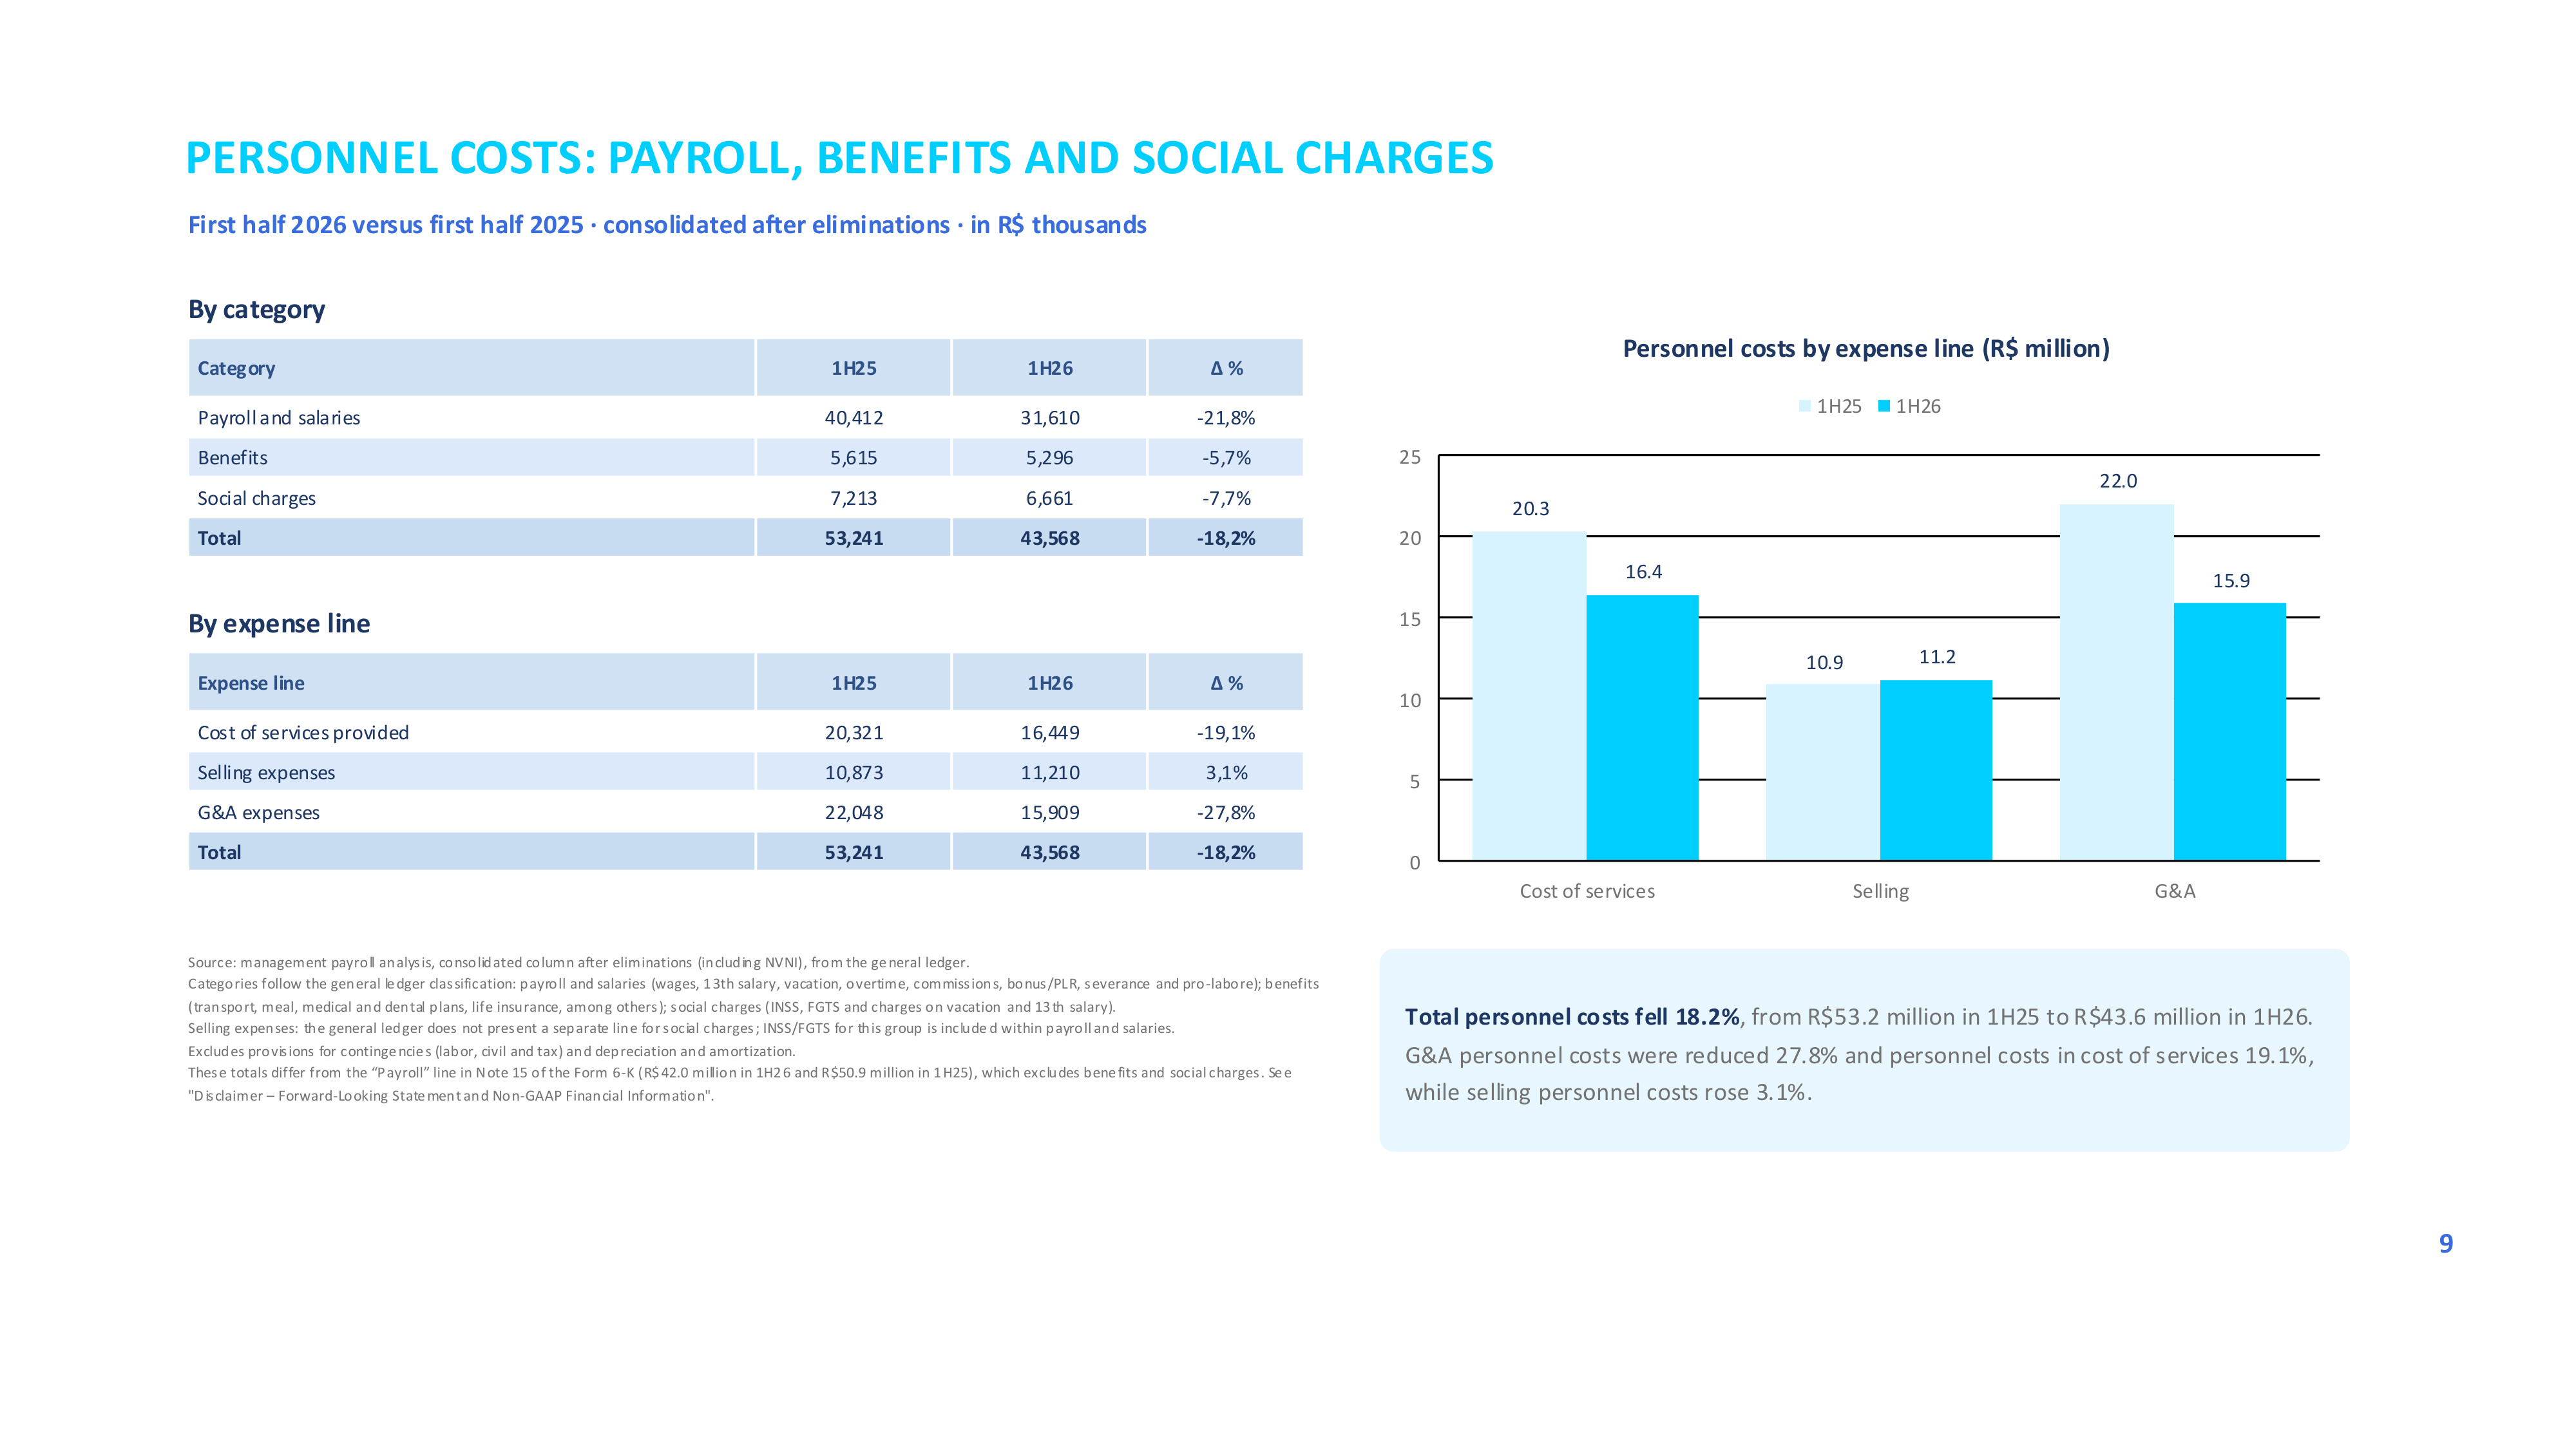
PERSONNEL COSTS: PAYROLL, BENEFITS AND SOCIAL CHARGES First half 2026 versus first half 2025 · consolidated after eliminations · in R$ thousands By category Category 1H25 1H26 Δ % Payroll and salaries 40,412 31,610 -21,8% Benefits 5,615 5,296 -5,7% Social charges 7,213 6,661 -7,7% Total 53,241 43,568 -18,2% By expense line Expense line 1H25 1H26 Δ % Cost of services provided 20,321 16,449 -19,1% Selling expenses 10,873 11,210 3,1% G&A expenses 22,048 15,909 -27,8% Total 53,241 43,568 -18,2% 20.3 10.9 22.0 16.4 11.2 15.9 0 5 10 15 20 25 Cost of services Selling G&A Personnel costs by expense line (R$ million) 1H25 1H26 Total personnel costs fell 18.2%, from R$53.2 million in 1H25 to R$43.6 million in 1H26. G&A personnel costs were reduced 27.8% and personnel costs in cost of services 19.1%, while selling personnel costs rose 3.1%. Source: management payroll analysis, consolidated column after eliminations (including NVNI), from the general ledger. Categories follow the general ledger classification: payroll and salaries (wages, 13th salary, vacation, overtime, commissions, bonus/PLR, severance and pro-labore); benefits (transport, meal, medical and dental plans, life insurance, among others); social charges (INSS, FGTS and charges on vacation and 13th salary). Selling expenses: the general ledger does not present a separate line for social charges; INSS/FGTS for this group is include d within payroll and salaries. Excludes provisions for contingencies (labor, civil and tax) and depreciation and amortization. These totals differ from the "Payroll" line in Note 15 of the Form 6-K (R$42.0 million in 1H26 and R$50.9 million in 1H25), which excludes benefits and social charges. See "Disclaimer – Forward-Looking Statement and Non-GAAP Financial Information". 9
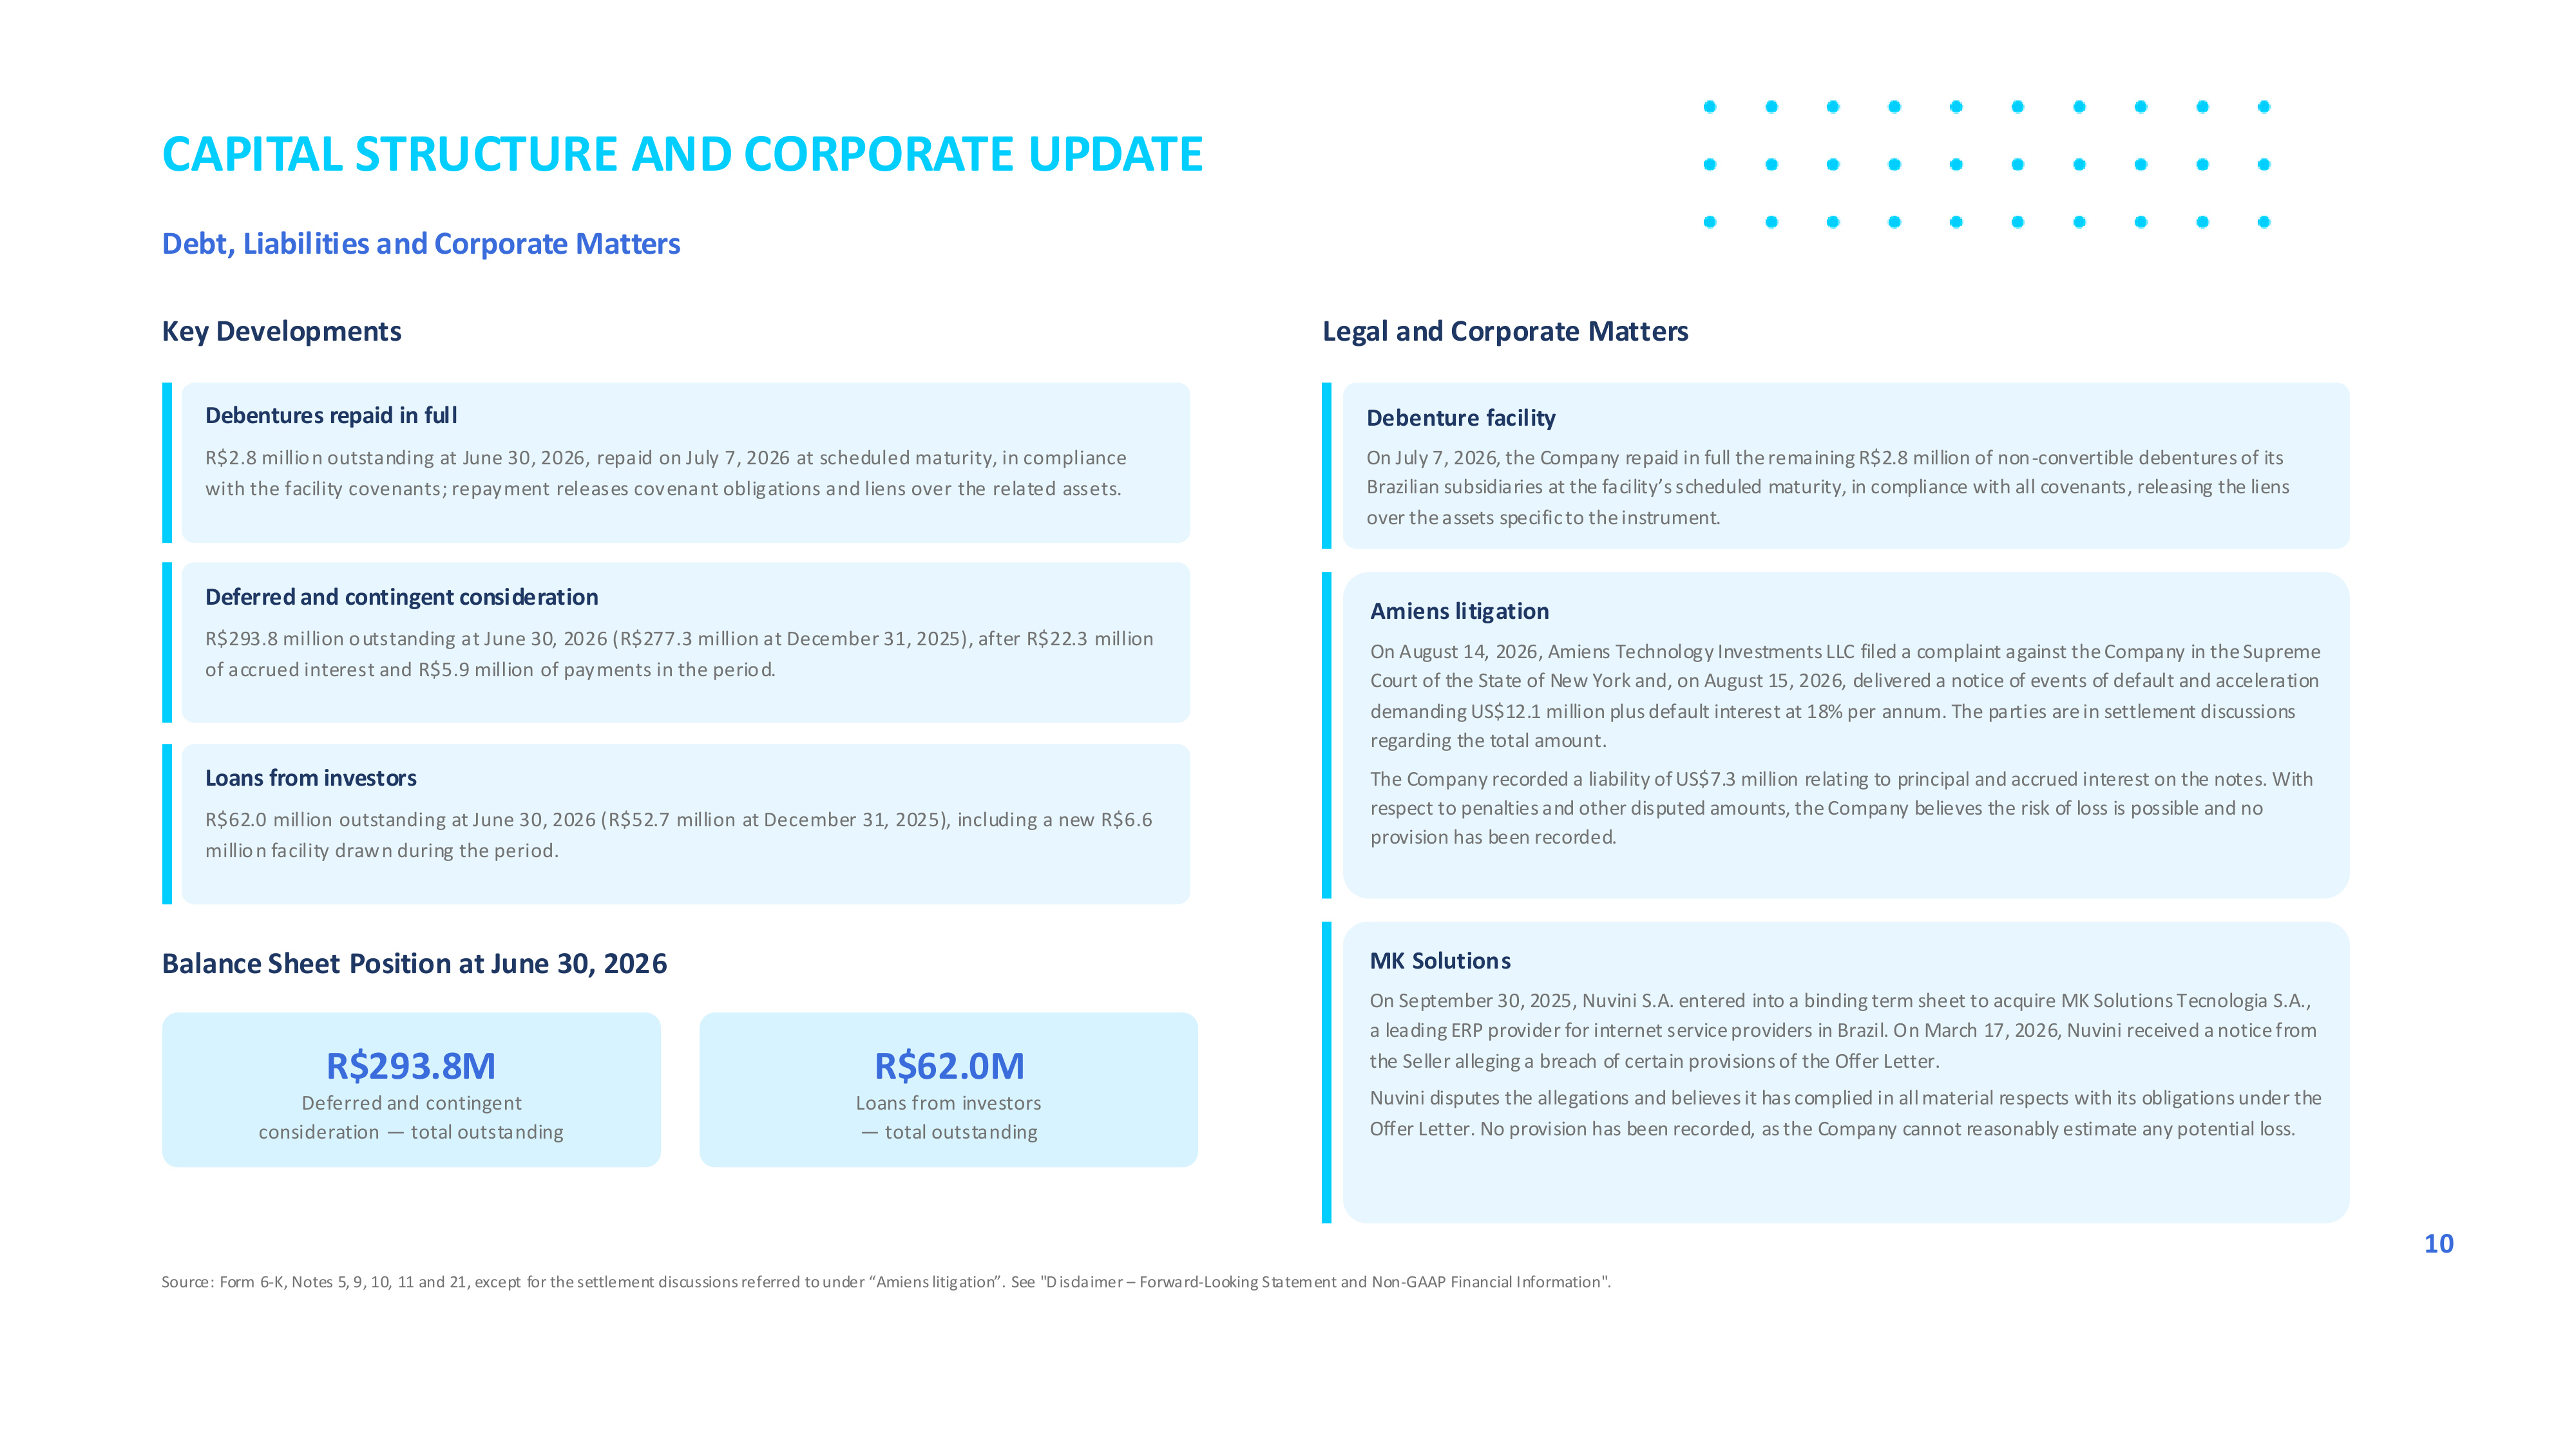
CAPITAL STRUCTURE AND CORPORATE UPDATE Debt, Liabilities and Corporate Matters Key Developments Debentures repaid in full R$2.8 million outstanding at June 30, 2026, repaid on July 7, 2026 at scheduled maturity, in compliance with the facility covenants; repayment releases covenant obligations and liens over the related assets. Deferred and contingent consideration R$293.8 million outstanding at June 30, 2026 (R$277.3 million at December 31, 2025), after R$22.3 million of accrued interest and R$5.9 million of payments in the period. Loans from investors R$62.0 million outstanding at June 30, 2026 (R$52.7 million at December 31, 2025), including a new R$6.6 million facility drawn during the period. Balance Sheet Position at June 30, 2026 R$293.8M Deferred and contingent consideration — total outstanding R$62.0M Loans from investors — total outstanding Legal and Corporate Matters Debenture facility On July 7, 2026, the Company repaid in full the remaining R$2.8 million of non-convertible debentures of its Brazilian subsidiaries at the facility's scheduled maturity, in compliance with all covenants, releasing the liens over the assets specific to the instrument. Amiens litigation On August 14, 2026, Amiens Technology Investments LLC filed a complaint against the Company in the Supreme Court of the State of New York and, on August 15, 2026, delivered a notice of events of default and acceleration demanding US$12.1 million plus default interest at 18% per annum. The parties are in settlement discussions regarding the total amount. The Company recorded a liability of US$7.3 million relating to principal and accrued interest on the notes. With respect to penalties and other disputed amounts, the Company believes the risk of loss is possible and no provision has been recorded. MK Solutions On September 30, 2025, Nuvini S.A. entered into a binding term sheet to acquire MK Solutions Tecnologia S.A., a leading ERP provider for internet service providers in Brazil. On March 17, 2026, Nuvini received a notice from the Seller alleging a breach of certain provisions of the Offer Letter. Nuvini disputes the allegations and believes it has complied in all material respects with its obligations under the Offer Letter. No provision has been recorded, as the Company cannot reasonably estimate any potential loss. Source: Form 6-K, Notes 5, 9, 10, 11 and 21, except for the settlement discussions referred to under "Amiens litigation". See "Disclaimer – Forward-Looking Statement and Non-GAAP Financial Information". 10
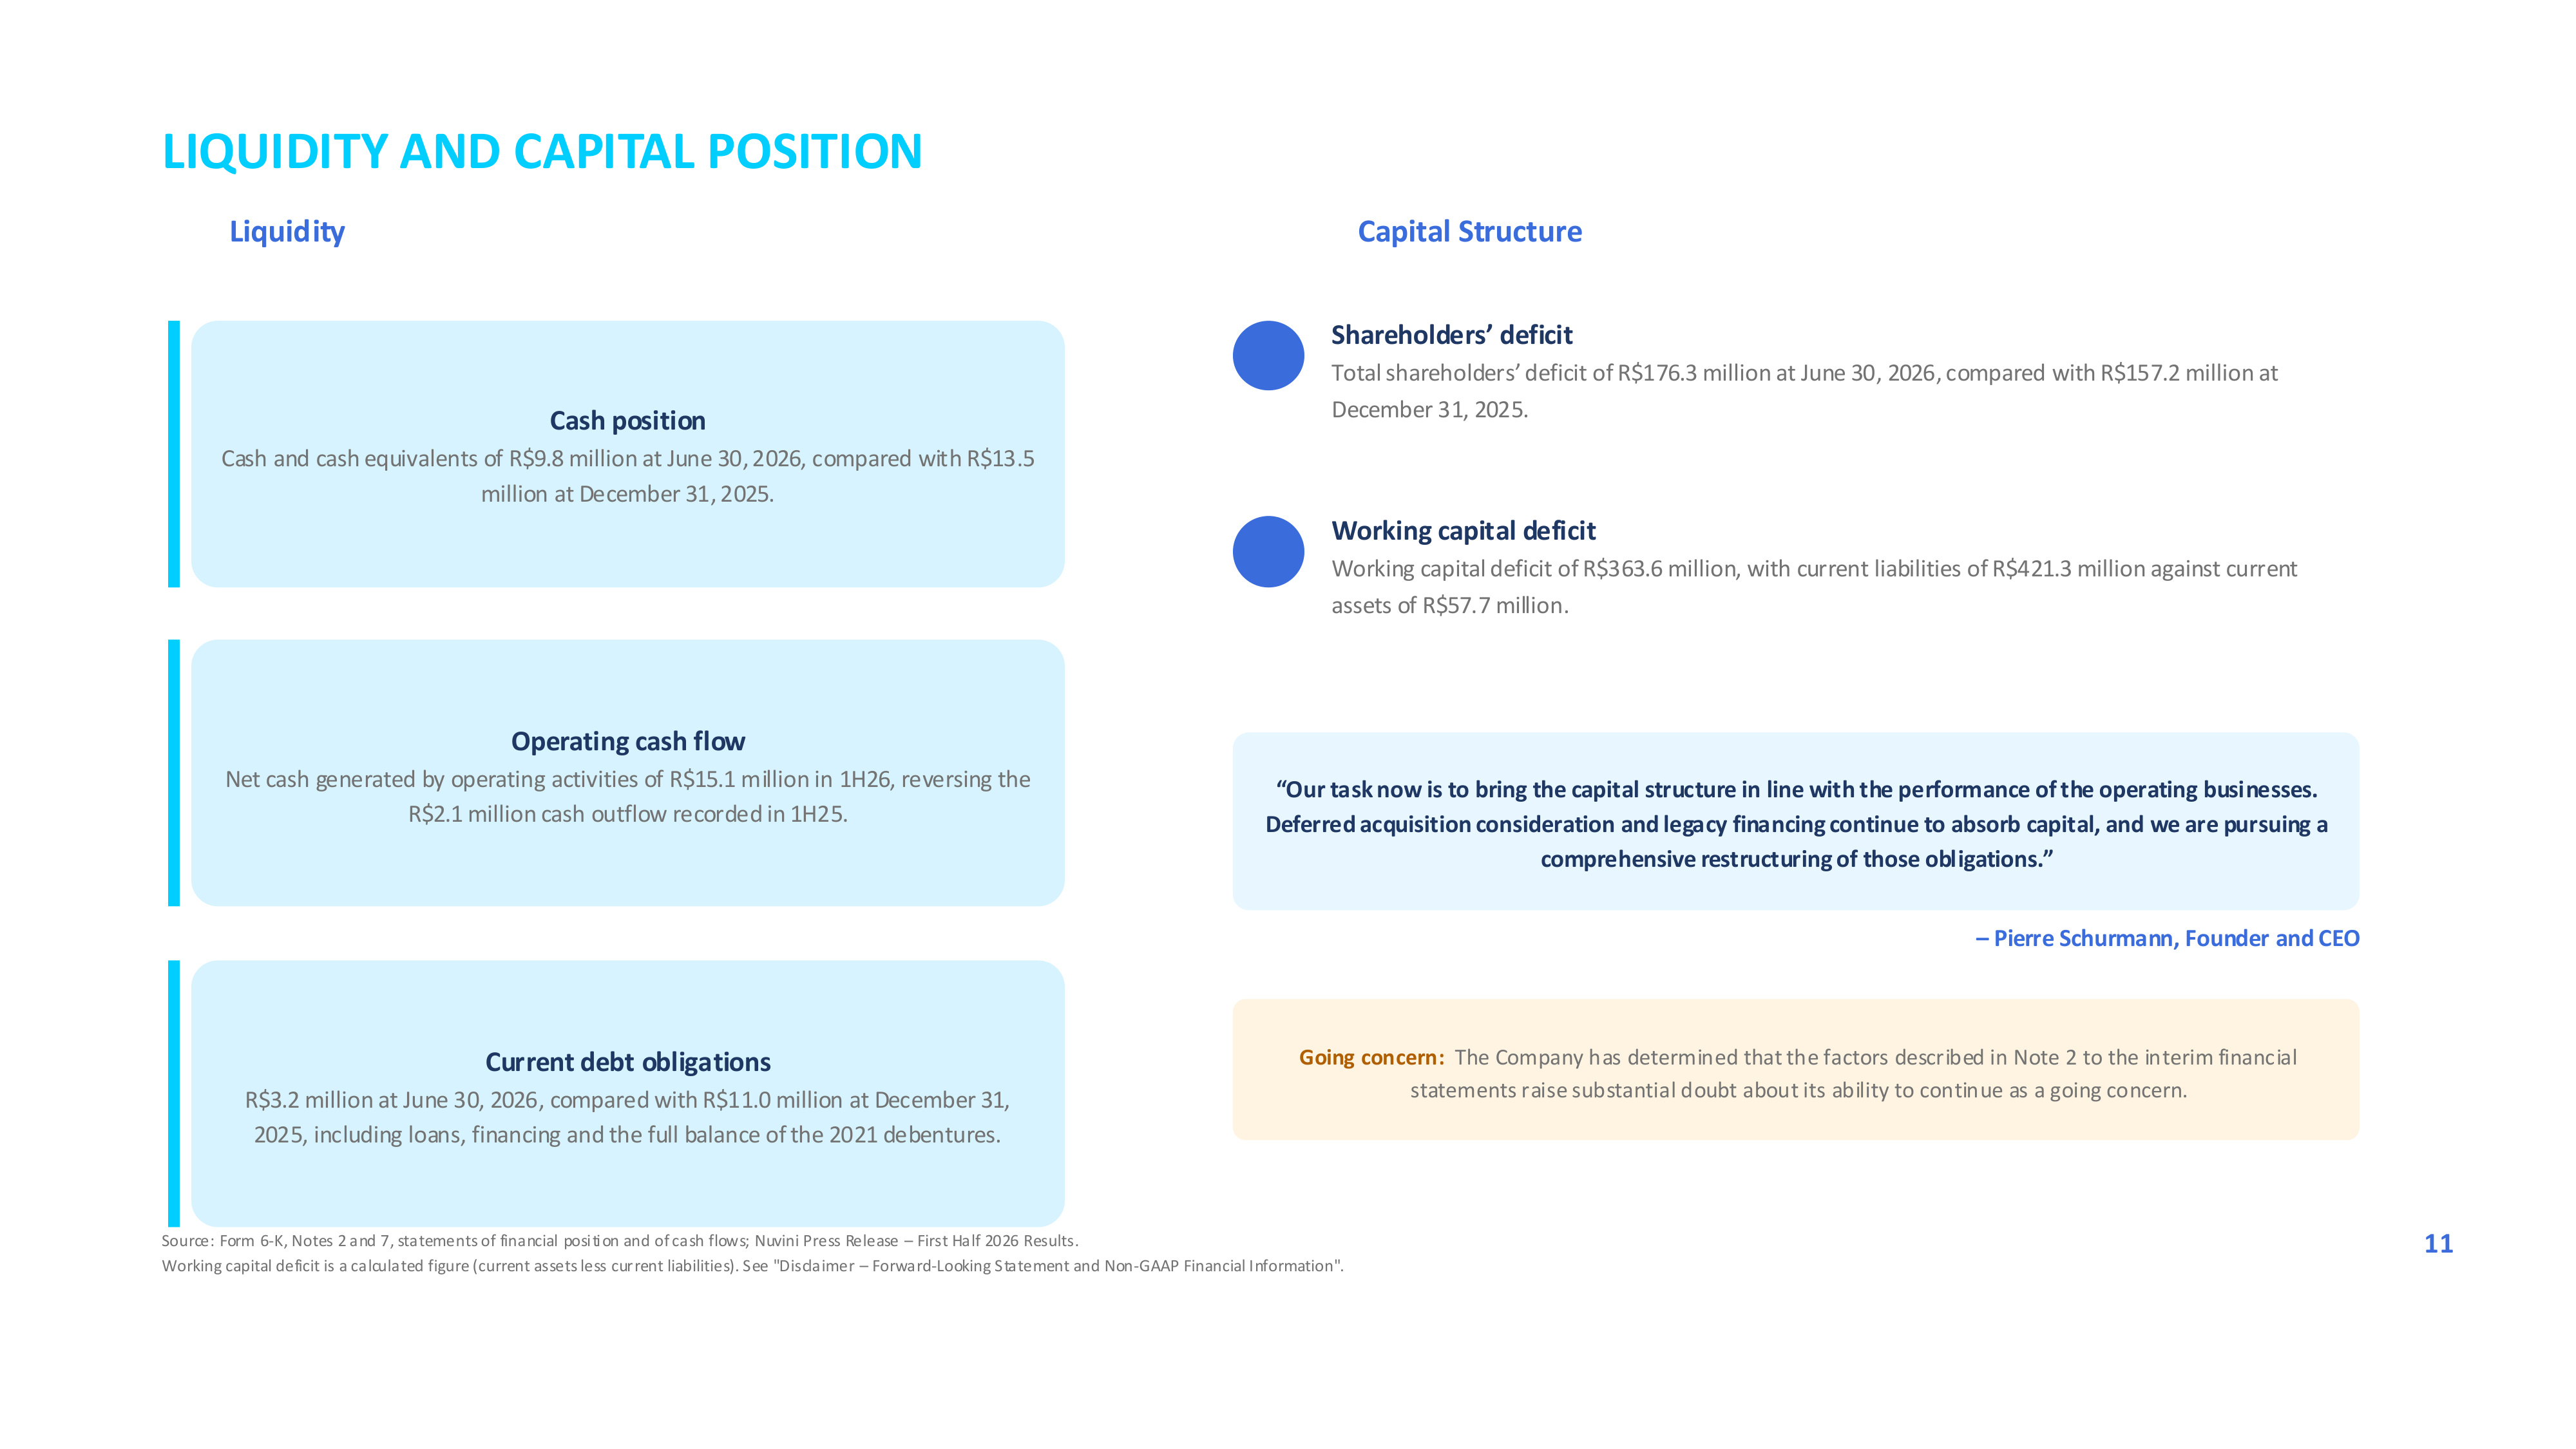
LIQUIDITY AND CAPITAL POSITION Liquidity Capital Structure Cash position Cash and cash equivalents of R$9.8 million at June 30, 2026, compared with R$13.5 million at December 31, 2025. Operating cash flow Net cash generated by operating activities of R$15.1 million in 1H26, reversing the R$2.1 million cash outflow recorded in 1H25. Current debt obligations R$3.2 million at June 30, 2026, compared with R$11.0 million at December 31, 2025, including loans, financing and the full balance of the 2021 debentures. Shareholders' deficit Total shareholders' deficit of R$176.3 million at June 30, 2026, compared with R$157.2 million at December 31, 2025. Working capital deficit Working capital deficit of R$363.6 million, with current liabilities of R$421.3 million against current assets of R$57.7 million. "Our task now is to bring the capital structure in line with the performance of the operating businesses. Deferred acquisition consideration and legacy financing continue to absorb capital, and we are pursuing a comprehensive restructuring of those obligations." – Pierre Schurmann, Founder and CEO Going concern: The Company has determined that the factors described in Note 2 to the interim financial statements raise substantial doubt about its ability to continue as a going concern. Source: Form 6-K, Notes 2 and 7, statements of financial position and of cash flows; Nuvini Press Release – First Half 2026 Results. Working capital deficit is a calculated figure (current assets less current liabilities). See "Disclaimer – Forward-Looking Statement and Non-GAAP Financial Information". 11
03. FIRST HALF 2026 FINANCIAL SUMMARY 12
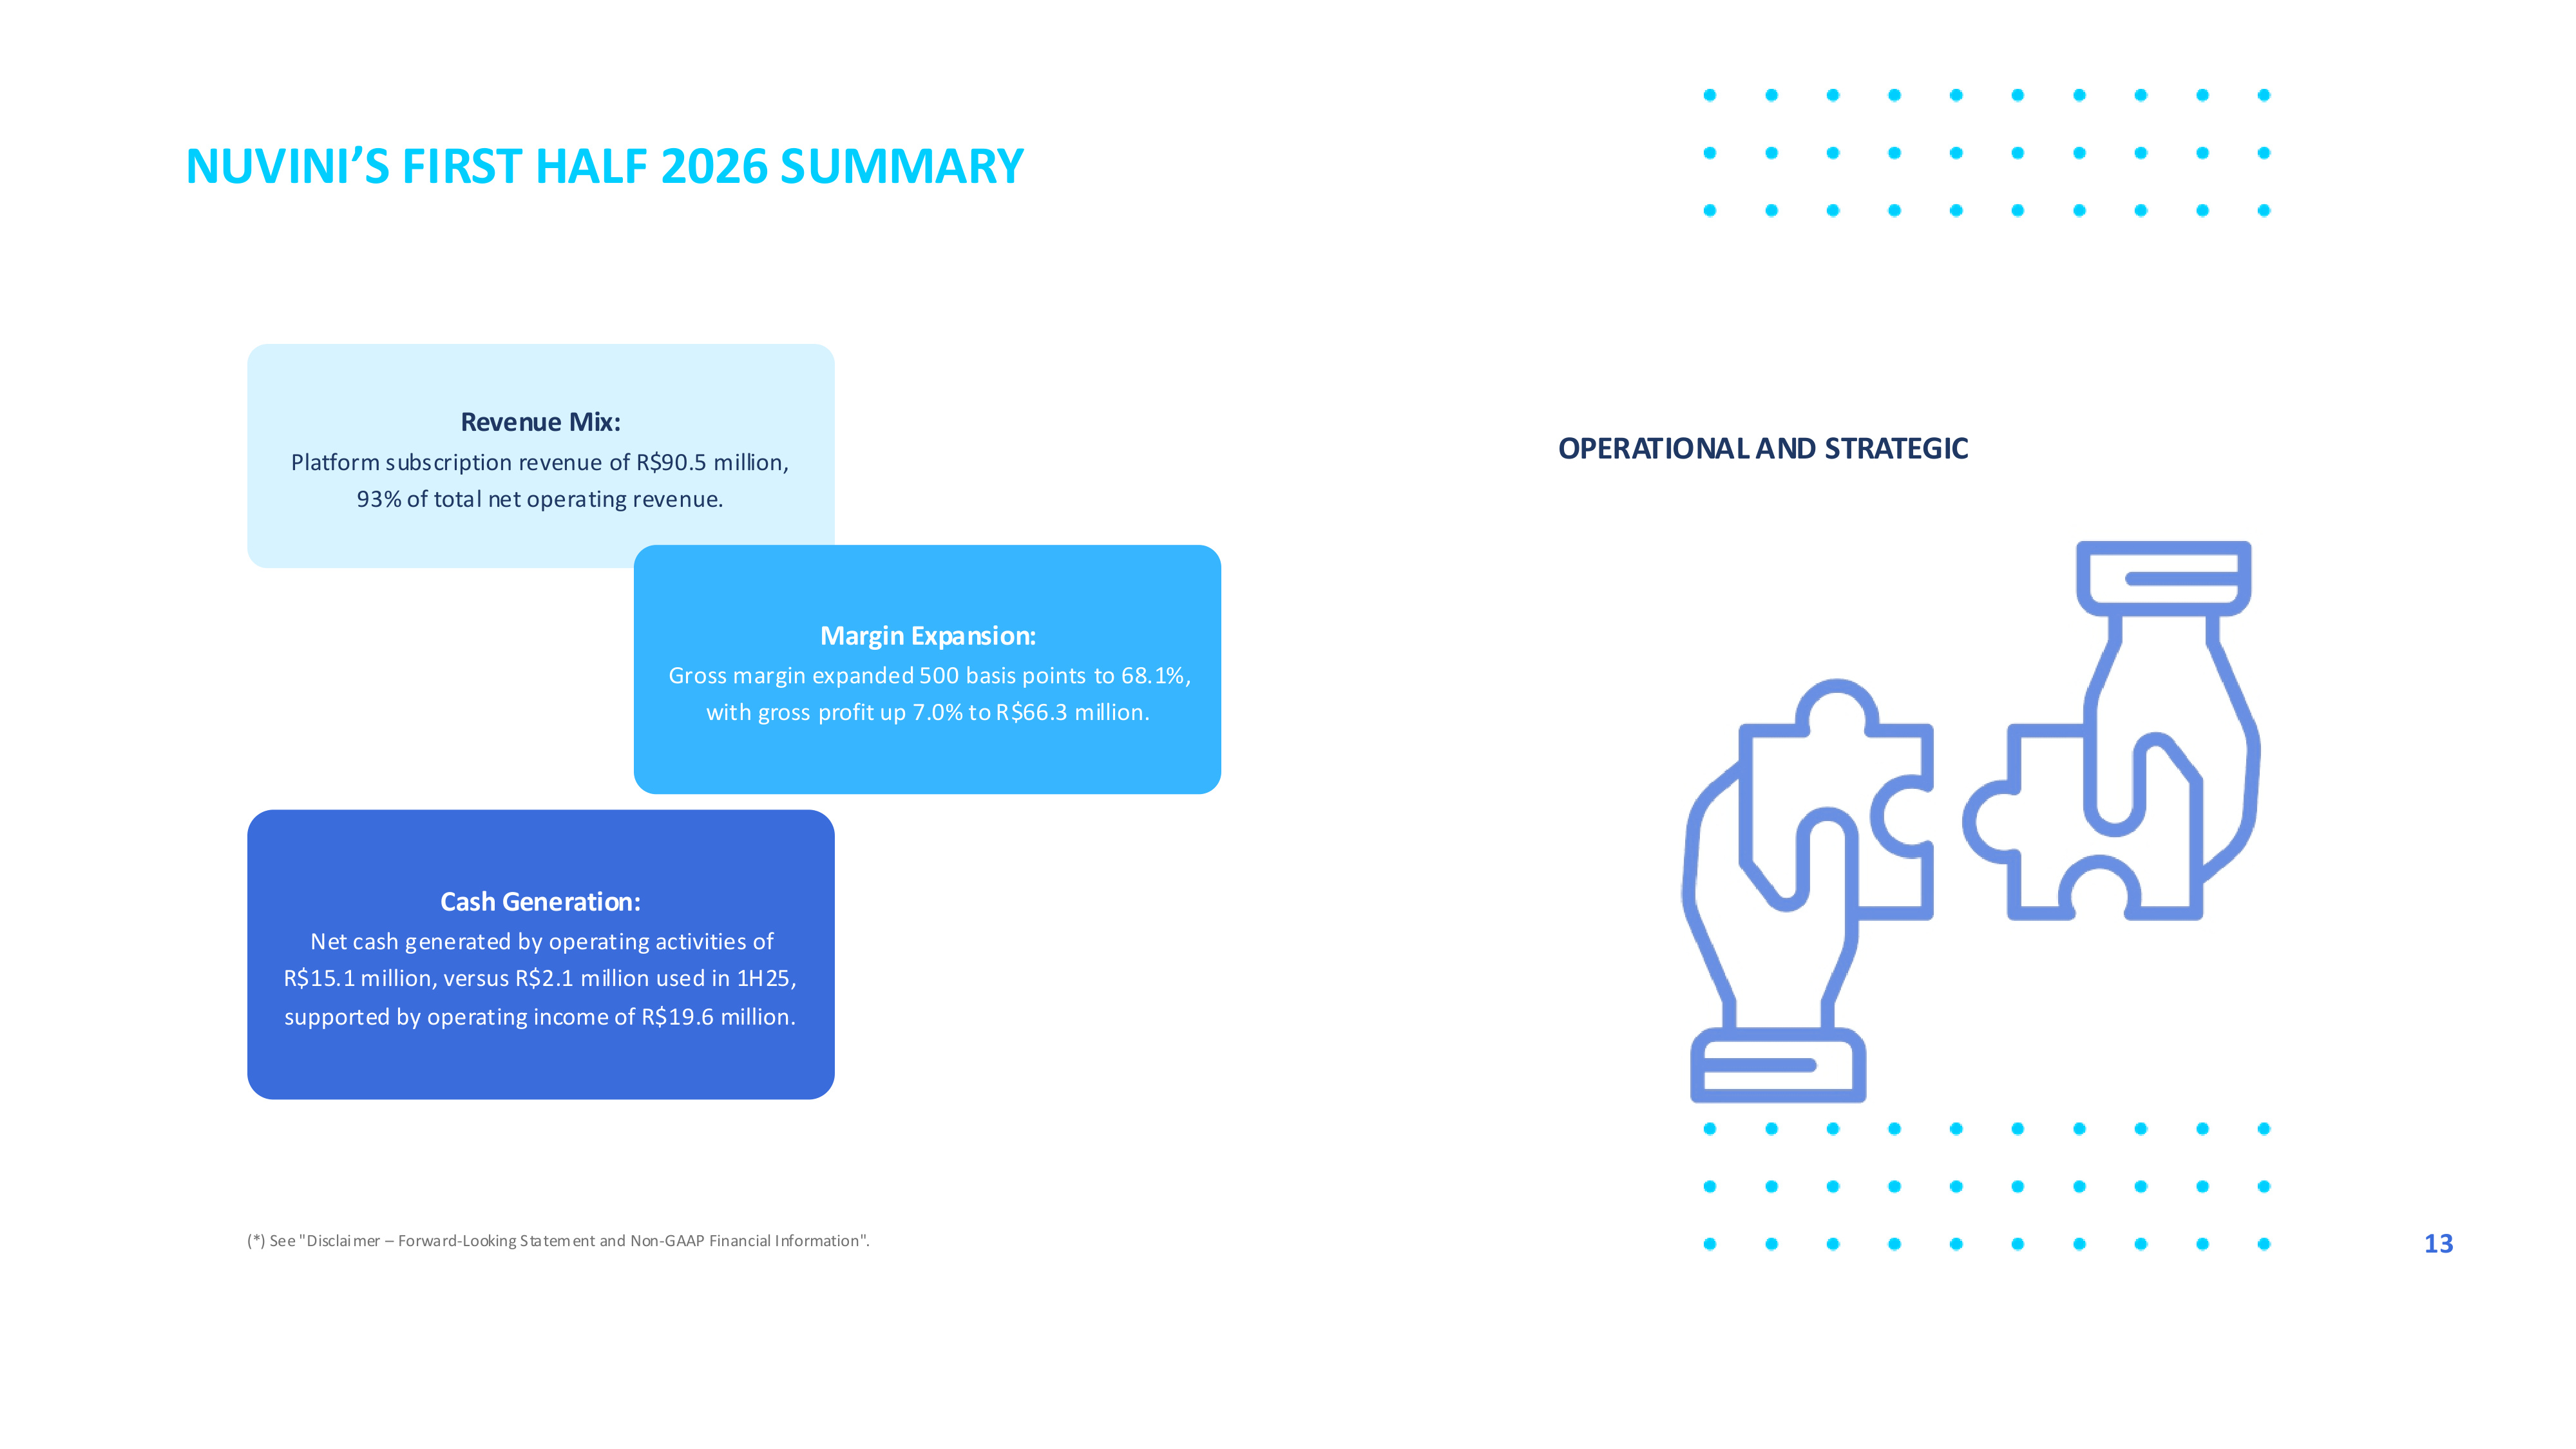
NUVINI'S FIRST HALF 2026 SUMMARY OPERATIONAL AND STRATEGIC Revenue Mix: Platform subscription revenue of R$90.5 million, 93% of total net operating revenue. Margin Expansion: Gross margin expanded 500 basis points to 68.1%, with gross profit up 7.0% to R$66.3 million. Cash Generation: Net cash generated by operating activities of R$15.1 million, versus R$2.1 million used in 1H25, supported by operating income of R$19.6 million. (*) See "Disclaimer – Forward-Looking Statement and Non-GAAP Financial Information". 13
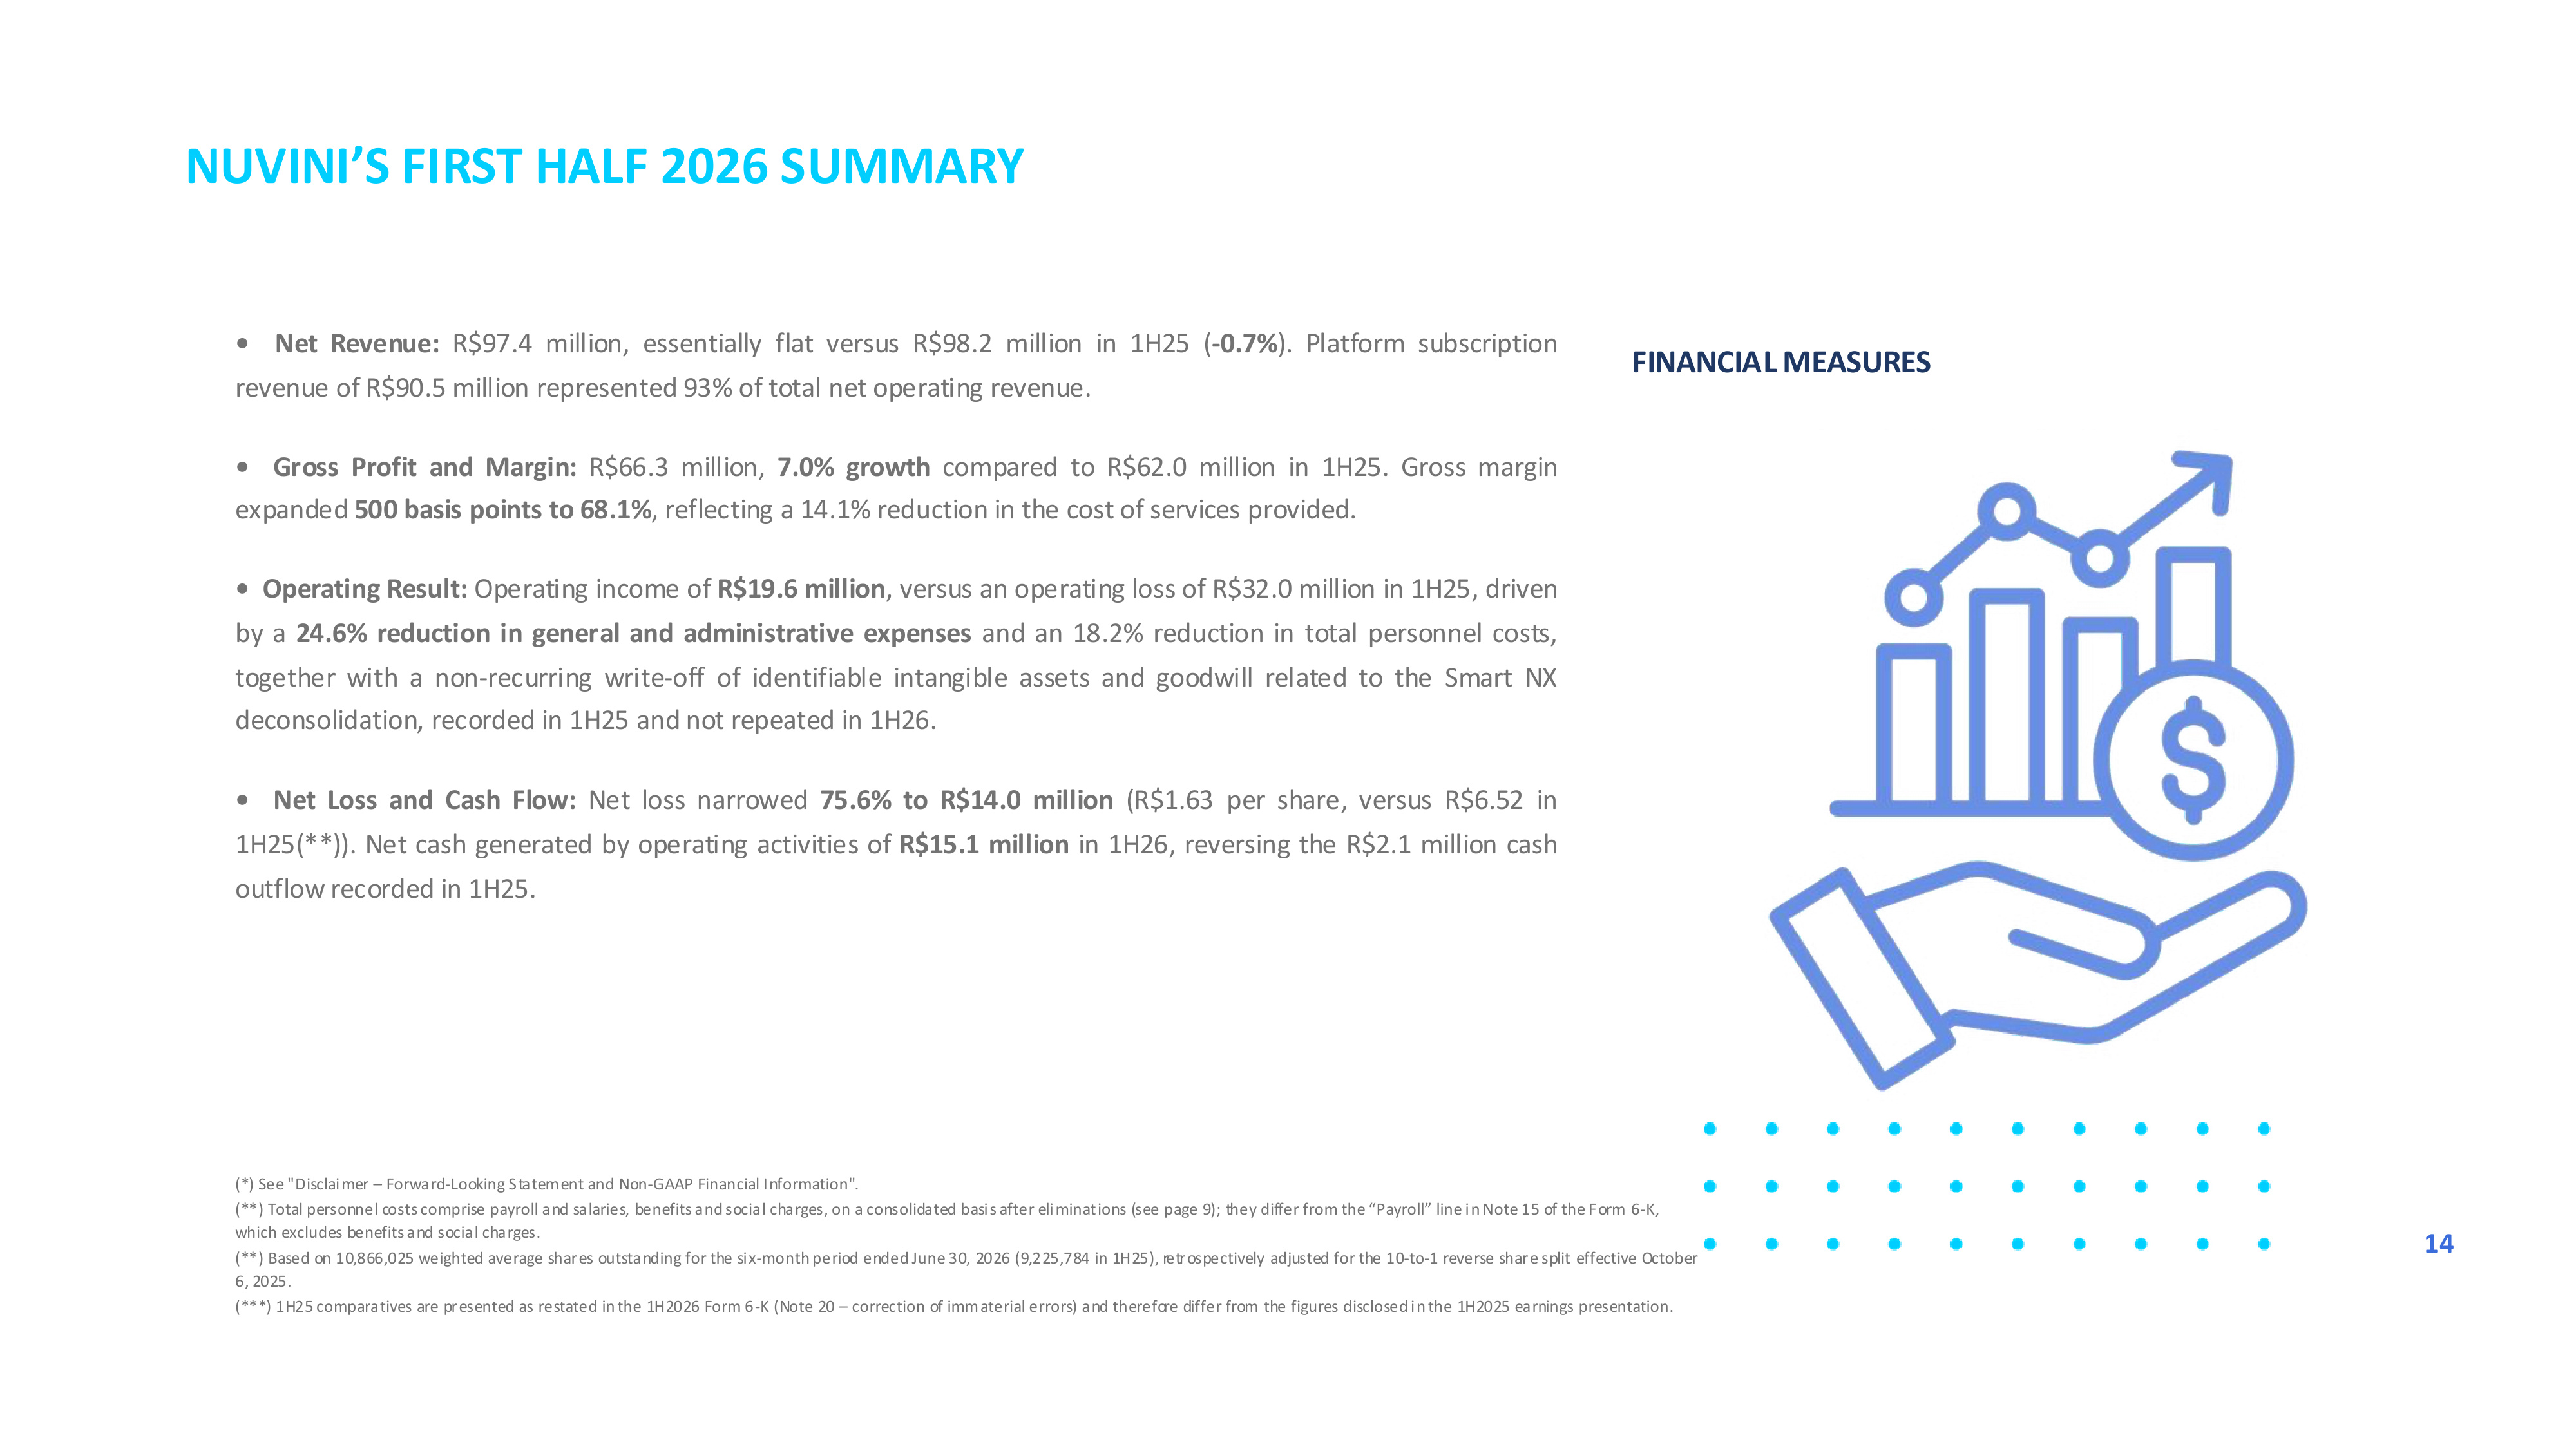
NUVINI'S FIRST HALF 2026 SUMMARY FINANCIAL MEASURES • Net Revenue: R$97.4 million, essentially flat versus R$98.2 million in 1H25 (-0.7%). Platform subscription revenue of R$90.5 million represented 93% of total net operating revenue. • Gross Profit and Margin: R$66.3 million, 7.0% growth compared to R$62.0 million in 1H25. Gross margin expanded 500 basis points to 68.1%, reflecting a 14.1% reduction in the cost of services provided. • Operating Result: Operating income of R$19.6 million, versus an operating loss of R$32.0 million in 1H25, driven by a 24.6% reduction in general and administrative expenses and an 18.2% reduction in total personnel costs, together with a non-recurring write-off of identifiable intangible assets and goodwill related to the Smart NX deconsolidation, recorded in 1H25 and not repeated in 1H26. • Net Loss and Cash Flow: Net loss narrowed 75.6% to R$14.0 million (R$1.63 per share, versus R$6.52 in 1H25(**)). Net cash generated by operating activities of R$15.1 million in 1H26, reversing the R$2.1 million cash outflow recorded in 1H25. (*) See "Disclaimer – Forward-Looking Statement and Non-GAAP Financial Information". (**) Total personnel costs comprise payroll and salaries, benefits and social charges, on a consolidated basis after eliminations (see page 9); they differ from the "Payroll" line in Note 15 of the Form 6-K, which excludes benefits and social charges. (**) Based on 10,866,025 weighted average shares outstanding for the six-month period ended June 30, 2026 (9,225,784 in 1H25), retrospectively adjusted for the 10-to-1 reverse share split effective October 6, 2025. (***) 1H25 comparatives are presented as restated in the 1H2026 Form 6-K (Note 20 – correction of immaterial errors) and therefore differ from the figures disclosed in the 1H2025 earnings presentation. 14
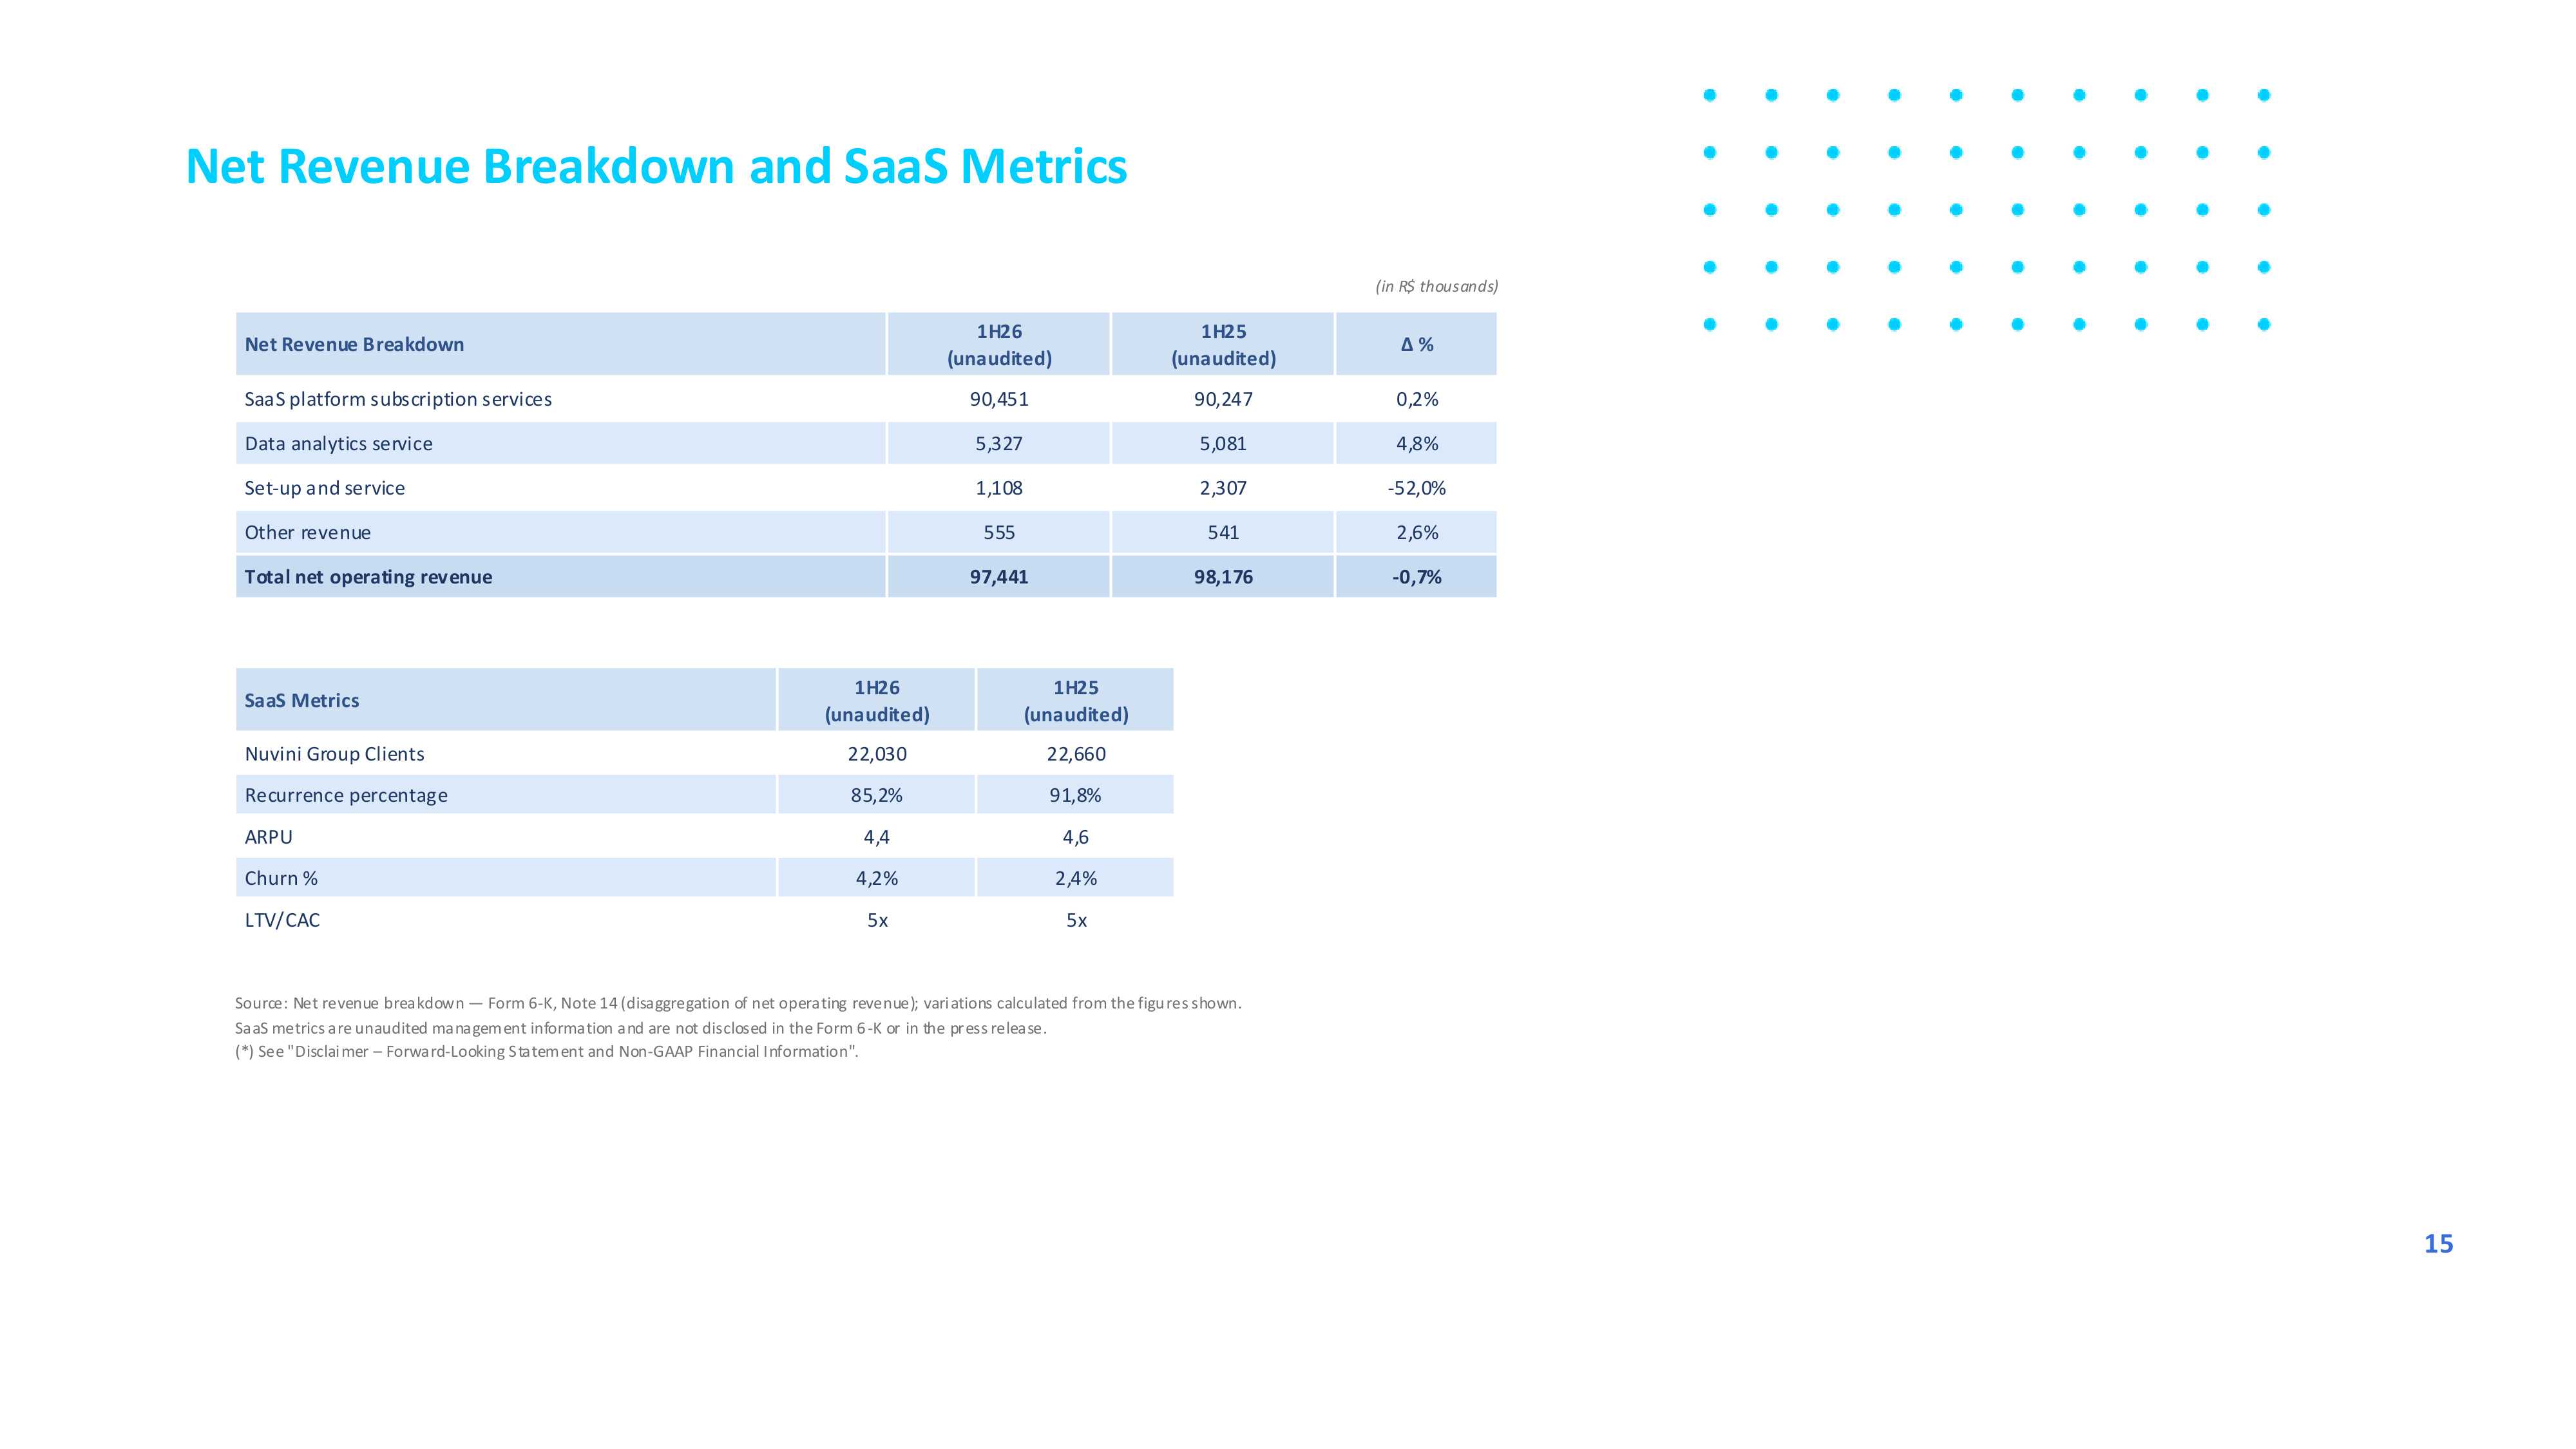
Net Revenue Breakdown and SaaS Metrics Net Revenue Breakdown 1H26 (unaudited) 1H25 (unaudited) Δ % SaaS platform subscription services 90,451 90,247 0,2% Data analytics service 5,327 5,081 4,8% Set-up and service 1,108 2,307 -52,0% Other revenue 555 541 2,6% Total net operating revenue 97,441 98,176 -0,7% (in R$ thousands) SaaS Metrics 1H26 (unaudited) 1H25 (unaudited) Nuvini Group Clients 22,030 22,660 Recurrence percentage 85,2% 91,8% ARPU 4,4 4,6 Churn % 4,2% 2,4% LTV/CAC 5x 5x Source: Net revenue breakdown — Form 6-K, Note 14 (disaggregation of net operating revenue); variations calculated from the figures shown. SaaS metrics are unaudited management information and are not disclosed in the Form 6-K or in the press release. (*) See "Disclaimer – Forward-Looking Statement and Non-GAAP Financial Information". 15
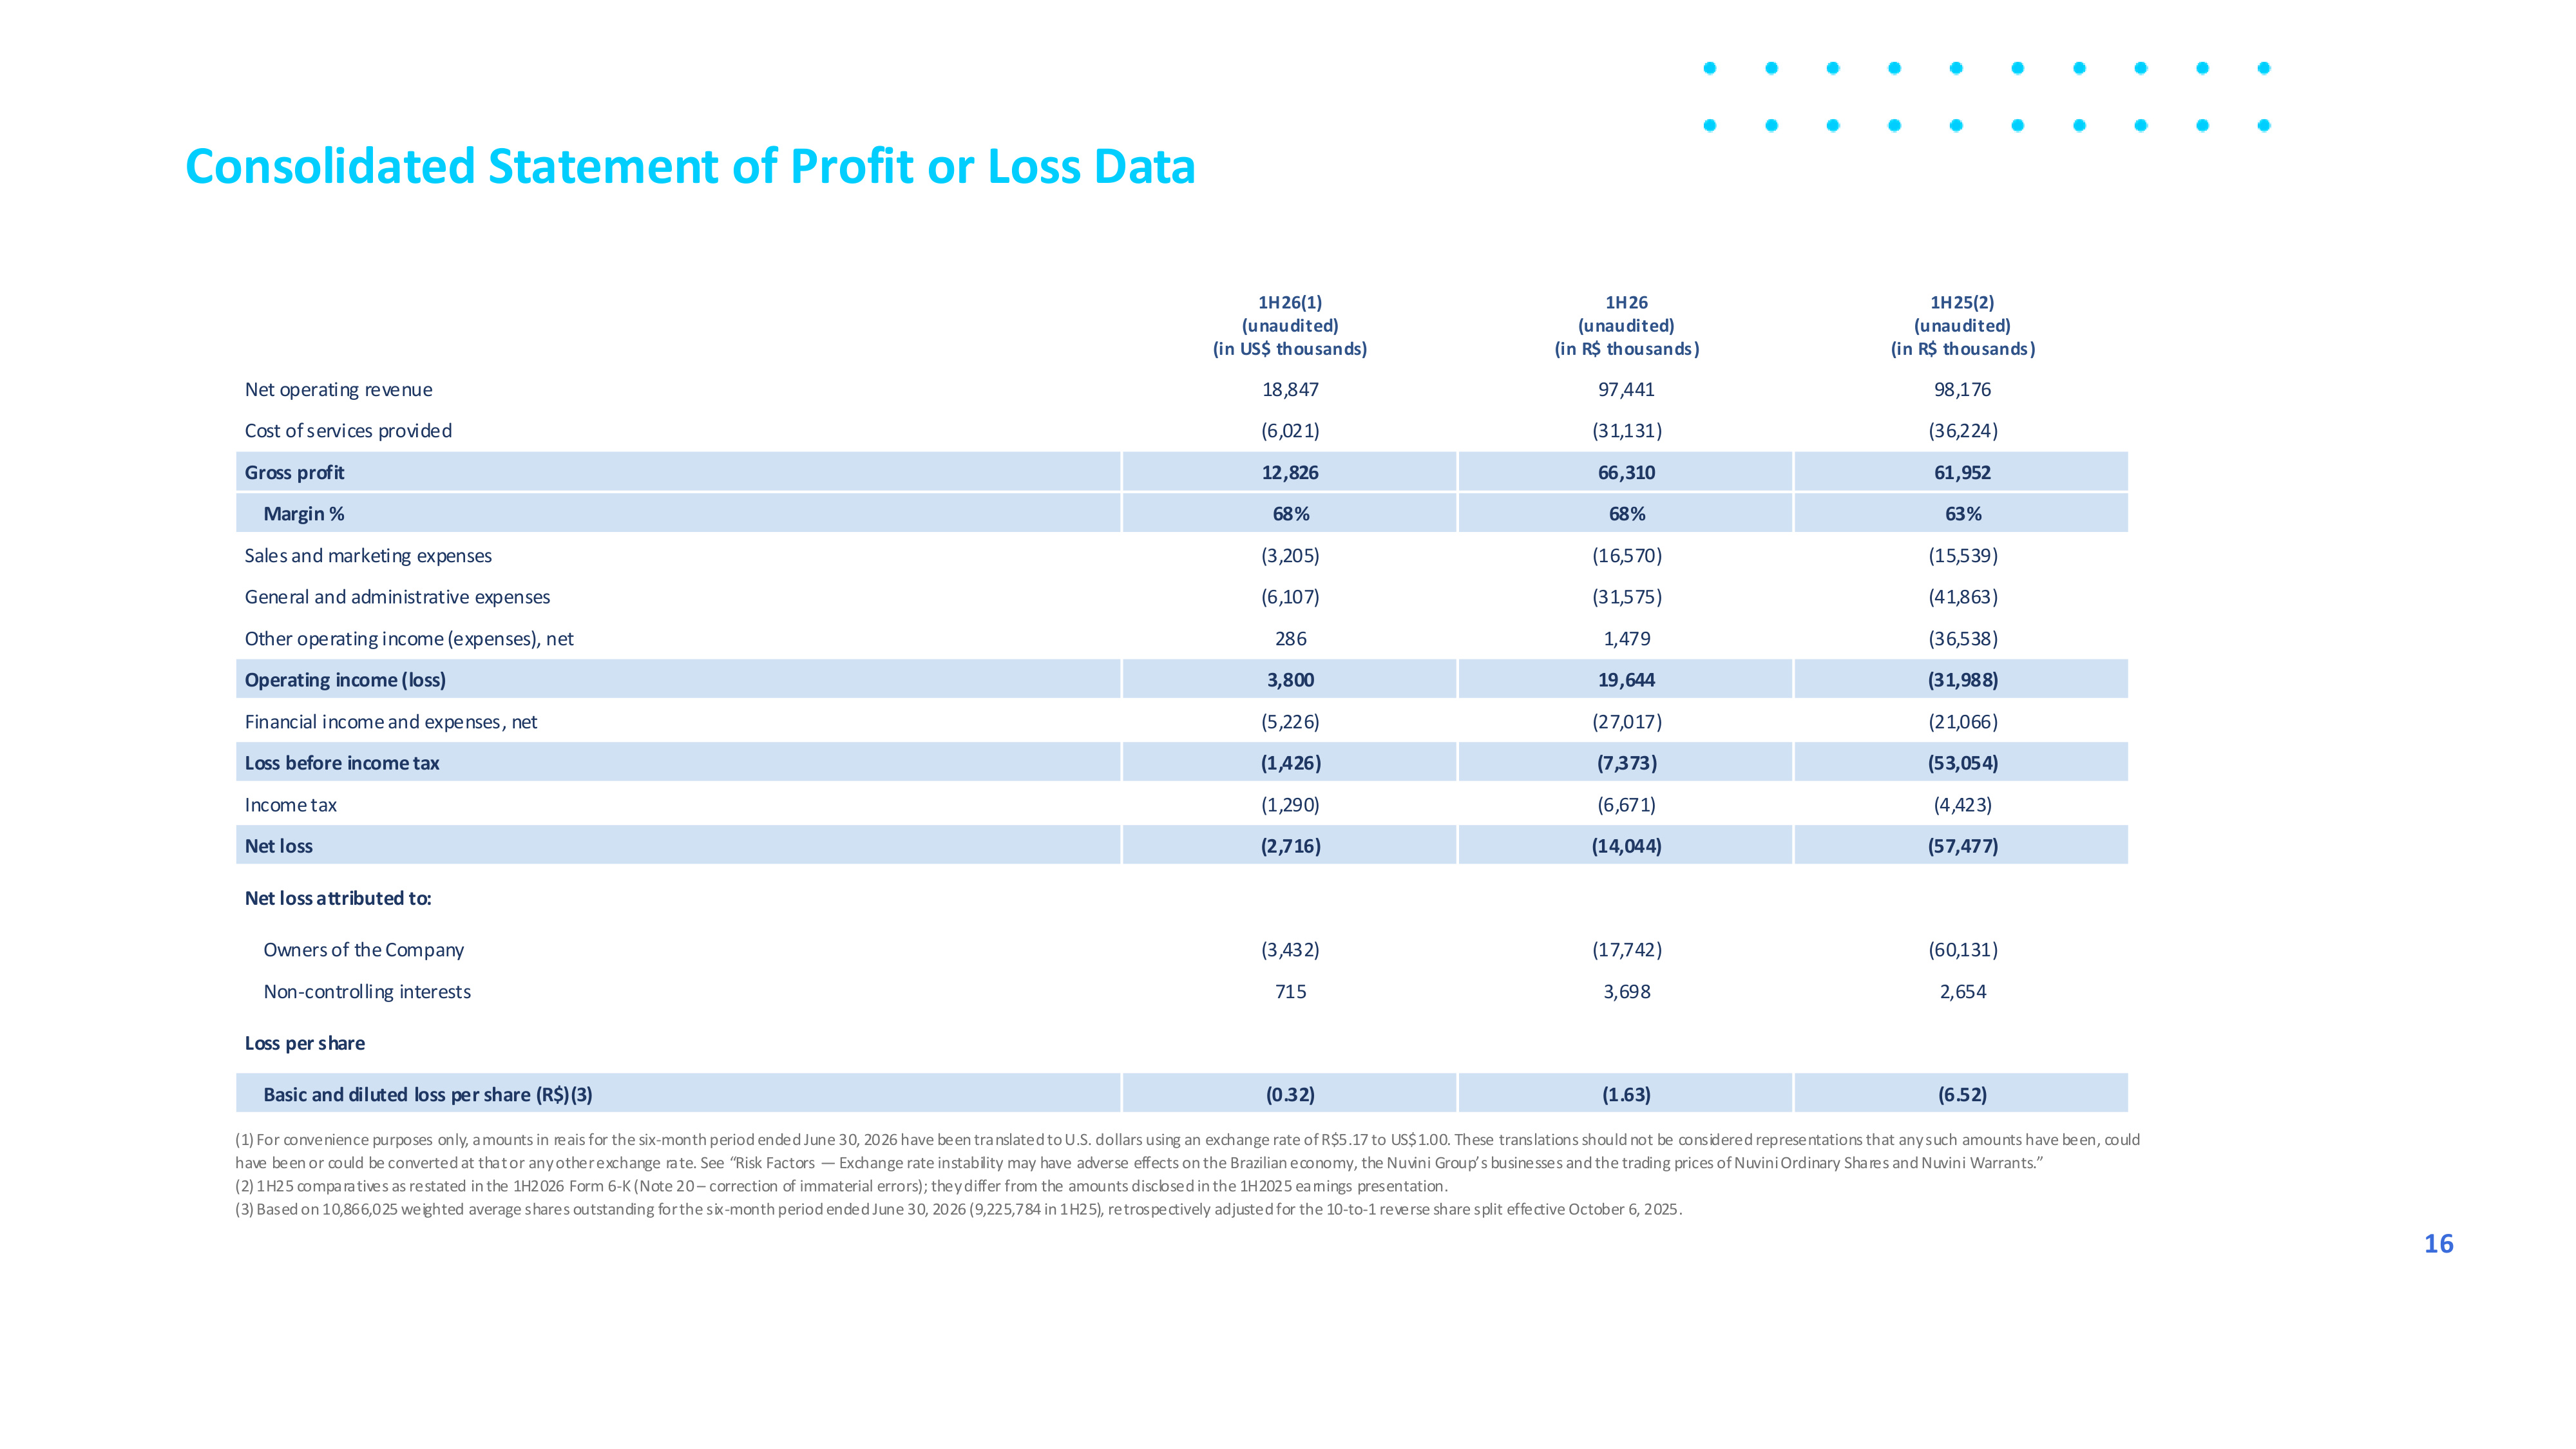
Consolidated Statement of Profit or Loss Data 1H26(1) (unaudited) (in US$ thousands) 1H26 (unaudited) (in R$ thousands) 1H25(2) (unaudited) (in R$ thousands) Net operating revenue 18,847 97,441 98,176 Cost of services provided (6,021) (31,131) (36,224) Gross profit 12,826 66,310 61,952 Margin % 68% 68% 63% Sales and marketing expenses (3,205) (16,570) (15,539) General and administrative expenses (6,107) (31,575) (41,863) Other operating income (expenses), net 286 1,479 (36,538) Operating income (loss) 3,800 19,644 (31,988) Financial income and expenses, net (5,226) (27,017) (21,066) Loss before income tax (1,426) (7,373) (53,054) Income tax (1,290) (6,671) (4,423) Net loss (2,716) (14,044) (57,477) Net loss attributed to: Owners of the Company (3,432) (17,742) (60,131) Non-controlling interests 715 3,698 2,654 Loss per share Basic and diluted loss per share (R$)(3) (0.32) (1.63) (6.52) (1) For convenience purposes only, amounts in reais for the six-month period ended June 30, 2026 have been translated to U.S. dollars using an exchange rate of R$5.17 to US$1.00. These translations should not be considered representations that any such amounts have been, could have been or could be converted at that or any other exchange rate. See "Risk Factors — Exchange rate instability may have adverse effects on the Brazilian economy, the Nuvini Group's businesses and the trading prices of Nuvini Ordinary Shares and Nuvini Warrants." (2) 1H25 comparatives as restated in the 1H2026 Form 6-K (Note 20 – correction of immaterial errors); they differ from the amounts disclosed in the 1H2025 earnings presentation. (3) Based on 10,866,025 weighted average shares outstanding for the six-month period ended June 30, 2026 (9,225,784 in 1H25), retrospectively adjusted for the 10-to-1 reverse share split effective October 6, 2025. 16
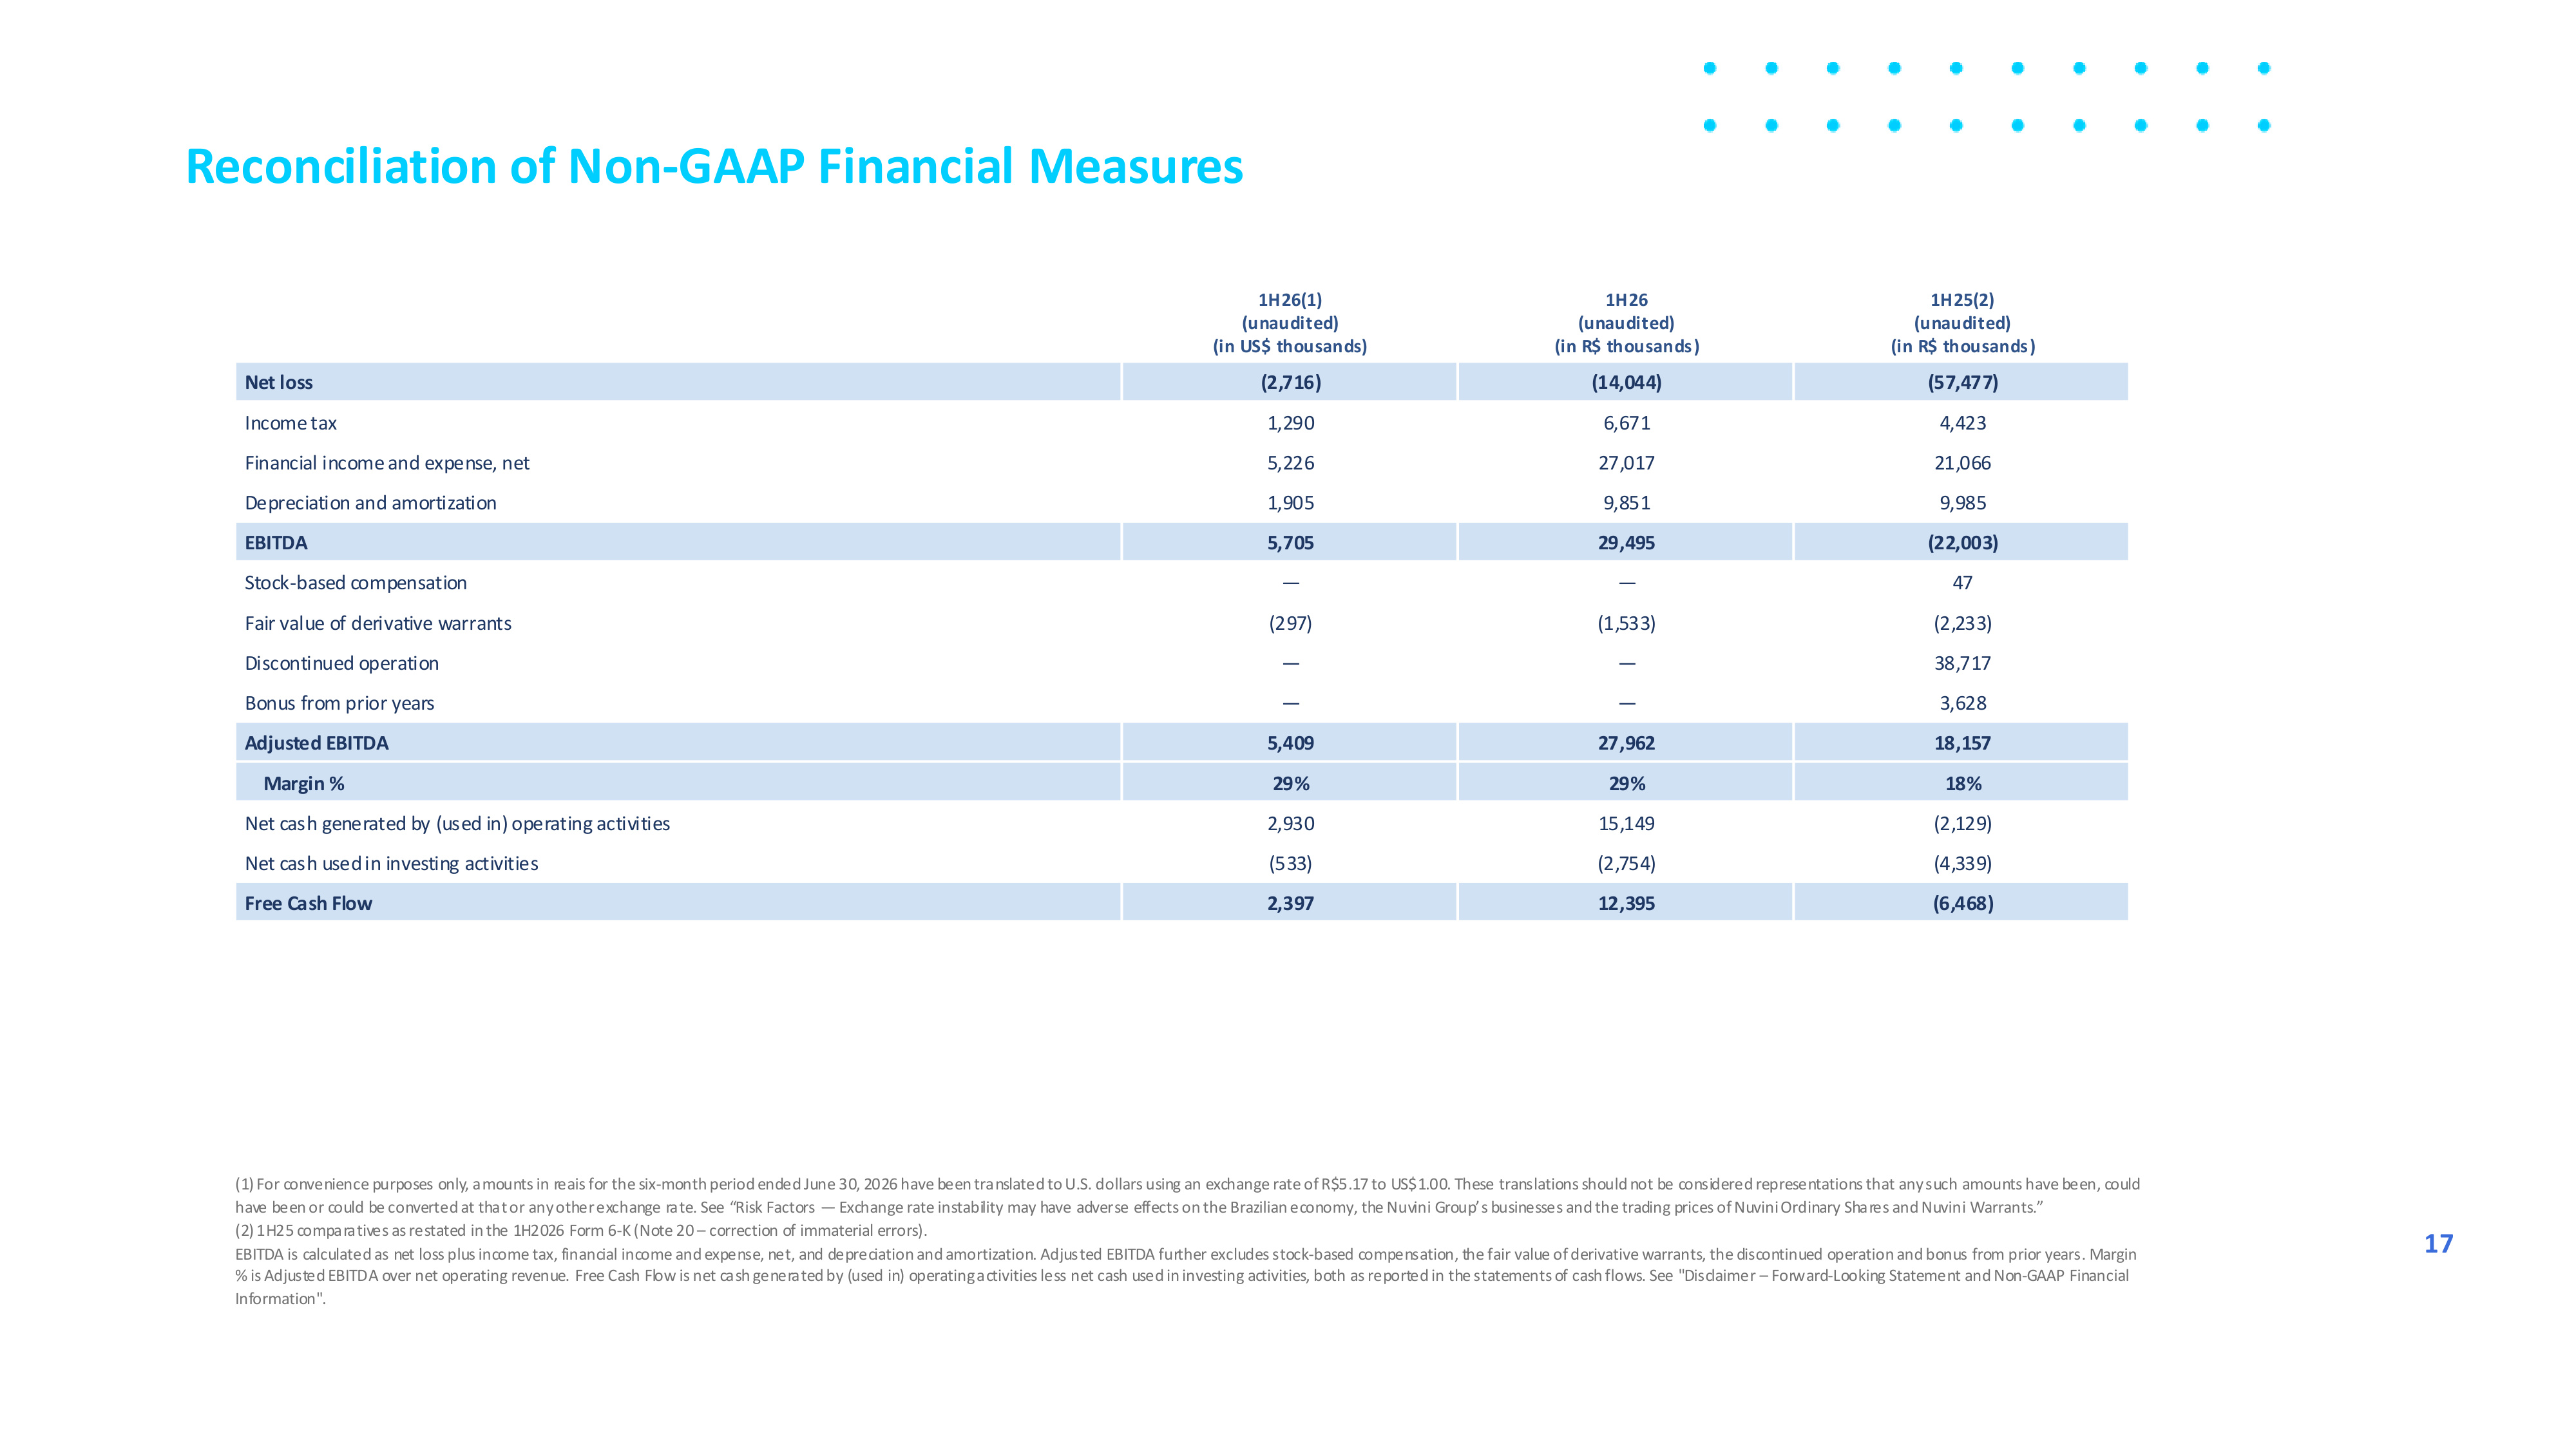
Reconciliation of Non-GAAP Financial Measures 1H26(1) (unaudited) (in US$ thousands) 1H26 (unaudited) (in R$ thousands) 1H25(2) (unaudited) (in R$ thousands) Net loss (2,716) (14,044) (57,477) Income tax 1,290 6,671 4,423 Financial income and expense, net 5,226 27,017 21,066 Depreciation and amortization 1,905 9,851 9,985 EBITDA 5,705 29,495 (22,003) Stock-based compensation — — 47 Fair value of derivative warrants (297) (1,533) (2,233) Discontinued operation — — 38,717 Bonus from prior years — — 3,628 Adjusted EBITDA 5,409 27,962 18,157 Margin % 29% 29% 18% Net cash generated by (used in) operating activities 2,930 15,149 (2,129) Net cash used in investing activities (533) (2,754) (4,339) Free Cash Flow 2,397 12,395 (6,468) (1) For convenience purposes only, amounts in reais for the six-month period ended June 30, 2026 have been translated to U.S. dollars using an exchange rate of R$5.17 to US$1.00. These translations should not be considered representations that any such amounts have been, could have been or could be converted at that or any other exchange rate. See "Risk Factors — Exchange rate instability may have adverse effects on the Brazilian economy, the Nuvini Group's businesses and the trading prices of Nuvini Ordinary Shares and Nuvini Warrants." (2) 1H25 comparatives as restated in the 1H2026 Form 6-K (Note 20 – correction of immaterial errors). EBITDA is calculated as net loss plus income tax, financial income and expense, net, and depreciation and amortization. Adjusted EBITDA further excludes stock-based compensation, the fair value of derivative warrants, the discontinued operation and bonus from prior years. Margin % is Adjusted EBITDA over net operating revenue. Free Cash Flow is net cash generated by (used in) operating activities less net cash used in investing activities, both as reported in the statements of cash flows. See "Disclaimer – Forward-Looking Statement and Non-GAAP Financial Information". 17
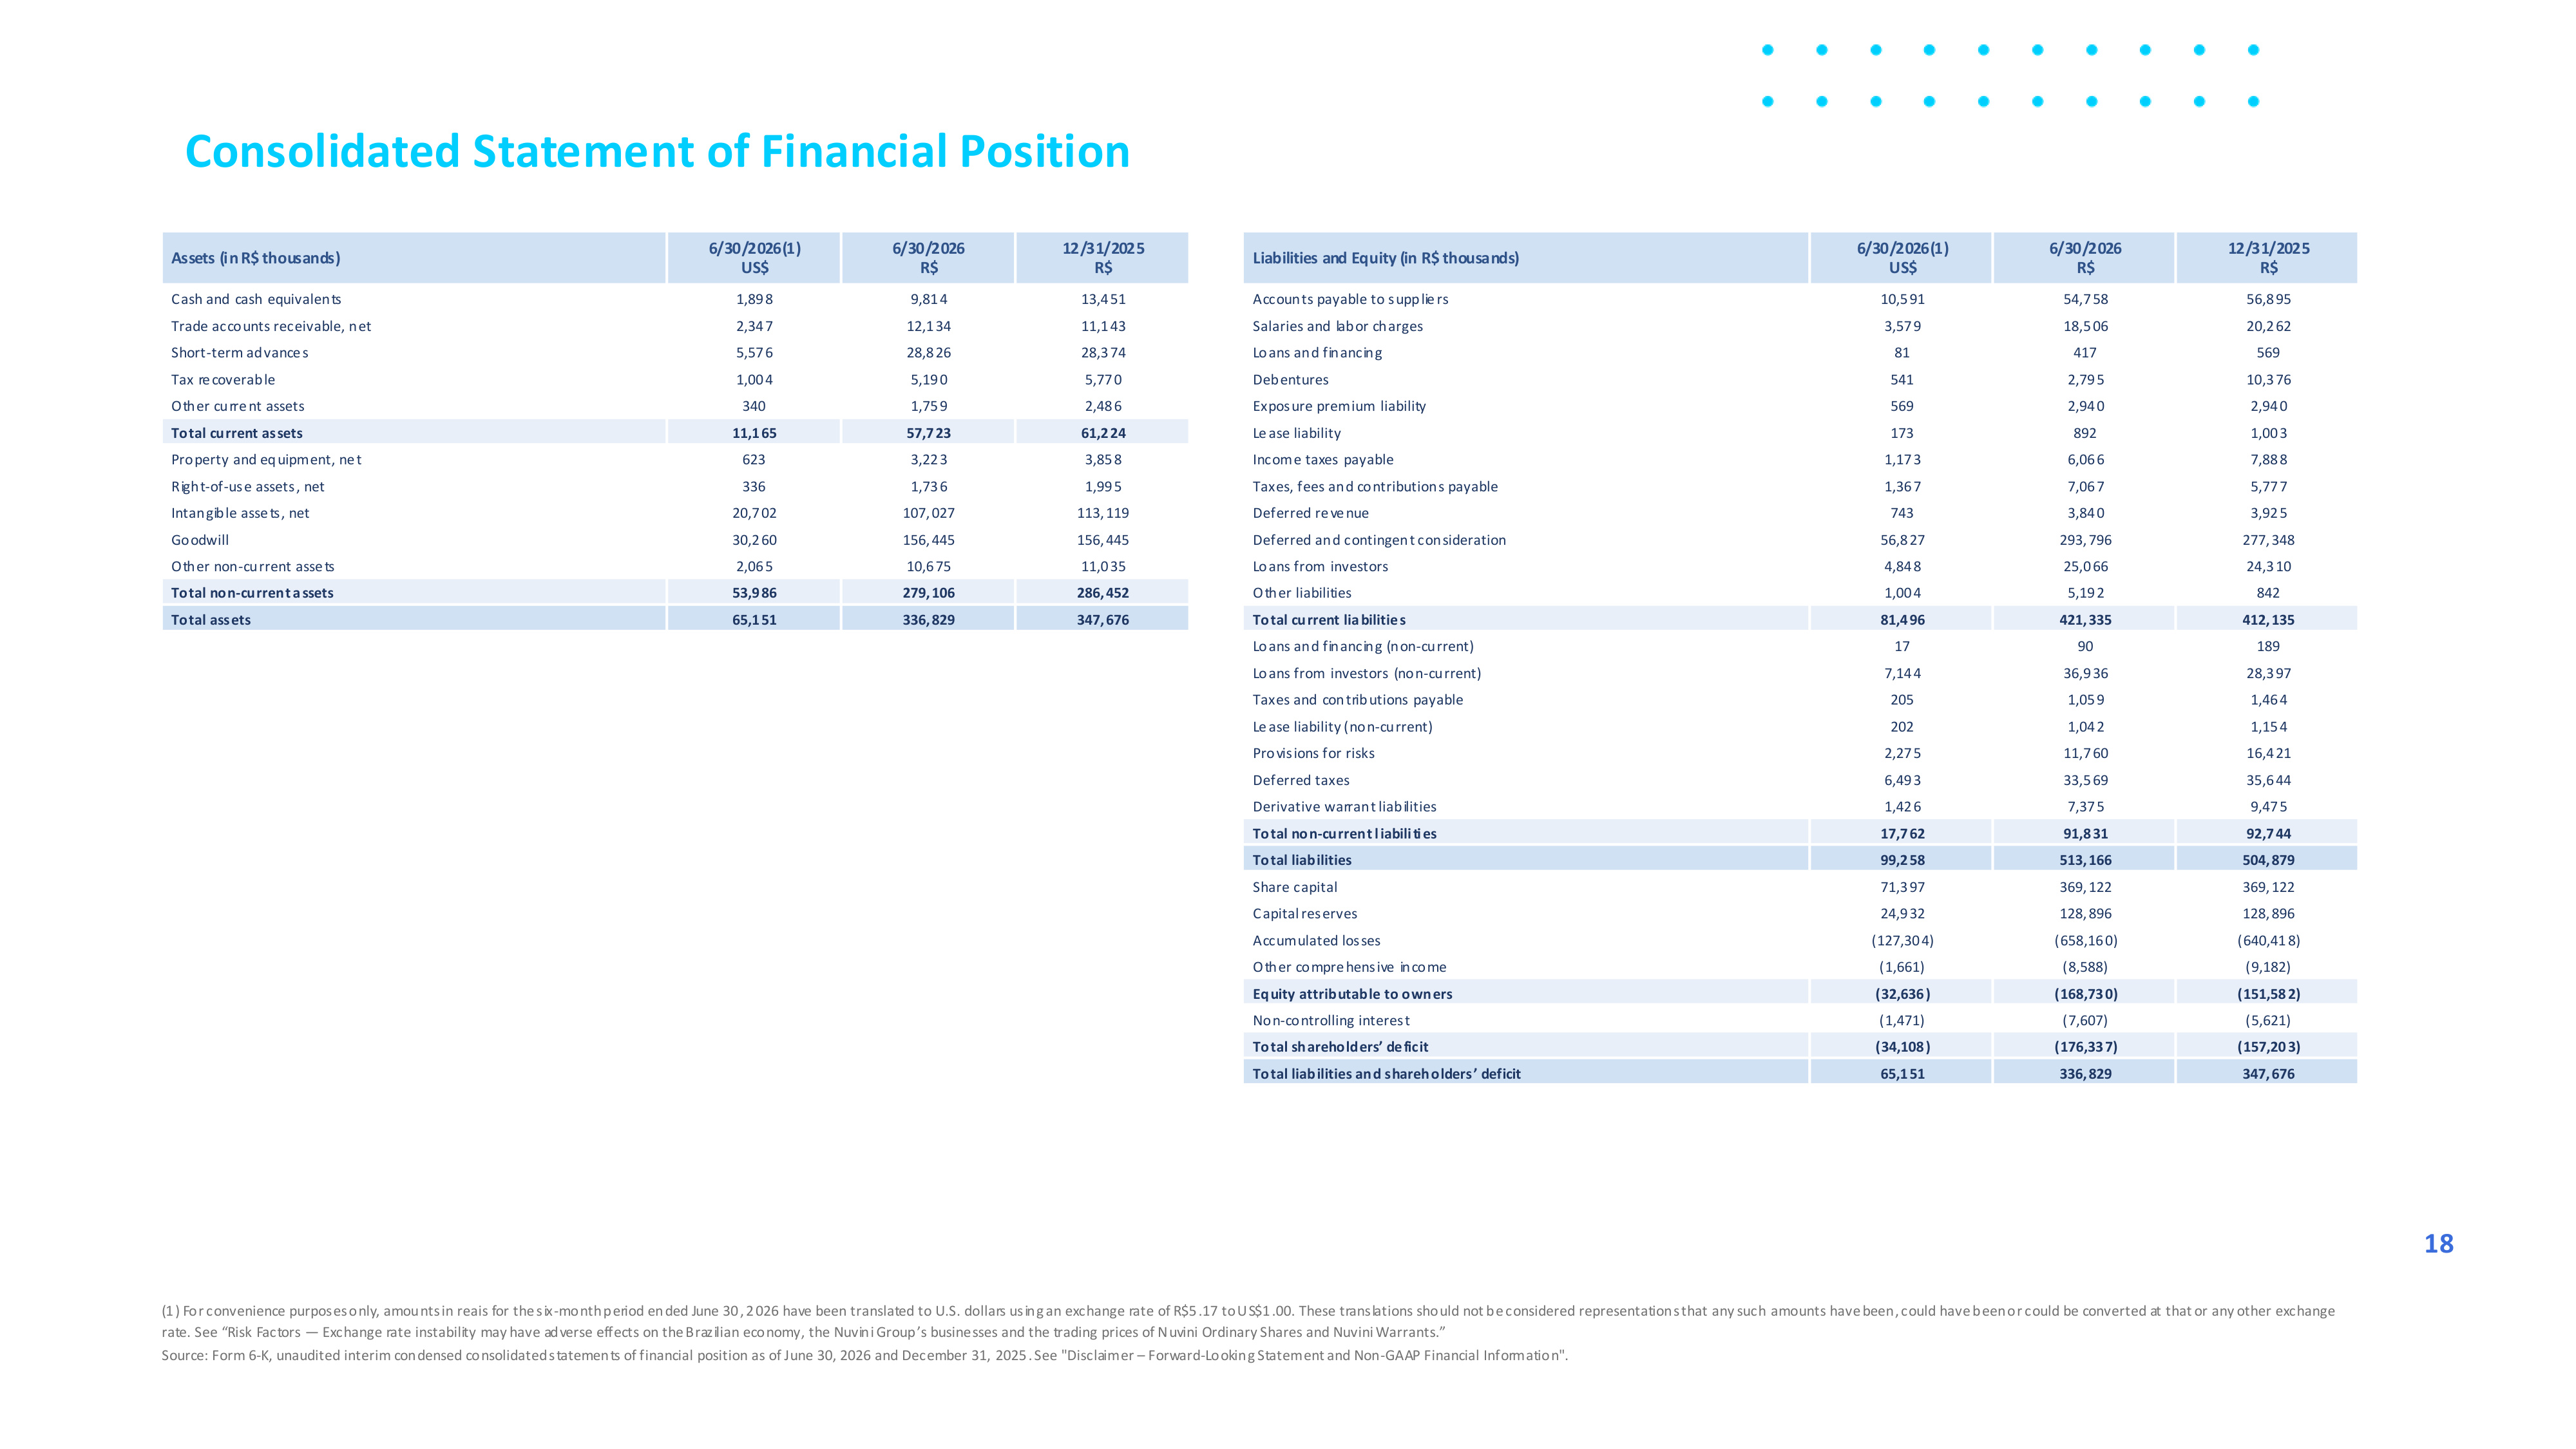
Consolidated Statement of Financial Position Assets (in R$ thousands) 6/30/2026(1) US$ 6/30/2026 R$ 12/31/2025 R$ Cash and cash equivalents 1,898 9,814 13,451 Trade accounts receivable, net 2,347 12,134 11,143 Short-term advances 5,576 28,826 28,374 Tax recoverable 1,004 5,190 5,770 Other current assets 340 1,759 2,486 Total current assets 11,165 57,723 61,224 Property and equipment, net 623 3,223 3,858 Right-of-use assets, net 336 1,736 1,995 Intangible assets, net 20,702 107,027 113,119 Goodwill 30,260 156,445 156,445 Other non-current assets 2,065 10,675 11,035 Total non-current assets 53,986 279,106 286,452 Total assets 65,151 336,829 347,676 Liabilities and Equity (in R$ thousands) 6/30/2026(1) US$ 6/30/2026 R$ 12/31/2025 R$ Accounts payable to suppliers 10,591 54,758 56,895 Salaries and labor charges 3,579 18,506 20,262 Loans and financing 81 417 569 Debentures 541 2,795 10,376 Exposure premium liability 569 2,940 2,940 Lease liability 173 892 1,003 Income taxes payable 1,173 6,066 7,888 Taxes, fees and contributions payable 1,367 7,067 5,777 Deferred revenue 743 3,840 3,925 Deferred and contingent consideration 56,827 293,796 277,348 Loans from investors 4,848 25,066 24,310 Other liabilities 1,004 5,192 842 Total current liabilities 81,496 421,335 412,135 Loans and financing (non-current) 17 90 189 Loans from investors (non-current) 7,144 36,936 28,397 Taxes and contributions payable 205 1,059 1,464 Lease liability (non-current) 202 1,042 1,154 Provisions for risks 2,275 11,760 16,421 Deferred taxes 6,493 33,569 35,644 Derivative warrant liabilities 1,426 7,375 9,475 Total non-current liabilities 17,762 91,831 92,744 Total liabilities 99,258 513,166 504,879 Share capital 71,397 369,122 369,122 Capital reserves 24,932 128,896 128,896 Accumulated losses (127,304) (658,160) (640,418) Other comprehensive income (1,661) (8,588) (9,182) Equity attributable to owners (32,636) (168,730) (151,582) Non-controlling interest (1,471) (7,607) (5,621) Total shareholders' deficit (34,108) (176,337) (157,203) Total liabilities and shareholders' deficit 65,151 336,829 347,676 (1) For convenience purposes only, amounts in reais for the six-month period ended June 30, 2026 have been translated to U.S. dollars using an exchange rate of R$5.17 to US$1.00. These translations should not be considered representations that any such amounts have been, could have been or could be converted at that or any other exchange rate. See "Risk Factors — Exchange rate instability may have adverse effects on the Brazilian economy, the Nuvini Group's businesses and the trading prices of Nuvini Ordinary Shares and Nuvini Warrants." Source: Form 6-K, unaudited interim condensed consolidated statements of financial position as of June 30, 2026 and December 31, 2025. See "Disclaimer – Forward-Looking Statement and Non-GAAP Financial Information". 18