Value of Initial Fixed | |||||||||||||||||||||||||||||||||||
PEO - Ergen | PEO - Akhavan | PEO - Dugan | Non-PEO NEOs | $100 Investment Based On: | |||||||||||||||||||||||||||||||
Average | Peer Group | Company- | |||||||||||||||||||||||||||||||||
Summary | Compensation | Summary | Compensation | Summary | Summary | Average | Total | Total | Selected | ||||||||||||||||||||||||||
Compensation | Actually | Compensation | Actually | Compensation | Compensation | Compensation | Compensation | Shareholder | Shareholder | Measure - | |||||||||||||||||||||||||
Year | Table Total (1) | | Paid to PEO (2) | | Table Total (1) | | Paid to PEO (2) | | Table Total (1) | | Actually Paid (2) | | Table Total (3) | | Actually Paid (2) | | Return (TSR) (4) | | Return (5) | | Net Income | | Revenue (6) | ||||||||||||
(In Millions) | |||||||||||||||||||||||||||||||||||
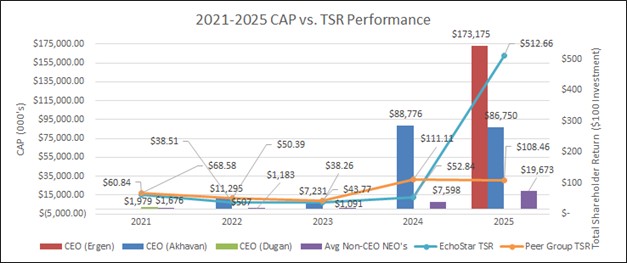
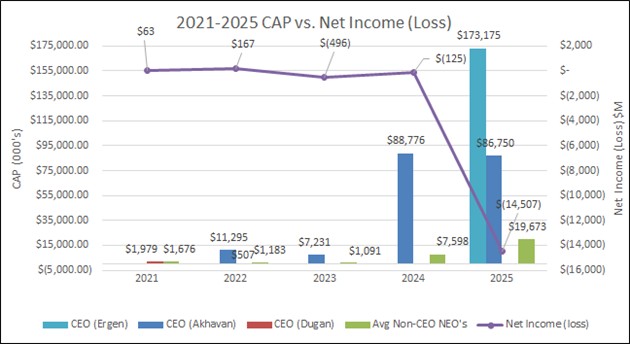
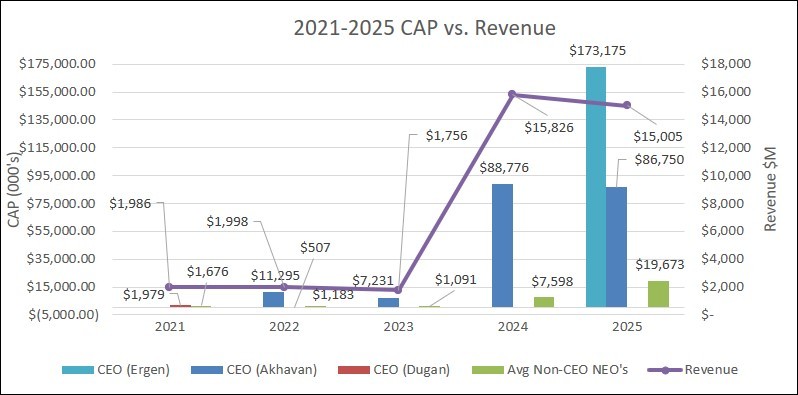
2025 | $ | 4,648,665 | $ | 173,174,888 | $ | 8,567,712 | $ | 86,749,950 | $ | — | $ | — | $ | 1,329,786 | $ | 19,672,798 | $ | 48.92 | $ | 106.40 | $ | (51.9) | $ | 1,887.9 | |||||||||||
2024 | $ | — | $ | — | $ | 8,927,865 | $ | 88,775,893 | $ | — | $ | — | $ | 5,271,261 | $ | 7,597,824 | $ | 52.84 | $ | 111.11 | $ | (124.5) | $ | 15,825.5 | |||||||||||
2023 | $ | — | $ | — | $ | 7,190,962 | $ | 7,230,741 | $ | — | $ | — | $ | 1,030,992 | $ | 1,091,461 | $ | 38.24 | $ | 94.83 | $ | (496.1) | $ | 1,755.6 | |||||||||||
2022 | $ | — | $ | — | $ | 15,288,135 | $ | 11,355,035 | $ | 635,518 | $ | 507,438 | $ | 1,814,059 | $ | 1,182,949 | $ | 38.50 | $ | 85.09 | $ | 166.5 | $ | 1,998.1 | |||||||||||
2021 | $ | — | $ | — | $ | — | $ | — | $ | 1,775,101 | $ | 1,978,621 | $ | 1,458,856 | $ | 1,675,670 | $ | 60.83 | $ | 99.48 | $ | 62.7 | $ | 1,985.7 | |||||||||||
(1) | Mr. Ergen became our Chief Executive Officer effective November 6, 2025. Mr. Akhavan was our Chief Executive Officers from 2023 to November 6, 2025. During 2022, our Chief Executive Officers were Mr. Dugan (until March 31, 2022) and Mr. Akhavan (beginning March 31, 2022). For 2021, our Chief Executive Officer was Mr. Dugan. |
(2) | Compensation Actually Paid (“CAP”) is calculated in accordance with Item 402(v) of Regulation S-K. The tables below set forth the adjustments made during each year presented in the table above to arrive at CAP to our “Named Executive Officers” or “NEOs” during each of the years in question. |
(3) | During 2025, our non-CEO NEOs consisted of Messrs. Gaske, Manson, Orban and Swieringa. During 2024, our non-CEO NEOs consisted of Messrs. Manson, Orban and Swieringa. During 2023, our non-CEO NEOs consisted of Messrs. Gaske, Manson, Morris and Ramaswamy. During 2022 and 2021, our non-CEO NEOs consisted of Messrs. Johnson, Kaul, Manson and Rayner. |
(4) | Total Shareholder Return (“TSR”) is the value of a $100 investment in our Class A common stock made on December 31, 2020, as of December 31 in each of 2025, 2024, 2023, 2022 and 2021, assuming reinvestment of all dividends. |
(5) | Represents the weighted TSR for our established peer group, weighted according to the respective companies’ stock market capitalization at the beginning of each period for which a return is indicated. The peer group used by the Company during 2025 and 2024 consists of AT&T Inc., Charter Communications, Inc., Comcast Corporation, T-Mobile US Inc., Viasat Inc. and Verizon Communications Inc. The peer group used by the Company during 2023 and 2022 consists of Gilat Satellite Networks Ltd., ViaSat, Inc., SES S.A. and Eutelsat Communications S.A. The peer group used by the Company in 2021 consisted of those companies, plus Intelsat S.A. Intelsat S.A. was removed from the peer group because it emerged from U.S. bankruptcy proceedings in February 2022 as a private company. Using the 2021 peer group, TSR would have been $68.21 in 2021 and $50.11 in 2022. Using the 2023 peer group, TSR would have been $71.10 in 2021, $54.36 in 2022, $49.55 in 2023 and $22.91 in 2024. |
(6) | The Company-Selected Measure for 2025 and prior years was Revenue, which is defined as Company total revenue. |
Mr. Ergen | Mr. Akhavan | Mr. Dugan | |||||||||||||||||||
Adjustments to Determine CAP for PEOs | | 2025 | 2025 | 2024 | | 2023 | | 2022 | | 2022 | | 2021 | |||||||||
Deduction for amounts reported under the “Stock Awards” column in the SCT | $ | — | $ | (6,026,318) | $ | (4,360,528) | $ | — | $ | (7,563,000) | $ | — | $ | — | |||||||
Deduction for amounts reported under the “Option Awards” column in the SCT | — | — | — | (5,312,980) | (6,134,800) | — | — | ||||||||||||||
Increase for fair value of awards granted during covered year that remain outstanding as of covered year end (Options) | — | — | — | — | 5,004,000 | — | — | ||||||||||||||
Increase for fair value of awards granted during covered year that vested during covered year | — | 28,605,275 | 28,605,275 | 5,451,225 | 4,760,700 | — | — | ||||||||||||||
Increase/deduction for change in fair value from prior year-end to covered year-end of awards granted prior to covered year that were outstanding and unvested as of year-end | 168,526,223 | 35,843,528 | 35,843,528 | 112,818 | — | — | — | ||||||||||||||
Increase/deduction for change in fair value from prior year-end to vesting date of awards granted prior to covered year that vested during covered year | - | 19,759,754 | 19,759,754 | 622,716 | — | (83,360) | 161,100 | ||||||||||||||
Deduction of fair value of awards granted prior to covered year that were forfeited during covered year | - | - | - | (834,000) | — | (44,720) | 42,420 | ||||||||||||||
Total Adjustments | $ | 168,526,223 | $ | 78,182,238 | $ | 79,848,028 | $ | 39,779 | $ | (3,933,100) | $ | (128,080) | $ | 203,520 | |||||||
Adjustments to Determine CAP for Non-PEO NEOs | | 2025 | 2024 | | 2023 | | 2022 | | 2021 | | ||||||
Deduction for amounts reported under the “Stock Awards” column in the Summary Compensation Table | $ | (2,585,000) | $ | (290,700) | $ | — | $ | — | $ | — | ||||||
Deduction for amounts reported under the “Option Awards” column in the Summary Compensation Table | (906,439) | (792,505) | — | (869,344) | — | |||||||||||
Increase for fair value of awards granted during year that remain outstanding as of covered year end (Options) | 8,474,433 | 1,266,016 | — | 467,569 | — | |||||||||||
Increase for fair value of awards granted during year that vested during covered year | 503,577 | - | — | — | — | |||||||||||
Increase/deduction for change in fair value from prior year-end to covered year-end of awards granted prior to covered year that were outstanding and unvested as of year-end | 11,856,671 | 2,053,195 | 47,383 | (62,520) | 161,100 | |||||||||||
Increase/deduction for change in fair value from prior year-end to vesting date of awards granted prior to covered year that vested during covered year | 999,770 | 90,557 | 13,086 | (33,540) | 55,714 | |||||||||||
Deduction of fair value of awards granted prior to covered year that were forfeited during covered year | — | - | — | (133,275) | — | |||||||||||
Total Adjustments | $ | 18,343,012 | $ | 2,326,563 | $ | 60,469 | $ | (631,110) | $ | 216,814 | ||||||
(1) | Mr. Ergen became our Chief Executive Officer effective November 6, 2025. Mr. Akhavan was our Chief Executive Officers from 2023 to November 6, 2025. During 2022, our Chief Executive Officers were Mr. Dugan (until March 31, 2022) and Mr. Akhavan (beginning March 31, 2022). For 2021, our Chief Executive Officer was Mr. Dugan. |
(3) | During 2025, our non-CEO NEOs consisted of Messrs. Gaske, Manson, Orban and Swieringa. During 2024, our non-CEO NEOs consisted of Messrs. Manson, Orban and Swieringa. During 2023, our non-CEO NEOs consisted of Messrs. Gaske, Manson, Morris and Ramaswamy. During 2022 and 2021, our non-CEO NEOs consisted of Messrs. Johnson, Kaul, Manson and Rayner. |
(5) | Represents the weighted TSR for our established peer group, weighted according to the respective companies’ stock market capitalization at the beginning of each period for which a return is indicated. The peer group used by the Company during 2025 and 2024 consists of AT&T Inc., Charter Communications, Inc., Comcast Corporation, T-Mobile US Inc., Viasat Inc. and Verizon Communications Inc. The peer group used by the Company during 2023 and 2022 consists of Gilat Satellite Networks Ltd., ViaSat, Inc., SES S.A. and Eutelsat Communications S.A. The peer group used by the Company in 2021 consisted of those companies, plus Intelsat S.A. Intelsat S.A. was removed from the peer group because it emerged from U.S. bankruptcy proceedings in February 2022 as a private company. Using the 2021 peer group, TSR would have been $68.21 in 2021 and $50.11 in 2022. Using the 2023 peer group, TSR would have been $71.10 in 2021, $54.36 in 2022, $49.55 in 2023 and $22.91 in 2024. |
Mr. Ergen | Mr. Akhavan | Mr. Dugan | |||||||||||||||||||
Adjustments to Determine CAP for PEOs | | 2025 | 2025 | 2024 | | 2023 | | 2022 | | 2022 | | 2021 | |||||||||
Deduction for amounts reported under the “Stock Awards” column in the SCT | $ | — | $ | (6,026,318) | $ | (4,360,528) | $ | — | $ | (7,563,000) | $ | — | $ | — | |||||||
Deduction for amounts reported under the “Option Awards” column in the SCT | — | — | — | (5,312,980) | (6,134,800) | — | — | ||||||||||||||
Increase for fair value of awards granted during covered year that remain outstanding as of covered year end (Options) | — | — | — | — | 5,004,000 | — | — | ||||||||||||||
Increase for fair value of awards granted during covered year that vested during covered year | — | 28,605,275 | 28,605,275 | 5,451,225 | 4,760,700 | — | — | ||||||||||||||
Increase/deduction for change in fair value from prior year-end to covered year-end of awards granted prior to covered year that were outstanding and unvested as of year-end | 168,526,223 | 35,843,528 | 35,843,528 | 112,818 | — | — | — | ||||||||||||||
Increase/deduction for change in fair value from prior year-end to vesting date of awards granted prior to covered year that vested during covered year | - | 19,759,754 | 19,759,754 | 622,716 | — | (83,360) | 161,100 | ||||||||||||||
Deduction of fair value of awards granted prior to covered year that were forfeited during covered year | - | - | - | (834,000) | — | (44,720) | 42,420 | ||||||||||||||
Total Adjustments | $ | 168,526,223 | $ | 78,182,238 | $ | 79,848,028 | $ | 39,779 | $ | (3,933,100) | $ | (128,080) | $ | 203,520 | |||||||
Adjustments to Determine CAP for Non-PEO NEOs | | 2025 | 2024 | | 2023 | | 2022 | | 2021 | | ||||||
Deduction for amounts reported under the “Stock Awards” column in the Summary Compensation Table | $ | (2,585,000) | $ | (290,700) | $ | — | $ | — | $ | — | ||||||
Deduction for amounts reported under the “Option Awards” column in the Summary Compensation Table | (906,439) | (792,505) | — | (869,344) | — | |||||||||||
Increase for fair value of awards granted during year that remain outstanding as of covered year end (Options) | 8,474,433 | 1,266,016 | — | 467,569 | — | |||||||||||
Increase for fair value of awards granted during year that vested during covered year | 503,577 | - | — | — | — | |||||||||||
Increase/deduction for change in fair value from prior year-end to covered year-end of awards granted prior to covered year that were outstanding and unvested as of year-end | 11,856,671 | 2,053,195 | 47,383 | (62,520) | 161,100 | |||||||||||
Increase/deduction for change in fair value from prior year-end to vesting date of awards granted prior to covered year that vested during covered year | 999,770 | 90,557 | 13,086 | (33,540) | 55,714 | |||||||||||
Deduction of fair value of awards granted prior to covered year that were forfeited during covered year | — | - | — | (133,275) | — | |||||||||||
Total Adjustments | $ | 18,343,012 | $ | 2,326,563 | $ | 60,469 | $ | (631,110) | $ | 216,814 | ||||||
Tabular List of Most Important Financial Performance Measures
The following table presents the performance measures the Compensation Committee and Board of Directors consider to have been the most important in its executive compensation program linking pay to performance for 2025. The role of each of these performance measures on our NEOs’ compensation is discussed in the “Compensation Discussion and Analysis” section.
Performance Measures |
Free Cash Flow |
Revenue |
Pay TV and/or Wireless Subscribers |
North America Consumer Creation Multiple |
(6) | The Company-Selected Measure for 2025 and prior years was Revenue, which is defined as Company total revenue. |