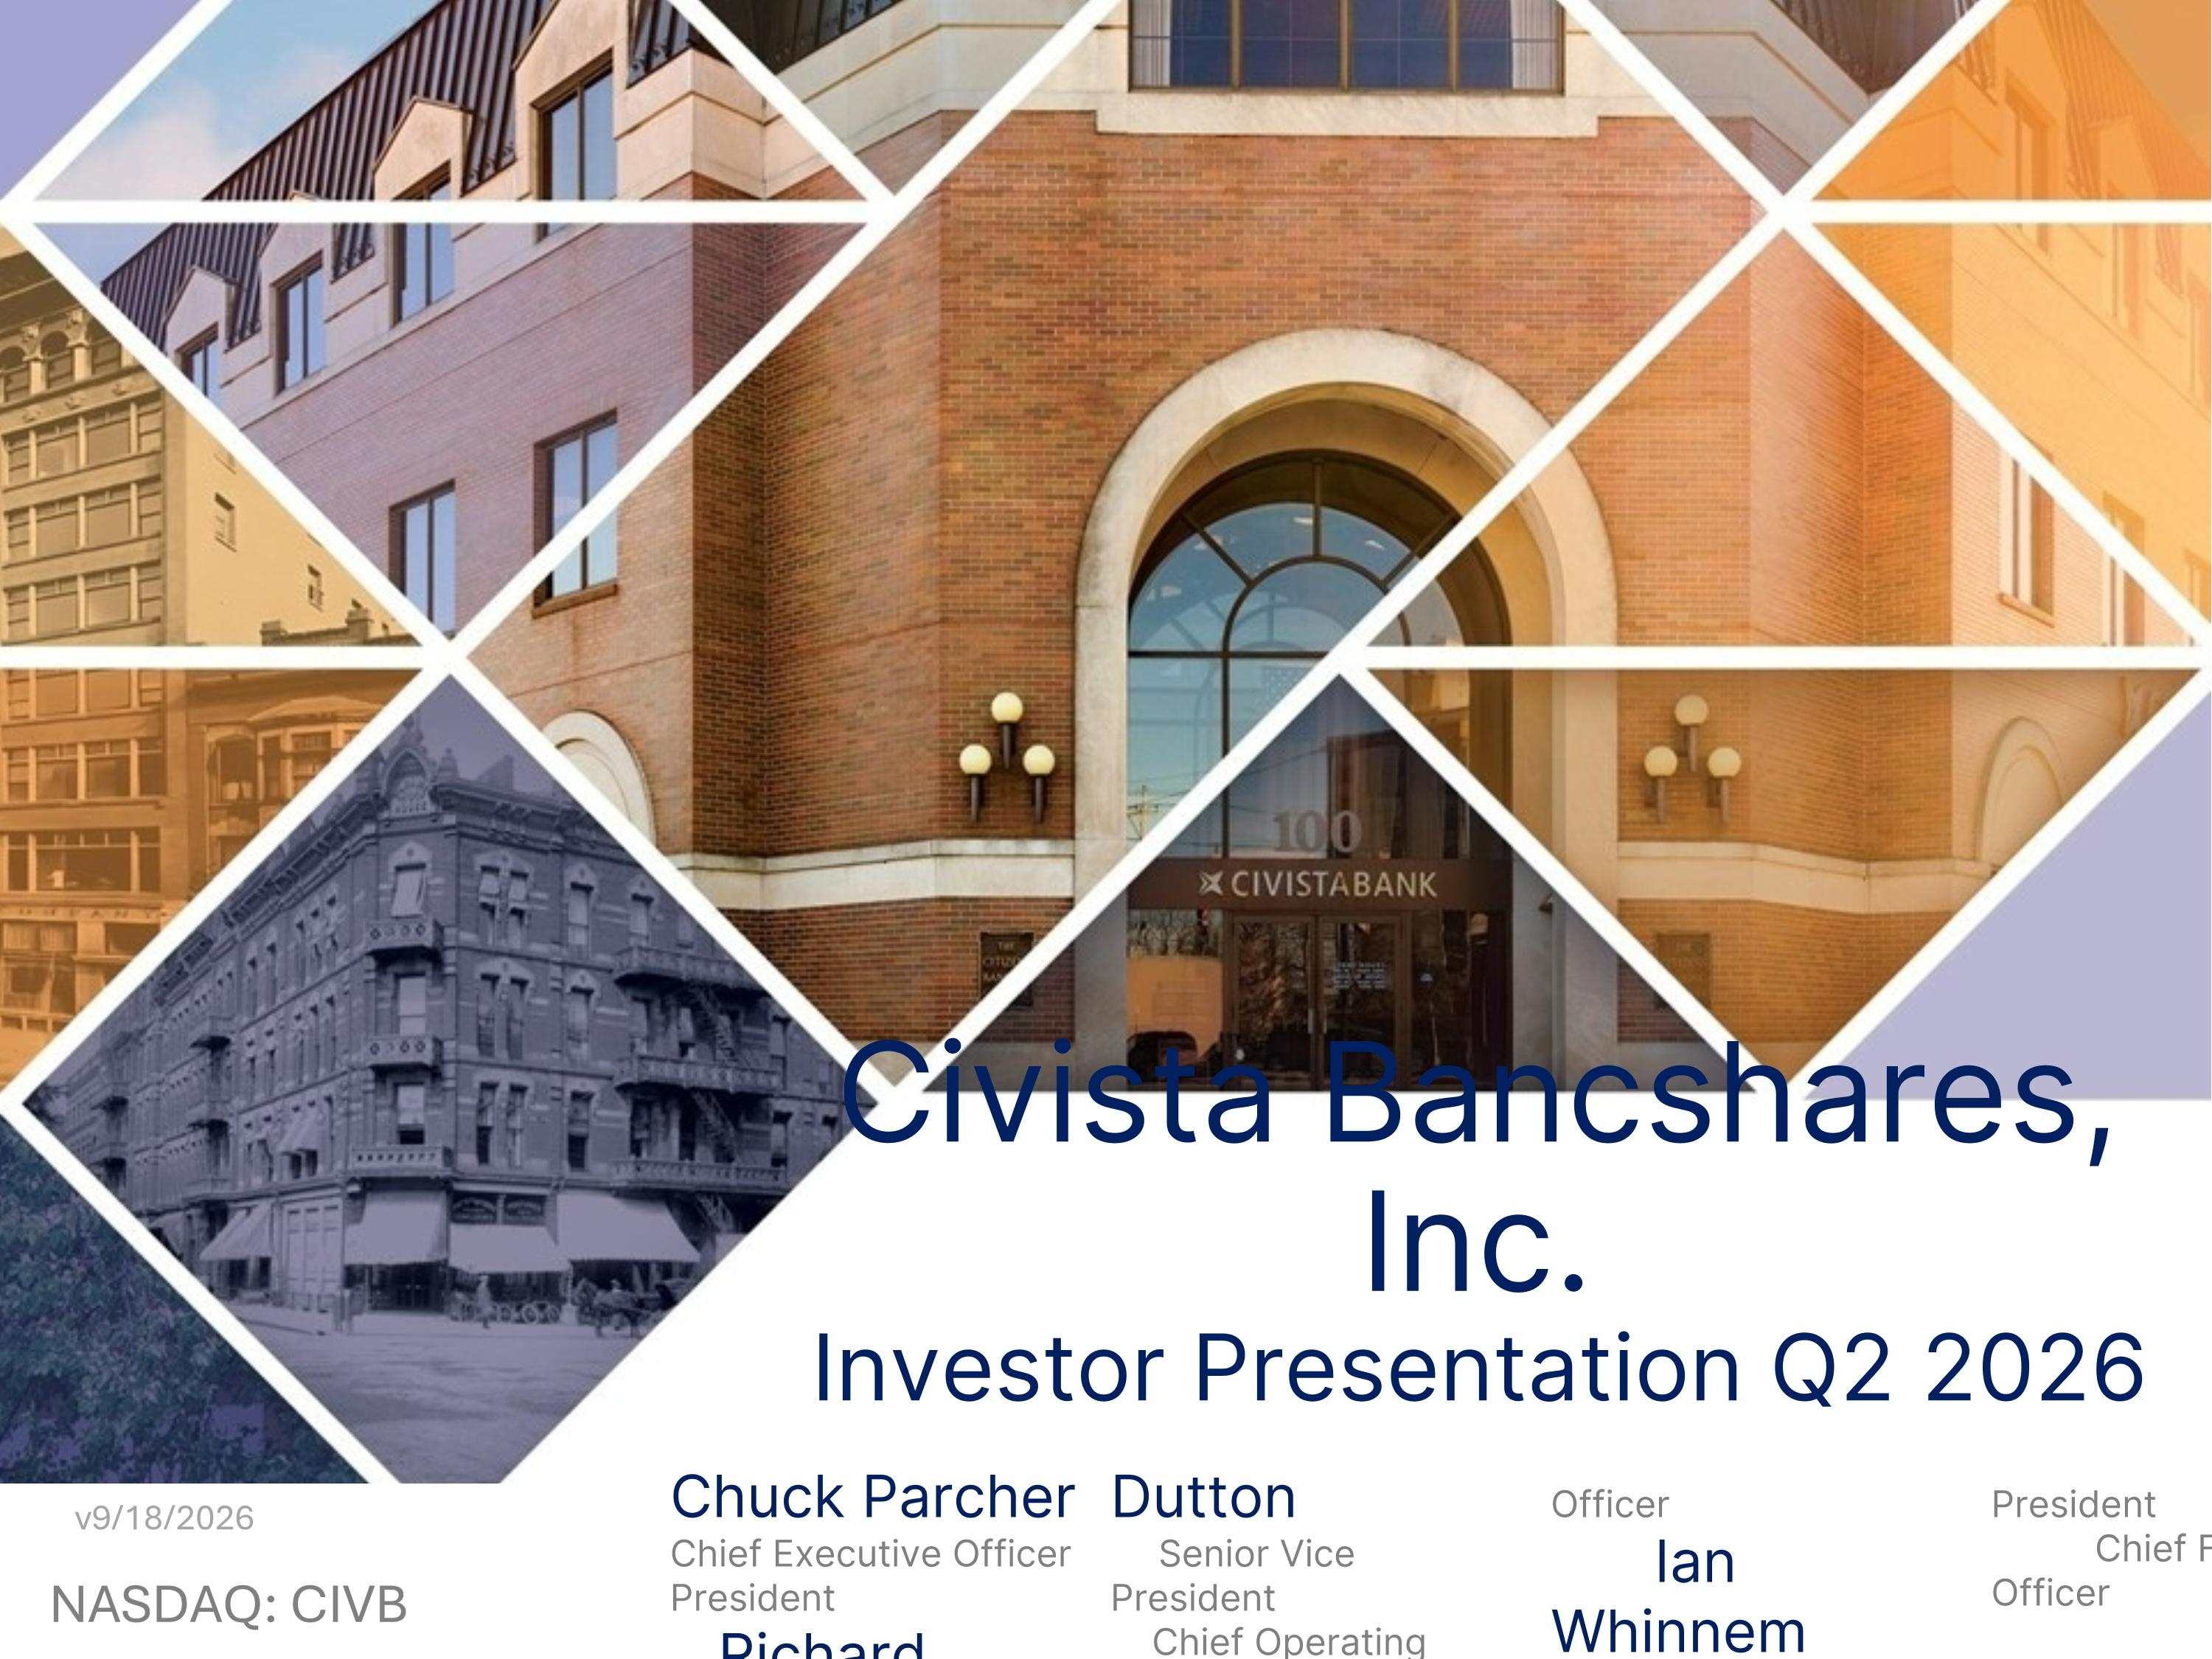
Civista Bancshares, Inc. Investor Presentation Q2 2026 Chuck Parcher Chief Executive Officer President Richard Dutton Senior Vice President Chief Operating Officer Ian Whinnem Senior Vice President Chief Financial Officer v9/18/2026
Forward-Looking Statements. This presentation may contain “forward-looking statements” within the meaning of Section 21E of the Securities Exchange Act of 1934, as amended. Forward-looking statements express management’s current expectations, estimates or projections of future events, results or long-term goals, and are generally identifiable by the use of words such as “believe,” “expect,” “anticipate,” “plan,” “intend,” “estimate,” “may,” “will,” “would,” “could,” “should” or other similar expressions. All statements in this material speak only as of the date they are made, and we undertake no obligation to update any statement except to the extent required by law. Forward-looking statements are not guarantees of performance and are inherently subject to known and unknown risks, uncertainties and assumptions that are difficult to predict and could cause actual results or performance to differ materially from those expressed in or implied by the forward-looking statements. Factors that could cause actual results or performance to differ from those discussed in the forward-looking statements include the risks identified from time to time in our public filings with the SEC, including those risks identified in “Item 1A. Risk Factors” of Part I of the Company’s Annual Report on Form 10-K for the fiscal year ended December 31, 2025, as supplemented by any additional risks identified in the Company’s subsequent Form 10-Qs. These risks and uncertainties should be considered in evaluating forward-looking statements and undue reliance should not be placed on such statements. Use of Non-GAAP Financial Measures. This presentation contains certain financial information determined by methods other than in accordance with accounting principles generally accepted in the United States (“GAAP”). These non-GAAP financial measures include “Tangible Book Value per Share” , “Tangible Common Equity to Tangible Assets” and “Efficiency Ratio”. The Company believes that these non-GAAP financial measures provide both management and investors a more complete understanding of the Company’s profitability. These non-GAAP financial measures are supplemental and are not a substitute for any analysis based on GAAP Measures. Not all companies use the same calculation of these measures; therefore, this presentation may not be comparable to other similarly titled measures as presented by other companies. Reconciliations of these non-GAAP measures are provided in the Appendix section of this presentation. Sources of Information: Company Management and S&P Global Market Intelligence Disclaimer
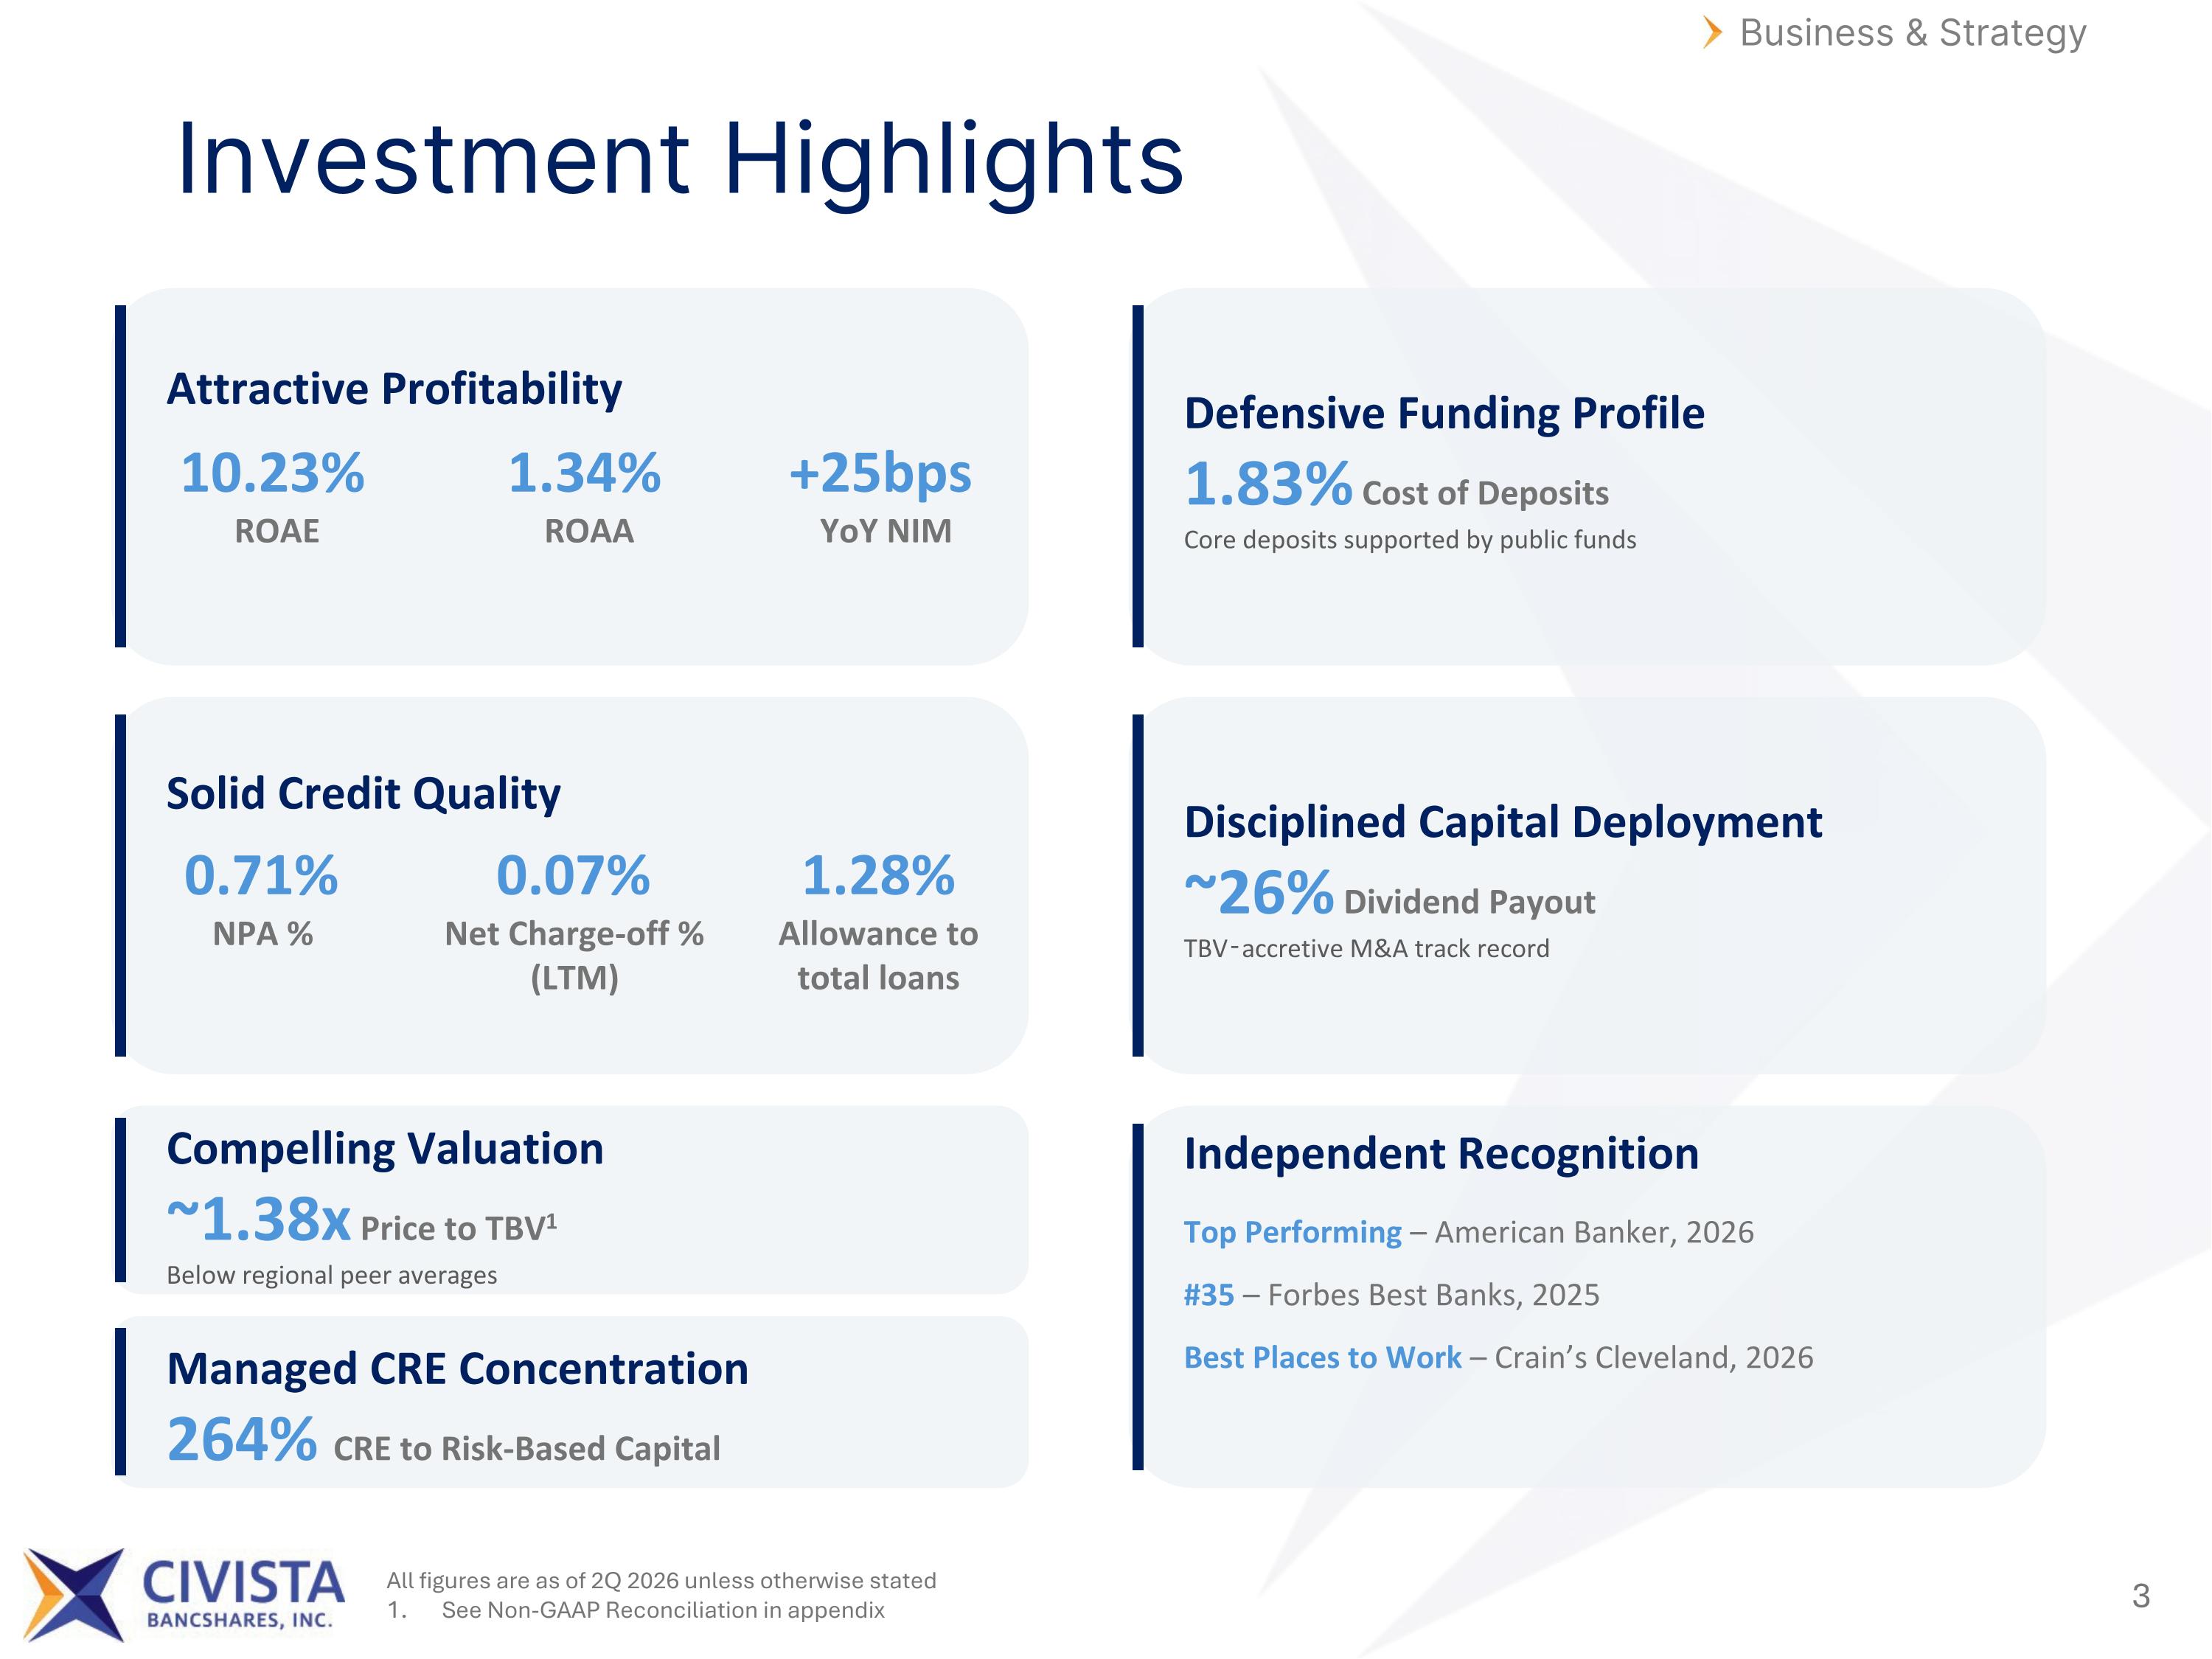
Investment Highlights Business & Strategy Defensive Funding Profile 1.83% Cost of Deposits Core deposits supported by public funds Solid Credit Quality 0.71% NPA % 0.07% Net Charge-off % (LTM) 1.28% Allowance to total loans Disciplined Capital Deployment ~26% Dividend Payout TBV‑accretive M&A track record Compelling Valuation ~1.38x Price to TBV1 Below regional peer averages Managed CRE Concentration 264% CRE to Risk-Based Capital Independent Recognition Top Performing – American Banker, 2026 #35 – Forbes Best Banks, 2025 Best Places to Work – Crain’s Cleveland, 2026 Attractive Profitability 10.23% ROAE 1.34% ROAA +25bps YoY NIM All figures are as of 2Q 2026 unless otherwise stated See Non-GAAP Reconciliation in appendix
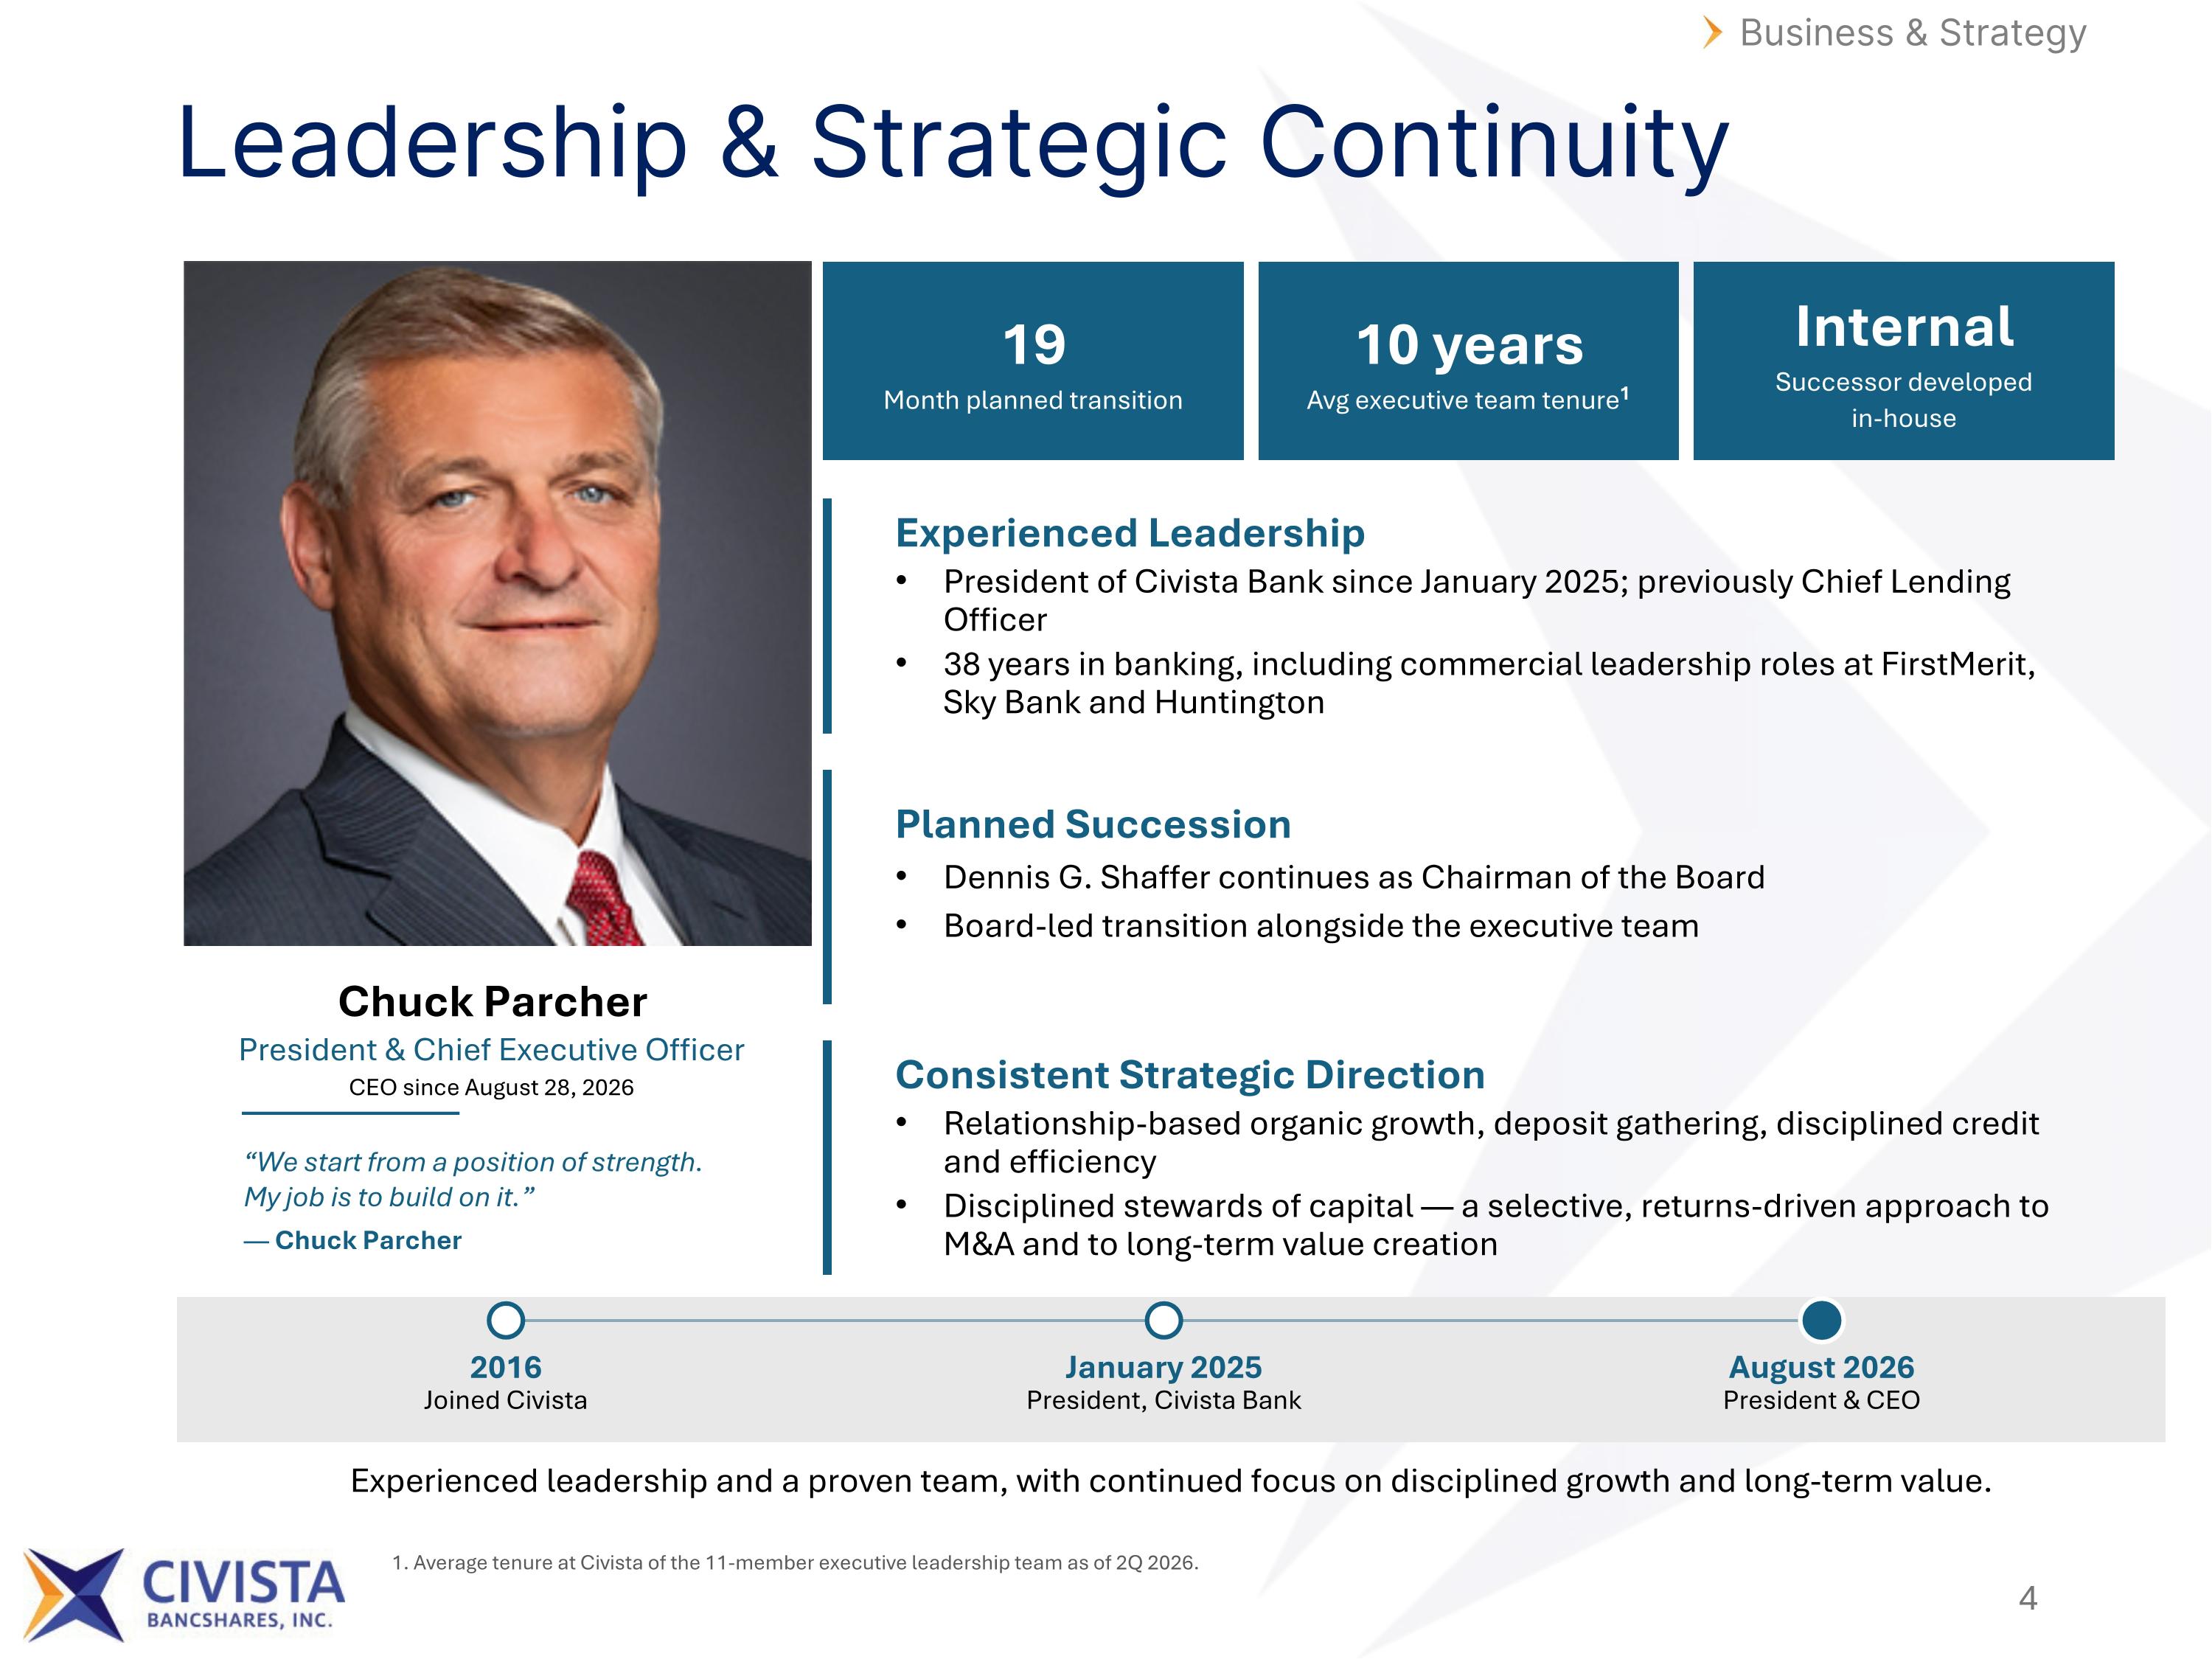
Leadership & Strategic Continuity Business & Strategy Chuck Parcher President & Chief Executive Officer CEO since August 28, 2026 19 Month planned transition 10 years Avg executive team tenure1 Internal Successor developed in-house Experienced Leadership President of Civista Bank since January 2025; previously Chief Lending Officer 38 years in banking, including commercial leadership roles at FirstMerit, Sky Bank and Huntington Planned Succession Dennis G. Shaffer continues as Chairman of the Board Board-led transition alongside the executive team Consistent Strategic Direction Relationship-based organic growth, deposit gathering, disciplined credit and efficiency Disciplined stewards of capital — a selective, returns-driven approach to M&A and to long-term value creation 2016 Joined Civista January 2025 President, Civista Bank August 2026 President & CEO 1. Average tenure at Civista of the 11-member executive leadership team as of 2Q 2026. Experienced leadership and a proven team, with continued focus on disciplined growth and long-term value. “We start from a position of strength. My job is to build on it.” — Chuck Parcher
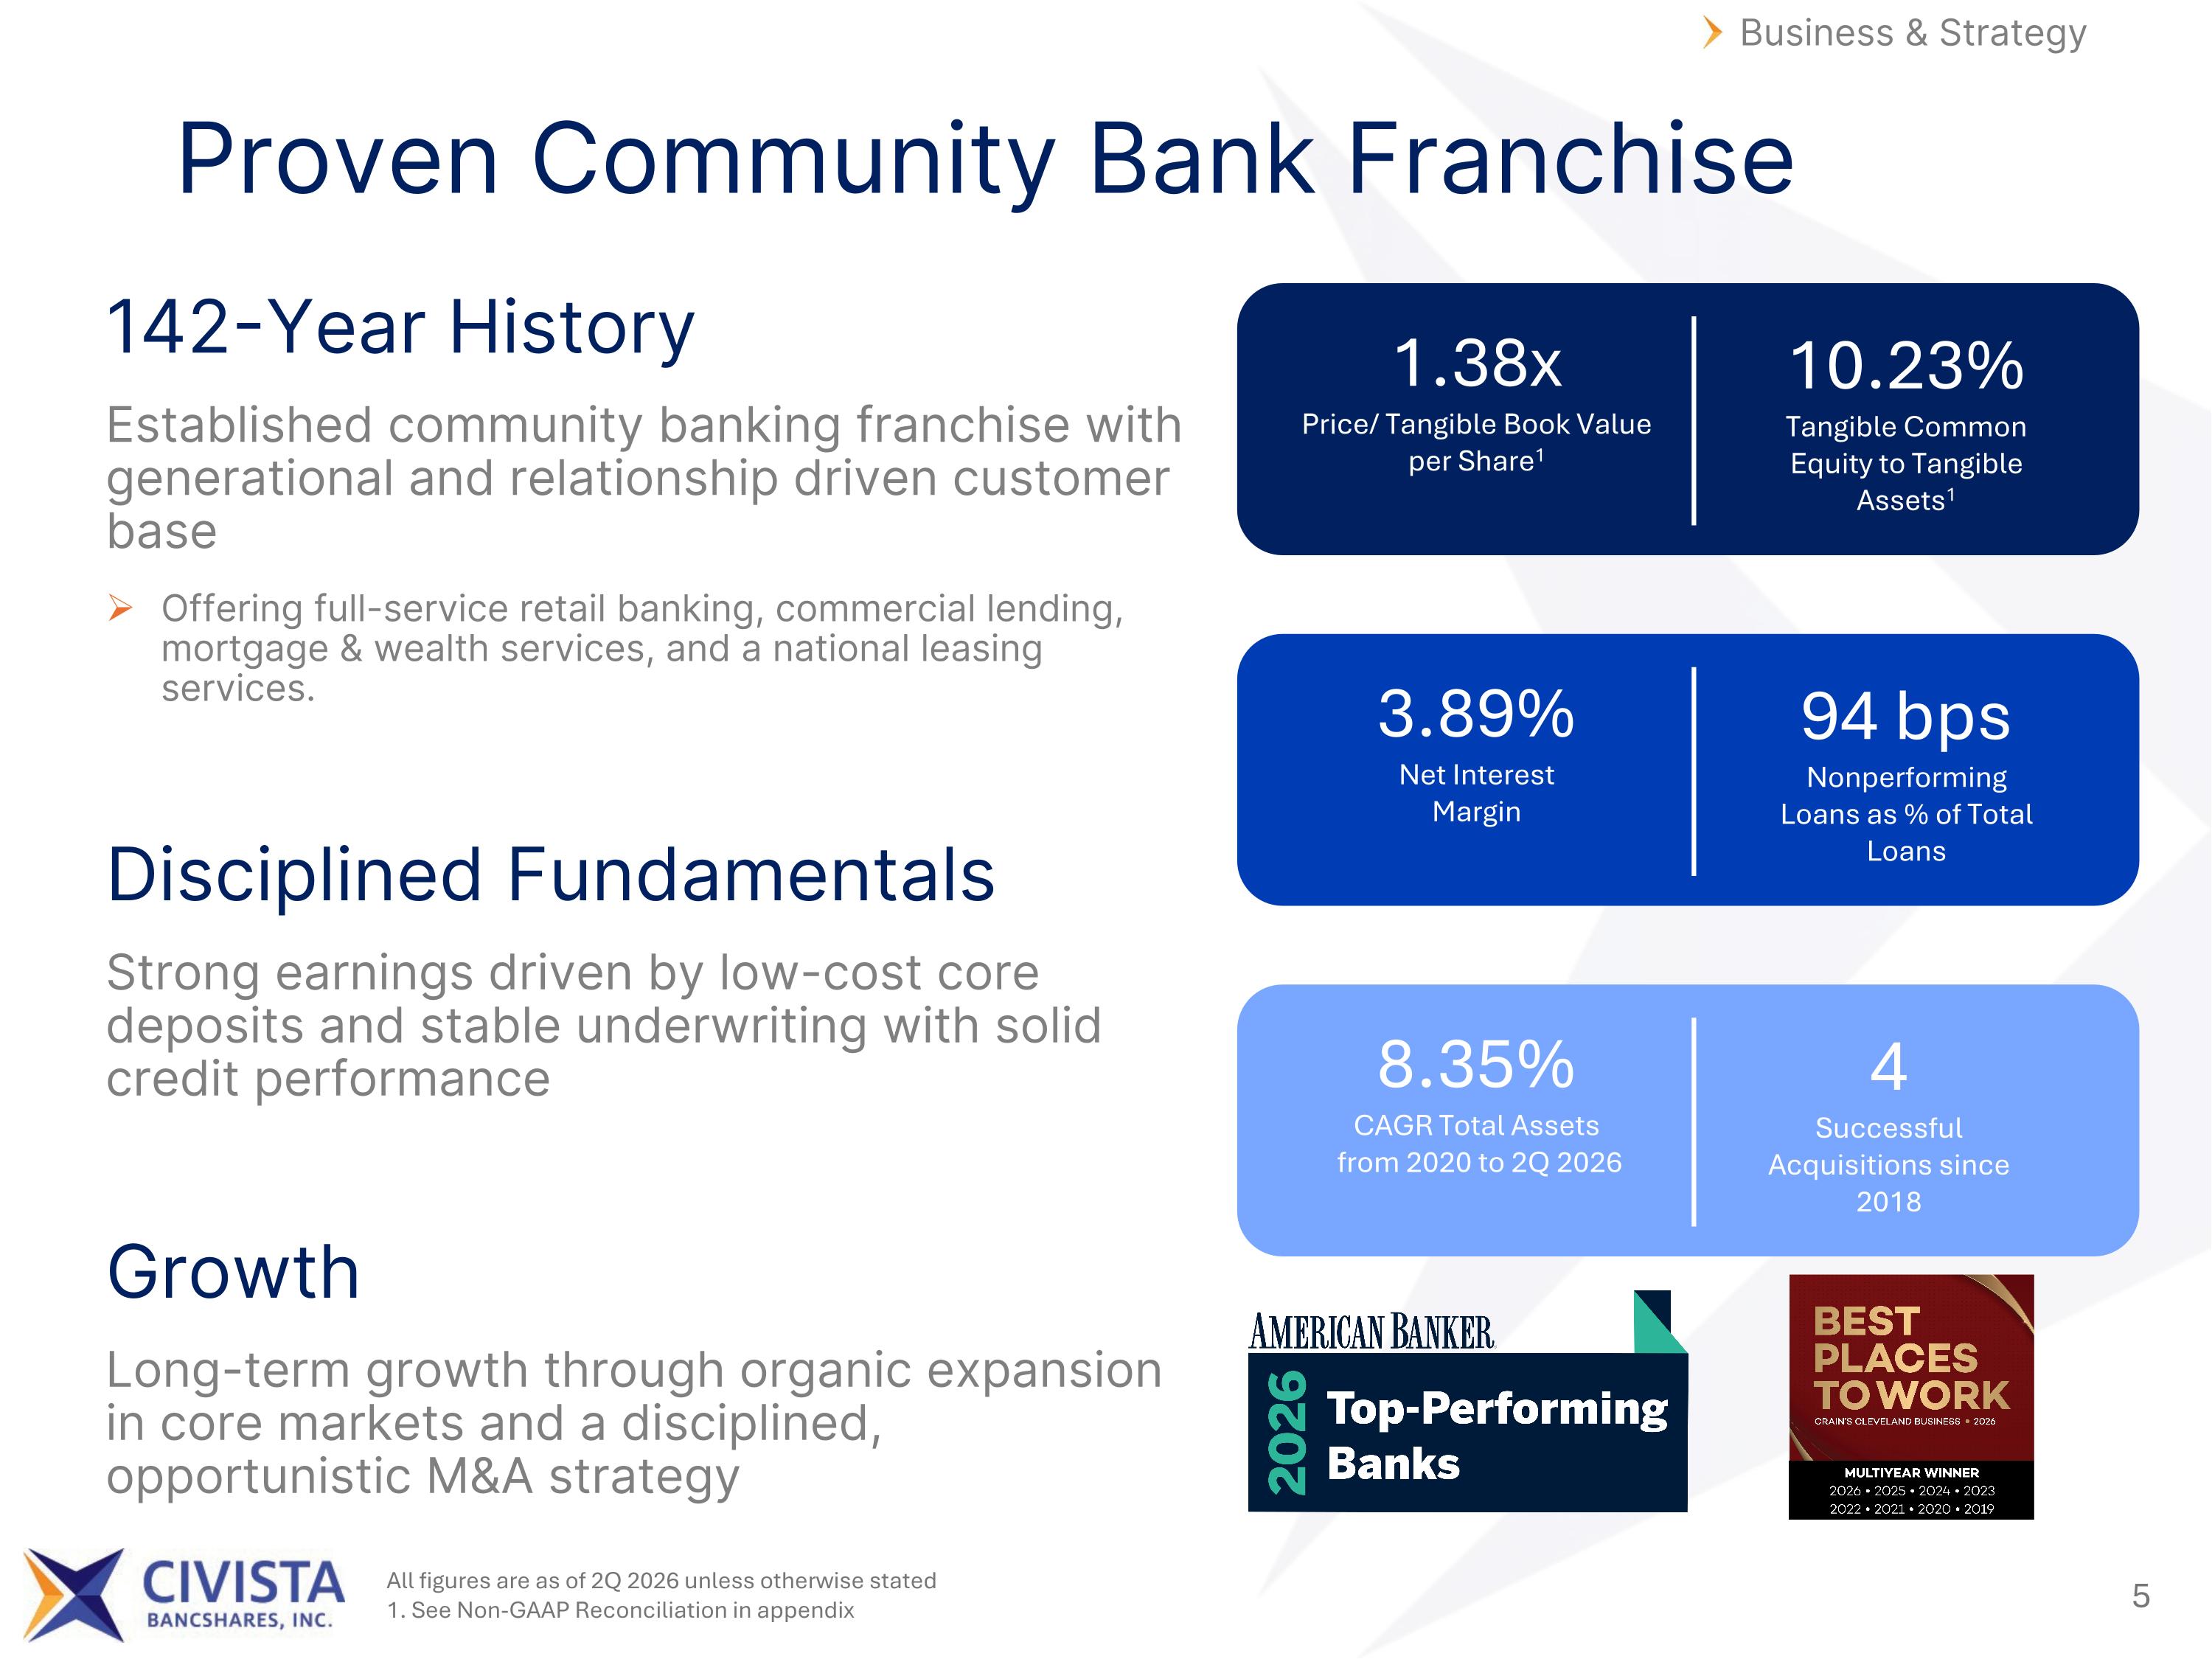
Proven Community Bank Franchise Business & Strategy 142-Year History Established community banking franchise with generational and relationship driven customer base Offering full-service retail banking, commercial lending, mortgage & wealth services, and a national leasing services. Disciplined Fundamentals Strong earnings driven by low-cost core deposits and stable underwriting with solid credit performance Growth Long-term growth through organic expansion in core markets and a disciplined, opportunistic M&A strategy 8.35% CAGR Total Assets from 2020 to 2Q 2026 4 Successful Acquisitions since 2018 All figures are as of 2Q 2026 unless otherwise stated 1. See Non-GAAP Reconciliation in appendix 3.89% Net Interest Margin 94 bps Nonperforming Loans as % of Total Loans 1.38x Price/ Tangible Book Value per Share1 10.23% Tangible Common Equity to Tangible Assets1
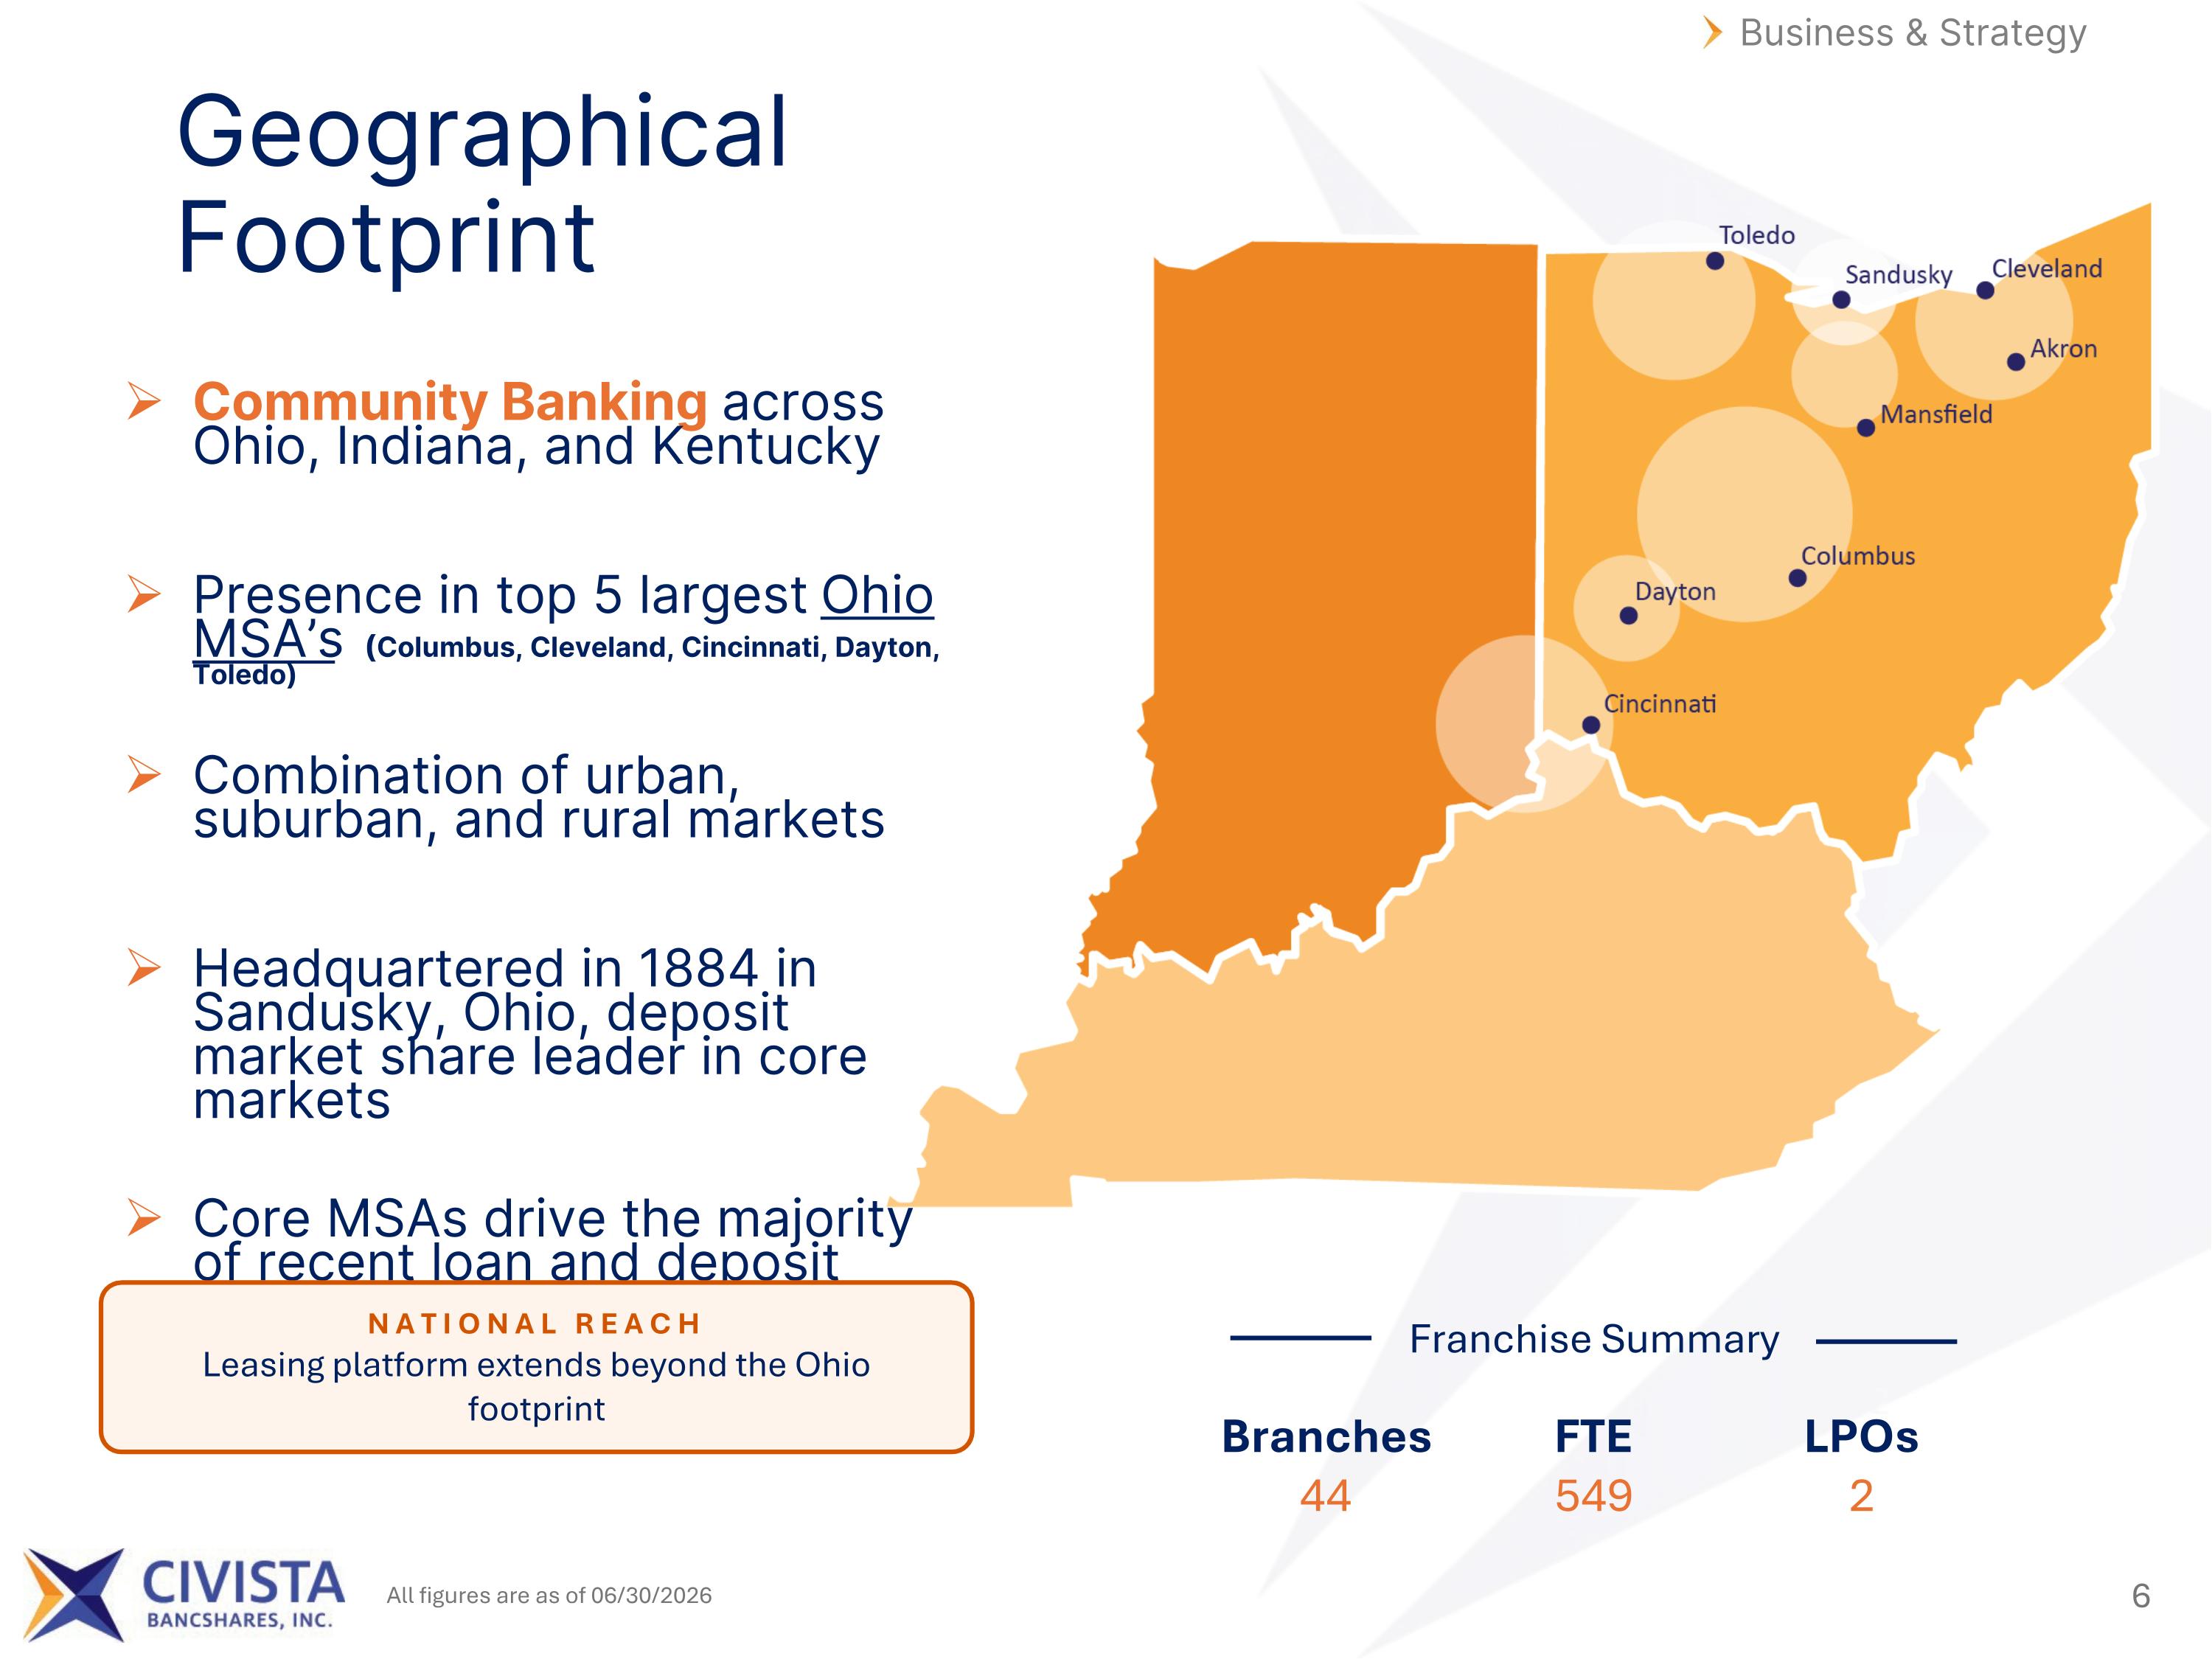
Business & Strategy Geographical Footprint Community Banking across Ohio, Indiana, and Kentucky Presence in top 5 largest Ohio MSA’s (Columbus, Cleveland, Cincinnati, Dayton, Toledo) Combination of urban, suburban, and rural markets Headquartered in 1884 in Sandusky, Ohio, deposit market share leader in core markets Core MSAs drive the majority of recent loan and deposit growth Franchise Summary Branches 44 FTE 549 LPOs 2 NATIONAL REACH Leasing platform extends beyond the Ohio footprint All figures are as of 06/30/2026
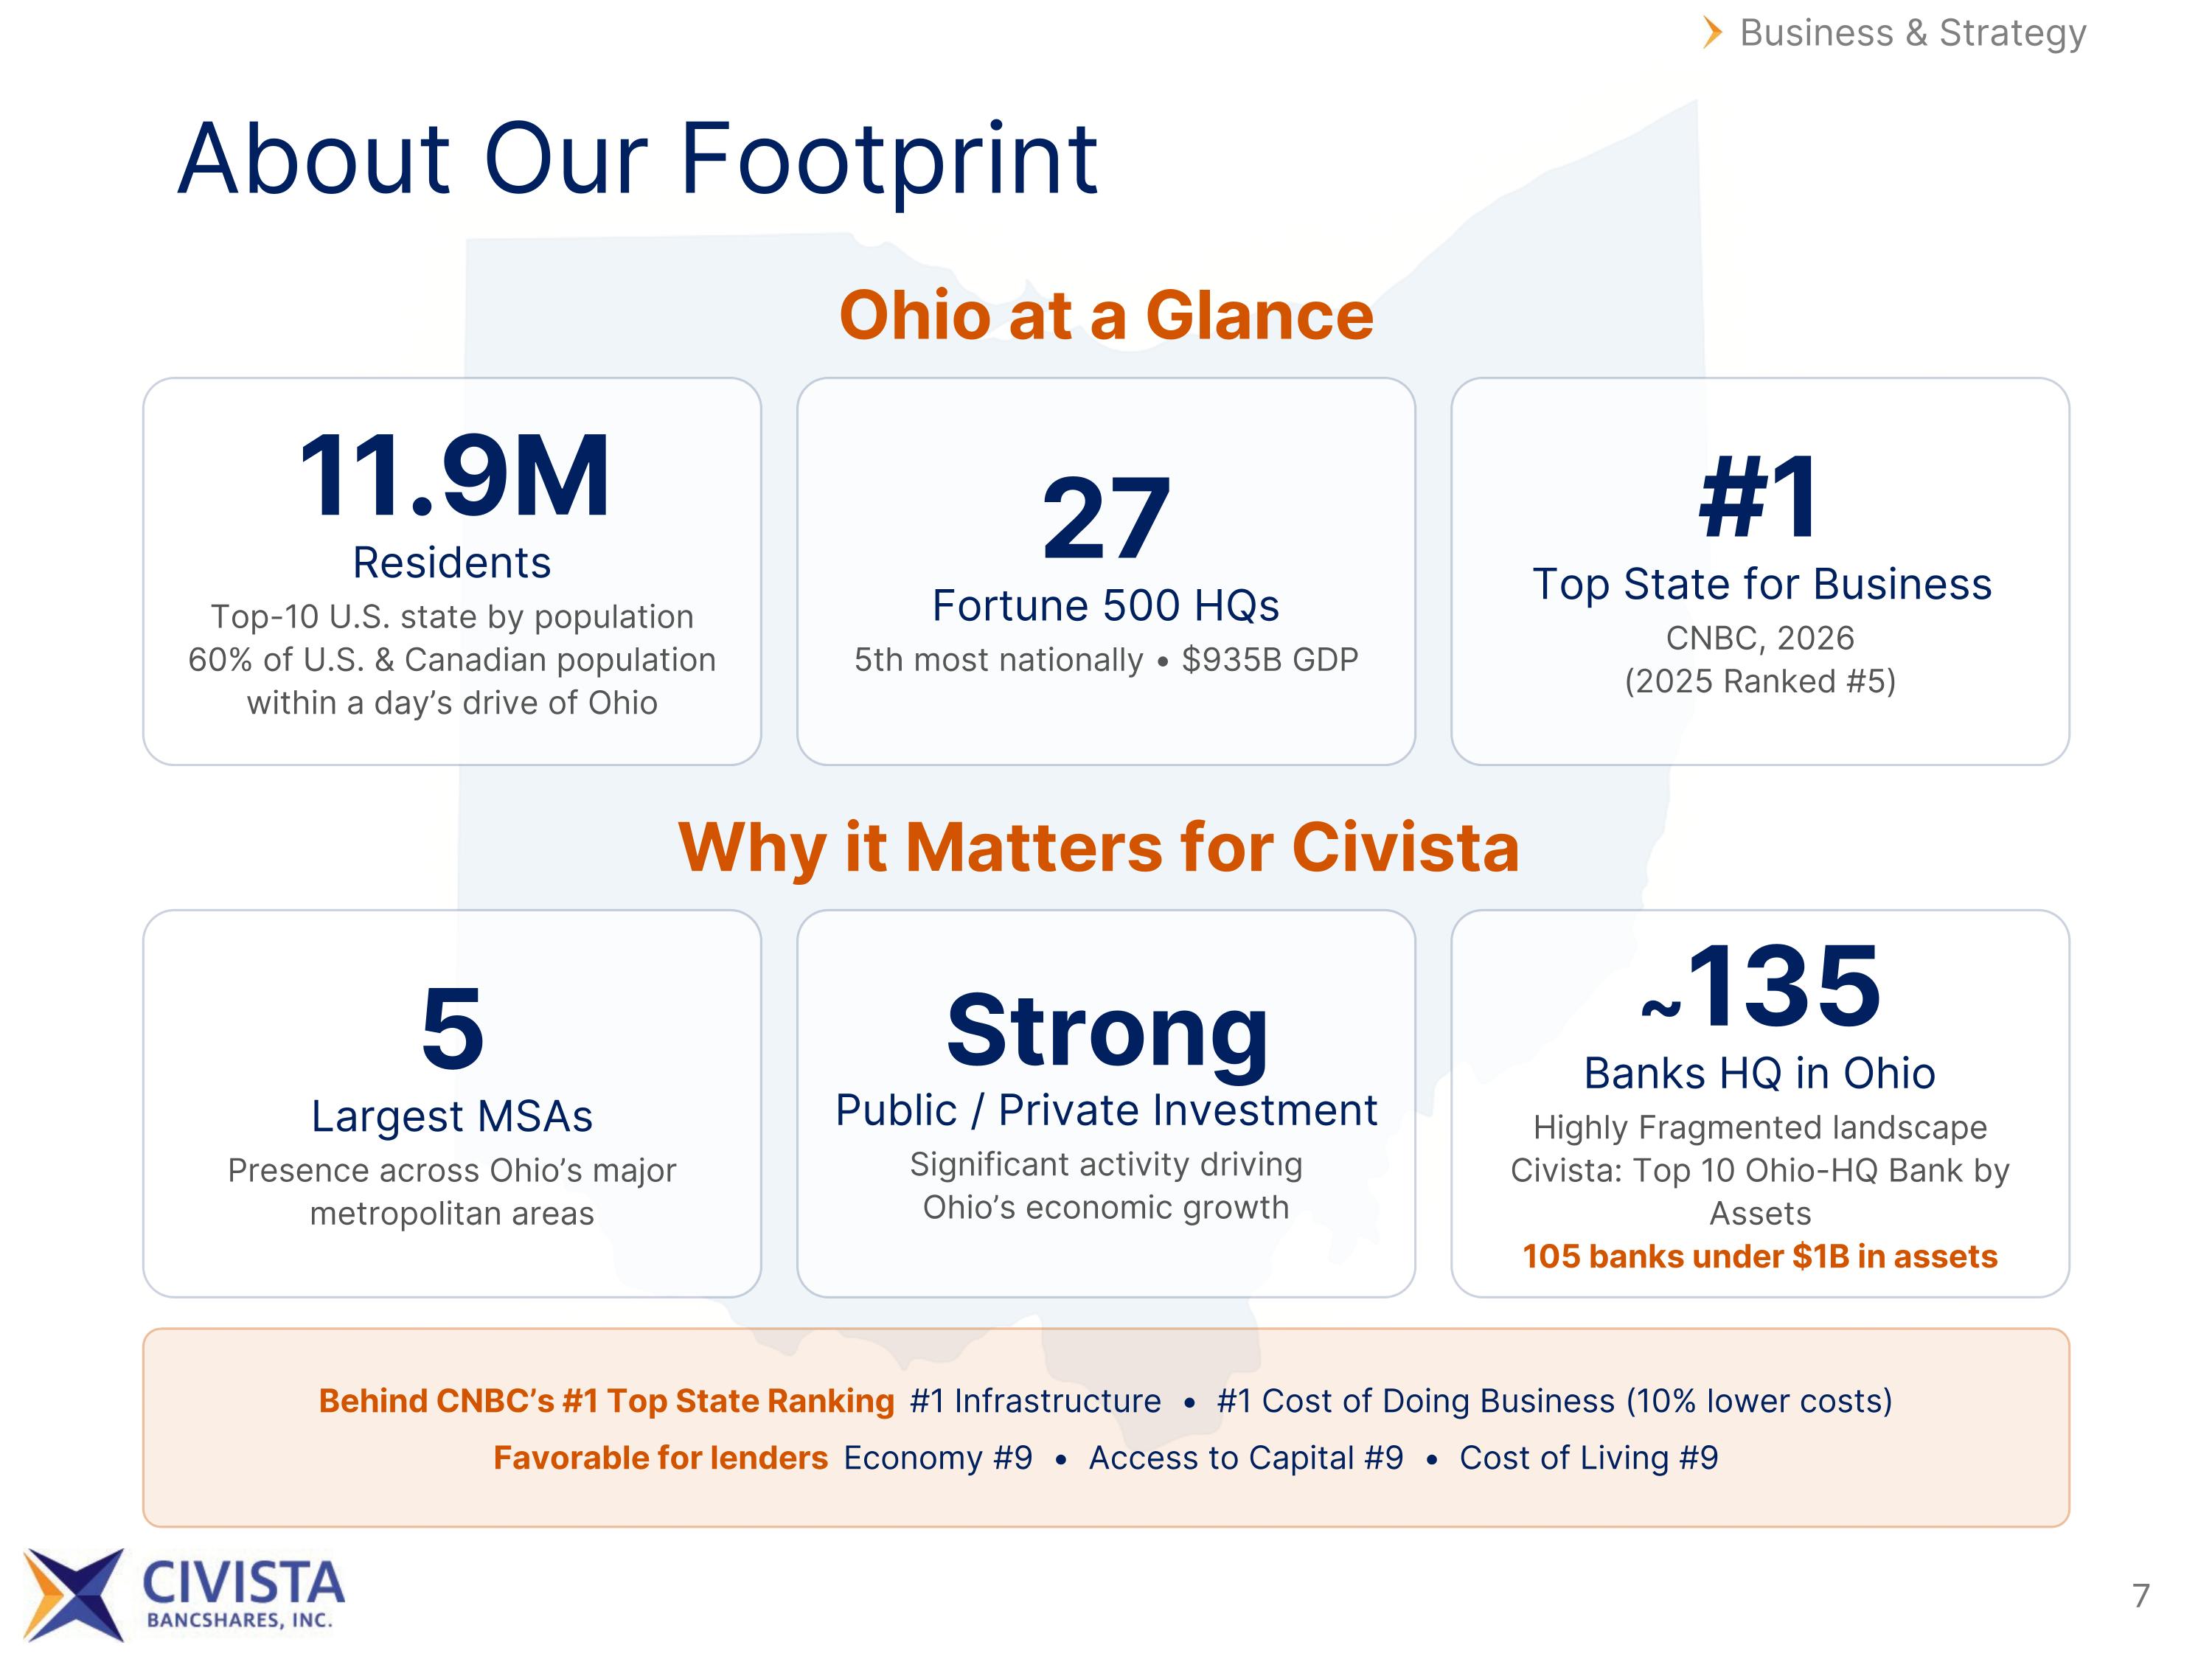
About Our Footprint Business & Strategy Ohio at a Glance 11.9M Residents Top-10 U.S. state by population 60% of U.S. & Canadian population within a day’s drive of Ohio 27 Fortune 500 HQs 5th most nationally • $935B GDP #1 Top State for Business CNBC, 2026 (2025 Ranked #5) Why it Matters for Civista 5 Largest MSAs Presence across Ohio’s major metropolitan areas Strong Public / Private Investment Significant activity driving Ohio’s economic growth ~135 Banks HQ in Ohio Highly Fragmented landscape Civista: Top 10 Ohio-HQ Bank by Assets 105 banks under $1B in assets Behind CNBC’s #1 Top State Ranking #1 Infrastructure • #1 Cost of Doing Business (10% lower costs) Favorable for lenders Economy #9 • Access to Capital #9 • Cost of Living #9
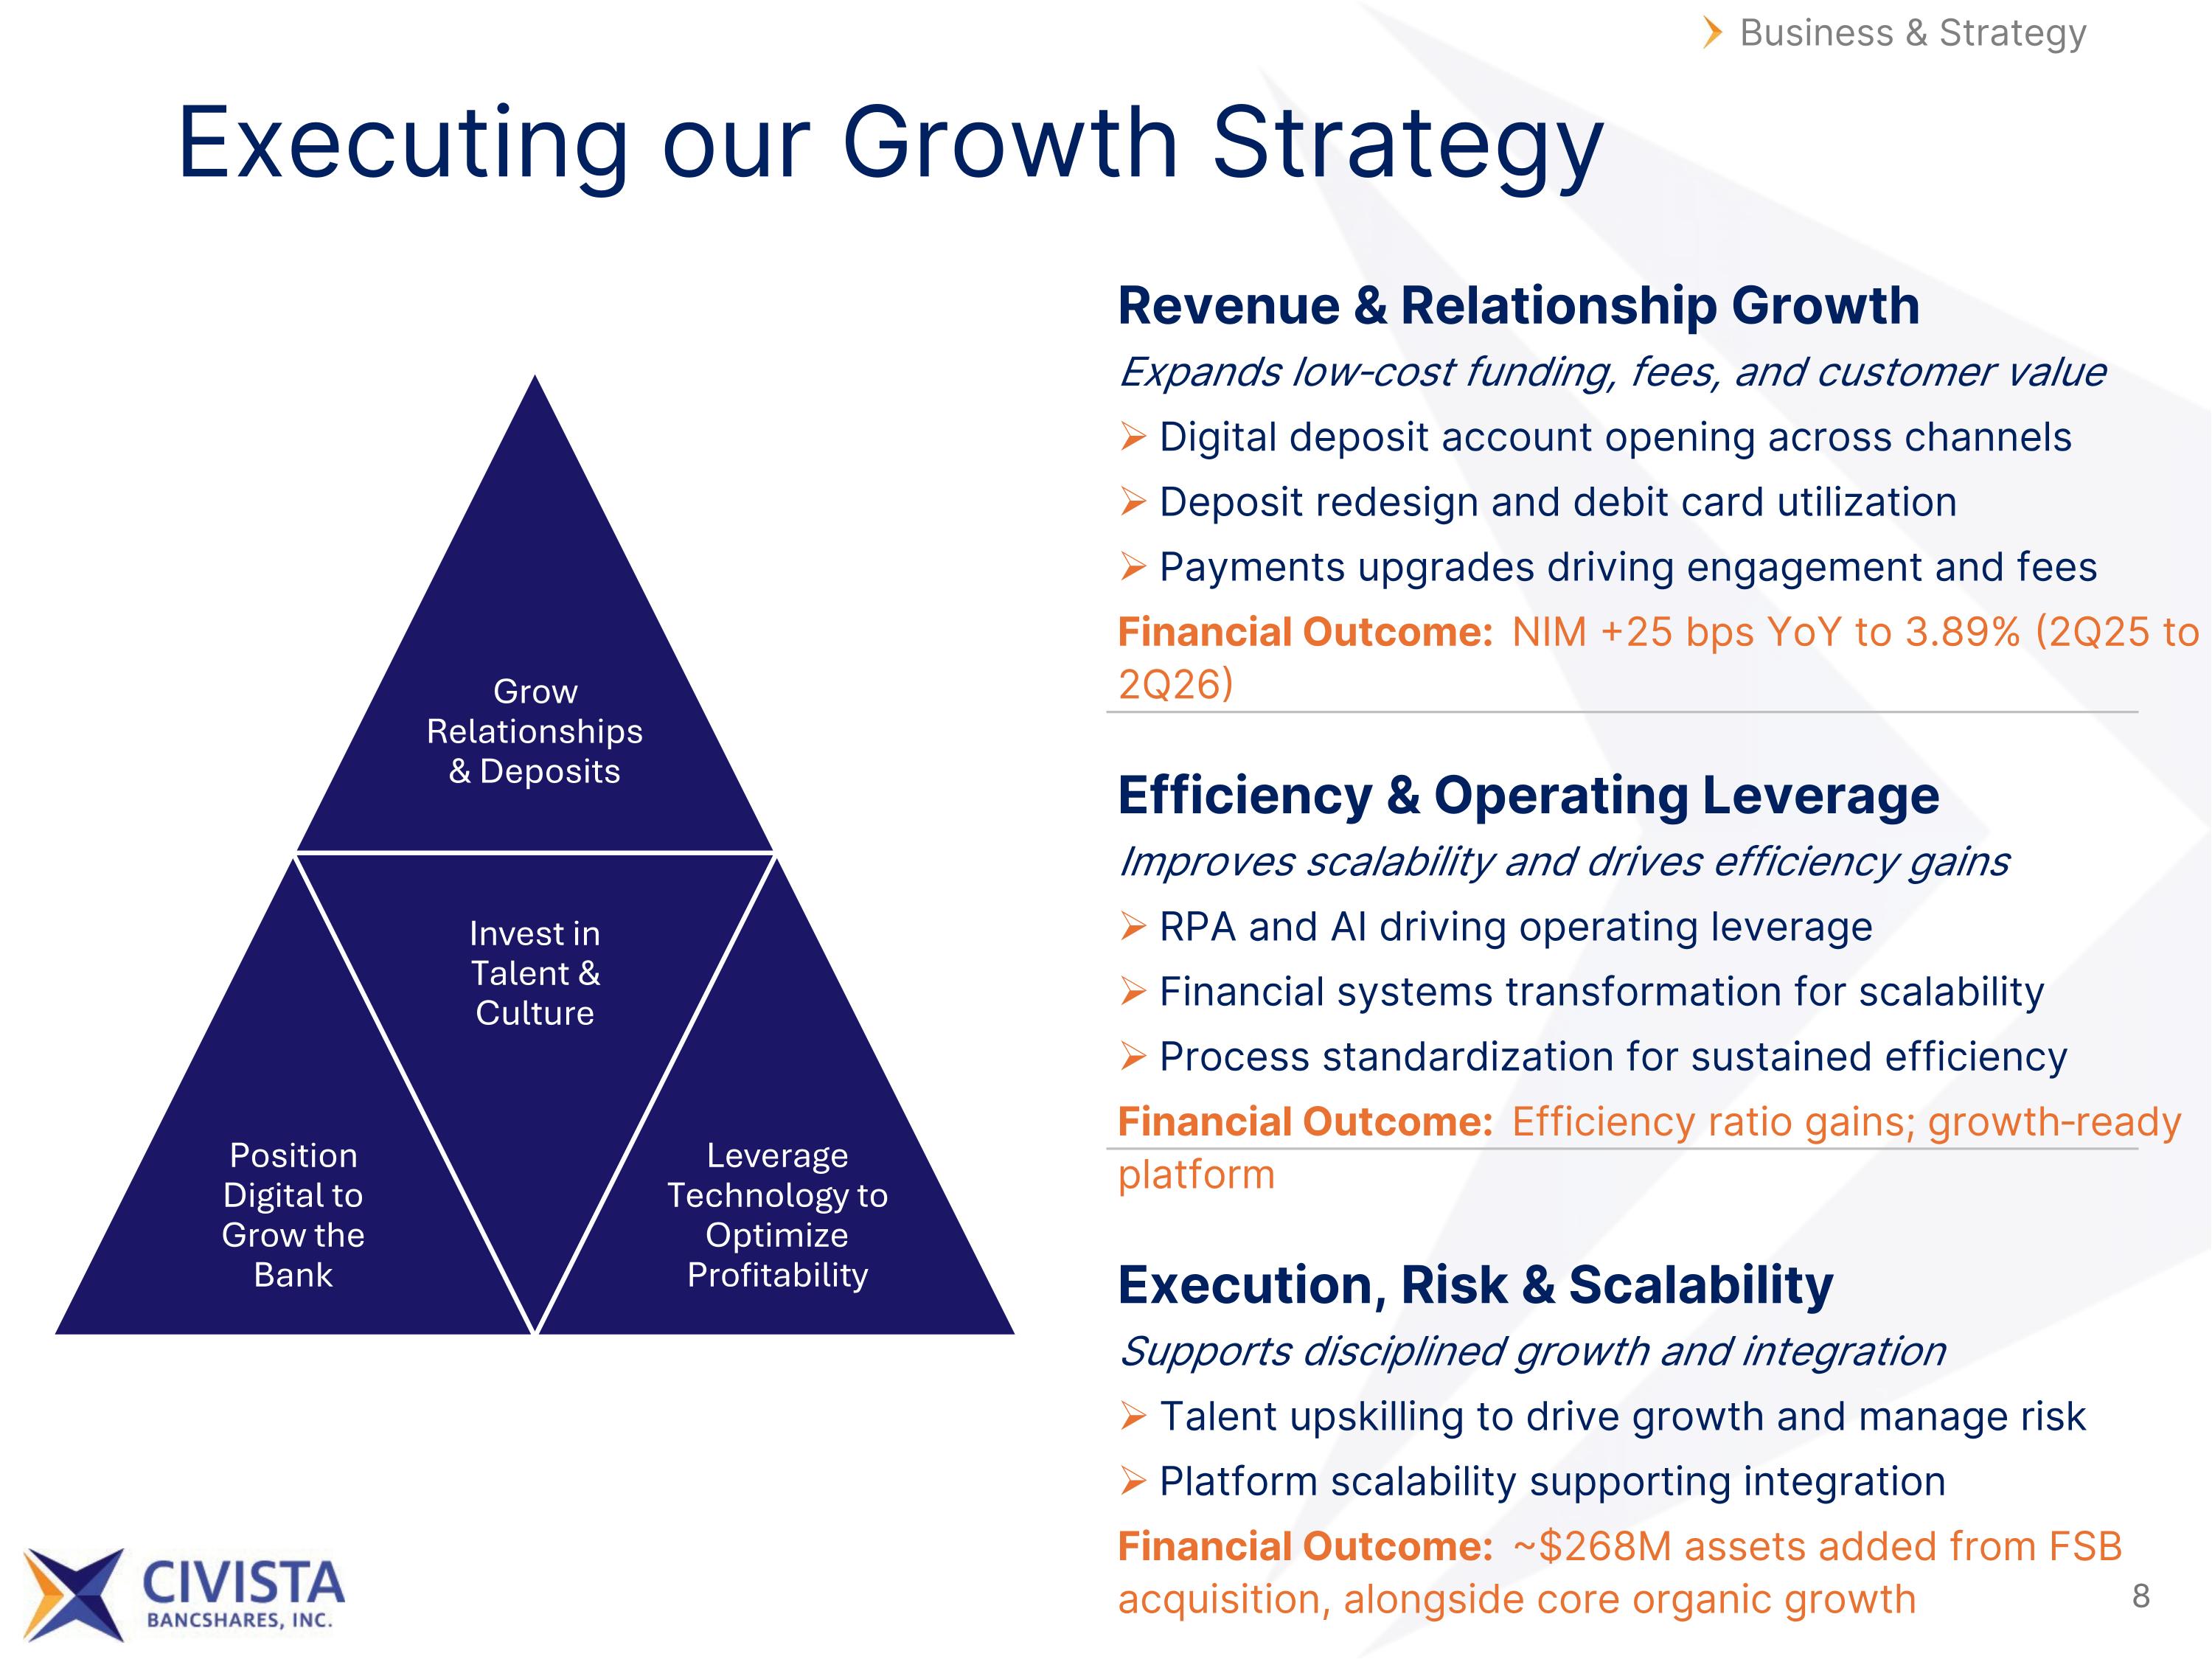
Executing our Growth Strategy Business & Strategy Revenue & Relationship Growth Expands low‑cost funding, fees, and customer value Digital deposit account opening across channels Deposit redesign and debit card utilization Payments upgrades driving engagement and fees Financial Outcome: NIM +25 bps YoY to 3.89% (2Q25 to 2Q26) Efficiency & Operating Leverage Improves scalability and drives efficiency gains RPA and AI driving operating leverage Financial systems transformation for scalability Process standardization for sustained efficiency Financial Outcome: Efficiency ratio gains; growth‑ready platform Execution, Risk & Scalability Supports disciplined growth and integration Talent upskilling to drive growth and manage risk Platform scalability supporting integration Financial Outcome: ~$268M assets added from FSB acquisition, alongside core organic growth Grow Relationships & Deposits Position Digital to Grow the Bank Invest in Talent & Culture Leverage Technology to Optimize Profitability
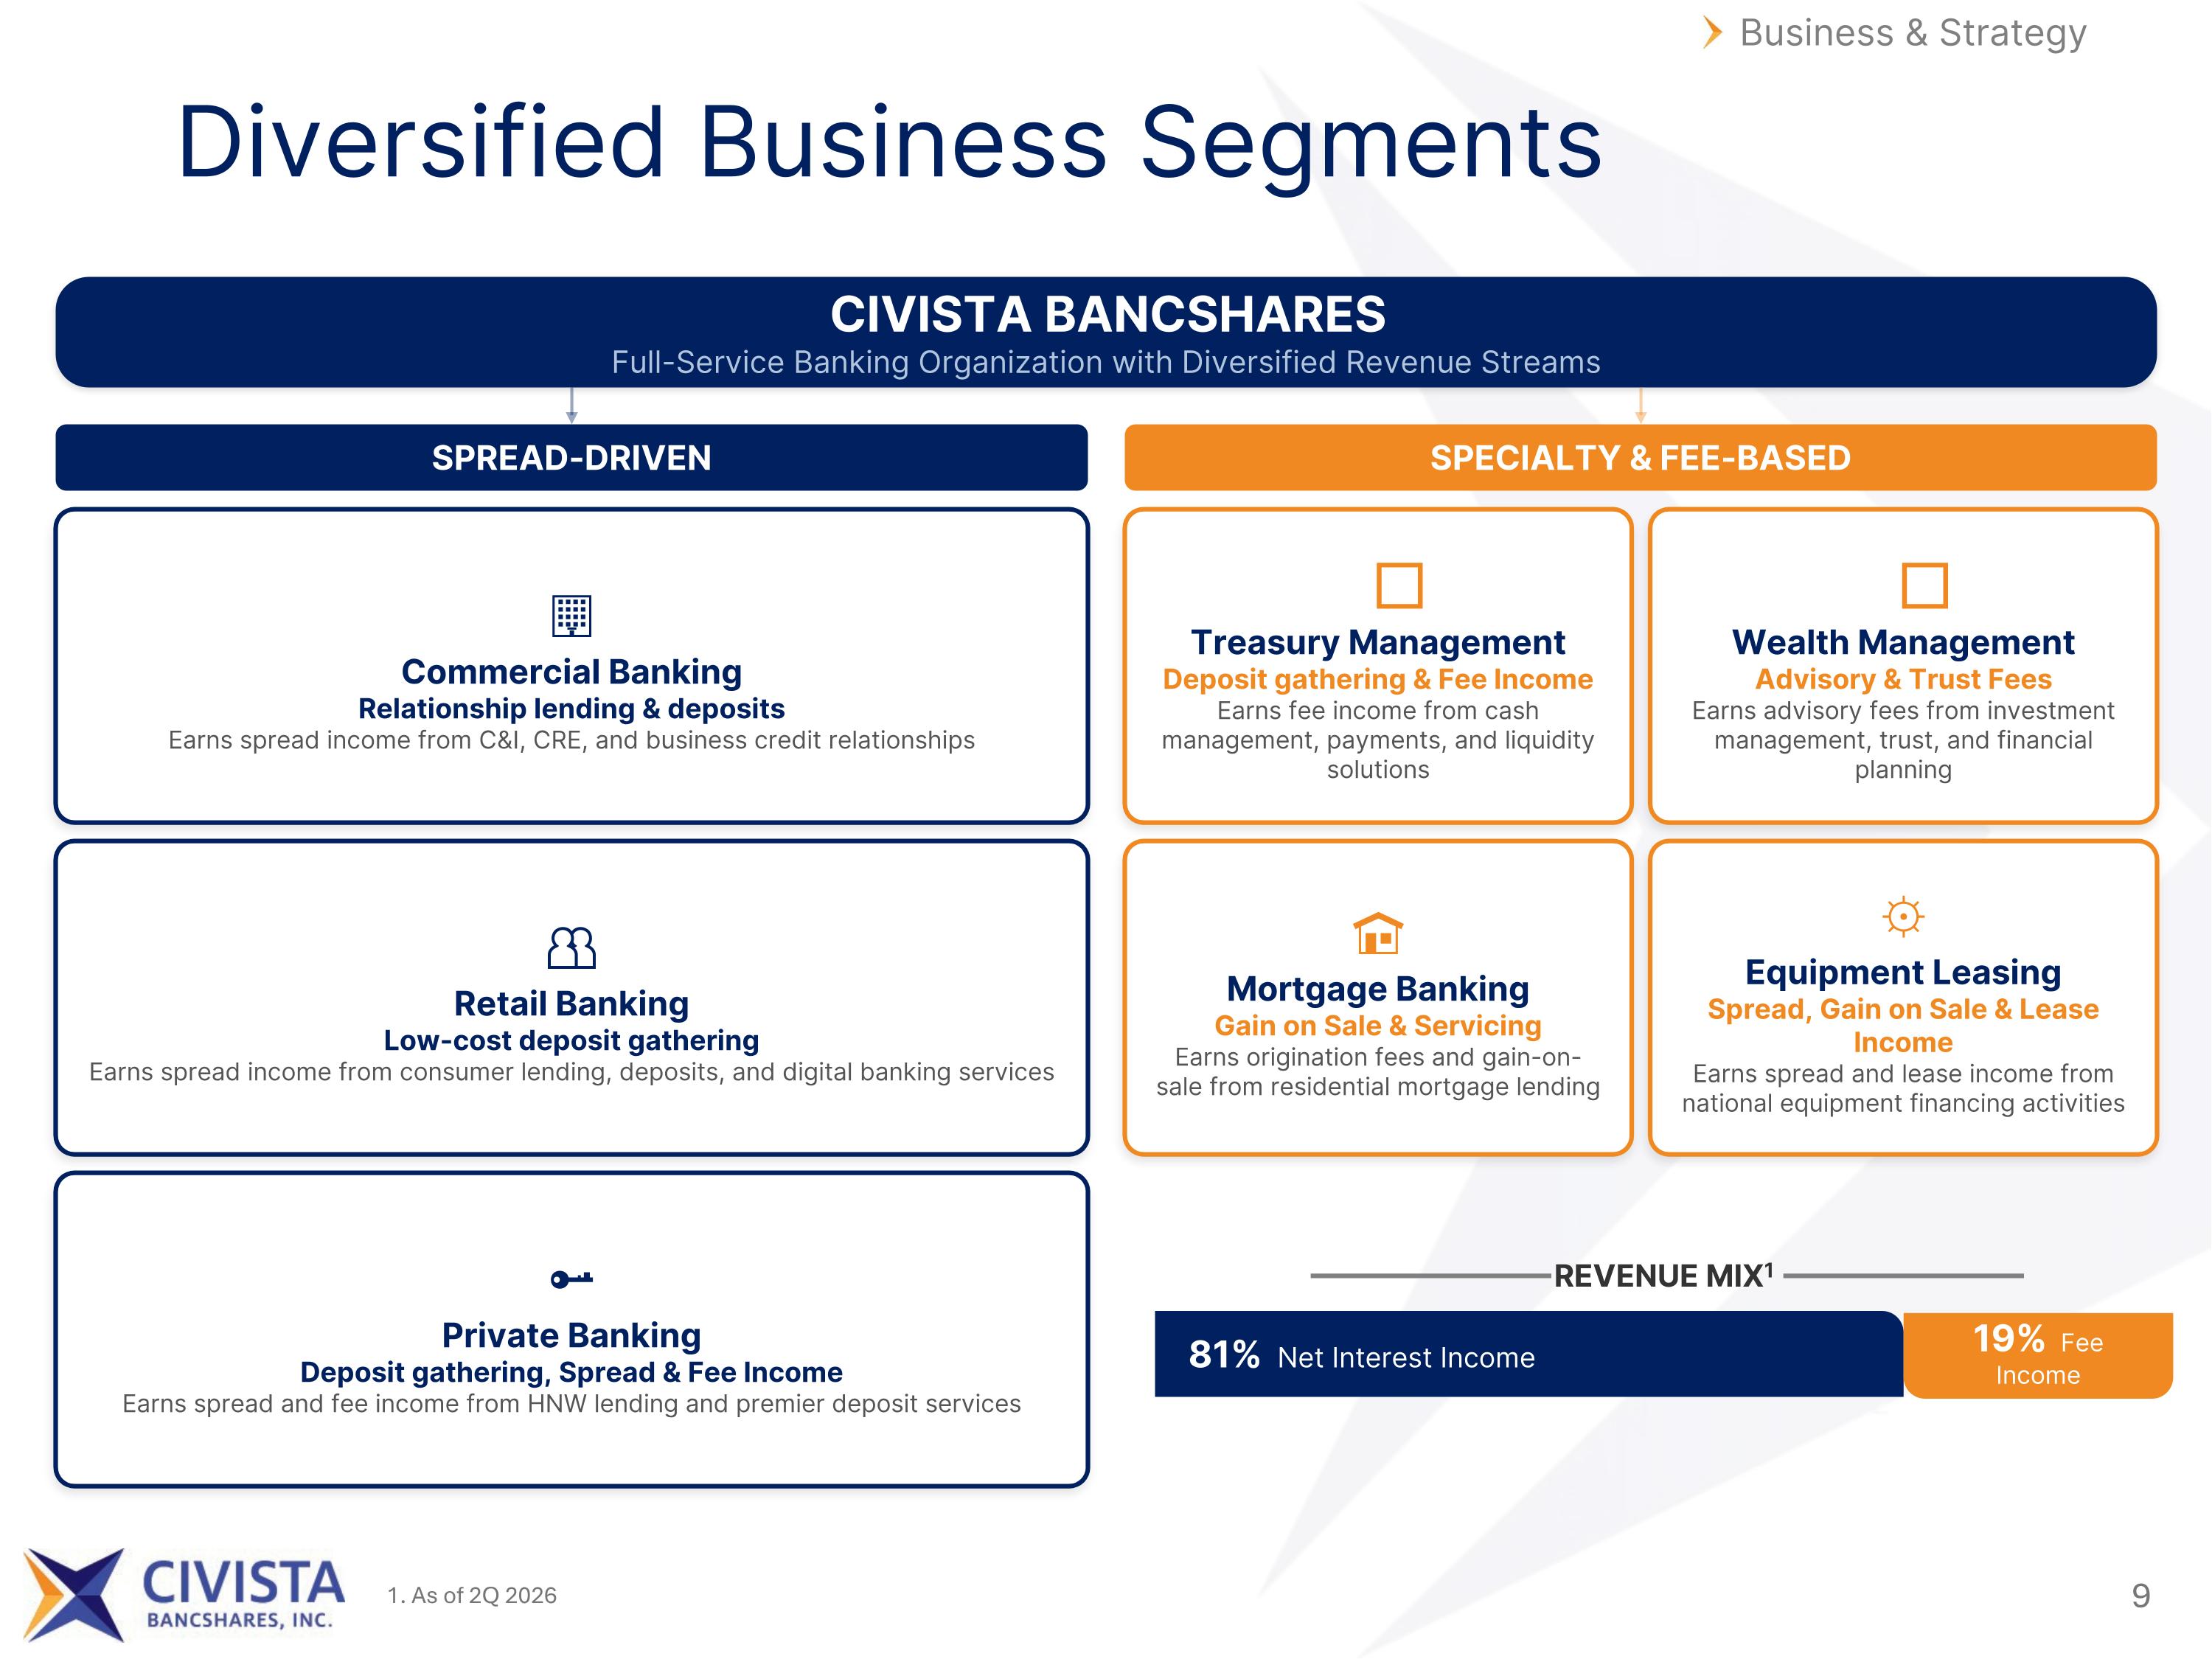
Diversified Business Segments Business & Strategy CIVISTA BANCSHARES Full-Service Banking Organization with Diversified Revenue Streams SPREAD-DRIVEN SPECIALTY & FEE-BASED 🏢 Commercial Banking Relationship lending & deposits Earns spread income from C&I, CRE, and business credit relationships 👥 Retail Banking Low-cost deposit gathering Earns spread income from consumer lending, deposits, and digital banking services 🔑 Private Banking Deposit gathering, Spread & Fee Income Earns spread and fee income from HNW lending and premier deposit services 💰 Treasury Management Deposit gathering & Fee Income Earns fee income from cash management, payments, and liquidity solutions 📈 Wealth Management Advisory & Trust Fees Earns advisory fees from investment management, trust, and financial planning 🏠 Mortgage Banking Gain on Sale & Servicing Earns origination fees and gain-on-sale from residential mortgage lending ⚙ Equipment Leasing Spread, Gain on Sale & Lease Income Earns spread and lease income from national equipment financing activities REVENUE MIX1 81% Net Interest Income 19% Fee Income 1. As of 2Q 2026
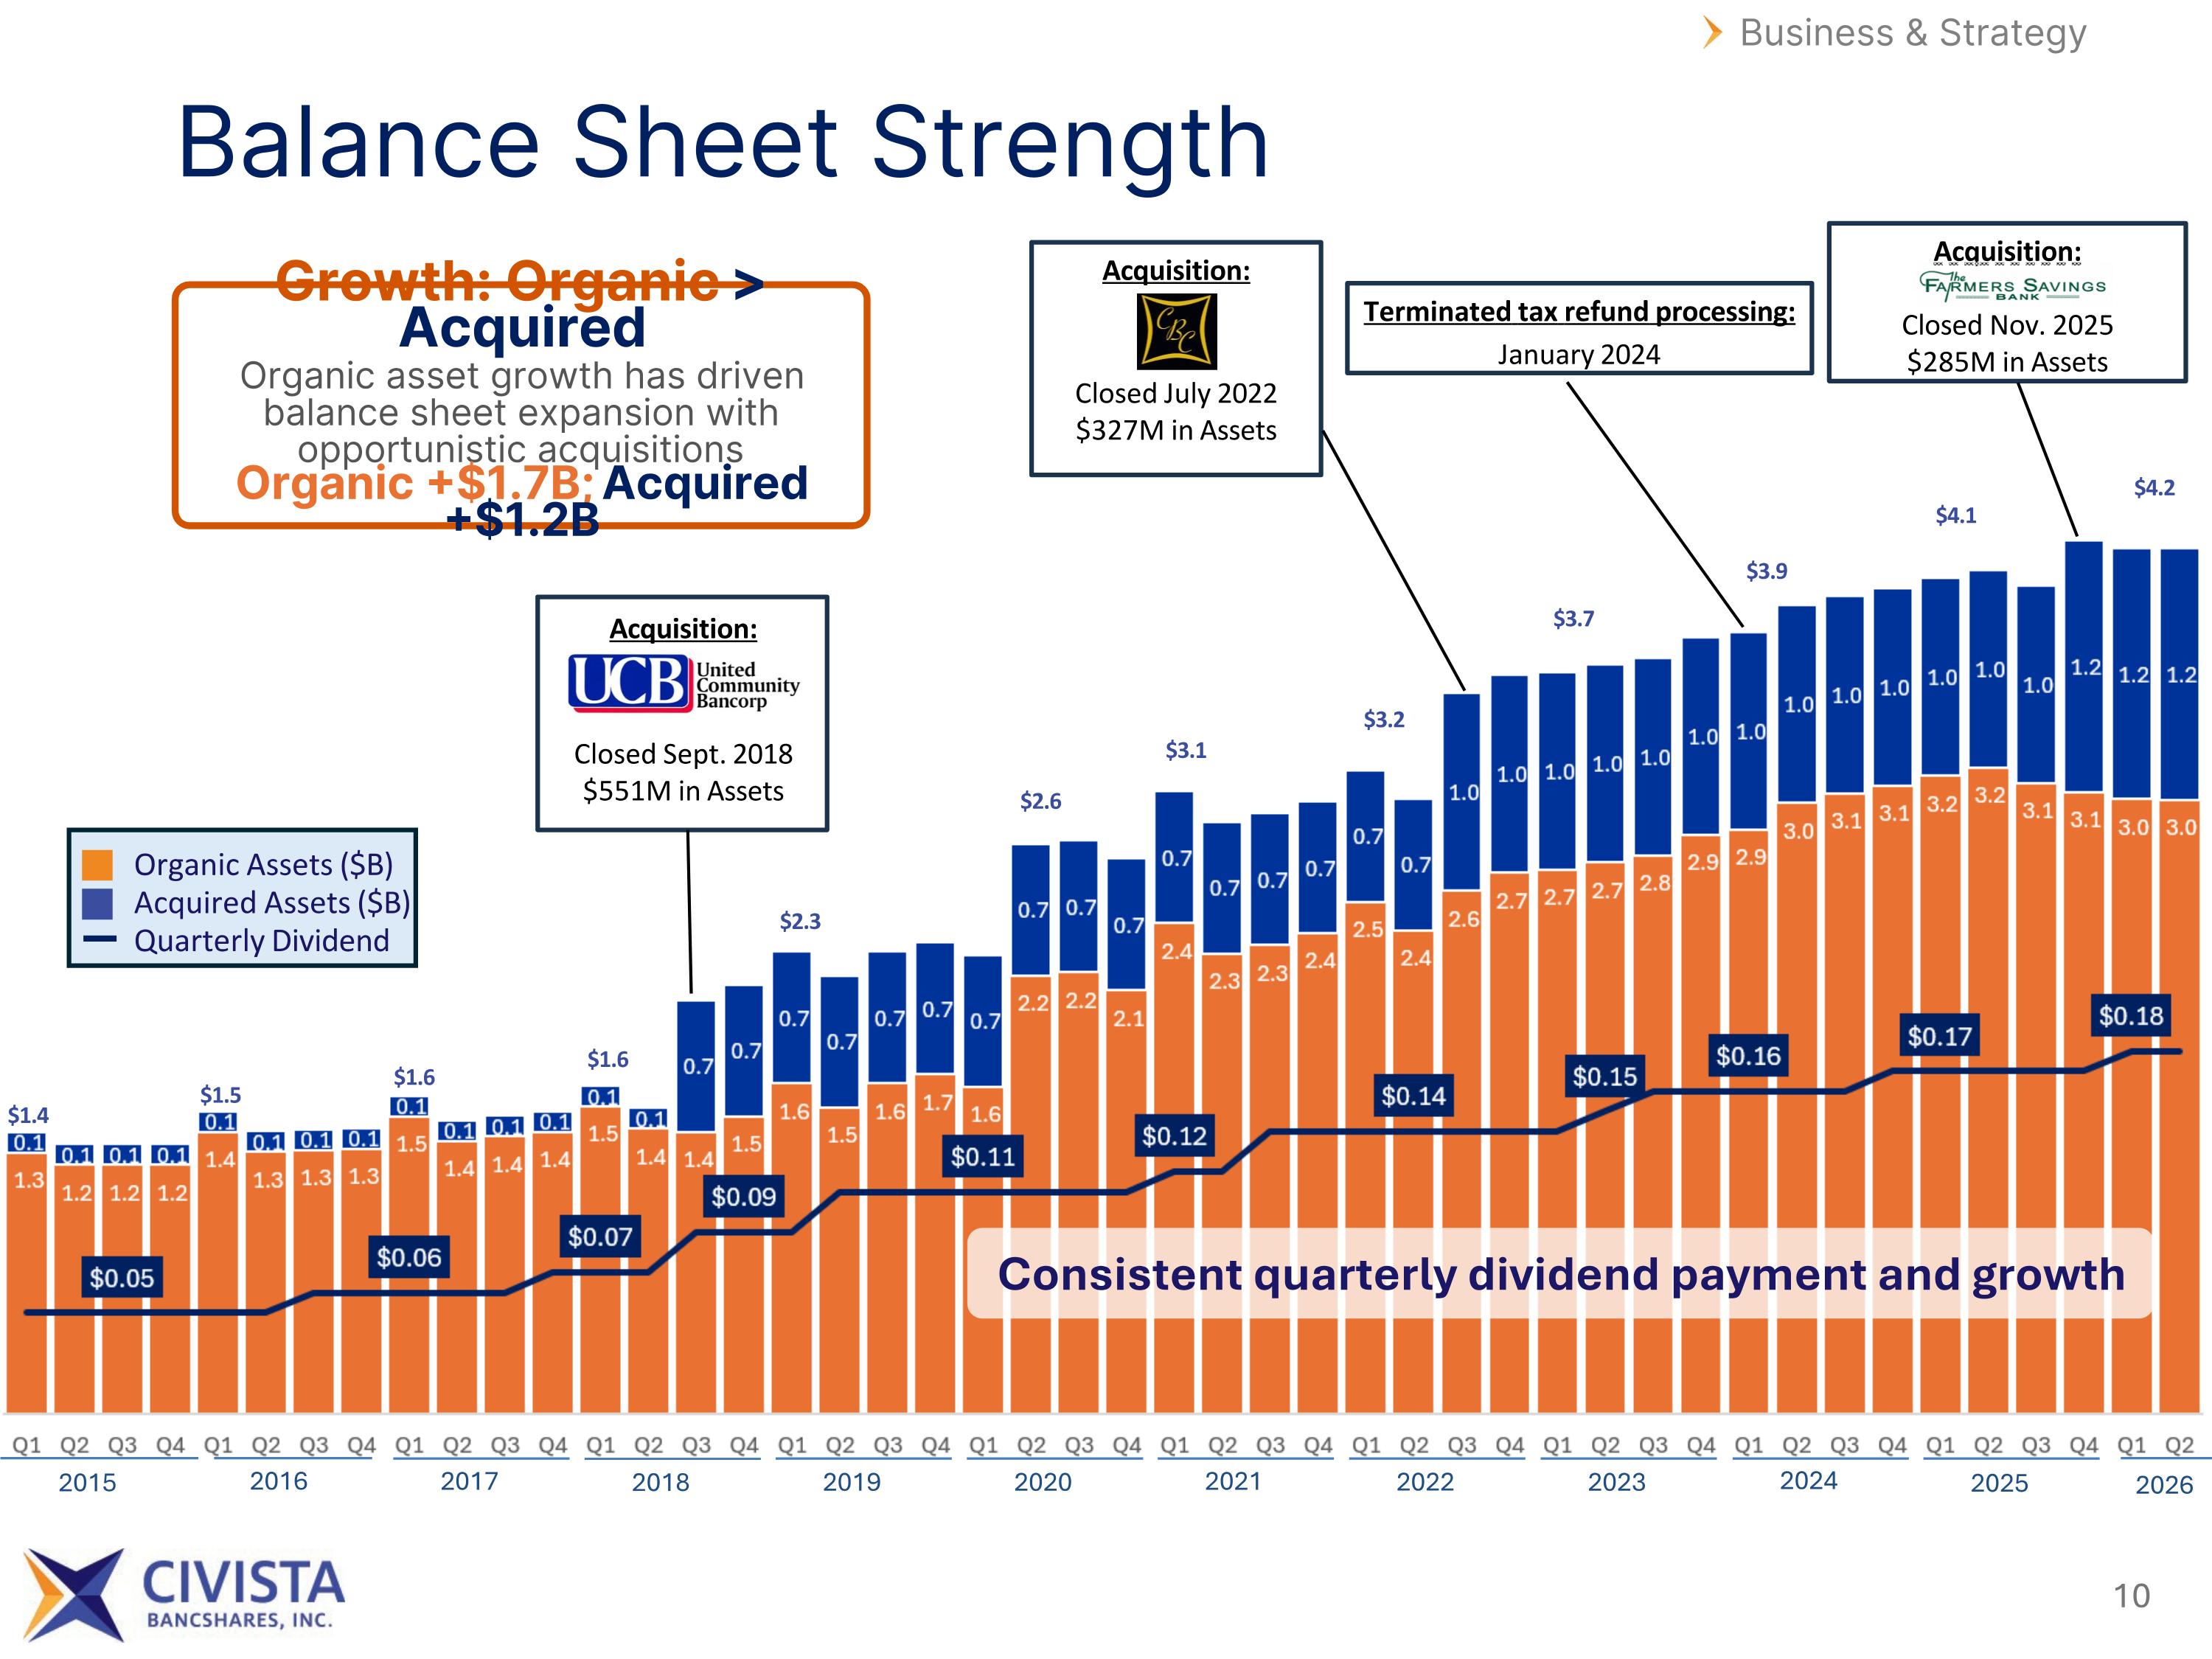
&P Capital IQ Pro $1.4 Acquisition: Closed July 2022 $327M in Assets Acquisition: Closed Nov. 2025 $285M in Assets $1.5 $1.6 $1.6 $2.3 $2.6 $3.1 $3.2 $3.7 $3.9 $4.1 Terminated tax refund processing: January 2024 10 Acquisition: Closed Sept. 2018 $551M in Assets Consistent quarterly dividend payment and growth Organic Assets ($B) Acquired Assets ($B) Quarterly Dividend Business & Strategy Balance Sheet Strength Growth: Organic > Acquired Organic asset growth has driven balance sheet expansion with opportunistic acquisitions Organic +$1.7B; Acquired +$1.2B $4.2 2026 2020 2021 2022 2023 2024 2025 2015 2016 2017 2018 2019
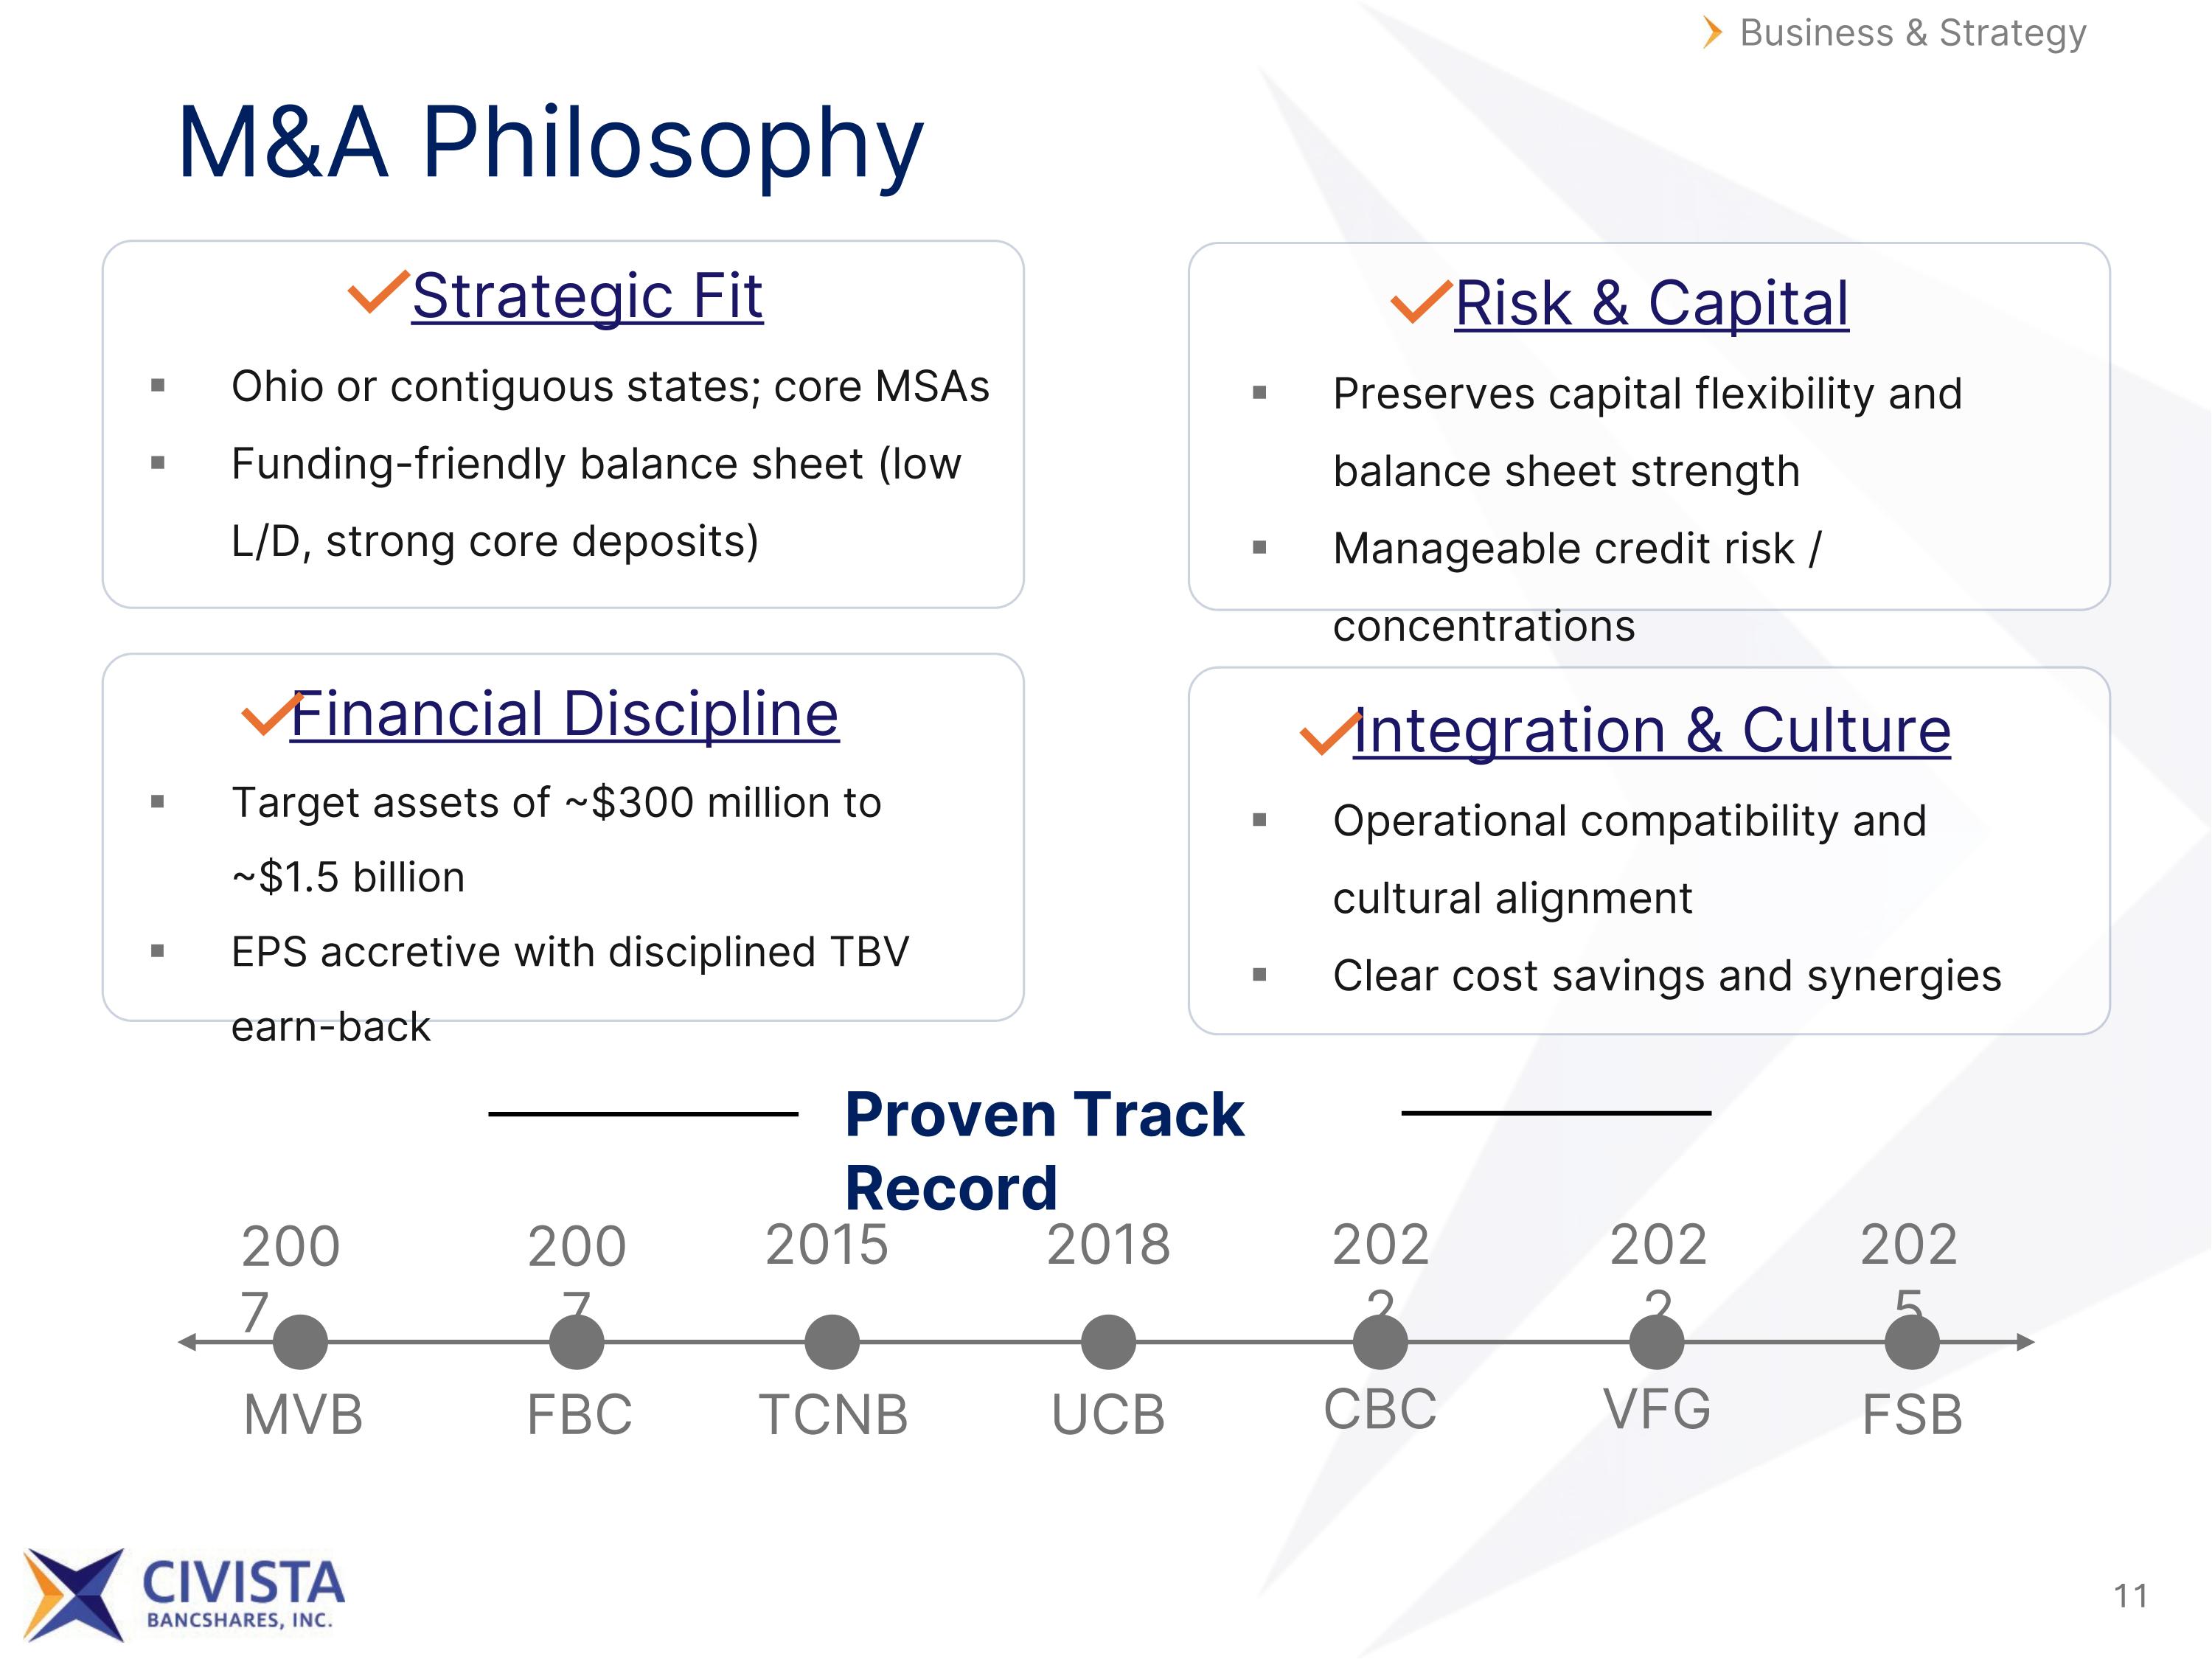
Risk & Capital Preserves capital flexibility and balance sheet strength Manageable credit risk / concentrations Financial Discipline Target assets of ~$300 million to ~$1.5 billion EPS accretive with disciplined TBV earn-back M&A Philosophy Business & Strategy Strategic Fit Ohio or contiguous states; core MSAs Funding-friendly balance sheet (low L/D, strong core deposits) Integration & Culture Operational compatibility and cultural alignment Clear cost savings and synergies Proven Track Record 2007 MVB 2007 FBC 2015 TCNB 2018 UCB 2022 CBC 2025 FSB 2022 VFG
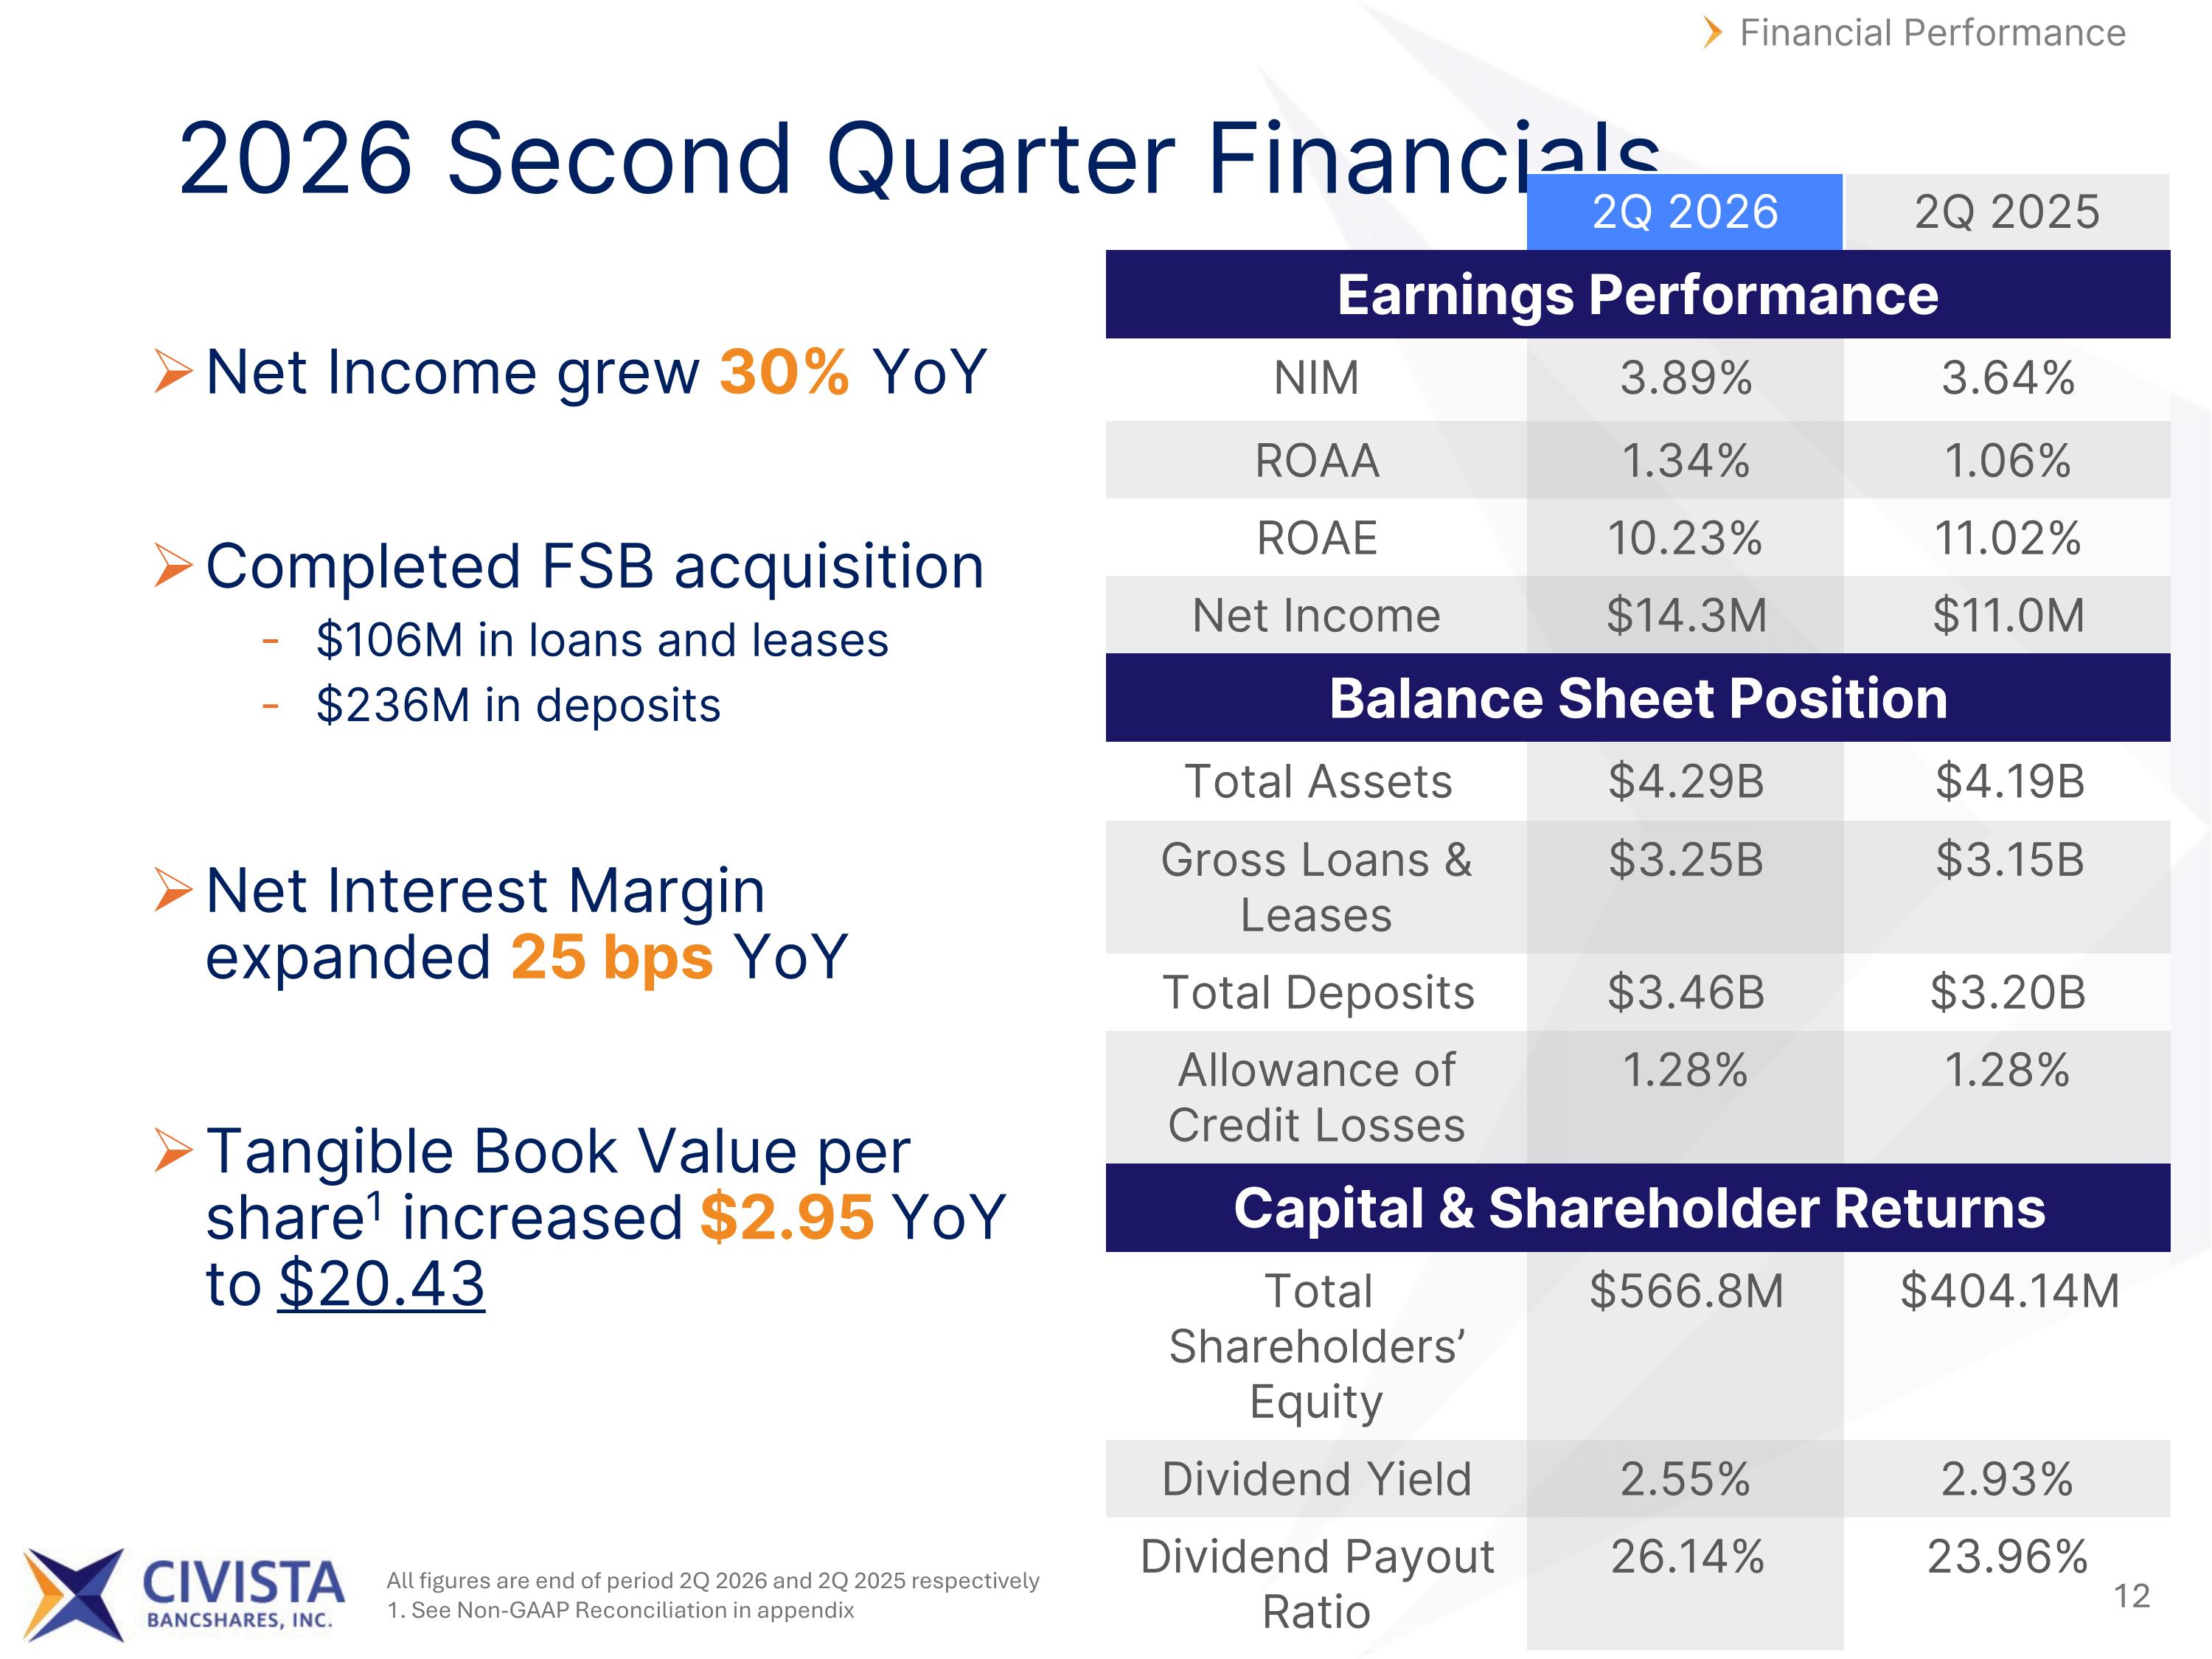
All figures are end of period 2Q 2026 and 2Q 2025 respectively 1. See Non-GAAP Reconciliation in appendix 2026 Second Quarter Financials 2Q 2026 2Q 2025 Earnings Performance NIM 3.89% 3.64% ROAA 1.34% 1.06% ROAE 10.23% 11.02% Net Income $14.3M $11.0M Balance Sheet Position Total Assets $4.29B $4.19B Gross Loans & Leases $3.25B $3.15B Total Deposits $3.46B $3.20B Allowance of Credit Losses 1.28% 1.28% Capital & Shareholder Returns Total Shareholders’ Equity $566.8M $404.14M Dividend Yield 2.55% 2.93% Dividend Payout Ratio 26.14% 23.96% Financial Performance Net Income grew 30% YoY Completed FSB acquisition $106M in loans and leases $236M in deposits Net Interest Margin expanded 25 bps YoY Tangible Book Value per share1 increased $2.95 YoY to $20.43
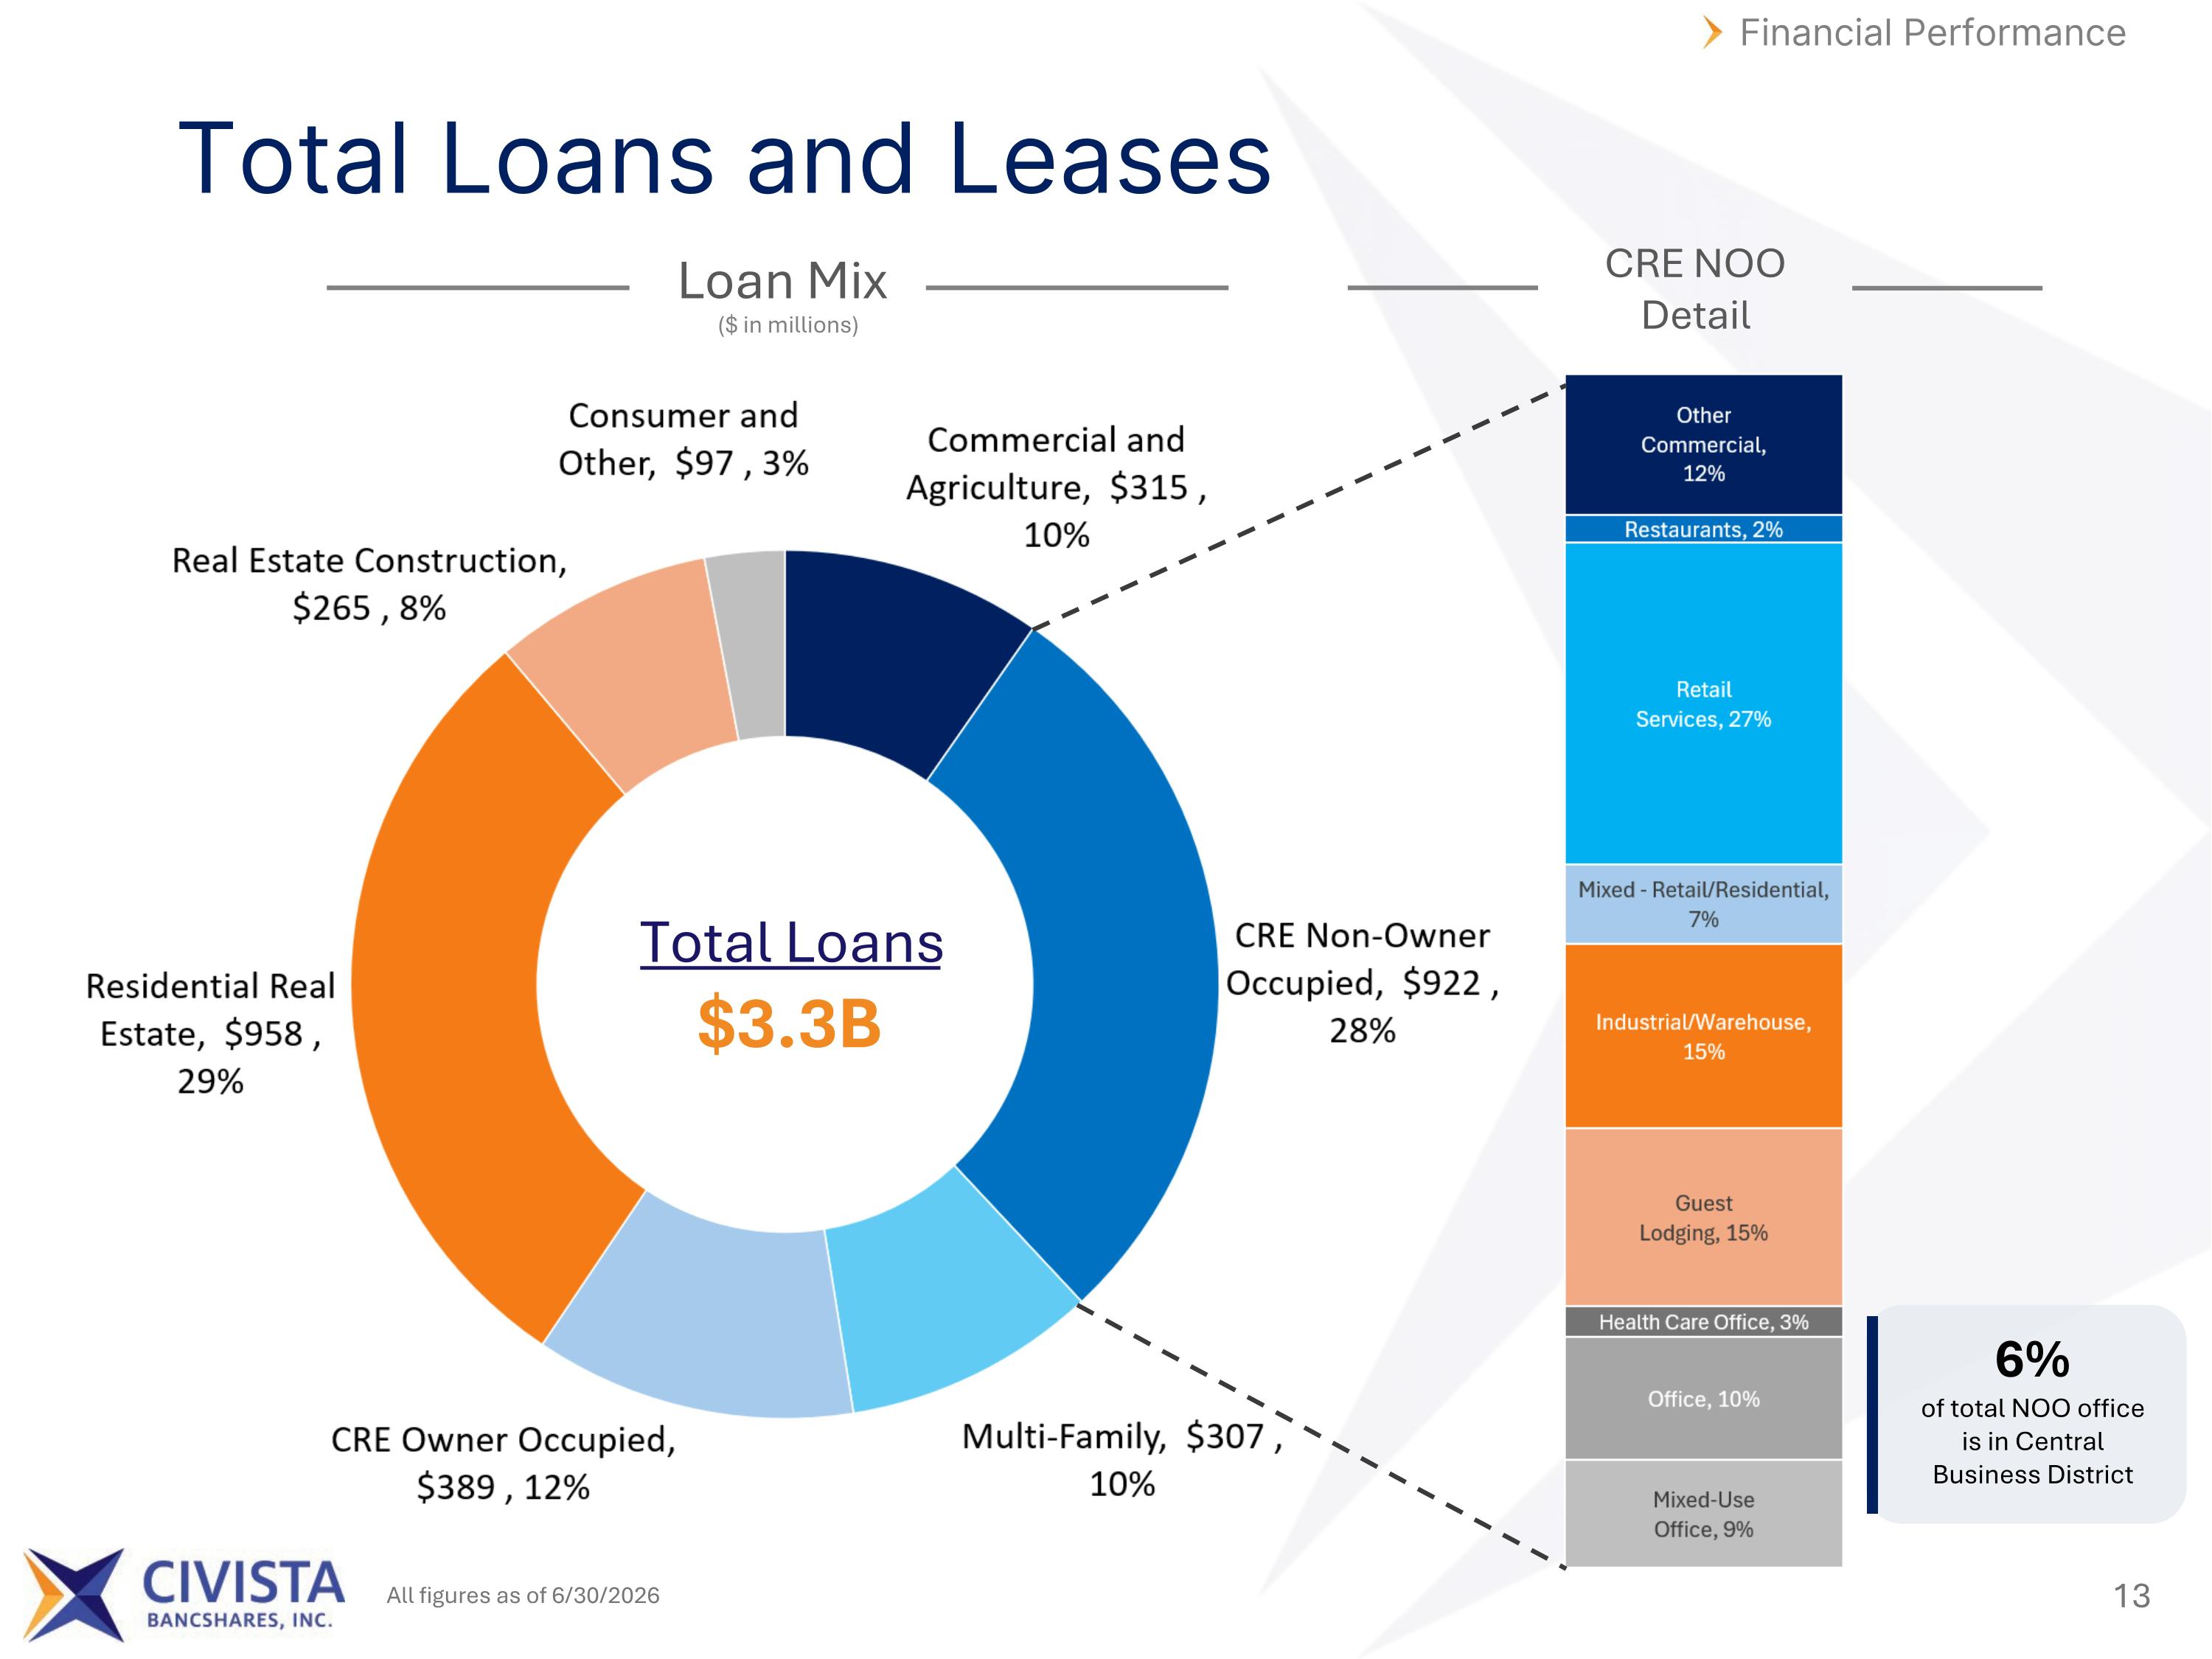
Total Loans and Leases Financial Performance Total Loans $3.3B Loan Mix CRE NOO Detail 6% of total NOO office is in Central Business District ($ in millions) All figures as of 6/30/2026
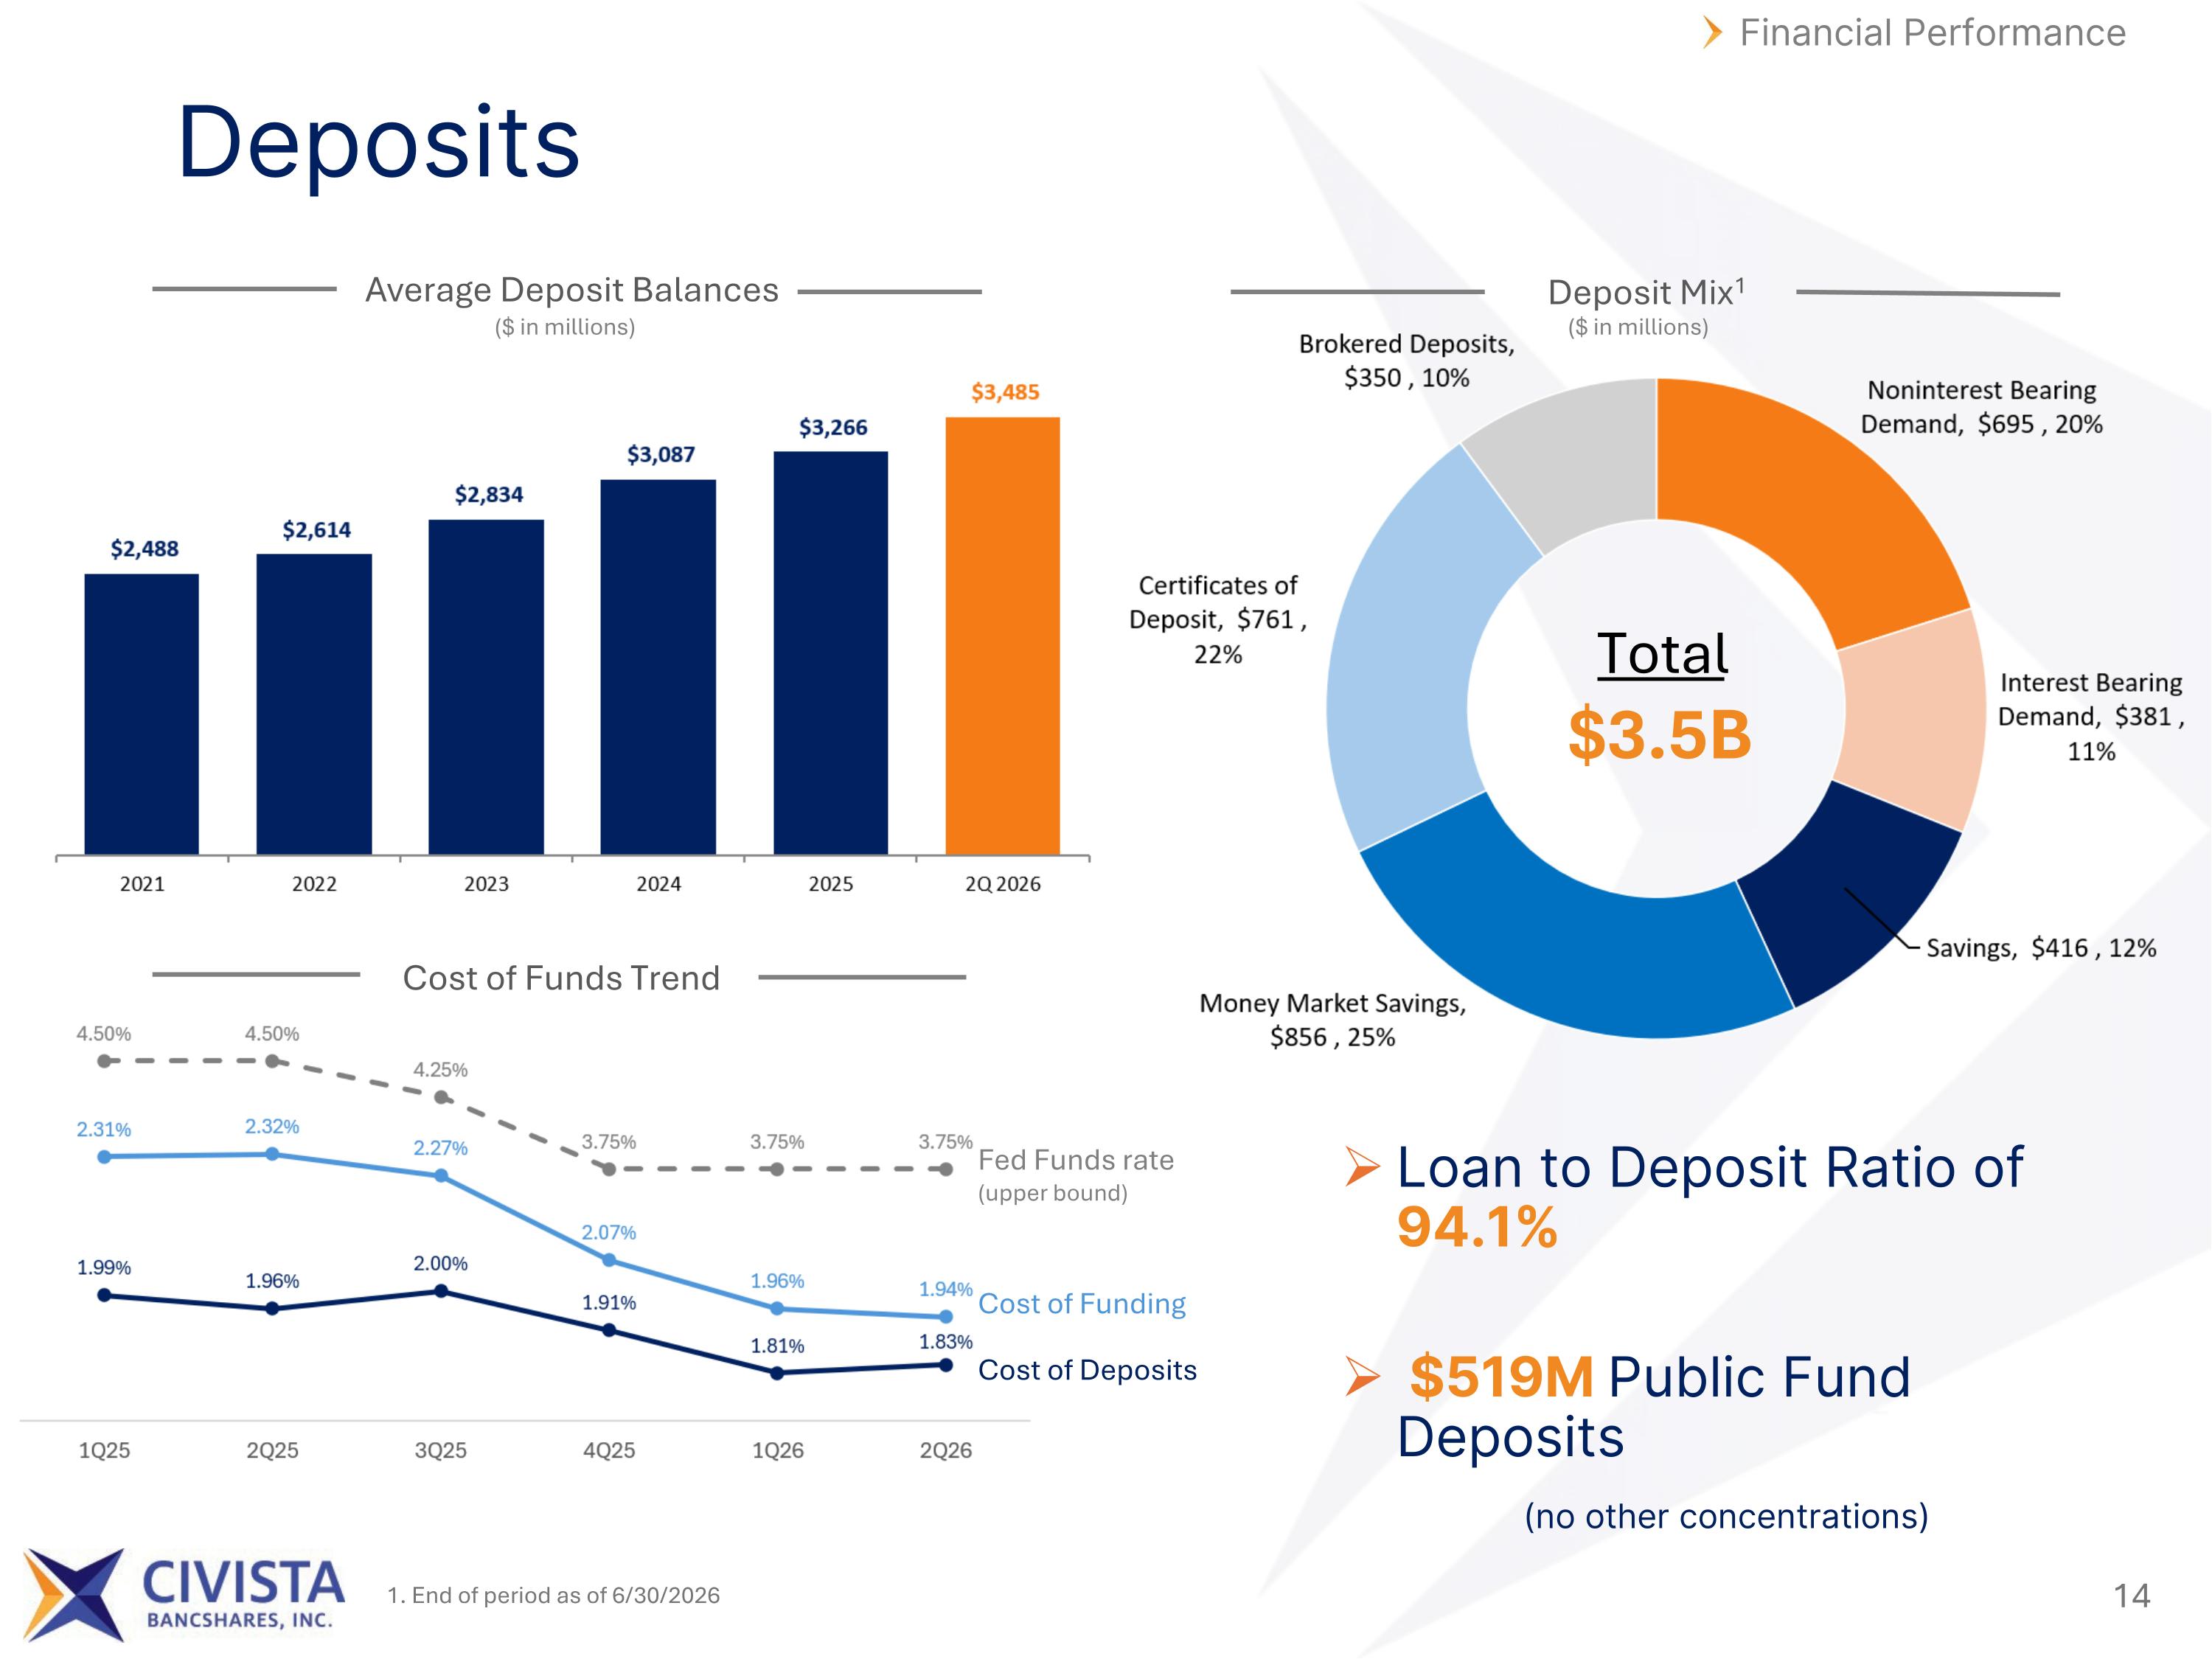
Deposits Financial Performance Fed Funds rate (upper bound) Cost of Funding Cost of Deposits Average Deposit Balances Cost of Funds Trend Deposit Mix1 Loan to Deposit Ratio of 94.1% $519M Public Fund Deposits (no other concentrations) Total $3.5B ($ in millions) ($ in millions) 1. End of period as of 6/30/2026
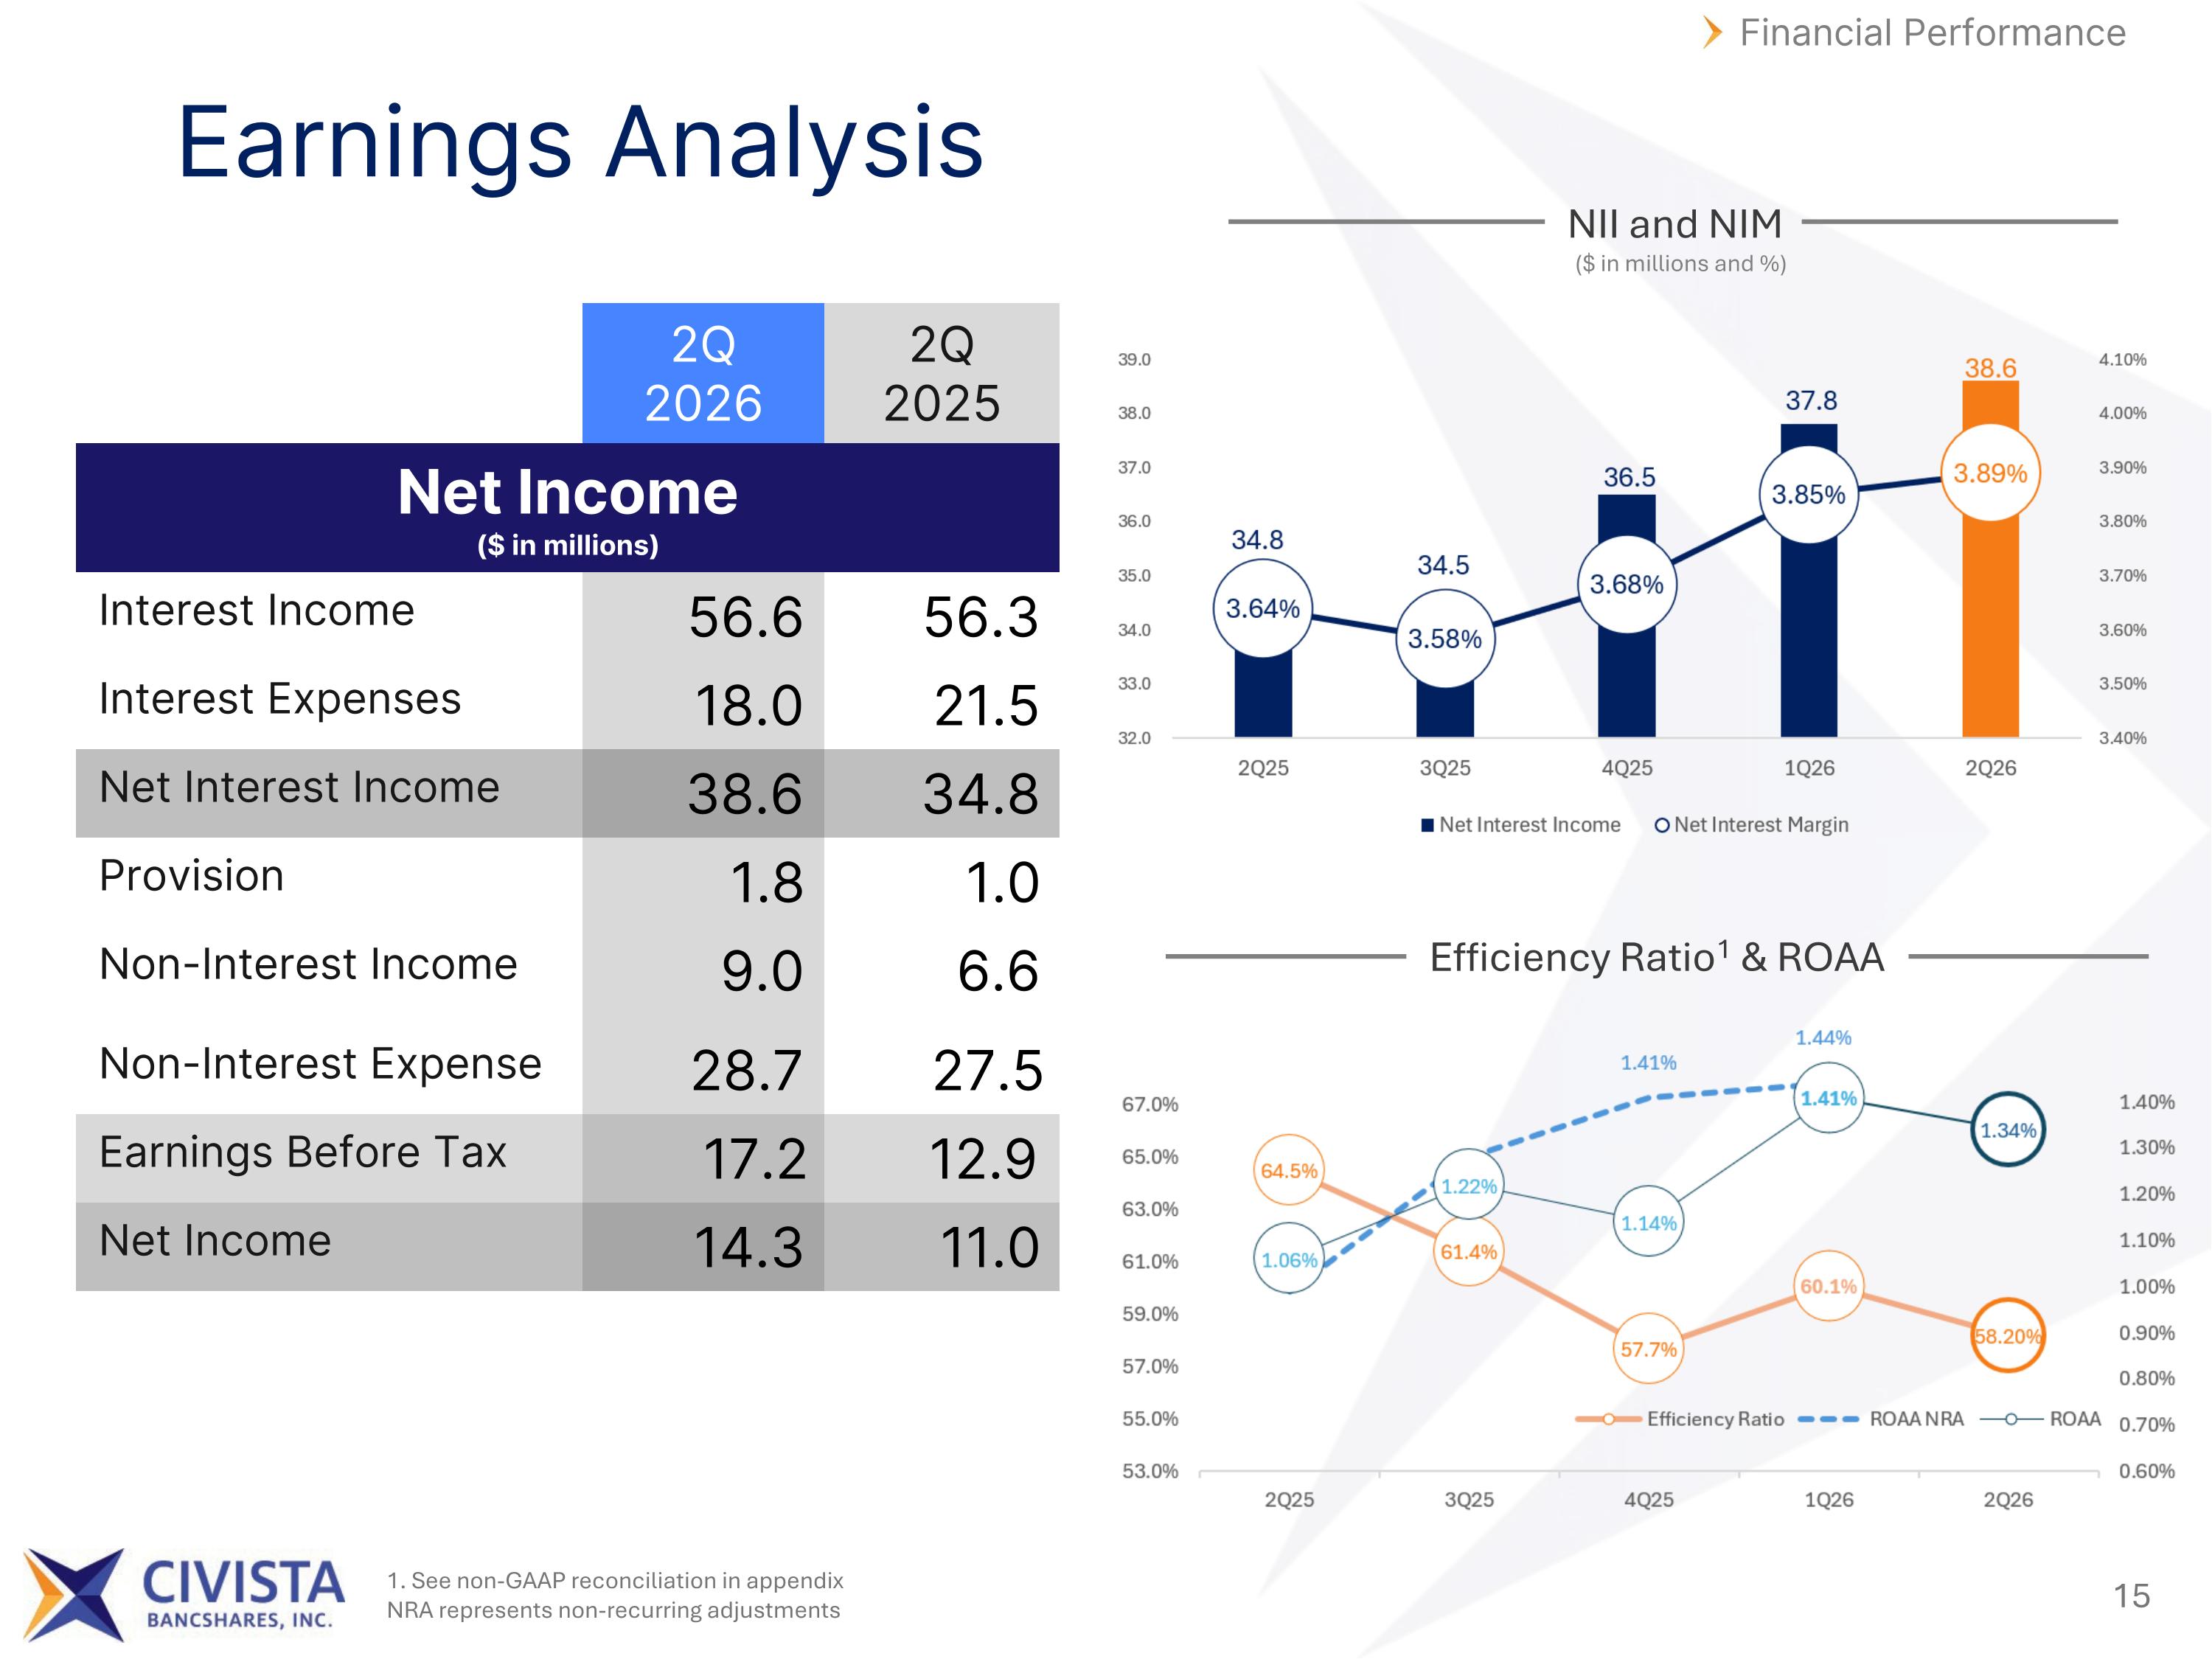
Earnings Analysis Financial Performance 2Q 2026 2Q 2025 Net Income ($ in millions) Interest Income 56.6 56.3 Interest Expenses 18.0 21.5 Net Interest Income 38.6 34.8 Provision 1.8 1.0 Non-Interest Income 9.0 6.6 Non-Interest Expense 28.7 27.5 Earnings Before Tax 17.2 12.9 Net Income 14.3 11.0 Efficiency Ratio1 & ROAA NII and NIM ($ in millions and %) 1. See non-GAAP reconciliation in appendix NRA represents non-recurring adjustments
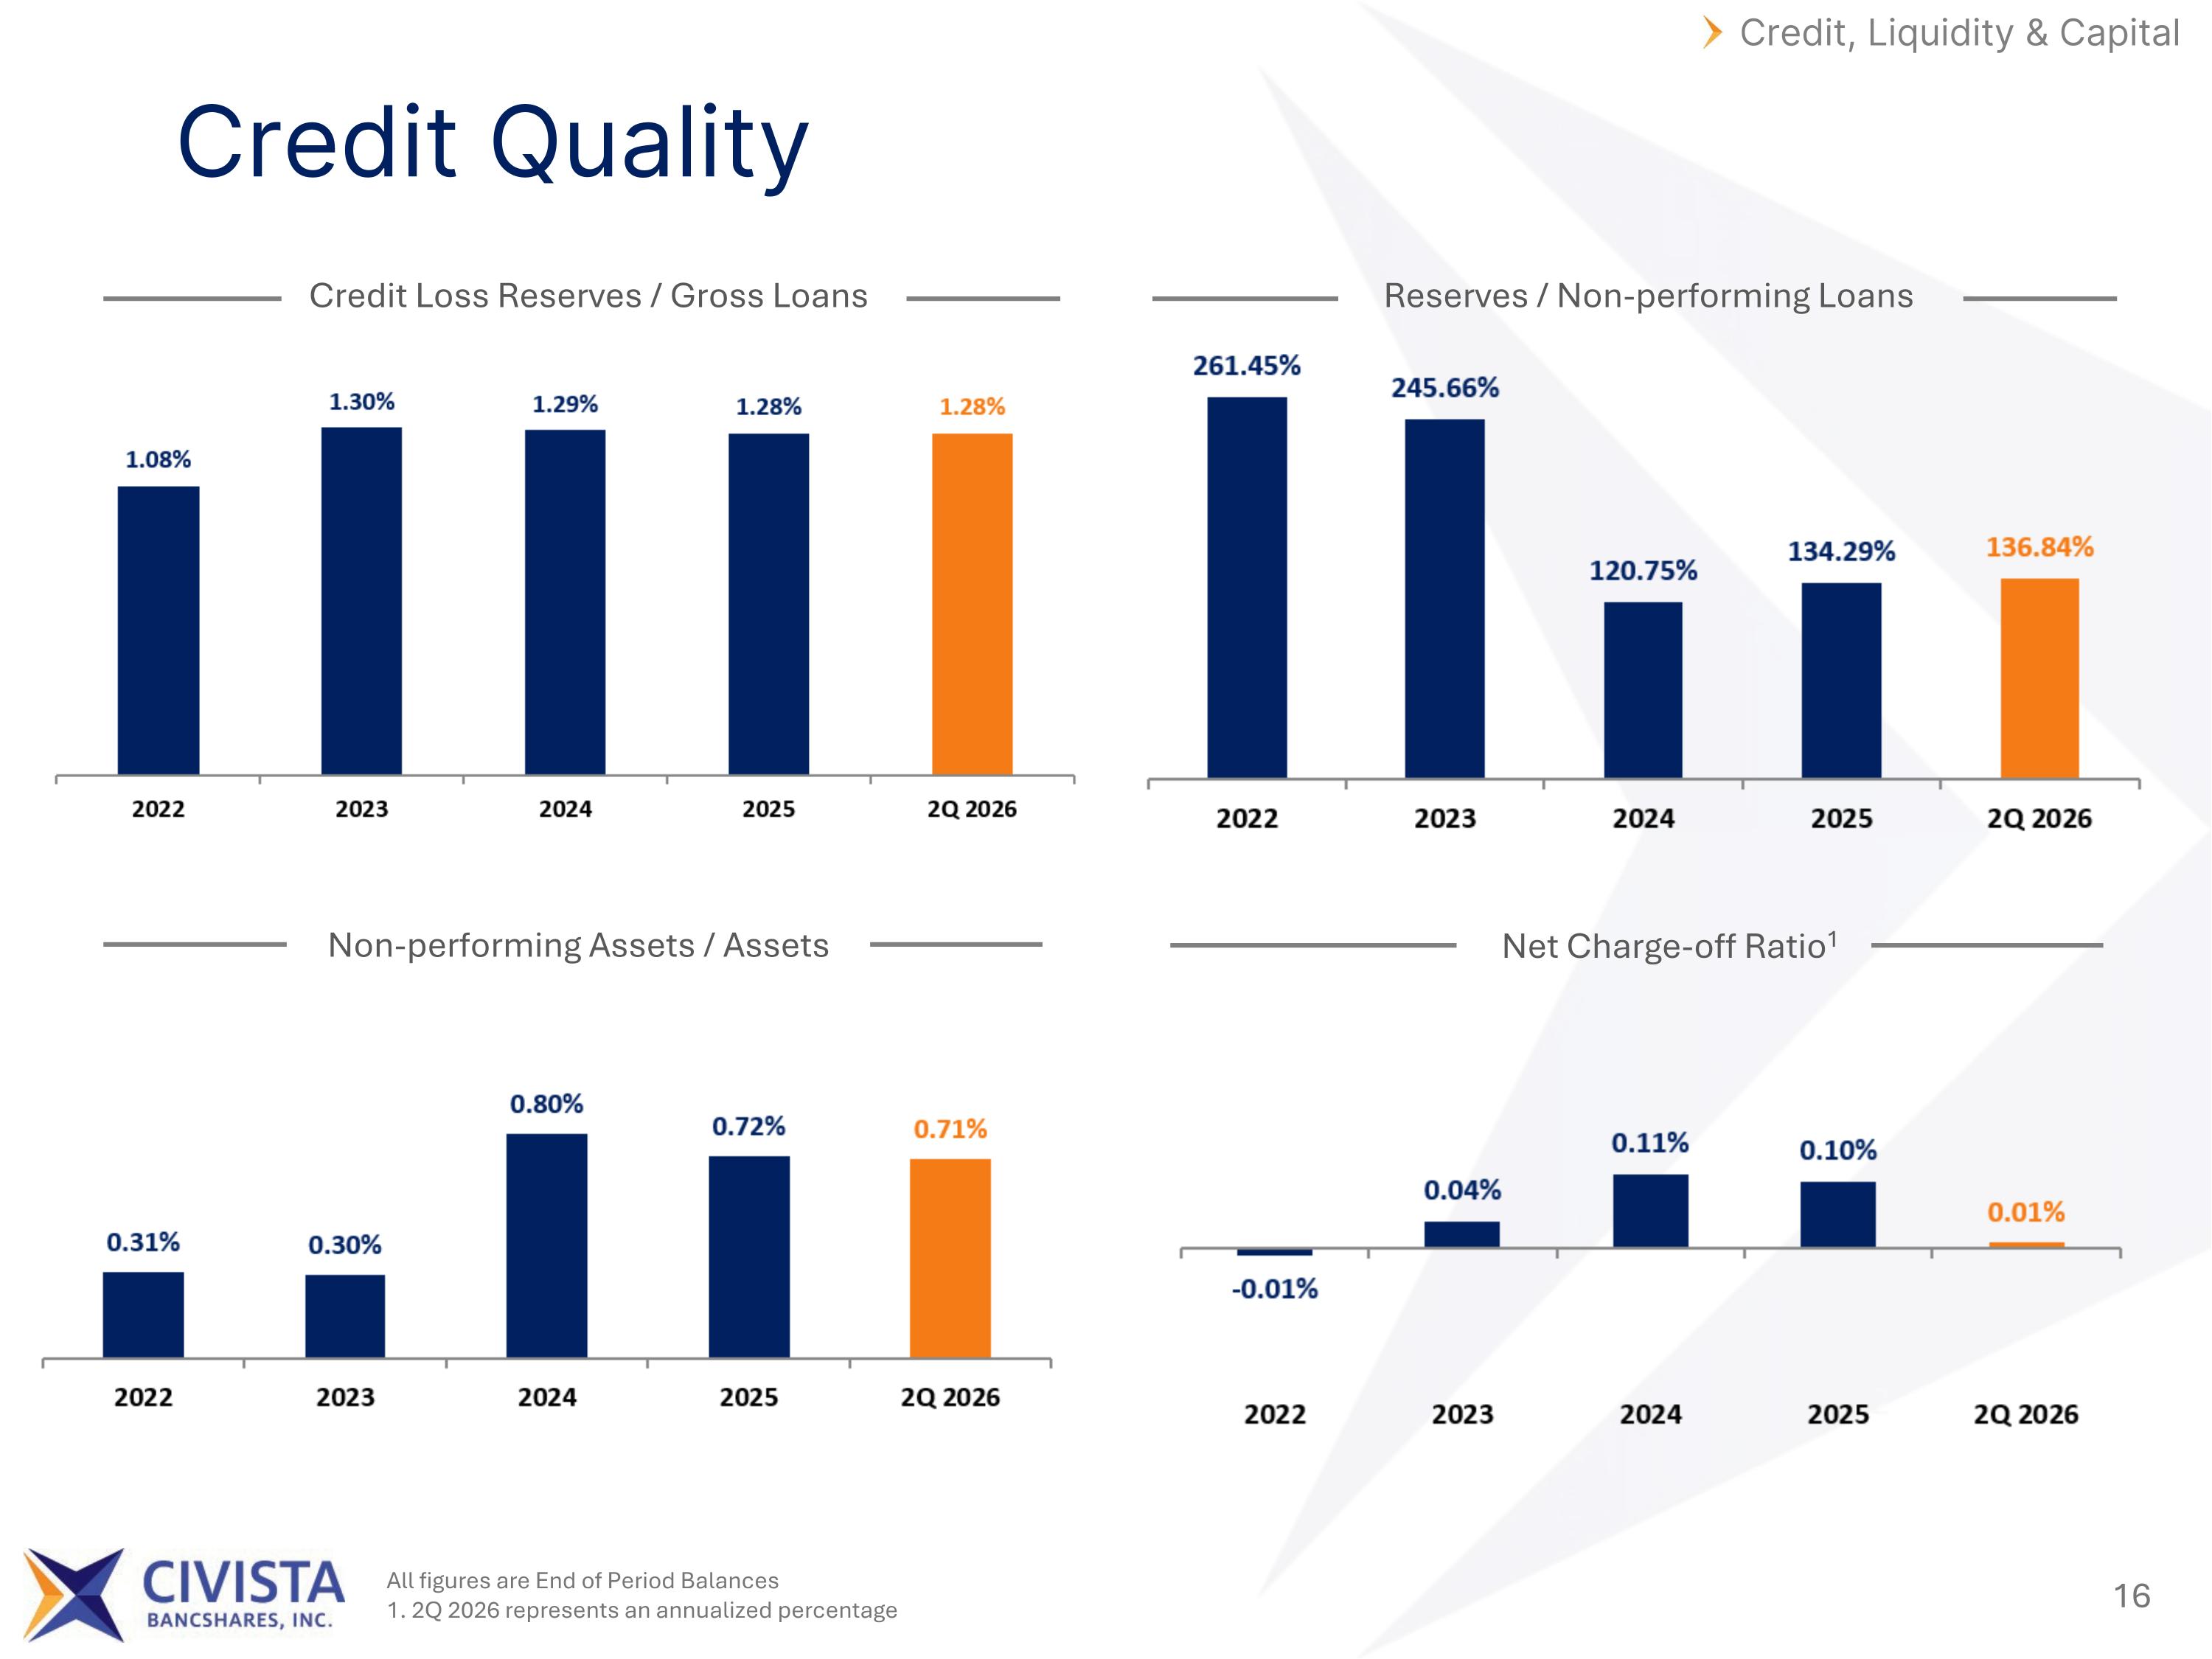
Credit Quality Credit, Liquidity & Capital Credit Loss Reserves / Gross Loans Reserves / Non-performing Loans Non-performing Assets / Assets Net Charge-off Ratio1 All figures are End of Period Balances 1. 2Q 2026 represents an annualized percentage
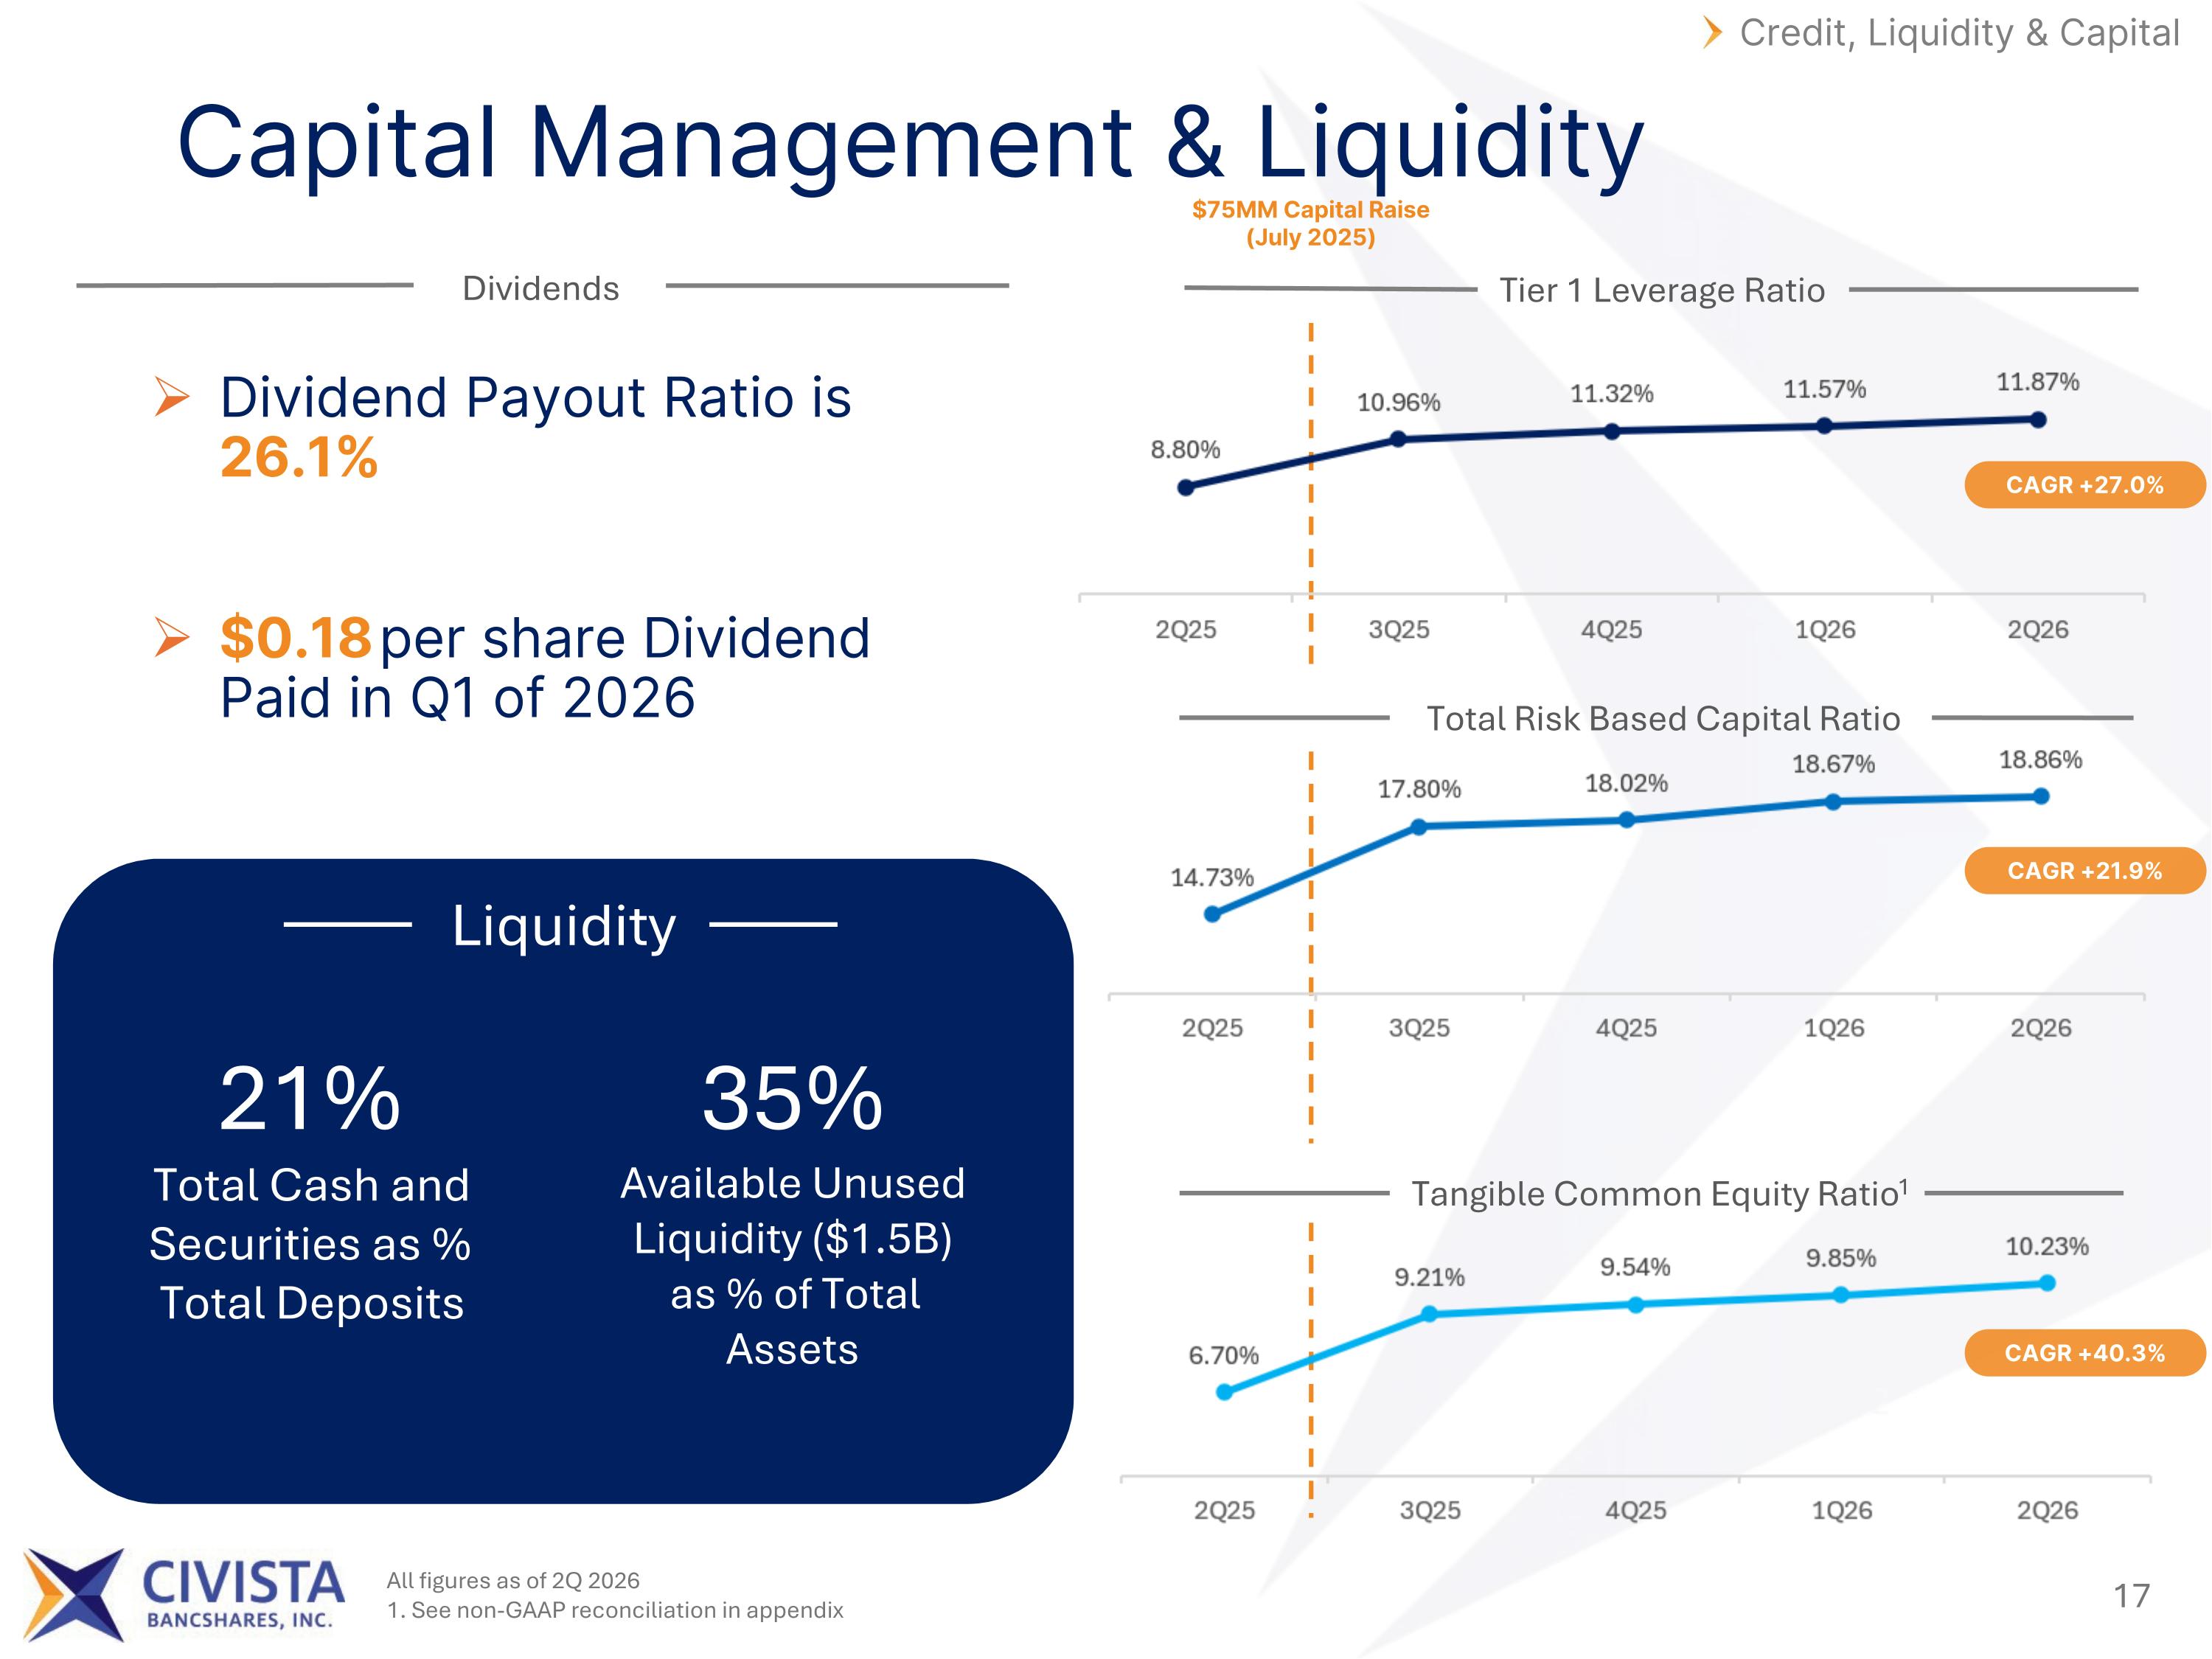
Capital Management & Liquidity Credit, Liquidity & Capital Liquidity Tier 1 Leverage Ratio Total Risk Based Capital Ratio Tangible Common Equity Ratio1 Dividend Payout Ratio is 26.1% $0.18 per share Dividend Paid in Q1 of 2026 Dividends 21% Total Cash and Securities as % Total Deposits 35% Available Unused Liquidity ($1.5B) as % of Total Assets All figures as of 2Q 2026 1. See non-GAAP reconciliation in appendix $75MM Capital Raise (July 2025) CAGR +27.0% CAGR +21.9% CAGR +40.3%
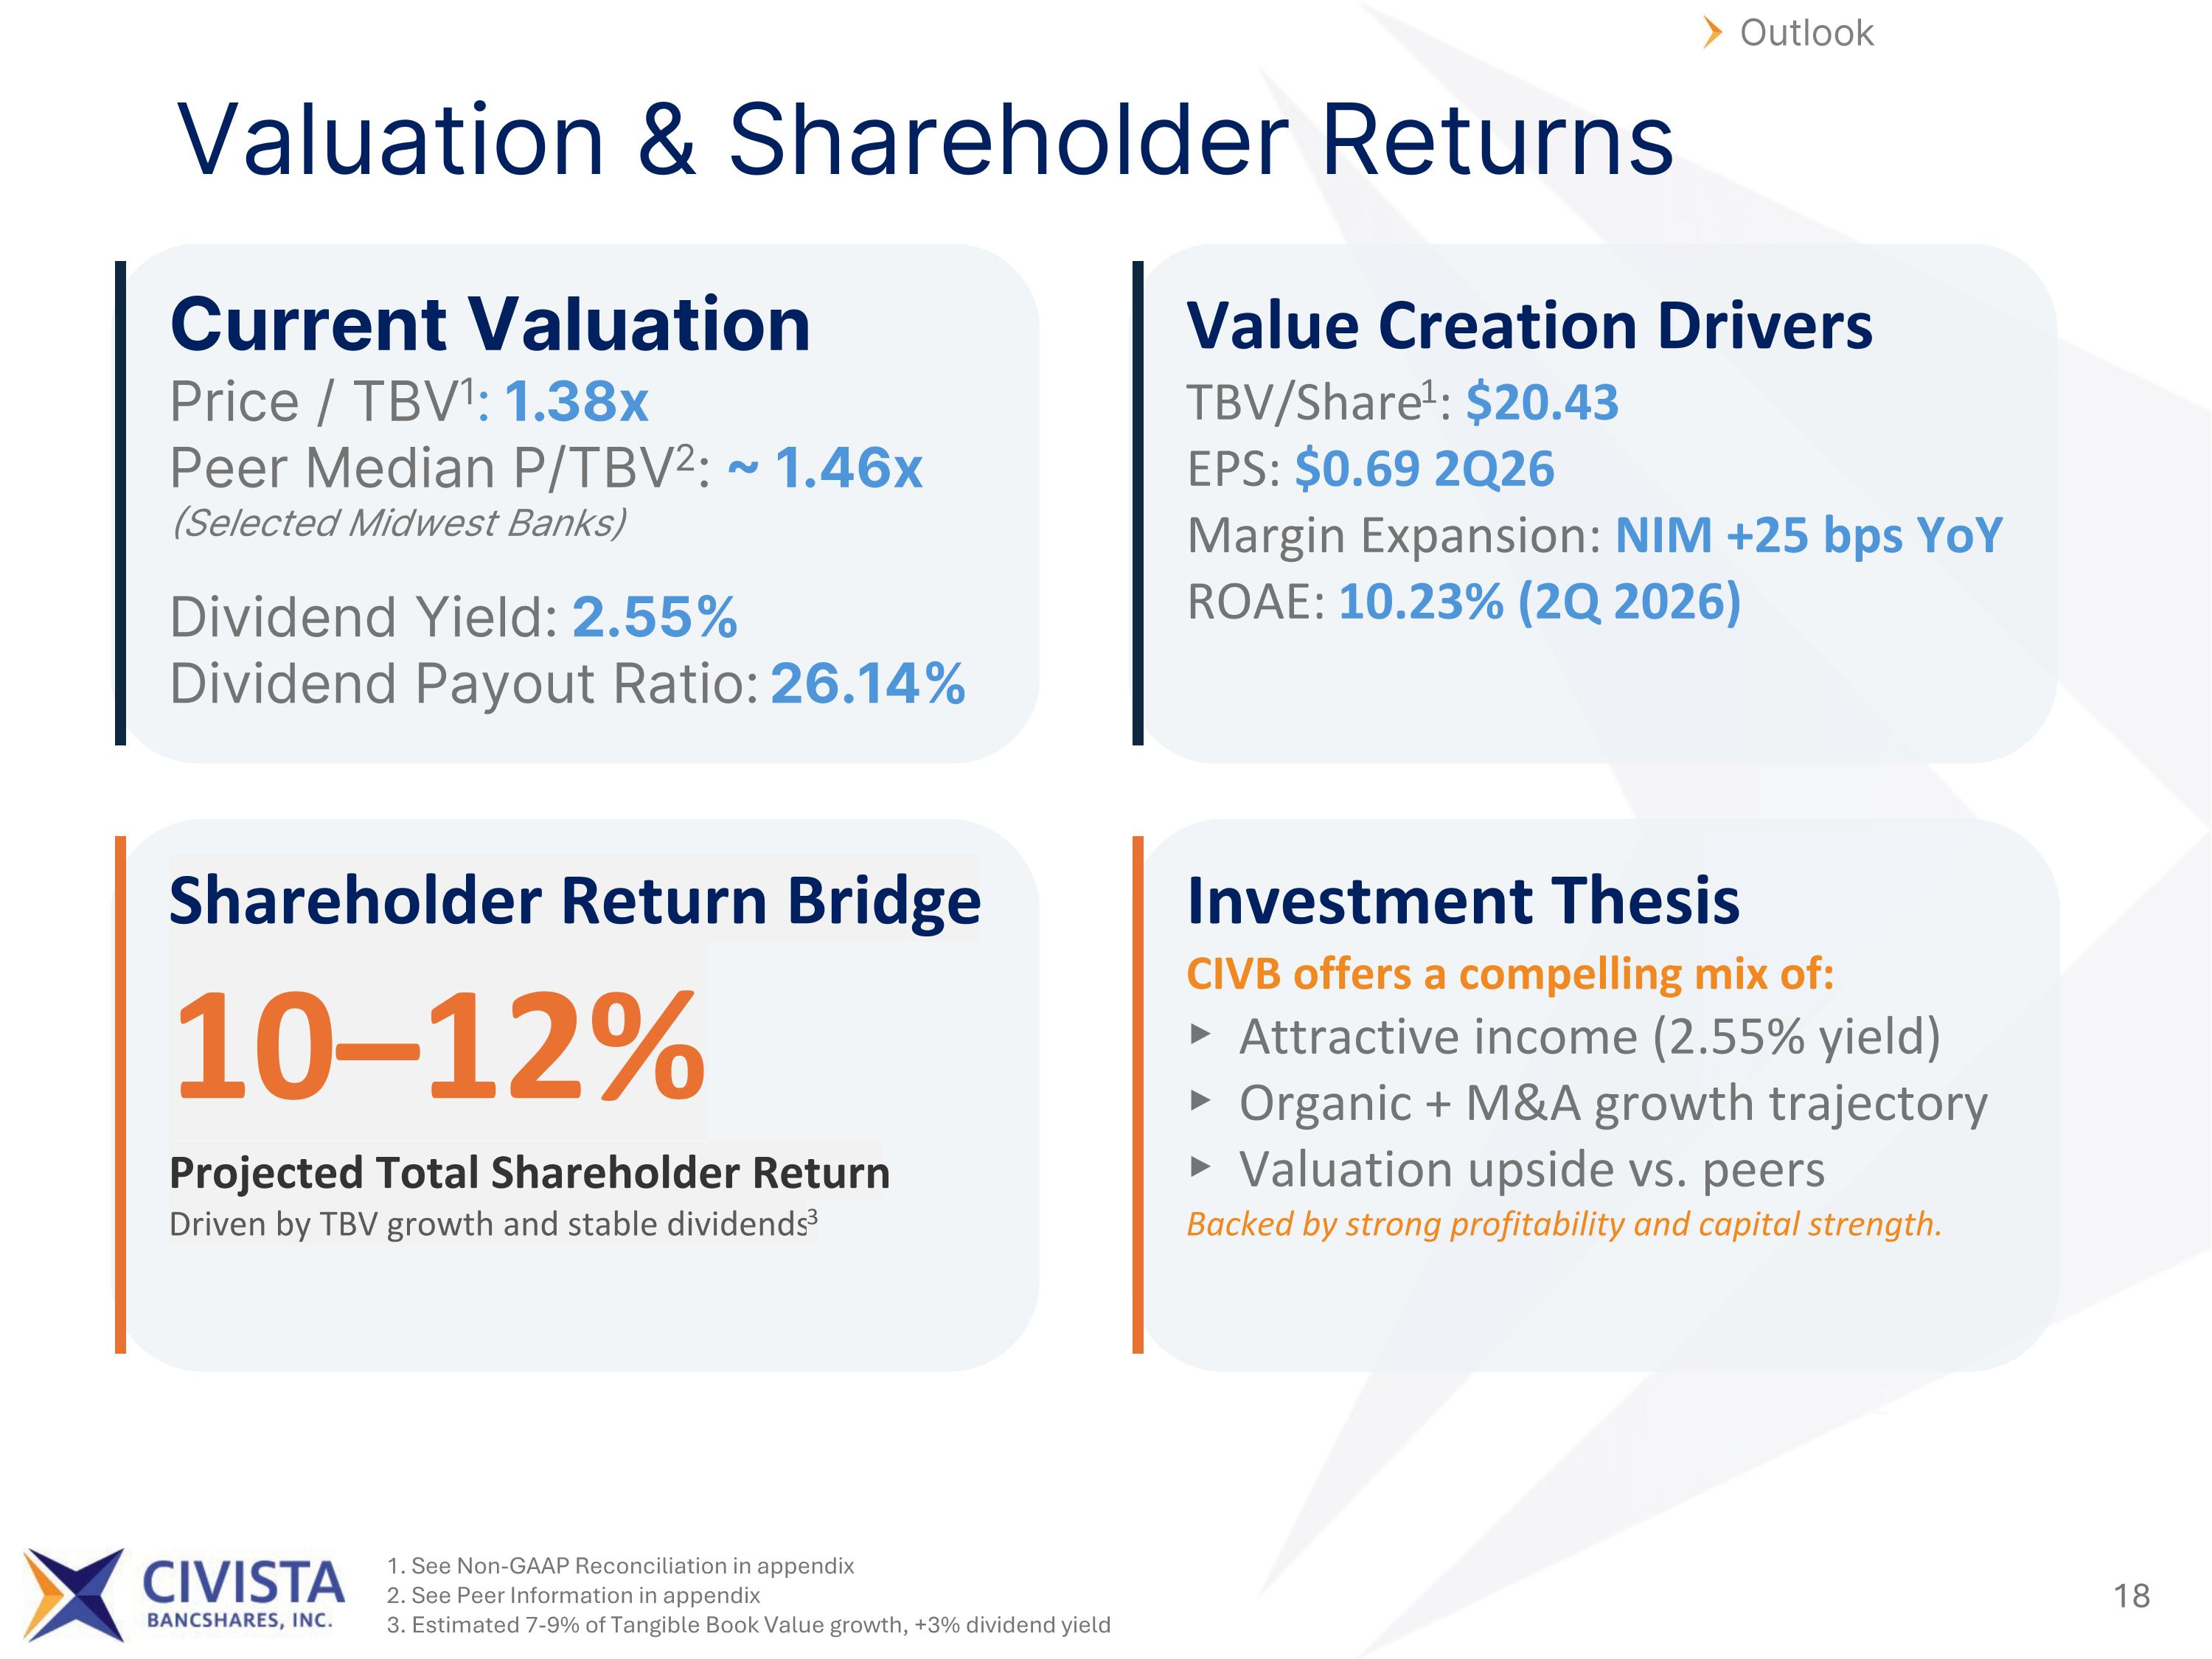
Outlook Valuation & Shareholder Returns Current Valuation Price / TBV1: 1.38x Peer Median P/TBV2: ~ 1.46x (Selected Midwest Banks) Dividend Yield: 2.55% Dividend Payout Ratio: 26.14% Value Creation Drivers TBV/Share1: $20.43 EPS: $0.69 2Q26 Margin Expansion: NIM +25 bps YoY ROAE: 10.23% (2Q 2026) Shareholder Return Bridge 10–12% Projected Total Shareholder Return Driven by TBV growth and stable dividends3 Investment Thesis CIVB offers a compelling mix of: ▸ Attractive income (2.55% yield) ▸ Organic + M&A growth trajectory ▸ Valuation upside vs. peers Backed by strong profitability and capital strength. 1. See Non-GAAP Reconciliation in appendix 2. See Peer Information in appendix 3. Estimated 7-9% of Tangible Book Value growth, +3% dividend yield
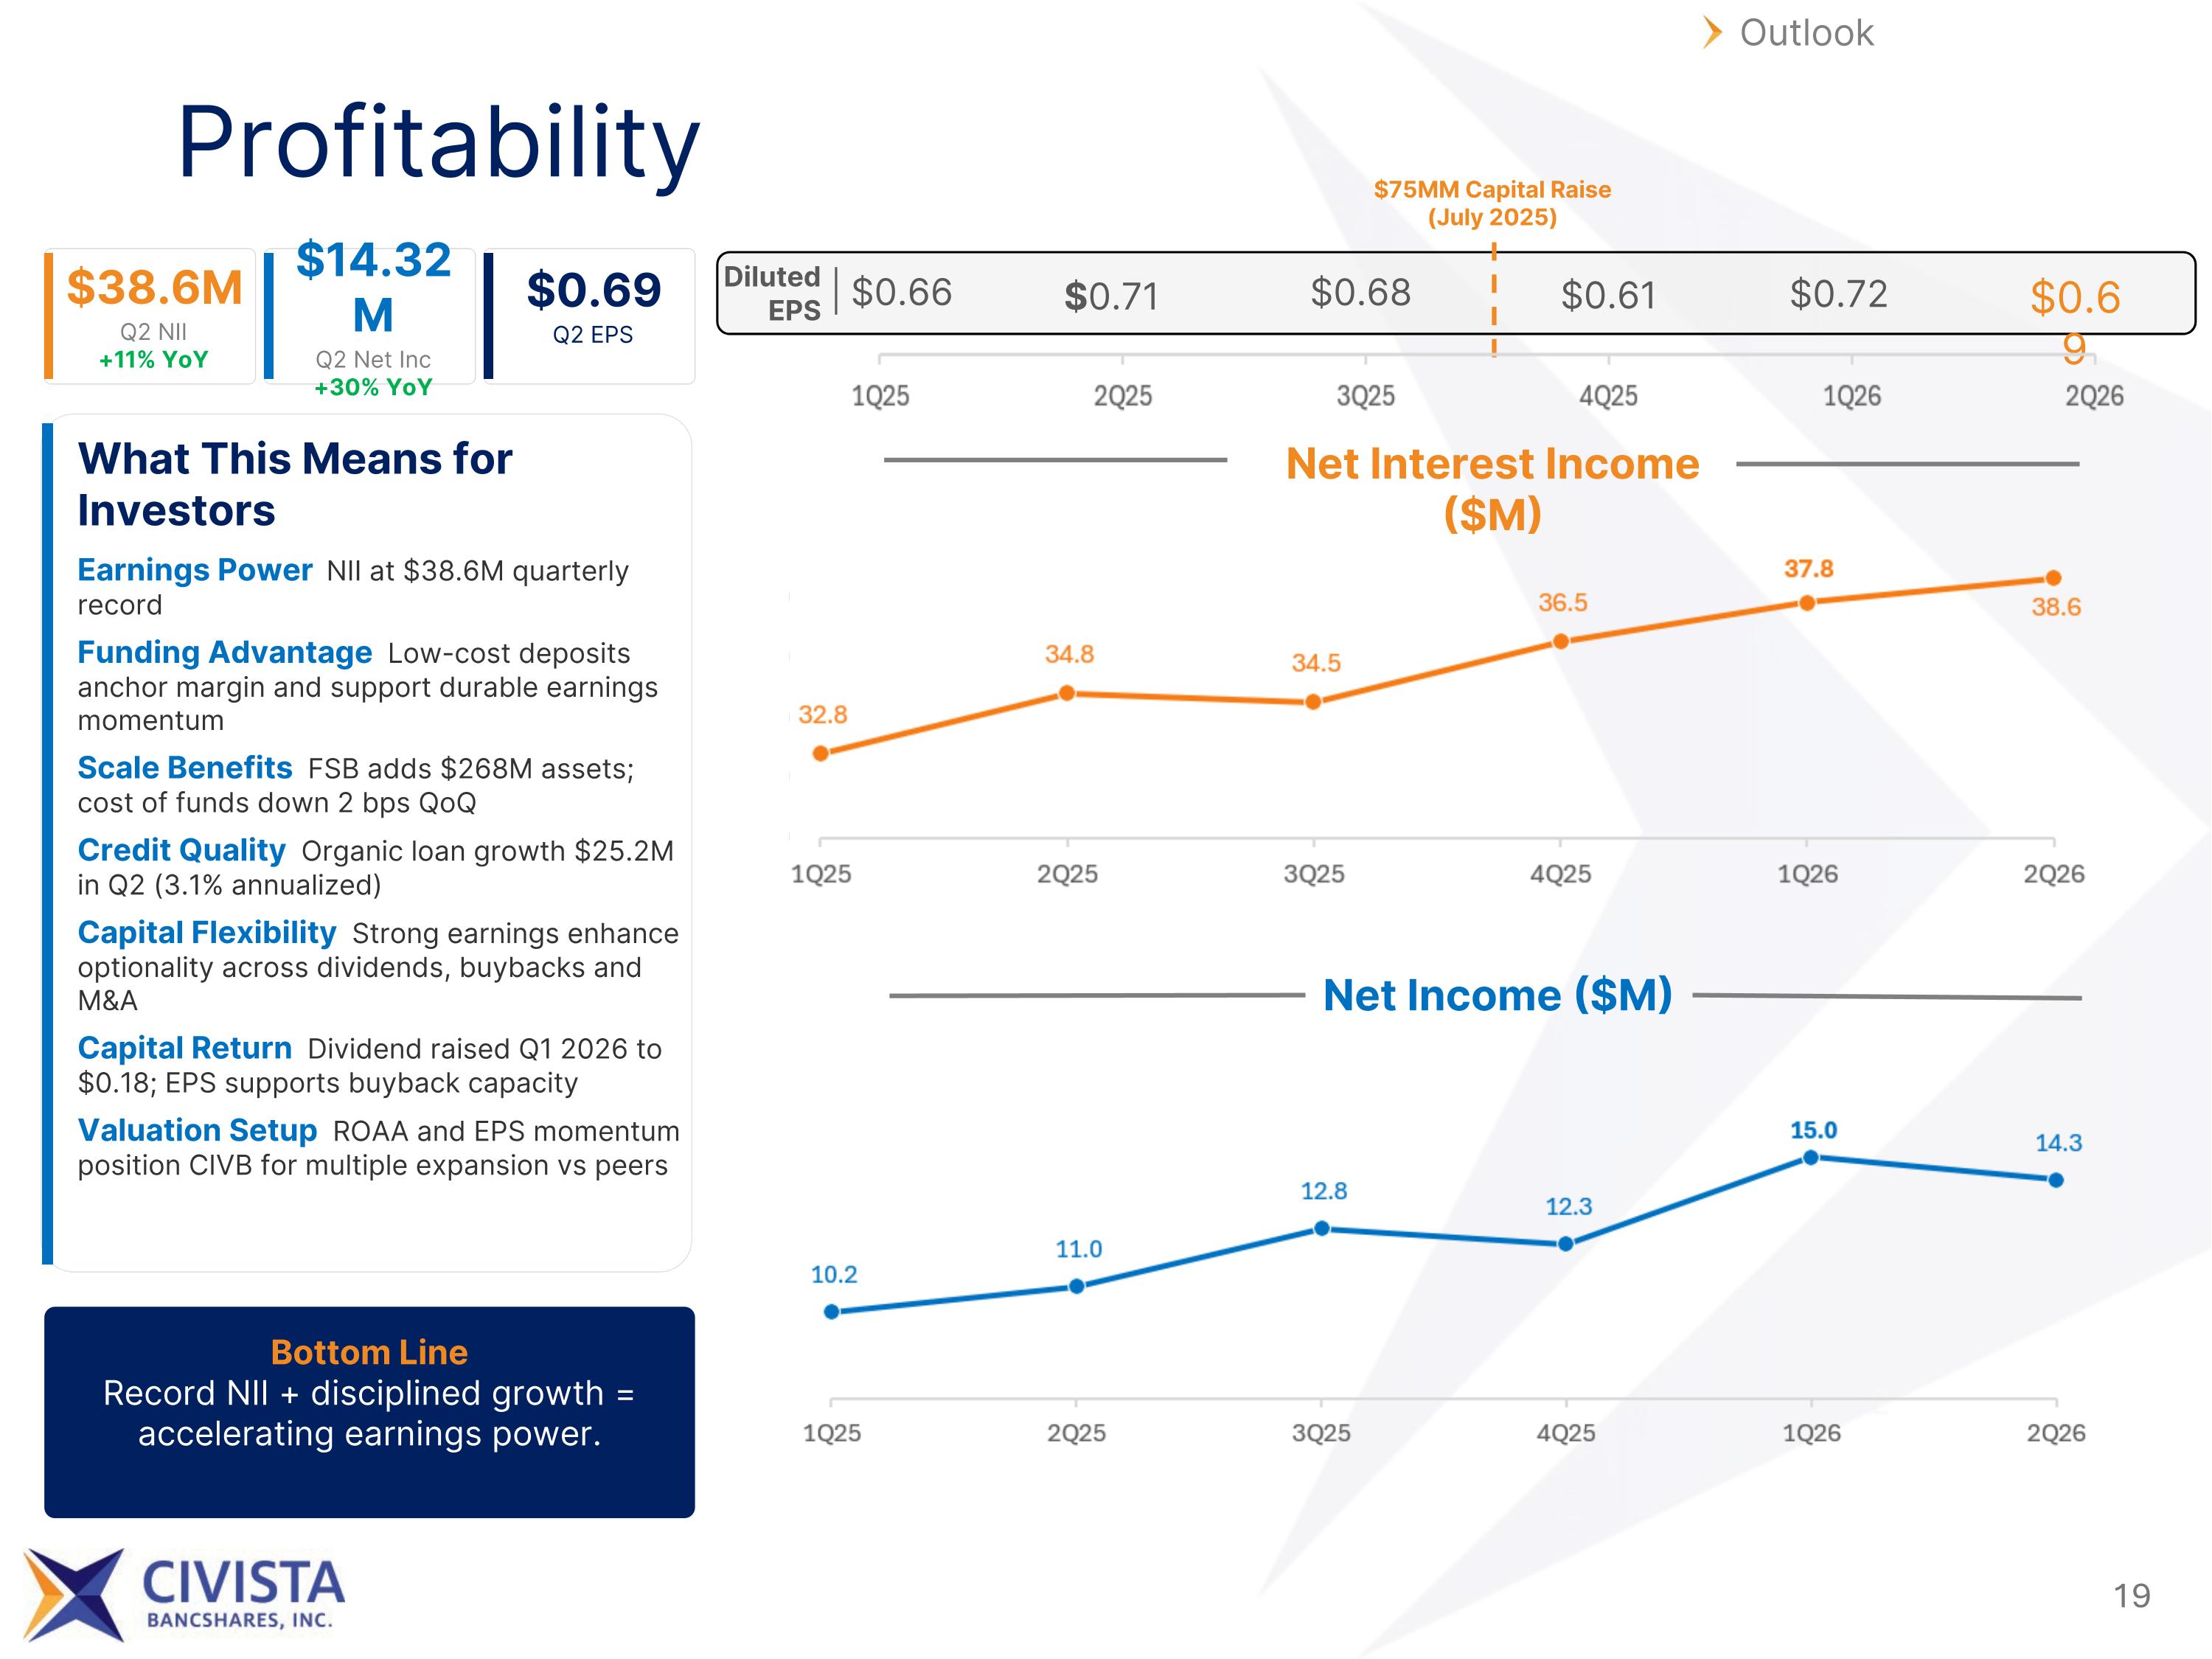
Profitability Outlook $38.6M Q2 NII +11% YoY $14.32M Q2 Net Inc +30% YoY $0.69 Q2 EPS What This Means for Investors Earnings Power NII at $38.6M quarterly record Funding Advantage Low-cost deposits anchor margin and support durable earnings momentum Scale Benefits FSB adds $268M assets; cost of funds down 2 bps QoQ Credit Quality Organic loan growth $25.2M in Q2 (3.1% annualized) Capital Flexibility Strong earnings enhance optionality across dividends, buybacks and M&A Capital Return Dividend raised Q1 2026 to $0.18; EPS supports buyback capacity Valuation Setup ROAA and EPS momentum position CIVB for multiple expansion vs peers Bottom Line Record NII + disciplined growth = accelerating earnings power. Net Interest Income ($M) Net Income ($M) Diluted EPS $0.66 $0.71 $0.68 $0.72 $0.61 $75MM Capital Raise (July 2025) $0.69
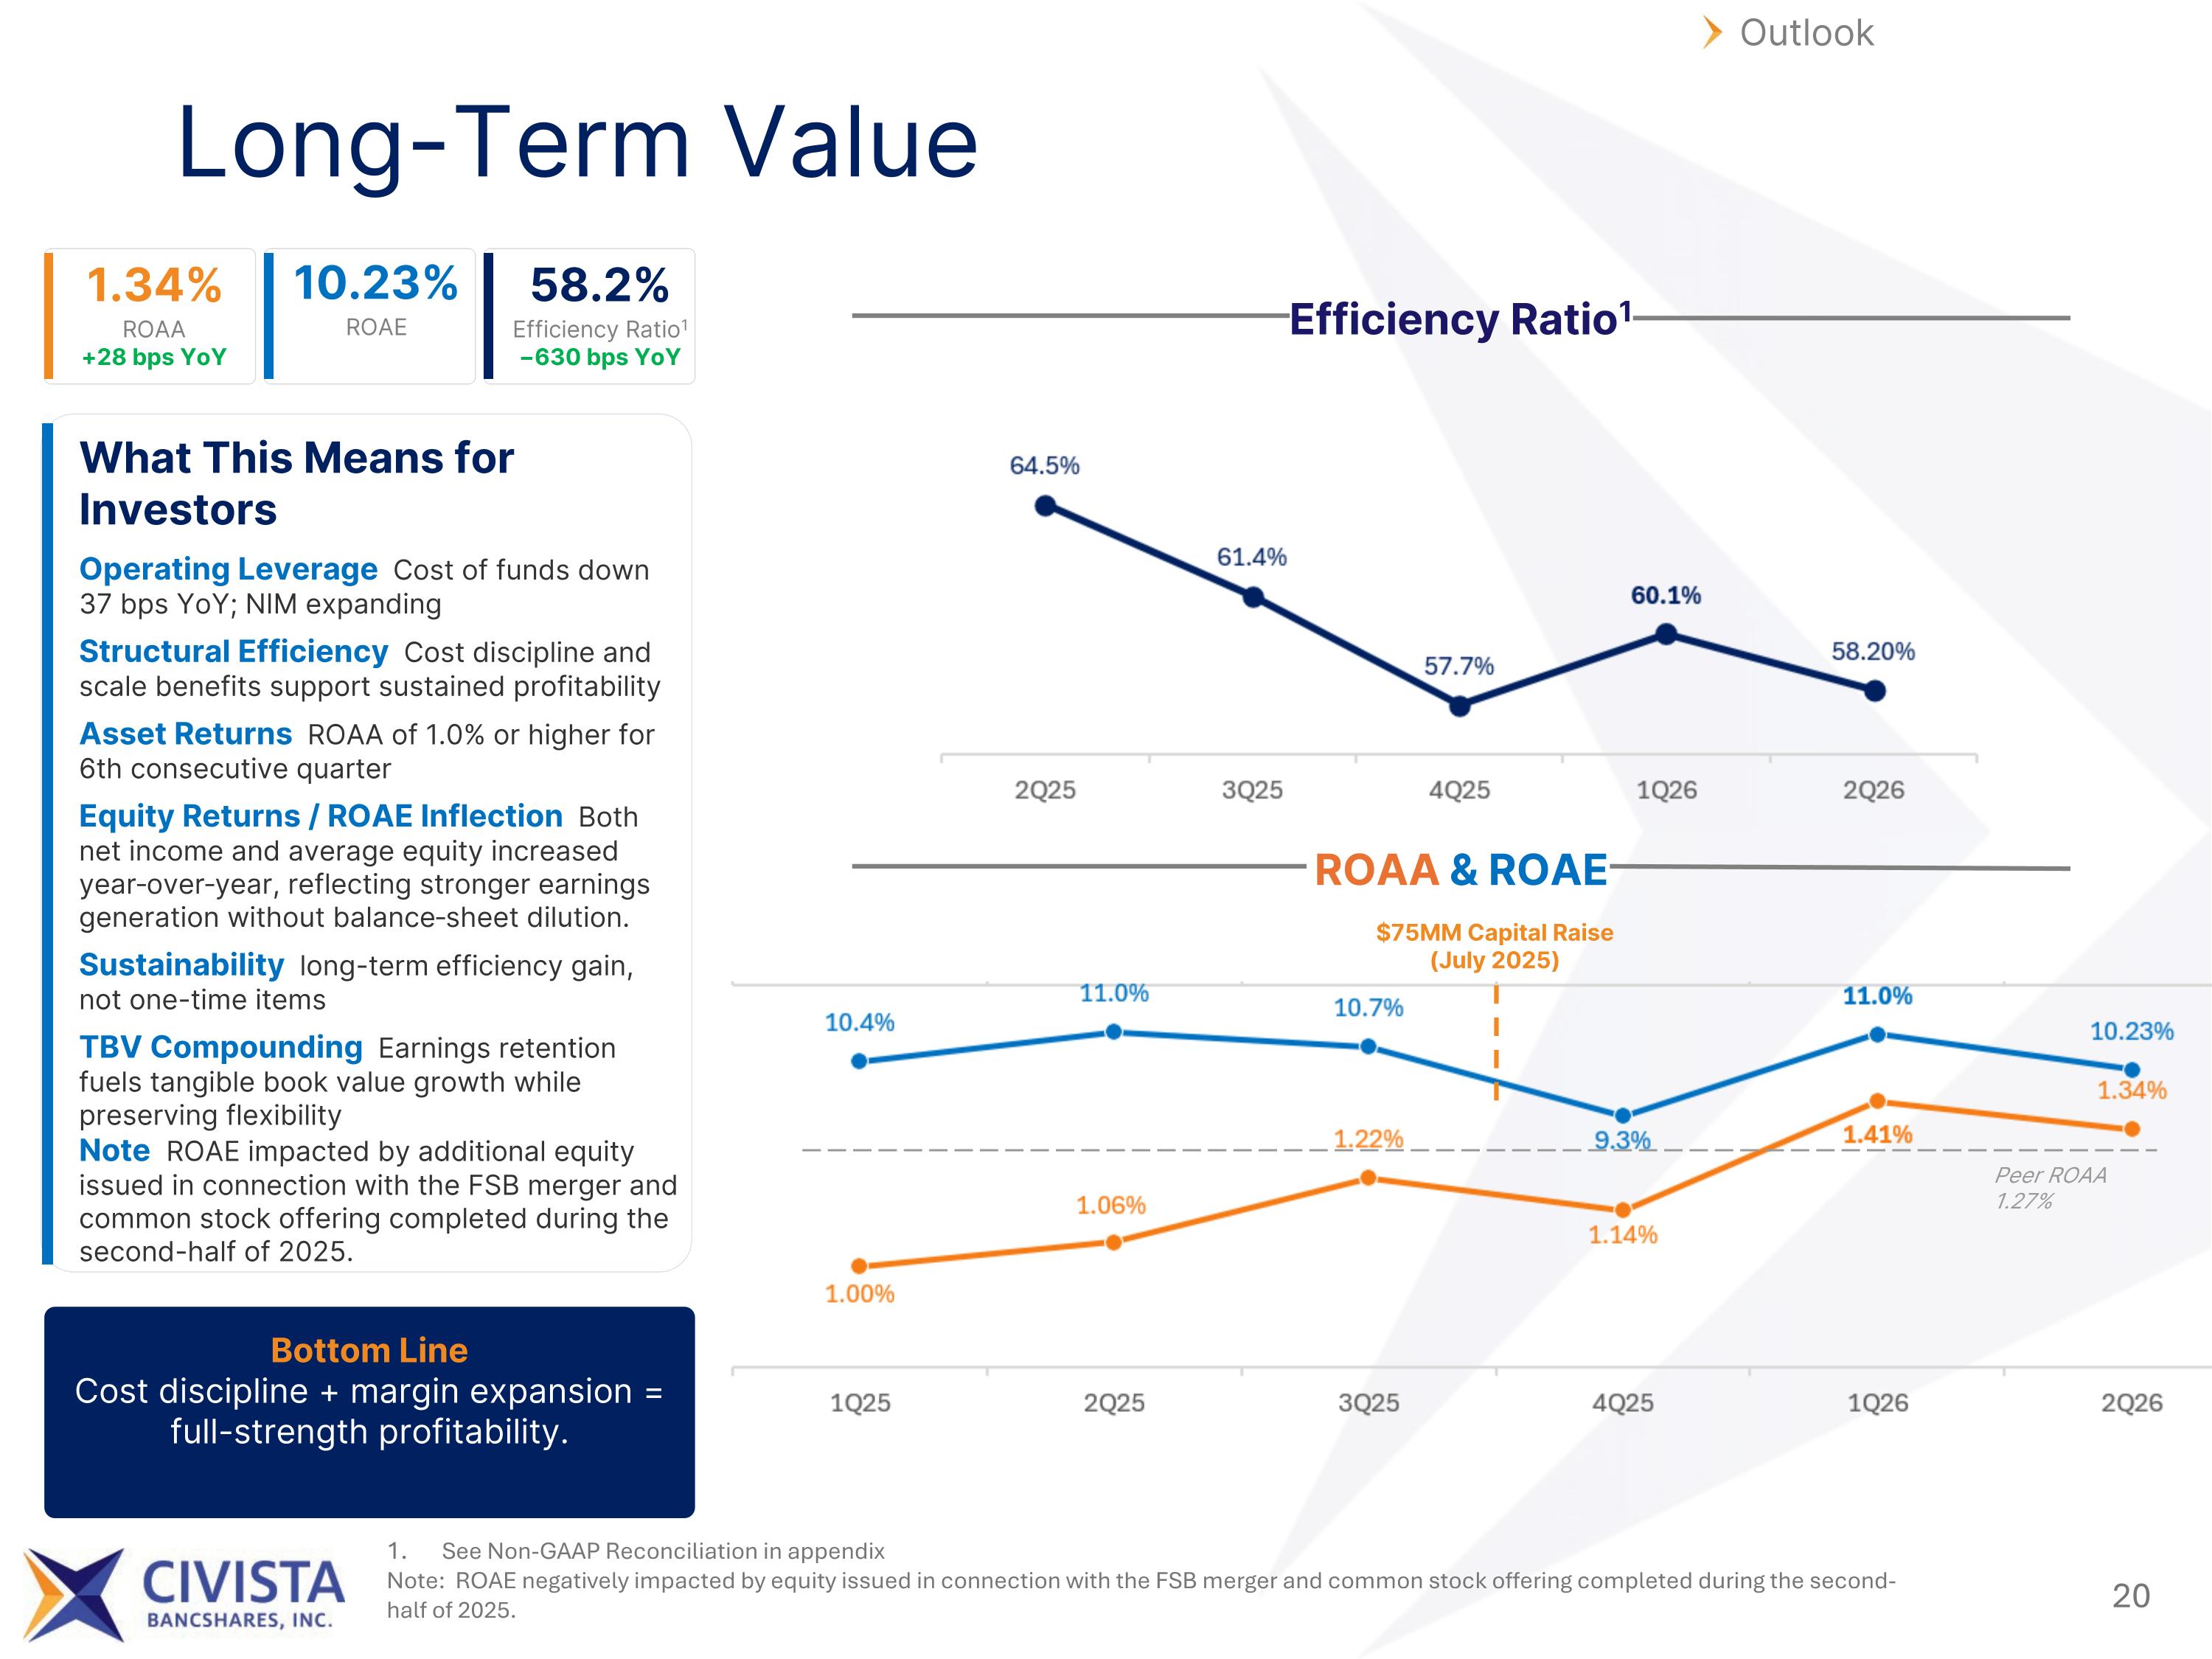
Long-Term Value Outlook 1.34% ROAA +28 bps YoY 10.23% ROAE 58.2% Efficiency Ratio1 −630 bps YoY What This Means for Investors Operating Leverage Cost of funds down 37 bps YoY; NIM expanding Structural Efficiency Cost discipline and scale benefits support sustained profitability Asset Returns ROAA of 1.0% or higher for 6th consecutive quarter Equity Returns / ROAE Inflection Both net income and average equity increased year‑over‑year, reflecting stronger earnings generation without balance‑sheet dilution. Sustainability long-term efficiency gain, not one-time items TBV Compounding Earnings retention fuels tangible book value growth while preserving flexibility Note ROAE impacted by additional equity issued in connection with the FSB merger and common stock offering completed during the second-half of 2025. Peer ROAA 1.27% Bottom Line Cost discipline + margin expansion = full-strength profitability. Efficiency Ratio1 ROAA & ROAE See Non-GAAP Reconciliation in appendix Note: ROAE negatively impacted by equity issued in connection with the FSB merger and common stock offering completed during the second-half of 2025. $75MM Capital Raise (July 2025)
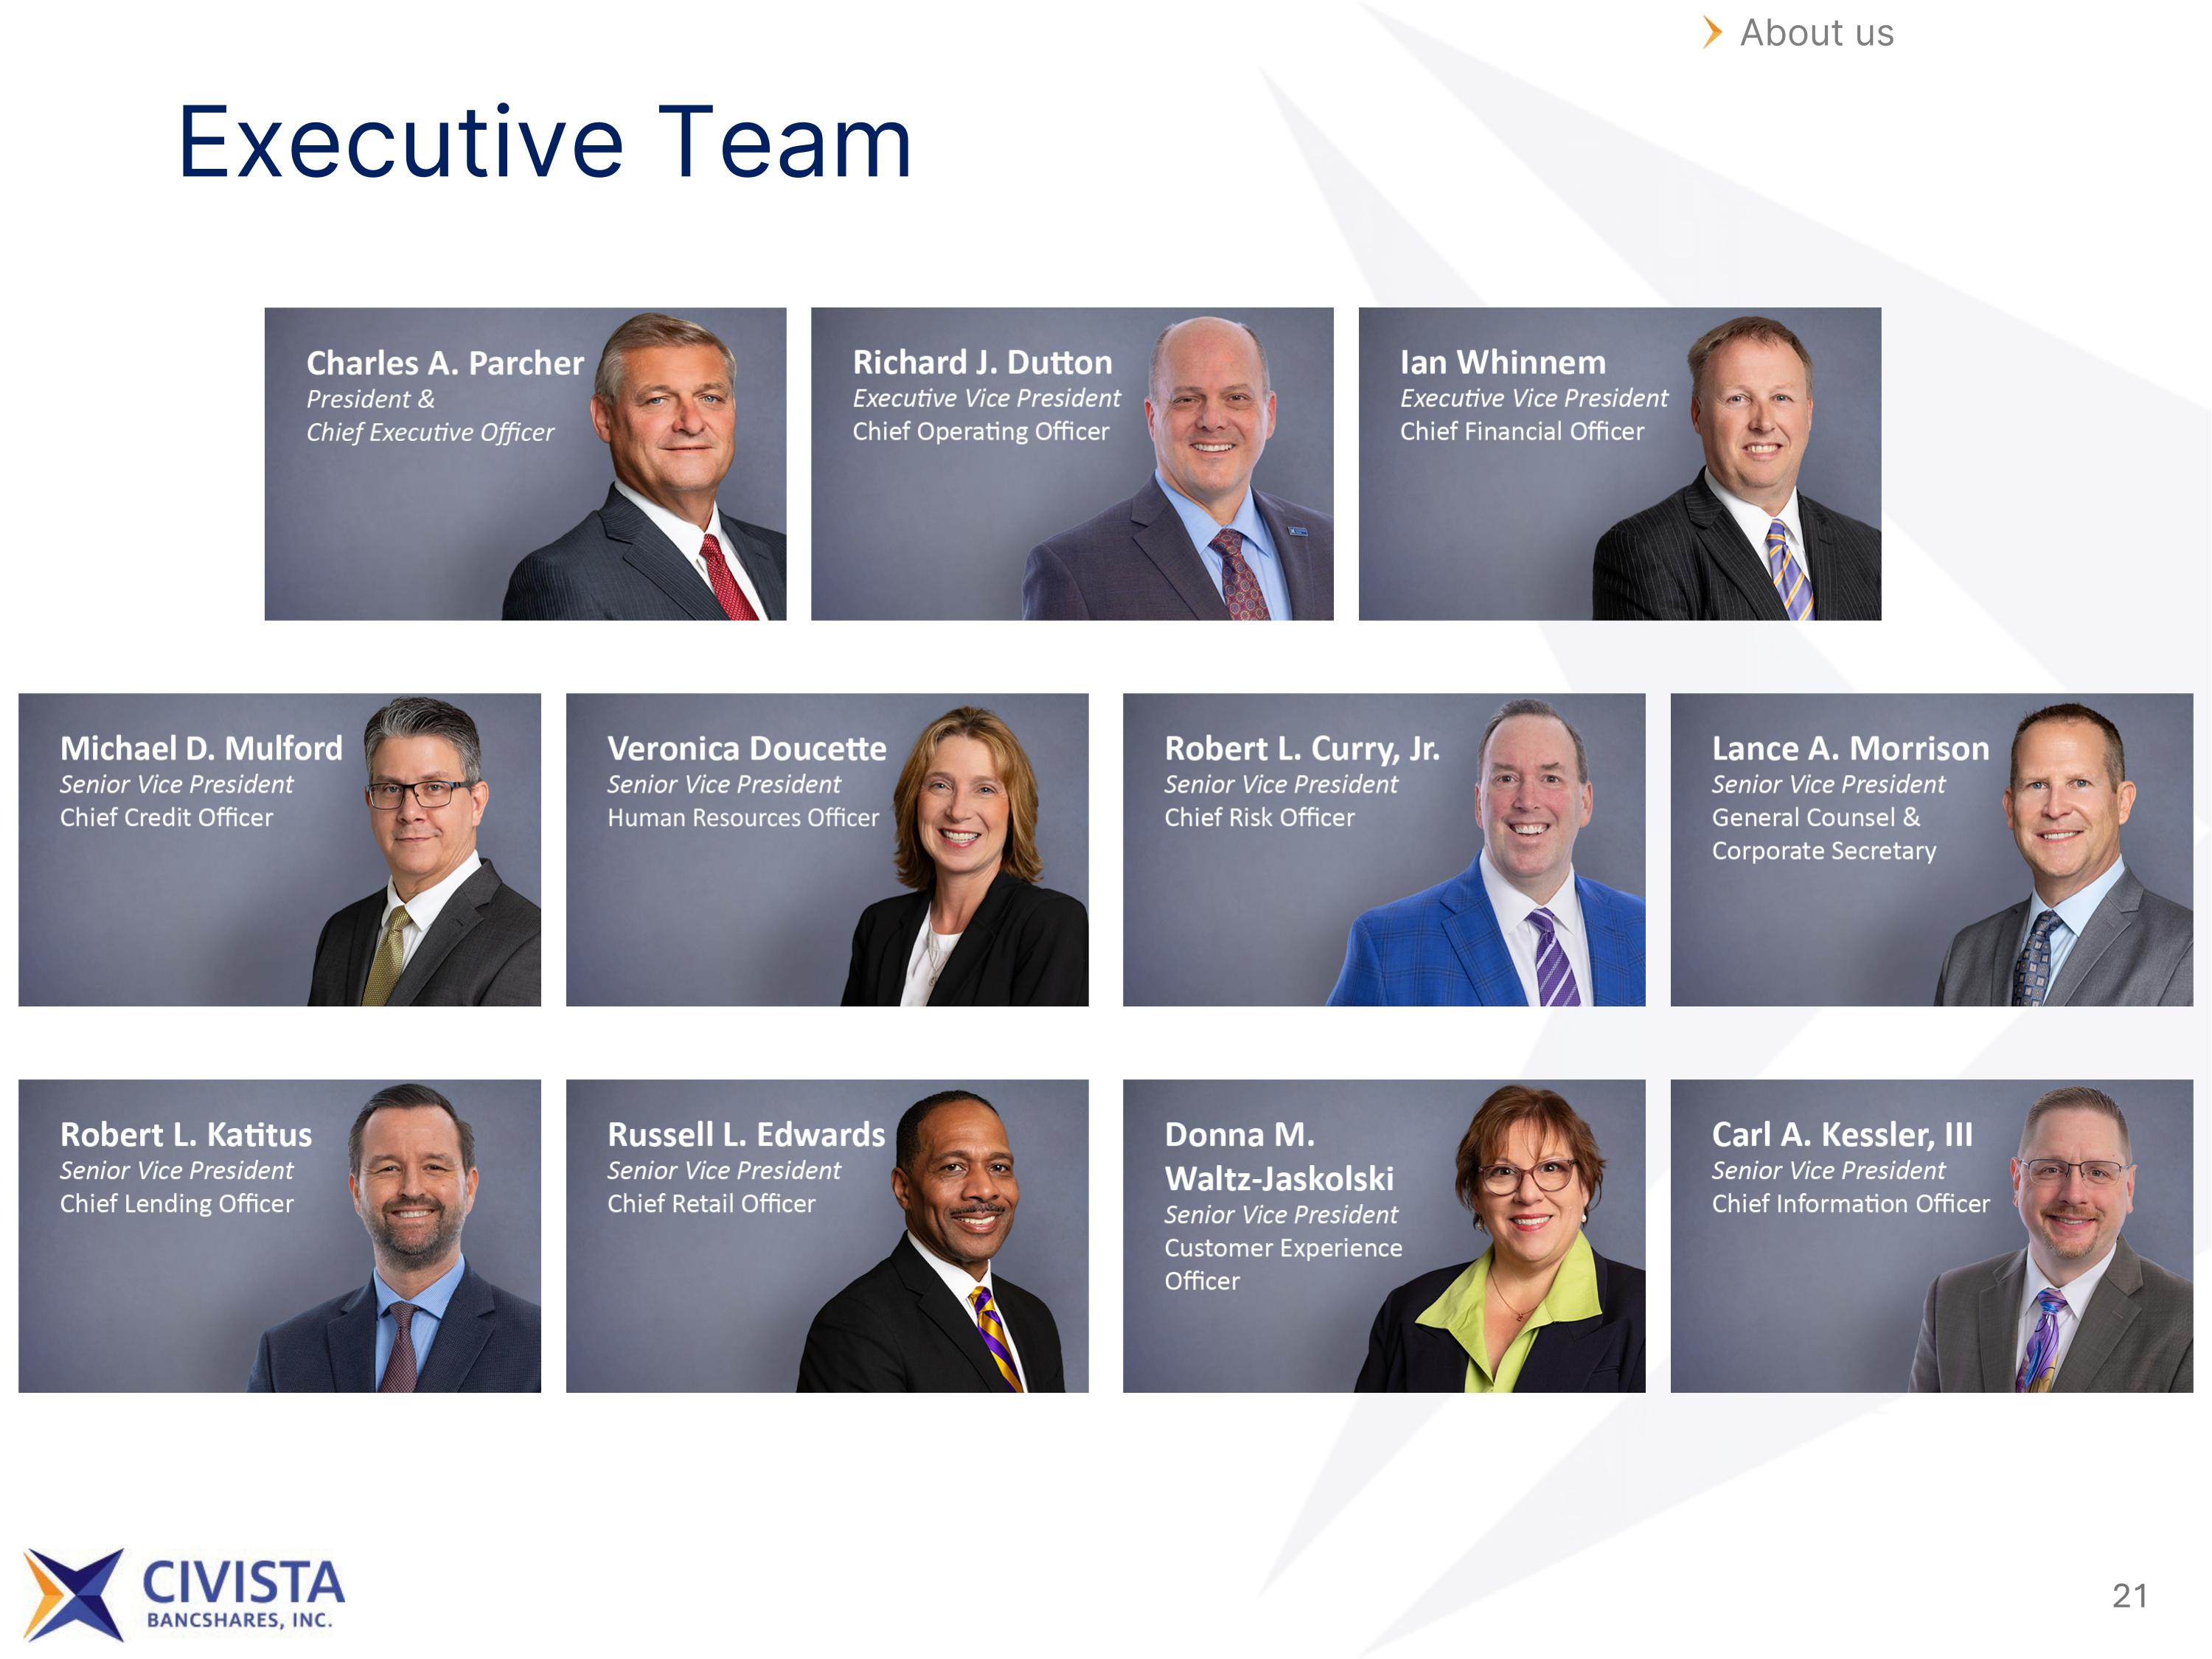
Executive Team About us
Appendix
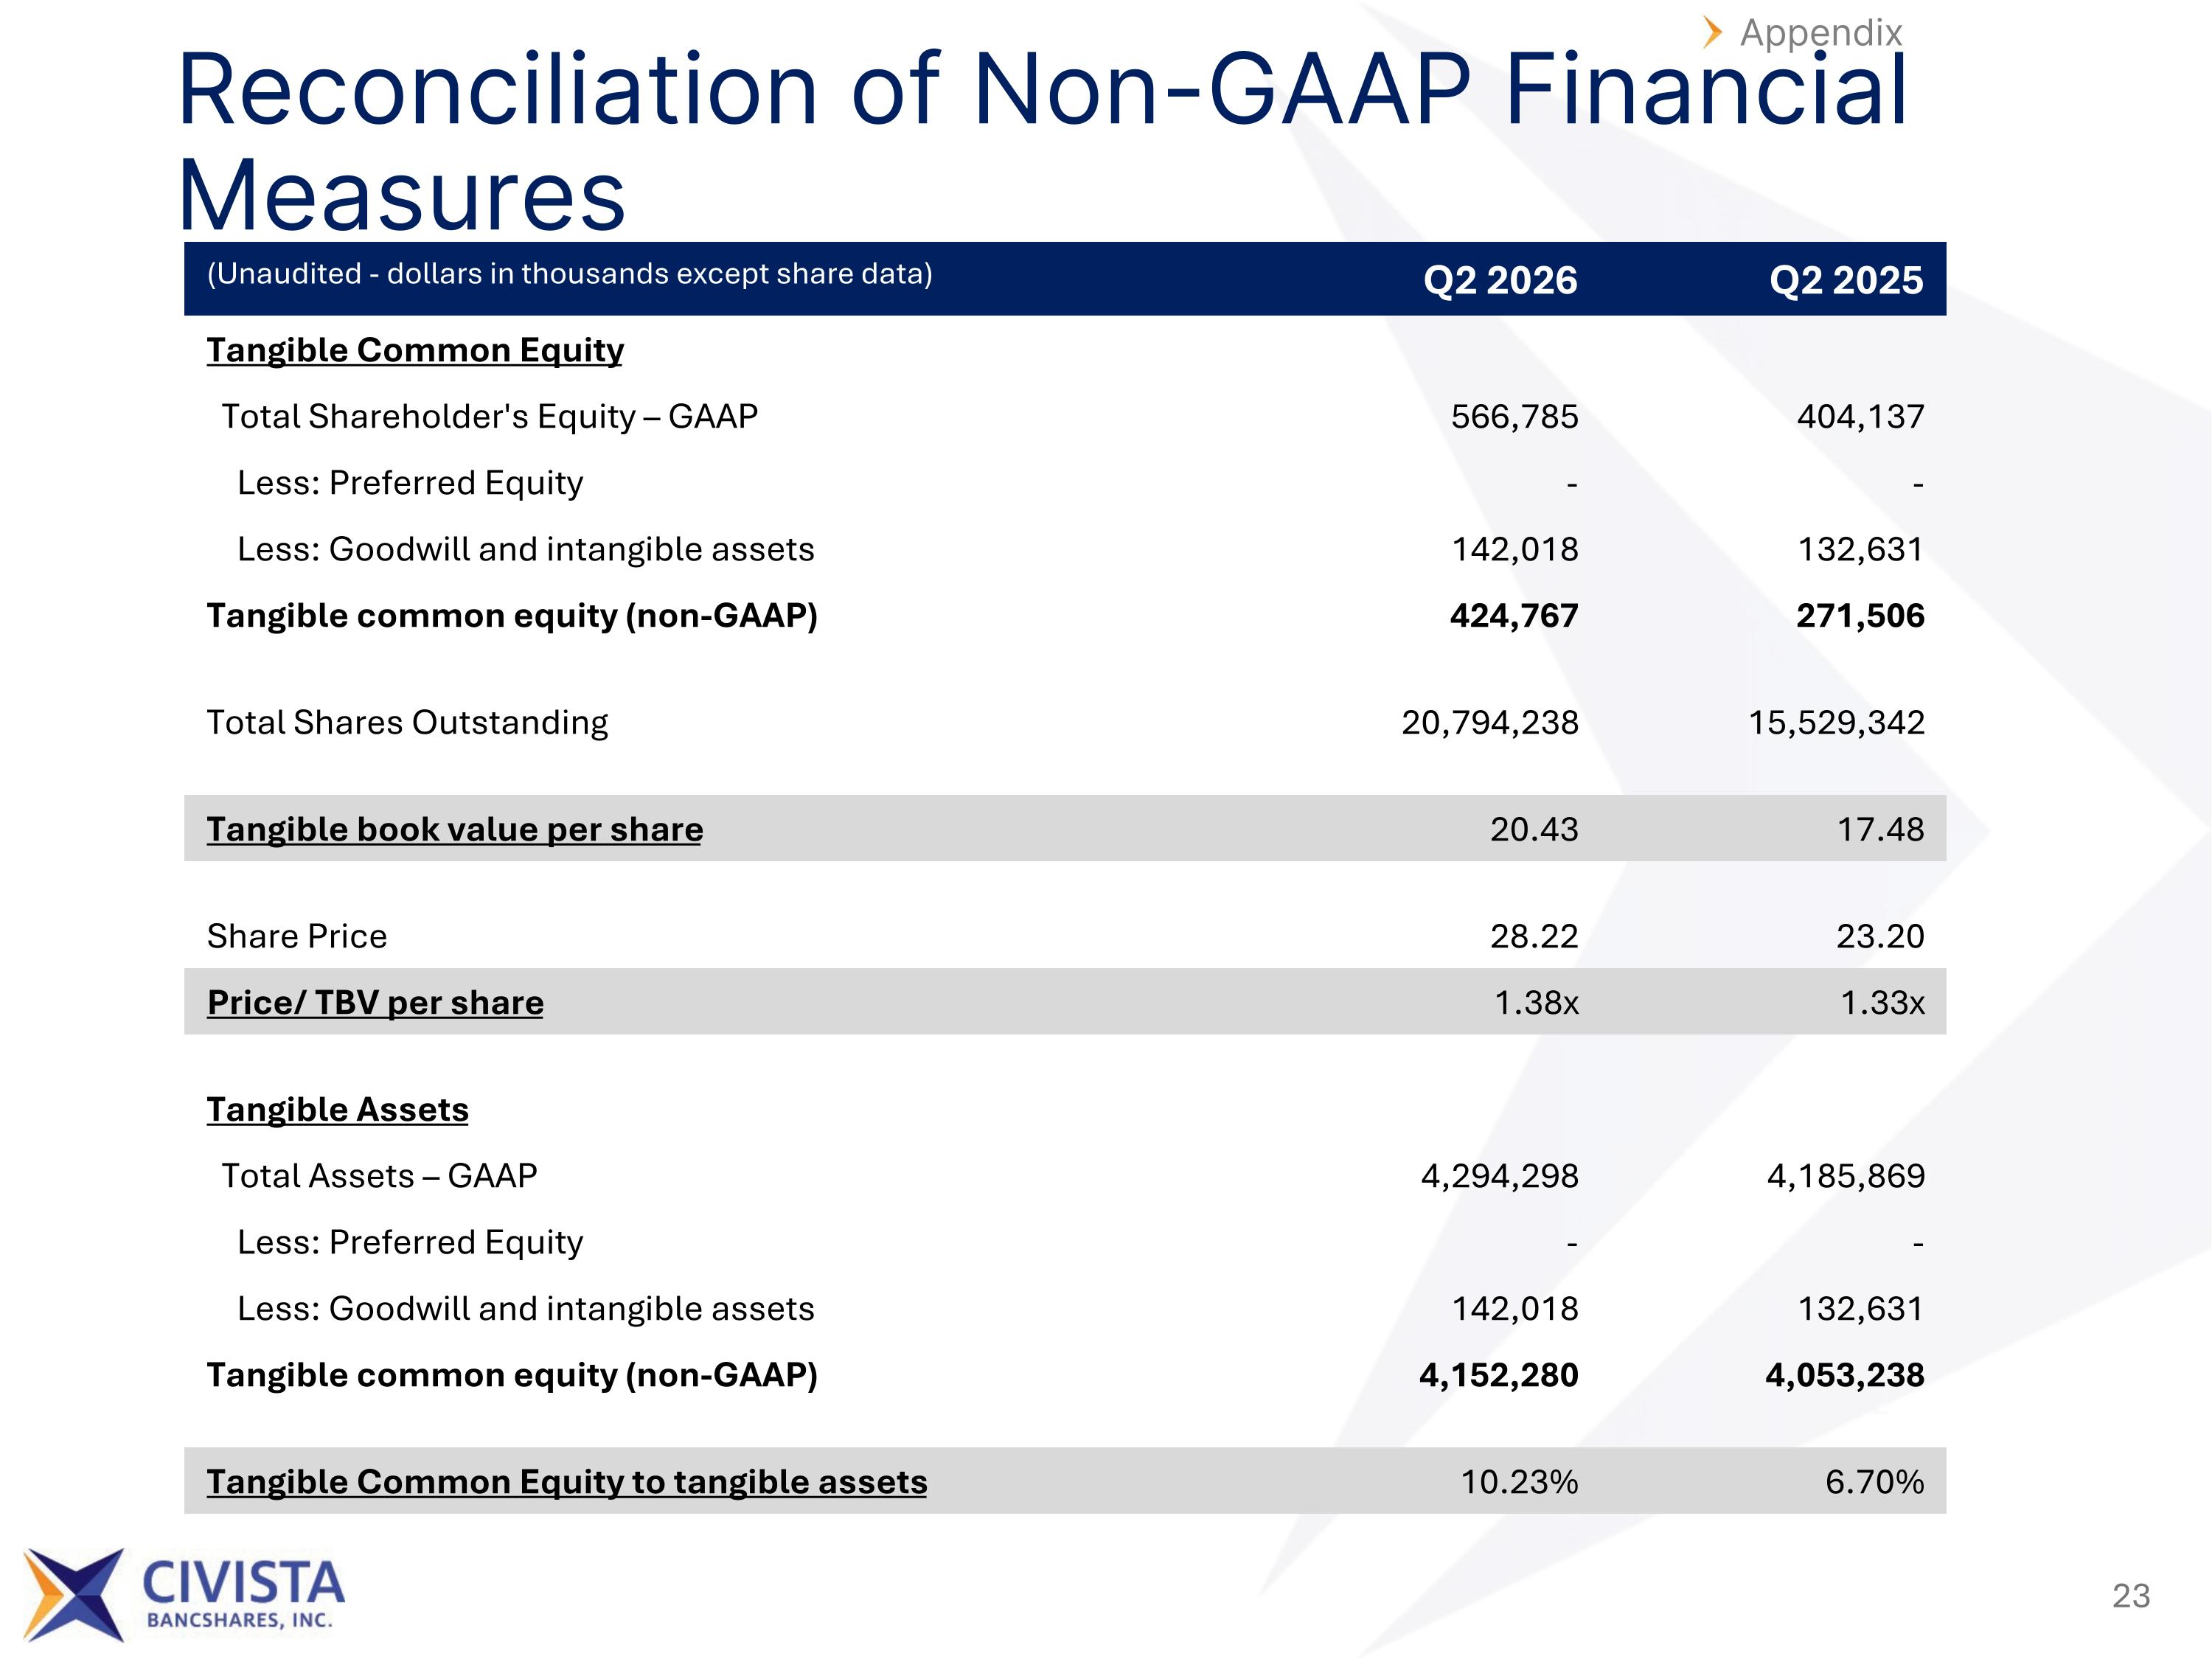
Reconciliation of Non-GAAP Financial Measures Appendix (Unaudited - dollars in thousands except share data) Q2 2026 Q2 2025 Tangible Common Equity Total Shareholder's Equity – GAAP 566,785 404,137 Less: Preferred Equity - - Less: Goodwill and intangible assets 142,018 132,631 Tangible common equity (non-GAAP) 424,767 271,506 Total Shares Outstanding 20,794,238 15,529,342 Tangible book value per share 20.43 17.48 Share Price 28.22 23.20 Price/ TBV per share 1.38x 1.33x Tangible Assets Total Assets – GAAP 4,294,298 4,185,869 Less: Preferred Equity - - Less: Goodwill and intangible assets 142,018 132,631 Tangible common equity (non-GAAP) 4,152,280 4,053,238 Tangible Common Equity to tangible assets 10.23% 6.70%
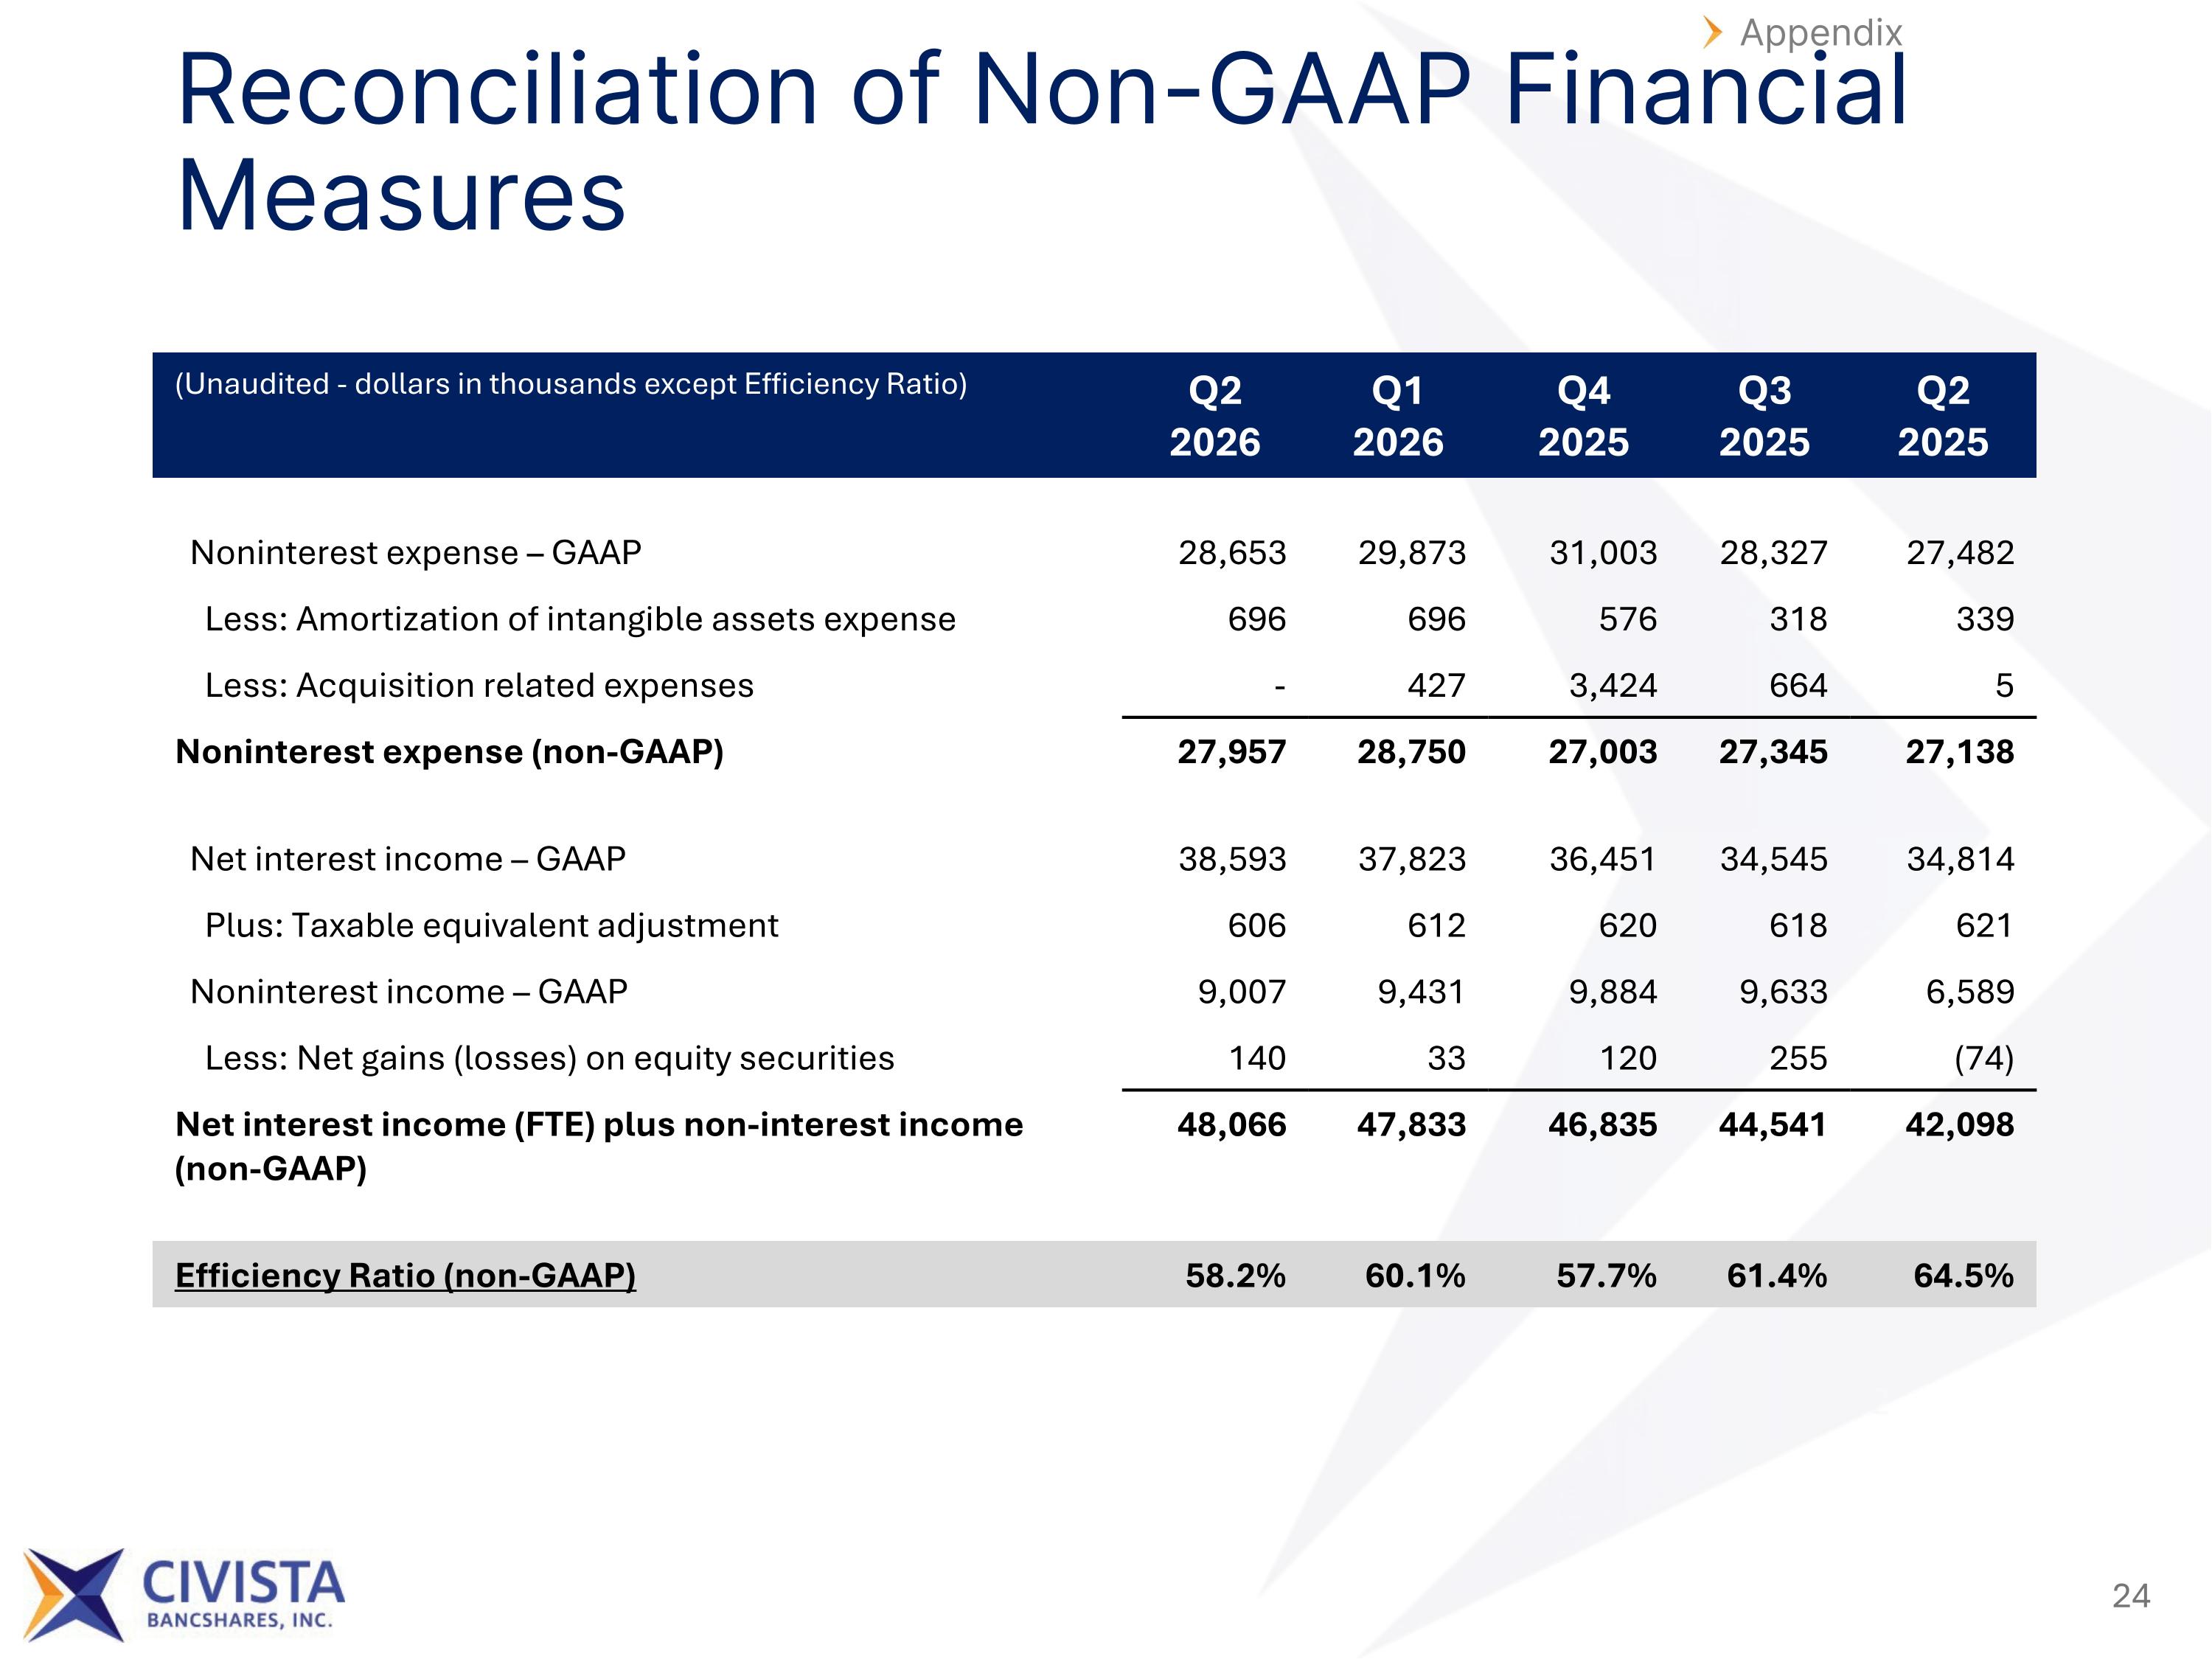
Reconciliation of Non-GAAP Financial Measures Appendix (Unaudited - dollars in thousands except Efficiency Ratio) Q2 2026 Q1 2026 Q4 2025 Q3 2025 Q2 2025 Noninterest expense – GAAP 28,653 29,873 31,003 28,327 27,482 Less: Amortization of intangible assets expense 696 696 576 318 339 Less: Acquisition related expenses - 427 3,424 664 5 Noninterest expense (non-GAAP) 27,957 28,750 27,003 27,345 27,138 Net interest income – GAAP 38,593 37,823 36,451 34,545 34,814 Plus: Taxable equivalent adjustment 606 612 620 618 621 Noninterest income – GAAP 9,007 9,431 9,884 9,633 6,589 Less: Net gains (losses) on equity securities 140 33 120 255 (74) Net interest income (FTE) plus non-interest income (non-GAAP) 48,066 47,833 46,835 44,541 42,098 Efficiency Ratio (non-GAAP) 58.2% 60.1% 57.7% 61.4% 64.5%
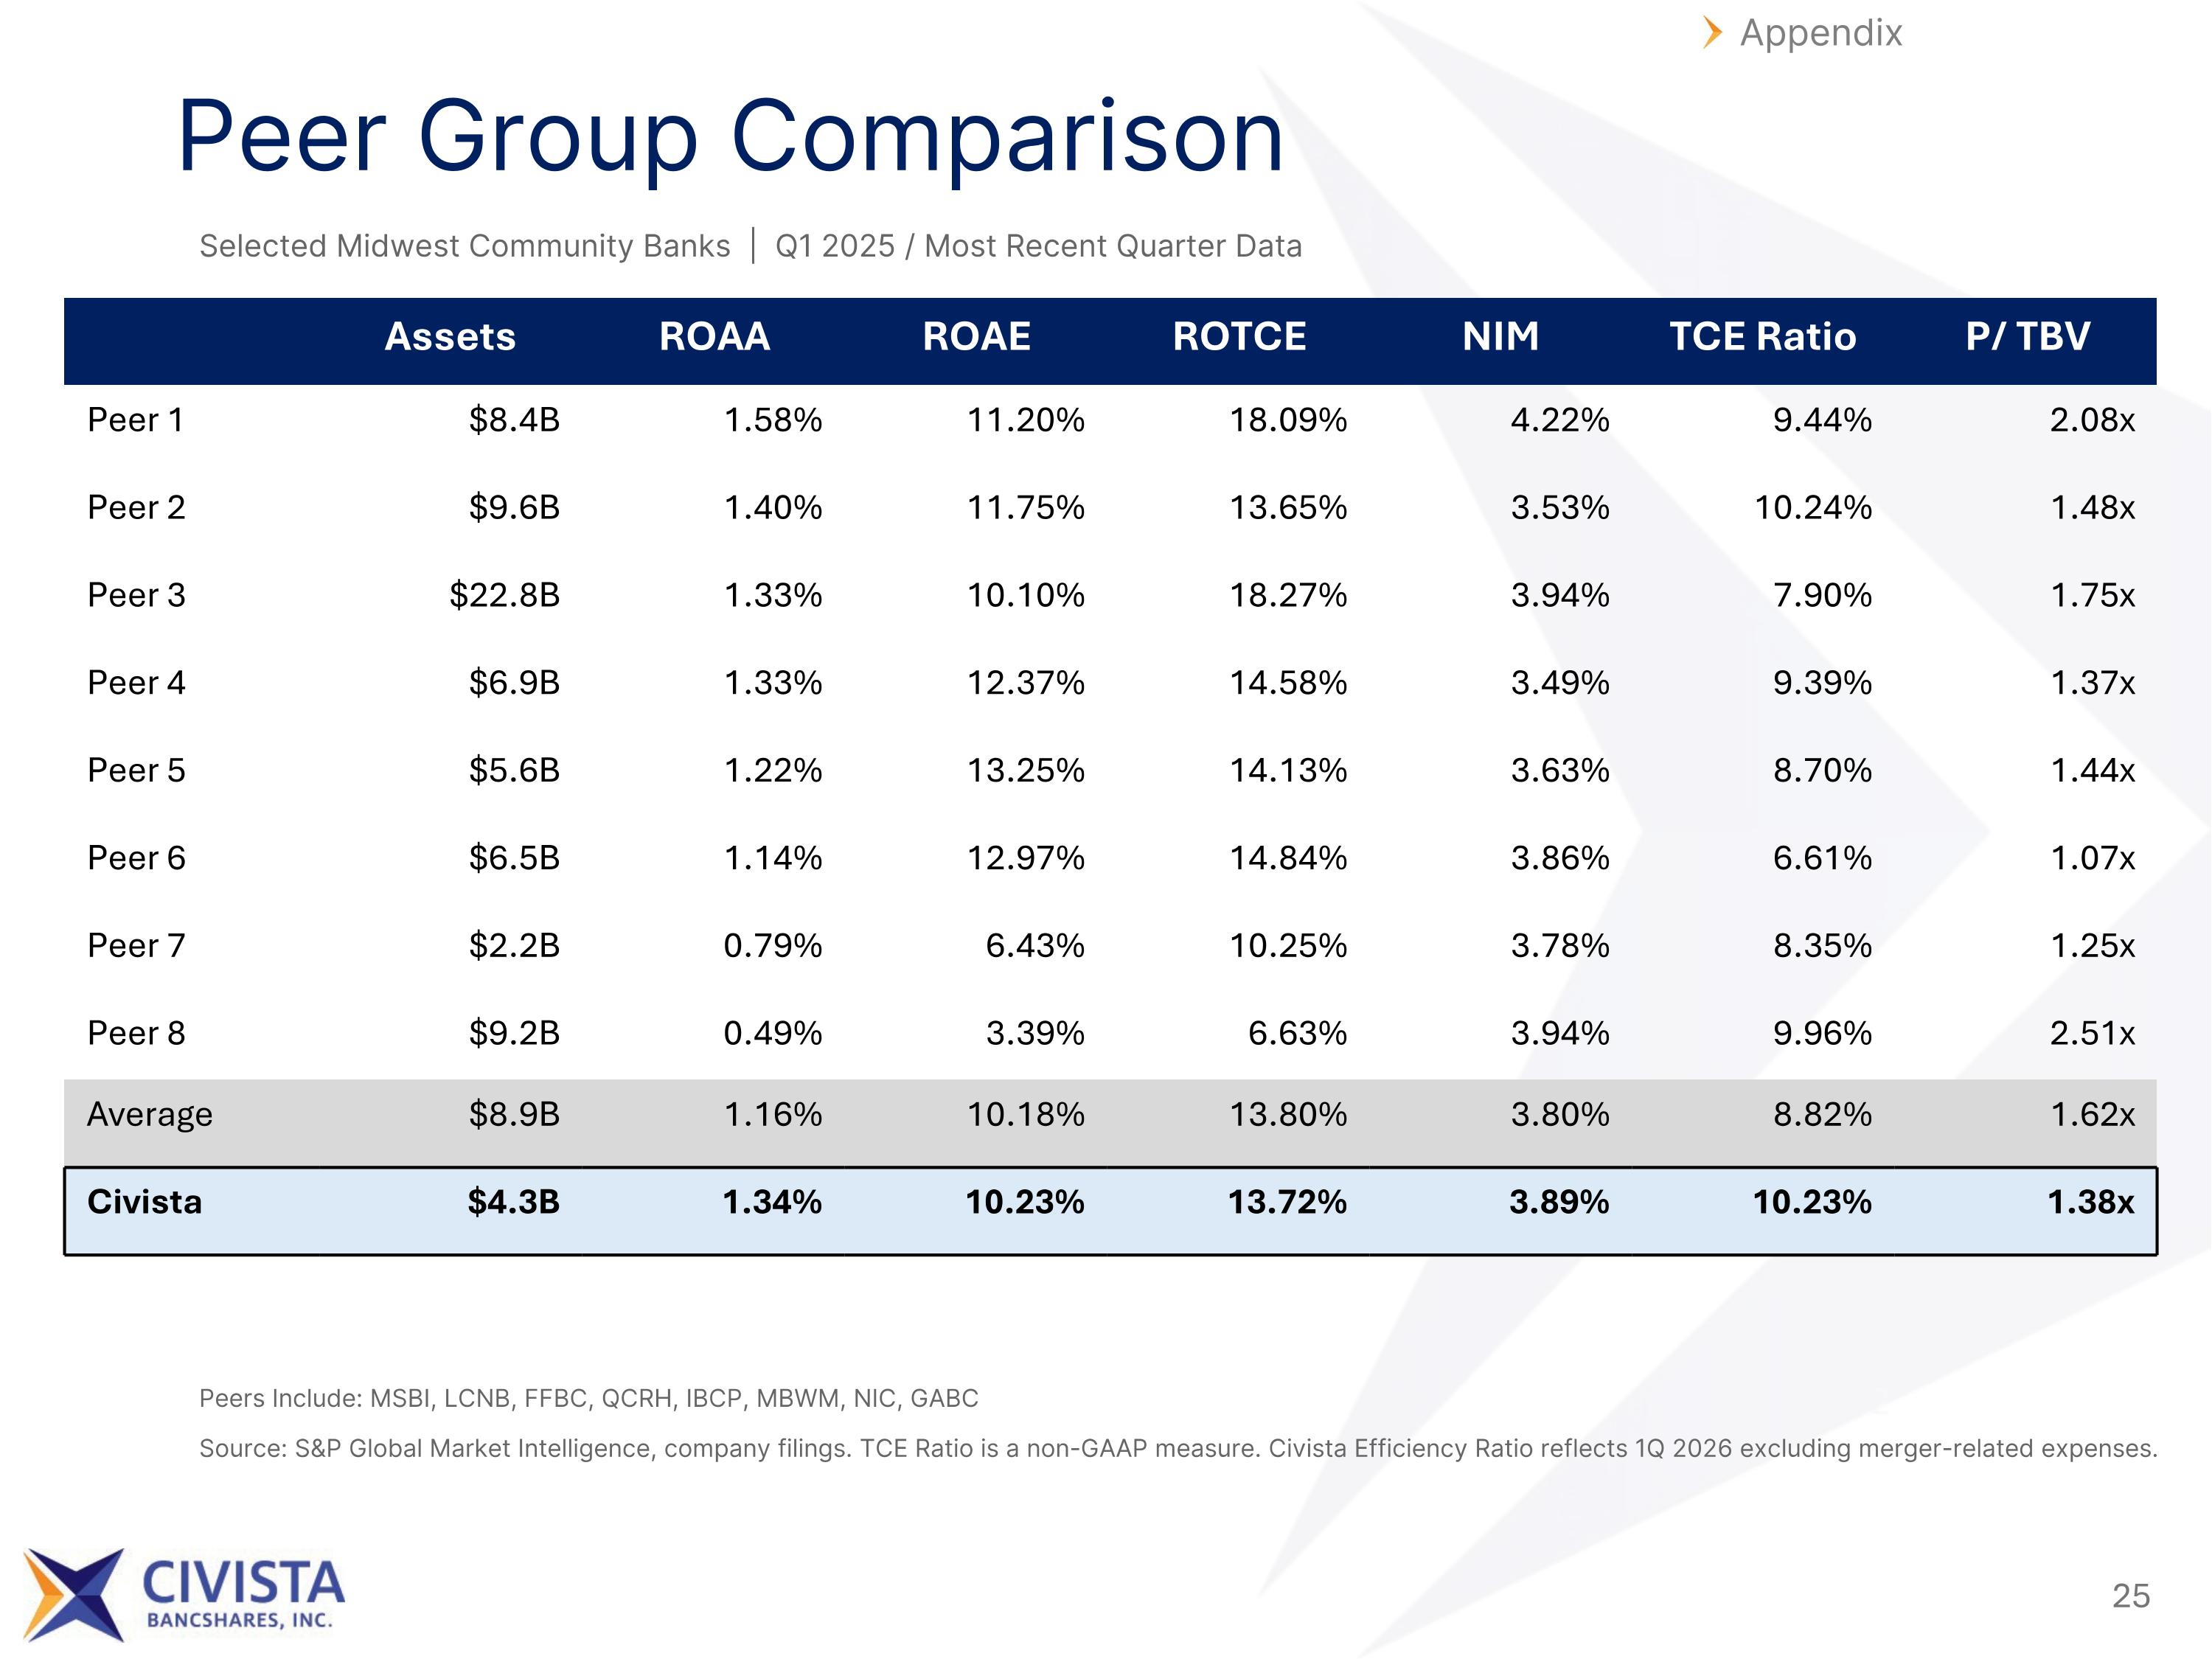
Selected Midwest Community Banks | Q1 2025 / Most Recent Quarter Data Source: S&P Global Market Intelligence, company filings. TCE Ratio is a non-GAAP measure. Civista Efficiency Ratio reflects 1Q 2026 excluding merger-related expenses. Peers Include: MSBI, LCNB, FFBC, QCRH, IBCP, MBWM, NIC, GABC Appendix Peer Group Comparison Assets ROAA ROAE ROTCE NIM TCE Ratio P/ TBV Peer 1 $8.4B 1.58% 11.20% 18.09% 4.22% 9.44% 2.08x Peer 2 $9.6B 1.40% 11.75% 13.65% 3.53% 10.24% 1.48x Peer 3 $22.8B 1.33% 10.10% 18.27% 3.94% 7.90% 1.75x Peer 4 $6.9B 1.33% 12.37% 14.58% 3.49% 9.39% 1.37x Peer 5 $5.6B 1.22% 13.25% 14.13% 3.63% 8.70% 1.44x Peer 6 $6.5B 1.14% 12.97% 14.84% 3.86% 6.61% 1.07x Peer 7 $2.2B 0.79% 6.43% 10.25% 3.78% 8.35% 1.25x Peer 8 $9.2B 0.49% 3.39% 6.63% 3.94% 9.96% 2.51x Average $8.9B 1.16% 10.18% 13.80% 3.80% 8.82% 1.62x Civista $4.3B 1.34% 10.23% 13.72% 3.89% 10.23% 1.38x
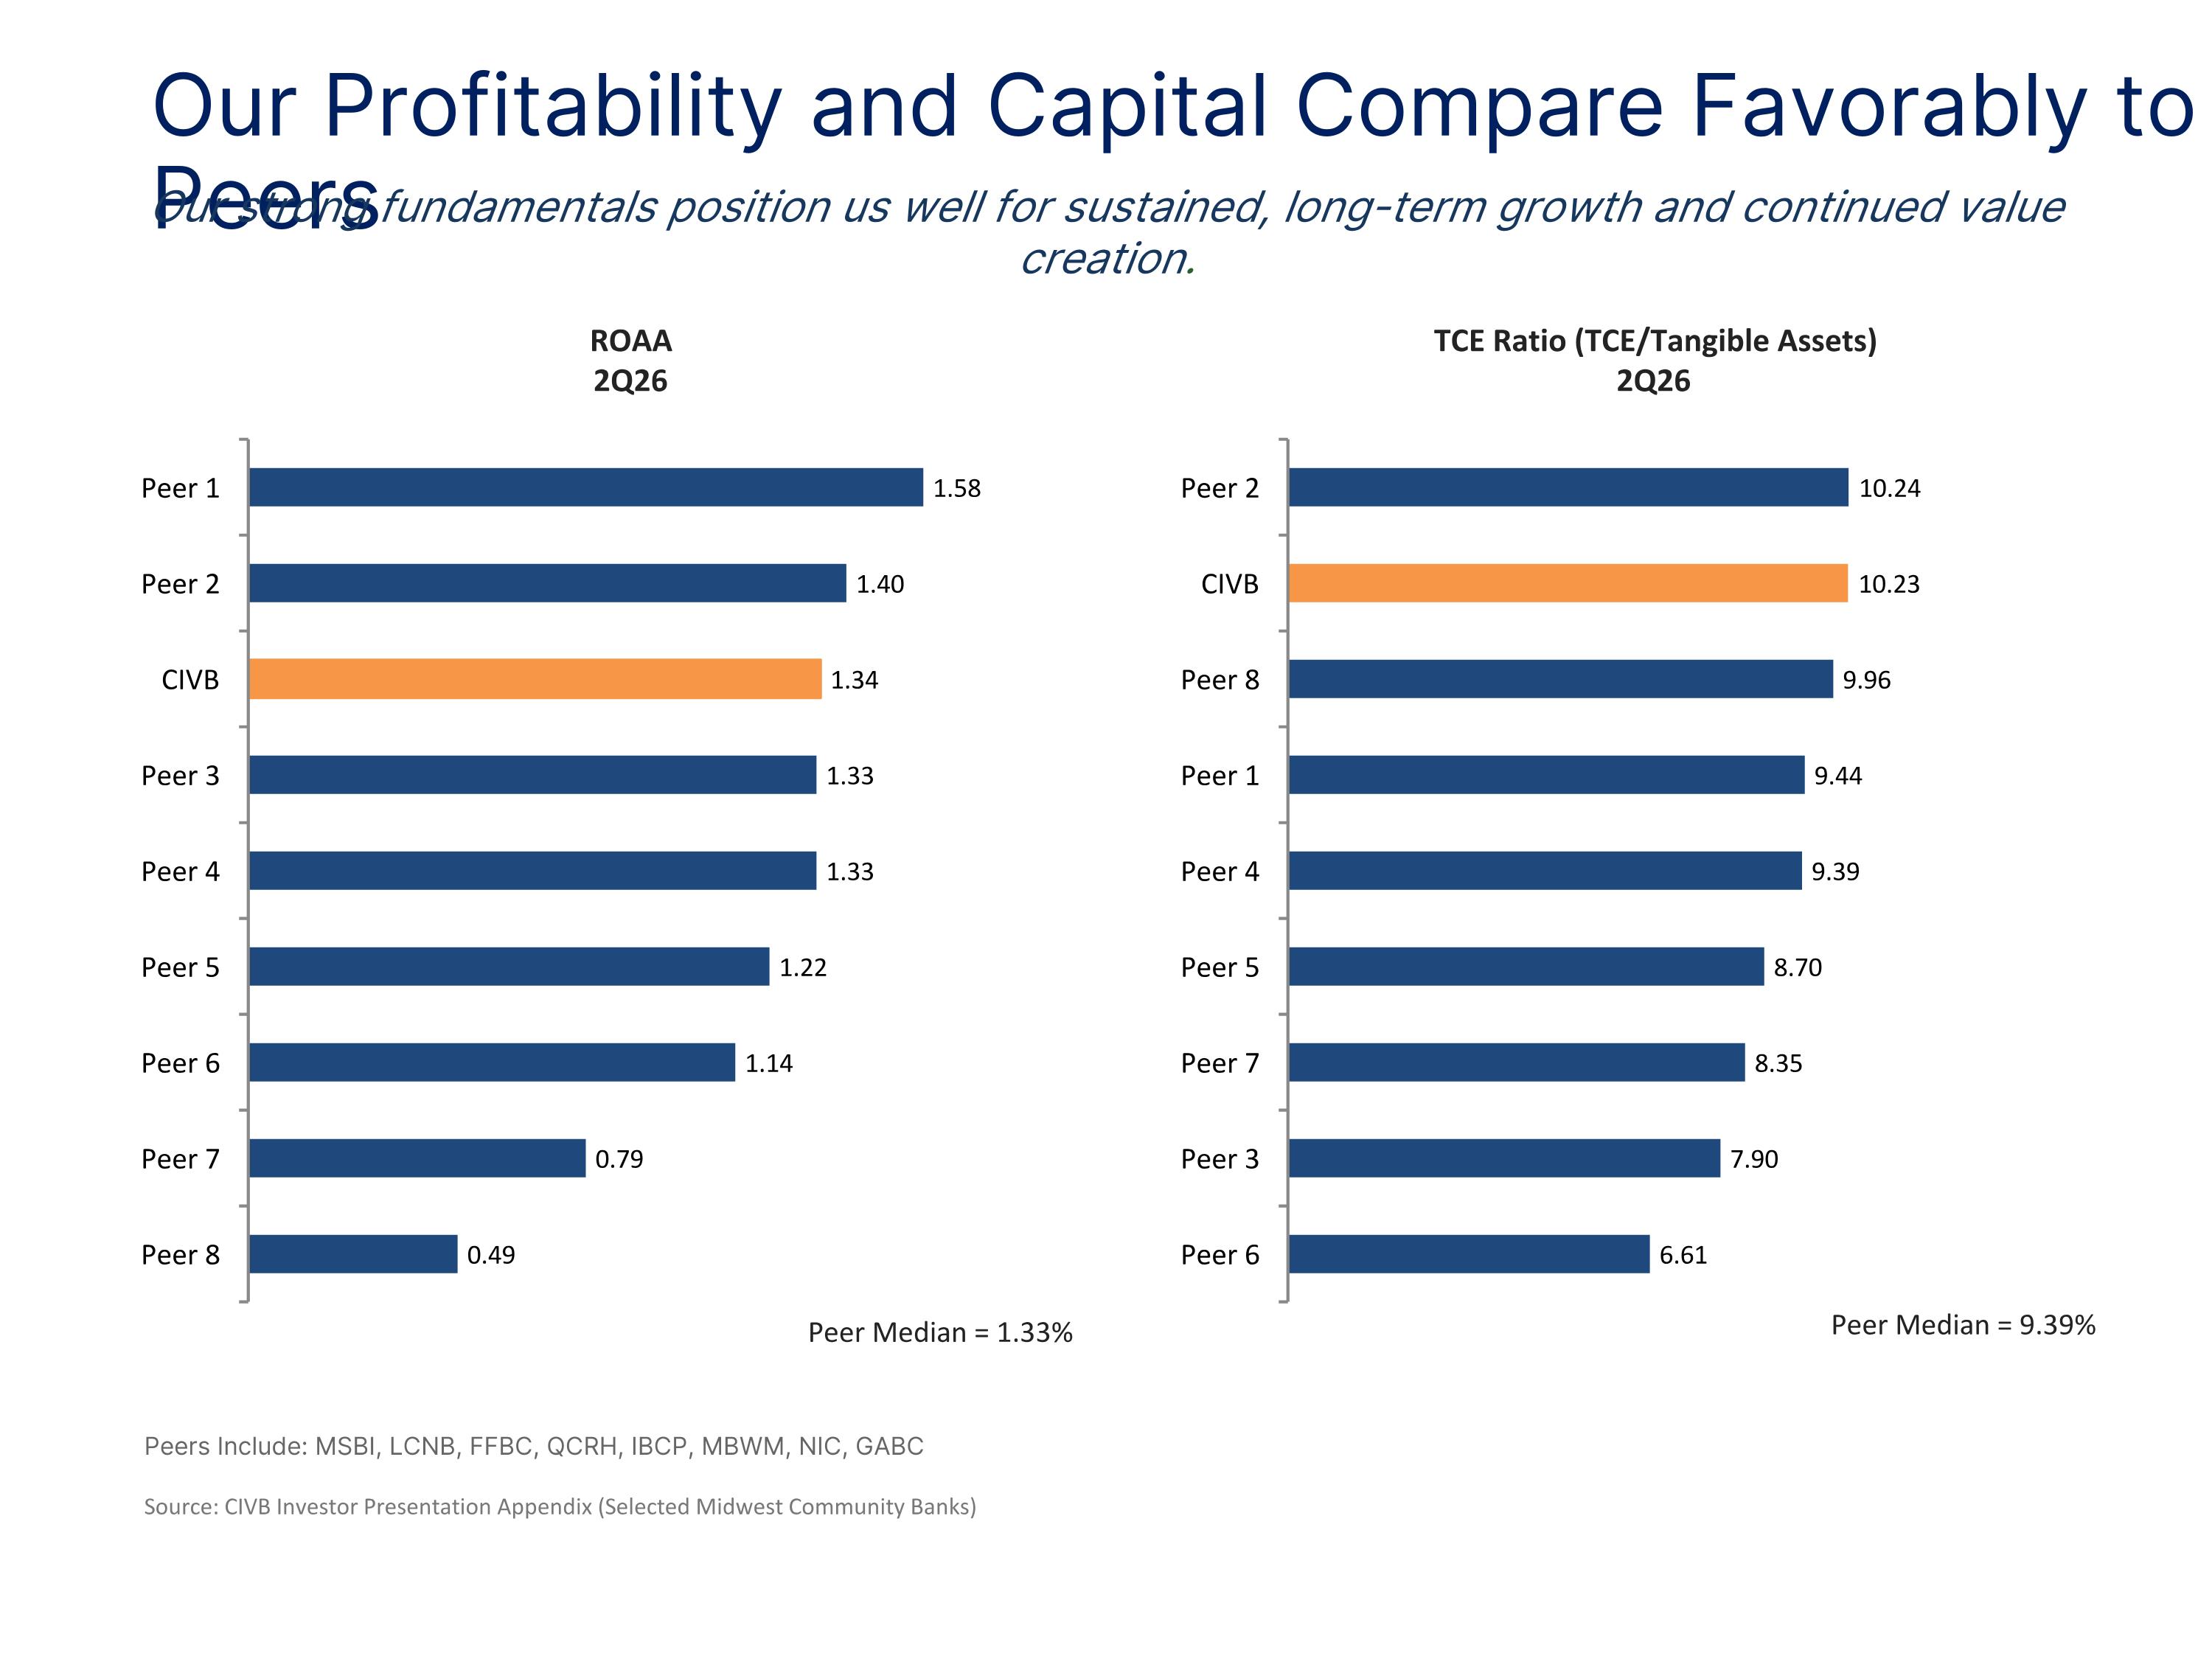
Our Profitability and Capital Compare Favorably to Peers Peer Median = 1.33% Peer Median = 9.39% Our strong fundamentals position us well for sustained, long-term growth and continued value creation. Source: CIVB Investor Presentation Appendix (Selected Midwest Community Banks) Peers Include: MSBI, LCNB, FFBC, QCRH, IBCP, MBWM, NIC, GABC
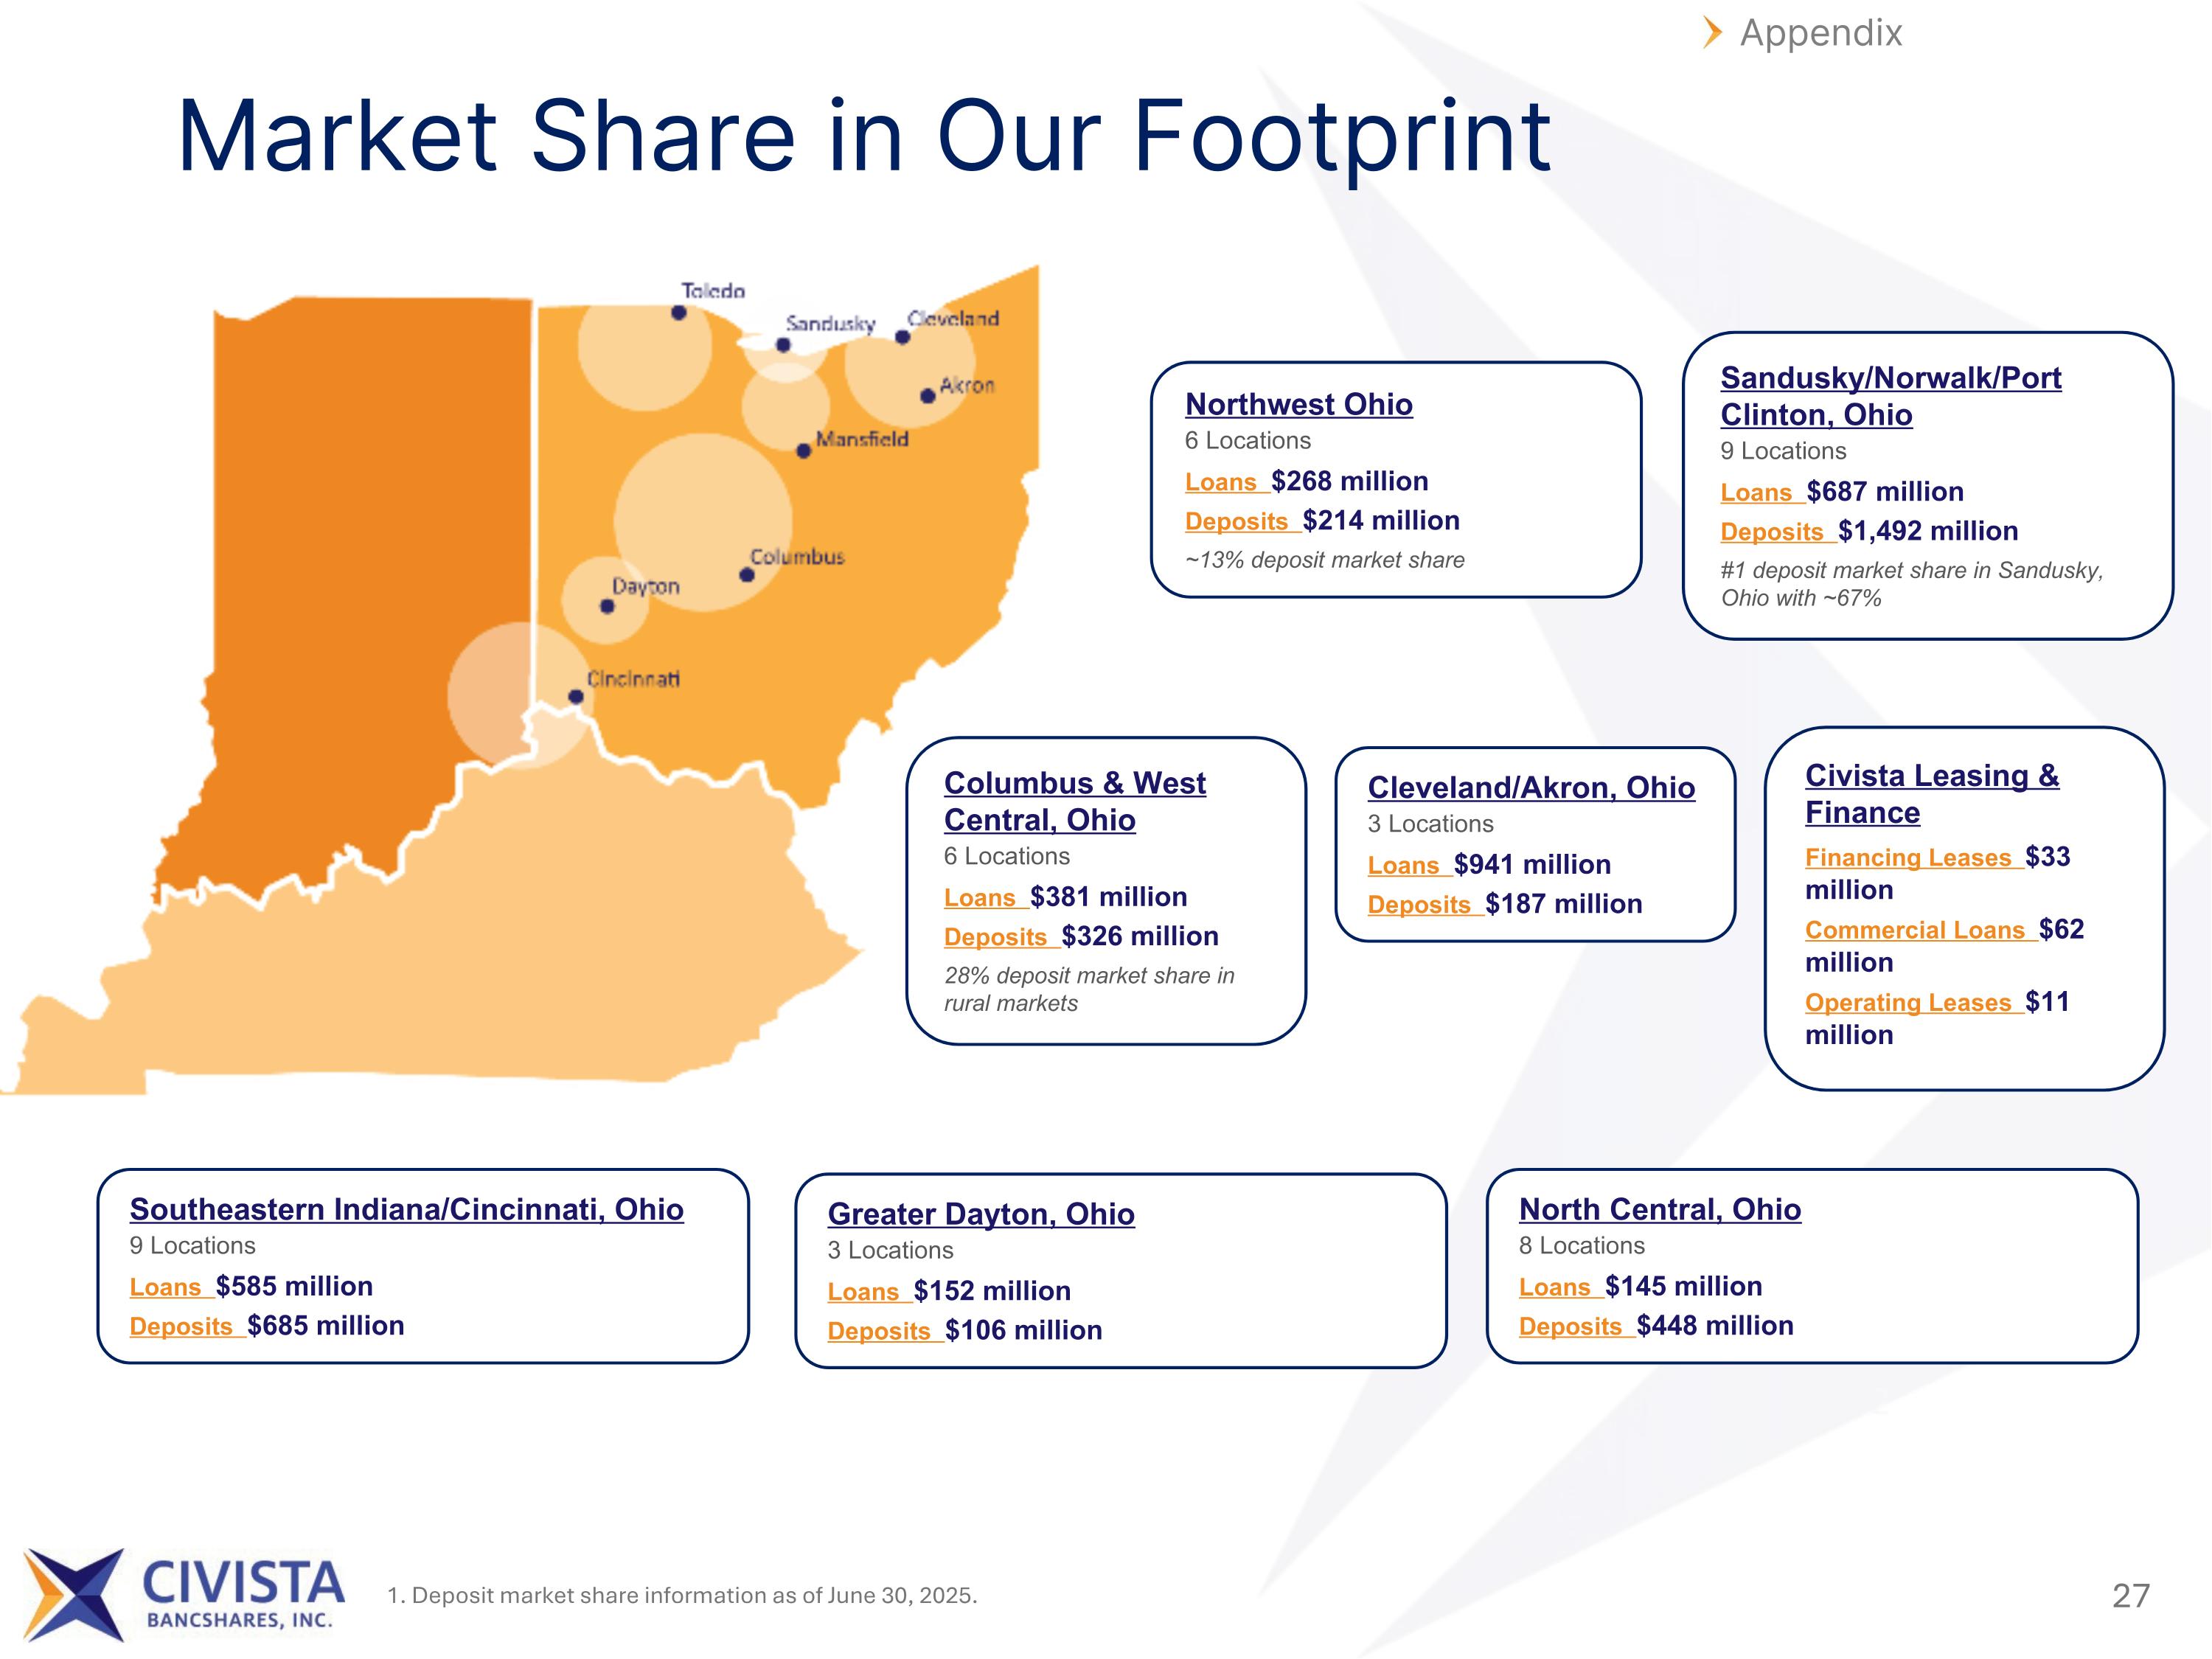
Appendix Sandusky/Norwalk/Port Clinton, Ohio 9 Locations Loans $687 million Deposits $1,492 million #1 deposit market share in Sandusky, Ohio with ~67% Cleveland/Akron, Ohio 3 Locations Loans $941 million Deposits $187 million North Central, Ohio 8 Locations Loans $145 million Deposits $448 million Columbus & West Central, Ohio 6 Locations Loans $381 million Deposits $326 million 28% deposit market share in rural markets Greater Dayton, Ohio 3 Locations Loans $152 million Deposits $106 million Southeastern Indiana/Cincinnati, Ohio 9 Locations Loans $585 million Deposits $685 million Northwest Ohio 6 Locations Loans $268 million Deposits $214 million ~13% deposit market share Civista Leasing & Finance Financing Leases $33 million Commercial Loans $62 million Operating Leases $11 million 1. Deposit market share information as of June 30, 2025. Market Share in Our Footprint
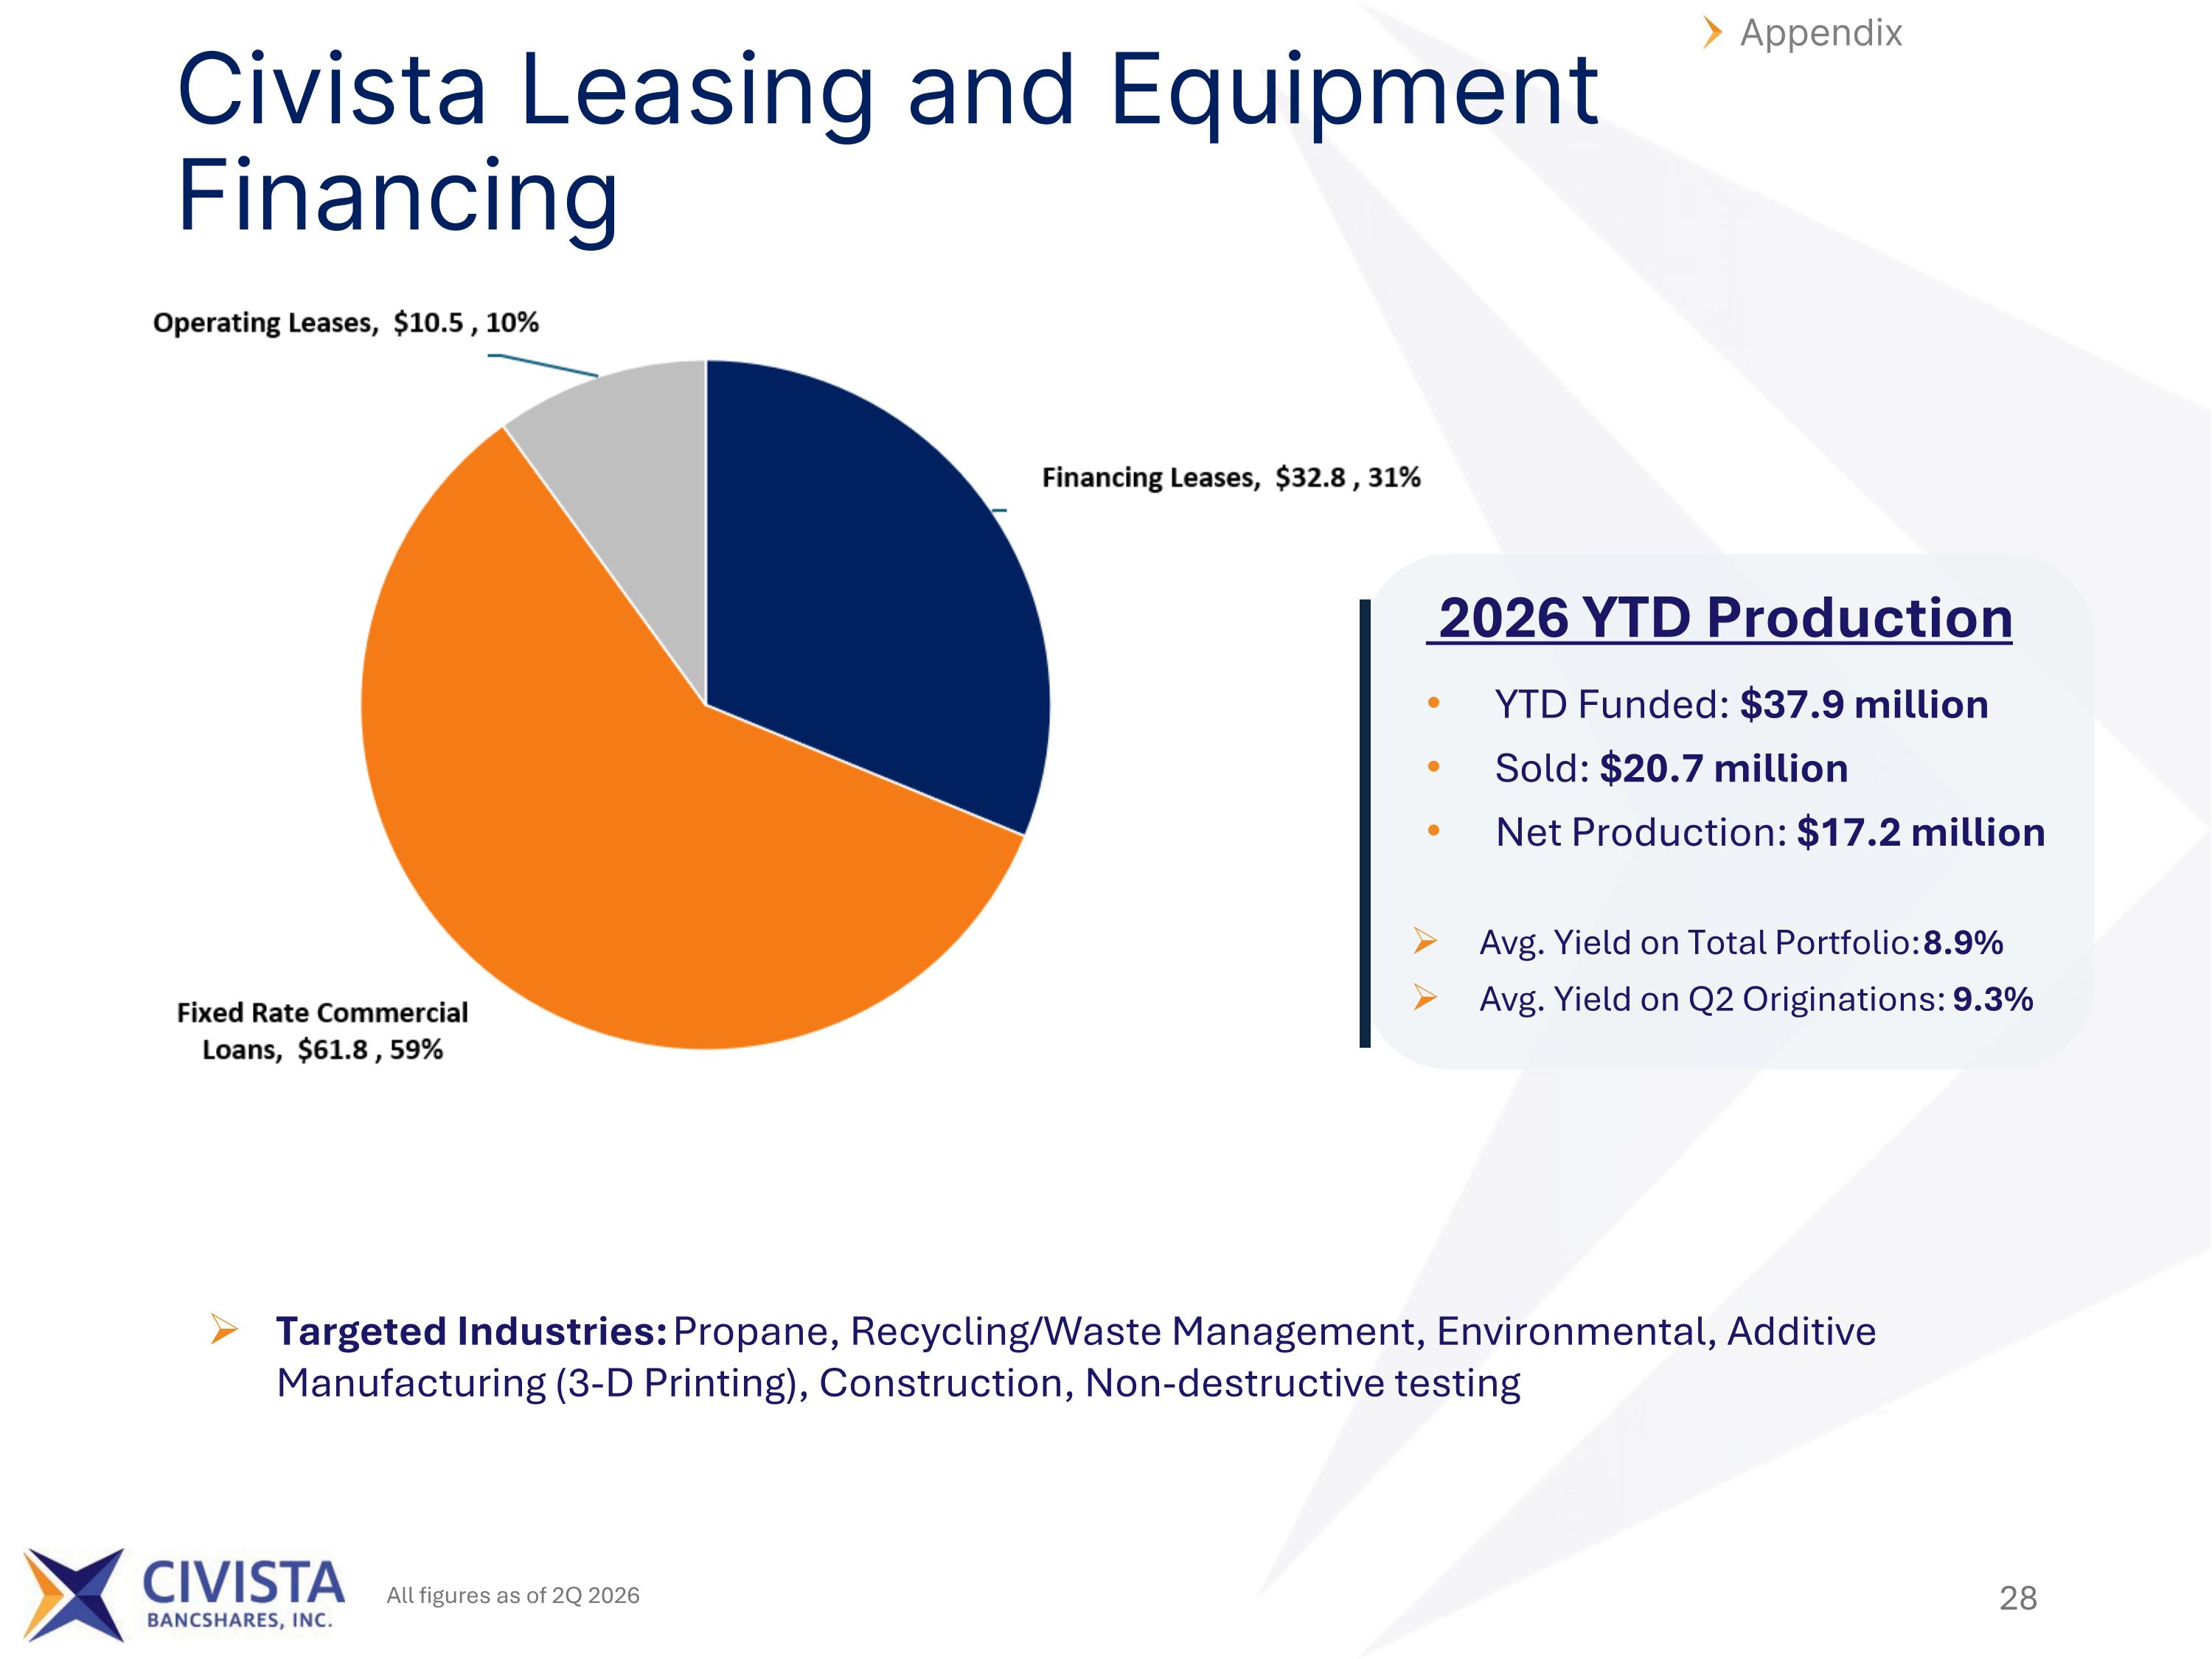
Civista Leasing and Equipment Financing Appendix 2026 YTD Production YTD Funded: $37.9 million Sold: $20.7 million Net Production: $17.2 million Targeted Industries: Propane, Recycling/Waste Management, Environmental, Additive Manufacturing (3-D Printing), Construction, Non-destructive testing Avg. Yield on Total Portfolio: 8.9% Avg. Yield on Q2 Originations: 9.3% All figures as of 2Q 2026
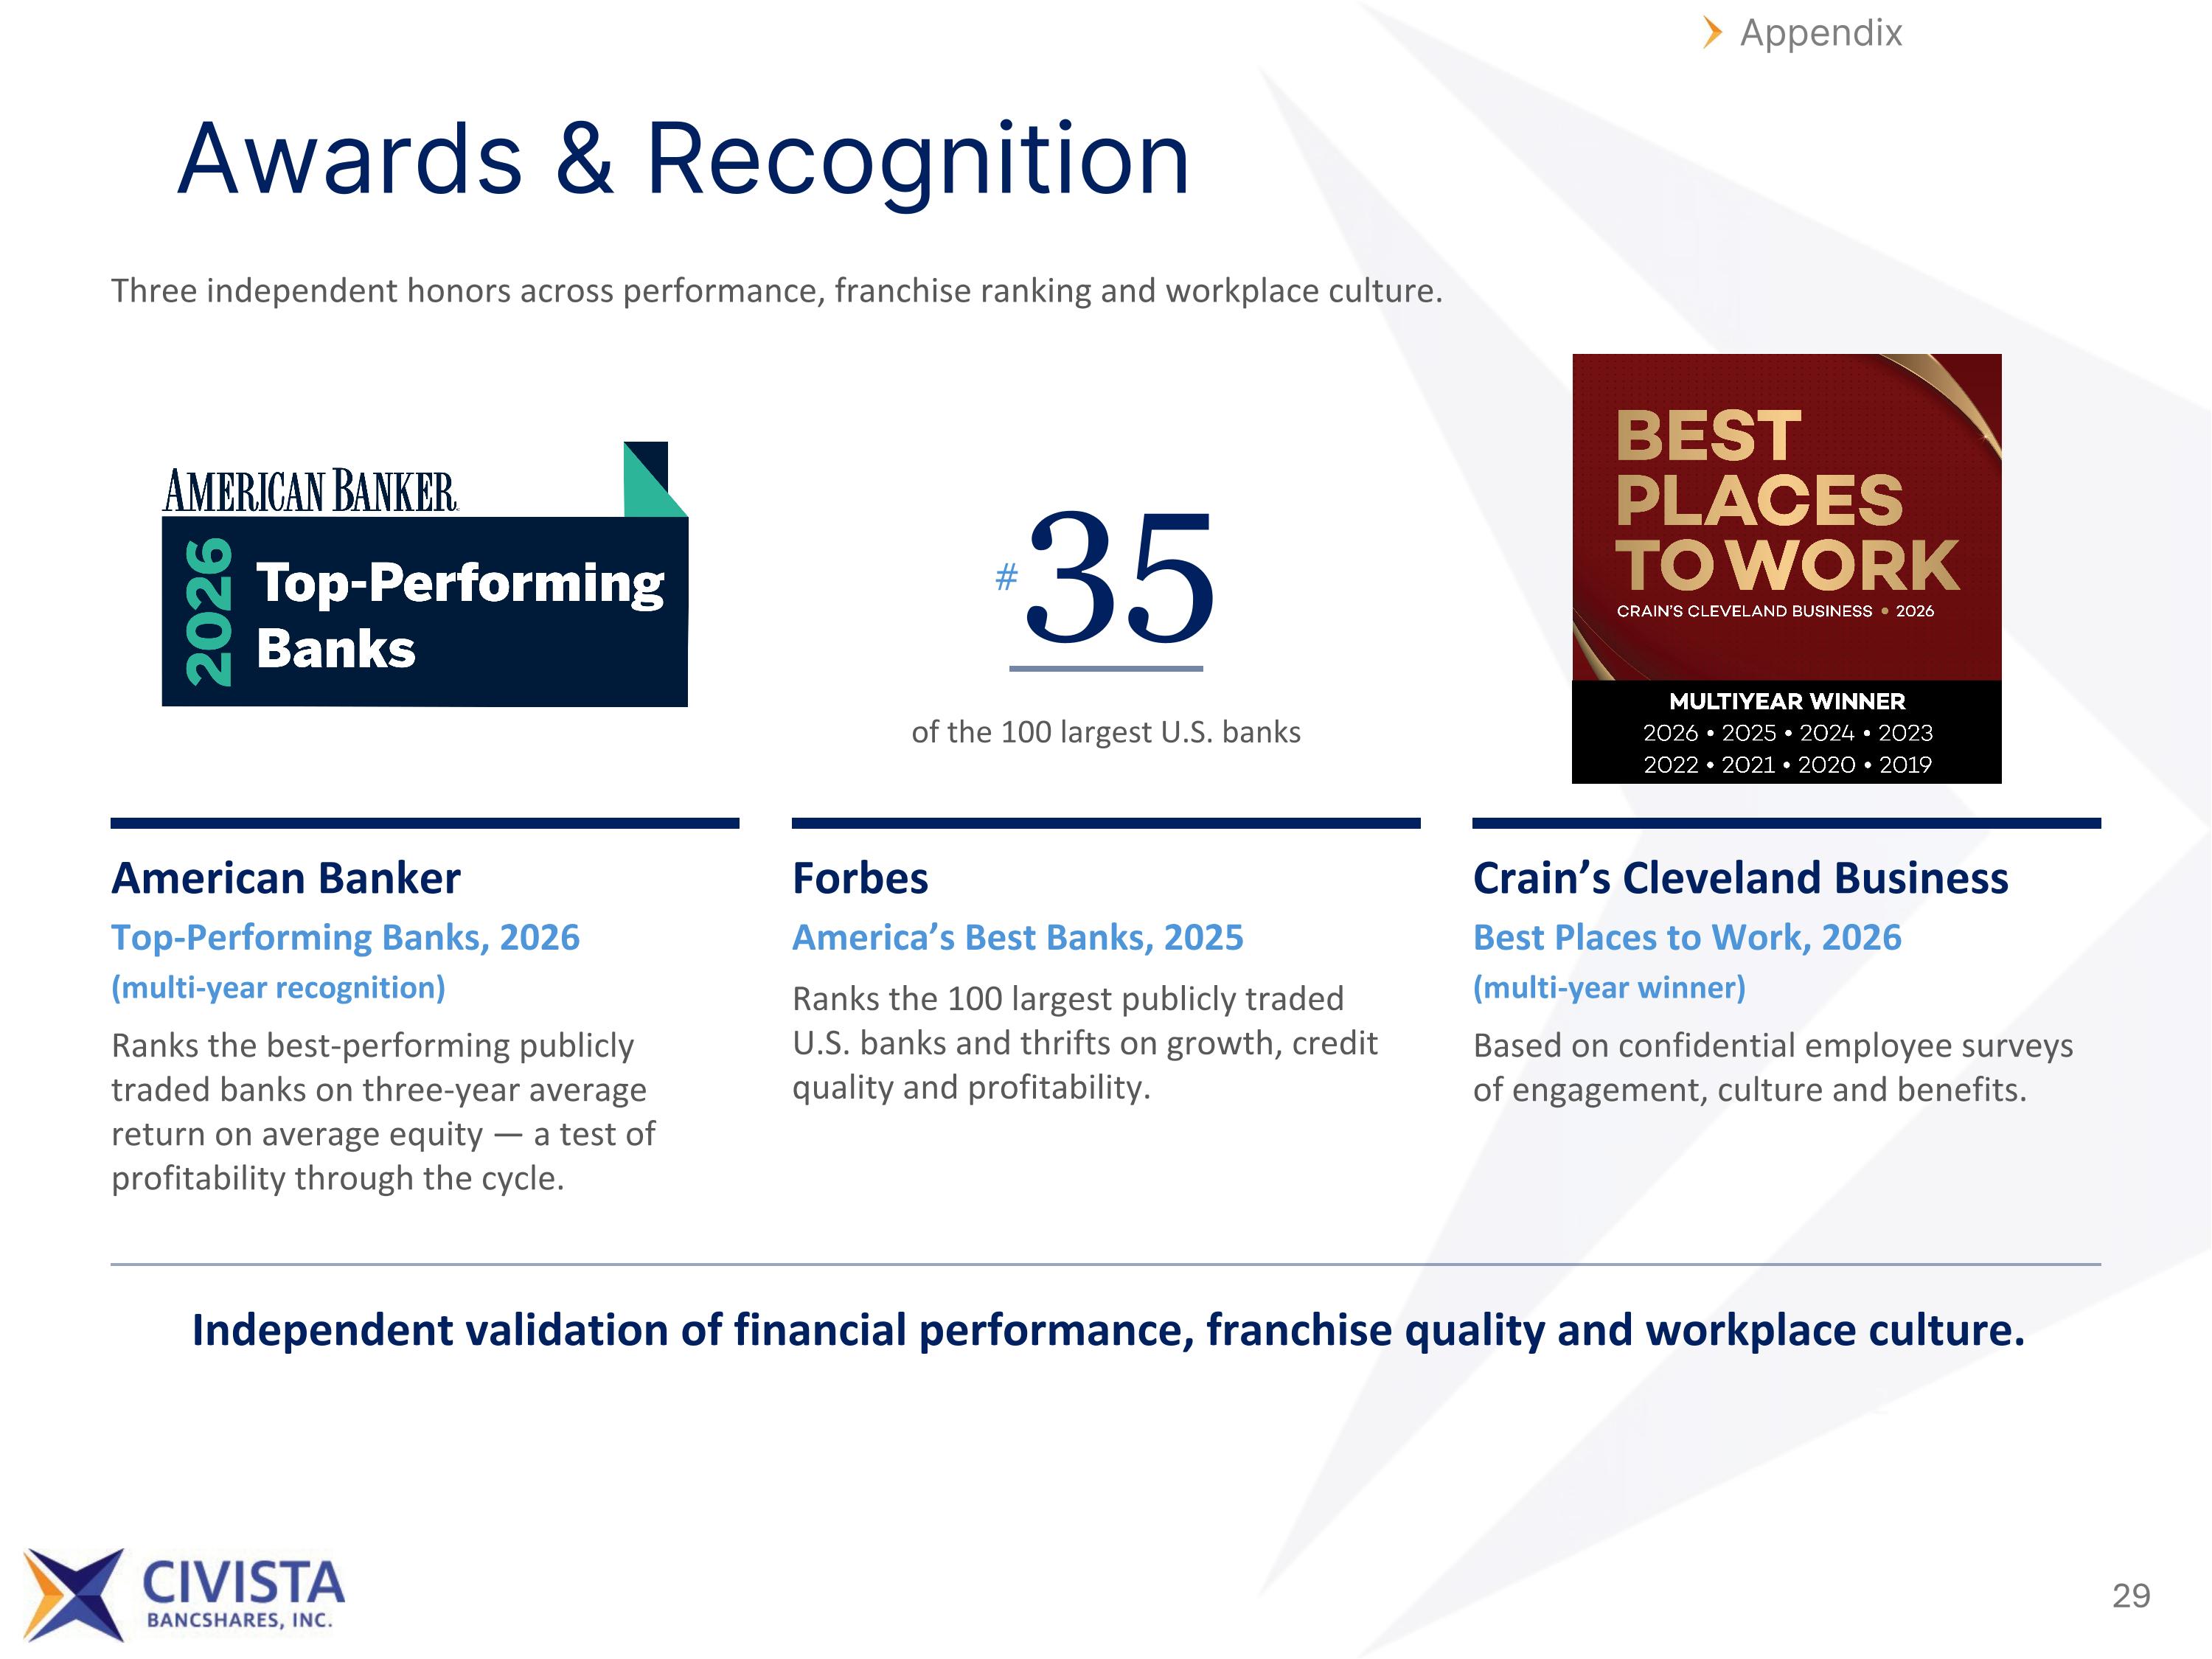
Awards & Recognition Three independent honors across performance, franchise ranking and workplace culture. American Banker Top-Performing Banks, 2026 (multi-year recognition) Ranks the best-performing publicly traded banks on three-year average return on average equity — a test of profitability through the cycle. Forbes America’s Best Banks, 2025 Ranks the 100 largest publicly traded U.S. banks and thrifts on growth, credit quality and profitability. Crain’s Cleveland Business Best Places to Work, 2026 (multi-year winner) Based on confidential employee surveys of engagement, culture and benefits. Independent validation of financial performance, franchise quality and workplace culture. Appendix #35 of the 100 largest U.S. banks