Value of initial | ||||||||||||||||||||||||
$100 Investment | ||||||||||||||||||||||||
Average | Based on: | |||||||||||||||||||||||
Summary | Average |
| Company - | |||||||||||||||||||||
Summary | Compensation | Compensation | Peer Group | Selected | ||||||||||||||||||||
Compensation | Compensation | Table Total | Actually Paid | Total | Total | Net | Measure: | |||||||||||||||||
Table Total | Actually Paid | for Non-PEO | to Non-PEO | Shareholder | Shareholder | Income | Adjusted EBITDA | |||||||||||||||||
Fiscal Year | for PEO(1) | to PEO(1)(2)(6)(7) | NEOs(1) | NEOs(1)(2)(6) | Return(3) | Return(3) | (in thousands)(4) | (in thousands)(5) | ||||||||||||||||
(a) | (b) | (c) | (d) | (e) | (f) | (g) | (h) | (i) | ||||||||||||||||
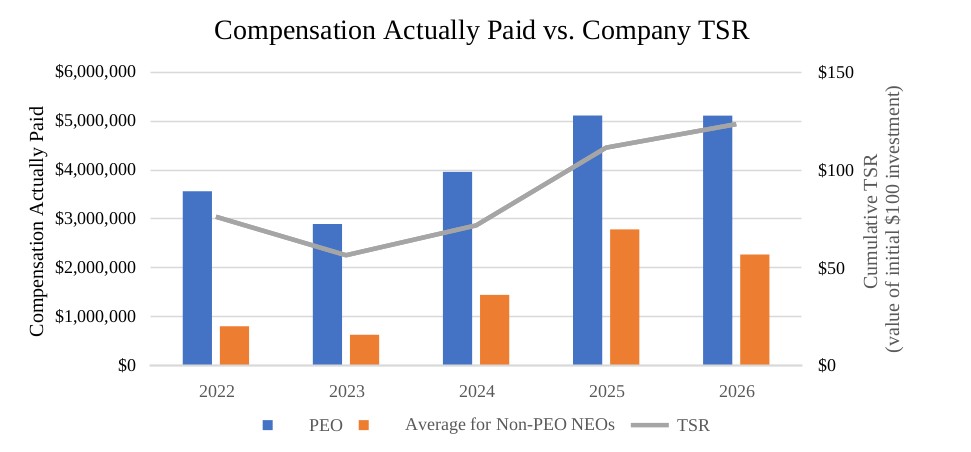
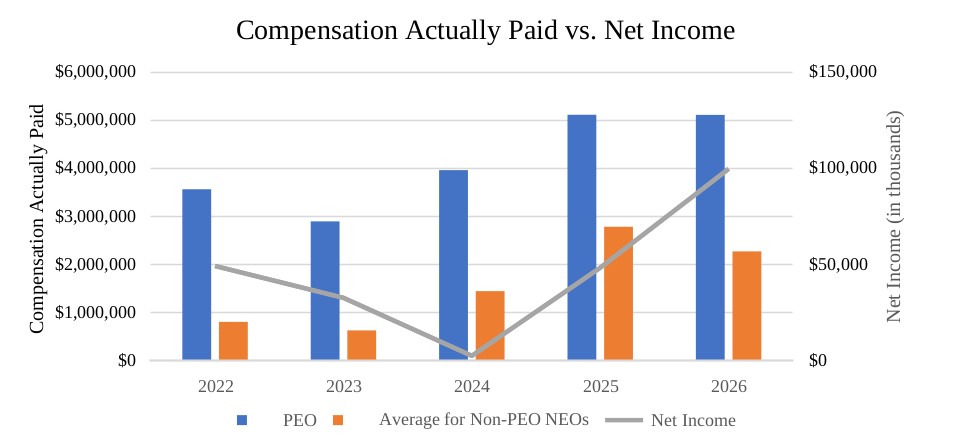
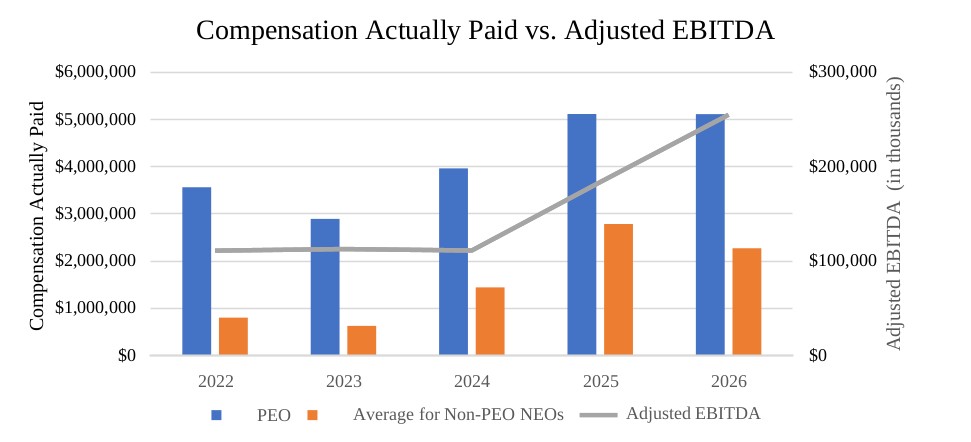
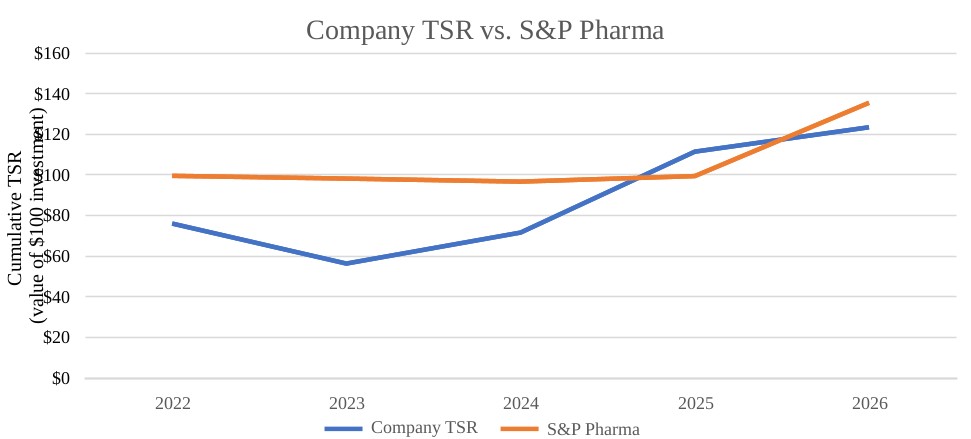
2026 | $ | 5,229,898 | $ | 5,203,165 | $ | 1,482,405 | $ | 2,473,274 | $ | 123 | $ | 136 | $ | 99,720 | $ | 254,971 | ||||||||
2025 | $ | 5,284,122 | $ | 5,116,035 | $ | 1,466,798 | $ | 2,784,862 | $ | 111 | $ | 99 | $ | 48,264 | $ | 183,684 | ||||||||
2024 | $ | 4,753,878 | $ | 3,962,890 | $ | 1,319,120 | $ | 1,444,508 | $ | 72 | $ | 97 | $ | 2,416 | $ | 111,237 | ||||||||
2023 | $ | 2,938,899 | $ | 2,895,188 | $ | 630,057 | $ | 627,456 | $ | 56 | $ | 98 | $ | 32,606 | $ | 112,753 | ||||||||
2022 | $ | 3,609,499 | $ | 3,564,829 | $ | 803,846 | $ | 803,846 | $ | 76 | $ | 100 | $ | 49,175 | $ | 111,083 | ||||||||
| (1) | In all years shown, Mr. Jack C. Bendheim was our Principal Executive Officer (“PEO”). The names of the non-Principal Executive Officer NEOs of the Company (each, a “Non-PEO NEO”) reflected in these columns for each applicable fiscal year are as follows: |
| ● | Fiscal year 2026: Glenn David, Larry Miller, Daniel M. Bendheim and Judith Weinstein; |
| ● | Fiscal year 2025: Glenn David, Larry Miller, Daniel M. Bendheim and Judith Weinstein; |
| ● | Fiscal year 2024: Glenn David, Richard Johnson, Damian Finio, Larry Miller, Rob Aukerman and Daniel M. Bendheim; |
| ● | Fiscal year 2023: Damian Finio, Larry Miller, Rob Aukerman and Daniel M. Bendheim; and |
| ● | Fiscal year 2022: Damian Finio, Larry Miller, Rob Aukerman and Daniel M. Bendheim. |
(2) | In calculating the ‘compensation actually paid’ amounts reflected in these columns, the fair value or change in fair value, as applicable, of the equity award adjustments included in such calculations was computed in accordance with FASB ASC Topic 718. The valuation assumptions used to calculate such fair values did not materially differ from those disclosed at the time of grant. In calculating the ‘compensation actually paid’ amounts reflected in these columns, the adjustments made to the pension benefit values were computed in accordance with U.S. GAAP. |
(3) | Total Shareholder Return (“TSR”) is cumulative for the measurement periods beginning on June 30, 2022 and ended on June 30, 2026, 2025, 2024 and 2023, respectively, calculated in accordance with Item 201(e) of Regulation S-K. The Peer Group represents the S&P 500 Pharmaceuticals Index, which is used by the Company for purposes of compliance with Item 201(e) of Regulation S-K, and assumes dividends, if any, were reinvested from the market close on June 30, 2022 through and including the end of the fiscal year for each year reported in the table. |
(4) | Represents the amount of the net income reflected in the Company’s audited GAAP financial statements for each applicable fiscal year. |
(5) | We have selected Adjusted EBITDA, a non-GAAP measure, as our most important financial measure (that is not otherwise required to be disclosed in the table) used to link ‘compensation actually paid’ to our NEOs to company performance for fiscal year 2026. For a reconciliation of Adjusted EBITDA to the most directly comparable GAAP financial measure, please see our earnings release for the fourth fiscal quarter and full fiscal year ended June 30, 2026 furnished as exhibit 99.1 to the Company’s Current Report on Form 8 K filed with the SEC on August 26, 2026. |
(6) | The values in this column reflect each of the following adjustments made to the total compensation amounts reported in the Summary Compensation Table for the applicable fiscal year, computed in accordance with Item 402(v) of Regulation S-K: |
| i. | The tables below reflect certain adjustments to the ‘compensation actually paid’ to the PEO and the average amount of ‘compensation actually paid’ to the Non-PEO NEOs for each of the fiscal years presented. There were no actuarially determined service costs for services rendered by the PEO or Non-PEO NEOs during the covered fiscal year. |
| a. | No adjustments to the amount of ‘compensation actually paid’ to the PEO were required for the following categories: (i) the cost of benefits granted in an amendment or initiation during the covered fiscal year attributed to services rendered prior to the amendment or initiation; (ii) the change in fair value of awards granted in prior years that are outstanding and unvested (from prior year-end to year-end); (iii) the change in the fair value of awards granted in prior years that vested in the covered fiscal year (from prior year-end to vesting date); (iv) the vesting date fair value of awards granted in the covered fiscal year that vested in that year; (v) the prior year-end fair value of awards granted in prior years that failed to vest in the covered fiscal year; and (vi) the dollar value of dividends, dividend equivalents or other earnings paid on stock & option awards in the covered fiscal year prior to vesting (not reflected in the fair value of such award or included in total compensation for that year). |
| b. | No adjustments to the average amount of ‘compensation actually paid’ to the Non-PEO NEOs were required for the following categories: (i) the cost of benefits granted in an amendment or initiation during the covered fiscal year attributed to services rendered prior to the amendment or initiation; (ii) the vesting date fair value of awards granted in the covered fiscal year that vested in that year; (iii) the prior year-end fair value of awards granted in prior years that failed to vest in the covered fiscal year; and (iv) the dollar value of dividends, dividend equivalents or other earnings paid on stock & option awards in the covered fiscal year prior to vesting (not reflected in the fair value of such award or included in total compensation for that year). |
Fiscal | Fiscal | Fiscal | Fiscal | Fiscal | |||||||||||
Year | Year | Year | Year | Year | |||||||||||
PEO | 2026 | 2025 |
| 2024 |
| 2023 | 2022 | ||||||||
Total Compensation Reported in the Summary Compensation Table | $ | 5,229,898 |
| $ | 5,284,122 |
| $ | 4,753,878 | $ | 2,938,899 | $ | 3,609,499 | |||
Less: the Change in Actuarial Present Value of Benefit Reported in the Summary Compensation Table for the Fiscal Year | $ | (117,108) |
| $ | (168,087) |
| $ | (790,988) | $ | (43,711) | $ | (44,670) | |||
Less: Grant Date Fair Value of Stock & Option Awards Reported in the Summary Compensation Table | $ | (424,255) | $ | — | $ | — | $ | — | $ | — | |||||
Plus: Year-End Fair Value of Awards Granted in the Covered Fiscal Year that are Outstanding and Unvested | $ | 514,630 |
| $ | — |
| $ | — | $ | — | $ | — | |||
Total Adjustments | $ | (26,733) |
| $ | (168,087) |
| $ | (790,988) | $ | (43,711) | $ | (44,670) | |||
Compensation Actually Paid for the Covered Fiscal Year | $ | 5,203,165 |
| $ | 5,116,035 |
| $ | 3,962,890 | $ | 2,895,188 | $ | 3,564,829 | |||
Fiscal | Fiscal | Fiscal | Fiscal | Fiscal | |||||||||||
Year | Year | Year | Year | Year | |||||||||||
Non-PEO NEOs | 2026 | 2025 |
| 2024 |
| 2023 | 2022 | ||||||||
Total Compensation Reported in the Summary Compensation Table | $ | 1,482,405 |
| $ | 1,466,798 |
| $ | 1,319,120 | $ | 630,057 | $ | 803,846 | |||
Less: the Change in Actuarial Present Value of Benefit Reported in the Summary Compensation Table for the Fiscal Year | $ | (9,124) | $ | (4,679) | $ | (54) | $ | (2,601) | $ | — | |||||
Less: Grant Date Fair Value of Stock Awards Reported in the Summary Compensation Table for the Fiscal Year | $ | (109,842) |
| $ | — |
| $ | (543,833) | $ | — | $ | — | |||
Plus: Year-End Fair Value of Awards Granted in the Covered Fiscal Year that are Outstanding and Unvested | $ | 133,242 | $ | — | $ | 669,275 | $ | — | $ | — | |||||
Plus: Change in Fair Value of Awards Granted in Prior Years that are Outstanding and Unvested (From Prior Year-End to Year-End) | $ | 770,338 | $ | 1,259,450 | $ | — | $ | — | $ | — | |||||
Plus: Change in Fair Value of Awards Granted in Prior Years that Vested in the Covered Fiscal Year (From Prior Year-End to Vesting Date) | $ | 206,255 | $ | 63,293 | $ | — | $ | — | $ | — | |||||
Total Adjustments | $ | 990,869 |
| $ | 1,318,064 |
| $ | 125,388 | $ | (2,601) | $ | — | |||
|
| ||||||||||||||
Compensation Actually Paid for the Covered Fiscal Year | $ | 2,473,274 |
| $ | 2,784,862 |
| $ | 1,444,508 | $ | 627,456 | $ | 803,846 | |||
(7) | Mr. Jack C. Bendheim elected to forgo his earned incentive award of $221,325 for the fiscal year ended June 30, 2023. |
| (1) | In all years shown, Mr. Jack C. Bendheim was our Principal Executive Officer (“PEO”). The names of the non-Principal Executive Officer NEOs of the Company (each, a “Non-PEO NEO”) reflected in these columns for each applicable fiscal year are as follows: |
| ● | Fiscal year 2026: Glenn David, Larry Miller, Daniel M. Bendheim and Judith Weinstein; |
| ● | Fiscal year 2025: Glenn David, Larry Miller, Daniel M. Bendheim and Judith Weinstein; |
| ● | Fiscal year 2024: Glenn David, Richard Johnson, Damian Finio, Larry Miller, Rob Aukerman and Daniel M. Bendheim; |
| ● | Fiscal year 2023: Damian Finio, Larry Miller, Rob Aukerman and Daniel M. Bendheim; and |
| ● | Fiscal year 2022: Damian Finio, Larry Miller, Rob Aukerman and Daniel M. Bendheim. |
(3) | Total Shareholder Return (“TSR”) is cumulative for the measurement periods beginning on June 30, 2022 and ended on June 30, 2026, 2025, 2024 and 2023, respectively, calculated in accordance with Item 201(e) of Regulation S-K. The Peer Group represents the S&P 500 Pharmaceuticals Index, which is used by the Company for purposes of compliance with Item 201(e) of Regulation S-K, and assumes dividends, if any, were reinvested from the market close on June 30, 2022 through and including the end of the fiscal year for each year reported in the table. |
(6) | The values in this column reflect each of the following adjustments made to the total compensation amounts reported in the Summary Compensation Table for the applicable fiscal year, computed in accordance with Item 402(v) of Regulation S-K: |
| i. | The tables below reflect certain adjustments to the ‘compensation actually paid’ to the PEO and the average amount of ‘compensation actually paid’ to the Non-PEO NEOs for each of the fiscal years presented. There were no actuarially determined service costs for services rendered by the PEO or Non-PEO NEOs during the covered fiscal year. |
| a. | No adjustments to the amount of ‘compensation actually paid’ to the PEO were required for the following categories: (i) the cost of benefits granted in an amendment or initiation during the covered fiscal year attributed to services rendered prior to the amendment or initiation; (ii) the change in fair value of awards granted in prior years that are outstanding and unvested (from prior year-end to year-end); (iii) the change in the fair value of awards granted in prior years that vested in the covered fiscal year (from prior year-end to vesting date); (iv) the vesting date fair value of awards granted in the covered fiscal year that vested in that year; (v) the prior year-end fair value of awards granted in prior years that failed to vest in the covered fiscal year; and (vi) the dollar value of dividends, dividend equivalents or other earnings paid on stock & option awards in the covered fiscal year prior to vesting (not reflected in the fair value of such award or included in total compensation for that year). |
| b. | No adjustments to the average amount of ‘compensation actually paid’ to the Non-PEO NEOs were required for the following categories: (i) the cost of benefits granted in an amendment or initiation during the covered fiscal year attributed to services rendered prior to the amendment or initiation; (ii) the vesting date fair value of awards granted in the covered fiscal year that vested in that year; (iii) the prior year-end fair value of awards granted in prior years that failed to vest in the covered fiscal year; and (iv) the dollar value of dividends, dividend equivalents or other earnings paid on stock & option awards in the covered fiscal year prior to vesting (not reflected in the fair value of such award or included in total compensation for that year). |
Fiscal | Fiscal | Fiscal | Fiscal | Fiscal | |||||||||||
Year | Year | Year | Year | Year | |||||||||||
PEO | 2026 | 2025 |
| 2024 |
| 2023 | 2022 | ||||||||
Total Compensation Reported in the Summary Compensation Table | $ | 5,229,898 |
| $ | 5,284,122 |
| $ | 4,753,878 | $ | 2,938,899 | $ | 3,609,499 | |||
Less: the Change in Actuarial Present Value of Benefit Reported in the Summary Compensation Table for the Fiscal Year | $ | (117,108) |
| $ | (168,087) |
| $ | (790,988) | $ | (43,711) | $ | (44,670) | |||
Less: Grant Date Fair Value of Stock & Option Awards Reported in the Summary Compensation Table | $ | (424,255) | $ | — | $ | — | $ | — | $ | — | |||||
Plus: Year-End Fair Value of Awards Granted in the Covered Fiscal Year that are Outstanding and Unvested | $ | 514,630 |
| $ | — |
| $ | — | $ | — | $ | — | |||
Total Adjustments | $ | (26,733) |
| $ | (168,087) |
| $ | (790,988) | $ | (43,711) | $ | (44,670) | |||
Compensation Actually Paid for the Covered Fiscal Year | $ | 5,203,165 |
| $ | 5,116,035 |
| $ | 3,962,890 | $ | 2,895,188 | $ | 3,564,829 | |||
Fiscal | Fiscal | Fiscal | Fiscal | Fiscal | |||||||||||
Year | Year | Year | Year | Year | |||||||||||
Non-PEO NEOs | 2026 | 2025 |
| 2024 |
| 2023 | 2022 | ||||||||
Total Compensation Reported in the Summary Compensation Table | $ | 1,482,405 |
| $ | 1,466,798 |
| $ | 1,319,120 | $ | 630,057 | $ | 803,846 | |||
Less: the Change in Actuarial Present Value of Benefit Reported in the Summary Compensation Table for the Fiscal Year | $ | (9,124) | $ | (4,679) | $ | (54) | $ | (2,601) | $ | — | |||||
Less: Grant Date Fair Value of Stock Awards Reported in the Summary Compensation Table for the Fiscal Year | $ | (109,842) |
| $ | — |
| $ | (543,833) | $ | — | $ | — | |||
Plus: Year-End Fair Value of Awards Granted in the Covered Fiscal Year that are Outstanding and Unvested | $ | 133,242 | $ | — | $ | 669,275 | $ | — | $ | — | |||||
Plus: Change in Fair Value of Awards Granted in Prior Years that are Outstanding and Unvested (From Prior Year-End to Year-End) | $ | 770,338 | $ | 1,259,450 | $ | — | $ | — | $ | — | |||||
Plus: Change in Fair Value of Awards Granted in Prior Years that Vested in the Covered Fiscal Year (From Prior Year-End to Vesting Date) | $ | 206,255 | $ | 63,293 | $ | — | $ | — | $ | — | |||||
Total Adjustments | $ | 990,869 |
| $ | 1,318,064 |
| $ | 125,388 | $ | (2,601) | $ | — | |||
|
| ||||||||||||||
Compensation Actually Paid for the Covered Fiscal Year | $ | 2,473,274 |
| $ | 2,784,862 |
| $ | 1,444,508 | $ | 627,456 | $ | 803,846 | |||
(6) | The values in this column reflect each of the following adjustments made to the total compensation amounts reported in the Summary Compensation Table for the applicable fiscal year, computed in accordance with Item 402(v) of Regulation S-K: |
| i. | The tables below reflect certain adjustments to the ‘compensation actually paid’ to the PEO and the average amount of ‘compensation actually paid’ to the Non-PEO NEOs for each of the fiscal years presented. There were no actuarially determined service costs for services rendered by the PEO or Non-PEO NEOs during the covered fiscal year. |
| a. | No adjustments to the amount of ‘compensation actually paid’ to the PEO were required for the following categories: (i) the cost of benefits granted in an amendment or initiation during the covered fiscal year attributed to services rendered prior to the amendment or initiation; (ii) the change in fair value of awards granted in prior years that are outstanding and unvested (from prior year-end to year-end); (iii) the change in the fair value of awards granted in prior years that vested in the covered fiscal year (from prior year-end to vesting date); (iv) the vesting date fair value of awards granted in the covered fiscal year that vested in that year; (v) the prior year-end fair value of awards granted in prior years that failed to vest in the covered fiscal year; and (vi) the dollar value of dividends, dividend equivalents or other earnings paid on stock & option awards in the covered fiscal year prior to vesting (not reflected in the fair value of such award or included in total compensation for that year). |
| b. | No adjustments to the average amount of ‘compensation actually paid’ to the Non-PEO NEOs were required for the following categories: (i) the cost of benefits granted in an amendment or initiation during the covered fiscal year attributed to services rendered prior to the amendment or initiation; (ii) the vesting date fair value of awards granted in the covered fiscal year that vested in that year; (iii) the prior year-end fair value of awards granted in prior years that failed to vest in the covered fiscal year; and (iv) the dollar value of dividends, dividend equivalents or other earnings paid on stock & option awards in the covered fiscal year prior to vesting (not reflected in the fair value of such award or included in total compensation for that year). |
Fiscal | Fiscal | Fiscal | Fiscal | Fiscal | |||||||||||
Year | Year | Year | Year | Year | |||||||||||
PEO | 2026 | 2025 |
| 2024 |
| 2023 | 2022 | ||||||||
Total Compensation Reported in the Summary Compensation Table | $ | 5,229,898 |
| $ | 5,284,122 |
| $ | 4,753,878 | $ | 2,938,899 | $ | 3,609,499 | |||
Less: the Change in Actuarial Present Value of Benefit Reported in the Summary Compensation Table for the Fiscal Year | $ | (117,108) |
| $ | (168,087) |
| $ | (790,988) | $ | (43,711) | $ | (44,670) | |||
Less: Grant Date Fair Value of Stock & Option Awards Reported in the Summary Compensation Table | $ | (424,255) | $ | — | $ | — | $ | — | $ | — | |||||
Plus: Year-End Fair Value of Awards Granted in the Covered Fiscal Year that are Outstanding and Unvested | $ | 514,630 |
| $ | — |
| $ | — | $ | — | $ | — | |||
Total Adjustments | $ | (26,733) |
| $ | (168,087) |
| $ | (790,988) | $ | (43,711) | $ | (44,670) | |||
Compensation Actually Paid for the Covered Fiscal Year | $ | 5,203,165 |
| $ | 5,116,035 |
| $ | 3,962,890 | $ | 2,895,188 | $ | 3,564,829 | |||
Fiscal | Fiscal | Fiscal | Fiscal | Fiscal | |||||||||||
Year | Year | Year | Year | Year | |||||||||||
Non-PEO NEOs | 2026 | 2025 |
| 2024 |
| 2023 | 2022 | ||||||||
Total Compensation Reported in the Summary Compensation Table | $ | 1,482,405 |
| $ | 1,466,798 |
| $ | 1,319,120 | $ | 630,057 | $ | 803,846 | |||
Less: the Change in Actuarial Present Value of Benefit Reported in the Summary Compensation Table for the Fiscal Year | $ | (9,124) | $ | (4,679) | $ | (54) | $ | (2,601) | $ | — | |||||
Less: Grant Date Fair Value of Stock Awards Reported in the Summary Compensation Table for the Fiscal Year | $ | (109,842) |
| $ | — |
| $ | (543,833) | $ | — | $ | — | |||
Plus: Year-End Fair Value of Awards Granted in the Covered Fiscal Year that are Outstanding and Unvested | $ | 133,242 | $ | — | $ | 669,275 | $ | — | $ | — | |||||
Plus: Change in Fair Value of Awards Granted in Prior Years that are Outstanding and Unvested (From Prior Year-End to Year-End) | $ | 770,338 | $ | 1,259,450 | $ | — | $ | — | $ | — | |||||
Plus: Change in Fair Value of Awards Granted in Prior Years that Vested in the Covered Fiscal Year (From Prior Year-End to Vesting Date) | $ | 206,255 | $ | 63,293 | $ | — | $ | — | $ | — | |||||
Total Adjustments | $ | 990,869 |
| $ | 1,318,064 |
| $ | 125,388 | $ | (2,601) | $ | — | |||
|
| ||||||||||||||
Compensation Actually Paid for the Covered Fiscal Year | $ | 2,473,274 |
| $ | 2,784,862 |
| $ | 1,444,508 | $ | 627,456 | $ | 803,846 | |||
Pay versus Performance Tabular List
The following table lists our most important performance measures used by us to link ‘compensation actually paid’ to our NEOs to Company performance for fiscal year 2026. The performance measures included in this table are not ranked by relative importance.
Most Important Performance Measures |
Adjusted EBITDA |
Free Cash Flow |
Net Sales |
(5) | We have selected Adjusted EBITDA, a non-GAAP measure, as our most important financial measure (that is not otherwise required to be disclosed in the table) used to link ‘compensation actually paid’ to our NEOs to company performance for fiscal year 2026. For a reconciliation of Adjusted EBITDA to the most directly comparable GAAP financial measure, please see our earnings release for the fourth fiscal quarter and full fiscal year ended June 30, 2026 furnished as exhibit 99.1 to the Company’s Current Report on Form 8 K filed with the SEC on August 26, 2026. |