Pay vs Performance Disclosure
Jun. 30, 2026
USD ($)
Jun. 30, 2025
USD ($)
Jun. 30, 2024
USD ($)
Jun. 30, 2023
USD ($)
Jun. 30, 2022
USD ($)
Pay versus Performance Table
| Summary Compensation Table Total | Compensation Actually Paid | Value of Initial Fixed $100 | ||||||||||||||||||||||||||||||
for First PEO | for Second PEO | to First PEO | to Second PEO | Average Summary Compensation Table Total for Non-PEO NEOs | Average Compensation Actually Paid to Non-PEO NEOs | Total Shareholder Return | Peer Group Total Shareholder Return | Net Income | Operating Income Margin | |||||||||||||||||||||||
| Year | ($) (1) | ($) (2) | ($) (1) | ($) (2) | ($) (3) | ($) (3) | ($) (4) | ($) (4) | ($) (5) | (6) | ||||||||||||||||||||||
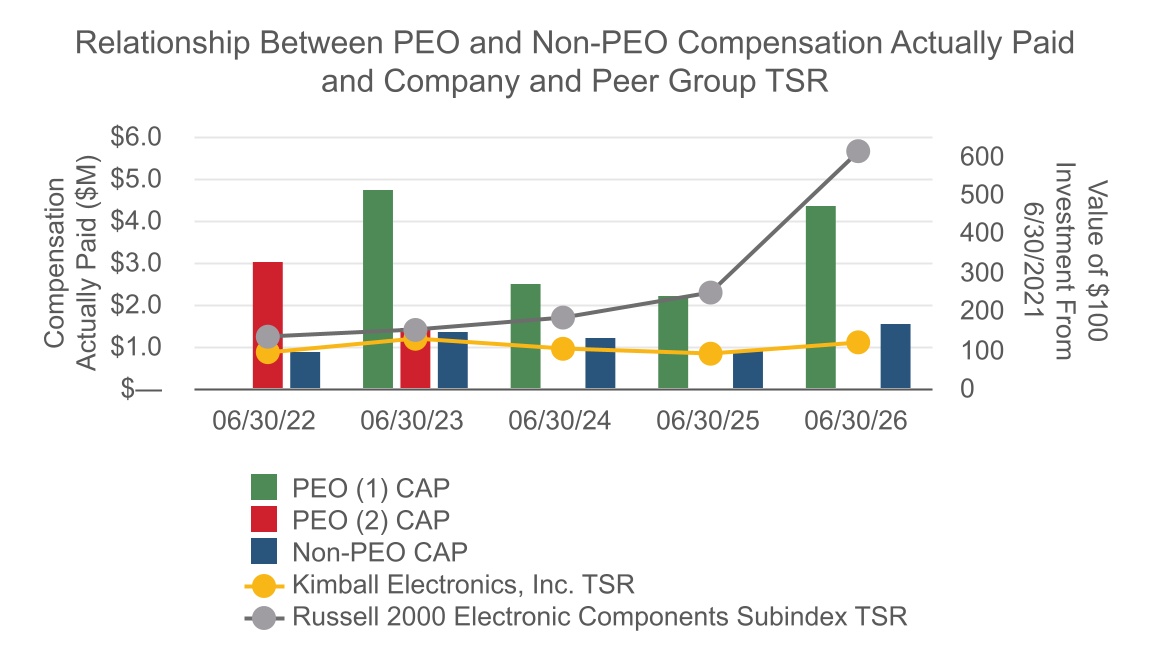
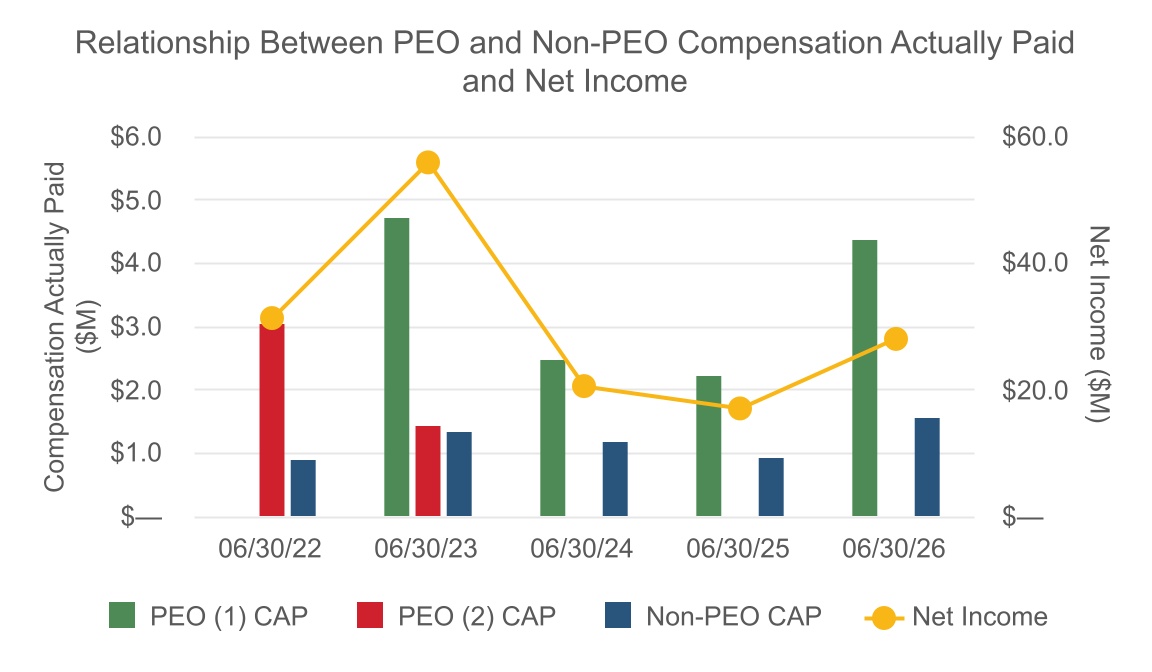
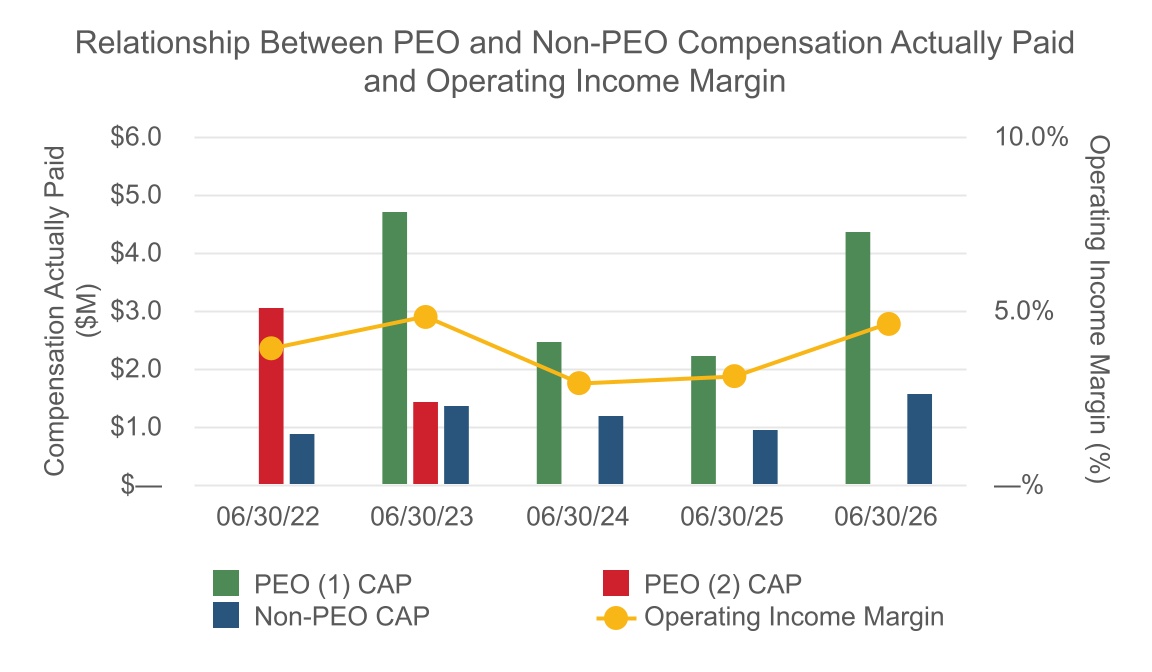
| 2026 | $ | 6,080,030 | $ | — | $ | 4,355,931 | $ | — | $ | 2,002,638 | $ | 1,544,315 | $ | 117.76 | $ | 610.83 | $ | 27,960,000 | 4.6 | % | ||||||||||||
| 2025 | $ | 3,982,601 | $ | — | $ | 2,210,881 | $ | — | $ | 1,319,430 | $ | 919,153 | $ | 88.45 | $ | 246.14 | $ | 16,984,000 | 3.1 | % | ||||||||||||
| 2024 | $ | 4,554,584 | $ | — | $ | 2,455,879 | $ | — | $ | 1,555,462 | $ | 1,180,999 | $ | 101.10 | $ | 181.66 | $ | 20,511,000 | 2.9 | % | ||||||||||||
| 2023 | $ | 4,293,775 | $ | 1,375,446 | $ | 4,697,655 | $ | 1,415,198 | $ | 1,070,088 | $ | 1,333,526 | $ | 127.09 | $ | 149.73 | $ | 55,831,000 | 4.8 | % | ||||||||||||
| 2022 | $ | — | $ | 3,906,259 | $ | — | $ | 3,020,432 | $ | 991,889 | $ | 879,149 | $ | 92.46 | $ | 132.31 | $ | 31,253,000 | 3.9 | % | ||||||||||||
(2)On February 28, 2023, Mr. Charron (the “Second PEO”) retired from his position as our Chief Executive Officer.
(3)During 2026, 2025 and 2024, our non-PEO NEOs consisted of the following: Ms. Croom, Mr. Korn, Ms. Thomson, and Mr. Hass. During 2023, our non-PEO NEOs consisted of the following: Ms. Croom, Mr. Korn, Ms. Thomson, and Mr. Christopher Thyen. During 2022, our non-PEO NEOs consisted of the following: Ms. Croom, Mr. Korn, Ms. Thomson, Mr. Thyen, and Mr. John Kahle.
| Richard D. Phillips | |||||
| 2026 | |||||
| Total Compensation as reported in the Summary Compensation Table | $ | 6,080,030 | |||
| Less: Reported Value of Equity Awards | $ | (4,142,940) | |||
| Plus: Total Value of Unvested Awards Granted during the Fiscal Year | $ | 1,853,258 | |||
| Total Change in Value of Unvested Awards Granted in Prior Fiscal Years | $ | (507,067) | |||
| Total Change in Value from Prior Fiscal Year-End of Awards that Vested during the Fiscal Year | $ | 1,072,650 | |||
| Compensation Actually Paid | $ | 4,355,931 | |||
The equity awards reportable for Mr. Phillips above consisted of performance shares, restricted shares, and an Equity Sign-On Inducement Grant, all of which are reported in the Summary Compensation Table at grant date fair value. In order to calculate the Compensation Actually Paid, the equity awards must be revalued at each fiscal year end. The performance shares were revalued based on updated performance metrics and the Company’s stock price as of each reportable fiscal year end. The restricted shares were revalued based on the Company’s stock price as of each reportable fiscal year end. The Equity Sign-On Inducement Grant was revalued using a Monte Carlo simulation as of each reportable fiscal year end.
| Average Non-PEO NEOs | |||||
| 2026 | |||||
| Total Compensation as reported in the Summary Compensation Table | $ | 2,002,638 | |||
| Less: Reported Value of Equity Awards | $ | (1,204,728) | |||
| Plus: Total Value of Unvested Awards Granted during the Fiscal Year | $ | 623,077 | |||
| Total Change in Value of Unvested Awards Granted in Prior Fiscal Years | $ | (82,359) | |||
| Total Change in Value from Prior Fiscal Year-End of Awards that Vested during the Fiscal Year | $ | 205,687 | |||
| Compensation Actually Paid | $ | 1,544,315 | |||
The equity awards reflected in the table above for the Company’s average Non-PEO NEOs consisted of performance shares and restricted shares which were reported in the Summary Compensation Table at grant date fair value. In order to calculate the Compensation Actually Paid, the equity awards must be revalued at each fiscal year end. The performance shares were revalued based on updated performance metrics and the Company’s stock price as of each reportable fiscal year end. The restricted shares were revalued based on the Company’s stock price as of each reportable fiscal year end.
Pay versus Performance Tabular List
The tabular list below reflects our other important performance measures used to link compensation actually paid for our NEOs to company performance, over the fiscal year ending June 30, 2026. The performance measures included in this table are ranked alphabetically, not by relative importance.
Performance Measures | ||||||||
•Economic Profit | ||||||||
•Operating Income Margin | ||||||||
•Relative Revenue Growth | ||||||||
•Relative Total Shareholder Return (rTSR) | ||||||||
•Free Cash Flow | ||||||||
•Sustainability | ||||||||
As outlined in the CD&A above, the TCC Committee has implemented an executive compensation program that prioritizes performance and aims to align employee and Share Owner interests. The Pay vs. Performance disclosure below provides a snapshot of pay and performance alignment by evaluating the link between Compensation Actually Paid, as defined by the SEC (“CAP”), and measures of market and financial performance. CAP is a valuation concept defined by the SEC solely for purposes of this Pay versus Performance disclosure; it does not represent amounts of compensation actually earned, realized, or received by our NEOs during the applicable year, and it is not a measure the Talent, Culture, and Compensation Committee uses to make its executive compensation decisions.
The following table sets forth additional compensation information for our principal executive officer (PEO) and our non-PEO named executive officers (Non-PEO NEOs), calculated in accordance with Item 402(v) of Regulation S-K, for fiscal years 2026, 2025, 2024, 2023, and 2022.