Pay vs Performance Disclosure - USD ($)
May 31, 2026
May 31, 2025
May 31, 2024
May 31, 2023
May 31, 2022
PAY VERSUS PERFORMANCE
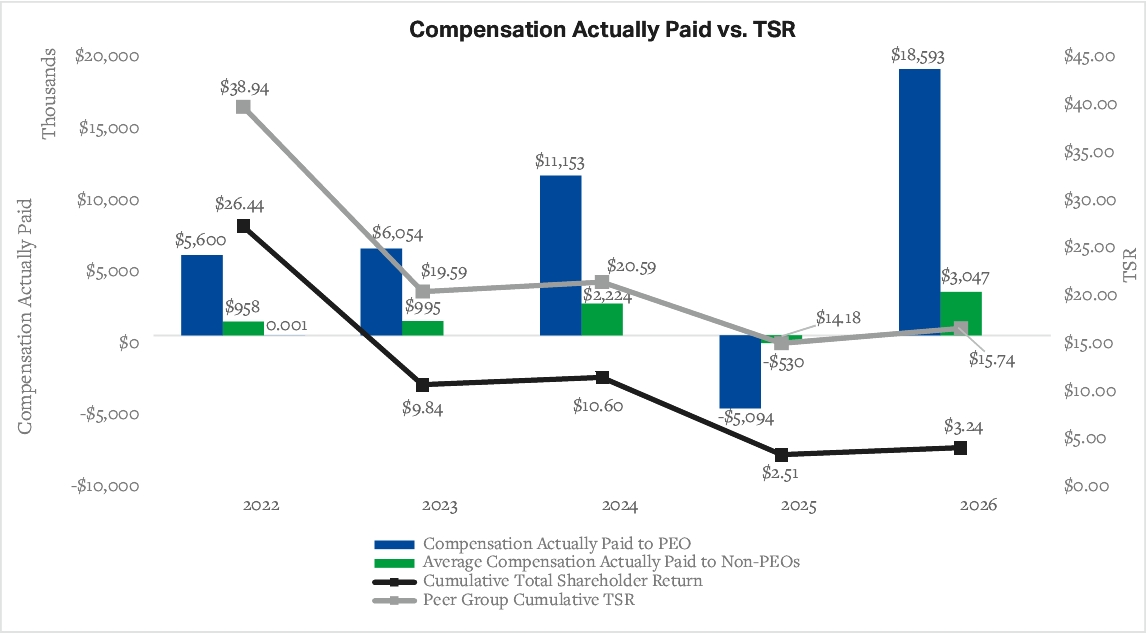
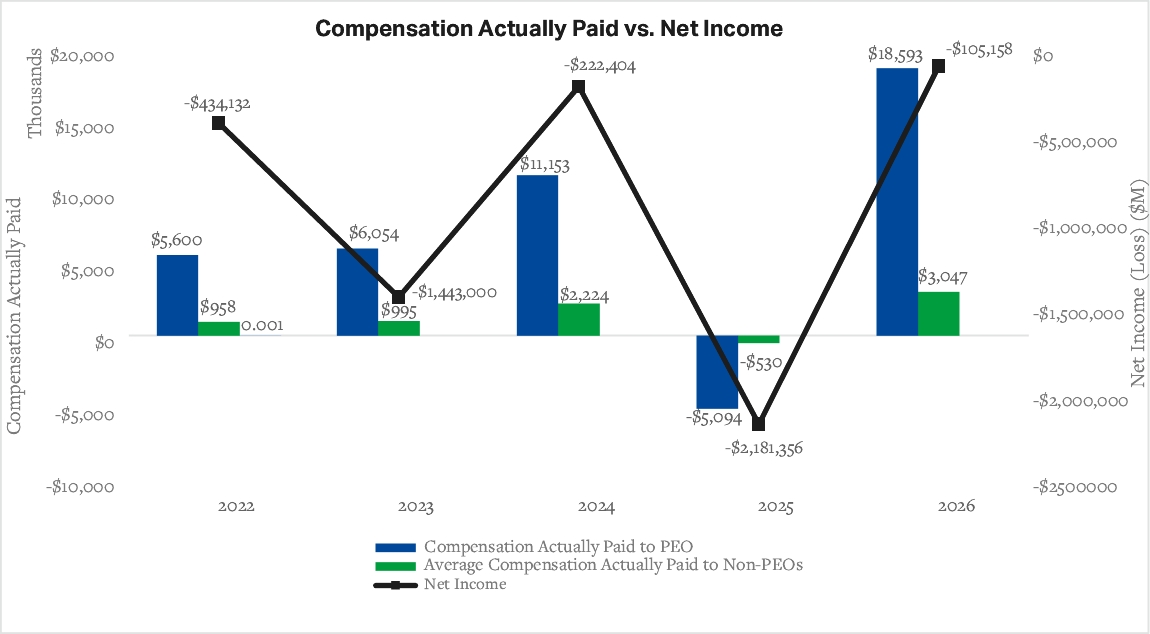
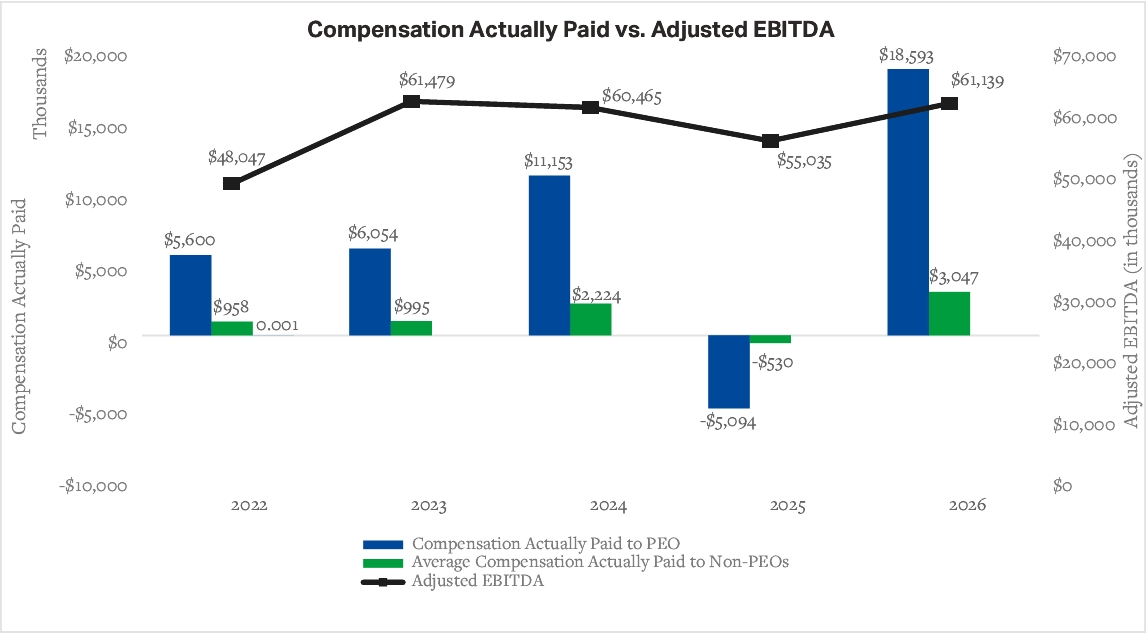
As required by Section 953(a) of the Dodd-Frank Wall Street Reform and Consumer Protection Act, and Item 402(v) of Regulation S-K, we are providing the following information about the relationship between “compensation actually paid” to our PEO and to our other non-PEOs and certain financial performance of the Company. Compensation actually paid, as determined under SEC requirements, does not reflect the actual amount of compensation earned by or paid to our executive officers during a covered year. For further information concerning the Company’s pay-for-performance philosophy and how the Company aligns executive compensation with the Company’s performance, refer to the Compensation Discussion and Analysis.
Fair value amounts below are computed in a manner consistent with the fair value methodology used to account for share-based payments in our financial statements under generally accepted accounting principles. For time-based RSU awards, fair value is calculated using the closing price on applicable year-end dates or, in the case of vesting dates, the actual vesting price. For PSU awards, the same valuation methodology as RSU awards is used to calculate fair value except year-end and vesting date values are multiplied by the probability of achievement as of each such date. The estimated probability of achievement was 100% for the Synergy PSUs and HEXO PSUs. Total shareholder return has been calculated in a manner consistent with Item 402(v) of Regulation S-K.
PEO1 | Average of Non-PEO NEOs2 | Value of $100 Initial Investment Based On: | ||||||||||||||||||||||||
Fiscal Year | SCT Total Compensation3 | Compensation Actually Paid4 10 | SCT Total Compensation3 | Compensation Actually Paid5 10 | Cumulative TSR6 | Peer Group TSR7 | Net Income (Loss)8 ($000) | Adjusted EBITDA9 ($000) | ||||||||||||||||||
2026 | $22,157,305 | $18,592,981 | $3,425,384 | $3,046,612 | $3.24 | $15.74 | ($105,158) | $61,139 | ||||||||||||||||||
2025 | $10,295,612 | ($5,093,898) | $1,989,199 | ($530,210) | $2.51 | $14.18 | ($2,181,356) | $55,035 | ||||||||||||||||||
2024 | $10,142,971 | $11,153,152 | $2,061,804 | $2,224,106 | $10.60 | $20.59 | ($222,404) | $60,465 | ||||||||||||||||||
2023 | $15,656,584 | $6,053,926 | $2,371,929 | $994,995 | $9.84 | $19.59 | ($1,443,000) | $61,479 | ||||||||||||||||||
2022 | $19,456,767 | $5,599,894 | $2,755,870 | $957,950 | $26.44 | $38.94 | ($434,132) | $48,047 | ||||||||||||||||||
(1) | Mr. Simon served as the Company’s PEO for fiscal years 2022-2026. |
(2) | The non-PEO NEOs for the applicable fiscal years were as follows: |
2023-2026: Carl Merton (CFO), Denise Faltischek (Chief Strategy Officer and Head of M&A), Mitchell Gendel (Global General Counsel and Corporate Secretary), and Roger Savell (Chief Administrative Officer)
2022: Carl Merton (CFO), Denise Faltischek (Chief Strategy Officer and Head of International), James Meiers (Head of Canada), and Mitchell Gendel (Global General Counsel and Corporate Secretary)
(3) | The values in this column reflect the “Total” compensation set forth in the Summary Compensation Table (“SCT”) as stated in the Company’s past proxy filings for the corresponding fiscal year. See the footnotes to the applicable SCT for further detail regarding the amounts in this column. |
(4) | The following table sets forth the adjustments made during each fiscal year presented in the Pay Versus Performance Table to arrive at compensation “actually paid” to our PEO during 2026: |
Adjustments to Determine Compensation “Actually Paid” for PEO | SCT Total Compensation4 | Deduction for Amounts Reported under the “Stock Awards” and “Option Awards” Column in the SCT | Increase for Fair Value of Awards Granted during the year that Remain Unvested as of Year End | Increase for Fair Value of Awards Granted during the year that Vest during year | Increase/ deduction for Change in Fair Value from prior Year-end to current Year-end of Awards Granted Prior to year that were Outstanding and Unvested as of Year-end | Increase/ deduction for Change in Fair Value from Prior Year-end to Vesting Date of Awards Granted Prior to year that Vested during year | Deduction of Fair Value of Awards Granted Prior to year that were Forfeited or Modified during year | Dollar Value of Dividends or other Earnings Paid on Stock Awards prior to Vesting Date not otherwise included in Total Compensation | Total Adjustments to SCT Total Compensation | ||||||||||||||||||||
2026 | $22,157,305 | $18,816,501 | $4,721,502 | $0 | $142,353 | $10,388,322 | $0 | $0 | $15,252,177 | ||||||||||||||||||||
(5) | The following table sets forth the adjustments made during each fiscal year presented in the Pay Versus Performance Table to arrive at the average compensation “actually paid” to our Non-PEO NEOs during each of the reportable years: |
Adjustments to Determine Compensation “Actually Paid” for PEO | SCT Total Compensation Of Average of Non-PEO NE | Deduction for Amounts Reported under the “Stock Awards” and “Option Awards” Column in the SCT | Increase for Fair Value of Awards Granted during the year that Remain Unvested as of Year End | Increase for Fair Value of Awards Granted during the year that Vest during year | Increase/ deduction for Change in Fair Value from prior Year-end to current Year-end of Awards Granted Prior to year that were Outstanding and Unvested as of Year-end | Increase/ deduction for Change in Fair Value from Prior Year-end to Vesting Date of Awards Granted Prior to year that Vested during year | Deduction of Fair Value of Awards Granted Prior to year that were Forfeited or Modified during year | Dollar Value of Dividends or other Earnings Paid on Stock Awards prior to Vesting Date not otherwise included in Total Compensation | Total Adjustments to SCT Total Compensation | ||||||||||||||||||||
2026 | $3,425,384 | $2,698,934 | $891,300 | $0 | $27,228 | $1,401,634 | $0 | $0 | $2,320,162 | ||||||||||||||||||||
(6) | Total shareholder return is calculated for each fiscal year based on a fixed investment of $100 from May 31, 2021 through the end of each applicable year, assuming reinvestment of dividends. |
(7) | Horizons Marijuana Life Sciences Index is the peer group index selected by the Company for this purpose and for purposes of the Stock Performance Graph in our Annual Report. |
(8) | The dollar amounts reported represents the amount of net income (loss) reflected in the Company’s audited financial statements for the applicable year or period. |
(9) | The Company has identified Adjusted EBITDA as the Company-selected measure for this pay versus performance disclosure, as it represents the most significant financial performance measure used to link compensation actually paid to the PEOs and Non-PEO NEOs to the Company’s performance in Fiscal Year 2026. The Adjusted EBITDA for all years except the year ended May 31, 2024 includes an adjustment for lease expenses. Please see “Reconciliation of Non-GAAP Financial Measures to GAAP Measures” in our Annual Report on Form 10-K for the fiscal year ended May 31, 2026 and our Form 10-K/A for the fiscal year ended May 31, 2022 for a reconciliation of such non-GAAP Measures to the most directly comparable GAAP financial measures. |
(10) | With respect to the awards described in the Compensation Discussion & Analysis section under “2024 EBITDA PSU Awards”, the fair value for purposes of ASC 718 was established in Fiscal Year 2026 due to the three-year cumulative performance targets having been set during Fiscal Year 2026. As a result, the fair value of such awards were not previously included in the Pay Versus Performance Table for prior fiscal years. The 2024 EBITDA PSUs became vested as of May 31, 2026 as described in the Compensation Discussion & Analysis section under “2024 EBITDA PSU Awards”. The corresponding fair value for the 2024 EBITDA PSU Awards has been reflected in the amount of total compensation for Fiscal Year 2026 and is included in the Pay Versus Performance Table. |
(1) | Mr. Simon served as the Company’s PEO for fiscal years 2022-2026. |
(2) | The non-PEO NEOs for the applicable fiscal years were as follows: |
2023-2026: Carl Merton (CFO), Denise Faltischek (Chief Strategy Officer and Head of M&A), Mitchell Gendel (Global General Counsel and Corporate Secretary), and Roger Savell (Chief Administrative Officer)
2022: Carl Merton (CFO), Denise Faltischek (Chief Strategy Officer and Head of International), James Meiers (Head of Canada), and Mitchell Gendel (Global General Counsel and Corporate Secretary)
(7) | Horizons Marijuana Life Sciences Index is the peer group index selected by the Company for this purpose and for purposes of the Stock Performance Graph in our Annual Report. |
(4) | The following table sets forth the adjustments made during each fiscal year presented in the Pay Versus Performance Table to arrive at compensation “actually paid” to our PEO during 2026: |
Adjustments to Determine Compensation “Actually Paid” for PEO | SCT Total Compensation4 | Deduction for Amounts Reported under the “Stock Awards” and “Option Awards” Column in the SCT | Increase for Fair Value of Awards Granted during the year that Remain Unvested as of Year End | Increase for Fair Value of Awards Granted during the year that Vest during year | Increase/ deduction for Change in Fair Value from prior Year-end to current Year-end of Awards Granted Prior to year that were Outstanding and Unvested as of Year-end | Increase/ deduction for Change in Fair Value from Prior Year-end to Vesting Date of Awards Granted Prior to year that Vested during year | Deduction of Fair Value of Awards Granted Prior to year that were Forfeited or Modified during year | Dollar Value of Dividends or other Earnings Paid on Stock Awards prior to Vesting Date not otherwise included in Total Compensation | Total Adjustments to SCT Total Compensation | ||||||||||||||||||||
2026 | $22,157,305 | $18,816,501 | $4,721,502 | $0 | $142,353 | $10,388,322 | $0 | $0 | $15,252,177 | ||||||||||||||||||||
(5) | The following table sets forth the adjustments made during each fiscal year presented in the Pay Versus Performance Table to arrive at the average compensation “actually paid” to our Non-PEO NEOs during each of the reportable years: |
Adjustments to Determine Compensation “Actually Paid” for PEO | SCT Total Compensation Of Average of Non-PEO NE | Deduction for Amounts Reported under the “Stock Awards” and “Option Awards” Column in the SCT | Increase for Fair Value of Awards Granted during the year that Remain Unvested as of Year End | Increase for Fair Value of Awards Granted during the year that Vest during year | Increase/ deduction for Change in Fair Value from prior Year-end to current Year-end of Awards Granted Prior to year that were Outstanding and Unvested as of Year-end | Increase/ deduction for Change in Fair Value from Prior Year-end to Vesting Date of Awards Granted Prior to year that Vested during year | Deduction of Fair Value of Awards Granted Prior to year that were Forfeited or Modified during year | Dollar Value of Dividends or other Earnings Paid on Stock Awards prior to Vesting Date not otherwise included in Total Compensation | Total Adjustments to SCT Total Compensation | ||||||||||||||||||||
2026 | $3,425,384 | $2,698,934 | $891,300 | $0 | $27,228 | $1,401,634 | $0 | $0 | $2,320,162 | ||||||||||||||||||||
Financial Performance Measures
As described in greater detail above in the “Compensation Discussion and Analysis,” our executive compensation program reflects a variable pay-for-performance philosophy. The metrics that we use for both our long-term and short-term incentive awards are selected based on an objective of incentivizing our named executive officers to increase the value of our enterprise for our stockholders. The most important financial performance measures used by us to link executive compensation actually paid to our named executive officers, for the most recently completed fiscal year, to our performance are as follows:
Adjusted EBITDA | ||
Consolidated Net Revenue | ||
(9) | The Company has identified Adjusted EBITDA as the Company-selected measure for this pay versus performance disclosure, as it represents the most significant financial performance measure used to link compensation actually paid to the PEOs and Non-PEO NEOs to the Company’s performance in Fiscal Year 2026. The Adjusted EBITDA for all years except the year ended May 31, 2024 includes an adjustment for lease expenses. Please see “Reconciliation of Non-GAAP Financial Measures to GAAP Measures” in our Annual Report on Form 10-K for the fiscal year ended May 31, 2026 and our Form 10-K/A for the fiscal year ended May 31, 2022 for a reconciliation of such non-GAAP Measures to the most directly comparable GAAP financial measures. |