Shareholder Report
|
12 Months Ended |
|
Jun. 30, 2026
USD ($)
Holding
|
|---|
| Shareholder Report [Line Items] |
|
| Document Type |
N-CSR
|
| Amendment Flag |
false
|
| Registrant Name |
EntrepreneurShares Series Trust
|
| Entity Central Index Key |
0001495922
|
| Entity Investment Company Type |
N-1A
|
| Document Period End Date |
Jun. 30, 2026
|
| C000194842 |
|
| Shareholder Report [Line Items] |
|
| Fund Name |
ERSHARES PRIVATE-PUBLIC CROSSOVER ETF
|
| Trading Symbol |
XOVR
|
| Annual or Semi-Annual Statement [Text Block] |
This annual shareholder report contains important information about ERShares Private-Public Crossover ETF for the period of July 1, 2025 to June 30, 2026.
|
| Additional Information [Text Block] |
You can find additional information about the Fund at https://entrepreneurshares.com/xovr-etf. You can also request this information by contacting us at +1 (617) 279 0045.
|
| Material Fund Change Notice [Text Block] |
This report describes changes to the Fund that occurred during the June 30, 2026 annual reporting period.
|
| Additional Information Phone Number |
+1 (617) 279 0045
|
| Additional Information Website |
https://entrepreneurshares.com/xovr-etf
|
| Expenses [Text Block] |
WHAT WERE THE FUND COSTS FOR THE LAST YEAR? (based on a hypothetical $10,000 investment) Table SummaryFund Name | Cost of a $10,000
Investment | Cost Paid as a Percentage of a
$10,000 Investment |
|---|
ERShares Private-Public Crossover ETF | $88 | 0.83% |
|---|
|
| Expenses Paid, Amount |
$ 88
|
| Expense Ratio, Percent |
0.83%
|
| Factors Affecting Performance [Text Block] |
HOW DID THE FUND PERFORM LAST YEAR?The Fund’s strong performance during the reporting period reflected strength in both public and private growth investments. Public market gains were driven by select technology, industrials and innovation-oriented companies, while the Fund’s exposure to the performance of private companies, such as SpaceX and other disruptive leaders, provided meaningful diversification benefits relative to traditional benchmarks. The Fund’s relative positioning, with measured exposure to the Magnificent Seven and emphasis on a broader set of entrepreneurial growth companies, allowed for balanced participation in the market rally. This approach helped the Fund generate competitive returns in an environment where a narrow group of mega-cap stocks once again dominated headlines. The primary factor weighing on the Fund's relative performance during the period was the fluctuating weight of its SpaceX position, which reached a peak of approximately 44% of the portfolio in February 2026. After a flat period, a stretch of notable strength in broader equity markets began towards the end of March. Because SpaceX, as a private holding, does not reprice with the same frequency or magnitude as the Fund's publicly traded positions, this elevated weighting effectively functioned as a cash-like drag during that window, limiting the Fund's ability to fully participate in the strong market performance. Beyond this effect, security selection and asset allocation also contributed to relative underperformance. Growth stocks broadly, and cloud names in particular, faced notable headwinds from October through December, followed by additional pressure on growth equities from January through March amid the market impact of the Iran war. Against this backdrop, security selection detracted most within Communication Services, Health Care, and Consumer Discretionary, where the Fund's holdings underperformed their sector counterparts. From an asset allocation standpoint, an overweight to Financials and Energy, along with an underweight to Information Technology, one of the benchmark's stronger-performing sectors, further weighed on relative results. These effects were partially offset by favorable security selection within Financials and Information Technology. Despite volatility, the Fund maintained its disciplined crossover strategy. We believe that by combining public innovators with high-conviction private market opportunities, the Fund has provided shareholders access to unique growth drivers that are not typically available in standard index-based portfolios. The Fund remained committed to its differentiated approach of bridging private and public markets. We believe that selective exposure to disruptive innovators, alongside a disciplined focus on risk management, positioned the Fund well in varying market environments. |
| Line Graph [Table Text Block] |
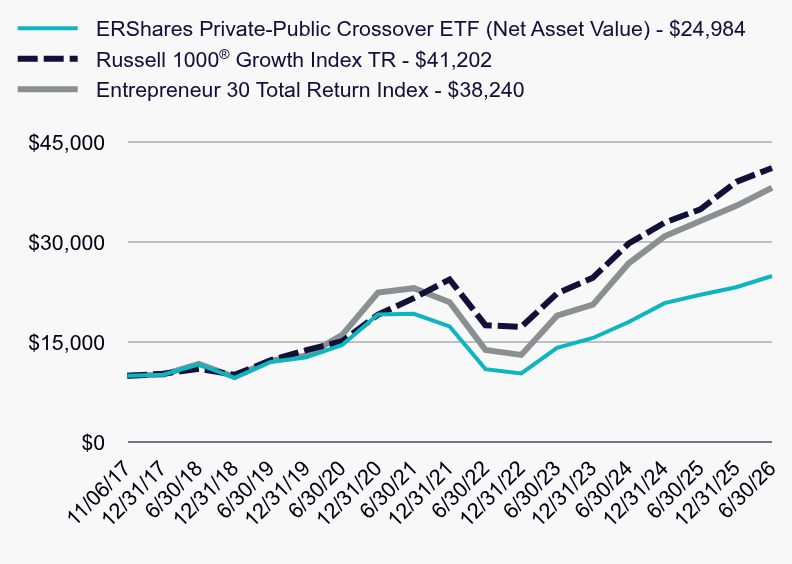
Table Summary | ERShares Private-Public Crossover ETF (Net Asset Value) - $24,984 | Russell 1000® Growth Index TR - $41,202 | Entrepreneur 30 Total Return Index - $38,240 |
|---|
11/06/17 | $10,000.01 | $10,000.00 | $10,000.00 |
|---|
12/31/17 | $10,181.82 | $10,309.18 | $10,181.81 |
|---|
6/30/18 | $11,729.78 | $11,056.93 | $11,790.69 |
|---|
12/31/18 | $9,708.35 | $10,153.13 | $9,812.16 |
|---|
6/30/19 | $12,093.95 | $12,334.88 | $12,278.65 |
|---|
12/31/19 | $12,781.54 | $13,847.79 | $13,017.76 |
|---|
6/30/20 | $14,636.14 | $15,206.86 | $16,157.77 |
|---|
12/31/20 | $19,218.46 | $19,178.26 | $22,508.33 |
|---|
6/30/21 | $19,321.11 | $21,669.36 | $23,160.49 |
|---|
12/31/21 | $17,430.71 | $24,470.82 | $21,059.70 |
|---|
6/30/22 | $11,004.59 | $17,601.25 | $13,895.25 |
|---|
12/31/22 | $10,365.46 | $17,340.74 | $13,140.91 |
|---|
6/30/23 | $14,200.21 | $22,372.39 | $19,039.42 |
|---|
12/31/23 | $15,687.63 | $24,741.47 | $20,685.69 |
|---|
6/30/24 | $18,081.45 | $29,863.10 | $26,902.62 |
|---|
12/31/24 | $20,916.85 | $32,994.32 | $30,941.69 |
|---|
6/30/25 | $22,183.48 | $35,004.59 | $33,234.09 |
|---|
12/31/25 | $23,299.04 | $39,118.20 | $35,522.43 |
|---|
6/30/26 | $24,984.01 | $41,202.46 | $38,240.37 |
|---|
|
| Average Annual Return [Table Text Block] |
AVERAGE ANNUAL TOTAL RETURNSTable Summary ERShares Private-Public Crossover ETF | 1 YR | 5 YR | SINCE INCEPTION* |
|---|
ERShares Private-Public Crossover ETF (Net Asset Value) | 12.62% | 5.28% | 11.17% |
|---|
Russell 1000® Growth Index TR | 17.71% | 13.71% | 17.79% |
|---|
Entrepreneur 30 Total Return Index | 15.06% | 10.55% | 16.78% |
|---|
|
| Material Change Date |
Jun. 30, 2026
|
| AssetsNet |
$ 2,174,482,976
|
| Holdings Count | Holding |
32
|
| Advisory Fees Paid, Amount |
$ 6,749,074
|
| InvestmentCompanyPortfolioTurnover |
143.00%
|
| Additional Fund Statistics [Text Block] |
- Total Net Assets$2,174,482,976
- Number of Portfolio Holdings32
- Portfolio Turnover Rate143%
- Advisory Fees Paid$6,749,074
|
| Holdings [Text Block] |
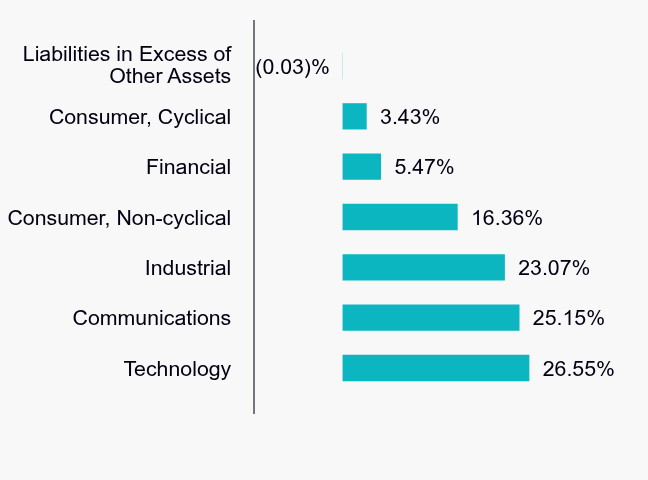
SECTOR WEIGHTINGS (as a % of Net Assets)Table SummaryValue | Value |
|---|
Technology | 26.55% | Communications | 25.15% | Industrial | 23.07% | Consumer, Non-cyclical | 16.36% | Financial | 5.47% | Consumer, Cyclical | 3.43% | Liabilities in Excess of Other Assets | (0.03)% | |
| Largest Holdings [Text Block] |
TOP TEN HOLDINGS (as a % of Net Assets)Table SummaryTop 10 | % |
|---|
SPV Exposure to SpaceX, LP | 17.83% | NVIDIA Corp. | 9.47% | Astera Labs, Inc. | 7.74% | Alphabet, Inc. Class A | 6.52% | Meta Platforms, Inc. | 4.47% | AppLovin Corp. Class A | 3.95% | Natera, Inc. | 3.70% | Robinhood Markets, Inc. Class A | 3.55% | Veeva Systems, Inc. Class A | 3.16% | Reddit, Inc. Class A | 2.78% | Total % of Top 10 Holdings | 63.17% | |
| Material Fund Change [Text Block] |
The following is a summary of material changes made to the Fund since the beginning of the reporting period. For more complete and current information, you may review the Fund's disclosure documents on its webpage at https://entrepreneurshares.com/xovr-etf or upon request at +1 (617) 279 0045. Effective March 4, 2026, the Fund's annual fund operating expenses were supplemented to reflect the addition of Acquired Fund Fees and Expenses of 1.06% reflecting non-recurring transaction fees borne by the Fund in connection with its investment in certain acquired funds. These fees were incurred at the time of acquisition and do not represent ongoing or recurring expenses associated with those existing investments. The Fund does not expect to incur additional transaction fees with respect to those previously acquired investments. To the extent the Fund acquires interests in additional acquired funds in the future, transaction-related costs may be incurred at that time; such costs may differ from those reflected herein. Effective March 4, 2026, the Fund's principal investment strategies and principal risks were supplemented to permit the Fund to invest in derivative instruments (such as futures, options and swaps or hybrid instruments) to implement its investment strategies. Effective June 4, 2026, the Fund's prospectus was supplemented to reflect the ability of the Fund to impose a variable redemption/transaction fee, payable to the Fund, of up to 2% of the value of the Creation Units subject to a redemption. |