
Preliminary Feasibility Study
& Technical Report Summary
5E Advanced Materials Fort Cady Project
Report Date
SEPTEMBER 17, 2026
Report Effective Date
JUNE 30, 2026
Exhibit 96.1
Preliminary Feasibility Study
& Technical Report Summary
5E Advanced Materials Fort Cady Project
Report Date
SEPTEMBER 17, 2026
Report Effective Date
JUNE 30, 2026
1
Signature Page
List of Qualified Persons
|
|
|
|
Section(s) |
Date |
Alan E. White, P. E., |
12, 13 and 18 (18.1.5 through 18.1.8) |
September 17, 2026 |
/s/ Alan E. White |
|
|
|
|
|
Kevin Martina, P.Eng., |
10, 14 and 18 (18.1.1 through 18.1.4, 18.1.9 and 18.2) |
September 17, 2026 |
/s/ Kevin Martina |
|
|
|
|
|
Martin Roth, P.G., |
7.3 |
September 17, 2026 |
/s/ Martin Roth |
|
|
|
|
|
Steven Kerr, P.G., C.P.G., Principal, |
2, 3, 4, 5, 6, 7 (except 7.3), 8, 9, 11, 15, 17, 20, 21 and 22 |
September 17, 2026 |
/s/ Steven Kerr |
|
|
|
|
|
Paul Weibel, CPA, |
1, 16, 19, 23, 24 and 25 |
September 17, 2026 |
/s/ Paul Weibel |
|
|
|
|
|
2
Table of Contents |
|
2 |
|
3 |
|
8 |
|
10 |
|
12 |
|
14 |
|
15 |
|
15 |
|
15 |
|
16 |
|
16 |
|
16 |
|
16 |
|
16 |
|
16 |
|
17 |
|
17 |
|
18 |
|
18 |
|
19 |
|
19 |
|
20 |
|
20 |
|
20 |
|
20 |
|
21 |
|
4 Accessibility, Climate, Local Resources, Infrastructure, and Physiography |
21 |
21 |
|
21 |
|
21 |
|
21 |
|
22 |
|
22 |
|
22 |
|
5.3 American Pacific Borates Share Exchange of Atlas Precious Metals |
23 |
23 |
|
28 |
|
28 |
|
30 |
|
30 |
|
31 |
|
33 |
|
33 |
3
33 |
|
33 |
|
33 |
|
37 |
|
37 |
|
38 |
|
39 |
|
40 |
|
40 |
|
40 |
|
40 |
|
41 |
|
41 |
|
41 |
|
41 |
|
42 |
|
49 |
|
49 |
|
49 |
|
49 |
|
49 |
|
49 |
|
50 |
|
50 |
|
50 |
|
50 |
|
52 |
|
54 |
|
59 |
|
60 |
|
60 |
|
60 |
|
61 |
|
61 |
|
63 |
|
63 |
|
64 |
|
64 |
|
65 |
|
67 |
|
71 |
|
71 |
|
71 |
|
71 |
|
71 |
4
72 |
|
73 |
|
73 |
|
13.1 Geotechnical and Hydrological Model Contribution to Mine Design |
74 |
74 |
|
75 |
|
81 |
|
81 |
|
83 |
|
84 |
|
84 |
|
90 |
|
92 |
|
95 |
|
97 |
|
97 |
|
97 |
|
97 |
|
97 |
|
97 |
|
97 |
|
97 |
|
98 |
|
98 |
|
98 |
|
98 |
|
98 |
|
100 |
|
100 |
|
101 |
|
102 |
|
102 |
|
102 |
|
102 |
|
102 |
|
103 |
|
103 |
|
104 |
|
104 |
|
104 |
|
104 |
|
105 |
|
106 |
|
106 |
|
107 |
5
107 |
|
107 |
|
108 |
|
108 |
|
108 |
|
108 |
|
110 |
|
110 |
|
18.1.1 Capital Cost Estimate - Processing Facility and Infrastructure |
110 |
18.1.2 Processing Facility and Infrastructure - Basis and Methodology |
111 |
114 |
|
18.1.4 Capital Cost Estimate - Cogeneration Combined Power & Heat (CHP) Plant |
114 |
114 |
|
115 |
|
115 |
|
115 |
|
115 |
|
116 |
|
116 |
|
116 |
|
117 |
|
117 |
|
117 |
|
117 |
|
118 |
|
118 |
|
118 |
|
118 |
|
119 |
|
119 |
|
119 |
|
119 |
|
120 |
|
120 |
|
120 |
|
121 |
|
121 |
|
121 |
|
123 |
|
123 |
|
125 |
|
125 |
|
125 |
|
126 |
|
127 |
6
7
8
106 |
|
Figure 16.7 U.S. gypsum market demand and growth, 2024 – 2034 |
107 |
112 |
|
119 |
|
120 |
|
121 |
|
122 |
|
123 |
9
10
115 |
|
115 |
|
116 |
|
117 |
|
118 |
|
119 |
|
120 |
|
Table 19.4 Total fixed operating cost over life of mine excluding depreciation |
120 |
Table 19.5 Total other operating costs / (credits) over life of mine |
120 |
123 |
|
124 |
11
Glossary of Terms |
|
Abbreviation |
Definition |
5E |
5E Advanced Materials, Inc., including its wholly-owned subsidiary 5E Boron Americas, LLC |
amsl |
Above mean sea level |
AOR |
Area of Review |
APBL |
American Pacific Borate & Lithium |
BA |
Boric acid |
B2O3 |
Boron oxide or Boron trioxide (chemical formula) |
bgs |
Below ground surface |
BLM |
U.S. Department of the Interior Bureau of Land Management |
C |
Celsius |
CaCl2 |
Calcium Chloride (chemical formula) |
CAGR |
Compound annual growth rate |
CEQA |
California Environmental Quality Act |
cm |
Centimeter |
cm3 |
Cubic centimeter |
cm/sec |
Centimeters per second |
CO2 |
Carbon dioxide (chemical formula) |
CSTR |
Continuous Stirred-Tank Reactor |
DL |
Detection limit |
Duval |
Duval Corporation |
E |
East |
EIR |
Environmental Impact Report (California lead) |
EIS |
Environmental Impact Statement (BLM lead) |
EPA |
United States Environmental Protection Agency |
F |
Fahrenheit |
FACE |
Financial Assurance Cost Estimate |
FCMC |
Fort Cady Mineral Corporation |
FEL |
Front End Loading, a stage gated project management system (with a number to the corresponding stage, e.g., FEL-2) |
ft |
Foot or Feet |
ft2 |
Square feet |
ft3 |
Cubic foot |
g |
Gram |
Gal |
Gallon(s) |
g/l |
Gram per liter |
Gal/min |
Gallons per minute |
gpm |
gallons per minute |
H2SO4 |
Sulfuric acid (chemical formula) |
H3BO3 |
Boric acid (chemical formula) |
HCl |
Hydrochloric acid (chemical formula) |
ICP |
Inductively Coupled Plasma |
ID2 |
Inverse Distance Squared algorithm |
IRR |
Internal Rate of Return |
ISL |
In-situ Leaching |
JORC |
Australian Joint Ore Reserves Committee |
K |
Hydraulic coefficient |
k |
Thousand |
kg |
Kilogram |
kv |
Kilovolt |
12
kw |
Kilowatt |
kWh |
Kilowatt hour |
Kline |
Kline & Company, Inc. |
lb(s) |
Pound(s) mass |
Li |
Lithium |
LOM |
Life of Mine |
LCE |
Lithium carbonate equivalents |
m |
Meters(s) |
mg |
Milligram |
mi |
Mile(s) |
mm |
Millimeter(s) |
MDAQMD |
Mojave Desert Air Quality Management District |
MgCl2 |
Magnesium Chloride (chemical formula) |
MMBtu |
Millions of British Thermal Units |
MSME |
Mountain States Mineral Enterprises Inc. |
Mt |
Million tons |
mt |
Metric tons |
M |
Million |
MTO |
Material Take-off |
MW |
Megawatt |
N |
North |
NaCl |
Sodium chloride (chemical formula) |
NAD 83 |
North American Datum 83 is a unified horizontal or geometric datum providing a spatial reference for mapping purposes |
NEPA |
National Environmental Policy Act |
NN |
Nearest neighbor |
NPV |
Net present value |
pH |
Potential Hydrogen – a numeric scale to specify the acidity or alkalinity of an aqueous solution |
PLS |
Pregnant leach solution |
Ppm |
Parts per million |
psi |
Pounds per square inch of pressure |
QA/QC |
Quality Assurance and Quality Control |
QP |
Qualified Person per SEC S-K 1300 definition |
ROD |
The 1994 Record of Decision for the Fort Cady Project was issued after the EIS/EIR evaluations. |
S |
Storage coefficient |
$ |
United States dollars |
SBC-LUS |
San Bernardino County Land Use Services Department |
SCE |
Southern California Edison |
SEC |
U.S. Securities and Exchange Commission |
SSF |
Small-scale Facility |
ST |
Short ton |
stpa |
Short tons per annum |
tpy |
Tons per year |
TRS |
Technical Report Summary |
UIC |
Underground Injection Control Class III Area Permit |
U.S. |
United States |
US$ |
United States dollars |
UTM |
Universal Transverse Mercator coordinate system for mapping |
wt. |
Weight |
XRF |
X-Ray Fluorescence Spectrometry |
yr |
Year |
13
1 Executive Summary
This report was prepared as a pre-feasibility level Technical Report Summary in accordance with the U.S. Securities and Exchange Commission (SEC) S-K regulations (Title 17, Part 229, Items 601 and 1300 through 1305) for 5E Advanced Materials, Inc. and its subsidiary 5E Boron Americas, LLC, (together 5E or the Company) Fort Cady Project (the Project). The Project described herein is part of 5E’s strategy to become a globally integrated supplier of industrial minerals through in-situ extraction of colemanite. Once extracted, the Company will produce and refine boron and calcium-based products. The Project is in the Mojave Desert, near the town of Newberry Springs, California.
Using the volumes, market inputs, and anticipated operating and capital costs, a detailed economic model was created with a forecasted net present value (NPV7) of approximately US$711M and internal rate of return (IRR) of 19.2%. Further details, including key model assumptions, are included in Section 19. This Technical Report Summary includes Phase 1 of the Project, and while the resource base provides the opportunity for expansion that could include additional production tonnage or value-added boron derivatives, they are excluded from this Technical Report Summary.
The Project includes six parcels of private land owned by 5E, federal land owned by the U.S. Department of the Interior Bureau of Land Management (BLM), and an electrical transmission corridor runs through the Project where Southern California Edison (SCE) has surface and subsurface control to a depth of 500 ft. While this limits surface access to the area within the right-of-way of the transmission lines, mineral rights are owned by 5E, and mineralization remains accessible as the ore body occurs at depths greater than 1,000 ft. The Project also includes 30 unpatented lode claims, 117 unpatented placer claims and two unpatented millsite claims from the Bureau of Land Management within the U.S. Department of the Interior. On the southwestern side of the Project, the State of California owns the mineral rights for 272 acres of land where 5E owns the surface rights. These mineral rights can be leased from the state.
Major mining permits were obtained in 1994, with a Record of Decision (ROD) issued by the BLM and a Conditional Use Permit issued by the State of California. In 2020, an Underground Injection Control (UIC) permit was obtained by the United States Environmental Protection Agency (EPA) and approval to commence mining operations was obtained in 2023. The mining permits allow for 90,000 short tons of borate, defined as boron oxide or boron oxide equivalent, thus permitting up to approximately 160,000 short tons of boric acid.
5E believes the resource is one of the largest deposit of borate globally with a history of exploration and mining of the ore body, beginning in 1964 with the resource discovery and includes production of boric acid and synthetic borates by Duval Corporation (Duval) and Fort Cady Mineral Corporation (FCMC). Geologically, the deposit is bounded by faults on both east and west sides and is the site of prior volcanic activity from the Pisgah Crater. Mineralization occurs in a sequence of lacustrine lakebed sediments ranging in depths from 1,300 ft to 1,500 ft below ground surface.
Exploration drilling has led to a geologic interpretation of the deposit as lacustrine evaporite sediments containing colemanite, a hydrated calcium borate mineral. The deposit also contains appreciable quantities of lithium. Geologic modeling based on drilling and sampling results depicts an elongate deposit of lacustrine evaporite sediments containing colemanite. The deposit is approximately 2.1 mi long by 0.6 mi wide and ranging in thickness from 70 to 262 ft. Mineralization has been defined in four distinct horizons defined by changes in lithology and B2O3 analyses.
A mineral resource and mineral reserve statement has been estimated and reported using a cut-off grade of 2.0% B2O3. Total measured, indicated, and inferred resources for the Project (inclusive of mineral reserves) total 204.8 MSTs of ore and 28.8 MSTs of boric acid. Resources exclusive of mineral reserves are presented in Section 11. Proven reserves total 2.6 MSTs and probable reserves total 2.5 MSTs of boric acid, respectively. The initial life of mine for Phase 1 is 37.5 years based on the current mine plan and 17.5% of the resource has been converted to reserves. The southeastern side of the property includes an exploration target and there is additional resource potential with this target.
The colemanite resource is to be mined via in-situ leaching (ISL) using a hydrochloric acid solution. The leachate will be processed in the commercial-scale facility to initially produce 130,000 short tons per annum (k stpa) of boric acid along with calcium-based by-products calcium chloride and gypsum. A Class 4 or FEL-2 level engineering estimate for the
14
phase 1 plant was prepared as part of this Technical Report Summary. In November 2023, the Company received approval to commence in-situ mining operations from the EPA and began mining in January 2024. The Company’s small-scale facility (SSF) began operation in April 2024, has achieved production and at times has achieved a steady state of production of approximately one short ton per day.
Global boric acid demand remains robust across established markets and future-facing industries while supply continues to be tight across the industry operating network. The supply deficit is expected to continue to materially worsen in the future and lead to elevated pricing. This outlook, along with a pricing forecast for boric acid and its calcium by-products, was assessed in a preliminary market study detailed in Section 16.
Capital cost expectations for a 130,000 stpa boric acid plant (inclusive of co-product processing and COGEN power) were determined to be $367M for the first stage plus a contingency of $55M and owner’s cost estimate of $13M for a total capital estimate of $435M. Operating costs are built upon detailed material and energy balances and recent historical pricing of raw materials and utilities.
Operation of the Company’s SSF has provided many of the parameters and scoping items for FEL-2 engineering and the mine plan, while also confirming historical data from operations in the 1980’s. Product produced from the SSF has been sent to various customers for qualification and sampling. Progression to Front End Loading Stage 3 Process Design Package (FEL-3) engineering will further refine the accuracy of the capital cost estimates for the chemical processing plant. Additionally, operation of horizontal directional wells and demonstrating a pilot scale well program is expected to confirm the final mine plan for the commercial facility. Once these steps are completed, the Company will be well positioned to advance this pre-feasibility study to a full-feasibility study.
2 Introduction
2.1 Registrant for Whom the Technical Report was Prepared
This report was prepared as a pre-feasibility study level Technical Report Summary in accordance with the U.S. Securities and Exchange Commission (SEC) S-K regulations Title 17, Part 229, Items 601 and 1300 through 1305 for 5E Advanced Materials, Inc. and its subsidiary 5E Boron Americas, LLC. The report was prepared by Qualified Persons (QPs) from third-party independent companies Fluor Enterprises, Inc. (Fluor), Miocene, Inc. (Miocene), Escalante Geological Services, LLC (Escalante), and Geomega, Inc. (Geomega) and Company management.
2.2 Terms of Reference and Purpose of the Report
The quality of information, conclusions, and estimates contained herein is based on the following:
This Technical Report Summary is based on a Class 4 or FEL-2 pre-feasibility study level engineering. This report is intended for use by 5E Advanced Materials, Inc. and its subsidiary 5E Boron Americas, LLC, subject to the terms and conditions of its agreements with Escalante, Fluor, Geomega, and Miocene and relevant securities legislation. Escalante, Fluor, Geomega, and Miocene permit 5E to file this report as a Technical Report Summary with the SEC pursuant to the SEC S-K regulations, more specifically Title 17, Subpart 229.60, Item 601(b)(96) – Technical Report Summary and Title 17, Subpart 229.1300 – Disclosure by Registrants Engaged in Mining Operations. Except for the purposes specified under U.S. securities law, any other uses of this report by any third party are at that party’s sole risk. The responsibility for this disclosure remains with the Company.
The purpose of this Technical Report Summary is to report on mineral resources and reserves as well as inform parties with potential financial interests in 5E and the Project.
15
2.3 Sources of Information
This report is based in part on external consultants’ expertise and their technical reports, internal Company technical reports, previous technical reports, maps, published government reports, company letters and memoranda, and public information cited throughout this report and listed in Section 24.
Reliance upon information provided by the registrant is listed in Section 25, when applicable.
2.4 Details of Inspection
Escalante, Fluor, Geomega, and Miocene have visited the property, inspected core samples, reviewed relevant intellectual property and reports, and have extensive knowledge of the Project.
2.5 Report Version Update
The user of this document should ensure that this is the most recent Technical Report Summary for the property. This Technical Report Summary is an update of a previously filed Technical Report Summary filed pursuant to 17 CFR §§ 229.1300 through 229.1305 subpart 229.1300 of Regulation S-K. The previously filed Technical Report Summary has a report date of August 7, 2025, and an effective date of August 4, 2025.
2.6 Units of Measure
The U.S. System for weights and units has been used throughout this report. Tons are reported in short tons of 2,000 pounds (lbs), drilling and resource model dimensions and map scales are in feet (ft). When included, metric tons are referred to as tonnes or mt. All currency is in U.S. dollars ($ or US$) unless otherwise stated.
2.7 Mineral Resource and Mineral Reserve Definition
The terms “mineral resource” and “mineral reserves” as used in this Technical Report Summary have the following definitions below.
2.7.1 Mineral Resources
17 CFR § 229.1300 defines a “mineral resource” as a concentration or occurrence of material of economic interest in or on the Earth’s crust in such form, grade or quality, and quantity that there are reasonable prospects for economic extraction. A mineral resource is a reasonable estimate of mineralization, taking into account relevant factors such as cut-off grade, likely mining dimensions, location or continuity, that, with the assumed and justifiable technical and economic conditions, is likely to, in whole or in part, become economically extractable. It is not merely an inventory of all mineralization drilled or sampled.
A “measured mineral resource” is that part of a mineral resource for which quantity and grade or quality are estimated on the basis of conclusive geological evidence and sampling. The level of geological certainty associated with a measured mineral resource is sufficient to allow a qualified person to apply modifying factors, as defined in this section, in sufficient detail to support detailed mine planning and final evaluation of the economic viability of the deposit. Because a measured mineral resource has a higher level of confidence than the level of confidence of either an indicated mineral resource or an inferred mineral resource, a measured mineral resource may be converted to a proven mineral reserve or to a probable mineral reserve.
An “indicated mineral resource” is that part of a mineral resource for which quantity and grade or quality are estimated on the basis of adequate geological evidence and sampling. The level of geological certainty associated with an indicated mineral resource is sufficient to allow a qualified person to apply modifying factors in sufficient detail to support mine planning and evaluation of the economic viability of the deposit. Because an indicated mineral resource has a lower level of confidence than the level of confidence of a measured mineral resource, an indicated mineral resource may only be converted to a probable mineral reserve.
16
An “inferred mineral resource” is that part of a mineral resource for which quantity and grade or quality are estimated on the basis of limited geological evidence and sampling. The level of geological uncertainty associated with an inferred mineral resource is too high to apply relevant technical and economic factors likely to influence the prospects of economic extraction in a manner useful for evaluation of economic viability. Because an inferred mineral resource has the lowest level of geological confidence of all mineral resources, which prevents the application of the modifying factors in a manner useful for evaluation of economic viability, an inferred mineral resource may not be considered when assessing the economic viability of a mining project, and may not be converted to a mineral reserve.
2.7.2 Mineral Reserves
17 CFR § 229.1300 defines a “mineral reserve” as an estimate of tonnage and grade or quality of indicated and measured mineral resources that, in the opinion of the qualified person, can be the basis of an economically viable project. More specifically, it is the economically mineable part of a measured or indicated mineral resource, which includes diluting materials and allowances for losses that may occur when the material is mined or extracted. A “proven mineral reserve” is the economically mineable part of a measured mineral resource and can only result from conversion of a measured mineral resource. A “probable mineral reserve” is the economically mineable part of an indicated and, in some cases, a measured mineral resource.
2.8 Qualified Persons
This report was compiled by 5E and its management, with contributions from Escalante Geological Services, LLC, Fluor Enterprises, Inc., Geomega, Inc., and Miocene, Inc. The QP’s, Escalante, Fluor, Geomega, and Miocene, are third-party firms comprising mining experts in accordance with 17 CFR § 229.1302(b)(1). 5E has determined that the third-party firms and internal management listed as qualified persons meet the qualifications specified under the definition of a qualified person in 17 CFR § 229.1300.
Escalante Geological Services, LLC prepared the following sections of the report:
Sections 2, 3, 4, 5, 6, 7 (excluding 7.3), 8, 9, 11, 15, 17, 20, 21, 22
Fluor Enterprises, Inc. prepared the following sections of the report:
Sections 10, 14, 18 (specifically Sections 18.1.1 through 18.1.4, 18.1.9 and 18.2, which are specific to operating and capital expenditures, excluding wellfield) and contributed to sections 22, 23, and 24
Geomega, Inc. prepared the following sections of the report:
Sections 7.3
Miocene, Inc. prepared the following sections of the report:
Sections 12, 13, 18 (specifically Sections 18.1.5 through 18.1.8, which are specific to wellfield capital expenditures)
The following members of 5E management prepared the following sections of the report:
Sections 1, 16, 19, 23, 24, 25
Section 16 Market Studies and Contracts was prepared by 5E. The company engaged Kline and Company, Inc. (Kline) to perform a preliminary market study and pricing forecast for boric acid, calcium chloride and gypsum. Forward pricing forecasts obtained from Kline were utilized as part of the financial model outlined in Section 19, Economic Analysis. Kline was not engaged as a qualified person; however, 5E has obtained permission to refer to the preliminary market study they have provided and cite accordingly.
17
3 Property Description and Location
3.1 Property Location
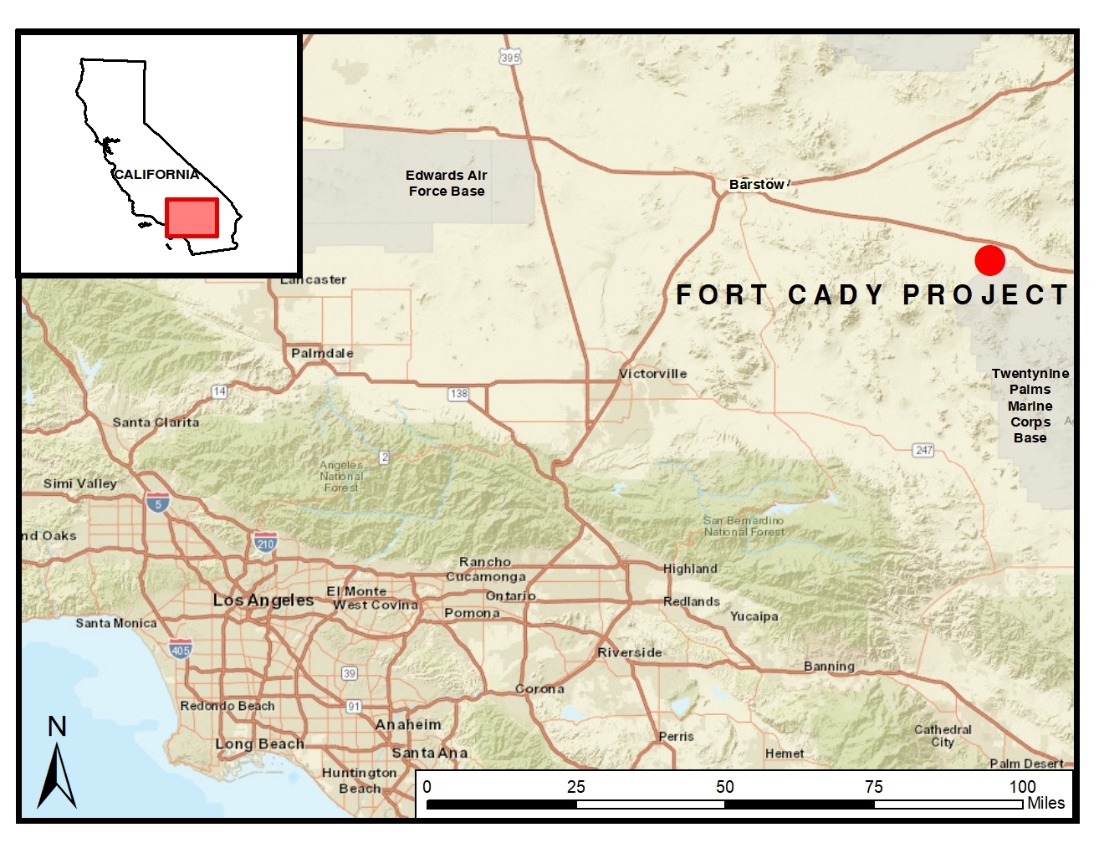
The Project is located in the Mojave Desert region in the high desert of San Bernardino County, California. Figure 3.1 outlines a map where the Project lies, which is approximately 118 mi northeast of Los Angeles, approximately 36 mi east-southeast of Barstow and approximately 17 mi east of Newberry Springs. The approximate center of the project area is N34°45’25.20”, W116°25’02.02”. The Project is in a similar geological setting as Rio Tinto’s U.S. Borax, Inc. operations in Boron, California, and Searles Valley Minerals operations in Trona, California, situated approximately 75 mi west-northwest and 90 mi northwest of the Project, respectively.
Figure 3.1: General location map
18
3.2 Area of Property
Figure 3.2 shows the 5E property and adjacent properties.
Figure 3.2: Property ownership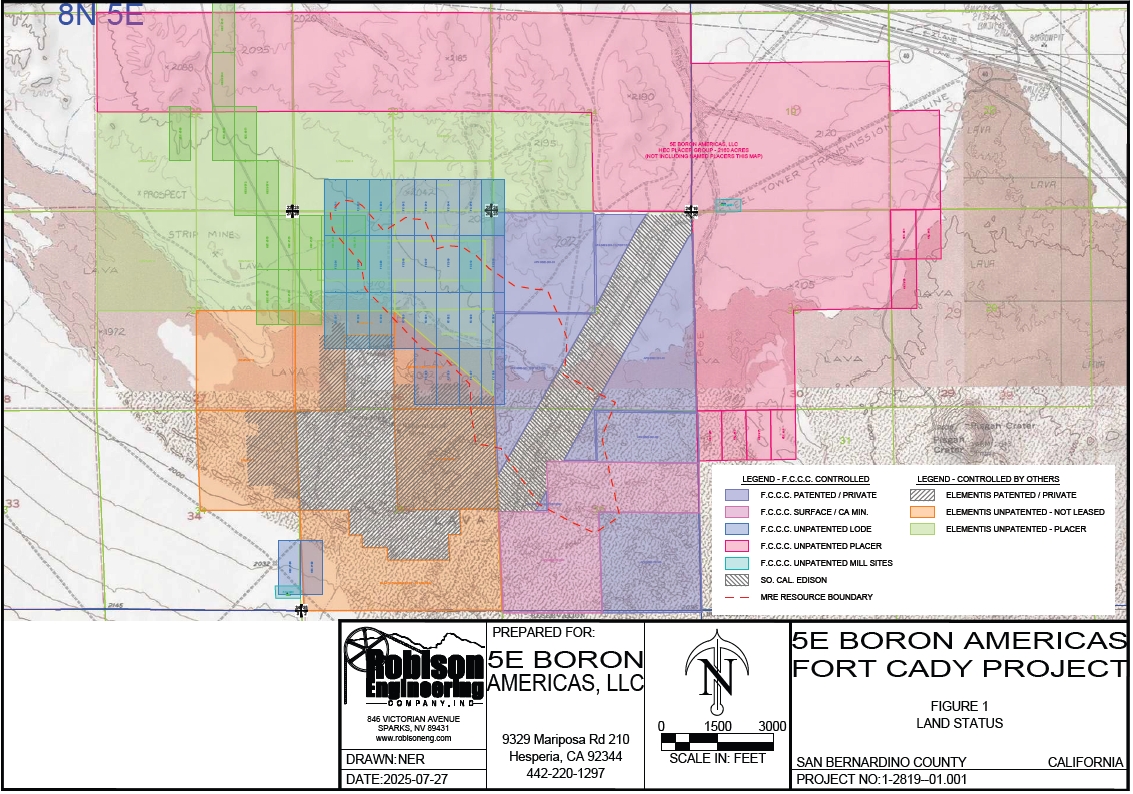
3.3 Mineral Title
5E owns simple fee (private) lands in Sections 25 and 36, of Township 8 North, Range 5 East of the San Bernardino Principal Meridian. An electrical transmission corridor, operated by SCE, tracts from the northeast to the southwest through the fee lands with SCE having surface and subsurface control to a depth of 500 ft, affecting approximately 91 acres of surface lands in the two sections. While this limits surface access to the land, mineralization remains accessible as the ore body occurs at depths greater than 1,000 ft (~ 300 m.)
5E currently holds 30 unpatented lode claims, 117 unpatented placer claims, and two (2) unpatented millsite claims with the BLM. Two lode claims were originally filed by Duval Corporation in 1978 with the 28 other lode claims filed by the Company in January 2025 (11 lode claims) and August 2025 (17 lode claims). Subsequently, in February 2026, we revised certain of the claims to perfect recording in San Bernardino County, California. Placer claims were filed between October 29, 2016, and February 24, 2017. A review of the BLM Mineral & Land Record System (MLRS) database shows claim status as filed with the next assessment fees due annually on September 1, 2027.
Lastly, in Section 36, Township 8 North, Range 5 East, 272 acres of land in Section 36 are split estate, with the surface estate owned by 5E and the mineral estate is owned by the State of California. These lands are available to 5E through a mineral lease from the California State Lands Commission. The remaining lands are owned by 5E, with the minerals underlying the transmission line available subsurface. Table 3.1 summarizes the mineral holdings held by 5E.
19
Table 3.1: 5E mineral holdings
|
|
Land Title Type |
Land Titles |
Private (Patented Property with surface and mineral rights in Fee Simple Title owned by 5E) |
Parcels: 05-29-251-01; 05-29-251-03; 05-29-251-05; 05-29-251-12; 05-29-251-13 |
Private (Patented Property with surface rights in Fee Simple Title owned by 5E; Mineral rights owned by State of California) |
Parcel: 05-29-251-04 |
Unpatented Lode Mining Claims Recorded and Located by 5E |
HEC #182, HEC #184, FC 001, FC 002, FC 003, FC 004, FC 005, FC 006, FC 007, FC 008, FC 009, FC 010, FC 011, FC 012, FC 013, FC 014, FC 015, FC 016, FC 017, FC 018, FC 019, FC 020, FC 021, FC 022, FC 023, FC 024, FC 025, FC 026, FC 027, FC 028 |
Unpatented Millsite Claims |
FCM 001, FCM 002 |
Unpatented Placer Mining Claims |
HEC #19, HEC #21, HEC #23, HEC #25, HEC #34 thru HEC #41; HEC #43 thru HEC #67, HEC #70 thru HEC #82; HEC#85 thru HEC #93; HEC #288, HEC #290, HEC #292, HEC #294, HEC #296, HEC #297, HEC #299 thru HEC #350 |
3.4 Mineral Rights
5E holds the rights to the mineral estate underlying Sections 25 and 36, except for the portion of the mineral estate held by the State of California in Section 36.
3.5 Incumbrances
5E maintains financial assurance bonds for reclamation and closure for current and planned operations. Additional information on reclamation and closure liabilities is included in Section 17. The amount of bonds and certificate of deposits posted with the applicable agency are present in Table 3.2.
Table 3.2: Current financial assurance obligations
|
|
|
|
Regulatory Authority |
Regulatory Obligation |
Instrument |
Instrument US$ |
United States Environmental Protection Agency |
Groundwater restoration |
Bond EACX173000037 |
$1,200,000 |
County of Sen Bernardino |
Reclamation and Closure |
Bond SPA151286 001 |
$799,994 |
County of San Bernardino |
Reclamation and Closure |
Certificate of deposits |
$61,604 |
3.5.1 Remediation Liabilities
5E submitted a Final Reclamation and Closure Plan to the Lahontan Regional Water Quality Control Board (LRWQCB) for closure of ponds constructed on the property in the 1980’s, and the ponds have been closed. The closure of the ponds and the 1988 WDRs is awaiting final sign-off from the LRWQCB. The bonding for closure of these ponds is included in the surety bond with San Bernardino County.
3.6 Other Significant Risk Factors
The mineral resource estimate (Section 11) includes BLM-managed public lands on which 5E has located unpatented mining claims in accordance with the Mining Law of 1872. Elementis Specialties, Inc. has filed a lawsuit in the US District Court, Central District of California, challenging the validity of 5E’s lode claims. Elementis operates a mine adjacent to 5E’s Fort Cady Project and alleges that 5E was unable to locate its lode claims because Elementis had already located placer claims on the subject public lands. Lode claims and placer claims are used to locate different types of mineralization, and one form of claim cannot be used as a substitute for the other. 5E believes the mineralization that it has claimed with its lode claims is lode-style mineralization, not placer mineralization.
20
An exploration program to expand the resource is possible in Section 36 on the southeastern portion of the property; however, this would require a mineral lease to be filed and executed with the California State Lands Commission for the State of California held mineral estate.
3.7 Royalties
There are no royalties associated with privately and publicly held lands in Section 25 and 36.
4 Accessibility, Climate, Local Resources, Infrastructure, and Physiography
4.1 Topography, Elevation, and Vegetation
The Project area is located on a gentle pediment with elevations ranging from approximately 1,970 ft above mean sea level (amsl) to approximately 2,185 ft amsl. Basalt lava flows cover most of the higher elevations or hilltops with flat ground and drainages covered in pale, gray-brown, silty soils. Basalt lava flows become more dominant south of the Project area with the Lava Bed Mountains located a few miles south of the Project area. The Project area’s vegetation is dominated by burro weed, creosote, cactus, and scattered grasses.
4.2 Accessibility and Transportation to the Property
Access to the Project is via U.S. Interstate 40 (I-40), eastbound from Barstow to the Hector Road exit. From the exit, travel south to Route 66, then east approximately 1 mile to County Road 20796 (CR20796). Travel south on CR20796 for 2.2 mi to the unnamed dirt access road bearing east for another 1.1 mi to the Project.
The BNSF Railroad main line from Chicago to Los Angeles runs parallel to I-40. A BNSF rail loadout is in Newberry Springs. There are potential options to develop rail access closer to the Project.
San Bernardino County operates six general aviation airports with the closest airport to the Project being the Barstow-Daggett Airport located approximately 23 mi west of the Project off Route 66. Commercial flight service is available through five airports in the greater Los Angeles area and in Las Vegas, Nevada. A dedicated cargo service airport is located approximately 65 mi southwest of the Project.
4.3 Climate and Length of Operating Season
The Project is accessible year-round, located in the western Mojave Desert with arid, hot, dry, and sunny summers of low humidity and temperate winters. Based upon climate data from the nearby town of Newberry Springs, the climate over the past 30 years indicates average monthly high temperatures ranging from 55°F in December to 98.2°F in July. Monthly low temperatures range from 40.1°F in December to 74.3°F in August. Extremes range from a record low of 7°F to a record high of 117°F. Maximum temperatures in summer frequently exceed 100°F while cold spells in winter with temperatures below 20°F may occur but seldom last for more than a few days. Average rainfall is generally less than 10 inches per year with most precipitation occurring in the winter and spring.
4.4 Infrastructure Availability and Sources
5E continues to develop operating infrastructure for the Project in support of extraction and processing activities. A manned gate is located on the Project access road and provides required site-specific safety briefings and monitors personnel entry and exit to the site. Personnel are predominantly sourced from the surrounding area including Barstow, California, and Victorville, California.
The BNSF Railroad main line from Las Vegas, Nevada to Los Angeles, California runs parallel to I-40. A rail loadout is located approximately 1.2 mi north of the National Trails Highway on a road that bears north and located 0.4 mi west of CR20796.
The construction of the small-scale facility was performed by a construction contractor with additional local resources supporting construction contracting, construction materials, energy sources, employees, and housing. The Project has
21
good access to I-40 which connects it to numerous sizable communities between Barstow, California and the greater Los Angeles area offering excellent access to transportation, construction materials, labor, and housing. The Project currently has limited electrical service (approximately 1 megawatt) that is sufficient for mine office, storage facilities on site, and provides a good portion of the power for the small-scale facility. The small-scale facility operates on shore power and liquid natural gas and 5E is currently exploring options for upgrading electrical services to the Project. An electrical transmission corridor operated by SCE extends northeastward through the eastern part of the Project. The Project has two water wells located nearby to support in-situ leaching operations where unpatented millsite claims are filed. Currently there is no natural gas connected to the Project, but 5E has a proposal from Kinder Morgan to connect to the Mojave Pipeline. Two other natural gas transmission lines run along Interstate 40 near the Project.
The plant site currently has a 2,000 ft2 control room and office building, a 1,000 ft2 administrative building, storage buildings, warehouse, an analytical laboratory, an approximately 20-acre production facility called the small-scale facility, and an intended gypsum storage area occupying 17 acres. Gypsum is a byproduct of past pilot plant production and is intended to be a future byproduct that can be sold to the regional market.
5 History
Discovery of the Project borate deposit occurred in 1964 when Congdon and Carey Minerals Exploration Company found several zones of colemanite, a calcium borate mineral, between the depths of 1,330 ft to 1,570 ft (405 m to 487 m) below ground surface (bgs) in Section 26, Township 8 North, Range 5 East (Simon Hydro-Search, 1993).
5.1 Prior Ownership and Ownership Changes
In September 1977, Duval initiated land acquisition and exploration activities near Hector, California. By March 1981, Duval had completed 34 exploration holes (DHB holes), plus one (1) potential water well. After evaluation of the exploration holes, Duval considered several mining methods. Subsequent studies and tests performed by Duval indicated that in-situ mining technology was feasible. Duval commenced limited testing and pilot-scale solution mining operations in June 1981 per the Mining and Land Reclamation Plan, Fort Cady Project, 2019.
Mountain States Mineral Enterprises, Inc. (MSME) purchased the project from Duval in 1985 and, in 1986, conducted an additional series of tests. MSME eventually sold the project to Fort Cady Mineral Corporation in 1989. FCMC began the permitting process, which resulted in a 1994 ROD from the BLM and approval from San Bernardino County, the California lead agency.
5.2 Exploration and Development Results of Previous Owners
Duval commenced limited-scale solution mining tests in June 1981. Between 1981 and 2001, subsequent owners drilled an additional 17 wells, which were used for a series of injection testing and pilot-scale operations. In July 1986, tests were conducted by MSME, where dilute hydrochloric acid solution was injected into the ore body. The acid dissolved the colemanite and was then withdrawn from the same well.
The first phase of pilot plant operations was conducted between 1987 and 1988. Approximately 550 tons (500 tonnes) of boric acid were produced. The test results were positive; thus, the Project was viewed as commercially viable. In preparation for the permitting process, feasibility studies, detailed engineering and test works were completed with FCMC receiving the required permits for a commercial-scale operation. Final state and local approvals for commercial-scale solution mining and processing were attained in 1994.
A second phase of pilot plant operations occurred between 1996 and 2001, during which approximately 2,200 tons of a synthetic colemanite product, marketed as CadyCal 100, were produced. Commercial-scale operations were not commissioned due to low product prices and other priorities of the controlling entity. For many years, boron was used in traditional applications such as cleaning supplies and ceramics, which never formulated in a strong pull-side demand investment thesis where pricing justified further development of the Project. However, a group of Australian investors,
22
through extensive due diligence identified green shoots that the market dynamics were fundamentally beginning to change.
5.3 American Pacific Borates Share Exchange of Atlas Precious Metals
In 2017, a group of Australian investors identified the Project and formed the investment thesis that the boron market had similar dynamics to the lithium market a decade earlier. Like the lithium market ten years prior, the market was dominated by a few companies with a compelling pull-side demand growth story fueled by future-facing applications targeting decarbonization and critical materials. Prior to lithium-ion batteries and electric vehicles, lithium was used in traditional everyday applications like boron’s use in recent years. As a result of the investment thesis that boron is expected to experience a supply deficit relative to demand, the group of Australian investors formed American Pacific Borates and Lithium Ltd (APBL) and issued shares to Atlas Precious Metals in exchange for the Fort Cady (California) Corporation, the entity holding the permits, mineral and property rights of the Project. In 2017, APBL underwent an initial public offering on the Australian Stock Exchange and progressed exploration and development of the Project. In September 2021, APBL created a subsidiary, 5E, through a corporate reorganization which placed 5E at the top of the corporate structure. Upon 5E becoming the parent company of the organization, in March 2022 5E direct listed on Nasdaq and became an SEC issuer. Shortly before becoming an SEC issuer, 5E Boron Americas, LLC was designated as Critical Infrastructure by the Department of Homeland Security Cybersecurity and Infrastructure Security Agency.
5.4 Historic Production
Limited historic production data, provided to 5E by previous operators, is summarized in Table 5.1 through Table 5.4. Little other information is available for these tests; the results could not be independently verified.
Table 5.1: Duval testing results
|
|
|
|
|
|
|
|
|
|
Test |
|
Volume |
Injection Rate |
Pump Pressure |
Acid |
Volume |
Recovery Rate |
Average Concentration |
Maximum Concentration |
1 |
|
680 |
1.5 |
150 |
16% HCl |
700 |
1.0–2.0 |
0.3 |
|
|
|
1,500 |
2 |
275 |
5% H₂SO₄ |
1,500 |
1.0–2.0 |
0.5 |
1.5 |
|
|
1,400 |
1.5–2.0 |
150 |
5% H₂SO₄ |
2,000 |
1.0–2.0 |
1.5 |
4.6 |
|
|
1,500 |
2 |
275 |
23% H₂SO₄ |
1,500 |
1.0–2.0 |
1.0 |
4.0 |
2 |
|
2,250 |
2 |
300 |
8% H₂SO₄ |
2,000 |
1.5–2.0 |
1.5 |
4.0 |
3 |
|
5,358 |
2–2.5 |
275 |
6.9% H₂SO₄ |
28,927 |
1.0–1.5 |
3.0 |
6.9 |
|
|
6,597 |
2–2.5 |
275 |
17.5% HCl |
|
|
3.0 |
6.9 |
4 |
|
19,311 |
2–2.5 |
230–275 |
6.2% HCl & |
67,995 |
1.0–1.5 |
3.0 |
6.5 |
5 |
|
20,615 |
2 |
290 |
16% HCl |
112,637 |
1.0–1.5 |
2.5 |
5.2 |
6 |
|
21,569 |
20 |
275 |
1.6% HCl |
63,460 |
1.0–1.5 |
1.1 |
1.7 |
Table 5.2: Mountain States testing injection summary
|
|
|
|
|
|
|
|
|
|
|
|
|
|
|
|
|
|
|
Date |
|
|
|
|
|
Gallons |
|
Pounds |
|
Theoretical H₃BO₃ |
||||
Series |
|
From |
To |
|
Test Nos. |
|
Wells SMT |
|
Series |
∑ |
|
HCl |
CO₂ |
|
Series |
∑ |
1 |
|
8/4/1986 |
8/23/1986 |
|
1-3 |
|
6 & 9 |
|
67,972 |
67,972 |
|
23,286 |
— |
|
59,540 |
59,540 |
2 |
|
11/4/1986 |
11/10/1986 |
|
4-7 |
|
6 |
|
45,489 |
113,461 |
|
15,500 |
— |
|
39,431 |
98,971 |
3 |
|
12/9/1986 |
12/18/1986 |
|
8-11 |
|
6 |
|
53,023 |
166,484 |
|
15,398 |
— |
|
39,173 |
138,144 |
4 |
|
6/18/1986 |
6/27/1987 |
|
12-15 |
|
9 |
|
47,640 |
214,124 |
|
— |
4,313 |
|
18,184 |
156,328 |
Total |
|
|
|
|
|
|
|
|
214,124 |
214,124 |
|
54,184 |
4,313 |
|
156,328 |
156,328 |
23
Table 5.3: Mountain States testing recovery summary
|
|
|
|
|
|
|
|
|
|
|
|
|
|
|
|
|
|
|
|
|
|
|
Date |
|
Test Nos. |
|
Wells SMT |
|
Gallons |
|
Pounds BA |
|
% BA in Solution, |
|
Theoretical BA |
||||||
Series |
|
From |
To |
|
|
|
Series |
∑ |
|
Series |
∑ |
|
High |
End |
Avg |
|
Series |
∑ |
||
1 |
|
8/7/1986 |
10/17/1986 |
|
1-3 |
|
6 & 9 |
|
128,438 |
128,438 |
|
32,608 |
32,608 |
|
3.84 |
1.56 |
2.50 |
|
54.77 |
54.77 |
2 |
|
11/5/1986 |
11/13/1986 |
|
4-7 |
|
6 |
|
51,636 |
180,074 |
|
21,223 |
53,831 |
|
5.74 |
4.05 |
4.68 |
|
53.83 |
54.39 |
3 |
|
12/10/1986 |
1/13/1987 |
|
8-11 |
|
6 |
|
99,889 |
279,963 |
|
33,386 |
87,217 |
|
5.59 |
1.93 |
4.18 |
|
85.23 |
63.14 |
4 |
|
6/9/1987 |
7/0/1987 |
|
12-15 |
|
9 |
|
86,595 |
366,558 |
|
18,973 |
106,190 |
|
3.55 |
1.81 |
2.60 |
|
104.34 |
67.93 |
Total |
|
|
|
|
|
|
|
|
366,558 |
366,558 |
|
106,190 |
106,190 |
|
|
|
3.79 |
|
|
67.93 |
In 2017, 5E completed an exploration drilling program to validate previous exploration efforts and expand mineral resources. Post drilling, an Australasian Code for Reporting of Exploration Results, Mineral Resources and Ore Reserves (JORC) mineral resource estimate was prepared by Terra Modelling Services (TMS). TMS updated the JORC mineral resource estimate in December 2018. The 2018 JORC mineral resource estimate identified 4.63 million tonnes of measured resource, 2.24 million tonnes of indicated resource, and 7.07 million tonnes of inferred resource using a B2O3 cut-off grade of 5%.
In October 2021, 5E issued an Initial Assessment Report (the Initial Assessment Report) on the Fort Cady Borate Project reporting a measured plus indicated resource estimate of 97.55 million tons (Mt) grading at 6.53% B2O3 and 324 parts per million (ppm) lithium using a 5.0% B2O3 cut-off grade. The Initial Assessment also identified 11.43 Mt of in Inferred resource grading at 6.40% B2O3 and 324 ppm Li. The Initial Assessment was subsequently updated in February 2022 with no changes to the resource estimate.
In October 2023, 5E updated and issued the Initial Assessment Report, dated October 2023, on the Project. The October 2023 Initial Assessment Report provided an updated estimate of 74.31 Mt of measured plus indicated resources grading at 4.15 B2O3 and 356 ppm Li using a 2.0% B2O3 cut-off grade, following a change in mineral tenure and improvements in processing. An inferred resource of 96.9 Mt grading at 4.75% B2O3 and 321 ppm LI was also identified in the estimate.
Table 5.4: Fort Cady Mineral Corporation production summary
|
|
|
|
|
|
|
|
|
|
|
|
|
|
|
|
|
|
|
|
|
|
|
|
|
|
Flow to Plant |
|
|
|
|
|
|
|
|
|
|
|
|
|
|
|
|
|
Date |
|
Total |
|
Gallons |
Gal/min |
|
pH |
|
Free Acid |
|
Boric |
|
Chloride |
|
Sulfate |
|
Boric |
|
B₂O₃ |
|
CadyCal |
Jan-01 |
|
7,215 |
|
258,556 |
35.8 |
|
5.83 |
|
|
|
2.33 |
|
12.54 |
|
3.76 |
|
15 |
|
9 |
|
20 |
Feb-01 |
|
7,785 |
|
331,886 |
42.6 |
|
2.54 |
|
0.35 |
|
2.36 |
|
12.13 |
|
4.94 |
|
25 |
|
14 |
|
33 |
Mar-01 |
|
10,470 |
|
422,922 |
40.4 |
|
2.41 |
|
0.23 |
|
1.90 |
|
15.84 |
|
3.23 |
|
34 |
|
19 |
|
45 |
Apr-01 |
|
10,290 |
|
393,824 |
38.3 |
|
1.86 |
|
2.60 |
|
5.43 |
|
42.11 |
|
8.18 |
|
41 |
|
23 |
|
53 |
May-01 |
|
7,560 |
|
296,000 |
39.2 |
|
2.02 |
|
2.67 |
|
5.77 |
|
44.77 |
|
8.70 |
|
31 |
|
17 |
|
40 |
Jun-01 |
|
3,375 |
|
120,928 |
35.8 |
|
0.67 |
|
1.35 |
|
3.12 |
|
27.84 |
|
5.30 |
|
12 |
|
7 |
|
16 |
Jul-01 |
|
2,385 |
|
77,157 |
32.4 |
|
1.19 |
|
0.31 |
|
2.00 |
|
12.74 |
|
2.60 |
|
7 |
|
4 |
|
9 |
Aug-01 |
|
3,300 |
|
142,207 |
43.1 |
|
4.04 |
|
0.07 |
|
3.84 |
|
19.60 |
|
3.08 |
|
15 |
|
8 |
|
19 |
Sep-01 |
|
4,875 |
|
247,901 |
50.9 |
|
2.77 |
|
0.12 |
|
3.44 |
|
23.21 |
|
3.68 |
|
21 |
|
12 |
|
28 |
Oct-01 |
|
10,035 |
|
478,723 |
47.7 |
|
2.03 |
|
0.35 |
|
3.00 |
|
15.54 |
|
4.60 |
|
37 |
|
1 |
|
49 |
Nov-01 |
|
9,270 |
|
371,171 |
40.0 |
|
1.99 |
|
0.16 |
|
2.39 |
|
14.15 |
|
4.02 |
|
23 |
|
13 |
|
30 |
Dec-01 |
|
12,525 |
|
353,885 |
28.3 |
|
1.83 |
|
0.17 |
|
2.52 |
|
14.94 |
|
2.58 |
|
29 |
|
16 |
|
38 |
01-Total |
|
89,085 |
|
3,495,160 |
39.2 |
|
2.44 |
|
0.73 |
|
3.19 |
|
21.37 |
|
4.74 |
|
291 |
|
164 |
|
381 |
00-Total |
|
87,255 |
|
3,142,413 |
36.0 |
|
2.14 |
|
0.25 |
|
2.70 |
|
12.42 |
|
2.54 |
|
279 |
|
157 |
|
366 |
99-Total |
|
92,820 |
|
2,475,770 |
26.7 |
|
1.59 |
|
0.48 |
|
2.82 |
|
10.13 |
|
6.84 |
|
201 |
|
113 |
|
263 |
98-Total |
|
111,468 |
|
2,715,319 |
24.4 |
|
1.24 |
|
0.91 |
|
2.85 |
|
7.78 |
|
10.19 |
|
217 |
|
122 |
|
284 |
97-Total |
|
109,040 |
|
2,692,940 |
24.7 |
|
0.99 |
|
1.84 |
|
3.10 |
|
3.52 |
|
13.00 |
|
252 |
|
142 |
|
329 |
96-Total |
|
101,212 |
|
2,711,044 |
26.8 |
|
1.33 |
|
1.32 |
|
3.01 |
|
2.96 |
|
5.76 |
|
244 |
|
137 |
|
319 |
24
In January 2024, the Company began injection after receiving approval from the EPA to commence mining in November 2023. In April 2024, the Company began operating its small-scale facility and producing borates. Table 5.5 summarizes 5E’s injection – recovery summary per cycle for IR-1, IR-2, and IR-3 while and table 5.6 summarizes 5E’s injection – recovery summary per cycle for IR-4.
Table 5.5: 5E injection – recovery summary per cycle (IR-1, IR-2, and IR-3)
|
|
|
|
|
|
|
|
|
Complete |
Injection |
Volume Injected |
Injection Rate |
Pump Pressure |
Recovery |
Volume Recovered |
Recovery Rate |
Average |
1 |
IR-3 |
5,206.99 |
14.89 |
63.28 |
|
|
|
|
2 |
IR-1 |
9,230.59 |
11.45 |
24.13 |
IR-3 |
732.70 |
9.27 |
2.20 |
3 |
IR-2 |
4,443.94 |
14.86 |
116.50 |
IR-2 |
2,893.28 |
1.82 |
2.29 |
4 |
IR-1 |
18,369.41 |
27.61 |
121.20 |
|
|
|
|
5 |
IR-2 |
3,571.00 |
15.96 |
67.31 |
IR-1 |
2,407.62 |
3.06 |
0.62 |
|
|
|
|
|
IR-3 |
1,191.32 |
1.34 |
1.11 |
6 |
IR-1 |
13,745.17 |
18.14 |
67.64 |
IR-2 |
2,329.89 |
2.25 |
3.07 |
7 |
IR-3 |
26,375.01 |
39.82 |
42.61 |
IR-1 |
8,346.20 |
17.27 |
2.11 |
|
|
|
|
|
IR-2 |
12,717.00 |
34.55 |
1.96 |
|
|
|
|
|
IR-3 |
3,247.43 |
14.60 |
1.60 |
8 |
IR-2 |
2,357.90 |
15.40 |
64.06 |
IR-1 |
707.36 |
4.62 |
0.99 |
|
|
|
|
|
IR-2 |
|
|
|
|
|
|
|
|
IR-3 |
1,414.70 |
9.24 |
0.55 |
9 |
IR-1 |
779.53 |
23.01 |
58.10 |
IR-1 |
472.02 |
13.37 |
0.79 |
|
|
|
|
|
IR-2 |
461.27 |
7.68 |
0.25 |
|
|
|
|
|
IR-3 |
464.61 |
7.74 |
0.55 |
10 |
IR-2 |
3,516.00 |
11.91 |
115.16 |
IR-1 |
2,109.60 |
7.15 |
0.82 |
|
|
|
|
|
IR-3 |
1,054.80 |
3.57 |
0.55 |
11 |
IR-1 |
11,620.79 |
20.08 |
25.47 |
IR-1 |
|
|
|
|
|
|
|
|
IR-2 |
3,673.40 |
7.91 |
2.09 |
|
|
|
|
|
IR-3 |
5,592.49 |
13.09 |
1.48 |
12 |
IR-2 |
11,047.68 |
2.62 |
80.31 |
IR-2 |
19,149.02 |
6.65 |
4.53 |
|
IR-3 |
16,450.00 |
21.08 |
140.30 |
IR-1 |
29,127.24 |
6.74 |
5.64 |
|
IR-1 |
12,410.20 |
19.57 |
122.25 |
IR-3 |
16,107.29 |
7.45 |
4.24 |
|
IR-3 |
1,815.00 |
12.35 |
103.00 |
|
|
|
|
|
IR-2 |
333.00 |
5.55 |
111.00 |
|
|
|
|
|
IR-1 |
5,209.97 |
43.40 |
28.59 |
|
|
|
|
13 |
IR-1 |
27,337.13 |
6.70 |
60.57 |
IR-1 |
40,537.49 |
9.38 |
5.29 |
|
IR-3 |
22,531.94 |
3.54 |
55.19 |
Combined with data above |
|||
14 |
IR-1 |
33,894.24 |
6.35 |
64.34 |
IR-1 |
31,620.99 |
5.92 |
5.18 |
15 |
IR-1 |
32,065.38 |
8.60 |
115.38 |
IR-3 |
2,127.05 |
3.94 |
5.55 |
16 |
IR-1 |
4,849.05 |
2.07 |
71.86 |
IR-1 |
41,348.82 |
17.67 |
6.13 |
|
IR-3 |
11,114.78 |
5.61 |
72.84 |
IR-2 |
17,567.34 |
9.76 |
4.06 |
17 |
IR-3 |
2,521.19 |
28.19 |
52.33 |
IR-1 |
10,071.44 |
4.94 |
5.67 |
|
IR-1 |
2,758.17 |
61.29 |
98.48 |
IR-3 |
15,981.97 |
7.83 |
4.92 |
|
|
|
|
|
IR-2 |
863.74 |
0.25 |
5.67 |
18 |
IR-1 |
11,052.45 |
3.76 |
70.81 |
IR-1 |
19,205.31 |
16.01 |
7.07 |
|
IR-3 |
18,854.36 |
3.74 |
69.45 |
IR-2 |
1,545.69 |
0.80 |
9.17 |
|
|
|
|
|
IR-3 |
6,324.87 |
3.40 |
6.63 |
25
|
|
|
|
|
|
|
|
|
Complete |
Injection |
Volume Injected |
Injection Rate |
Pump Pressure |
Recovery |
Volume Recovered |
Recovery Rate |
Average |
19 |
IR-1 |
4,905.86 |
7.43 |
73.67 |
IR-1 |
5,097.00 |
2.83 |
4.03 |
|
|
|
|
|
IR-2 |
13,070.53 |
7.26 |
4.68 |
|
|
|
|
|
IR-3 |
1,733.01 |
0.70 |
4.38 |
20 |
IR-1 |
5,249.52 |
5.15 |
40.20 |
|
|
|
|
|
IR-3 |
11,049.80 |
7.67 |
36.23 |
|
|
|
|
|
IR-1 |
4,078.35 |
6.47 |
70.07 |
|
|
|
|
|
IR-2 |
2,542.97 |
14.13 |
64.00 |
IR-1 |
655.19 |
0.91 |
4.12 |
|
IR-3 |
8,035.73 |
7.44 |
61.25 |
IR-2 |
6,197.07 |
4.68 |
4.13 |
|
IR-1 |
11,890.22 |
5.08 |
71.66 |
IR-3 |
5,450.06 |
4.54 |
5.19 |
21 |
IR-1 |
15,110.04 |
7.41 |
64.49 |
IR-1 |
23,296.09 |
3.23 |
7.43 |
|
IR-3 |
9,455.86 |
4.38 |
62.88 |
IR-2 |
17,009.05 |
2.36 |
7.65 |
|
IR-1 |
6,794.54 |
2.98 |
54.36 |
IR-3 |
4,835.47 |
0.67 |
8.21 |
22 |
IR-1 |
5,632.64 |
3.91 |
58.98 |
IR-1 |
986.47 |
0.46 |
8.32 |
|
IR-3 |
26,175.41 |
3.03 |
112.36 |
IR-2 |
10,971.17 |
5.08 |
7.53 |
|
|
|
|
|
IR-3 |
837.90 |
0.39 |
4.86 |
|
|
|
|
|
24 Hour Recovery Pause |
|||
|
|
|
|
|
IR-1 |
8,663.25 |
6.30 |
3.28 |
|
|
|
|
|
IR-2 |
8,831.20 |
4.54 |
3.26 |
|
|
|
|
|
IR-3 |
1,189.49 |
0.49 |
3.14 |
23 |
IR-1 |
20,111.84 |
16.76 |
51.24 |
IR-1 |
5,338.40 |
1.49 |
7.46 |
|
IR-3 |
1,305.83 |
21.76 |
41.98 |
IR-2 |
20,262.84 |
8.65 |
6.56 |
|
|
|
|
|
IR-3 |
3,839.77 |
4.92 |
4.15 |
24 |
IR-1 |
10,735.96 |
4.16 |
65.56 |
IR-1 |
433.72 |
7.22 |
2.12 |
|
IR-3 |
4,219.55 |
3.91 |
70.26 |
IR-2 |
6,726.29 |
10.19 |
2.79 |
|
IR-1 |
5,851.48 |
1.81 |
68.98 |
IR-3 |
433.72 |
7.22 |
3.29 |
|
IR-2 |
4,589.64 |
1.37 |
71.58 |
7 Day Recovery Pause |
|||
|
IR-3 |
10,217.39 |
2.94 |
72.65 |
IR-1 |
1,259.62 |
1.05 |
5.14 |
|
|
|
|
|
IR-2 |
12,583.30 |
13.12 |
6.23 |
|
|
|
|
|
IR-3 |
1,106.44 |
2.63 |
4.86 |
25 |
IR-1 |
6,657.38 |
2.71 |
60.05 |
IR-1 |
1,983.10 |
1.84 |
4.86 |
|
IR-3 |
8,684.07 |
16.08 |
71.24 |
IR-2 |
4,304.86 |
4.03 |
4.86 |
|
|
|
|
|
IR-3 |
16,086.25 |
9.15 |
6.06 |
26 |
IR-3 |
4,522.27 |
3.77 |
68.32 |
IR-3 |
33,720.96 |
4.68 |
6.27 |
27 |
IR-3 |
15,847.10 |
9.78 |
67.88 |
IR-2 |
12,072.07 |
8.05 |
5.08 |
|
|
|
|
|
IR-3 |
1,226.40 |
0.82 |
5.08 |
28 |
IR-1 |
7,303.31 |
3.38 |
54.68 |
IR-2 |
33,433.04 |
14.65 |
4.83 |
|
IR-3 |
7,795.03 |
3.61 |
68.44 |
|
|
|
|
29 |
IR-3 |
6,330.72 |
13.19 |
67.56 |
IR-3 |
25,288.41 |
17.56 |
5.49 |
|
IR-1 |
4,228.14 |
4.70 |
44.36 |
|
|
|
|
30 |
IR-3 |
1,773.14 |
1.06 |
94.60 |
IR-2 |
12,790.93 |
17.76 |
4.63 |
31 |
IR-1 |
24,119.86 |
23.65 |
114.25 |
IR-3 |
15,666.38 |
14.51 |
5.49 |
|
IR-3 |
13,818.41 |
12.79 |
77.86 |
IR-1 |
5,285.80 |
3.52 |
4.49 |
32 |
IR-3 |
8,717.51 |
8.07 |
61.45 |
IR-2 |
13,456.27 |
13.68 |
4.04 |
|
IR-1 |
11,354.01 |
10.51 |
101.36 |
Combined with data above |
|||
|
IR-3 |
2,979.31 |
8.28 |
99.25 |
Combined with data above |
|||
33 |
IR-3 |
9,673.93 |
4.48 |
78.59 |
IR-1 |
1,792.07 |
4.97 |
4.74 |
34 |
IR-1 |
4,181.65 |
3.87 |
85.69 |
IR-2 |
12,871.21 |
11.92 |
4.72 |
|
IR-3 |
8,053.74 |
8.95 |
114.23 |
IR-1 |
6,517.74 |
3.62 |
4.73 |
26
|
|
|
|
|
|
|
|
|
Complete |
Injection |
Volume Injected |
Injection Rate |
Pump Pressure |
Recovery |
Volume Recovered |
Recovery Rate |
Average |
Steam heated solution |
||||||||
35 |
IR-1 |
68,518.59 |
63.44 |
74.36 |
IR-3 |
68,518.59 |
63.44 |
5.65 |
36 |
IR-1 |
35,022.36 |
32.43 |
68.64 |
IR-2 |
35,022.36 |
32.43 |
5.62 |
37 |
IR-1 |
13,988.00 |
12.95 |
61.33 |
IR-2 |
2,648.00 |
7.35 |
5.92 |
|
|
|
|
|
IR-3 |
11,185.03 |
31.06 |
5.59 |
38 |
IR-1 |
6,021.82 |
5.58 |
57.68 |
IR-2 |
11,218.12 |
18.69 |
5.26 |
|
IR-3 |
1,590.00 |
6.63 |
67.24 |
IR-3 |
8,575.53 |
14.29 |
4.55 |
|
IR-1 |
19,710.28 |
18.25 |
70.25 |
IR-2 |
10,822.60 |
4.09 |
4.74 |
|
|
|
|
|
IR-3 |
9,168.02 |
3.47 |
3.70 |
39 |
IR-3 |
9,089.95 |
25.25 |
69.58 |
IR-2 |
24,947.90 |
11.67 |
4.28 |
|
IR-1 |
1,556.98 |
1.44 |
71.68 |
Combined with data above |
|||
|
IR-1 |
3,429.60 |
3.18 |
78.36 |
Combined with data above |
|||
40 |
IR-1 |
4,545.51 |
4.21 |
64.39 |
|
|
|
|
|
IR-1 |
25,433.09 |
23.55 |
61.48 |
IR-3 |
15,245.69 |
5.52 |
5.96 |
Total |
|
627,453.08 |
|
|
|
658,696.49 |
|
|
27
Table 5.6: 5E injection – recovery summary per cycle (IR-4)
|
|
|
|
|
|
|
|
|
Complete |
Injection |
Volume Injected |
Injection Rate |
Pump Pressure |
Recovery |
Volume Recovered |
Recovery Rate |
Average |
1 |
IR--4 |
3,496.01 |
21.29 |
115.56 |
IR-4 |
2,663.89 |
10.82 |
0.40 |
2 |
IR-4 |
5,395.21 |
3.93 |
124.26 |
IR-4 |
8,136.86 |
22.04 |
3.20 |
3 |
IR-4 |
2,537.92 |
3.60 |
102.73 |
IR-4 |
715.80 |
20.92 |
2.69 |
4 |
IR-4 |
11,527.29 |
15.52 |
112.38 |
IR-4 |
8,650.70 |
28.63 |
4.60 |
5 |
IR-4 |
16,474.89 |
12.61 |
73.75 |
IR-4 |
3,564.96 |
16.50 |
3.01 |
6 |
IR-4 |
7,400.40 |
6.59 |
120.55 |
IR-4 |
8,729.30 |
20.19 |
4.78 |
7 |
IR-4 |
7,853.70 |
9.26 |
119.92 |
IR-4 |
7,937.90 |
17.94 |
5.55 |
8 |
IR-4 |
8,878.00 |
10.87 |
93.00 |
IR-4 |
15,790.90 |
10.34 |
6.01 |
9 |
IR-4 |
8,700.30 |
6.44 |
69.12 |
IR-4 |
12,922.89 |
6.05 |
5.90 |
10 |
IR-4 |
9,641.00 |
9.45 |
128.79 |
IR-4 |
21,252.32 |
6.78 |
5.39 |
11 |
IR-4 |
10,983.36 |
7.32 |
137.15 |
IR-4 |
28,551.44 |
15.17 |
4.74 |
12 |
IR-4 |
13,529.92 |
5.78 |
138.88 |
IR-4 |
14,205.00 |
11.80 |
4.81 |
13 |
IR-4 |
13,600.29 |
5.15 |
117.73 |
IR-4 |
15,109.93 |
9.33 |
4.88 |
14 |
IR-4 |
6,446.20 |
8.77 |
82.06 |
IR-4 |
20,930.95 |
7.75 |
4.90 |
15 |
IR-4 |
17,513.86 |
14.71 |
119.40 |
IR-4 |
18,259.44 |
6.34 |
5.51 |
16 |
IR-4 |
26,883.73 |
17.52 |
128.26 |
IR-4 |
13,426.25 |
9.32 |
5.30 |
17 |
IR-4 |
47,761.87 |
40.14 |
70.04 |
IR-4 |
12,123.06 |
50.51 |
3.20 |
18 |
IR-4 |
12,993.61 |
4.93 |
34.88 |
IR-4 |
33,627.47 |
7.57 |
6.13 |
19 |
IR-4 |
58,515.05 |
5.29 |
89.10 |
IR-4 |
7,731.22 |
1.30 |
5.05 |
20 |
IR-4 |
10,528.19 |
5.70 |
55.69 |
IR-4 |
10,844.75 |
4.11 |
7.35 |
21 |
IR-4 |
7,715.22 |
16.92 |
126.53 |
IR-4 |
8,752.76 |
12.16 |
3.97 |
22 |
IR-4 |
1,077.09 |
17.95 |
41.90 |
IR-4 |
17,930.93 |
3.11 |
5.69 |
23 |
IR-4 |
50,693.34 |
5.87 |
111.46 |
IR-4 |
25,935.29 |
9.01 |
5.85 |
24 |
IR-4 |
10,344.98 |
2.39 |
64.78 |
IR-4 |
13,928.74 |
4.84 |
6.31 |
25 |
IR-4 |
8,021.89 |
13.37 |
72.58 |
IR-4 |
34,964.89 |
6.07 |
5.18 |
26 |
IR-4 |
8,070.94 |
11.21 |
64.23 |
IR-4 |
5,078.17 |
3.53 |
2.92 |
27 |
IR-4 |
1,415.94 |
23.60 |
84.69 |
IR-4 |
13,223.72 |
10.50 |
5.08 |
28 |
IR-4 |
12,780.83 |
4.95 |
68.33 |
IR-4 |
10,037.30 |
11.15 |
4.86 |
29 |
IR-4 |
10,254.86 |
15.54 |
94.22 |
IR-4 |
10,227.39 |
4.73 |
3.39 |
30 |
IR-4 |
23,327.37 |
4.05 |
70.06 |
IR-4 |
16,649.16 |
4.62 |
6.32 |
31 |
IR-4 |
5,215.85 |
17.39 |
62.25 |
IR-4 |
15,252.04 |
4.24 |
6.92 |
32 |
IR-4 |
13,609.48 |
5.16 |
66.35 |
IR-4 |
14,282.18 |
4.96 |
10.93 |
33 |
IR-4 |
4,667.70 |
15.56 |
68.58 |
IR-4 |
17,595.95 |
12.22 |
4.33 |
Total |
|
457,856.29 |
|
|
|
469,033.55 |
|
|
6 Geological Setting, Mineralization and Deposit
6.1 Regional Setting
The Project area is in the western Mojave Desert and is part of the Basin and Range Physiographic Province. The region is characterized by narrow faulted mountain ranges and flat valleys and basins, the result of tectonic extension that began approximately 17 million years ago. The Project lies within the Hector Basin of the Barstow Trough and is bounded on the southwest by the San Andreas fault zone and the Transverse Ranges, on the north by the Garlock fault zone, and on the east by the Death Valley and Granite Mountain infrastructure faults. Numerous faults of various orientations are found within the area with various orientations though the predominant trend is to the northwest.
The Barstow Trough, a structural depression, extends northwesterly from Barstow toward Randsburg and to east-southeast toward Bristol. It is characterized by thick successions of Cenozoic sediments, including borate-bearing lacustrine deposits, with abundant volcanism along the trough flanks. The northwest-southeast trending trough initially formed during Oligocene through Miocene times. As the basin was filled with sediments and the adjacent highland areas were reduced by erosion, the areas receiving sediments expanded, and playa lakes, characterized by fine-grained clastic and evaporitic chemical deposition, formed in the low areas at the center of the basins.
28
Exposures of fine-grained lacustrine sediments and tuffs, possibly Pliocene in age, are found throughout the Project area. Younger alluvium occurs in washes and overlying the older lacustrine lakebed sediments. Much of the Project area is covered by recent olivine basalt flows from the Pisgah Crater, which is located approximately two miles east of the site as shown in Figure 6.1 and Figure 6.2. Thick fine-grained, predominantly lacustrine lakebed mudstones appear to have been uplifted, forming a block of lacustrine sediments interpreted to be floored by an andesitic lava flow.
Figure 6.1: Surface geology in the Newberry Springs area
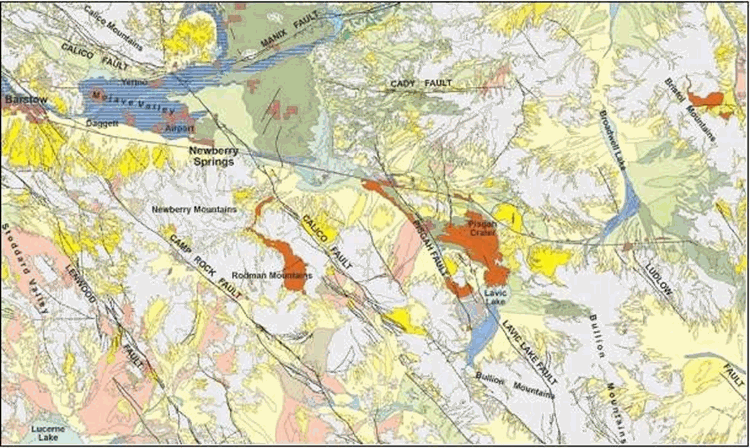
There are three prominent geologic features in the project area (Figure 6.2):
29
Figure 6.2: Topographic map with faults and infrastructure
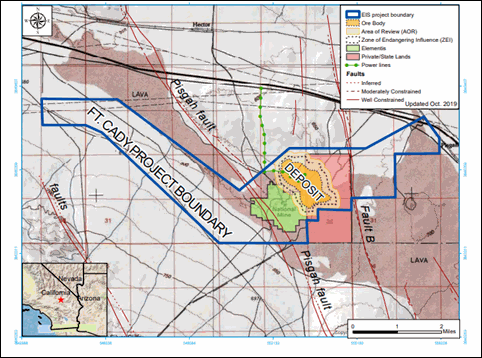
The Pisgah Fault is a right-lateral slip fault that exhibits at least 250 ft of vertical separation at the Project. The east side of the fault is up-thrown relative to the west side. Fault B is located east of the ore body and also exhibits at least 250 ft of vertical separation; however, at Fault B, the east side is down dropped relative to the west side. The uplifted zone containing the borate ore body the Wedge is situated within a thick area of fine-grained, predominantly lacustrine lakebed mudstones, east of the Pisgah Fault and west of Fault B.
6.1.1 Mineralization
Mineralization occurs in a sequence of lacustrine lakebed sediments ranging in depths from 1,300 ft to 1,500 ft bgs. The mineralization is hosted by a sequence of mudstones, evaporites and tuffs, consisting of variable amounts of colemanite, calcium borate 2CaO • 3B2O3• 5H2O, and lithium. Colemanite and lithium are the target minerals. Colemanite is a secondary alteration mineral formed from borax and ulexite. The mineral is semi-hard with a Mohs hardness of 4.5 and forms as discreet monoclinic, prismatic crystals or masses. Colemanite typically forms as a translucent colorless, white, or gray crystal with a vitreous luster. Colemanite is insoluble in water but soluble in HCl and sulfuric acid (H2SO4). Colemanite is associated with thinly laminated siltstone, clay and gypsum beds containing an average of 9% calcite, 35% anhydrite plus 10% celestite (SrSO4) (Wilkinson & Krier, 1985). In addition to colemanite and celestite, elevated levels of lithium have been found through chemical analyses of drill samples. X-ray diffraction analysis of core samples from the deposit indicates the presence of the evaporite minerals anhydrite, colemanite, celestite, and calcite. The mineralogy of the detrital sediments include quartz, illite, feldspars, clinoptilolite, and zeolite. The deposit underlies massive clay beds which appear to encapsulate the evaporite ore body on all sides as well as above and below the deposit. This enclosed setting makes the deposit an ideal candidate for in-situ mining technology affording excellent containment of the leachate solution.
6.2 Mineral Deposit
Boron is believed to have been sourced from regional thermal waters which flowed from hot springs during times of active volcanism. These hot springs vented into the Hector Basin when it contained a large desert lake. Borates were precipitated as the thermal waters entered the lake and cooled or as the lake waters evaporated and became saturated
30
with boron. Colemanite, being the least soluble mineral, would evaporate on the receding margins of the lake. The evaporite-rich sequence forms a consistent zone in which the borate-rich colemanite zone transgresses higher in the section relative to stratigraphic marker beds.
Based on drilling results, the deposit is elliptical in shape, with the long axis trending N40°W to N50°W. extending over an area of about 606 acres at an average depth of approximately 1,300 ft to 1,500 ft bgs. Beds within the colemanite deposit strike roughly N45°W and dip about 10° or less to the southwest. Using an isoline of 5% B2O3, mineralization has an approximate width of 2,800 ft and a length of 11,150 ft with thickness ranging from 70 to 262 ft exclusive of barren interbeds.
The western margin of mineralization appears to be roughly linear, paralleling the Pisgah Fault which lies approximately 1 mi to the west (Figure 6.2). Duval geologists consider this boundary to be controlled by facies change from evaporite rich mudstones to carbonate-rich lake beds, because of syn-depositional faulting. The northeast and northwest boundaries of the deposit are controlled by facies changes to more clastic material, reducing both the overall evaporite content and the concentration of colemanite within the evaporites. The southeast end of the deposit is open-ended, and additional drilling is necessary to define the southeastern limits of borate deposition (Wilkinson & Krier, 1985).
6.3 Stratigraphic Column
Drilling of the deposit by Duval in the late 1970’s and early 1980’s defined the following lithological sequence (Figure 6.3 and Figure 6.4). Four major units have been identified:
31
Figure 6.3 Long-section and cross-section through the Fort Cady deposit
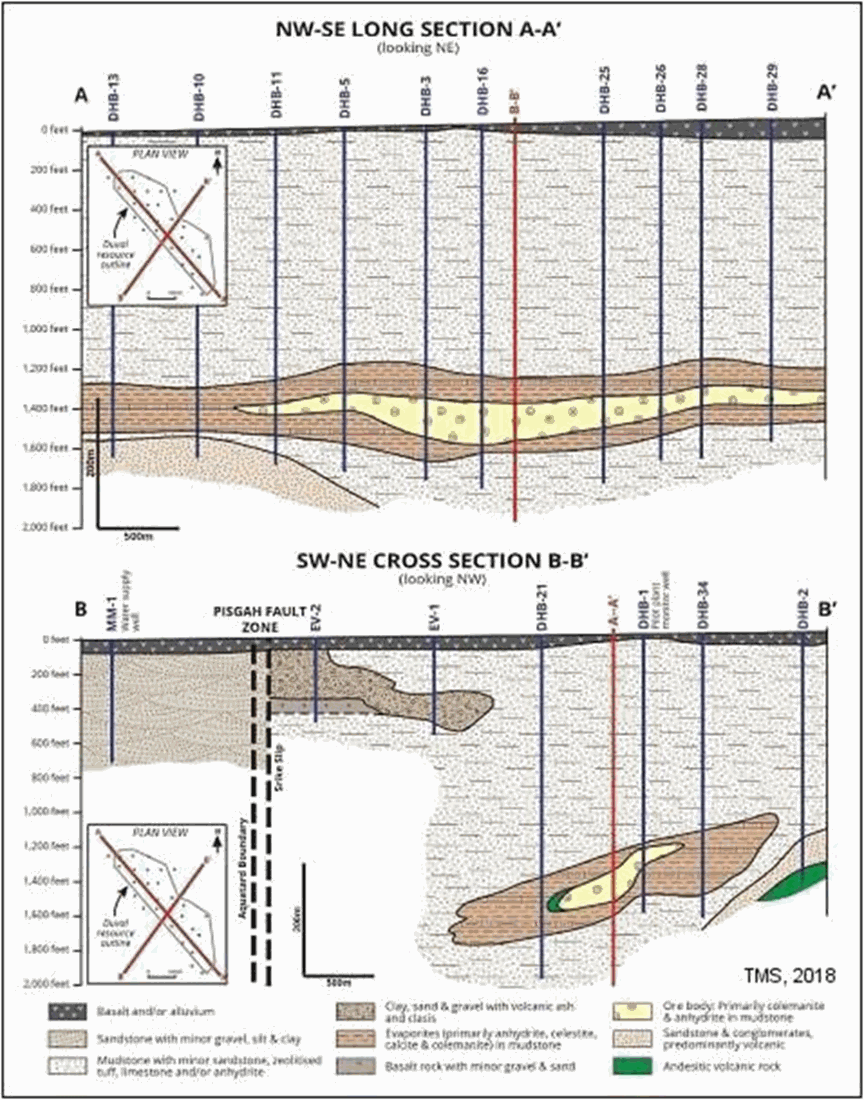
Figure 6.4: Generalized lithological column for the Fort Cady deposit
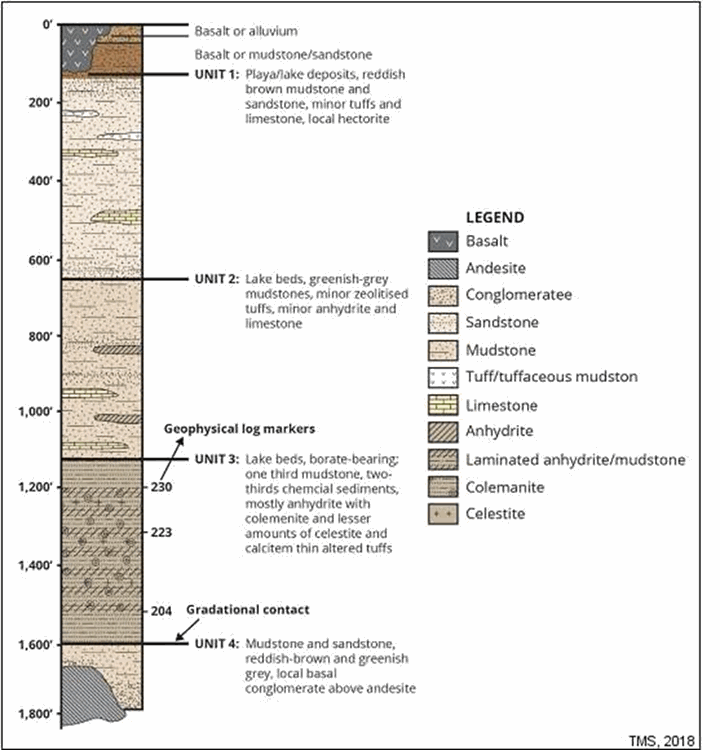
32
7 Exploration
7.1 Non-drilling exploration
Non-drilling exploration has not been deemed appropriate for this deposit.
7.2 Drilling
7.2.1 Historic Drilling
As part of their exploration program, Duval completed 35 drill holes between 1979 and 1981. The DHB holes were drilled using a combination of rotary drilling through the overburden followed by core drilling through the evaporite sequence. DHB-32 was drilled as a water well southeast of the Project. Geologic logs of rotary cuttings and core were completed for all holes followed by geochemical analyses of the core. Duval paid particular attention during logging to identifying marker beds ash tuffs for correlation. In addition to geologic logging, down-hole geophysics were completed on 25 holes for gamma ray and neutron. A few holes had additional geophysical logs completed for compensated density, deviation, induction, elastic properties, and caliper.
In 1981 and 1982, after the exploration program, Duval drilled five solution mining test (SMT) wells which were used in injection/recovery (IR) tests. Like previous drilling, the wells were rotary drilled through the overburden and cored through the evaporite sequence. Following coring, a 5.5-inch casing was set through the cored interval. All SMT wells were logged, and analytical samples are available from the cored intervals of SMT-1, SMT-2, and SMT-3. Gamma ray and neutron logs were collected from all SMT wells. Caliper, compensated density, and induction logs were run on several, but not all the SMT wells. Three additional SMT wells were established in 1992 and 1993 (SMT-92 & 93 Holes) and these three wells were rotary drilled to full depth and no geologic samples were collected.
FCMC completed two drilling campaigns during their participation in the Project. Additional P-Series holes were completed between 1987 and 1996 as rotary holes for injection/recovery test wells. Cuttings were sampled for analysis at 5-foot intervals for holes P-1, P-2, and P-3. A ten-foot sampling interval was used for sampling on P-4. No geologic samples were collected for holes P-5, P-6, and P-7. FCMC completed three S-Series wells in 1990. All three wells were rotary drilled and no geologic sampling was performed. FCMC completed down-hole geophysics on all the P and S-series wells. Historic drilling completed by Duval and FCMC is summarized in Table 7.1.
33
Table 7.1: Historic drilling summary
|
|
|
|
|
|
|
|
|
|
|
|
UTM 83-11 m |
|
|
Rotary Interval (ft) |
|
Cored Interval (ft) |
|
|||
Drill Hole ID |
Easting |
Northing |
Collar |
Depth |
From |
To |
|
From |
To |
No. of |
DHB-01 |
553,336 |
3,846,154 |
2,004 |
1,623 |
— |
1,090 |
|
1,090 |
1,623 |
187 |
DHB-02 |
554,062 |
3,846,179 |
2,033 |
1,679 |
— |
955 |
|
955 |
1,443 |
— |
DHB-03 |
553,089 |
3,845,899 |
1,980 |
1,773 |
— |
940 |
|
940 |
1,773 |
214 |
DHB-04 |
552,855 |
3,845,669 |
1,981 |
1,708 |
— |
1,194 |
|
1,194 |
1,708 |
178 |
DHB-05 |
552,848 |
3,846,153 |
1,978 |
1,730 |
— |
1,043 |
|
1,043 |
1,730 |
179 |
DHB-06 |
553,115 |
3,846,386 |
2,008 |
1,616 |
— |
1,040 |
|
1,040 |
1,616 |
125 |
DHB-07 |
553,736 |
3,845,492 |
2,000 |
1,735 |
— |
1,063 |
|
1,063 |
1,735 |
181 |
DHB-08 |
552,575 |
3,846,214 |
1,966 |
1,809 |
— |
1,072 |
|
1,072 |
1,809 |
186 |
DHB-09 |
552,391 |
3,846,408 |
1,967 |
1,750 |
— |
1,137 |
|
1,137 |
1,750 |
138 |
DHB-10 |
552,349 |
3,846,631 |
1,980 |
1,655 |
— |
1,148 |
|
1,148 |
1,655 |
86 |
DHB-11 |
552,599 |
3,846,390 |
1,976 |
1,671 |
— |
1,150 |
|
1,150 |
1,671 |
86 |
DHB-12 |
552,824 |
3,846,402 |
1,993 |
1,625 |
— |
1,130 |
|
1,130 |
1,625 |
85 |
DHB-13 |
552,104 |
3,846,877 |
1,978 |
1,661 |
— |
1,140 |
|
1,140 |
1,661 |
70 |
DHB-14 |
553,089 |
3,846,151 |
1,987 |
1,631 |
— |
1,105 |
|
1,105 |
1,631 |
80 |
DHB-15 |
553,580 |
3,846,158 |
2,013 |
1,609 |
— |
1,177 |
|
1,177 |
1,609 |
51 |
DHB-16 |
553,263 |
3,845,595 |
1,985 |
1,845 |
— |
1,193 |
|
1,193 |
1,845 |
138 |
DHB-17 |
552,843 |
3,845,925 |
1,982 |
1,804 |
— |
1,178 |
|
1,178 |
1,804 |
151 |
DHB-18 |
553,238 |
3,845,431 |
1,978 |
1,880 |
— |
1,212 |
|
1,212 |
1,878 |
106 |
DHB-19 |
554,141 |
3,845,287 |
2,034 |
1,460 |
— |
1,060 |
|
1,060 |
1,460 |
74 |
DHB-20 |
553,006 |
3,845,437 |
1,998 |
1,671 |
— |
1,207 |
|
1,207 |
1,671 |
— |
DHB-21 |
553,292 |
3,845,143 |
2,011 |
1,752 |
— |
1,118 |
|
1,118 |
1,828 |
39 |
DHB-22 |
553,275 |
3,845,902 |
1,988 |
1,711 |
— |
1,196 |
|
1,196 |
1,711 |
135 |
DHB-23 |
553,508 |
3,845,110 |
2,021 |
1,857 |
— |
1,208 |
|
1,208 |
1,857 |
114 |
DHB-24 |
553,523 |
3,845,637 |
1,994 |
1,780 |
— |
1,202 |
|
1,202 |
1,780 |
119 |
DHB-25 |
553,699 |
3,845,297 |
2,021 |
1,818 |
— |
1,248 |
|
1,248 |
1,818 |
152 |
DHB-26 |
553,891 |
3,845,056 |
2,050 |
1,702 |
— |
1,106 |
|
1,106 |
1,702 |
106 |
DHB-27 |
553,698 |
3,844,803 |
2,043 |
1,795 |
— |
1,228 |
|
1,228 |
1,795 |
95 |
DHB-28 |
554,004 |
3,844,943 |
2,053 |
1,690 |
— |
1,185 |
|
1,185 |
1,690 |
115 |
DHB-29 |
554,164 |
3,844,454 |
2,040 |
1,610 |
— |
1,203 |
|
1,203 |
1,610 |
101 |
DHB-30 |
553,873 |
3,844,630 |
2,050 |
1,720 |
— |
1,250 |
|
1,250 |
1,720 |
83 |
DHB-31 |
553,865 |
3,844,381 |
2,037 |
1,460 |
— |
1,195 |
|
1,195 |
1,625 |
41 |
DHB-32 |
551,770 |
3,843,845 |
2,045 |
870 |
— |
870 |
|
— |
— |
— |
DHB-33 |
554,045 |
3,844,254 |
2,043 |
1,601 |
— |
1,124 |
|
1,124 |
1,860 |
80 |
DHB-34 |
553,746 |
3,845,722 |
2,116 |
1,525 |
— |
1,150 |
|
1,150 |
1,620 |
79 |
DHB-35 |
551,249 |
3,848,166 |
2,068 |
1,449 |
— |
1,194 |
|
1,194 |
1,459 |
— |
P-1 |
553,093 |
3,845,908 |
1,984 |
1,500 |
— |
1,500 |
|
— |
— |
20 |
P-2 |
553,094 |
3,845,969 |
1,984 |
1,510 |
— |
1,510 |
|
— |
— |
21 |
P-3 |
553,033 |
3,845,902 |
1,981 |
1,510 |
— |
1,510 |
|
— |
— |
18 |
P-4 |
553,033 |
3,845,935 |
1,977 |
1,510 |
— |
1,510 |
|
— |
— |
34 |
P-5 |
553,193 |
3,845,874 |
1,985 |
1,547 |
— |
1,547 |
|
— |
— |
— |
P-6 |
553,209 |
3,845,946 |
1,989 |
1,525 |
— |
1,525 |
|
— |
— |
— |
P-7 |
553,217 |
3,846,023 |
1,992 |
1,475 |
— |
1,475 |
|
— |
— |
— |
SMT-1 |
553,323 |
3,846,144 |
2,004 |
1,315 |
— |
1,235 |
|
1,235 |
1,315 |
59 |
SMT-2 |
553,310 |
3,846,135 |
2,004 |
1,679 |
— |
1,234 |
|
1,234 |
1,316 |
55 |
SMT-3 |
553,211 |
3,845,897 |
1,988 |
1,679 |
— |
1,325 |
|
1,325 |
1,518 |
69 |
SMT-6 |
553,210 |
3,845,934 |
1,988 |
1,450 |
— |
1,341 |
|
1,341 |
1,450 |
— |
SMT-9 |
553,194 |
3,845,837 |
1,985 |
1,497 |
— |
1,341 |
|
1,341 |
1,497 |
— |
This data, along with company drilling discussed in Section 7.2.2 and subsequent analysis discussed in Section 8, form the basis and confirmations for the geologic model.
34
7.2.2 Company Drilling
After acquisition of the Project in May 2017, American Pacific Borates and Lithium, Ltd, a predecessor entity to 5E, completed 14 drill holes, which confirmed previous drilling results and expanded the Mineral Resource Estimate. Table 7.2 provides a summary of the 2017 drilling program. A cross-section through the deposit is also displayed in Figure 7.1. Drilling through the overburden sequence was completed using rotary air blast drilling. This was followed by drilling a 2.5-inch core through the evaporite sequence. All drill holes were completed vertically with no greater than five degrees of deviation.
Table 7.2: 2017 5E drilling summary
|
|
|
|
|
|
|
|
|
|
|
|
UTM 83-11 m |
|
|
Rotary Interval (ft) |
|
Cored Interval (ft) |
|
|||
Drill Hole ID |
Easting |
Northing |
Collar |
Depth |
From |
To |
|
From |
To |
No. of |
17FTCBL-01 |
552,638 |
3,846,716 |
2,006 |
1,569 |
— |
1,204 |
|
1,204 |
1,569 |
82 |
17FTCBL-02 |
552,711 |
3,846,490 |
1,997 |
1,509 |
— |
1,208 |
|
1,208 |
1,509 |
107 |
17FTCBL-03 |
552,981 |
3,846,485 |
2,019 |
1,459 |
— |
1,153 |
|
1,153 |
1,459 |
91 |
17FTCBL-04 |
552,695 |
3,846,268 |
1,978 |
1,738 |
— |
1,266 |
|
1,266 |
1,738 |
162 |
17FTCBL-05 |
552,930 |
3,846,267 |
1,995 |
1,589 |
— |
1,237 |
|
1,237 |
1,589 |
150 |
17FTCBL-06 |
553,145 |
3,846,260 |
2,002 |
1,502 |
— |
1,189 |
|
1,189 |
1,502 |
83 |
17FTCBL-07 |
552,772 |
3,846,041 |
1,977 |
1,775 |
— |
1,196 |
|
1,196 |
1,775 |
207 |
17FTCBL-08 |
552,972 |
3,846,042 |
1,984 |
1,625 |
— |
1,202 |
|
1,202 |
1,625 |
153 |
17FTCBL-09 |
553,179 |
3,846,037 |
1,992 |
1,560 |
— |
1,169 |
|
1,169 |
1,560 |
120 |
17FTCBL-10 |
552,831 |
3,845,939 |
1,989 |
1,647 |
— |
1,208 |
|
1,208 |
1,647 |
176 |
17FTCBL-11 |
553,078 |
3,845,899 |
1,983 |
1,778 |
— |
1,332 |
|
1,332 |
1,778 |
155 |
17FTCBL-12 |
552,963 |
3,845,801 |
1,973 |
1,750 |
— |
1,281 |
|
1,281 |
1,750 |
212 |
17FTCBL-13 |
553,153 |
3,845,818 |
1,992 |
1,769 |
— |
1,313 |
|
1,313 |
1,769 |
155 |
17FTCBL-14 |
553,270 |
3,845,608 |
1,987 |
1,845 |
— |
1,328 |
|
1,328 |
1,845 |
260 |
Core logging was completed on all drill holes and included lithological and geotechnical logging. Downhole geophysical logs included Gam Ray, Induction, and standard caliper, and were completed on all drill holes from surface to total depth except for 17FTCBL009 where adverse hole conditions resulted in only partial geophysical logging. All core is logged and photographed according to industry standard procedures. An example of core photos is shown in Figure 7.2.
A geotechnical drill hole, APBL023, was also completed in 2017. This well was cored for its entire length and a geologic log was completed to define mineralized horizons. No splitting or analytical samples were collected from this hole to preserve the core for subsequent geotechnical testing.
In 2022, 5E drilled 13 wells as part of a monitoring well and testing program. One well, IR2-01-01, was cored and assayed and subsequently added to the drilling database as outlined in Table 7.3.
In 2023, three observation wells, OW-9, OW-10, and OW-11 were completed as part of the permitting process with the EPA. Down-hole geophysics were completed on the three wells. Rotary cuttings from the wells were logged and assayed and subsequently included into the drilling database.
The QP considers the drilling program by 5E to be of sufficient quality to support a Mineral Resource Estimate.
35
Table 7.3: Recent 5E Drilling
|
|
|
|
|
|
|
|
|
|
|
|
UTM 83-11 m |
|
|
Rotary Interval (ft) |
|
Cored Interval (ft) |
|
|||
Drill Hole ID |
Easting |
Northing |
Collar |
Depth |
From |
To |
|
From |
To |
No. of |
IR2-01-01 |
552,472 |
3,845,807 |
2,006 |
1,931 |
— |
1,079 |
|
1,079 |
1,931 |
135 |
OW-9 |
553,364 |
3,845,874 |
1,972 |
1,527 |
— |
1,527 |
|
— |
— |
46 |
OW-9 |
553,619 |
3,845,692 |
1,979 |
1,800 |
— |
1,800 |
|
— |
— |
44 |
OW-11 |
552,669 |
3,845,877 |
1,978 |
1,538 |
— |
1,538 |
|
— |
— |
41 |
Figure 7.1: Cross-section through the Fort Cady deposit
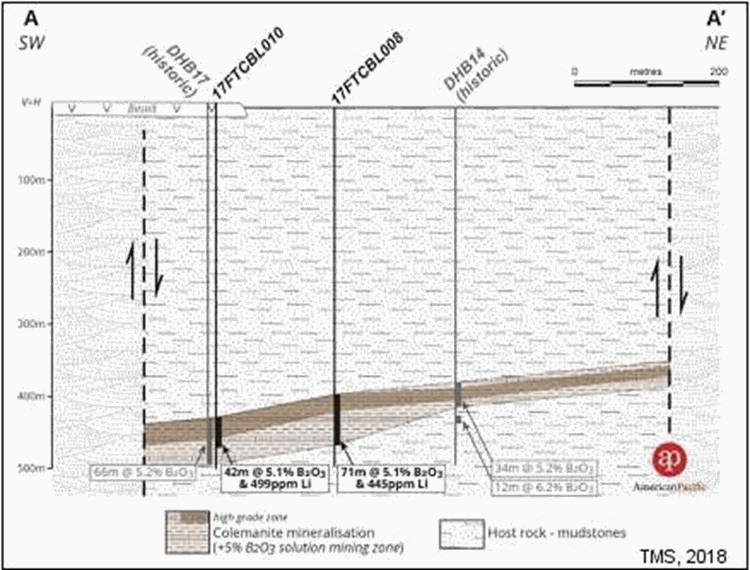
36
Figure 7.2: Core photo, 17FTCBL-014
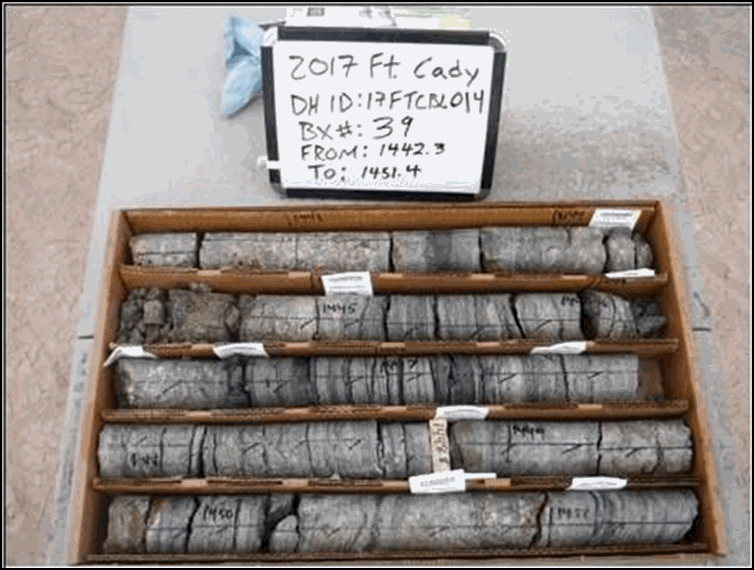
7.3 Hydrogeology
7.3.1 Hydraulic Setting
The Project deposit is in the California Groundwater Bulletin 118 Unit Basin 14 Lavic Valley, and Hydrologic Unit 12 sub-basin 180902081303. There is no name associated with the sub-basin and it is located north and west of the Lavic Lake and town of Lavic hydrologic sub basins. Basin 180902081303 is approximately 39,657 acres (160.48 square kilometers) in area and extends from the Rodman Mountains south and west of the Project in a north direction towards Highway 40, terminating at a topographical divide at the highway. The basin is bound to the south and east by the Pisgah Crater and Lavic Lake Volcanic Field.
The Fort Cady Mountains constrain Basin 14 to the north and the Rodman Mountains and Lava Bed Mountains constrain Basin 14 to the south of the Project. The groundwater flow in the Lavic Valley alluvial basin is generally west towards the Mojave River, but in the project area is poorly defined. The basin outflow is interpreted to occur to the east of Broadwell Valley, with no localized groundwater discharge such as evapotranspiration or discharge to springs or a river.
The mineral deposit is bounded to the west by the Pisgah Fault and to the east by subordinate faults that include Fault B (UIC permit application; Confluence Water Resources CWR, 2019 Fault B Program Results, Technical Report).
The nearest industrial well, owned by Candeo Lava Products, is 3.5 miles east of the Project ore body. No other water wells are known to exist within the vicinity of the Project. Water level measurements from the Candeo Lava Products well are not currently available but are greater than 96 ft bgs based on the CWR investigation in 2018. The next closest water well is located north and west of the Project at the Desert Oasis Highway Rest Stop providing non-potable water to the rest stop facilities. This well is located approximately 7 miles northwest of the Project. The depth to water from the Rest Stop Well (Well 1807), was measured by CWR to be 54.75 ft bgs, at an approximate elevation of 1,758 ft amsl.
The nearest municipal well is screened in the valley alluvium, west of the Pisgah fault and approximately five miles northwest of the ore body (Figure 7.3).
37
Figure 7.3: Project area groundwater basins and surrounding area wells, Fort Cady Project
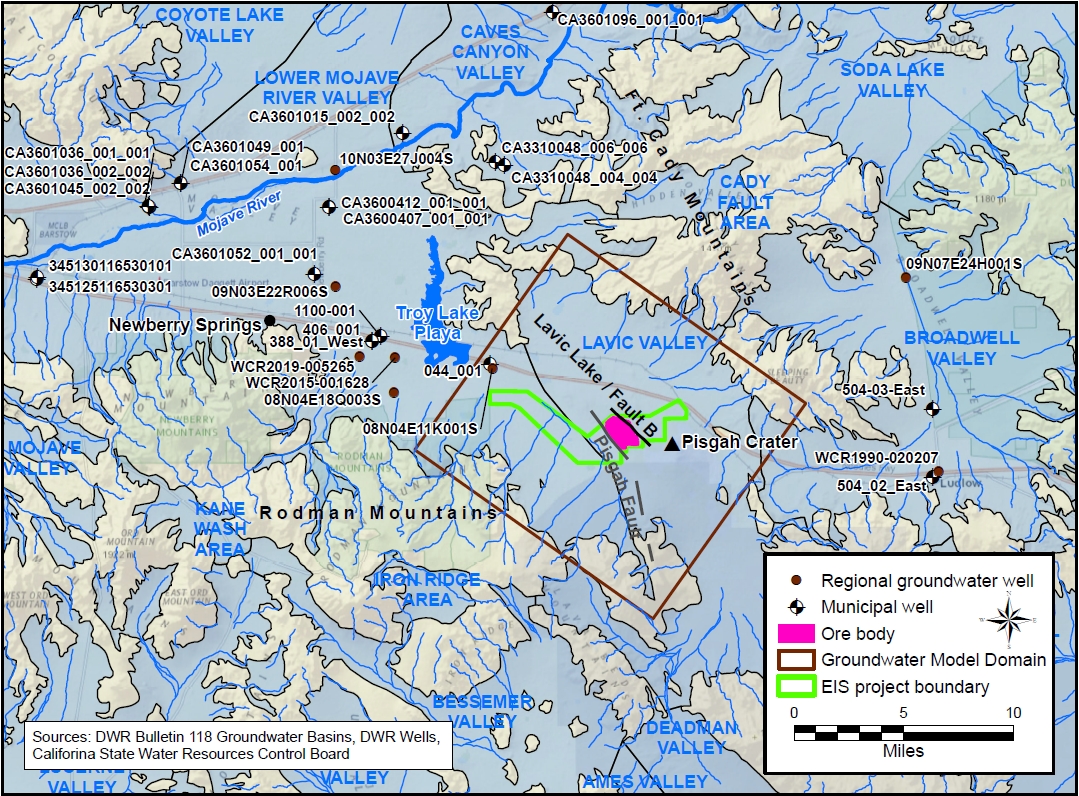
Private domestic wells are associated with rural residences located greater than 6.5 miles west of the Project on the eastern edge of the town of Newberry Springs. Irrigation wells are located further west, the closest of which is approximately 10 miles west of the Project. The Pisgah Fault separates these residential and irrigation wells from the Project area, such that they are not within the same regional groundwater flow system and are not hydraulically connected.
The Project is located within a closed basin. Although surface water is rarely present in the vicinity of the Project, when it occurs, flow is in a northwesterly direction past the Project area from the Rodman Mountains and the Pisgah Crater topographic divide. There are no perennial springs or streams in the vicinity of the Project. Surface water-related features are seasonal, and ephemeral in response to meteorological events. These features consist of unnamed dry washes that may carry water during heavy storm events generally draining west through the Project area toward the Troy Lake playa in Newberry Springs.
7.3.2 Project Area Groundwater Levels
The orebody is “wedged” between the Pisgah Fault and Fault B. The static depths to groundwater in the vicinity of the orebody generally range between 240 and 350 ft bgs. Prior to injection in 2024, the measured groundwater elevation in the wedge ranged from approximately 1,500 ft amsl at MW-3A to 1,720 ft amsl at AOR-3A, although many wells were still recovering from fluid evacuation during drilling. Injection and recovery in the IR wells beginning in January 2024 has caused pressure fluctuations in two wells, OW-6A and all three screens of OW-10 (nested well). The pressure response from injections causes water level fluctuations of about 35 ft in OW-6A which is about 1,000 ft away from the IR wells. The deepest screen of OW-10 fluctuates ~50 ft while the middle and shallow screen fluctuate ~100 ft in response to injection and recovery at the IR wells. The water levels in the remaining wells do not show a response to injections and are either still recovering or remaining relatively flat.
38
The groundwater elevation outside the wedge, west of the Pisgah Fault in the quaternary alluvial fan sediments of the Lower Mojave River Valley Groundwater Basin is approximately 1,785 ft amsl in Project wells MWW-1, MWW-S1, and MWW-2.
The difference in groundwater elevation between Project wells presents a steepening of the gradient from west to east across the Pisgah Fault. There is approximately a 30 to 40 foot water level differential on the east and west sides of the Pisgah Fault, which is regionally recognized as a barrier to groundwater flow and represents one of the groundwater basin boundaries.
Groundwater in the vicinity of Fault B at Project wells TW-1, PW-1, and PW-2, is approximately 350 to 390 ft bgs in the coarser alluvial sediments to the east of Fault B (PW-1 and PW-2) and in a mix of alluvial and fine playa sediments to the west of Fault B (TW-1).
Monitoring wells drilled in 2021 by 5E as part of permit compliance did not encounter groundwater above the Unit 4 sediments except for a perched groundwater zone localized in fine sand lenses underlaying surficial basalt above the contact with Unit 1. The results of the Shallow Groundwater Characterization Program (CWR, June 2022, Shallow Groundwater Characterization Report on Mining Block 2 Near Pisgah Fault), indicated that groundwater encountered during drilling of the Series 7 wells is of low yield, poor quality and probably low storage capacity.
Recharge to the perched zone originates from precipitation occurring in the Lava Bed Mountains, and drainage from Sunshine Peak, located southwest of the project. The upgradient precipitation drains into the shallow alluvium southwest of the Pisgah Fault with shallow groundwater flowing in a northeasterly direction through unconsolidated alluvial sediments, before draining under the basalt flow at a gradient of 0.002 ft/ft into cemented sandstone and mudstone, where it is compartmentalized within the lithology and controlled by Fault B. Interpretation of chip logs for all Series 7 and Series 3 wells, and the WSW and WMW wells, indicate the shallow cemented sandstone is not uniform, decreasing in depth to the east of the project, where the mudstone is encountered higher in most wellbores due to either pre-basalt flow topography and/or offset from faulting.
Since shallow groundwater was not encountered or observed during drilling of the Series 3 monitor wells, the Pisgah Fault is interpreted as being a strong influence on the shallow groundwater system flow dynamics, influencing the groundwater quality in Block 2. The lateral extent of the shallow groundwater system is anticipated to be confined to within the area underlying the surface basalt near the Series 7 wells to the extent of the Pisgah Fault zone northwest of the Project.
The Pisgah Fault compartmentalizes the shallow groundwater system’s lateral extent within the western Project area and is not the source of shallow groundwater.
Below Unit 4 is the Unit 5 andesite where groundwater was encountered in MW-3B (CWR, March 12, 2023, CWR Technical Memorandum, Results of OW-3A and MW-3B Hydraulic Testing, Fort Cady California Project), describe the results of groundwater testing between Unit 4 and the underlying andesite. The results of air lift testing found that the Unit 5 groundwater is under a highly confined pressure demonstrating that Unit 4 is an aquiclude up to 150 ft thick, preventing percolation of groundwater from Unit 3 to Unit 5. The current conceptual model indicates that recharge in the deep bedrock is extremely slow. This is particularly true between the Pisgah Fault and Fault B, where inflow from precipitation recharge through the alluvium or inflow from adjacent bedrock is minimal due to the bounding faults.
Proven water resources have been deemed acceptable through Phase 1 of the Project.
7.3.3 Hydrogeology External to the Ore Block
The hydrology east of Fault B, approximately 3,500 ft east of the colemanite deposit was analyzed by CWR (2018) that found, 1) a significant groundwater resource east of Fault B, and 2) that the fault is a barrier to groundwater flow. Stable isotope analytical results compared against Nevada Meteoric Water Lines appropriate for desert terrains found that the aquifer east of Fault B and the aquifer west of the Pisgah Fault have different origins, while the limited groundwater
39
between the two faults is of a different origin than both aquifers. Recovery rates from wells between the two faults, which includes the colemanite deposit, are less than one gpm as would be expected in mudstones and claystone with very limited groundwater present.
7.3.4 Formation Hydraulic Properties
Testing for hydraulic properties of the colemanite and evaporates/mudstones containing the colemanite have occurred on several occasions. Based on the pump test results in mudstone and claystone sediments above and below the ore body evaporites, CWR (2019) estimated hydraulic conductivity to be approximately 10-5 ft/day, a very low value. Additionally, a majority of the monitoring wells have been recovering since development and have not reached a steady state value after 3+ years, a clear indicator of limited water in the confining units and low hydraulic conductivity.
The results of the testing in OW-3A indicate the contact between Units 2 and 4 is extremely low permeability, with hydraulic conductivity (K) approximately 4.3 x 10⁻⁵ feet/day. Testing in MW-3B indicates the permeability of the underlying andesite is three orders of magnitude higher, approximately 8.9 x 10⁻² feet/day (CWR, March 12, 2023, Results of OW-3A and MW-3B Hydraulic Testing, Fort Cady California Project).
7.3.4.1 Duval 1980-1982
Beginning in 1980, Duval retained Core Laboratories, Inc. to run injectivity tests on one-inch cores from borehole SMT-1. The samples were extracted with toluene, salts leached with cool methanol and dried in a controlled humidity oven. Permeability to air and Boyle’s Law porosity were determined for each sample.
The injectivity tests were run at the reservoir temperature of (simulated) formation water (120o F) which flowed through the core until equilibrium occurred, and a minimum of three pore volumes had been injected. Sulfuric acid and hydrochloric acid solutions were injected through the core samples after which the permeability to acid solutions was determined.
In the 1981 testing, injection pressures were up to 1,250 psi, with flow velocities predominantly 107 cm/sec with groundwater, increasing to 105 cm/sec with acid concentrations between 10-20%, indicative of the hydraulically tight nature of the claystone hosting the deposit.
While detailed information on the Core Lab testing procedures is available, quality assurance and quality control (QA/QC) procedures are not.
Based on the colemanite content in the sediments and laboratory core analyses, the end-point porosity of the ore body formation after mining was predicted by Core Lab in 1981 to be 15-19%.
7.3.4.2 In-Situ 1990
A field pilot test found that the initial permeability ranged from 1.35 x 10⁻⁹ to 2.9 x 10⁻¹⁰ cm/sec as part as a multiple well constant rate injection test to determine the directional tendencies of hydraulic properties in the mineral deposit. In-Situ also investigated the effects of prior injection/recovery testing using a Badger flow meter, a HEREMIT data logger, and pressure transmitters. The water-level responses were measured in the injection well and six nearby observation wells and the Cooper and Jacob method used to analyze data from each well and the Papadopulos Method to determine directional permeability. The results confirmed the earlier work that the permeability and transmissivity of the deposit are low.
7.3.4.3 Hydro-Engineering 1996
This analysis summarized some of the testing and provided interpretations of prior testing in 1981 and 1990. The mineralized sequence of rock transmissivity is estimated at 10 gal/day/ft, or 1.3 ft2/day. Assuming that the colemanite mineralized sequence occurs over an approximate 300 ft thickness, then the native K was estimated at 4.5 x 10⁻³ ft/day, similar to that of Simon Hydro-Search 1993 of 8.2 x 10⁻³ to 2.2 x 10⁻² ft/day K converted from millidarcy units. The storage coefficient (S) of the ore body was also estimated by Hydro-Engineering 1996 to be at 2.5 x 10⁻⁶.
40
Increases in the transmissivity, hydraulic conductivity and storage coefficient will occur as colemanite is dissolved from the formation. Hydro-Engineering, 1996, estimated that the end-point permeability of the ore body formation after colemanite dissolution would be approximately 30 times higher, with a long-term storage coefficient of approximately 1.1 x 10⁻⁵. The end-point hydraulic properties are still low because much of the formation is evaporites, anhydrite, and claystone that will not be dissolved.
7.3.4.4 Geomega 2023
Geomega analyzed step rate testing completed in the IR wells in block two in 2023. The step rate tests resulted in an average formation fracture pressure of 917 psi and a formation fracture gradient of 0.69 psi/ft, well aligned with prior estimates of 0.65 to 0.76 psi/ft from the Duval 1983 pilot tests. Further analysis of the data indicated that permeability ranged from 0.5 to 2 millidarcies with total porosity ranging from 27% to 34%, aligned with prior low permeability estimates.
7.3.5 Water Quality Compliance Monitoring
Routine sampling of monitoring wells is ongoing for water quality purposes, with OW-6A specifically used to monitor the movement of mining related solutions. While monitoring wells installed closer to the IR wells in late 2024 do not have enough data yet to determine mining related impacts (there is a wide range of natural variability in the ore body), none of the monitoring wells show definitive indications of mining related solution impact as of Q2 2025.
8 Sample Preparation, Analysis and Security
8.1 Sampling Method and Approach
Between September 2017 and October 2017, 14 holes for a total of 23,111 ft were completed as part of a confirmatory resource drilling program. Assay results from all 14 drill holes were used in the mineral resource estimate. There are 2,113 samples from the 2017 drilling program representing 1,713 ft of core. In conjunction with the 2017 drilling program, 29 historical drill holes completed by Duval and four holes completed by FCMC have been utilized in the mineral resource estimate. There are 3,672 samples from the historic drilling representing a cumulative total 10,831.3 ft of core. The QA/QC procedures for the historic drilling are unknown though the work products compiled during the historic drilling suggest it was carried out by competent geologists following procedures considered standard practice at that time.
Discussions held with Pamela A.K. Wilkinson, who was an exploration geologist for Duval at the time of drilling and sampling, indicate that Duval had internal quality control and quality assurance procedures in place to ensure that assay results were accurate. Duval utilized their Tucson, West Texas Culberson Mine or New Mexico Duval Potash Mine laboratories for analytical work carried out at the Project. Geochemical analyses were carried out using X-Ray Fluorescence Spectrometry (XRF). XRF results were reportedly checked against logging and assay data.
Entire core sequences were sampled. Sample intervals were determined at the time of logging based on changes in lithology, mineralogy, and bedding. Sample intervals range from 0.2 to 6.6 ft with an overall average sample length of 2.66 ft. Following determination of sampling intervals, the core was split in half using a core splitter. One half of the core is used for the analytical sample with the remaining half core being returned to the core box for archiving. Samples are then placed into labeled plastic sample bags along with a pre-numbered sample tag. A companion sample tag is placed back in the core box marking the interval sampled. Samples were dispatched by commercial carrier to the Saskatchewan Research Council (SRC) for geochemical analysis. SRC has been accredited by the Standards Council of Canada and conforms with the requirements of ISO/IEC 17025.2005.
Identical sampling procedures were followed in 2022 for IR2-01-01. One hundred thirty-five (135) samples were collected from IR2-01-01 and dispatched to SRC for analysis.
41
For observation wells OW-9, OW-10 and OW-11, 131 chip samples were collected on 1.0 to 16 ft. intervals with the most samples through the mineral horizons at 10 ft. lengths. Sample splits weighing approximately 640 grams were dispatched to SRC for analysis.
8.2 Sample Preparation, Analysis and Security
Upon receipt of samples from 5E, SRC would complete an inventory of samples received, completing the chain of custody documentation, and providing a ledger system to APBL tracking samples received and steps in process for sample preparation and analysis. Core samples and chip samples are dried in their original sample bags, then jaw crushed. A subsample is split out using a sample riffler. The subsample is then pulverized with a jaw and ring grinding mill. The grinding mill is cleaned between each sample using steel wool and compressed air or by using silica sand. The resulting pulp sample is then transferred to a barcode labeled plastic vial for analysis.
All samples underwent a multi-element Inductively Coupled Plasma Optical Emission Spectroscopy (ICP-OES), using a multi-acid digestion for Ag, Al2O3, Ba, Be, CaO, Cd, Ce, Cr, Cu, Dy, Er, Eu, Fe2O3, Ga, Gd, Hf, Ho, K2O, La, Li, MgO, MnO, Mo, Na2O, Nb, Nd, Ni, P2O5, Pb, Pr, Sc, Sm, Sn, Sr, Ta, Tb, Th, TiO2, U, V, W, Y, Yb, Zn, and Zr. Boron was also analyzed by ICP-OES but undergoes a separate digestion where an aliquot of the sample is fused in a mixture of NaO2/NaCO3 in a muffle oven, then dissolved in deionized water, prior to analysis. Major oxides Al2O3, CaO, Fe2O3, K2O, MgO, MnO, Na2O, P2O5 and TiO2 are reported in weight percent. Minor, trace, and rare earth elements are reported in ppm. The detection limit for B is 2 ppm and 1 ppm for Li.
For the 2017 drilling program and IR2-01-01 in 2022, a total of 2,253 core samples and 441 control samples were submitted for multi-element analysis to SRC. 5E submitted control samples in the form of certified standards, blanks and coarse duplicates bags with sample identification supplied by 5E for SRC to make duplicate samples. In addition to these control samples, SRC also submitted their own internal control samples in the form of standards and pulp duplicates. A summary of all the QA/QC control samples submitted to SRC is shown in Table 8.1. Only the internal control samples provided by SRC were included with rotary chip samples from the observation wells drilled in 2023.
Table 8.1: Summary of QA/QC control samples
|
|
|
|
|
|
|
|
|
|
|
Submitted |
Drilling Type |
Number of |
Meters |
Standards |
Blanks |
Coarse |
Pulp |
Total |
Primary |
Total |
5E |
Rotary |
15 |
5,284.24 |
— |
— |
— |
— |
— |
— |
— |
|
Diamond Tail |
— |
— |
— |
— |
— |
— |
— |
— |
— |
|
Tail |
15 |
2,472.85 |
153 |
143 |
144 |
— |
— |
2,253 |
2,693 |
|
Total |
15 |
7,757.09 |
153 |
143 |
144 |
— |
— |
2,253 |
2,693 |
|
Frequency |
5.68% |
5.31% |
5.35% |
— |
19.10% |
83.66% |
100% |
||
SRC |
SRC Internal QAQC |
|
|
151 |
|
82 |
|
|
|
|
|
Frequency |
7.10% |
|
3.90% |
|
11.00% |
|
|
||
Certified standards SRM 1835 and SRM 97b, prepared by the National Institute of Standards and Technology, were submitted as part of the APBL QA/QC procedures, the results of which are shown graphically on Figure 8.1 and Figure 8.2. Standard deviations shown are for the SRC assays. No two standards in any single batch submission were more than two standard deviations from the analyzed mean, implying an acceptable level of precision of SRC instrumentation.
42
Figure 8.1: Assay results of Standard SRM1835
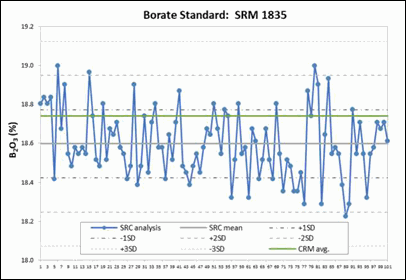
Figure 8.2: Assay results of Standard SRM97b
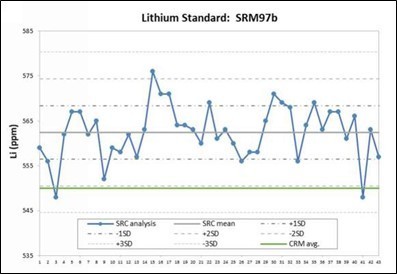
SRC assayed two different standards, CAR110/BSM and CAR110/BSH, for its own QC protocol. CAR110/BSM is designated as a “medium boron standard.” CAR110/BSH is designated as a “high boron standard.” Figure 8.3 and Figure 8.4 display the analytical results for the certified standards. The analytical precision for analysis of both CAR110/BSM and CAR110/BSH is also reasonable, with no two standards in any single batch submission being more than two standard deviations from the analyzed mean.
43
Figure 8.3: Assay results for SRC Standard CAR110/BSM
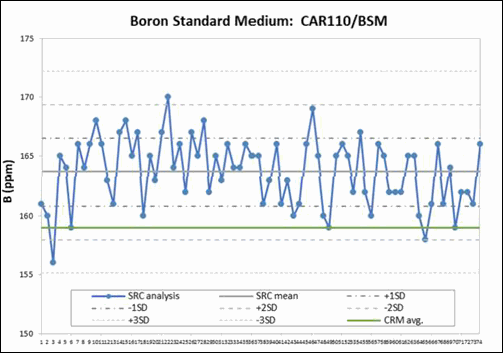
Figure 8.4: Assay results for SRC Standard CAR110/BSH
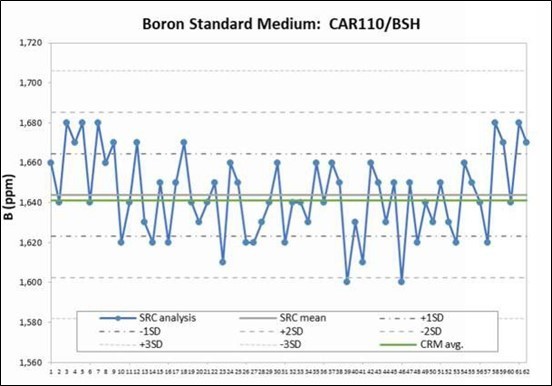
44
Figure 8.5: Sample blank assay results for boron
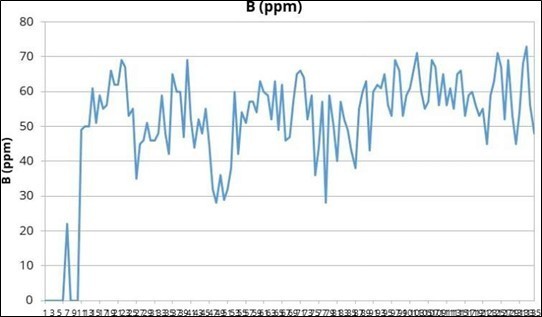
Blank samples inserted by 5E consisted of non-mineralized marble. One hundred and thirty-five blank samples were submitted, all of which had assay results of less than 73 ppm B. The level of boron detected in the blanks is likely sourced from pharmaceutical borosilicate glass used during sample digestion. These boron concentrations are considered immaterial in relation to the boron levels detected in the colemanite mineralization and do not appear to represent carryover contamination from sample preparation. Lithium levels in the blank samples are also at acceptable levels with many assays <15 ppm Li. The four highest Li levels in the blanks immediately followed samples that contained relatively high Li concentrations. Overall, the concentration of the primary elements of interest B and Li in the blanks are at levels considered to be acceptable, implying a reasonable performance for sample preparation. The results of the blanks for B and Li are plotted in Figure 8.5 and Figure 8.6.
45
Figure 8.6: Sample blank assay results for lithium
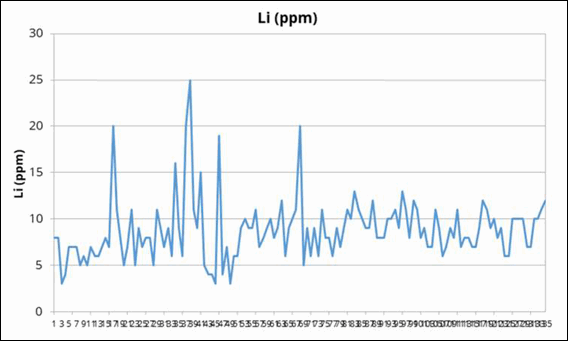
A total of 136 duplicate samples were submitted to the SRC. 5E commissioned SRC to compose coarse duplicate samples using a Boyd rotary splitter. Figure 8.7 and Figure 8.8 show the assay results of duplicate samples for B and Li. As can be seen from the regressions, there is a good correlation between original and duplicate samples.
Figure 8.7: Duplicate sample results for boron
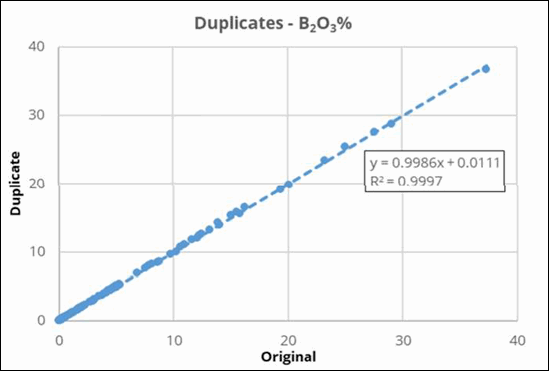
46
Figure 8.8: Duplicate sample results for lithium
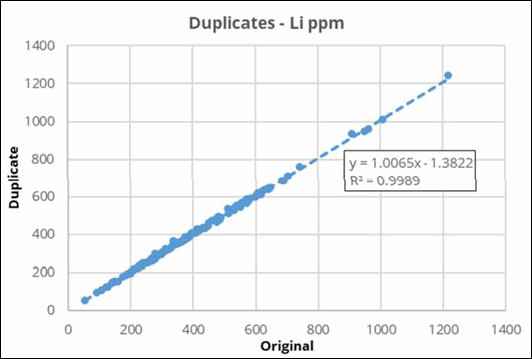
Figure 8.9 displays a HARD half absolute relative difference plot for the duplicates. This highlights reasonable precision for the duplicates. Regression and HARD results were also plotted for pulp duplicates assayed in SRC’s own QC protocol shown in Figure 8.10 and Figure 8.11. These also show a reasonable level of precision.
Figure 8.9: HARD diagram for 5E duplicate samples
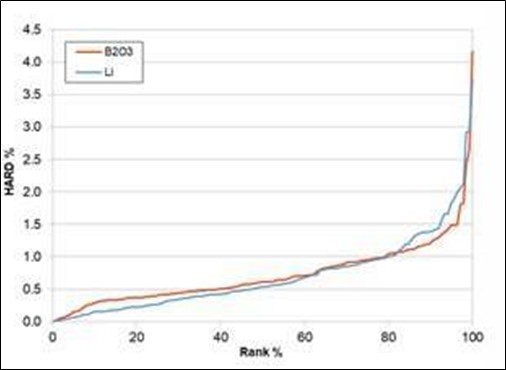
47
Figure 8.10: SRC duplicate results
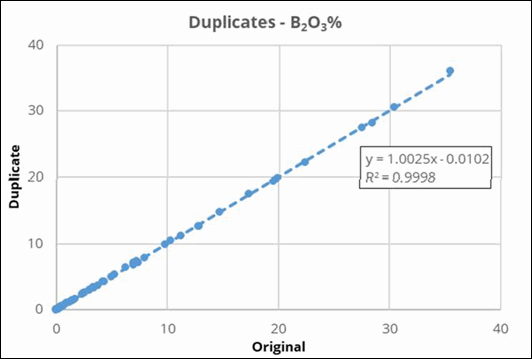
Figure 8.11: SRC duplicates HARD diagram
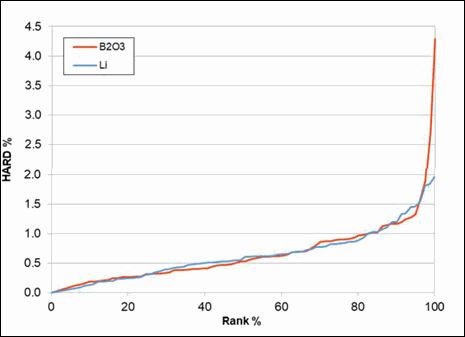
The QP believes reasonable care has been taken to collect and dispatch samples for analysis. The QA/QC program has shown that the analyses are viable with a minimum of dispersion or contamination errors. The QP considers the sampling program to be of sufficient quality to support a mineral resource estimate.
48
9 Data Verification
9.1 Data Verification Procedures
During a site visit, the QP examined the core and also visited the site in 2024. Core has been safely stored in a designated storage building near the mine site office and is in good condition. The QP examined the core and compared the core to the geologic logs and sample interval records and found good agreement with the log descriptions and with no discrepancies with sample intervals.
The QP has done a visual check of drilling locations through Google Earth. Drill sites from the 2017 drilling program are still visible in imagery. Older sites completed by Duval and FCMC are not discernible on imagery.
Historic drilling location records were originally recorded in California State Plane coordinates or in metes and bounds. The QP checked historic drilling location data to ensure these records had been properly converted to Universal Transverse Mercator (UTM) coordinates, the coordinate system used in the 2017 drilling program. All historic location data has been properly converted to the current UTM coordinate system.
The QP received drilling records, sample intervals, and assay results in excel workbook files that were used as input for the drill hole database. Through a variety of data checks drill hole information was evaluated for duplicate entries, incorrect intervals, lengths, or distance values less than or equal to zero, out-of-sequence intervals and intervals or distances greater than the reported drill hole length. Historical drill hole records were also checked against relevant Duval and FCMC data sets. A review comparing original field logs and assay reports showed the data to have been transcribed accurately into the Excel files.
9.2 Data Limitations or Failures
The QP did not identify any data limitations or failures.
9.3 Data Adequacy
The QP believes adequate care has been taken in preserving and transcribing the historic data to digital format and drill hole data accurately corresponds back to the sample ledger and assay certificates. The QP believes that the data used is adequate and suitable for a mineral resource estimate.
10 Mineral Processing and Metallurgical Testing
This section summarizes at a high level the overall metallurgical program and flowsheet development work completed during the preliminary feasibility study (PFS). This test work validates the selected options of the PFS flowsheets.
The most recent phase of metallurgical test work was primarily focused on the evaluation and optimization of the crystallization and impurity removal circuits for boric acid production. Crystallization represents a critical unit operation, directly influencing both product purity and throughput.
The impurity removal process step occurs downstream of the boric acid crystallization steps, but it is critical for the operation that impurities such as magnesium and calcium are removed. A portion of the crystallizer mother liquor is recycled back to be re-injected in the solution mining process. If the impurities are not removed, then they will build up and adversely affect the in-situ leaching process.
10.1 Metallurgical Testing
To support the development and design verification of the Large-Scale Borate Facility (LSBF) process, 5E initiated a comprehensive metallurgical test work program. Pregnant leach solution (PLS) from the wellfield (i.e. representative samples) was collected from the SSF and shipped to Kemetco Research Inc. (Kemetco), an independent metallurgical laboratory based in Richmond, British Columbia, Canada. Kemetco was selected based on its demonstrated expertise in crystallization technologies and other critical hydrometallurgical unit operations relevant to boric acid production. The
49
laboratory also brings extensive prior experience with borate systems, making it a strategic partner for validating process assumptions and optimizing key parameters. Prior to engaging Kemetco, 5E commissioned Ardent Technologies (Ardent) to perform preliminary test work. Ardent’s studies, which focused on gypsum processing, impurity removal, and boric acid crystallization, which provided valuable insights and formed the basis for subsequent testing at Kemetco. The Kemetco program expanded on this foundation, incorporating process solutions and refining key parameters to inform the FEL-2 process design.
10.2 Representative Samples
To ensure the test work was based on realistic process conditions, 5E shipped five drums of brine solution and five buckets of crude boric acid, both generated from the SSF, to Kemetco. These materials were used to reconstitute a representative PLS for metallurgical testing. Prior to combining the materials, Kemetco conducted a full analytical characterization of each component. The results of this analysis are presented in Section 10.4.
10.3 Testing Laboratory
In March of 2025, 5E selected and engaged Kemetco, an independent and ISO-certified laboratory, to conduct the metallurgical testing program. The facility has no financial interest in 5E and was chosen for its expertise in crystallization and process development.
In addition to Kemetco’s work, earlier test programs (July 2022) were conducted by Ardent. While Ardent’s initial studies primarily used synthetic solutions, some of their later work incorporated actual process materials and contributed to the development of the current test program. Their findings, particularly in the areas of impurity removal and crystallization behavior, were valuable in shaping the scope and direction of the Kemetco testing.
10.4 Relevant Results
10.4.1 Feedstock Assay Results
5E shipped brine solution and crude boric acid, both produced at the SSF, to Kemetco’s testing facility. These materials were directly generated from actual wellfield operations, making them highly representative of the expected feedstock for the LSBF. The use of authentic, wellfield-derived PLS is a critical component of the metallurgical test program, ensuring that the results are directly applicable to full-scale operations. This approach enhances confidence in the process design, performance assumptions, and downstream engineering decisions.
At Kemetco, the brine and crude boric acid were combined to reconstitute the PLS. Prior to blending, each component underwent comprehensive metallurgical analysis to characterize its composition. The results of this analysis are presented in Table 10.1.
50
Table 10.1: Kemetco metallurgical analysis for the five brine samples
|
|
|
|
|
|
|
|
Element |
Unit |
5E-PLS #1 |
PLS #2 |
PLS #3 |
PLS #4 |
PLS #5 |
Average |
Ag Silver |
mg/L |
<0.5 |
<0.5 |
<0.5 |
<0.5 |
<0.5 |
<DL |
Al Aluminum |
mg/L |
51 |
49 |
50 |
50 |
50 |
50 |
As Arsenic |
mg/L |
<2. |
<2. |
<2. |
<2. |
<2. |
<DL |
B Boron |
mg/L |
4,006 |
3,995 |
3,836 |
3,858 |
3,846 |
3,908 |
Ba Barium |
mg/L |
1 |
1 |
1 |
1 |
1 |
1 |
Be Beryllium |
mg/L |
<0.2 |
<0.2 |
<0.2 |
<0.2 |
<0.2 |
<DL |
Bi Bismuth |
mg/L |
<2. |
<2. |
<2. |
<2. |
<2. |
<DL |
Ca Calcium |
mg/L |
21,284 |
20,693 |
21,312 |
21,121 |
21,151 |
21,112 |
Cd Cadmium |
mg/L |
<0.2 |
<0.2 |
<0.2 |
<0.2 |
<0.2 |
<DL |
Co Cobalt |
mg/L |
<0.5 |
<0.5 |
<0.5 |
<0.5 |
<0.5 |
<DL |
Cr Chromium |
mg/L |
<0.5 |
<0.5 |
<0.5 |
<0.5 |
<0.5 |
<DL |
Cu Copper |
mg/L |
<1. |
<1. |
<1. |
<1. |
<1. |
<DL |
Fe Iron |
mg/L |
183 |
172 |
174 |
183 |
178 |
178 |
K Potassium |
mg/L |
185 |
179 |
187 |
186 |
183 |
184 |
Li Lithium |
mg/L |
39 |
38 |
39 |
39 |
38 |
38 |
Mg Magnesium |
mg/L |
1,341 |
1,305 |
1,369 |
1,331 |
1,358 |
1,341 |
Mn Manganese |
mg/L |
44 |
42 |
44 |
44 |
43 |
43 |
Mo Molybdenum |
mg/L |
<1. |
<1. |
<1. |
<1. |
<1. |
<DL |
Na Sodium |
mg/L |
4,462 |
4,323 |
4,457 |
4,416 |
4,423 |
4,416 |
Ni Nickel |
mg/L |
2 |
2 |
2 |
2 |
2 |
2 |
* P Phosphorus |
mg/L |
<5. |
<5. |
<5. |
<5. |
<5. |
<DL |
Pb Lead |
mg/L |
<2. |
<2. |
<2. |
<2. |
<2. |
<DL |
* S Sulfur |
mg/L |
404 |
393 |
382 |
407 |
393 |
396 |
Sb Antimony |
mg/L |
<2. |
<2. |
<2. |
<2. |
<2. |
<DL |
Se Selenium |
mg/L |
3 |
3 |
3 |
<2. |
3 |
3 |
Si Silicon |
mg/L |
25 |
25 |
24 |
24 |
24 |
24 |
Sn Tin |
mg/L |
<2. |
<2. |
<2. |
<2. |
<2. |
<DL |
Sr Strontium |
mg/L |
225 |
219 |
224 |
224 |
223 |
223 |
Ti Titanium |
mg/L |
<1. |
<1. |
<1. |
<1. |
<1. |
<DL |
Tl Thallium |
mg/L |
<2. |
<2. |
<2. |
<2. |
<2. |
<DL |
U Uranium |
mg/L |
<5. |
<5. |
<5. |
<5. |
<5. |
<DL |
V Vanadium |
mg/L |
<1. |
<1. |
<1. |
<1. |
<1. |
<DL |
Zn Zinc |
mg/L |
3 |
3 |
3 |
3 |
3 |
3 |
Density (g/mL) |
g/mL |
1.08 |
1.09 |
1.09 |
1.09 |
1.08 |
1.08 |
Cl (colorimetric) |
mg/L |
48,377 |
48,472 |
49,576 |
51,116 |
49,233 |
49,355 |
F by ISE (ppm) |
mg/L |
101 |
96 |
99 |
101 |
97 |
99 |
pH |
|
4.85 |
4.88 |
4.83 |
4.90 |
4.89 |
|
H₃BO₃ |
g/kg |
21 |
21 |
20 |
20 |
20 |
21 |
* Not certified |
|
|
|
|
|
|
|
51
Table 10.2: Kemetco metallurgical analysis for the five boric acid samples
|
|
|
|
|
|
|
|
Element |
Unit |
Boric Acid #1 |
Boric Acid #2 |
Boric Acid #3 |
Boric Acid #4 |
Boric Acid #5 |
Average |
Ag Silver |
mg/kg |
<5. |
<5. |
<5. |
<5. |
<5. |
<DL |
Al Aluminum |
mg/kg |
<10. |
<10. |
<10. |
<10. |
<10. |
<DL |
As Arsenic |
mg/kg |
<20. |
<20. |
<20. |
<20. |
<20. |
<DL |
B Boron |
mg/kg |
158,991 |
163,909 |
155,827 |
160,997 |
157,943 |
159,533 |
Ba Barium |
mg/kg |
<2. |
<2. |
<2. |
<2. |
<2. |
<DL |
Be Beryllium |
mg/kg |
<2. |
<2. |
<2. |
<2. |
<2. |
<DL |
Bi Bismuth |
mg/kg |
<20. |
<20. |
<20. |
<20. |
<20. |
<DL |
Ca Calcium |
mg/kg |
19,181 |
16,696 |
18,409 |
18,283 |
18,282 |
18,170 |
Cd Cadmium |
mg/kg |
<2. |
<2. |
<2. |
<2. |
<2. |
<DL |
Co Cobalt |
mg/kg |
<5. |
<5. |
<5. |
<5. |
<5. |
<DL |
Cr Chromium |
mg/kg |
<5. |
<5. |
<5. |
<5. |
<5. |
<DL |
Cu Copper |
mg/kg |
<10. |
<10. |
<10. |
<10. |
<10. |
<DL |
Fe Iron |
mg/kg |
18.3 |
14.1 |
14.6 |
14.1 |
14.5 |
15 |
K Potassium |
mg/kg |
<50. |
<50. |
<50. |
<50. |
<50. |
<DL |
Li Lithium |
mg/kg |
<10. |
<10. |
<10. |
<10. |
<10. |
<DL |
Mg Magnesium |
mg/kg |
<10. |
<10. |
<10. |
<10. |
<10. |
<DL |
Mn Manganese |
mg/kg |
<2. |
<2. |
<2. |
5.6 |
<2. |
6 |
Mo Molybdenum |
mg/kg |
<10. |
<10. |
<10. |
<10. |
<10. |
<DL |
Na Sodium |
mg/kg |
<50. |
<50. |
<50. |
<50. |
<50. |
<DL |
Ni Nickel |
mg/kg |
<5. |
<5. |
<5. |
<5. |
<5. |
<DL |
* P Phosphorus |
mg/kg |
<50. |
<50. |
<50. |
<50. |
<50. |
<DL |
Pb Lead |
mg/kg |
<20. |
<20. |
<20. |
<20. |
<20. |
<DL |
* S Sulfur |
mg/kg |
15,260 |
13,021 |
15,540 |
14,630 |
14,707 |
14,632 |
Sb Antimony |
mg/kg |
<20. |
<20. |
<20. |
<20. |
<20. |
<DL |
Se Selenium |
mg/kg |
<20. |
<20. |
<20. |
<20. |
<20. |
<DL |
Si Silicon |
mg/kg |
87.2 |
80.6 |
87.2 |
84.1 |
86.7 |
85 |
Sn Tin |
mg/kg |
<20. |
<20. |
<20. |
<20. |
<20. |
<DL |
Sr Strontium |
mg/kg |
35.9 |
30.7 |
36.5 |
33.9 |
35.4 |
34 |
Ti Titanium |
mg/kg |
<10. |
<10. |
<10. |
<10. |
<10. |
<DL |
Tl Thallium |
mg/kg |
<20. |
<20. |
<20. |
<20. |
<20. |
<DL |
U Uranium |
mg/kg |
<50. |
<50. |
<50. |
<50. |
<50. |
<DL |
V Vanadium |
mg/kg |
<10. |
<10. |
<10. |
<10. |
<10. |
<DL |
Zn Zinc |
mg/kg |
<5. |
<5. |
<5. |
<5. |
<5. |
<DL |
H₃BO₃ |
g/kg |
909 |
937 |
891 |
921 |
903 |
912 |
10.4.2 PLS Characterization
The PLS composition that is fed to the crystallizers was simulated using METSIM® modelling software and is shown below. Kemetco amended the reconstituted PLS with small amounts of magnesium chloride, calcium chloride, and sodium chloride to approach the simulated feed conditions. This was done to simulate the various recycle streams within the plant.
The target boric acid head grade expected from the mining operation is 10.2 wt.%. Actual testing by Kemetco was performed at a target of 10.4 wt.%. The slight variation in boric acid head grade is a result of some adjustments to the overall process simulation that were performed after the test work program had begun. Table 10.3 provides the simulated crystallizer feed conditions from the METSIM model.
52
Table 10.3: Simulated crystallizer feed conditions
|
|
Component |
wt. (%) |
H₂O |
76.6% |
H₃BO₃ |
10.4% |
CaCl₂ |
5.3% |
NaCl |
3.8% |
MgCl₂ |
2.4% |
KCl |
1.0% |
LiCl |
0.5% |
CaSO₄ |
0.1% |
pH |
4.0 |
The amended PLS feed compositions for the crystallization tests are shown in Table 10.4 and Table 10.5 provides the feed solutions compositions for continuous crystallization tests (CRZ1-4 and CRZ1-5).
Table 10.4: Amended PLS feed compositions for batch crystallization tests (CRZ1-1 through CRZ1-3)
|
|
|
|
|
Element |
Unit |
CRZ1-1 |
CRZ1-2 |
CRZ1-3 |
Ag Silver |
mg/kg |
<1. |
<2.5 |
<1. |
Al Aluminum |
mg/kg |
63 |
65 |
58 |
As Arsenic |
mg/kg |
<4.0 |
<10.0 |
<4.0 |
B Boron |
mg/kg |
15,941 |
21,030 |
18,491 |
Ba Barium |
mg/kg |
1 |
1 |
1 |
Be Beryllium |
mg/kg |
<0.4 |
<1.0 |
<0.4 |
Bi Bismuth |
mg/kg |
<4.0 |
<10.0 |
<4.0 |
Ca Calcium |
mg/kg |
17,380 |
16,830 |
17,095 |
Cd Cadmium |
mg/kg |
<0.4 |
<1.0 |
<0.4 |
Co Cobalt |
mg/kg |
<1.0 |
<2.5 |
<1.0 |
Cr Chromium |
mg/kg |
<1.0 |
<2.5 |
2 |
Cu Copper |
mg/kg |
<2.0 |
<5.0 |
<2.0 |
Fe Iron |
mg/kg |
146 |
153 |
142 |
K Potassium |
mg/kg |
244 |
250 |
249 |
Li Lithium |
mg/kg |
69 |
70 |
68 |
Mg Magnesium |
mg/kg |
6,067 |
6,069 |
5,762 |
Mn Manganese |
mg/kg |
33 |
38 |
31 |
Mo Molybdenum |
mg/kg |
<2. |
<5.0 |
<2.0 |
Na Sodium |
mg/kg |
14,504 |
14,467 |
15,575 |
Ni Nickel |
mg/kg |
<1.0 |
<2.5 |
3 |
* P Phosphorus |
mg/kg |
<10.0 |
<25.0 |
<10. |
Pb Lead |
mg/kg |
<4.0 |
<10.0 |
<4.0 |
* S Sulfur |
mg/kg |
249 |
243 |
313 |
Sb Antimony |
mg/kg |
<4.0 |
<10.0 |
<4.0 |
Se Selenium |
mg/kg |
<4.0 |
<10.0 |
<4.0 |
Si Silicon |
mg/kg |
27 |
27 |
27 |
Sn Tin |
mg/kg |
<4.0 |
<10.0 |
<4.0 |
Sr Strontium |
mg/kg |
166 |
163 |
161 |
Ti Titanium |
mg/kg |
<2.0 |
<5.0 |
<2.0 |
Tl Thallium |
mg/kg |
<4.0 |
<10.0 |
<4.0 |
U Uranium |
mg/kg |
<10.0 |
<25.0 |
<10.0 |
V Vanadium |
mg/kg |
<2.0 |
<5.0 |
<2.0 |
Zn Zinc |
mg/kg |
3 |
<2.5 |
3 |
53
Table 10.5: Feed solutions for continuous crystallization
|
|
|
|
Element |
Unit |
CRZ1-4 |
CRZ1-5 |
Ag Silver |
mg/kg |
<1.0 |
<1.0 |
Al Aluminum |
mg/kg |
40 |
12 |
As Arsenic |
mg/kg |
<4.0 |
<4.0 |
B Boron |
mg/kg |
19,967 |
16,484 |
Ba Barium |
mg/kg |
1 |
1 |
Be Beryllium |
mg/kg |
<0.4 |
<0.4 |
Bi Bismuth |
mg/kg |
<4.0 |
<4.0 |
Ca Calcium |
mg/kg |
17,460 |
16,609 |
Cd Cadmium |
mg/kg |
<0.4 |
<0.4 |
Co Cobalt |
mg/kg |
<1.0 |
<1.0 |
Cr Chromium |
mg/kg |
2 |
<1.0 |
Cu Copper |
mg/kg |
<2.0 |
<2.0 |
Fe Iron |
mg/kg |
125 |
<2.0 |
K Potassium |
mg/kg |
248 |
244 |
Li Lithium |
mg/kg |
67 |
65 |
Mg Magnesium |
mg/kg |
5,915 |
5,350 |
Mn Manganese |
mg/kg |
33 |
31 |
Mo Molybdenum |
mg/kg |
<2.0 |
<2.0 |
Na Sodium |
mg/kg |
15,983 |
14,480 |
Ni Nickel |
mg/kg |
2 |
2 |
* P Phosphorus |
mg/kg |
<10.0 |
<10.0 |
Pb Lead |
mg/kg |
<4.0 |
<4.0 |
* S Sulfur |
mg/kg |
319 |
324 |
Sb Antimony |
mg/kg |
<4.0 |
<4.0 |
Se Selenium |
mg/kg |
<4.0 |
<4.0 |
Si Silicon |
mg/kg |
22 |
50 |
Sn Tin |
mg/kg |
<4.0 |
<4.0 |
Sr Strontium |
mg/kg |
167 |
34 |
Ti Titanium |
mg/kg |
<2.0 |
<2.0 |
Tl Thallium |
mg/kg |
<4.0 |
<4.0 |
U Uranium |
mg/kg |
<10.0 |
<10.0 |
V Vanadium |
mg/kg |
<2.0 |
<2.0 |
Zn Zinc |
mg/kg |
3 |
4 |
Cl |
mg/kg |
76,599 |
66,522 |
10.4.3 Crystallization Results
Five boric acid crystallization tests and a re-crystallization test were performed. These tests were performed using 1-stage crystallization, 2-stage crystallization, flash crystallization, and re-crystallization processes. In each test, representative samples were collected and analyzed. The crystal samples were analyzed using Inductively Coupled Plasma (ICP) techniques. Crystallization tests CRZ1-1 to CRZ1-3 were performed in batch mode and CRZ1-4 and CRZ1-5 were performed in a continuous process.
Boric acid solubility curves were generated by measuring boric acid concentrations at various temperatures ranging from 10°C to 80°C (50°F to 176°F). This is a critical step in designing full-scale crystallizers, as it defines the temperature range required for crystal growth and enables calculation of the amount of boric acid that can be crystallized from solution—directly impacting plant throughput. The solubility curve data collected, confirmed previously postulated data used in the process simulation. This information is essential for accurately sizing crystallizers and associated process equipment by informing the mass and energy balance requirements needed to meet design capacity. A well-characterized solubility curve also supports optimized process control, helping to prevent fouling and poor crystal quality, and is used to validate the overall process simulation model.
54
Figure 10.1: Boric acid solubility curve at various temperatures for CRZ1-1, CRZ1-2, and CRZ1-3
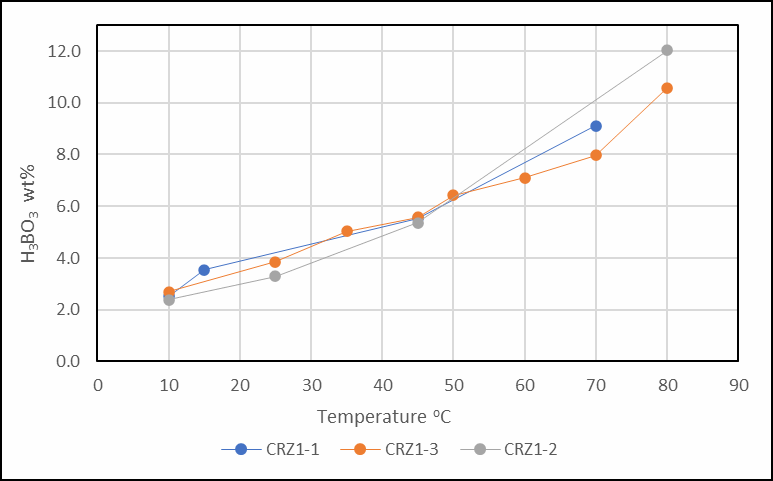
Figure 10.2: Boric acid continuous crystallization set-up including an agitated feed tank
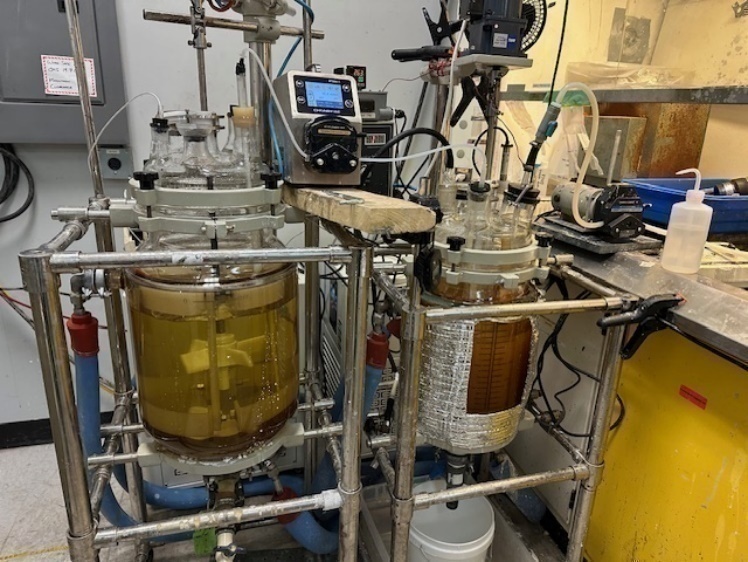
55
Figure 10.3: Boric acid crystals after continuous crystallization test (CRZ1-4)
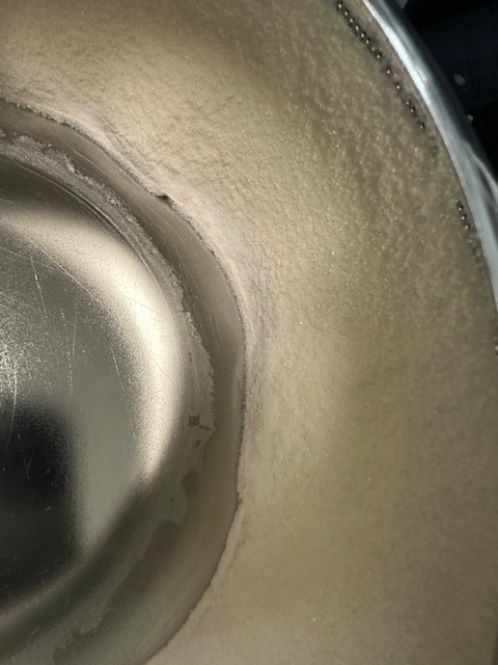
Figure 10.4: Boric acid crystals after continuous crystallization test (CRZ1-4) and centrifugation
The boric acid crystals in the continuous crystallization test, CRZ1-4, had a distinct brown-orange layer that is indicative of ferric iron precipitation. The boric acid crystals pictured are not the finished product. They are the result of the crude crystallization step. The full process includes a filtration step for the crude crystallizer slurry. The resulting filter cake is washed and redissolved. This solution is filtered again before being fed to the re-crystallization process as shown in Figure 10.5 and Figure 10.6 below.
56
Figure 10.5: Boric acid crystals after re-crystallization
Figure 10.6: Boric acid crystals after re-crystallization and dewatering process
The re-crystallization testing yielded a bright-white boric acid crystal product. This is a visual indicator of higher product purity and was confirmed in the lab testing through ICP and chloride analysis as shown below. The boric acid recrystallization test confirmed that the product can achieve the customer specifications listed in Section 16 through water dissolution and displacement washing. This method successfully met or exceeded target chemical specifications, particularly for iron and chloride, and is the design basis for the Large-Scale Borates Facility.
57
Table 10.6: Boric acid re-crystallization results
|
|
|
|
|
|
|
|
|
|
|
|
|
|
|
Solutions |
|
Crystals – wet solids |
|
Crystals – dry solids |
||||||
|
Unit |
Feed |
Mother |
Wet |
|
Batch 1 |
Batch 2 |
Batch 3 |
|
Batch 1 |
Batch 2 |
Batch 3 |
BA assay |
wt% |
- |
- |
- |
|
- |
- |
- |
|
98.89 |
98.85 |
98.61 |
Calc H₃BO₃ |
wt% |
12.50 |
5.14 |
4.50 |
|
102.71 |
95.62 |
95.94 |
|
101.68 |
108.03 |
109.08 |
Ag |
mg/kg |
<1.0 |
<1.0 |
<1.0 |
|
<5.0 |
<5.0 |
<5.0 |
|
<5.0 |
<5.0 |
<5.0 |
Al |
mg/kg |
<2.0 |
<2.0 |
<2.0 |
|
<10.0 |
<10.0 |
<10.0 |
|
<10.0 |
<10.0 |
<10.0 |
As |
mg/kg |
<4.0 |
<4.0 |
<4.0 |
|
<20.0 |
<20.0 |
<20.0 |
|
<20.0 |
<20.0 |
<20.0 |
B |
mg/kg |
21,862 |
8,983 |
7,869 |
|
170,117 |
146,588 |
152,546 |
|
177,782 |
175,656 |
177,375 |
Ba |
mg/kg |
<0.4 |
<0.4 |
<0.4 |
|
<2.0 |
<2.0 |
<2.0 |
|
<2.0 |
<2.0 |
<2.0 |
Be |
mg/kg |
<0.4 |
<0.4 |
<0.4 |
|
<2.0 |
<2.0 |
<2.0 |
|
<2.0 |
<2.0 |
<2.0 |
Bi |
mg/kg |
<4.0 |
<4.0 |
<4.0 |
|
<20.0 |
<20.0 |
<20.0 |
|
<20.0 |
<20.0 |
<20.0 |
Ca |
mg/kg |
187 |
200 |
33.0 |
|
17.8 |
38.3 |
<10.0 |
|
18 |
35 |
<10.0 |
Cd |
mg/kg |
<0.4 |
<0.4 |
<0.4 |
|
<2.0 |
<2.0 |
<2.0 |
|
<2.0 |
<2.0 |
<2.0 |
Co |
mg/kg |
<1.0 |
<1.0 |
<1.0 |
|
<5.0 |
<5.0 |
<5.0 |
|
<5.0 |
<5.0 |
<5.0 |
Cr |
mg/kg |
<1.0 |
<1.0 |
<1.0 |
|
<5.0 |
<5.0 |
<5.0 |
|
<5.0 |
<5.0 |
<5.0 |
Cu |
mg/kg |
<2.0 |
<2.0 |
<2.0 |
|
<10.0 |
<10.0 |
<10.0 |
|
<10.0 |
<10.0 |
<10.0 |
Fe |
mg/kg |
2.6 |
2.9 |
<2.0 |
|
<10.0 |
<10.0 |
<10.0 |
|
<10.0 |
<10.0 |
<10.0 |
K |
mg/kg |
<10.0 |
<10.0 |
<10.0 |
|
<50.0 |
<50.0 |
<50.0 |
|
<50.0 |
<50.0 |
<50.0 |
Li |
mg/kg |
<2.0 |
<2.0 |
<2.0 |
|
<10.0 |
<10.0 |
<10.0 |
|
<10.0 |
<10.0 |
<10.0 |
Mg |
mg/kg |
58.6 |
63.7 |
9.9 |
|
<10.0 |
10.2 |
<10.0 |
|
<10.0 |
11 |
<10.0 |
Mn |
mg/kg |
2.2 |
2.5 |
0.9 |
|
<2.0 |
<2.0 |
<2.0 |
|
<2.0 |
<2.0 |
<2.0 |
Mo |
mg/kg |
<2.0 |
<2.0 |
<2.0 |
|
<10.0 |
<10.0 |
<10.0 |
|
<10.0 |
<10.0 |
<10.0 |
Na |
mg/kg |
154 |
162 |
25.3 |
|
<50.0 |
<50.0 |
<50.0 |
|
<50.0 |
<50.0 |
<50.0 |
Ni |
mg/kg |
<1.0 |
<1.0 |
<1.0 |
|
<5.0 |
<5.0 |
<5.0 |
|
<5.0 |
<5.0 |
<5.0 |
* P |
mg/kg |
<10.0 |
<10.0 |
<10.0 |
|
<50.0 |
<50.0 |
<50.0 |
|
<50.0 |
<50.0 |
<50.0 |
Pb |
mg/kg |
<4.0 |
<4.0 |
<4.0 |
|
<20.0 |
<20.0 |
<20.0 |
|
<20.0 |
<20.0 |
<20.0 |
* S |
mg/kg |
20.7 |
21.2 |
6.0 |
|
<20.0 |
<20.0 |
<20.0 |
|
<20.0 |
<20.0 |
<20.0 |
Sb |
mg/kg |
<4.0 |
<4.0 |
<4.0 |
|
<20.0 |
<20.0 |
<20.0 |
|
<20.0 |
<20.0 |
<20.0 |
Se |
mg/kg |
<4.0 |
<4.0 |
<4.0 |
|
<20.0 |
<20.0 |
<20.0 |
|
<20.0 |
<20.0 |
<20.0 |
Si |
mg/kg |
<4.0 |
<4.0 |
<4.0 |
|
<20.0 |
<20.0 |
<20.0 |
|
<20.0 |
<20.0 |
<20.0 |
Sn |
mg/kg |
<4.0 |
<4.0 |
<4.0 |
|
<20.0 |
<20.0 |
<20.0 |
|
<20.0 |
<20.0 |
<20.0 |
Sr |
mg/kg |
1.9 |
2.0 |
<0.4 |
|
<2.0 |
<2.0 |
<2.0 |
|
<2.0 |
<2.0 |
<2.0 |
Ti |
mg/kg |
<2.0 |
<2.0 |
<2.0 |
|
<10.0 |
<10.0 |
<10.0 |
|
<10.0 |
<10.0 |
<10.0 |
Tl |
mg/kg |
<4.0 |
<4.0 |
<4.0 |
|
<20.0 |
<20.0 |
<20.0 |
|
<20.0 |
<20.0 |
<20.0 |
U |
mg/kg |
<10.0 |
<10.0 |
<10.0 |
|
<50.0 |
<50.0 |
<50.0 |
|
<50.0 |
<50.0 |
<50.0 |
V |
mg/kg |
<2.0 |
<2.0 |
<2.0 |
|
<10.0 |
<10.0 |
<10.0 |
|
<10.0 |
<10.0 |
<10.0 |
Zn |
mg/kg |
<1.0 |
<1.0 |
<1.0 |
|
<5.0 |
<5.0 |
<5.0 |
|
<5.0 |
<5.0 |
<5.0 |
Cl |
mg/kg |
687 |
775 |
123 |
|
40.1 |
105 |
10.0 |
|
28.8 |
104 |
12.6 |
Table 10.7: Particle size distribution for batch crystallization test CRZ1-1 through CRZ1-3
|
|
|
|
|
|
Unit |
CRZ1-1 |
CRZ1-2 |
CRZ1-3 |
D10 |
μm |
101 |
73 |
58 |
D50 |
μm |
283 |
215 |
189 |
D90 |
μm |
492 |
419 |
404 |
58
Table 10.8: Particle size distribution for continuous crystallization test CRZ1-4
|
|
|
|
Batch # |
D10 |
D50 |
D90 |
1 |
79.0 |
318.0 |
646.7 |
3 |
82.5 |
250.2 |
696.5 |
5 |
75.9 |
238.9 |
663.4 |
7 |
79.6 |
233.7 |
653.2 |
9 |
80.1 |
225.4 |
586.3 |
10 |
96.6 |
366.9 |
793.6 |
Table 10.9: Particle size distribution for continuous crystallization test CRZ1-5
|
|
|
|
Batch # |
D10 |
D50 |
D90 |
1 |
78.0 |
289.5 |
573.8 |
3 |
43.6 |
233.8 |
651.1 |
5 |
54.8 |
175.2 |
648.1 |
7 |
61.9 |
177.6 |
635.8 |
9 |
47.9 |
175.9 |
591.1 |
10 |
73.5 |
184.9 |
526.9 |
Table 10.10: Boric acid crystal particle size distribution for re-crystallization
|
|
|
D10 |
D50 |
D90 |
147.9 |
269.7 |
449.3 |
The particle size distribution for the re-crystallization test yielded boric acid crystals that are coarser than the final product specification.
Table 10.11: Boric acid crystal particle size specification
|
|
|
Parameter |
Unit |
Design Value |
Dry Sieve Analysis |
|
|
8 mesh (2360 micron) |
%, Max |
0.0 |
20 mesh (850 micron) |
%, Max |
2.0 |
30 mesh (600 micron) |
%, Max |
5.0 |
100 mesh (150 micron) |
%, Min |
60.0 |
200 mesh (75 micron) |
% |
Report |
Crystal growth dynamics are influenced by several interdependent process parameters, including residence time, slurry density, degree of supersaturation, cooling method and rate, agitation intensity, and mixing efficiency. These variables can be strategically manipulated to control nucleation and growth rates, thereby influencing the final crystal size distribution—favoring either larger crystals or a greater yield of smaller crystals, depending on process objectives. While crystal growth optimization was not a primary focus of the current test work campaign, the data generated—including operating conditions and corresponding residence times—provides a valuable baseline. These results will inform future optimization efforts during final process design.
10.4.4 Impurity Removal Test Results
Impurity removal testing was conducted on crystallizer mother liquor to evaluate two process flow options for removing magnesium while minimizing boron losses. The goal was to selectively precipitate impurities without compromising boron recovery. Two different flow sheet options were evaluated as part of the test work.
59
Option 1: Crystallizer mother liquor Evaporation (50% mass) Cooling Crystallization Sequential pH Adjustments with Lime Slurry
Option 2: CRZ1 mother liquor Sequential pH adjustments Evaporation (EVP1) (60% mass reduction)
Note that the actual pH values were determined through experimentation.
The difference in magnesium removal at a basic pH (Option 1) was 84% compared to a basic pH (Option 2) was 12% removal. Magnesium removal is strongly pH dependent. Boron precipitates out at lower pH and the resulting boron calcium complex can be recycled to increase overall boron recovery. Removing magnesium is important because it is a waste product, and the remaining filtrate is rich in calcium chloride which is to be further concentrated and sold as a byproduct. Both options that were tested were successful. The major difference between the two options was that the size of evaporation ponds was smaller in Option 2. Option 2 is included in the basis of design.
These data points are helpful for understanding the sensitivities of the selective precipitations in order to further recover valuable boron while removing impurities.
10.5 Adequacy of Data
The QP for Fluor, Kevin Martina, conducted a thorough review of the metallurgical test methods and results of the metallurgical test involving the PLS sample collected from the SSF. He confirmed that the reporting was consistent with industry standard practice and that the appropriate protocols were followed during sample preparation. Mr. Martina further verified that the processing and testing of the PLS sample were conducted in accordance with the accepted methodologies. Based on this evaluation, the QP concluded that the extent of testing performed is suitable for the current engineering study level and provides relevant data to support ongoing process design development.
11 Mineral Resource Estimates
Mr. Steven Kerr of Escalante Geological Services, LLC completed an updated mineral resource estimate for the Project with an effective date of June 30, 2026. Mr. Kerr prepared two prior estimates: an October 2023 estimate, which identified a total resource of 171.3 million short tons of ore, with 30.95 million short tons classified as measured resource and 43.35 million short tons classified as indicated resource, using a cut-off grade of 2.0% B₂O₃; and a March 10, 2025 estimate, which incorporated three additional bore holes and additional mineral tenure acquired in the intervening period.
The current estimate is the first to incorporate all mineral tenure held by 5E as of the effective date, including all 30 unpatented lode claims described in Section 3.3. In accordance with Item 1304(d)(2) of Regulation S-K, mineral resources are stated both inclusive of mineral reserves (Table 11.7) and exclusive of mineral reserves (Table 11.8). Mineral reserves were first established in the August 2025 pre-feasibility study, and this is the first mineral resource estimate for the Project reported exclusive of those reserves.
11.1 Key Assumptions
Key assumptions used in the economic assessment include:
60
A detailed financial model using a discount rate of 7% (NPV7) delivered a positive net present value to support the cut-off grade and more broadly the resulting mineral resource estimation.
11.2 QP’s Estimate of Resource
11.2.1 Resource Database
The database used for resource estimation includes 52 core holes and three rotary holes for a total of 55 bore holes. Thirty (30) of the core holes were completed by Duval between 1979 and 1981. 5E completed 14 core holes in 2017 and another hole in 2022. In 2024, 5E completed three (3) rotary holes as observation wells from which chip samples were collected through the mineral horizons for B2O3 and Li analyses. The cumulative sampled length for the database is 5,440.19 m (17,848.39 ft). Table 11.1 summarizes the drilling database. The Project’s exploration dataset is current as of February 12, 2025. Drilling coordinates in the database are in UTM NAD 83-11, and depths and elevations are reported in meters. Borate is listed as weight percent (%) B2O3 and Li as ppm. The drilling database contains 5,767 analytical values for B2O3 and 5,402 analytical values for Li.
Core recovery for the 5E drilling programs has ranged from 93% to 100% with an overall average of 97.60%. Core recovery records for earlier drilling conducted by Duval are not available, but based on missing intervals in the drilling database, core recovery likely exceeded 90% in the core drilling. The QP has completed a thorough review and verification of the drilling database and found the database to be sufficient for resource modeling.
61
Table 11.1: Summary of drilling database
|
|
|
|
|
Core Hole ID |
Cumulative Core Length (m) |
Cumulative Sample Length (m) |
B₂O₃ Analyses |
Li Analyses |
APBL-01 |
111.13 |
88.90 |
82 |
82 |
APBL-02 |
91.74 |
87.74 |
107 |
107 |
APBL-03 |
93.11 |
92.80 |
91 |
91 |
APBL-04 |
143.77 |
142.71 |
162 |
162 |
APBL-05 |
107.35 |
104.76 |
150 |
150 |
APBL-06 |
95.34 |
90.47 |
83 |
83 |
APBL-07 |
176.27 |
166.09 |
207 |
207 |
APBL-08 |
128.96 |
127.20 |
153 |
153 |
APBL-09 |
119.33 |
118.51 |
120 |
120 |
APBL-10 |
133.81 |
126.50 |
176 |
176 |
APBL-11 |
135.72 |
134.79 |
155 |
155 |
APBL-12 |
142.77 |
138.42 |
212 |
212 |
APBL-13 |
138.99 |
136.75 |
155 |
155 |
APBL-14 |
157.43 |
156.99 |
260 |
260 |
DHB-01 |
162.49 |
158.41 |
184 |
184 |
DHB-03 |
212.90 |
212.12 |
213 |
213 |
DHB-05 |
207.26 |
207.26 |
179 |
179 |
DHB-06 |
175.57 |
155.42 |
124 |
124 |
DHB-07 |
204.83 |
204.06 |
179 |
179 |
DHB-08 |
224.63 |
224.63 |
186 |
186 |
DHB-09 |
170.69 |
170.69 |
138 |
138 |
DHB-10 |
139.08 |
81.79 |
86 |
86 |
DHB-11 |
112.90 |
73.28 |
86 |
86 |
DHB-12 |
120.67 |
74.04 |
85 |
— |
DHB-13 |
102.57 |
61.17 |
70 |
70 |
DHB-14 |
117.63 |
75.71 |
80 |
— |
DHB-15 |
125.70 |
56.18 |
51 |
51 |
DHB-16 |
145.48 |
122.62 |
138 |
138 |
DHB-17 |
141.25 |
104.49 |
151 |
151 |
DHB-18 |
139.48 |
92.32 |
105 |
105 |
DHB-19 |
106.68 |
59.40 |
74 |
74 |
DHB-21 |
26.33 |
25.93 |
39 |
39 |
DHB-22 |
135.94 |
101.81 |
135 |
135 |
DHB-23 |
136.24 |
100.80 |
114 |
114 |
DHB-24 |
146.00 |
120.00 |
119 |
119 |
DHB-25 |
173.74 |
134.87 |
152 |
152 |
DHB-26 |
121.37 |
81.99 |
106 |
106 |
DHB-27 |
132.71 |
67.07 |
95 |
95 |
DHB-28 |
128.62 |
80.07 |
115 |
115 |
DHB-29 |
120.64 |
75.28 |
101 |
101 |
DHB-30 |
137.53 |
68.49 |
83 |
83 |
DHB-31 |
49.00 |
57.36 |
41 |
— |
DHB-33 |
111.19 |
92.17 |
80 |
— |
DHB-34 |
68.76 |
87.47 |
79 |
— |
IR-2-01-01 |
137.59 |
119.57 |
135 |
135 |
SMT-1 |
24.40 |
24.40 |
57 |
59 |
SMT-2 |
24.60 |
24.60 |
55 |
— |
SMT-3 |
33.10 |
33.10 |
69 |
— |
P1 |
61.10 |
61.10 |
20 |
— |
P2 |
64.20 |
64.20 |
21 |
— |
P3 |
55.10 |
55.10 |
18 |
— |
P4 |
54.20 |
54.20 |
34 |
— |
Total |
6,327.89 |
5,375.80 |
5,910 |
5,330 |
Rotary Hole ID |
Hole Depth (m) |
Cumulative Sample Length (m) |
B₂O₃ Analyses |
Li Analyses |
OW-09 |
480.06 |
126.50 |
46 |
46 |
OW-10 |
466.00 |
132.88 |
44 |
44 |
OW-11 |
460.00 |
121.71 |
41 |
41 |
Total |
|
381.09 |
131 |
131 |
62
11.2.2 Geologic Model
The QP developed a gridded geologic model of the Project using Carlson Mining™ software. The mineralization does not correlate to lithological markers as the entire sequence is predominantly lacustrine mudstone. However, detailed examination of the analytical results reveals distinct mineralized horizons. The deposit was delineated based on these patterns of mineralization into four mineralized horizons, two non-mineralized or weakly mineralized interbeds and two non-mineralized horizons bounding the deposit. These horizons are listed in Table 11.2.
The grid model was constructed across the deposit area, with a grid cell size of 50 m x 50 m. Grids represent the bounding elevation surfaces of key horizons, horizon thicknesses, and analytical grades. Grids representing the bounding surface elevations of the mineral horizon were interpolated through triangulation. Mineral horizon grids for thickness and analytical grades were interpolated using Ordinary Kriging (OK) and Inverse Distance Squared (ID2) algorithms. Mineralization is spatially defined by a resource boundary using a distance of 200 m from the last intersection of mineralization in a drill hole and by property boundaries. Grids are masked to the outside of the resource boundary.
Table 11.2: Modelled horizons
|
|
|
|
|
|
Horizon |
Abbreviation |
Thickness Range |
Average Thickness |
Composite B₂O₃ Range (wt.%) |
Composited Li Range (ppm) |
Overburden |
OBN |
317.0 – 507.7 |
381.8 |
NA |
NA |
Upper Mineralized Horizon |
UMH |
0.1 – 12.5 |
4.3 |
0.87 – 14.45 |
99 – 588 |
Upper Interbed |
UI |
0.1 – 16.7 |
6.7 |
0.5 – 4.1 |
108 – 623 |
Main Mineralized Horizon |
MMH |
0.7 – 69.4 |
27.4 |
2.6 – 17.6 |
98 – 550 |
Medial Interbed |
MI |
0.2 – 5.2 |
9.7 |
0.3 – 1.9 |
386 – 492 |
Intermediate Mineralized Horizon |
IMH |
1.8 – 58.3 |
22.5 |
0.7 – 12.0 |
23 – 534 |
Lower Mineralized Horizon |
LMH |
0.0 – 53.9 |
19.7 |
0.2 – 5.7 |
91 – 534 |
Lower Sandstone * |
LSS |
0.1 – 58.6 |
15.6 |
NA |
NA |
* Horizon not fully penetrated. NA: Not Applicable |
|||||
11.2.3 Grade Estimation & Resource Classification
Using composites for each mineralized horizon, variography was successful for B2O3 grades for the Major Mineralized Horizon (MMH), Intermediate Mineralized Horizon (IMH), and the Lower Mineralized Horizon (LMH) and are summarized in Table 11.3. Variogram modelling was unsuccessful for the Upper Mineralized Horizon and with Li in all horizons. Grids representing B2O3 grades for the MMH, IMH, and LMH were constructed using OK based on the constructed variograms. ID2 interpolation was used with all remaining grade grids using the same spatial limits established with the horizon grids.
Table 11.3: Modelled variograms
|
|
|
|
|
Horizon |
Type |
Nugget |
First Structure |
Second Structure |
MMH |
Spherical, omnidirectional |
— |
200.0 |
400 |
IMH |
Spherical, omnidirectional |
0.2 |
180.0 |
450 |
LMH |
Spherical, omnidirectional |
0.2 |
530.0 |
— |
Based on the variography above, the deposit was classified as follows:
Drilling and sampling density is sufficient that no further limits on classification are required.
63
11.3 Model Validation
The QP has conducted an audit of the gridded model. The audit and validation of the gridded model consisted of the following steps:
Figure 11.1: Grade variation swath
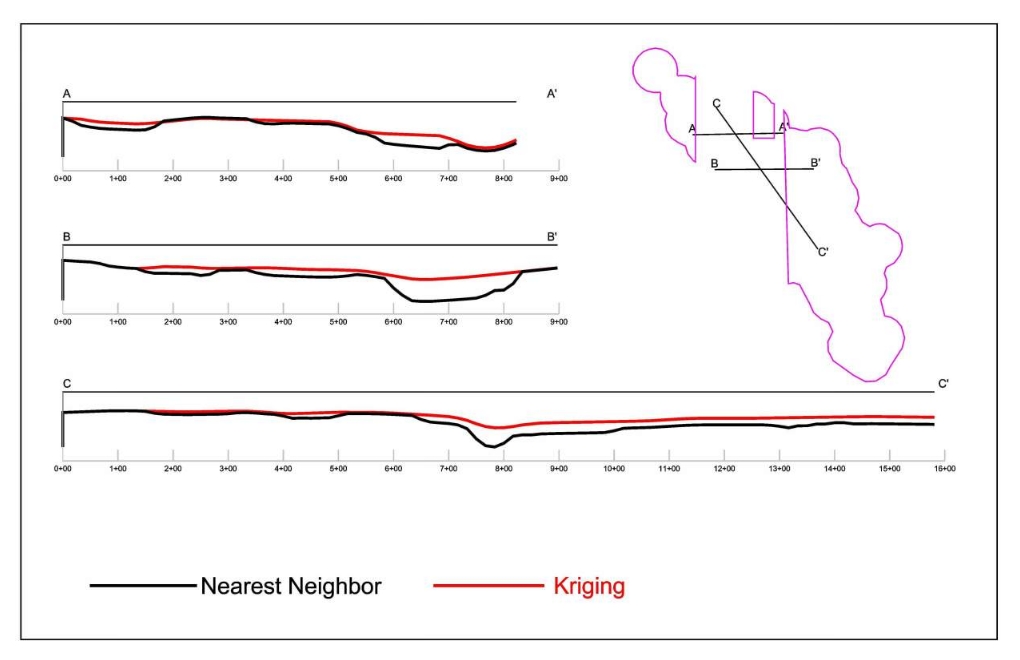
11.3.1 Density Measurements
The 2017 drilling program included the collection of 777 density measurements from core samples. Density determinations were made using the weight in air/weight in water method. The weighted average bulk density determined from the 381 samples collected through the mineralized horizons is 2.18 g/cm3. and has been used as the bulk density in resource estimation.
64
11.4 Cut-off Grade
A 5.0% B2O3 cut-off grade was previously established by Duval and was carried forth by previous QP’s in previous technical report summaries. An in-depth assessment of cut-off grade was undertaken in 2022 and 2023 as mass and energy balances were developed to fundamentally begin to assess economic viability. Data informing the mass and energy balances included incorporating the results of leaching tests, historical results, mining, and processing costs, as well as commodity pricing. This assessment derived a 2.0% cut-off calculation based on the most recent previous initial assessment.
Cut-off grade is an economic analysis to measure cash costs (i.e., the variable cost to produce boric acid compared to the price that can be achieved in the market for the sale of boric acid). 5E commenced mining operations in January 2024 and began operating the SSF in April 2024. The SSF achieved a steady state of operation in the Summer of 2024 and optimized mining operations by September 2024. As such, mining data from September and October 2024 have been utilized as the basis of design and further leveraged for the cut-off grade analysis. Using this data set, an in-depth assessment was performed that included an analysis of the cash costs (i.e., the variable cost to produce boric acid) and excluded book costs (i.e., depreciation) as the capital is assumed to have already been invested to build the project such that it can operate. The definition of cut-off grade for the in-situ mining operation is the point at which the Company would cease operating a particular well or in the case of a combination of wells, the wellfield. As such, cash costs are established as the basis for the analysis.
The in-depth analysis incorporates mineralization and at what point economic extraction or boron in solution is no longer viable. The driver of this analysis focuses on three specific ratios derived from the basis of design using mining data during the period of September and October 2024: calcium to boron, sodium to boron, and magnesium to boron. These three ratios are drivers of various costs, chemical utilizations, and byproduct production rates. For example, calcium to boron impacts sulfuric acid utilization and gypsum production compared to boric acid production. Additionally, magnesium to boron impacts lime utilization and metal salt waste production compared to boric acid production. Lastly, sodium to boron impacts HCl utilization and sodium chloride production compared to boric acid production. Table 11.4 below details the average, minimum and maximum ratios of elements utilized in the basis of design from September and October 2024:
Table 11.4: Basis of design ratios
|
|
|
|
|
Ca:B |
Mg:B |
Na:B |
Average |
1.27 |
0.13 |
0.34 |
Minimum |
0.77 |
0.03 |
0.02 |
Maximum |
2.05 |
0.22 |
0.70 |
To calculate cut-off grade, the following assumptions were utilized which are in-line with the basis of design noted in Section 14:
Table 11.5 provides the cost inputs used in the sensitivity analysis for cut-off grade:
65
Table 11.5: Cut-off grade input costs
|
|
|
Raw Material |
Unit |
Price |
36% HCl |
per short ton BA |
$158.61 |
H₂SO₄ |
per short ton BA |
$124.13 |
Lime |
per short ton BA |
$197.47 |
Metal impurities waste |
per short ton BA |
$45.00 |
Natural gas |
per MMBtu |
$3.19 |
Finally, a sensitivity analysis was performed where cash costs were calculated at each discreet cutoff grade to determine where the cost curves relative to the price of boric acid intersect. For this analysis, the magnesium to boron ratio and the sodium to boron ratio were held constant using the averages obtained from actual mining data and noted in Table 11.4 above. Table 11.6 provides this analysis:
Table 11.6: Cut-off grade analysis
|
|
|
|
|
|
|
|
B₂O₃ |
1.5% |
2.0% |
3.0% |
4.0% |
6.0% |
8.0% |
10.0% |
Ca:B |
6.98 |
5.47 |
3.96 |
3.20 |
2.45 |
2.07 |
1.85 |
Mg:B |
0.13 |
0.13 |
0.13 |
0.13 |
0.13 |
0.13 |
0.13 |
Na:B |
0.34 |
0.34 |
0.34 |
0.34 |
0.34 |
0.34 |
0.34 |
Max head grade BA wt% |
4.4% |
4.9% |
5.9% |
6.7% |
7.8% |
8.7% |
9.3% |
Production rate (kST/yr) |
40.9 |
51.3 |
68.6 |
82.5 |
103.6 |
118.7 |
130.0 |
Plant flow (gpm) |
880 |
880 |
880 |
880 |
880 |
880 |
880 |
36% HCl (lb/ST) |
655 |
655 |
655 |
655 |
655 |
655 |
655 |
H₂SO₄ (lb/ST) |
7,216 |
5,743 |
4,270 |
3,534 |
2,797 |
2,429 |
2,208 |
Lime (lb/ST) |
957 |
821 |
685 |
618 |
550 |
516 |
496 |
Gypsum production (kST/yr) |
259 |
259 |
257 |
256 |
255 |
253 |
252 |
Metal waste (kST/yr) |
6.3 |
7.9 |
10.6 |
12.7 |
16.0 |
18.3 |
20.1 |
NaCl Production (kST/yr) |
6.2 |
7.7 |
10.4 |
12.5 |
15.7 |
17.9 |
19.6 |
Heating (MMBtu/ST) |
7.7 |
7.7 |
7.7 |
7.7 |
7.7 |
7.7 |
7.7 |
Electricity (kWh/ST) |
3,424 |
2,734 |
2,043 |
1,698 |
1,353 |
1,180 |
1,078 |
BTU/ST |
21.7 |
19.2 |
16.6 |
15.3 |
14.1 |
13.4 |
13.0 |
BA Packaging ($/ST) |
$18.00 |
$18.00 |
$18.00 |
$18.00 |
$18.00 |
$18.00 |
$18.00 |
BA freight ($/ST) |
$113.50 |
$113.50 |
$113.50 |
$113.50 |
$113.50 |
$113.50 |
$113.50 |
Variable cost ($/ST) |
$877.98 |
$749.52 |
$621.06 |
$556.83 |
$492.60 |
$460.49 |
$441.20 |
Fixed cost ($/ST) |
$746.52 |
$595.99 |
$445.45 |
$370.19 |
$294.92 |
$257.29 |
$235.00 |
Cash cost ($/ST) |
$1,624.50 |
$1,345.51 |
$1,066.52 |
$927.02 |
$787.53 |
$717.78 |
$676.20 |
Cash cost w/ credit ($/ST) |
$1,417.49 |
$1,180.75 |
$944.01 |
$825.64 |
$707.27 |
$648.09 |
$612.85 |
Sales pricing has risen over the past several years and is currently tracking around $1,100 to $1,300 per short ton F.O.B. in the spot market as of July 2025. For this evaluation, current pricing was used along with price forecasting based on the preliminary market study performed by Kline.
Figure 11.2 plots the cutoff grade relative to cash costs. The result of this exercise is a 2.0% financially viable cutoff grade, where our cash costs are near the current and forecasted boric acid pricing at the commencement of production. The geological model used a 2.0% B2O3 cutoff grade which has a boric acid equivalent cutoff of 3.55% boric acid.
66
Figure 11.2: Cash costs, $/st of boric acid
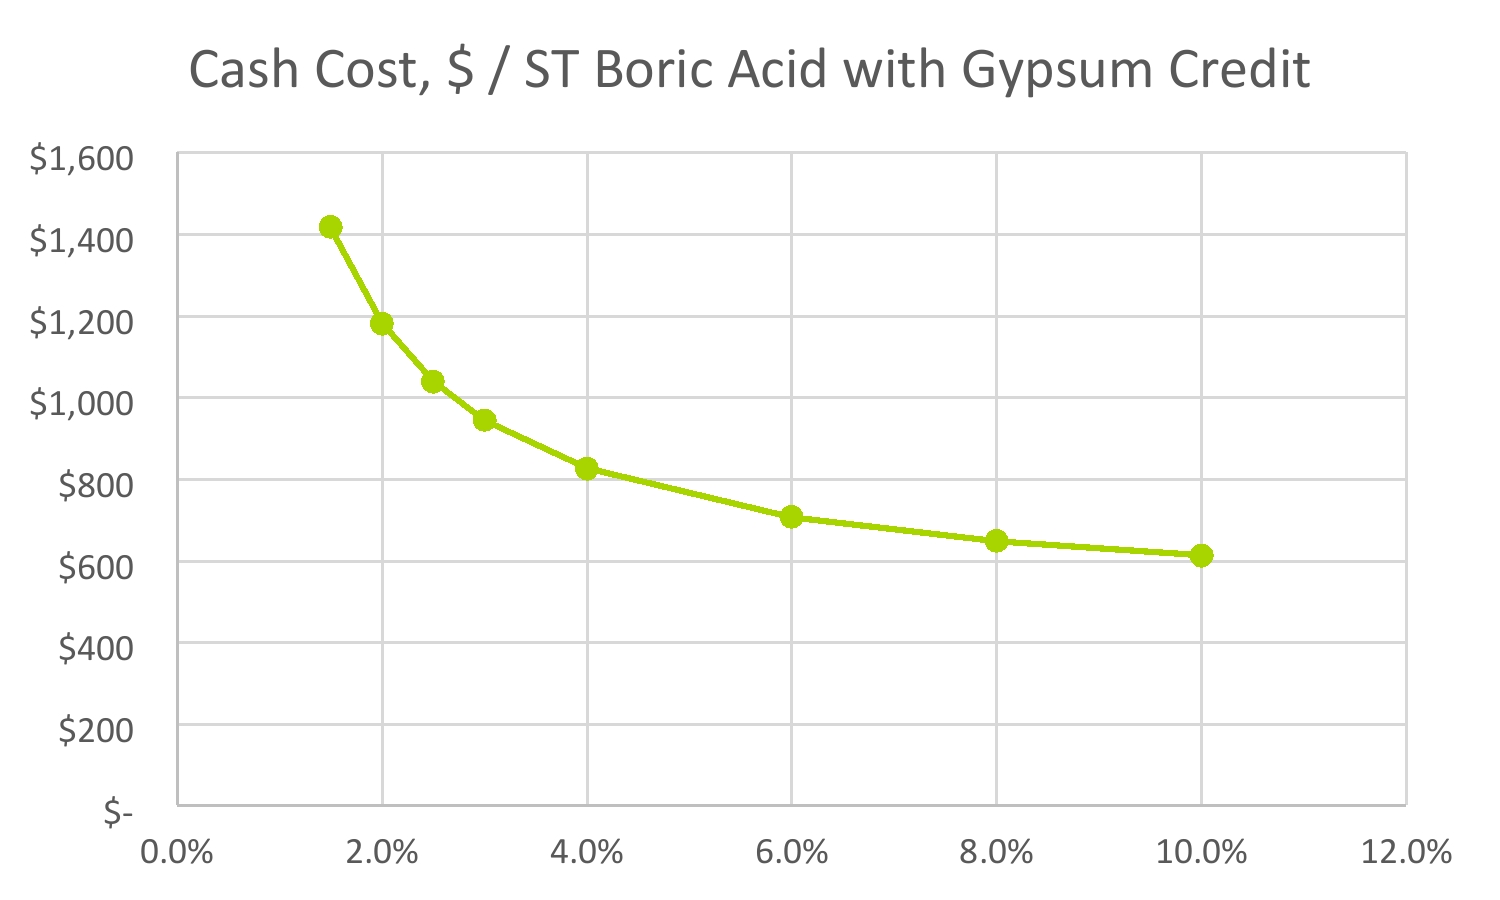
11.5 Mineral Resource Estimation
Results of the mineral resource estimation are shown in Table 11.7 (inclusive of mineral reserves) and Table 11.8 (exclusive of mineral reserves). Below, Figure 11.3 shows resource classification of the Project. The resource estimate for lands under mineral control by 5E contains a combined 177.3 million short tons of measured plus indicated resources with an average grade of 8.25% B2O3 and 312 ppm Li, using a 2.0% cut-off grade for B2O3. Average grades and lithium concentrations for aggregated classifications presented in this section are calculated by weighting each mineralized bed's grade by its contained product (in-situ boric acid or lithium carbonate equivalent, as applicable), rather than by ore tonnage. Mineral reserve grades presented in Section 12 are weighted by ore tonnage. The mineral resource estimate also identifies 4.2 million short tons of inferred resources under mineral control. Uncontrolled land (State of California Surface) contains approximately 22.4 million short tons of measured plus indicated resources and an inferred resource of 0.9 million short tons. The electrical transmission corridor contains 29.9 million short tons, and while SCE maintains control of the surface and resources to a depth of 500 ft, it does not impinge on 5E’s mineral rights for B2O3 and Li which occur at depths greater than 1,000 ft.
It is noted that these numbers are different to previous reports, which are ascribed to the change in cut-off grade as detailed in Section 11.4 and Section 3.6 as well as an increase in mineral tenure. Regulation S-K 1300 requires a current economic assessment to be completed which provides a reasonable basis for establishing the prospects of economic extraction of the mineral resource estimation.
67
Table 11.7: Fort Cady Project mineral resource estimate (inclusive of mineral reserves)*, Effective June 30, 2026
|
|
|
|
|
|
|
|
|
|
|
|
|
|
|
|
|
|
|
|
|
|
|
|
|
|
|
|
|
|
|
|
|
Classification Tons |
|
Product Tons–Measured |
|
Product Tons–Indicated |
|
Product Tons–Inferred |
||||||||
Property |
Bed |
Thick |
B₂O₃ |
H₃BO₃ |
Li |
LCE |
Tonnes |
Tons |
Measured |
Indicated |
Inferred |
|
B₂O₃ |
H₃BO₃ |
LCE |
|
B₂O₃ |
H₃BO₃ |
LCE |
|
B₂O₃ |
H₃BO₃ |
LCE |
|
UMH |
7.06 |
7.73 |
13.72 |
262.00 |
0.14 |
5,389,672 |
5,941,096 |
2,673,493 |
3,267,603 |
— |
|
206,580 |
366,886 |
3729 |
|
252,486 |
448,416 |
4,557 |
|
— |
— |
— |
Unpatented |
MMH |
31.31 |
8.99 |
15.97 |
374.00 |
0.20 |
23,883,147 |
26,326,663 |
11,846,998 |
14,479,665 |
— |
|
1,065,024 |
1,891,483 |
23,585 |
|
1,301,696 |
2,311,812 |
28,826 |
|
— |
— |
— |
Lode Claims |
IMH |
38.53 |
8.02 |
14.24 |
340.00 |
0.18 |
29,390,577 |
32,397,565 |
14,578,904 |
17,818,661 |
— |
|
1,169,139 |
2,076,390 |
26,385 |
|
1,428,947 |
2,537,810 |
32,249 |
|
— |
— |
— |
|
LMH |
28.32 |
9.02 |
16.02 |
232.00 |
0.12 |
21,607,945 |
23,818,683 |
10,718,407 |
13,100,275 |
— |
|
966,856 |
1,717,136 |
13237 |
|
1,181,713 |
2,098,722 |
16,178 |
|
— |
— |
— |
|
Sub-Total |
80,271,341 |
88,484,007 |
39,817,803 |
48,666,204 |
— |
|
3,407,599 |
6,051,895 |
66,935 |
|
4,164,843 |
7,396,761 |
81,810 |
|
— |
— |
— |
|||||
|
UMH |
2.96 |
6.60 |
11.72 |
250.60 |
0.13 |
5,237,458 |
5,773,309 |
2,472,388 |
3,101,236 |
199,686 |
|
163,178 |
289,803 |
3,298 |
|
204,682 |
363,514 |
4,137 |
|
13,179 |
23,406 |
266.38 |
Fee |
MMH |
15.25 |
8.23 |
14.62 |
323.00 |
0.17 |
26,938,158 |
29,694,236 |
12,865,519 |
15,809,116 |
1,019,601 |
|
1,058,832 |
1,880,486 |
22,121 |
|
1,301,090 |
2,310,736 |
27,182 |
|
83,913 |
149,030 |
1,753 |
Land |
IMH |
6.09 |
7.24 |
12.85 |
349.40 |
0.19 |
10,766,257 |
11,867,767 |
5,132,408 |
6,327,384 |
407,975 |
|
371,397 |
659,601 |
9,545 |
|
457,869 |
813,176 |
11,768 |
|
29,522 |
52,432 |
759 |
|
LMH |
8.11 |
8.63 |
15.33 |
222.90 |
0.12 |
14,326,177 |
15,791,907 |
6,888,713 |
8,363,283 |
539,911 |
|
594,514 |
1,055,857 |
8,173 |
|
721,773 |
1,281,869 |
9,922 |
|
46,596 |
82,754 |
641 |
|
Sub-Total |
57,268,050 |
63,127,220 |
27,359,028 |
33,601,019 |
2,167,173 |
|
2,187,921 |
3,885,747 |
43,138 |
|
2,685,414 |
4,769,296 |
53,010 |
|
173,211 |
307,622 |
3,419 |
|||||
|
UMH |
2.57 |
5.91 |
10.50 |
2.70 |
0.00 |
2,093,660 |
2,307,865 |
712,998 |
1,423,910 |
170,957 |
|
42,138 |
74,837 |
10 |
|
84,153 |
149,456 |
20 |
|
10,104 |
17,944 |
2 |
Power |
MMH |
22.06 |
7.83 |
13.91 |
277.00 |
0.15 |
17,959,378 |
19,796,826 |
6,433,014 |
12,076,479 |
1,287,333 |
|
503,705 |
894,580 |
9,485 |
|
945,588 |
1,679,365 |
17,806 |
|
100,798 |
179,018 |
1,898 |
Corridor |
IMH |
4.40 |
5.09 |
9.04 |
279.00 |
0.15 |
3,578,805 |
3,944,958 |
1,260,563 |
2,415,793 |
268,602 |
|
64,175 |
113,974 |
1,872 |
|
122,987 |
218,425 |
3,588 |
|
13,674 |
24,286 |
399 |
|
LMH |
4.25 |
7.83 |
13.90 |
250.00 |
0.13 |
3,457,554 |
3,811,301 |
1,196,680 |
2,343,151 |
271,469 |
|
93,662 |
166,344 |
1592 |
|
183,395 |
325,709 |
3,118 |
|
21,247 |
37,736 |
361 |
|
Sub-Total |
27,089,397 |
29,860,949 |
9,603,255 |
18,259,333 |
1,998,362 |
|
703,680 |
1,249,736 |
12,960 |
|
1,336,123 |
2,372,955 |
24,533 |
|
145,824 |
258,983 |
2,661 |
|||||
|
Total |
164,628,788 |
181,472,176 |
76,780,085 |
100,526,556 |
4,165,535 |
|
6,299,200 |
11,187,378 |
123,033 |
|
8,186,380 |
14,539,011 |
159,352 |
|
319,034 |
566,605 |
6,080 |
|||||
CA Surface |
UMH |
4.78 |
6.99 |
12.41 |
313.20 |
0.17 |
3,788,532 |
4,176,141 |
208,807 |
3,800,289 |
167,046 |
|
14,596 |
25,922 |
348 |
|
265,640 |
471,777 |
6,337 |
|
11,676 |
20,737 |
279 |
Section 36 |
MMH |
14.02 |
6.76 |
12.01 |
376.00 |
0.20 |
11,109,305 |
12,245,912 |
612,296 |
11,143,780 |
489,836 |
|
41,391 |
73,511 |
1225 |
|
753,320 |
1,337,896 |
22,303 |
|
33,113 |
58,809 |
980 |
(Uncontrolled) |
IMH |
4.88 |
3.66 |
6.50 |
340.30 |
0.18 |
3,869,438 |
4,265,325 |
213,266 |
3,881,446 |
170,613 |
|
7,804 |
13,860 |
386 |
|
142,029 |
252,244 |
7,031 |
|
6,243 |
11,088 |
309 |
|
LMH |
2.98 |
6.18 |
10.98 |
465.90 |
0.25 |
2,358,929 |
2,600,274 |
130,014 |
2,366,249 |
104,011 |
|
8,039 |
14,278 |
322 |
|
146,314 |
259,853 |
5,869 |
|
6,431 |
11,422 |
258 |
|
Uncontrolled Total |
21,126,204 |
23,287,653 |
1,164,383 |
21,191,764 |
931,506 |
|
71,830 |
127,570 |
2,282 |
|
1,307,303 |
2,321,769 |
41,540 |
|
57,464 |
102,056 |
1,826 |
|||||
* Denotes 2.0% cut-off. Aggregate average grades presented in the accompanying text are weighted by contained product rather than by ore tonnage. |
|||||||||||||||||||||||
68
In accordance with Item 1304(d)(2) of Regulation S-K, the following table presents mineral resources exclusive of mineral reserves. These figures represent total mineral resources as presented in Table 11.7, less the tonnage converted to proven and probable mineral reserves as presented in Section 12.
Table 11.8: Fort Cady Project mineral resource estimate (exclusive of mineral reserves)*, Effective June 30, 2026
|
|
|
|
|
|
|
|
|
|
|
|
|
|
|
|
|
|
|
|
|
|
|
|
|
|
|
|
|
|
|
|
|
Classification Tons |
|
Product Tons–Measured |
|
Product Tons–Indicated |
|
Product Tons–Inferred |
||||||||
Property |
Bed |
Thick |
B₂O₃ |
H₃BO₃ |
Li |
LCE |
Tonnes |
Tons |
Measured |
Indicated |
Inferred |
|
B₂O₃ |
H₃BO₃ |
LCE |
|
B₂O₃ |
H₃BO₃ |
LCE |
|
B₂O₃ |
H₃BO₃ |
LCE |
|
UMH |
7.06 |
7.73 |
13.72 |
262.00 |
0.14 |
5,389,672 |
5,941,096 |
2,673,493 |
3,267,603 |
— |
|
206,580 |
366,886 |
3729 |
|
252,486 |
448,416 |
4,557 |
|
— |
— |
— |
Unpatented |
MMH |
31.31 |
8.99 |
15.97 |
374.00 |
0.20 |
23,883,147 |
26,326,663 |
11,846,998 |
14,479,665 |
— |
|
1,065,024 |
1,891,483 |
23,585 |
|
1,301,696 |
2,311,812 |
28,826 |
|
— |
— |
— |
Lode Claims |
IMH |
38.53 |
8.02 |
14.24 |
340.00 |
0.18 |
29,390,577 |
32,397,565 |
14,578,904 |
17,818,661 |
— |
|
1,169,139 |
2,076,390 |
26,385 |
|
1,428,947 |
2,537,810 |
32,249 |
|
— |
— |
— |
|
LMH |
28.32 |
9.02 |
16.02 |
232.00 |
0.12 |
21,607,945 |
23,818,683 |
10,718,407 |
13,100,275 |
— |
|
966,856 |
1,717,136 |
13237 |
|
1,181,713 |
2,098,722 |
16,178 |
|
— |
— |
— |
|
Sub-Total |
80,271,341 |
88,484,007 |
39,817,803 |
48,666,204 |
— |
|
3,407,599 |
6,051,895 |
66,935 |
|
4,164,843 |
7,396,761 |
81,810 |
|
— |
— |
— |
|||||
|
UMH |
8.79 |
6.60 |
11.72 |
250.61 |
0.13 |
2,402,829 |
2,648,665 |
847,573 |
1,695,146 |
105,947 |
|
55,940 |
99,349 |
1,131 |
|
111,880 |
198,698 |
2,261 |
|
6,992 |
12,419 |
141.33 |
Fee |
MMH |
42.72 |
8.23 |
14.62 |
323.01 |
0.17 |
11,682,198 |
12,877,419 |
4,120,774 |
8,241,548 |
515,097 |
|
339,140 |
602,312 |
7,085 |
|
678,279 |
1,204,624 |
14,171 |
|
42,392 |
75,289 |
886 |
Land |
IMH |
17.23 |
7.24 |
12.85 |
349.40 |
0.19 |
4,712,057 |
5,194,153 |
1,662,129 |
3,324,258 |
207,766 |
|
120,277 |
213,612 |
3,091 |
|
240,554 |
427,224 |
6,183 |
|
15,035 |
26,701 |
386 |
|
LMH |
21.95 |
8.63 |
15.33 |
222.89 |
0.12 |
6,001,386 |
6,615,396 |
2,116,927 |
4,233,853 |
264,616 |
|
182,696 |
324,469 |
2,512 |
|
365,393 |
648,937 |
5,023 |
|
22,837 |
40,559 |
314 |
|
Sub-Total |
24,798,470 |
27,335,634 |
8,747,403 |
17,494,805 |
1,093,425 |
|
698,053 |
1,239,742 |
13,819 |
|
1,396,105 |
2,479,483 |
27,638 |
|
87,257 |
154,968 |
1,727 |
|||||
|
UMH |
8.97 |
5.91 |
10.50 |
2.67 |
0.00 |
1,192,999 |
1,315,056 |
276,162 |
867,937 |
170,957 |
|
16,321 |
28,986 |
4 |
|
51,295 |
91,100 |
12 |
|
10,104 |
17,944 |
2 |
Power |
MMH |
67.58 |
7.83 |
13.91 |
277.00 |
0.15 |
8,983,455 |
9,902,564 |
2,079,538 |
6,535,692 |
1,287,333 |
|
162,828 |
289,182 |
3,066 |
|
511,745 |
908,859 |
9,637 |
|
100,798 |
179,018 |
1,898 |
Corridor |
IMH |
14.10 |
5.09 |
9.04 |
279.00 |
0.15 |
1,874,394 |
2,066,166 |
433,895 |
1,363,669 |
268,602 |
|
22,089 |
39,231 |
644 |
|
69,424 |
123,297 |
2,025 |
|
13,674 |
24,286 |
399 |
|
LMH |
14.25 |
7.83 |
13.90 |
250.00 |
0.13 |
1,894,407 |
2,088,227 |
438,528 |
1,378,230 |
271,469 |
|
34,323 |
60,957 |
584 |
|
107,872 |
191,580 |
1,834 |
|
21,247 |
37,736 |
361 |
|
Sub-Total |
13,945,256 |
15,372,013 |
3,228,123 |
10,145,529 |
1,998,362 |
|
235,561 |
418,357 |
4,298 |
|
740,335 |
1,314,836 |
13,508 |
|
145,824 |
258,983 |
2,661 |
|||||
|
Total |
119,015,066 |
131,191,654 |
51,793,329 |
76,306,538 |
3,091,787 |
|
4,341,213 |
7,709,993 |
85,052 |
|
6,301,284 |
11,191,080 |
122,956 |
|
233,080 |
413,951 |
4,388 |
|||||
CA Surface |
UMH |
16.17 |
6.99 |
12.41 |
313.24 |
0.17 |
3,788,532 |
4,176,141 |
208,807 |
3,800,289 |
167,046 |
|
14,596 |
25,922 |
348 |
|
265,640 |
471,777 |
6,337 |
|
11,676 |
20,737 |
279 |
Section 36 |
MMH |
47.41 |
6.76 |
12.01 |
376.00 |
0.20 |
11,109,305 |
12,245,912 |
612,296 |
11,143,780 |
489,836 |
|
41,391 |
73,511 |
1225 |
|
753,320 |
1,337,896 |
22,303 |
|
33,113 |
58,809 |
980 |
(Uncontrolled) |
IMH |
16.51 |
3.66 |
6.50 |
340.32 |
0.18 |
3,869,438 |
4,265,325 |
213,266 |
3,881,446 |
170,613 |
|
7,804 |
13,860 |
386 |
|
142,029 |
252,244 |
7,031 |
|
6,243 |
11,088 |
309 |
|
LMH |
10.07 |
6.18 |
10.98 |
465.93 |
0.25 |
2,358,929 |
2,600,274 |
130,014 |
2,366,249 |
104,011 |
|
8,039 |
14,278 |
322 |
|
146,314 |
259,853 |
5,869 |
|
6,431 |
11,422 |
258 |
|
Uncontrolled Total |
21,126,204 |
23,287,653 |
1,164,383 |
21,191,764 |
931,506 |
|
71,830 |
127,570 |
2,282 |
|
1,307,303 |
2,321,769 |
41,540 |
|
57,464 |
102,056 |
1,826 |
|||||
* Denotes 2.0% cut-off. Aggregate average grades presented in the accompanying text are weighted by contained product rather than by ore tonnage. |
|||||||||||||||||||||||
69
Figure 11.3: Resource classification
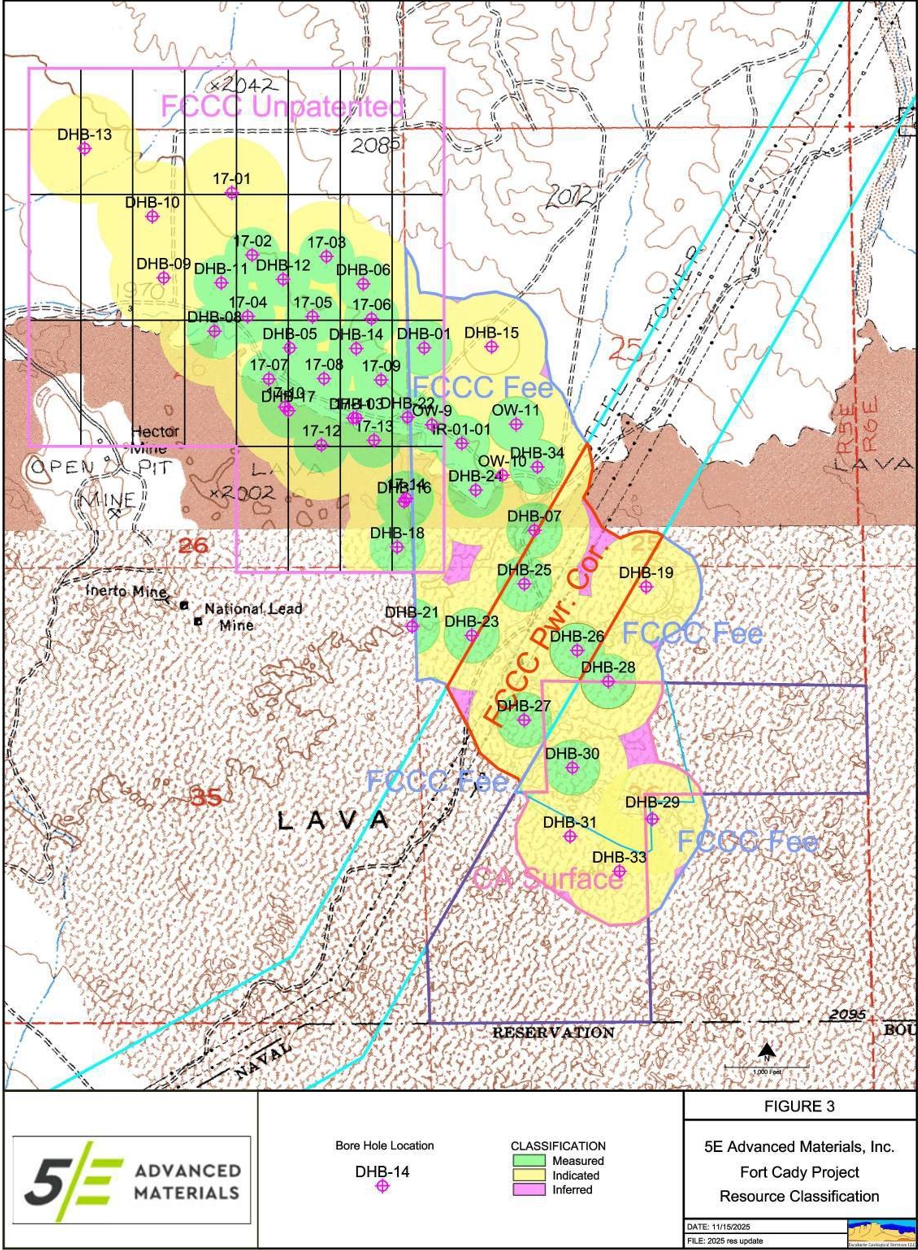
70
11.6 Uncertainties
The QP is not aware of any known environmental, permitting, legal, title, taxation, socio-economic, marketing, or other relevant factors or uncertainties that could affect the mineral resource estimate.
The accuracy of resources and reserve estimates is, in part, a function of the quality and quantity of available data and of engineering and geological interpretation and judgment. Given the data available at the time this report was prepared, the estimates presented herein are considered reasonable. However, they should be accepted with the understanding that additional data and analysis available after the date of the estimates may necessitate revision. These revisions may be material. There is no guarantee that all or any part of the estimated resources or reserves will be recoverable.
11.7 Individual Grade for Each Commodity
Included with Section 11.5.
11.8 Disclose Required Future Work
Approximately 97% of the deposit is measured plus indicated resources. Though there is potential to expand the resource with step-out drilling, there are more than sufficient resources defined to focus efforts on development and production.
12 Mineral Reserve Estimates
A detailed mine plan was prepared in Section 13 in support of mineral reserves. The EPA UIC permit subdivides the mineralized deposit into three blocks for development. Block 1 comprises the northwestern third of the orebody, Block 2 occupies the central portion of the orebody, and Block 3 comprises the southeastern third of the orebody. The SSF currently operates in Block 2 and Block 2 is permitted for mining with sufficient resources on fee-based lands and within the power corridor to convert resources to reserves on an economic basis, which provides for 37.5 years of mining life. To convert additional resources to reserves, Block 1 and Block 3 would need to be authorized by the EPA and a mine plan devised that includes this mineral tenure.
For economic modeling, a mine plan (Section 10) was designed where recovery and flow rates are sufficient to feed the chemical plant (Section 14) where PLS is converted to a finished refined borate product available for sale. Production output is within permitted parameters with forecasted revenue from borate sales based on a pricing forecast based on a preliminary market study commissioned by 5E, as discussed in Section 16 of this report.
The mine plan and wellfield optimization were based on third-party engineering work that incorporated 18 months of actual wellfield data from the SSF into the design and includes a bottoms-up capital estimate. A capital estimate was derived by Fluor for the inside and outside battery limits above ground and a total capital estimate was derived and incorporated into the economic analysis. The operating costs were derived from material and energy balances provided by Fluor as well as a bottoms-up labor build for human capital requirements. The revenue and cost inputs for the economic model were on a real basis and the economic model yields an NPV7 of $711 million.
12.1 Conversion Assumptions, Parameters, and Methods
All conversion assumptions such as plant efficiency, leaching efficiency, and mining efficiency were taken into consideration to calculate the reserve estimate.
The following steps and assumptions were used to calculate reserves:
71
Reserves are stated in-situ with a 2.0% cutoff grade established based on the analysis performed with mineral resources in Section 11. Cut-off was established using a long-term forecasted sales price of $1,350 per ton F.O.B. and a cash cost as detailed in Table 11.6 of $1,181 per short ton. The long-term price was obtained from a preliminary market study with the price of boric acid having increased, which has been driven by supply-demand fundamentals. B2O3 grade was captured from the measured and indicated grades of the fee-based land and power corridor.
12.2 Mineral Reserve Estimate
The mine plan considered measured and indicated resources with measured resources converted to proven reserves and indicated resources converted to probable reserves. The plan design results in 2.57 MSTs of boric acid proven reserve with a weighted average grade of 7.92% boric oxide, and 2.48 MSTs of boric acid probable reserve with a weighted average grade of 7.87% boric oxide. The mineral reserve statement, as of June 30, 2026, for the Fort Cady Project is presented in Table 12.3. Table 12.1 provides the proven mineral reserves and Table 12.2 provides the probable mineral reserves. The reference point for the mineral reserves is in-situ.
Table 12.1: Proven mineral reserves
|
|
|
|
|
|
|
|
Proven Mineral Reserves |
|||||||
Bed |
Mean Mineralized Bed Thickness |
Avg. B₂O₃ Grade |
Insoluble Material Grade |
Mineralized Bed Volume |
Recoverable Mineralized Bed Volume |
B₂O₃ Reserve |
H₃BO₃ Reserve |
UMH |
9.58 |
6.47 |
14.3 |
3,304,965 |
2,571,428 |
98,450 |
174,848 |
MMH |
70.13 |
8.10 |
24.5 |
26,343,664 |
20,496,688 |
784,743 |
1,393,703 |
IMH |
19.47 |
6.93 |
29.3 |
7,282,993 |
5,666,533 |
216,950 |
385,304 |
LMH |
23.25 |
8.53 |
45.6 |
11,703,147 |
9,105,634 |
348,621 |
619,151 |
Table 12.2: Probable mineral reserves
|
|
|
|
|
|
|
|
Probable Mineral Reserves |
|||||||
Bed |
Mean Mineralized Bed Thickness |
Avg. B₂O₃ Grade |
Insoluble Material Grade |
Mineralized Bed Volume |
Recoverable Mineralized Bed Volume |
B₂O₃ Reserve |
H₃BO₃ Reserve |
UMH |
9.58 |
6.42 |
14.3 |
3,121,287 |
2,428,517 |
92,979 |
165,131 |
MMH |
70.13 |
8.06 |
24.5 |
26,246,406 |
20,421,016 |
781,846 |
1,388,558 |
IMH |
19.47 |
6.82 |
29.3 |
6,728,406 |
5,235,036 |
200,430 |
355,964 |
LMH |
23.25 |
8.49 |
45.6 |
10,728,126 |
8,347,018 |
319,577 |
567,568 |
Table 12.3: Mineral reserve statement
|
|
|
|
|
|
|
Proven and Probable Mineral Reserves |
||||||
Reserve |
Avg. B₂O₃ Grade |
Insoluble Material Grade |
Mineralized Bed Volume |
Recoverable Mineralized Bed Volume |
B₂O₃ Reserve |
H₃BO₃ Reserve |
Proven |
7.92 |
29.6 |
48,634,769 |
37,840,283 |
1,448,764 |
2,573,006 |
Probable |
7.87 |
29.3 |
46,824,225 |
36,431,587 |
1,394,832 |
2,477,221 |
72
See Table 11.7 for total mineral resources inclusive of mineral reserves, and Table 11.8 for mineral resources exclusive of mineral reserves, presented in accordance with Item 1304(d)(2) of Regulation S-K.
12.3 Relevant Factors
The reserve statement herein is subject to potential change based on changes to the forward-looking cost and revenue assumptions utilized in this Technical Report Summary (TRS). It is assumed that 5E will produce and sell borates to customers once the LSBF is constructed, commissioned, and in operation. Full extraction of this reserve is dependent upon the modification of the UIC permit to include the finalized mine plan based on the learnings obtained from the Company’s horizontal wells. 5E obtained a minor modification and authorization to drill the horizontal and sidetrack program in July 2025 and it is 5E’s expectation that it will be successful in modifying the UIC permit. In the QP’s opinion, 5E’s expectation is reasonable. The evaporation ponds incorporated into the design of the LSBF and placed on 5E’s fee-based land require a waste discharge permit (WDR) with the Lahontan Regional Water Quality Control Board. 5E had a WDR for evaporation ponds and 5E expects to obtain the WDR for the evaporation ponds to remove calcium and sodium. In the QP’s opinion, 5E’s expectation is reasonable.
The QP is not aware of other existing environmental, permitting, legal, socio-economic, marketing, political, or other factors that might materially affect the in-situ mineral reserve estimate. An increase to mineral reserves is possible as the current mine plan only captures approximately 41% of the resource. Additionally, an exploration target is available which, with further exploration work, could increase the resource and provide potential to increase the mineral reserves.
The mineral reserve statement herein, effective June 30, 2026, supersedes the initial mineral reserve statement for the Project, which had an effective date of August 4, 2025. Total proven and probable mineral reserves decreased approximately 5%, from 5.34 million short tons to 5.05 million short tons of boric acid, and the initial life of mine decreased from 39.5 years to 37.5 years. Proven mineral reserves increased from 1.35 million short tons to 2.57 million short tons and probable mineral reserves decreased from 3.98 million short tons to 2.48 million short tons, reflecting the reclassification of certain indicated mineral resources to measured mineral resources within the mine plan area, as described in Section 11, and further refinement and geologic modeling of the mine plan wellfield. Cut-off grade, recovery efficiencies, commodity price assumptions, and the capital estimate were unchanged between the two statements.
13 Mining Methods
Given the geological and stratigraphic suitability, the Project will be employing ISL as its mining method to recover borates from the mineralized horizons. Depth and grade of the deposit precludes conventional mining techniques such as open pit and underground mining as effective methods for economical extraction of ore. With ISL mining, there is no stripping of waste rock or underground development required for the Project. Mine development steps include drilling and constructing of injection/recovery wells (IR Wells), installing pumping or airlifting extraction equipment on wells, and piping to transport leach solutions to the wellfield and PLS to the chemical plant for processing. Mining fleet and machinery are not required for the Project.
The process designed by 5E and Fluor assumed an initial production rate of 130,000 stpa boric acid. This production rate should correspond to 880 – 900 gallons/min of PLS to the processing plant, assuming a head grade of 10.2% weight boric acid in the PLS (160°F), and 95.1% yield of boric acid in the processing plant. This translates to a minimum of 100 gpm production from at least nine wells during recovery phase of injection cycles when operating under the proven cyclic injection-residence-recovery well operation. Required well production capacity will be minimized when recovering from dedicated production wells outside of the cyclic cycle and/or during continuous mining operation of horizontal wells.
Based on the results of operating the SSF injection – recovery wells and preliminary work completed by 5E, the LSBF calls for the installation of 27 directional wells targeting the upper mineralized horizon (UMH), major mineralized horizon
73
(MMH), and lower mineralized horizon (LMH) spaced at 200-ft horizontal offset and 120 – 180-ft vertical spacing. Operating strategy of the wells will focus on high-grade mineralization zone cavern development through continuous injection and cyclic push-pull mechanics. These wells are to operate as injection and recovery wells whereby injection and recovery of lixiviant through separate horizontal wellbores and full reservoir contact is accomplished by geo-steered laterals in a “fishbone” pattern and positively intercepting each well. The leach solution (lixiviant) is pumped into the well and, after a prescribed residence time, is retrieved from the same well, or offset wells as caverns develop, for processing. This method will be used until the dissolution of the colemanite in the deposit progresses to where complete reservoir flow is established between regional groups of wells.
13.1 Geotechnical and Hydrological Model Contribution to Mine Design
The mineralized body exists in four major evaporite sequences totaling approximately 108-ft thickness and comprised of interbedded layers of claystone, anhydrite, heulandite, biotite, quartz, and muscovite, inhibiting permeability. The Major Mineralized Horizon contains 40 – 60% colemanite in nearly continuous 50 – 60-ft thick intervals providing the basis for targeting for primary wells. Upper Mineralized Horizon (UMH) contains 30 – 50% colemanite in semi-continuous 15 – 20-ft thick intervals interbedded with associated insoluble material providing the targeting basis secondary wells. Lower Mineralized Horizon (LMH) contains 40 – 60% colemanite in nearly-continuous 15 – 18-ft thick intervals. The Intermediate Mineralized Horizon (IMH) is in the target range with the MMH for wellfield development and mine planning.
Static geotechnical model and drilling programs indicate orebody deposition exists in stratigraphically continuous beds at an 8 – 10° NE – SW inclination. Regional water monitoring wells have indicated solution migration and pore pressure transmission along this inclination of the orebody from IR Wells via transducer response from monitoring wells. Micro-deformation instrumentation has provided fluid migration via plume tracking of injected fluids to confirm orebody dip migration of lixiviant. Incorporating an operating strategy to utilize injection wells with the end of the well placed up-dip provides the opportunity to leverage the downward dip of the 8 – 10° inclination to ensure solvent flows downward through the orebody dissolving colemanite. Since production wells down-dip and the plan equips the bottom of wells with jet pumps to efficiently lift the PLS to surface, this operating strategy utilizes the natural 8 – 10° inclination and gravity to assist with recovery. This knowledge supports a mine plan for a 27-well network to manage cavity formation and maintain artificial lift when operating wells within each horizon.
Well planning of mineralized horizons and the sequence of the drilling program utilize directional drilling to target MMH/IMH in a primary set of IR Wells in 90 – 92° trajectory drilled along the strike of orebody, perpendicular to the 8 – 10° structural dip/inclination. The horizontal well’s extended reach along the strike enables multiple injection/production points via perforated intervals and slotted liners promoting uniform dissolution of colemanite and ensures effective leaching across a wider area than vertical well patterns. Gravity driven flow of the solvent from up-dip wells to dedicated production wells at lower elevations de-risks fluid injection leak off concerns and higher probability of fluid capture, which is necessary for maintaining hydraulic gradient per the EPA UIC permit.
Vertical production wells have indicated that wellbore collapse due to collapsing clay will not occur if the operating strategy is followed. Reservoir re-charge to wellbore is greater than geo-mechanical collapse stress and is evident during recovery phase of production cycles. Pilot horizontal wells will run geophysical logging tools to quantify degree of geo-mechanical collapse stresses and jet pump deployment will confirm quantification. Given the estimated degree of geo-mechanical stability within the mineralized zones, directional and horizontal wellbores become feasible as tools of scaling to increase contact area by a factor of 20X with a 3,450-ft lateral well and permeability driven sustainable injection rates of +100 gpm.
13.2 Artificial Lift
Current recovery method at the SSF wellfield is airlifting solution using compressed air injected into production tubing to force fluids up the backside annulus of the well between 7-in casing and production tubing. Average recovery rates are approximately 15 – 20 gpm and heavily rely on reservoir pressure to maintain higher recovery rates. The LSBF design
74
includes installation of jet pump systems due to proven designs with artificial lift in oil and gas fields and ability to recover higher rates of PLS needed for commercial plant design.
Hydraulic jet pumps are planned as the primary means of PLS recovery from the orebody when reservoir pressure has not been maintained for adequate recovery rates between a network of communicating wells within a target horizon. Each dual use IR Well and dedicated production well will contain a jet pump BHA (bottom-hole assembly) constructed of corrosion resistant alloy (CRA) and the possible addition of corrosion inhibitor to ensure adequate production rates of PLS. Jet pumps have no moving parts and operate using a high-pressure fluid to create a Venturi effect, drawing reservoir fluids into the pump and lifting to the surface.
Each jet pump will consist of a nozzle, throat, and diffuser. High-pressure power fluid is pumped from the surface through the nozzle, creating a high velocity, low-pressure jet which draws in corrosive reservoir PLS from the wellbore and mining region in the absence of reservoir pressure. The mixed fluids (power fluid + PLS) pass through the diffuser where kinetic energy is converted back to pressure, enabling the fluid to be lifted to surface. The absence of moving parts reduces the need for maintenance and the ability of the jet pumps to tolerate solids without significant wear. The diagram in Figure 13.1 below provides the assembly structure of the jet pump.
Typical jet pump systems in oil and gas applications are frequently used to produce residual acid with minimal erosion and corrosion to conventional steel designs. 5E has designed a prototype convention jet pump and has successfully tested in a laboratory based environment and has begun initial field tests with favorable results. Full field trials are required to confirm assumed recovery rates.
Figure 13.1: jet pump assembly
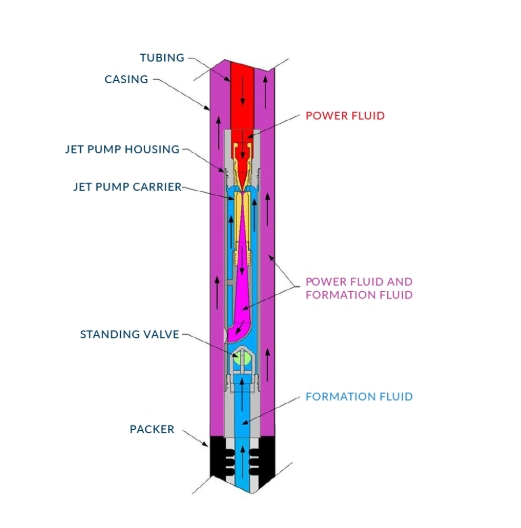
13.3 Wellfield Operating Strategy
The wellfield will be operating under an artificially induced reservoir pressure environment with the main objective of maintaining a high enough productivity index while remaining below the established fracture gradient. Maintenance of reservoir pressure will be key to achieving adequate recovery rates of PLS from each targeted horizon, particularly for offset wells within direct communication where displacement of reacted HCl will need to be recovered at surface. The network of 27 jet pumps will be key to maintaining the ability of the orebody to deliver fluids to the wellbore by recovering fluid during production phase and circulation of unspent or reacted HCl during injection phase.
In addition to recovery rate of fluids, the installation of a jet pump network provides the ability to maintain a high temperature power fluid to the reservoir fluid and maintain a critical temperature needed for boric acid to remain in solution. Installation of the centralized surface facility (CSF) will supply high-pressure power fluid to multiple jet pumps
75
across the 27 well network, recovering and circulating fluid as needed. After lifting at-grade PLS to surface, the power fluid and produced fluid are separated at surface with PLS directed towards plant and lower concentration PLS recycled and directed towards the next group of wells undergoing recovery operations.
Dissolution kinetics of the rate at which colemanite dissolves and boron is extracted assumes that the solid colemanite particle reacts with HCl, and the reaction front moves inward as mineralized particles dissolve. Geo-steered wells adjust the wellbore path using measurement while drilling (MWD) and logging while drilling (LWD) technology to ensure the well stays within target horizon. The rate of dissolution is mainly controlled by film diffusion of HCl through the liquid boundary layer, underground surface reaction between HCl and colemanite, and diffusion of reaction products through a porous layer of undissolved precipitates. To progressively leach the orebody in required amounts, greater volumes of fluid will need to be injected to replace previously leached volume and contact new colemanite. The underground surface chemical reaction is the rate-controlling step because the reaction at the colemanite surface is slower than the diffusion of HCl to the mineralized particle or removal of products, thus resource temperature needs to be maintained at dissolution levels to produce required head grades. Table 13.1 below provides the parameters for which the wellfield operating strategy will be deployed, and Figure 13.2 provides the first-year production rates per cycle.
Table 13.1: Wellfield operating strategy mining parameters
|
|
|
|
|
|
Well Group |
Unit |
MMH |
UMH |
LMH |
IMH |
Geologic Unit |
horizon |
Major |
Upper |
Lower |
Intermediate |
Colemanite Reserve |
tons |
3,270,047 |
501,765 |
1,780,099 |
1,122,736 |
MMH Reserve, H₃BO₃ |
tons |
2,613,737.67 |
401,058.83 |
1,422,827.36 |
897,399.29 |
No. of Wells |
each |
9.00 |
9.00 |
9.00 |
* accounted in MMH |
Well Completion |
type |
Open-Hole, limited entry perforated tubing, liner hanger |
Open-Hole, limited entry perforated tubing, liner hanger |
Open-Hole, limited entry perforated tubing, liner hanger |
Open-Hole, limited entry perforated tubing, liner hanger |
Avg Length |
ft |
3,450 |
3,450 |
3,450 |
3,450 |
Avg Thickness |
ft |
61.18 |
9.08 |
20.27 |
17.20 |
Group Injection Rate |
gpm |
1,125 |
1,170 |
1,350 |
1,125 |
Group Production Rate |
gpm |
1,125 |
1,170 |
1,350 |
1,125 |
H₃BO₃ tons per year (tpy) |
tons |
43,333 |
43,333 |
43,333 |
* |
Colemanite Mass Leached, tpy |
tons |
74,377 |
77,352 |
89,252 |
* |
Horizon Life |
years |
43.97 |
6.49 |
19.94 |
* |
Mining Efficiency |
% |
95.0 |
95.0 |
95.0 |
* |
Leaching Efficiency |
% |
81.9 |
81.9 |
81.9 |
* |
Plant Efficiency |
% |
95.1 |
95.1 |
95.1 |
* |
Dedicated Injection Wells |
each |
1.0 |
— |
— |
* |
Dedicated Production Wells |
each |
1.0 |
— |
— |
* |
Dual Injection/Recovery Wells |
each |
7.00 |
9.00 |
9.00 |
* |
* Accounted for in MMH |
|
|
|
|
|
76
Figure 13.2: Year 1 production rates per cycle
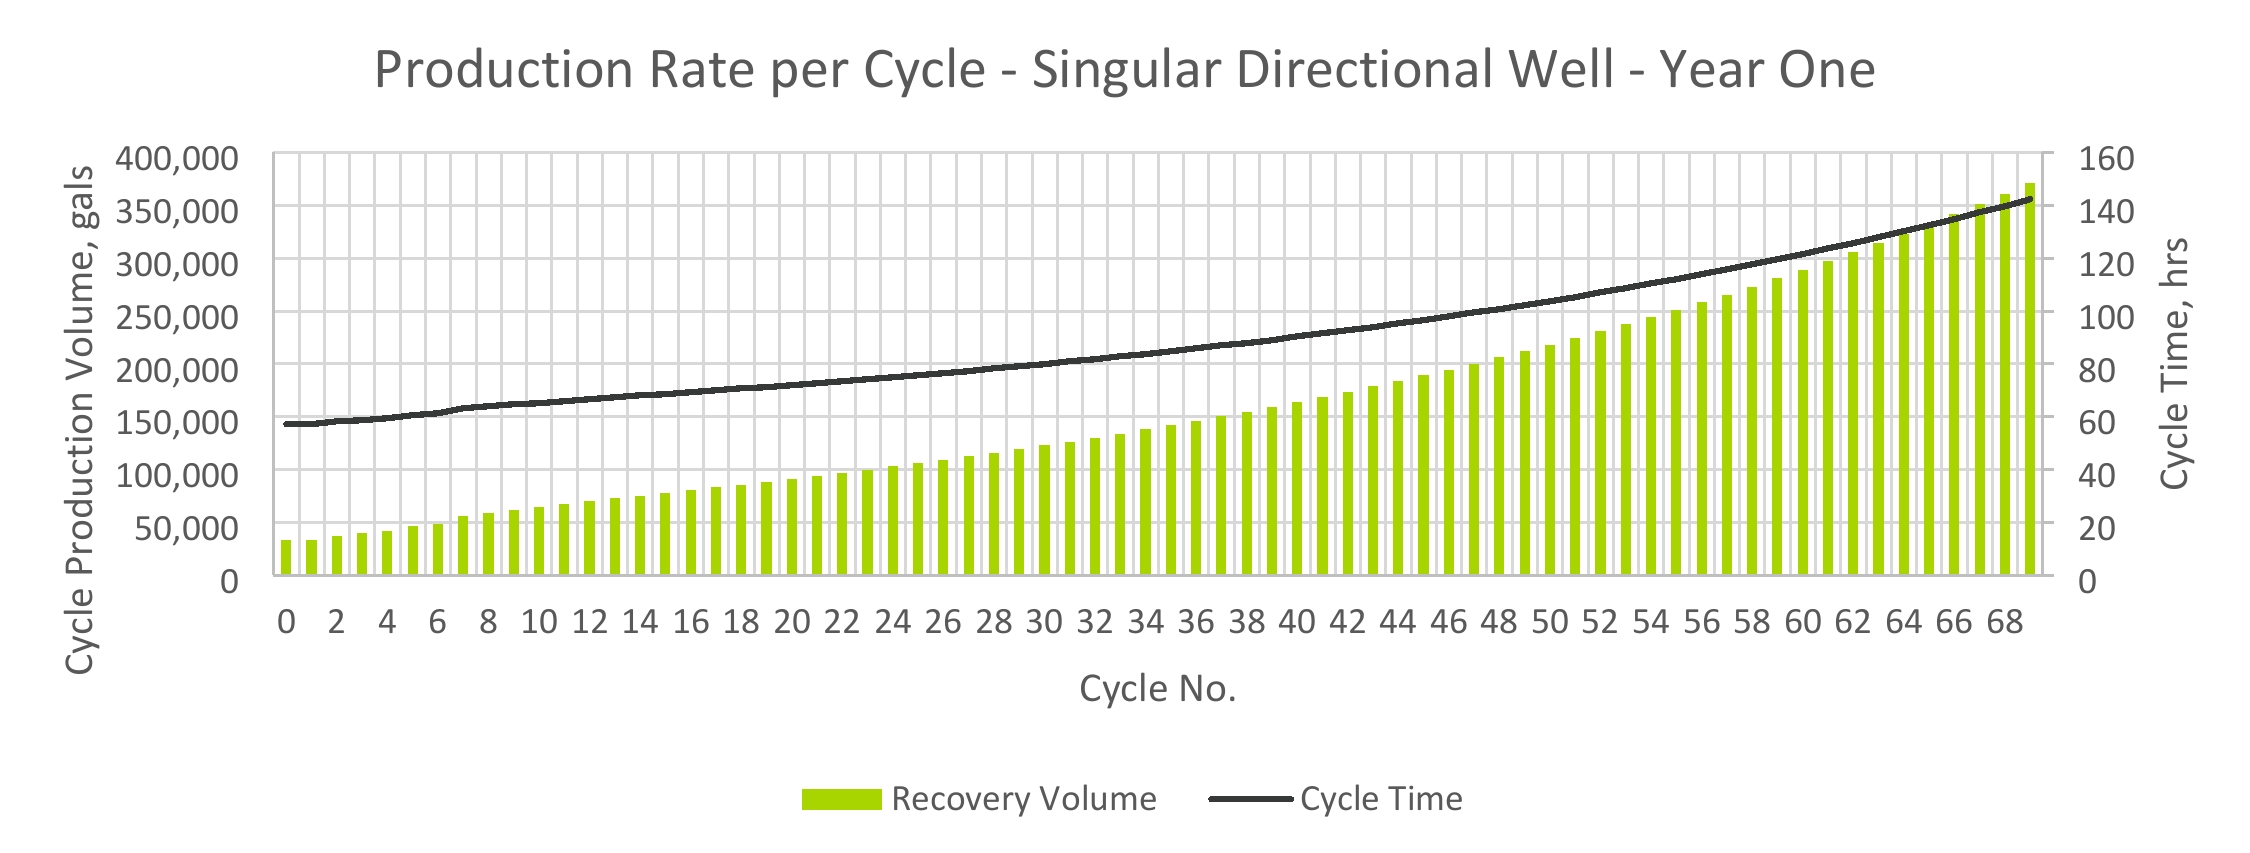
The mine plan utilizes in-situ leaching operations via lixiviant solutions to mine the colemanite resource in place without physically removing large volumes of ore or overburden. The process relies on the natural and enhanced permeability of the deposit to allow leaching solution to flow through and dissolve targeted mineralization. Solution mining accesses the colemanite deposit through wells drilled into the orebody, where leaching solution is then injected directly into the mineralized zone. The colemanite mineral’s moderate solubility combined with its geological and stratigraphic suitability allows leaching solutions to extract boron without stripping the surface or backfilling voids from underground development.
Mine recovery rate (leaching efficiency) of 81.9% is applied to account for losses for leaching solution not reaching and reacting with the ore body, as well as for non-recoverable saturated solution underground. This is based on studies conducted by 5E, Hazen, and MSME. Leaching efficiency requires lixiviant to contact colemanite, therefore an additional “mining efficiency” factor for fluid to contact colemanite probability has been introduced to account for reduction anomalies due to wellbore traversing in lower grade zones or discontinuous colemanite beds along horizontal well paths. The mining efficiency factor is based on drilling experience during a 3000 ft horizontal well and sidetrack program deployed in July 2025 which tested drill cuttings using ICP-OES and confirmed approximately 95% of the wellbore was in the planned zone. Table 13.2 below provides the ICP-OES results from the horizontal well program.
77
Table 13.2: Horizontal well program ICP-OES results (July 7, 2025)
|
|
|
|
|
|
|
|
|
|
|
|
|
|
|
|
|
|
|
|
Test Sample ID |
Depth |
Date |
Test Date |
Al |
As |
B |
B |
Ca |
Fe |
K |
Li |
Mg |
Mn |
Na |
S |
Si |
Sr |
Ti |
Zn |
7092563 |
1090-1100 |
7/7/2025 |
7/17/2025 |
1,429 |
49 |
261 |
0.1% |
125,607 |
2,233 |
6,279 |
— |
1,896 |
590 |
4,802 |
>38,702 |
2,485 |
6,210 |
21 |
— |
7092562 |
1190-1200 |
7/7/2025 |
7/17/2025 |
954 |
133 |
370 |
0.2% |
101,618 |
2,752 |
6,026 |
— |
1,795 |
347 |
9,440 |
>43,670 |
1,462 |
6,224 |
— |
— |
7092561 |
1220-1230 |
7/7/2025 |
7/17/2025 |
1,073 |
96 |
451 |
0.3% |
100,893 |
1,852 |
7,782 |
— |
2,058 |
272 |
6,911 |
>42,540 |
1,478 |
8,714 |
— |
— |
7092560 |
1230-1240 |
7/7/2025 |
7/17/2025 |
1,179 |
192 |
567 |
0.3% |
113,484 |
3,433 |
7,240 |
— |
2,002 |
332 |
8,914 |
>42,951 |
1,515 |
3,806 |
— |
— |
7092559 |
1240-1250 |
7/7/2025 |
7/17/2025 |
2,308 |
67 |
602 |
0.3% |
45,406 |
2,611 |
10,940 |
— |
2,146 |
186 |
13,398 |
>27,689 |
1,554 |
7,538 |
— |
— |
7092558 |
1250-1260 |
7/7/2025 |
7/17/2025 |
1,206 |
111 |
603 |
0.3% |
99,541 |
3,605 |
9,300 |
— |
2,056 |
474 |
6,951 |
>41,829 |
1,191 |
2,783 |
— |
— |
7092557 |
1260-1270 |
7/7/2025 |
7/17/2025 |
1,419 |
123 |
774 |
0.4% |
135,328 |
3,629 |
9,211 |
— |
1,710 |
446 |
7,660 |
>43,335 |
1,271 |
4,382 |
— |
— |
7092556 |
1270-1280 |
7/7/2025 |
7/17/2025 |
1,572 |
123 |
1,040 |
0.6% |
116,244 |
3,276 |
8,530 |
— |
1,683 |
425 |
8,870 |
>43,810 |
1,147 |
2,761 |
— |
— |
7092555 |
1280-1290 |
7/7/2025 |
7/17/2025 |
1,646 |
88 |
390 |
0.2% |
82,825 |
2,059 |
11,775 |
— |
1,868 |
277 |
7,276 |
>44,076 |
1,514 |
3,686 |
— |
— |
7092554 |
1290-1300 |
7/7/2025 |
7/17/2025 |
1,325 |
84 |
600 |
0.3% |
103,330 |
2,181 |
4,191 |
— |
1,713 |
303 |
4,821 |
>43,003 |
1,679 |
4,099 |
— |
— |
7092553 |
1370-1380 |
7/7/2025 |
7/17/2025 |
1,380 |
125 |
810 |
0.5% |
113,453 |
2,612 |
9,955 |
— |
2,714 |
300 |
9,277 |
>42,004 |
— |
12,491 |
— |
— |
7092552 |
1380-1390 |
7/7/2025 |
7/17/2025 |
913 |
202 |
822 |
0.5% |
156,475 |
2,809 |
8,358 |
— |
2,303 |
334 |
6,742 |
>42,702 |
1,288 |
13,441 |
— |
— |
7092551 |
1390-1400 |
7/7/2025 |
7/17/2025 |
1,565 |
323 |
1,205 |
0.7% |
128,577 |
4,084 |
8,446 |
— |
2,608 |
296 |
9,043 |
>42,849 |
1,397 |
11,787 |
— |
— |
7092550 |
1400-1410 |
7/7/2025 |
7/17/2025 |
838 |
206 |
10,478 |
6.0% |
175,003 |
2,289 |
8,333 |
— |
1,996 |
306 |
5,845 |
>44,070 |
1,292 |
13,966 |
— |
— |
7092549 |
1410-1420 |
7/7/2025 |
7/17/2025 |
1,041 |
162 |
9,456 |
5.4% |
147,142 |
2,307 |
7,282 |
— |
2,652 |
280 |
7,079 |
>43,938 |
1,572 |
4,219 |
— |
— |
7092548 |
1420-1430 |
7/7/2025 |
7/17/2025 |
1,289 |
169 |
7,031 |
4.0% |
123,375 |
3,127 |
8,459 |
— |
2,642 |
277 |
7,845 |
>44,396 |
1,564 |
7,765 |
— |
— |
7092547 |
1430-1440 |
7/7/2025 |
7/17/2025 |
1,198 |
116 |
5,288 |
3.0% |
173,385 |
1,858 |
7,458 |
— |
2,691 |
287 |
7,329 |
>43,984 |
1,410 |
10,056 |
— |
— |
7092546 |
1440-1450 |
7/7/2025 |
7/17/2025 |
781 |
115 |
11,449 |
6.5% |
157,714 |
1,256 |
6,834 |
— |
1,983 |
263 |
6,230 |
>42,023 |
1,080 |
8,933 |
— |
— |
7092545 |
1530-1540 |
7/7/2025 |
7/15/2025 |
649 |
141 |
16,792 |
9.6% |
192,185 |
1,343 |
5,246 |
— |
1,398 |
183 |
405 |
>52,789 |
1,079 |
17,493 |
— |
— |
7092544 |
1550-1560 |
7/7/2025 |
7/15/2025 |
1,378 |
163 |
7,387 |
4.2% |
176,049 |
2,547 |
7,565 |
— |
1,725 |
194 |
1,957 |
>52,386 |
1,599 |
10,261 |
— |
220 |
7092543 |
1580-1590 |
7/7/2025 |
7/15/2025 |
813 |
74 |
17,522 |
10.0% |
>206,819 |
1,248 |
2,417 |
— |
947 |
193 |
377 |
>51,705 |
1,331 |
10,044 |
— |
163 |
7092542 |
1690-1700 |
7/7/2025 |
7/15/2025 |
493 |
133 |
7,901 |
4.5% |
>197,773 |
2,106 |
3,969 |
— |
1,332 |
160 |
2,966 |
>49,443 |
1,617 |
14,302 |
— |
167 |
7092541 |
1780-1800 |
7/7/2025 |
7/15/2025 |
— |
87 |
4,274 |
2.4% |
201,932 |
1,936 |
4,191 |
— |
1,054 |
212 |
866 |
>54,254 |
1,379 |
13,362 |
— |
230 |
7092540 |
1800-1820 |
7/7/2025 |
7/15/2025 |
401 |
166 |
10,417 |
6.0% |
>206,458 |
2,923 |
4,377 |
— |
1,486 |
455 |
1,700 |
>51,615 |
1,727 |
18,578 |
— |
156 |
7092539 |
1820-1840 |
7/7/2025 |
7/14/2025 |
292 |
197 |
35,684 |
20.4% |
>167,183 |
2,618 |
6,990 |
— |
1,501 |
273 |
4,580 |
>41,796 |
1,529 |
17,113 |
— |
— |
7092538 |
1840-1860 |
7/7/2025 |
7/14/2025 |
310 |
189 |
35,610 |
20.4% |
>153,839 |
2,720 |
6,670 |
— |
1,476 |
265 |
4,458 |
>38,460 |
1,416 |
17,058 |
— |
— |
7092537 |
1860-1880 |
7/7/2025 |
7/14/2025 |
718 |
141 |
42,442 |
24.3% |
>159,921 |
3,284 |
6,309 |
— |
1,427 |
210 |
2,841 |
>39,980 |
1,219 |
14,588 |
— |
— |
7092536 |
1880-1900 |
7/7/2025 |
7/14/2025 |
605 |
126 |
23,761 |
13.6% |
>167,104 |
2,202 |
6,204 |
— |
1,328 |
221 |
2,285 |
>41,776 |
1,035 |
15,672 |
— |
— |
7092535 |
1900-1920 |
7/7/2025 |
7/14/2025 |
582 |
132 |
29,091 |
16.6% |
>17,895 |
2,140 |
6,331 |
— |
1,355 |
266 |
2,968 |
>44,724 |
1,401 |
18,983 |
— |
— |
7092534 |
1920-1940 |
7/7/2025 |
7/14/2025 |
997 |
171 |
19,077 |
10.9% |
133,397 |
2,811 |
11,536 |
— |
1,737 |
196 |
2,653 |
>43,156 |
1,209 |
15,413 |
— |
— |
7092533 |
1940-1960 |
7/7/2025 |
7/9/2025 |
— |
192 |
33,517 |
19.2% |
>155,231 |
1,875 |
6,611 |
90 |
1,074 |
145 |
1,347 |
>38,808 |
1,075 |
15,226 |
82 |
— |
7092532 |
1960-1980 |
7/7/2025 |
7/9/2025 |
63 |
222 |
49,058 |
28.0% |
>155,569 |
2,222 |
6,539 |
91 |
1,013 |
105 |
1,056 |
>38,892 |
656 |
13,455 |
80 |
— |
7092531 |
1980-2000 |
7/7/2025 |
7/9/2025 |
304 |
379 |
10,202 |
5.8% |
>138,112 |
1,909 |
8,576 |
91 |
1,429 |
128 |
1,505 |
>34,528 |
4,611 |
8,094 |
75 |
— |
7092530 |
2000-2020 |
7/7/2025 |
7/9/2025 |
157 |
155 |
19,179 |
11.0% |
>137,156 |
1,691 |
8,113 |
87 |
1,409 |
94 |
1,937 |
>34,289 |
811 |
7,930 |
69 |
— |
7092529 |
2020-2040 |
7/7/2025 |
7/9/2025 |
277 |
176 |
17,087 |
9.8% |
>141,037 |
2,278 |
11,755 |
104 |
1,667 |
61 |
3,343 |
>39,921 |
1,158 |
10,534 |
86 |
— |
7092528 |
2040-2060 |
7/7/2025 |
7/9/2025 |
— |
163 |
43,631 |
24.9% |
>161,324 |
1,237 |
6,670 |
89 |
988 |
85 |
1,989 |
>40,331 |
912 |
15,596 |
79 |
— |
7092527 |
2060-2080 |
7/7/2025 |
7/9/2025 |
75 |
191 |
16,692 |
9.5% |
>156,423 |
2,009 |
9,584 |
88 |
1,246 |
139 |
2,552 |
>39,106 |
1,028 |
11,085 |
81 |
— |
7092526 |
2100-2120 |
7/7/2025 |
7/9/2025 |
— |
158 |
16,692 |
9.5% |
>155,883 |
1,353 |
6,995 |
93 |
1,215 |
97 |
2,268 |
>38,971 |
1,010 |
12,078 |
77 |
— |
7092525 |
2180-2200 |
7/7/2025 |
7/9/2025 |
— |
122 |
16,918 |
9.7% |
>157,460 |
830 |
2,519 |
75 |
762 |
48 |
— |
>39,365 |
727 |
8,635 |
76 |
— |
7092524 |
2220-2240 |
7/7/2025 |
7/9/2025 |
— |
141 |
27,287 |
15.6% |
>158,720 |
1,072 |
2,392 |
82 |
752 |
37 |
248 |
>39,680 |
1,074 |
10,737 |
83 |
— |
7092523 |
2280-2300 |
7/7/2025 |
7/9/2025 |
— |
148 |
12,674 |
7.2% |
>146,014 |
1,202 |
3,586 |
74 |
984 |
77 |
490 |
>36,503 |
1,169 |
9,618 |
74 |
— |
7092522 |
2380-2400 |
7/7/2025 |
7/9/2025 |
— |
146 |
9,210 |
5.3% |
>165,228 |
1,104 |
2,160 |
86 |
918 |
101 |
1,445 |
>41,307 |
1,150 |
10,993 |
84 |
— |
7092521 |
2548 |
7/7/2025 |
7/9/2025 |
— |
165 |
7,976 |
4.6% |
>159,690 |
1,228 |
2,233 |
86 |
882 |
122 |
382 |
>39,922 |
961 |
11,579 |
81 |
— |
7092520 |
2580-2600 |
7/7/2025 |
7/9/2025 |
37 |
238 |
2,696 |
1.5% |
>171,634 |
2,321 |
5,803 |
108 |
1,431 |
144 |
1,445 |
>42,908 |
900 |
8,782 |
88 |
— |
7092519 |
2600-2620 |
7/7/2025 |
7/9/2025 |
— |
206 |
7,440 |
4.3% |
>161,274 |
2,003 |
4,912 |
105 |
1,346 |
101 |
1,616 |
>40,319 |
1,176 |
11,114 |
87 |
— |
7092518 |
2640-2660 |
7/7/2025 |
7/9/2025 |
212 |
172 |
12,033 |
6.9% |
>144,798 |
1,945 |
8,102 |
108 |
1,484 |
87 |
2,426 |
>36,199 |
1,408 |
13,307 |
82 |
— |
7092517 |
2680-2700 |
7/7/2025 |
7/9/2025 |
47 |
160 |
14,388 |
8.2% |
>149,230 |
1,391 |
5,160 |
98 |
1,162 |
52 |
1,518 |
>37,308 |
1,386 |
13,046 |
80 |
— |
7092516 |
2780-2800 |
7/7/2025 |
7/9/2025 |
108 |
157 |
6,899 |
3.9% |
>159,966 |
1,523 |
4,711 |
100 |
1,259 |
103 |
924 |
>39,991 |
1,257 |
10,514 |
90 |
— |
7092515 |
2880-2900 |
7/7/2025 |
7/9/2025 |
77 |
201 |
6,021 |
3.4% |
>156,296 |
2,067 |
4,207 |
89 |
1,117 |
130 |
1,020 |
>39,074 |
1,288 |
12,675 |
80 |
— |
7092514 |
2980-3000 |
7/7/2025 |
7/9/2025 |
131 |
162 |
4,054 |
2.3% |
>162,181 |
1,688 |
5,649 |
94 |
941 |
80 |
1,374 |
>40,543 |
1,276 |
10,815 |
82 |
— |
7092513 |
3022 |
7/7/2025 |
7/9/2025 |
122 |
146 |
35,828 |
20.5% |
>140,990 |
1,222 |
3,236 |
82 |
810 |
65 |
1,043 |
>35,247 |
1,431 |
10,926 |
70 |
— |
The EPA UIC permit subdivides the mineralized deposit into three blocks for development. Block 1 comprises the northwestern third of the orebody, Block 2 occupies the central portion of the orebody, and Block 3 comprises the southeastern third of the orebody. The SSF currently operates in Block 2 and Figure 13.3 presents the commercial mine plan of the 27 wells in Block 2. Figure 13.4 provides an example of the cross section in Block 2 and the MMH wells with vertical spacing while Figure 13.5 provides an example of the cross section in Block 2 and the MMH wells with lateral spacing. To permit mining of Block 1 and Block 3, the EPA UIC permits will require additional monitoring wells to be installed and baseline parameters to be established via sampling and laboratory testing. Block 2 has established enough resources and reserves for the first phase of mining.
78
Figure 13.3: LSBF block 2 mine plan
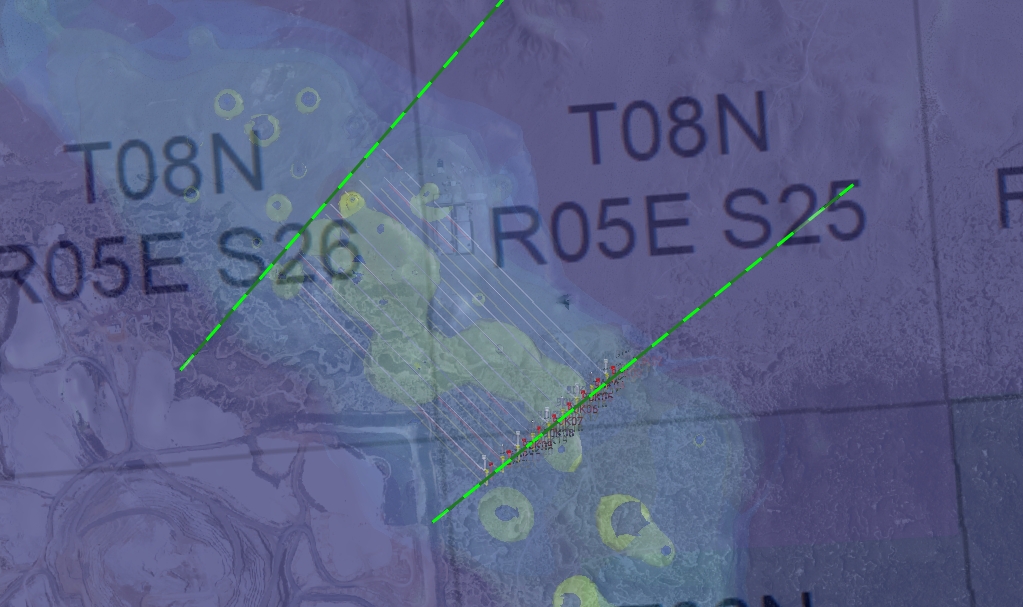
Figure 13.4: Block 2 mining cross section – MMH wells vertical spacing
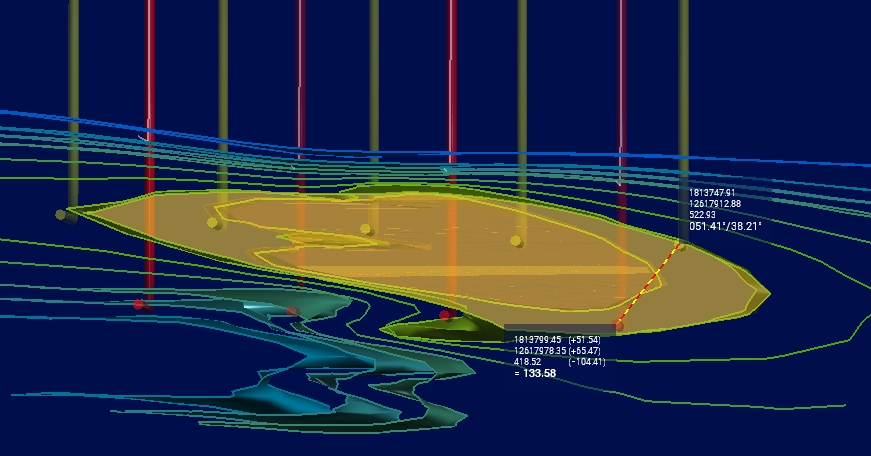
79
Figure 13.5: Block 2 mining cross section – MMH wells lateral spacing
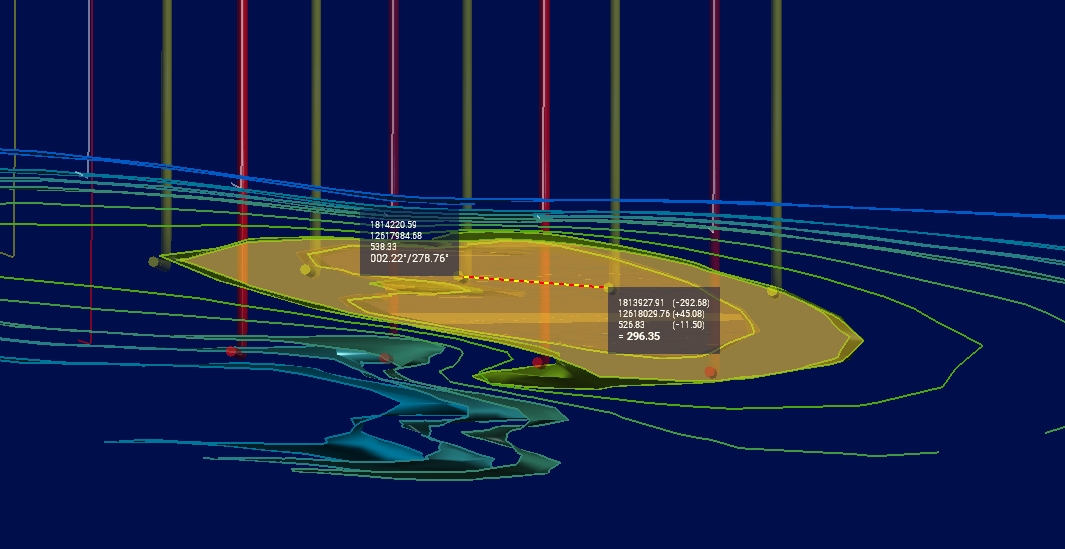
Drilling and construction of the 27 wells for the LSBF wellfield requires a precision super single automated drilling rig operating by a 5-man crew with 24 hour per day and seven days a week (24/7) operations. Additional personnel require a dedicated tool-pusher and drill site manager on-site 24/7 while the rig deploys a rotary steerable directional drilling method. During the program, the commercial production wells will actively be adjusted or geo-steered based on logging during drilling operations.
Given the progressive nature of cavern development and injection fluid recharge and re-injection, cavern voids are expected to remain fluid-filled thus limiting subsidence risks at surface. Existing Micro-deformation instrumentation monitors the surface for subsidence and indicates cyclical net balance of subsidence and heave, and results are displayed in Figure 13.6 below. The injection interval is isolated to colemanite bearing orebody with overburden geological layers providing a bridge to reduce subsidence effects. Micro-deformation instrumentation will continue to monitor orebody throughout life of mine.
Figure 13.6: Micro-deformation results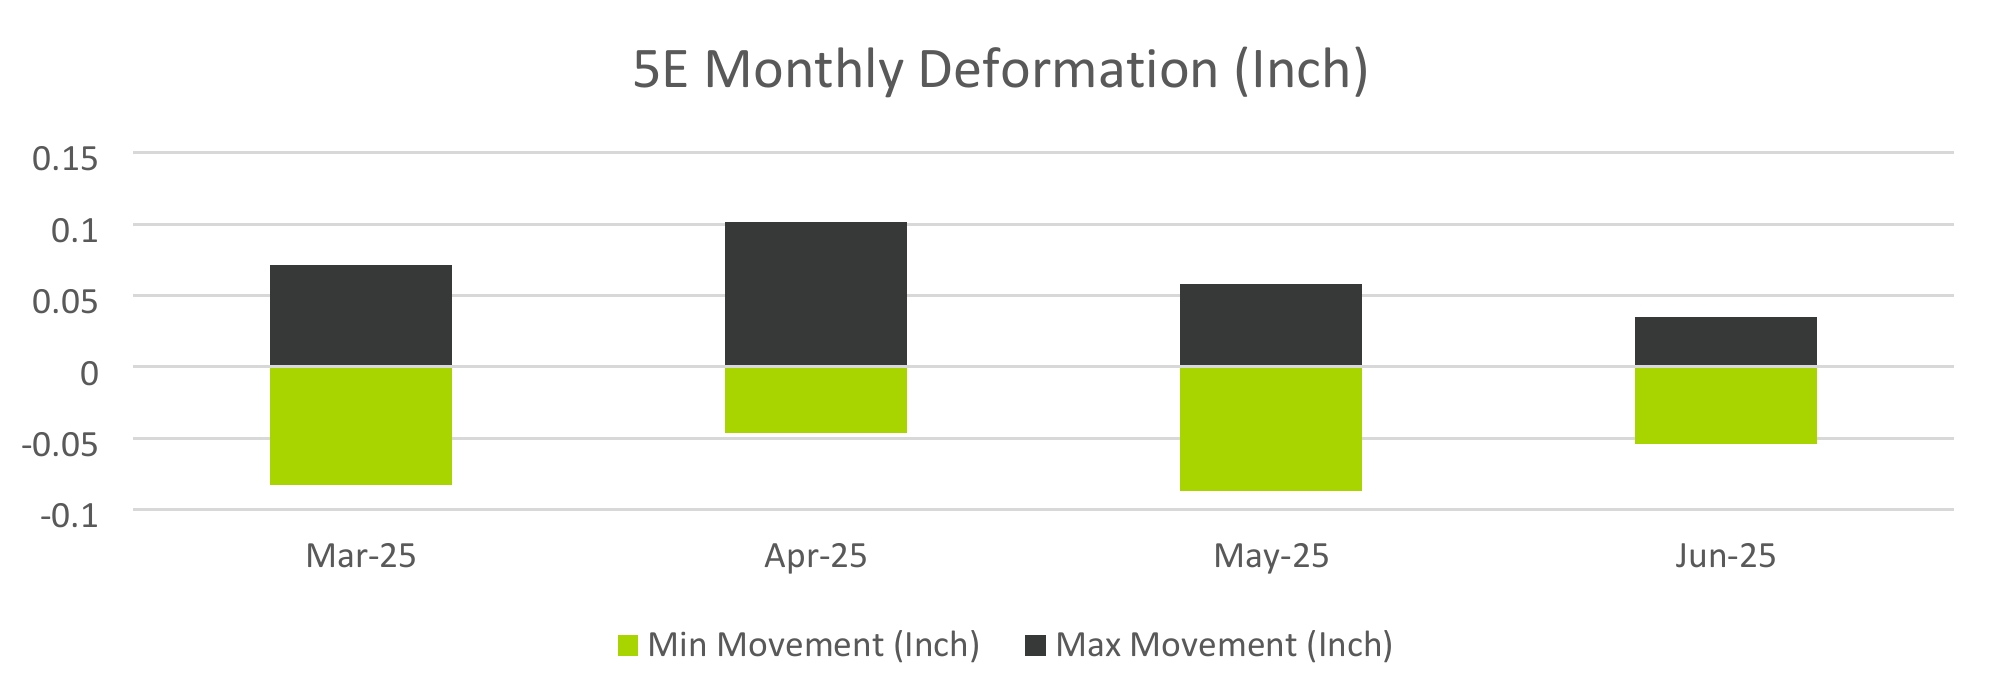
80
14 Processing and Recovery Methods
This section outlines the processing facilities established in the final stage of the 2025 Pre-feasibility Study for the Large-Scale Borates Facility Project (LSBF). It encompasses all processing operations, from the delivery of PLS from the mine wells to the production of boric acid and associated byproducts.
14.1 Processing Summary
During the Front-End Loading Phase 2 (FEL-2), 5E successfully executed an extensive program of mineral processing and metallurgical testing, as detailed in Section 10. Building on these results, the company has selected a proven, crystallization-based process for boric acid extraction. This method has been validated through both laboratory-scale experiments and the operational success of the SSF, illustrated in Figure 14.1.
Figure 14.1: Small-Scale Facility
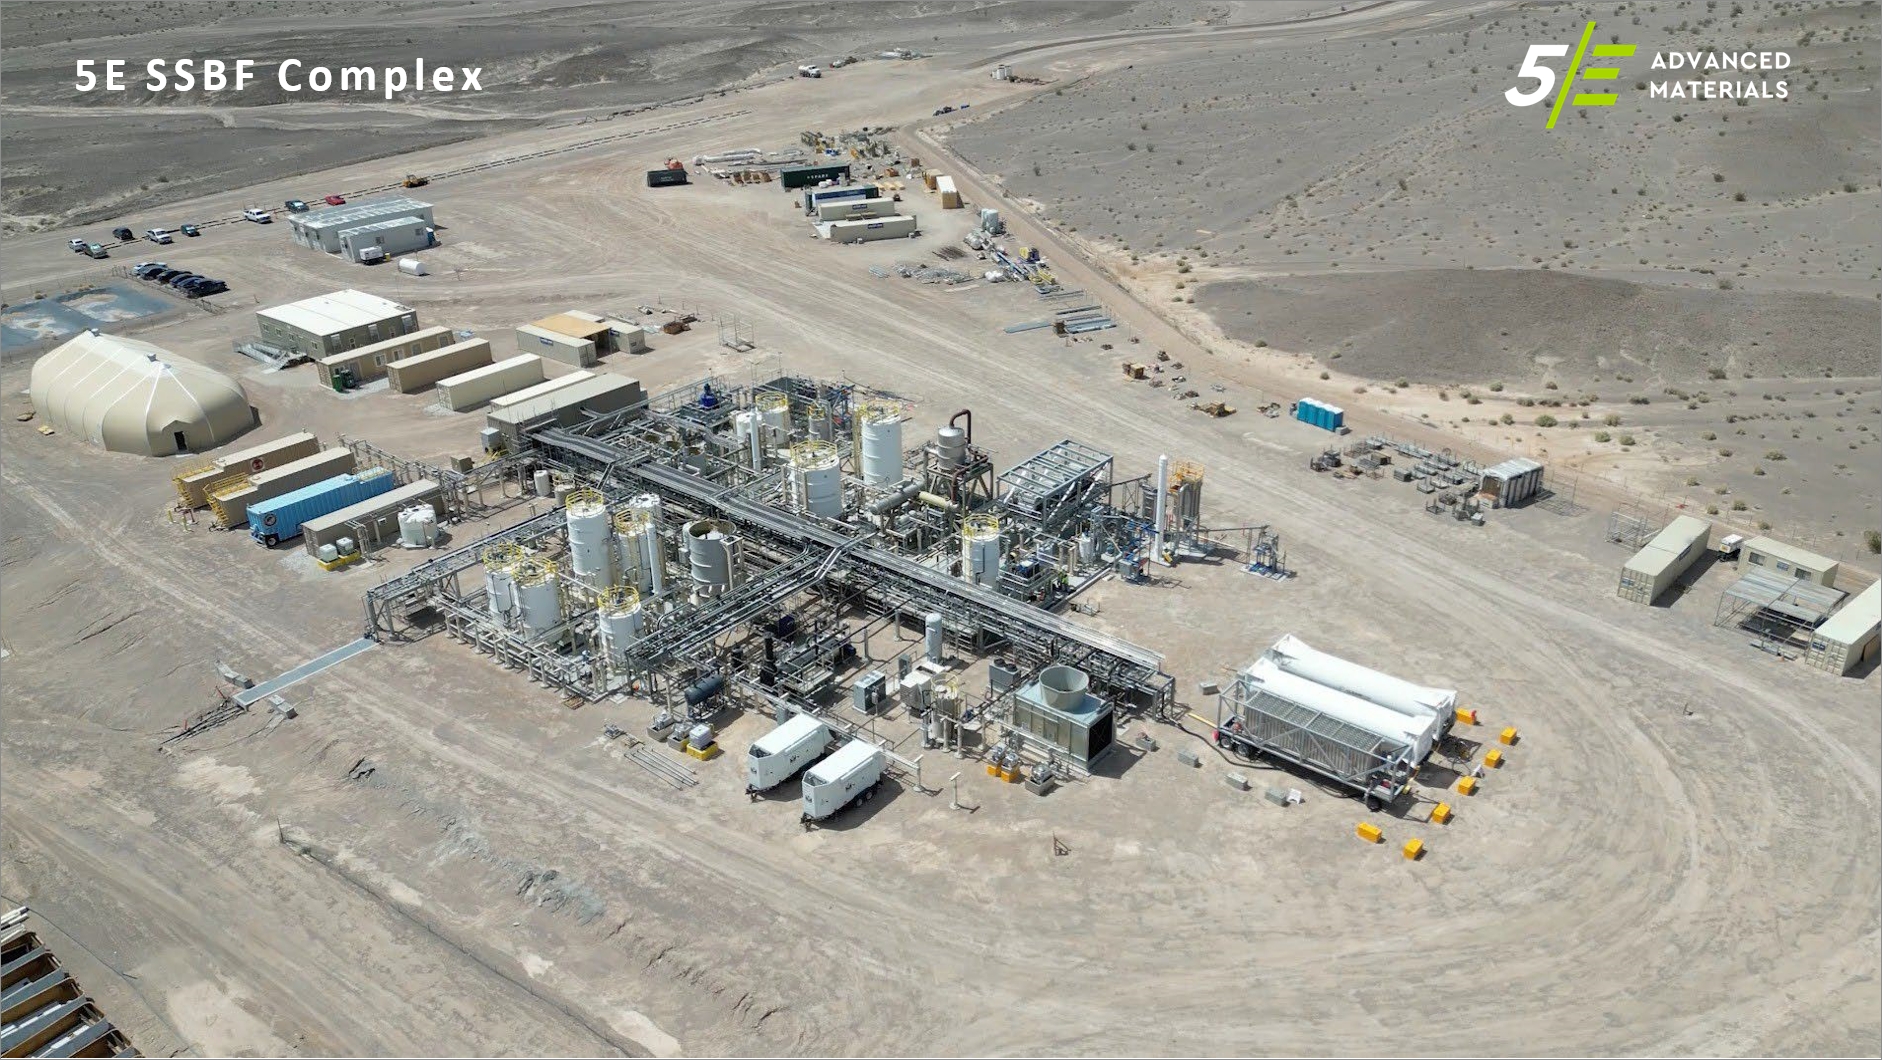
The SSF has consistently produced boric acid that meets or exceeds customer quality specifications. Operational insights, performance data, and key learnings from the SSF have been integrated into the design of the forthcoming Large-Scale Borates Facility.
A high-level overview of the selected process, along with a simplified block flow diagram (Figure 14.2), is presented below. Additional technical details are available in Section 14.3 and the Process & Utility Description document (5EAM-G1-RPT-225-00003).
81
Figure 14.2: Block flow diagram of the Large-Scale Borates Facility
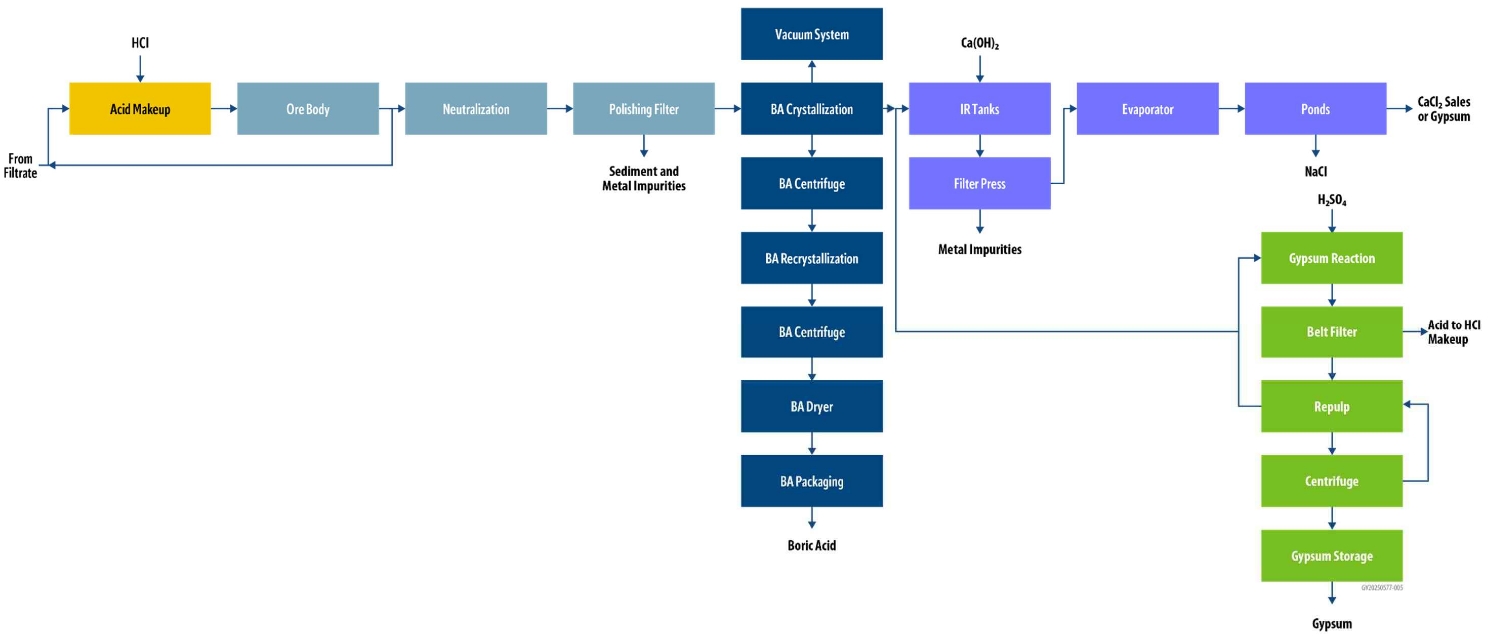
82
14.2 Process Design Criteria / Usages
The LSBF’s engineering and design framework is guided by the specifications detailed in the Process Design Criteria document (5EAM-G1-DBD-225-00001), with summary of the most critical process parameters, assumptions, and usages reflected in Table 14.1 below:
Table 14.1 LSBF design criteria
|
|
|
|
|
|
|
Design Criteria / Usages – Process Summary |
||
Parameter |
Units |
Value |
Value |
Comments |
Feed Rate |
st/hr |
25.6 |
25.6 |
|
Operating Days per Year |
days/yr |
365 |
365 |
|
Operating Factor |
% |
91 |
91 |
|
Plant Operating Hours |
hr/yr |
8,000 |
8,000 |
|
Boron Recovery |
% |
95.1 |
95.1 |
|
Boric Acid Production Rate |
ST/hr |
16.25 |
16.25 |
|
Boric Acid Design Production |
stpa |
130,000 |
130,000 |
|
Gypsum Production |
stpa |
162,000 |
129,000 |
Dry Basis |
Calcium Chloride Production |
stpa |
0 |
57,000 |
~57,000 @ 40% weight CaCl₂ solution, equivalent to 60,000 @38% |
Water Consumption |
gpm |
237 |
237 |
Make up from wells |
Hydrochloric Acid |
lbs/ST BA |
291 |
510 |
100% basis |
Sulfuric Acid |
lbs/ST BA |
1,451 |
1,157 |
100% basis |
Lime |
lbs/ST BA |
423 |
423 |
100% basis |
Natural Gas |
MMBtu/ST |
7 |
7 |
|
Electricity |
kW/ST |
1,000 |
1,000 |
|
Employees |
people |
110 |
110 |
80 operators and 30 overhead |
83
14.2.1 Basis for Boric Acid (BA) Head Grade
As stated in Section 11.1 Key Assumptions, it is the opinion of the QP for Section 13 that 5E may achieve a boric acid head grade of 10.2% weight in the PLS at 160°F, with 12% head grade being the maximum potentially achieved at 212°F for PLS recovery. The drivers assume to achieve this rate are two-fold: (1) injectate solution can be heated above ground at a temperature above 200°F with PLS solution leaving the formation at 160°F, or (2) the formation can be heated via dedicated steam injection such that PLS solution exits the formation at 160°F. Other drivers that have been proven include: (1) recycled boron remains in solution during mining, (2) boron solubility curves follow calcium curves as demonstrated by work performed by MSME in the 1980’s, and (3) 5E’s extracted PLS aligns with the solubility curves versus temperature. See Kemetco solubility curve in Section 10.
14.3 Work Breakdown Structure and Plant Layout
To support the execution and management of the LSBF project, the processing facilities have been organized using a structure Work Breakdown Structure (WBS). This framework provides a clear, hierarchical representation of the project scope, enabling effective planning, coordination, and control throughout the project lifecycle. Table 14.2 presents the processing facilities by WBS, while the plant layout is illustrated in Figure 14.3 and Figure 14.4. This WBS divides the LSBF into five primary geographic areas, each representing a distinct portion of the processing infrastructure. Two additional areas are included for cost accounting purposes. During FEL-2, the project scope was defined to the Level 2 WBS, providing sufficient detail for pre-feasibility level planning and reporting. Further refinement to Levels 3 and 4 will be completed during FEL-3 and the detailed design phase.
This structured approach ensures that each component of the processing facilities is clearly defined and traceable, supporting efficient execution and alignment with overall project objectives.
84
Table 14.2 LSBF WBS processing facilities
|
|
|
|
|
|
FEL-2 (DEFINITION LVL) |
|
FEL-3/EXECUTION |
|
||
AREA |
|
AREA |
|
AREA |
|
PLANT AREA |
|
UNIT TYPE |
|
CWA - DRAFT |
|
"N" |
|
"N#" |
|
"N###" |
DESCRIPTION |
G |
|
|
|
|
General |
|
|
G100000 |
|
|
GENERAL |
S |
|
|
|
|
Site and Infrastructure |
|
|
S100000 |
|
|
Site Preparation |
|
|
|
|
S101000 |
Site Preparation |
|
|
|
|
S102000 |
Mass Earthworks |
|
|
|
|
S103000 |
Site Drainage |
|
|
|
|
S104000 |
Sediment Handling |
|
|
|
|
S105000 |
Site Finish Grading |
|
|
|
|
S106000 |
Topsoil/Overburden Storage |
|
|
S200000 |
|
|
Plant Roads |
|
|
|
|
S201000 |
Plant Site Roads |
|
|
|
|
S202000 |
Parking |
|
|
|
|
S203000 |
Access Roads |
B |
|
|
|
|
Buildings/Ancillary Facilities |
|
|
B100000 |
|
|
Buildings |
|
|
|
|
B101000 |
Administration Buildings (by 5E) |
|
|
|
|
B102000 |
Guard House/Security Buildings/Gate House |
|
|
|
|
B103000 |
Truck Weigh Scale |
|
|
|
|
B104000 |
Central Control Room |
|
|
|
|
B105000 |
Warehouses |
|
|
|
|
B106000 |
Process Controls Lab |
|
|
|
|
B107000 |
Maintenance Building |
P |
|
|
|
|
Hydrometallurgical Processing Facility |
|
|
P100000 |
|
|
Solution Mining and Injection |
|
|
|
|
P101000 |
Mining Acid Make-up |
|
|
|
|
P102000 |
Reserved for Owner |
|
|
P200000 |
|
|
PLS Recovery and Clarification |
|
|
|
|
P201000 |
Mine FEED Storage and Return |
|
|
|
|
P202000 |
PLS Solid/Liquid Separation |
|
|
|
|
P203000 |
PLS Tailings Filtration |
|
|
|
|
P204000 |
Tailings Handling and Storage |
|
|
P300000 |
|
|
Boric Acid Circuit |
|
|
|
|
P301000 |
Boric Acid Crystallization |
|
|
|
|
P302000 |
Boric Acid Filtration and Washing |
|
|
|
|
P303000 |
Boric Acid Recrystallization and Dissolution |
|
|
|
|
P304000 |
Boric Acid Drying |
|
|
|
|
P305000 |
Boric Acid Product Packing and Loadout System |
|
|
|
|
P306000 |
Boric Acid Building |
|
|
|
|
P307000 |
Brine Storage and Distribution |
|
|
P400000 |
|
|
Impurity Removal Circuit |
|
|
|
|
P401000 |
Impurity Precipitation/Concentration |
|
|
|
|
P402000 |
Impurity Filtration |
|
|
|
|
P403000 |
Impurity Handling and Storage |
|
|
P500000 |
|
|
Evaporation Circuit |
|
|
|
|
P501000 |
Brine Concentration |
|
|
P600000 |
|
|
Gypsum Circuit |
|
|
|
|
P601000 |
Gypsum Precipitation/Concentration |
|
|
|
|
P602000 |
Gypsum Filtration |
|
|
|
|
P603000 |
Gypsum Refining |
|
|
|
|
P604000 |
Gypsum Drying |
|
|
|
|
P605000 |
Gypsum Product Packing and Truck Loadout System(s) |
|
|
|
|
P606000 |
Gypsum Plant Building |
85
|
|
|
|
|
|
FEL-2 (DEFINITION LVL) |
|
FEL-3/EXECUTION |
|
||
AREA |
|
AREA |
|
AREA |
|
PLANT AREA |
|
UNIT TYPE |
|
CWA - DRAFT |
|
"N" |
|
"N#" |
|
"N###" |
DESCRIPTION |
|
|
P700000 |
|
|
Reagents |
|
|
|
|
P701000 |
Lime System |
|
|
|
|
P702000 |
Hydrochloric Acid System |
|
|
|
|
P703000 |
Sulfuric Acid System |
|
|
|
|
P704000 |
Sodium Hydroxide System |
|
|
|
|
P705000 |
Miscellaneous Reagent Systems |
|
|
P800000 |
|
|
Evaporation Ponds |
U |
|
|
|
|
Utilities and Offsite (U&O) |
|
|
U100000 |
|
|
Plant Utilities (Above/Underground) |
|
|
|
|
U100000 |
Utilities General |
|
|
|
|
U101000 |
Natural Gas |
|
|
|
|
U102000 |
Process Water Storage and Supply |
|
|
|
|
U103000 |
Gland Water Storage and Supply |
|
|
|
|
U104000 |
Potable Water Storage and Supply |
|
|
|
|
U105000 |
Reverse Osmosis Water Storage and Supply |
|
|
|
|
U106000 |
Firewater/Raw Water Storage and Supply |
|
|
|
|
U107000 |
Fire Protection System |
|
|
|
|
U108000 |
Cooling Water |
|
|
|
|
U109000 |
Chilled Water |
|
|
|
|
U110000 |
Demin Water |
|
|
|
|
U111000 |
Steam and Condensate Systems |
|
|
|
|
U112000 |
Storm Water System |
|
|
|
|
U113000 |
Compressed Air |
|
|
|
|
U114000 |
Instrument Air |
|
|
|
|
U115000 |
Lube Oil/Hydraulic |
|
|
|
|
U116000 |
Oily Water Treatment |
|
|
|
|
U117000 |
Environmental Monitoring |
|
|
|
|
U118000 |
Utility Shelters |
|
|
|
|
U119000 |
Sanitary Sewer |
|
|
U200000 |
|
|
Interconnecting Systems |
|
|
|
|
U201000 |
Piperack |
|
|
|
|
U202000 |
Piperack (Placeholder) |
|
|
|
|
U203000 |
Piperack (Placeholder) |
|
|
|
|
U203000 |
Piperack Utilities |
|
|
U300000 |
|
|
Power Supply and Distribution |
|
|
|
|
U301000 |
Plant Site Power Distribution |
|
|
|
|
U302000 |
Plant Site Grounding |
|
|
|
|
U303000 |
Main Sub-Station E-House |
|
|
|
|
U304000 |
E-House 1 |
|
|
|
|
U305000 |
E-House 2 |
|
|
U400000 |
|
|
Communications |
|
|
|
|
U401000 |
Plant Control Systems |
|
|
|
|
U402000 |
Fire Detection System |
|
|
|
|
U403000 |
Security System |
|
|
|
|
U404000 |
Process Monitoring System (CCTV) |
|
|
|
|
U405000 |
Telephone System |
|
|
|
|
U406000 |
Fiber Optics/Networks |
|
|
|
|
U407000 |
Satellite Connection |
|
|
|
|
U408000 |
Radio Communication |
|
|
U500000 |
|
|
Offsites |
|
|
U600000 |
|
|
Cogen Facility |
86
Figure 14.3: LSBF plant layout
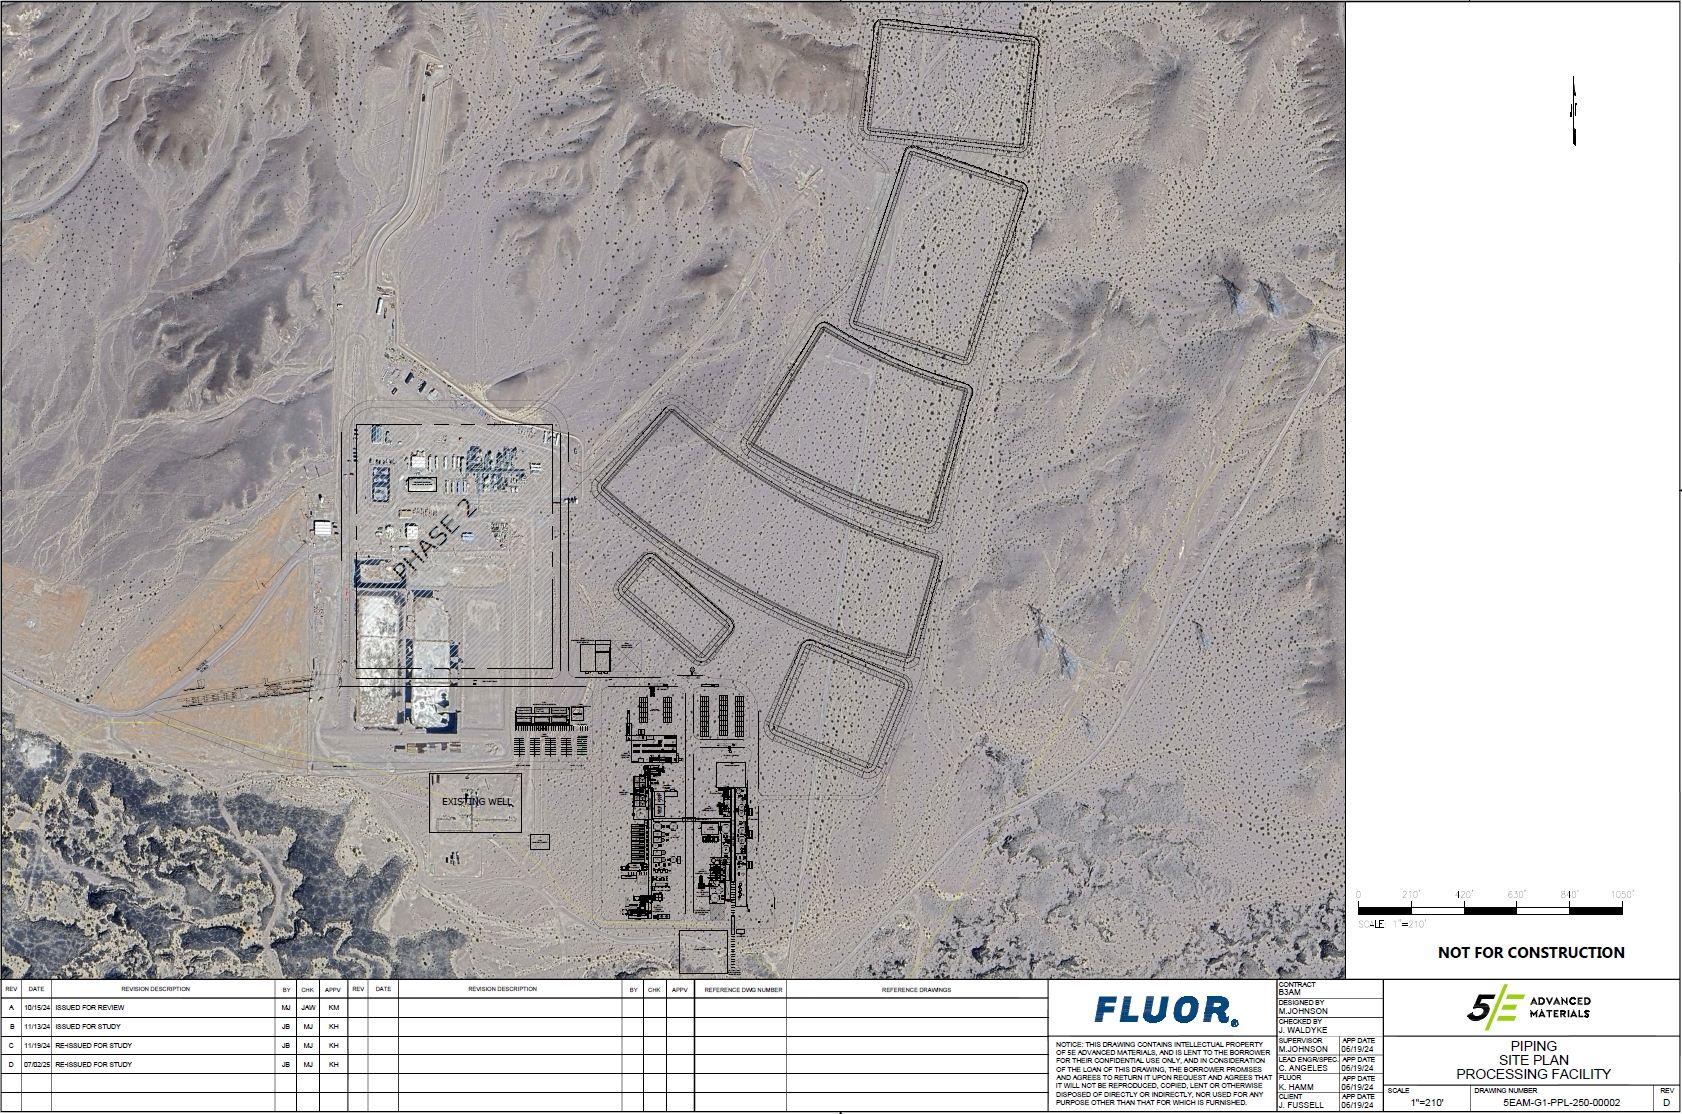
87
Figure 14.4: LSBF detailed layout
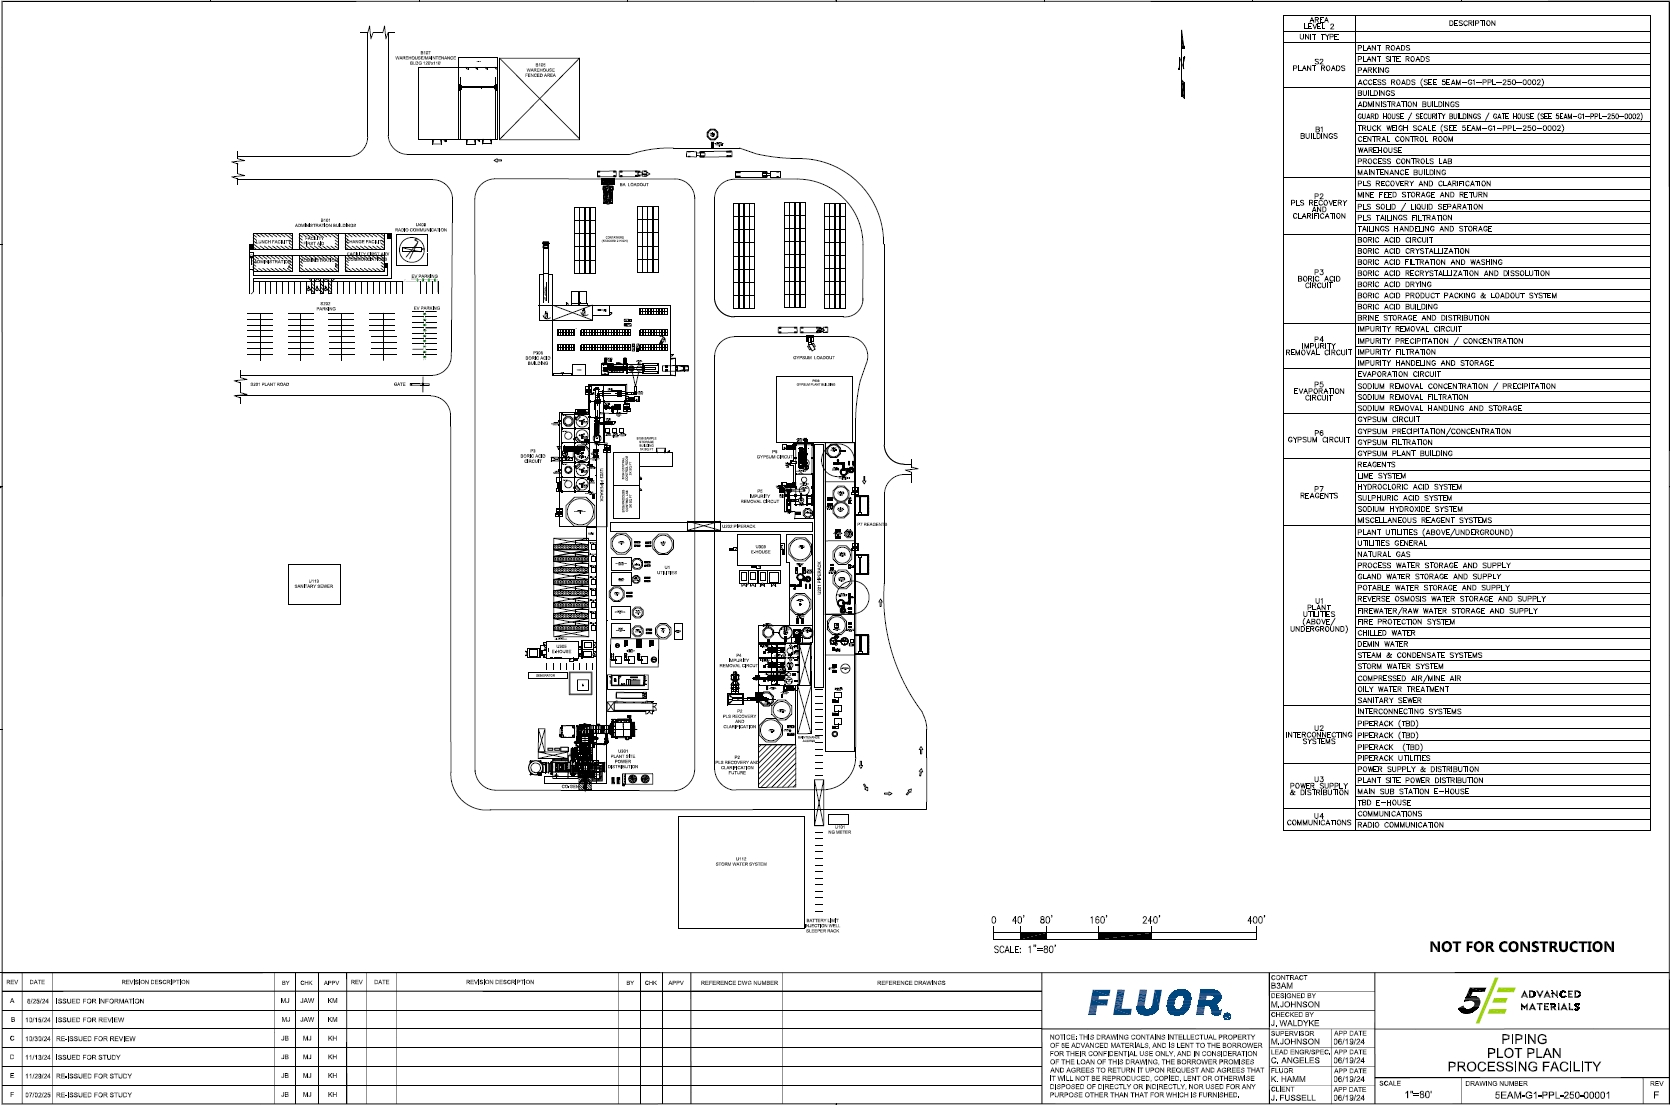
88
89
14.4 Description of Processing Facilities
The processing facility at the LSBF is engineered to support high-efficiency, high-throughput extraction and refinement of boric acid and associated byproducts from the PLS. This section provides a more detailed overview of each major processing area, highlighting the unit operations, equipment, and supporting systems that collectively enable the transformation of raw leached solution into finished, market-ready products. The design integrates industry best practices and leverages proven technologies validated through extensive test work and the successful operation of the SSF.
At the core of the LSBF is the Hydrometallurgical Processing Area, which encompasses all major processing functions. The following subsections describe this area. For a comprehensive breakdown of the facility scope, refer to the Scope of Facilities document 5EAM-G1-RPT-201-00003.
90
In total, the pond system spans approximately 37 acres, with around 33.5 acres actively engaged in brine processing. Once the brine is sufficiently concentrated, the resulting calcium chloride stream is directed either to the Gypsum Circuit for further treatment or to a truck load-out facility for sale as a byproduct.
91
14.5 Equipment Selection – Processing Facilities
The selection of equipment for the LSBF is directly informed by the process design and operational requirements established during the FEL-2 phase. Each piece of equipment has been chosen to ensure reliable performance, alignment with throughput targets, and compatibility with the crystallization-based boric acid recovery process.
In addition to process suitability, the selection criteria emphasized:
92
Table 14.3 below summarizes the major plant equipment selections for the processing facilities that form the basis of the capital cost estimate. An all-inclusive list of equipment can be viewed in the plant mechanical equipment list (Mechanical Equipment List 5EAM-G1-EQL-255-00001). Details on equipment purchasing are provided in Project Execution Strategy 5EAM-G1-PEP-100-00001.
Table 14.3 Major Plant Equipment Selections
|
|
|
MAJOR EQUIPMENT SUMMARY – PROCESSING FACILITIES |
||
Equipment Tag |
Equipment Type |
Equipment Description |
P2-TNK-201 |
TANK |
PREGNANT LEACH SOLUTION HOLDING TANK |
P2-SBR-202 |
SCRUBBER |
HCL MAKE-UP TANK SCRUBBER |
P2-TNK-202 |
TANK |
HCL MAKE-UP TANK |
P2-VPK-202 |
PACKAGE |
HCL MAKE-UP TANK SCRUBBER PACKAGE |
P2-TNK-205 |
TANK |
PLS PH ADJUSTMENT TANK |
P2-TNK-206 |
TANK |
PLS FILTER PRESS FEED TANK |
P2-FIP-201 |
FILTER PRESS |
PLS FILTER PRESS |
P2-FIL-201 |
FILTER |
PLS POLISHING FILTER |
P2-TNK-208 |
TANK |
PLS FILTER PRESS WASH WATER TANK |
P2-TNK-207 |
TANK |
PLS FILTRATE TANK |
P2-CRN-001 |
CRANE |
FILTER PRESS CRANE |
P3-TNK-301 |
TANK |
BA CRYSTALLIZER FEED TANK |
P3-VPK-301 |
PACKAGE |
BORIC ACID CRYSTALLIZER PACKAGE |
P3-CRZ-301 |
CRYSTALLIZER |
1ST STAGE BA CRYSTALLIZER |
P3-CRZ-302 |
CRYSTALLIZER |
2ND STAGE BA CRYSTALLIZER |
P3-HEX-301-A |
CONDENSER |
BA CRYSTALLIZER VENT CONDENSER 1 |
P3-HEX-302-A |
HEAT EXCHANGER |
INTER CONDENSER 1 |
P3-HEX-303-A |
HEAT EXCHANGER |
AFTER CONDENSER 1 |
P3-EJR-301-A |
EJECTOR |
FIRST VACUUM EJECTOR 1 |
P3-EJR-302-A |
EJECTOR |
SECOND VACUUM EJECTOR 1 |
P3-HEX-304 |
CONDENSER |
BA CRYSTALLIZER VENT CONDENSER 2 |
P3-HEX-305 |
HEAT EXCHANGER |
INTER CONDENSER 2 |
P3-HEX-306 |
HEAT EXCHANGER |
AFTER CONDENSER 2 |
P3-EJR-303 |
EJECTOR |
FIRST VACUUM EJECTOR 2 |
P3-EJR-304 |
EJECTOR |
SECOND VACUUM EJECTOR 2 |
P3-TNK-302 |
TANK |
BA CRYSTALLIZER HOTWELL |
P3-VPK-302 |
PACKAGE |
BA BELT FILTER VENDOR PACKAGE |
P3-FIB-301 |
BELT FILTER |
BA BELT FILTER |
P3-TNK-303 |
TANK |
BA DISSOLUTION TANK |
P3-HEX-307 |
HEAT EXCHANGER |
BA DISSOLUTION TANK HEAT EXCHANGER |
P3-FIL-301 |
FILTER PRESS |
CALCIUM SULFATE FILTER |
P3-CRZ-303 |
CRYSTALLIZER |
1ST STAGE BA RECRYSTALLIZER |
P3-CRZ-304 |
CRYSTALLIZER |
2ND STAGE BA RECRYSTALLIZER |
P3-HEX-308 |
CONDENSER |
BA RECRYSTALLIZER VENT CONDENSER STAGE 1 |
P3-HEX-309 |
CONDENSER |
RECRYSTALLIZER INTER CONDENSER STAGE 1 |
P3-HEX-310 |
CONDENSER |
RECRYSTALLIZER AFTER CONDENSER STAGE 1 |
P3-EJR-305 |
EJECTOR |
RECRYSTALLIZER FIRST VACUUM EJECTOR STAGE 1 |
P3-EJR-306 |
EJECTOR |
RECRYSTALLIZER SECOND VACUUM EJECTOR STAGE 1 |
P3-HEX-311 |
CONDENSER |
BA RECRYSTALLIZER VENT CONDENSER STAGE 1 |
P3-HEX-312 |
CONDENSER |
RECRYSTALLIZER INTER CONDENSER STAGE 1 |
P3-HEX-313 |
CONDENSER |
RECRYSTALLIZER AFTER CONDENSER STAGE 1 |
P3-EJR-307 |
EJECTOR |
RECRYSTALLIZER FIRST VACUUM EJECTOR STAGE 1 |
P3-EJR-308 |
EJECTOR |
RECRYSTALLIZER SECOND VACUUM EJECTOR STAGE 1 |
P3-TNK-304 |
TANK |
BA RECRYSTALLIZER HOTWELL |
P3-CTF-301 |
CENTRIFUGE |
BA CENTRIFUGE |
93
|
|
|
MAJOR EQUIPMENT SUMMARY – PROCESSING FACILITIES |
||
Equipment Tag |
Equipment Type |
Equipment Description |
P3-TNK-305 |
TANK |
BA CENTRIFUGE FEED TANK |
P3-TNK-306 |
TANK |
BA CENTRATE TANK |
P3-BLO-301 |
BLOWER |
BA DRYER COMBUSTION AIR BLOWER |
P3-BLO-302 |
BLOWER |
BA DRYER AIR BLOWER |
P3-BLO-303 |
BLOWER |
BA COOLER AIR BLOWER |
P3-BRN-301 |
BURNER |
BA DRYER BURNER |
P3-CLR-301 |
COOLER |
BA COOLER |
P3-HET-301 |
HEATER |
BA AIR HEATER |
P3-DRY-301 |
DRYER |
BA DRYER |
P3-HEX-314 |
COOLER |
BA COOLER AIR COOLER |
P3-CYC-301 |
CYCLONE |
BA CYCLONE 1 |
P3-CYC-302 |
CYCLONE |
BA CYCLONE 2 |
P3-VPK-303 |
PACKAGE |
BA DRYER SCRUBBER PACKAGE |
P3-SBR-301 |
SCRUBBER |
BA SCRUBBER |
P3-BUE-301 |
BUCKET ELEVATOR |
BA PRODUCT BUCKET ELEVATOR |
P3-DCO-301 |
DUST COLLECTOR |
BA SILO DUST COLLECTOR |
P3-SLO-301 |
SILO |
BA PRODUCT STORAGE SILO |
P3-VPK-304 |
BAGGING SYSTEM |
BA PRODUCT BAGGING SYSTEM |
P3-TNK-308 |
TANK |
BRINE HOLDING TANK |
P4-TNK-402 |
TANK |
NEUTRALIZATION TANK |
P4-THK-401 |
THICKENER |
IMPURITY REMOVAL THICKENER |
P4-TNK-403 |
TANK |
IMPURITY REMOVAL THICKENER OVERFLOW TANK |
P4-TNK-404 |
TANK |
IMPURITY REMOVAL FILTER FEED TANK |
P4-FIP-401 |
FILTER PRESS |
IMPURITY REMOVAL FILTER PRESS |
P4-TNK-405 |
TANK |
IMPURITY REMOVAL FILTER CLOTH WASH TANK |
P4-TNK-406 |
TANK |
MAGNESIUM REMOVAL TANK |
P4-FIP-402 |
FILTER PRESS |
MAGNESIUM REMOVAL FILTER PRESS |
P4-TNK-407 |
TANK |
MAGNESIUM REMOVAL FILTER CLOTH WASH TANK |
P4-TNK-408 |
TANK |
MAGNESIUM REMOVAL FILTRATE TANK |
P5-TNK-501 |
TANK |
EVAPORATOR FEED TANK |
P5-EVP-501 |
EVAPORATOR |
EVAPORATOR |
P5-EJR-501 |
EJECTOR |
EVAPORATOR STEAM EJECTOR 1 |
P5-EJR-502 |
EJECTOR |
EVAPORATOR STEAM EJECTOR 2 |
P5-HEX-501 |
HEAT EXCHANGER |
EVAPORATOR PRE-HEATER |
P5-HEX-502 |
HEAT EXCHANGER |
EVAPORATOR HEATER |
P5-FIL-501 |
FILTER |
EVAPORATOR POLISHING FILTER |
P6-TNK-601 |
TANK |
GYPSUM PRECIPITATION TANK |
P6-VPK-601 |
PACKAGE |
GYPSUM VENT SCRUBBER PACKAGE |
P6-SBR-601 |
SCRUBBER |
GYPSUM VENT SCRUBBER |
P6-CTF-601 |
CENTRIFUGE |
GYPSUM CENTRIFUGE |
P6-FIB-601 |
BELT FILTER |
GYPSUM BELT FILTER |
P6-VPK-602 |
PACKAGE |
GYPSUM BELT FILTER PACKAGE |
P6-TNK-603 |
TANK |
GYPSUM CENTRIFUGE FEED TANK |
P6-TNK-604 |
TANK |
GYPSUM CENTRATE TANK |
P6-TNK-606-A/B |
TANK |
CALCIUM CHLORIDE TANK A/B |
P7-BLO-701 |
BLOWER |
LIME BULK UNLOADING BLOWER |
P7-SLO-701 |
SILO |
LIME SILO |
P7-TNK-701 |
TANK |
LIME MIXING TANK |
P7-TNK-702 |
TANK |
LIME STORAGE TANK |
P7-TNK-703-A/B |
TANK |
HYDROCHLORIC ACID STORAGE TANK A/B |
P7-TNK-704-A |
TANK |
SULFURIC ACID STORAGE TANK A |
P7-TNK-704-B |
TANK |
SULFURIC ACID STORAGE TANK B |
P7-TNK-705 |
TANK |
SODIUM HYDROXIDE STORAGE TANK |
U1-MSC-101 |
SKID |
NATURAL GAS METERING SKID |
U1-FIL-101 |
FILTER |
RO 1 POLISHING FILTER |
94
|
|
|
MAJOR EQUIPMENT SUMMARY – PROCESSING FACILITIES |
||
Equipment Tag |
Equipment Type |
Equipment Description |
U1-ROS-101 |
REVERSE OSMOSIS |
REVERSE OSMOSIS NO. 1 |
U1-TNK-103 |
TANK |
RAW WATER TANK |
U1-TNK-104 |
TANK |
TREATED WATER TANK |
U1-TNK-105 |
TANK |
RO 1 FEED TANK |
U1-VPK-101 |
PACKAGE |
RAW WATER TREATMENT PACKAGE |
U1-VPK-102 |
PACKAGE |
REVERSE OSMOSIS NO. 1 PACKAGE |
U1-TNK-106 |
TANK |
RO WATER TANK |
U1-FIL-106 |
FILTER |
GLAND SEAL WATER FILTER |
U1-TNK-109 |
TANK |
PROCESS WATER TANK |
U1-TNK-111 |
TANK |
POTABLE WATER TANK |
U1-VPK-104 |
PACKAGE |
POTABLE WATER TREATMENT PACKAGE |
U1-TNK-112 |
TANK |
FIRE WATER TANK |
U1-VPK-105 |
PACKAGE |
BOILER SYSTEM PACKAGE |
U1-TNK-113 |
TANK |
CHILLED WATER EXPANSION TANK |
U1-VPK-106 |
PACKAGE |
CHILLED WATER PACKAGE |
U1-FIL-103 |
FILTER |
WATER RECOVERY RO POLISHING FILTER |
U1-ROS-103 |
REVERSE OSMOSIS |
WATER RECOVERY REVERSE OSMOSIS |
U1-TNK-114 |
TANK |
WATER RECOVERY TANK |
U1-VPK-107 |
PACKAGE |
WATER RECOVERY RO PACKAGE |
U1-ACO-101-A/B/C |
COMPRESSOR |
PLANT AIR COMPRESSOR |
U1-DRY-101 |
DRYER |
PLANT AIR DRYER |
U1-FIL-104-A/B |
FILTER |
PLANT AIR PRE-DRYER FILTERS |
U1-FIL-105-A/B |
FILTER |
PLANT AIR POST-DRYER FILTER |
U1-VPK-108 |
PACKAGE |
AIR COMPRESSOR PACKAGE |
U1-VSL-101 |
RECEIVER |
PLANT AIR RECEIVER |
U1-VSL-102 |
RECEIVER |
INSTRUMENT AIR RECEIVER |
B1-CRN-101 |
CRANE |
MAINTENANCE SHOP CRANE |
15 Infrastructure
15.1 Access and Local Communities
The Project is located near Interstate-40 along with nearby access to rail and a natural gas transmission line. Currently, the Project receives electrical power from a 12kV powerline and the SSF operates off this power. Figure 15.1 shows general infrastructure needs for the Project.
95
Figure 15.1: Fort Cady Project infrastructure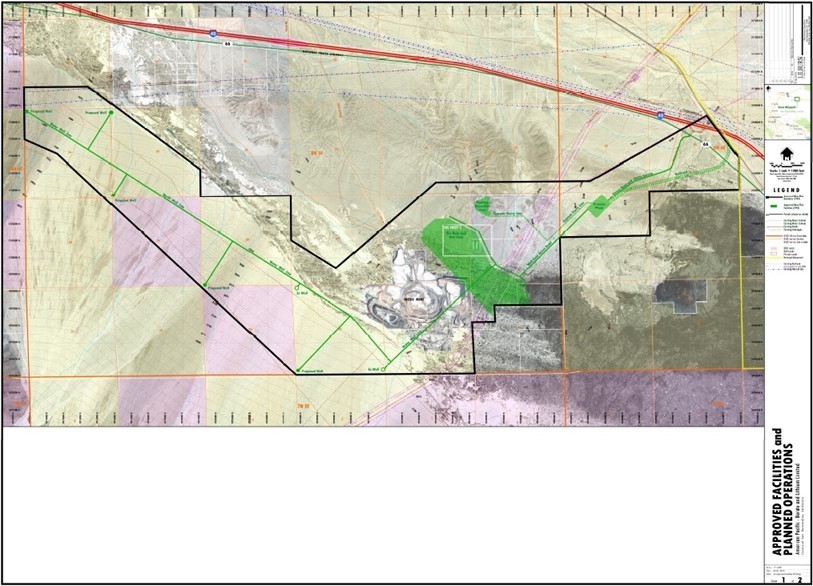
96
15.2 Site Facilities and Infrastructure
The infrastructure required for the Project is expected to consist of the following:
15.3 Security
The Project currently has 24-hour security service and camera surveillance for critical areas and areas with high-traffic, with gates at entrances to the Project area. 5E is considering constructing a fence around the property.
15.4 Communications
The Project currently utilizes a satellite-based internet service, which is fully functional. For larger operations, 5E has considered a dedicated fiber line to site or a dedicated cell tower amongst other potential options. Additionally, a strong cell phone signal is available.
15.5 Logistics Requirements and Off-site Infrastructure
15.5.1 Rail
Rail is not currently used by the Project; however, the BNSF rail is situated next to the Project and is being assessed for logistical requirements. Several transloading and rail service providers have also been contacted for potential off-site loading to rail transport.
15.5.2 Port and Logistics
The Port of Los Angeles, Long Beach, and San Diego are all within a half-day drive from the Project on major highways. 5E has a truck scale on-site that can weigh deliveries to and from ports or rail.
15.5.3 Off-site storage and distribution
Storage and distribution locations off-site are being explored, and discussions have been initiated with several potential providers.
97
16 Market Studies and Contracts
This section was completed with reference to a preliminary market study performed by Kline and Company, Inc. titled Boric Acid, Calcium Chloride, Gypsum Market Studies and Pricing Models dated June 19, 2025. 5E incorporated information obtained through consultation with industry experts, discussions with current end-use customers, and other publicly available sources to complete this section.
16.1 General Market Overview
Initially, 5E recognizes two primary minerals mined through ISL at the Project : borate and calcium. 5E will produce boric acid from its borate mineral and either calcium chloride or gypsum from the calcium mineral. Additional byproducts can be produced from other minerals and elements included with metals salts (i.e., lithium and magnesium); however, additional testing, analysis and research will need to occur to finalize a process before these minerals can be included in economic analysis.
16.2 Borates
16.2.1 Market Overview
Based on the preliminary market study, global boric acid demand was estimated at approximately 1,137k metric tonnes per year in 2024 and is projected to grow at a compounded annual growth rate (CAGR) of 5.5%, reaching 1,834k metric tonnes per year by 2033.
The growth is driven by both traditional and emerging sectors, with applications spanning E-glass, textile fiberglass, specialty borosilicate glass, fertilizers, ceramics, and detergents, as well as high-value uses such as permanent magnets, semiconductors, nuclear energy, and advanced defense materials. Currently, glass applications account for 21% of total demand, non-glass applications for 40%, and the remaining 39% is attributed to specialty borates. The boron market is a global oligopoly where two companies dominate approximately 85% of global supply. Specific to boric acid, there are approximately 13 global suppliers; however, the market remains dominated by the two largest suppliers.
16.2.2 Historical Pricing
The global boric acid market has historically demonstrated stable prices with periods of relatively low volatility. Between 2010 and 2024, prices averaged $789 per short ton F.O.B. with the material driver to prices being supply and demand. Figure 16.1 provides the historical and forecasted supply and demand. and Figure 16.2 provides the historical pricing and forecasted pricing.
There are two historical periods where pricing significantly increased relative to historical averages, and both are driven by tightness in supply and demand. In 2010 and 2011, a labor dispute caused a plant shutdown at one of the larger producers which caused a supply constraint such that demand exceeded supply. This led to a period where pricing increased to $1,229 per short ton in Q4 2011. In 2020, the world experienced the COVID-19 pandemic. During the COVID-19 pandemic, demand dissipated causing pricing to drop to as low as $470 per short ton in Q2 2020. Once the pandemic ended, demand surged such that supply capacity could not keep pace with demand. This led to the second period where pricing significantly increased to $1,213 per short ton in Q2 2022. Although there has been a small decline since the COVID-19 pandemic, increases in demand have led to prices remaining elevated relative to long term historical averages. At the end of 2024, boric acid prices stabilized around $1,000 per short ton.
98
Figure 16.1: Project market capacity versus demand
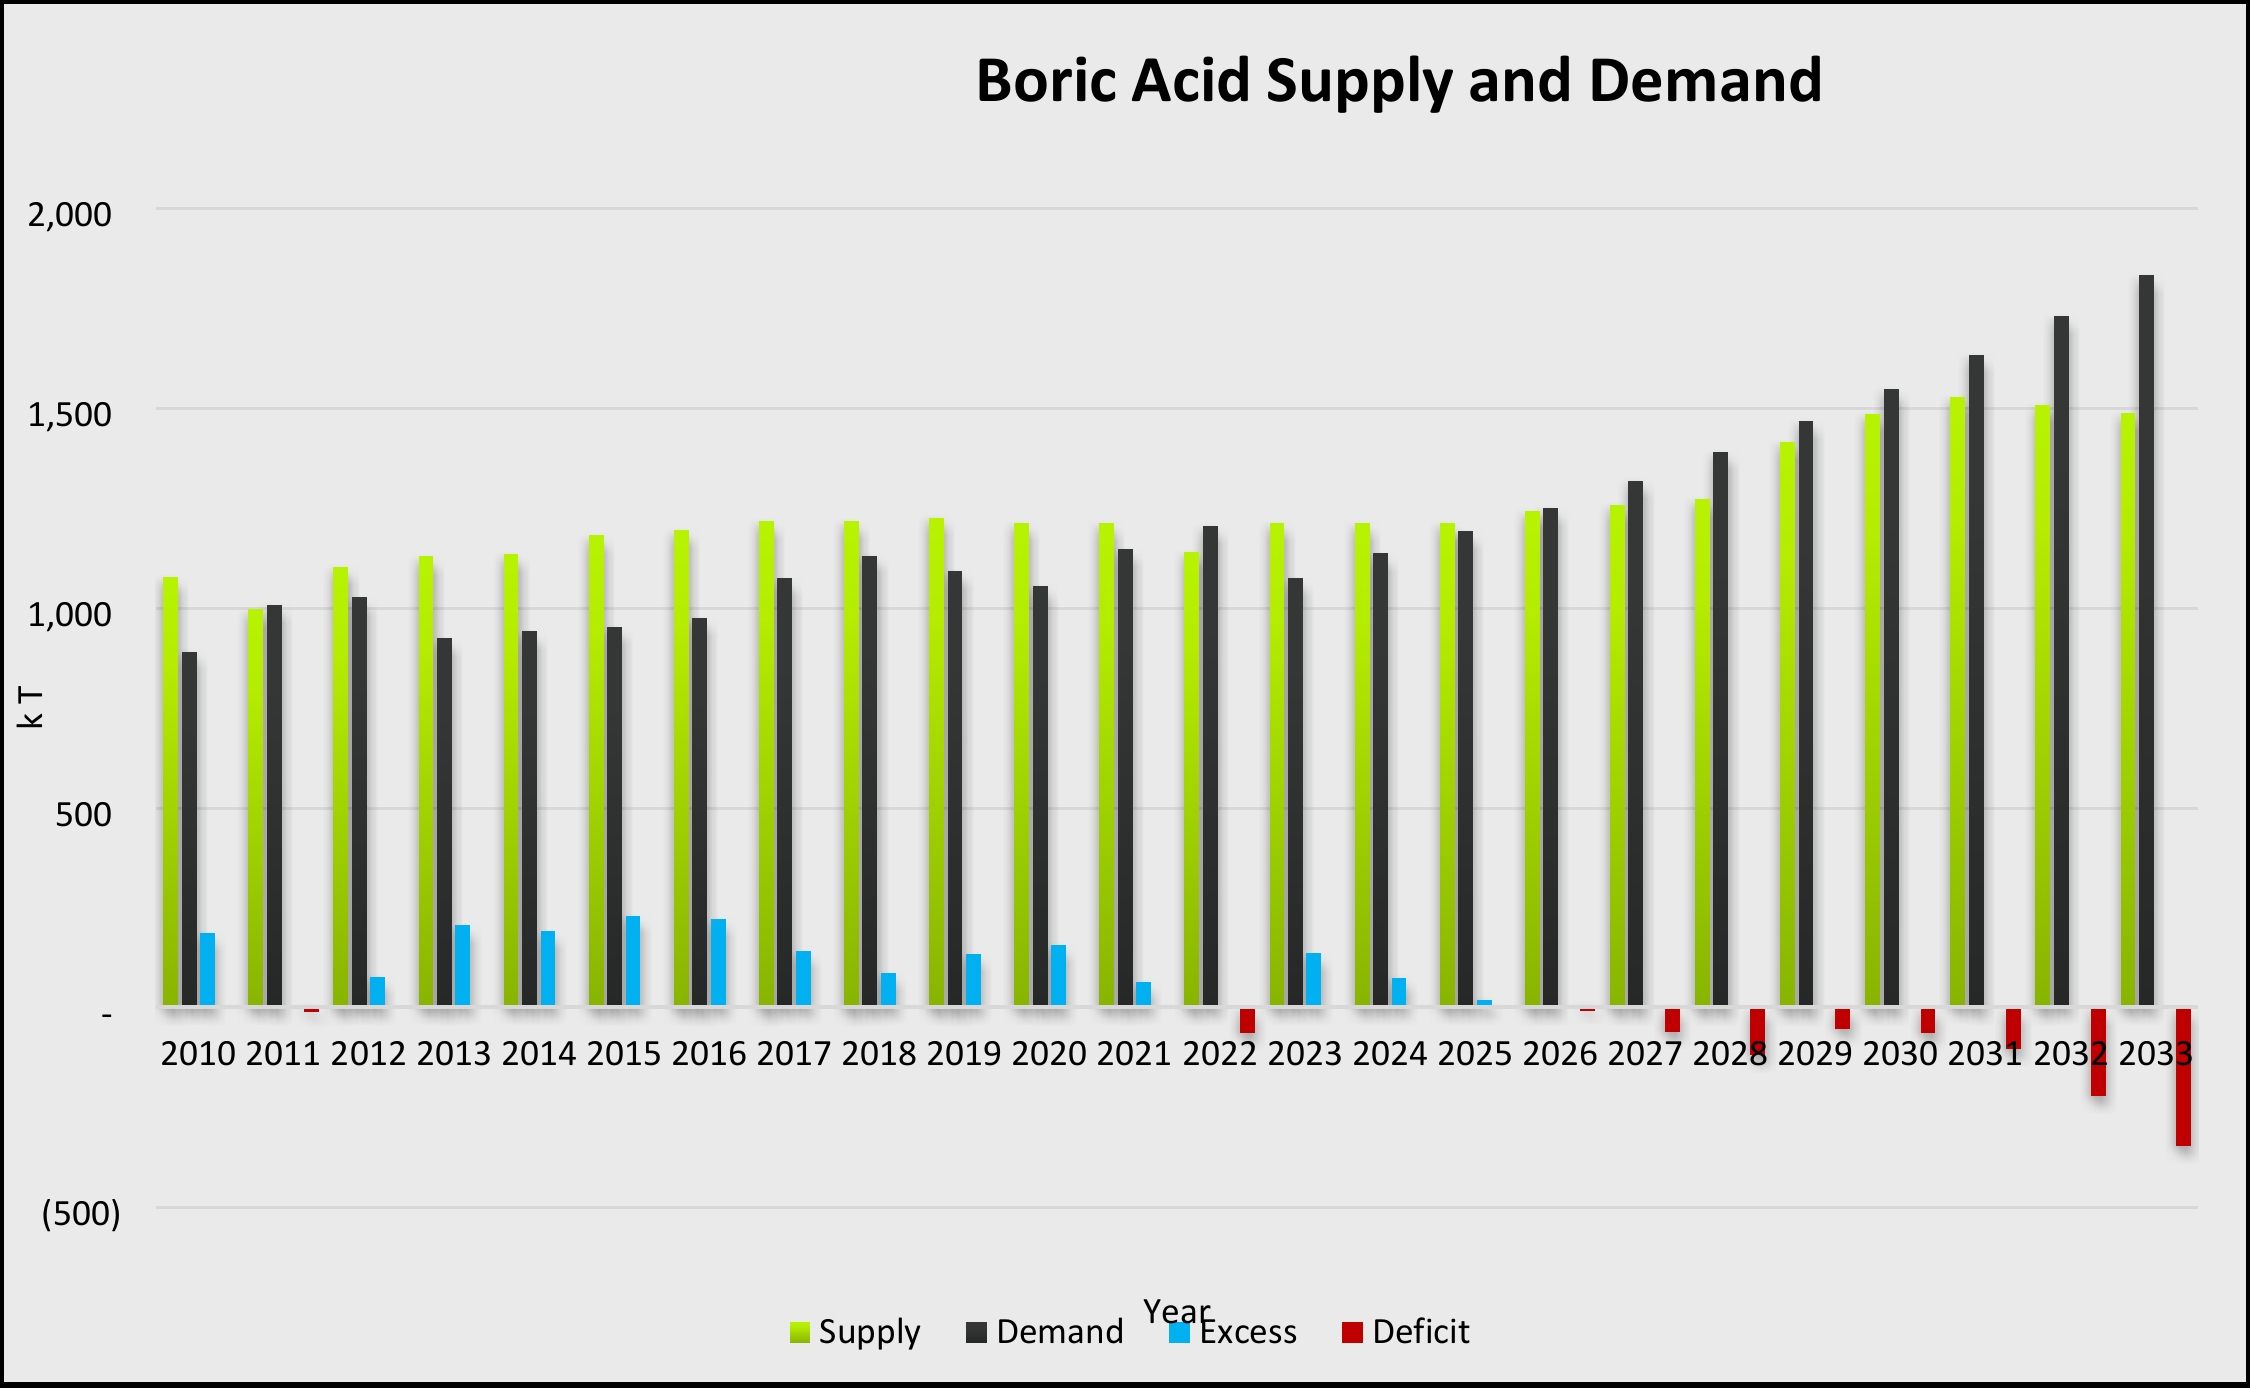
Figure 16.2: Forecasted boric acid pricing, per Kline 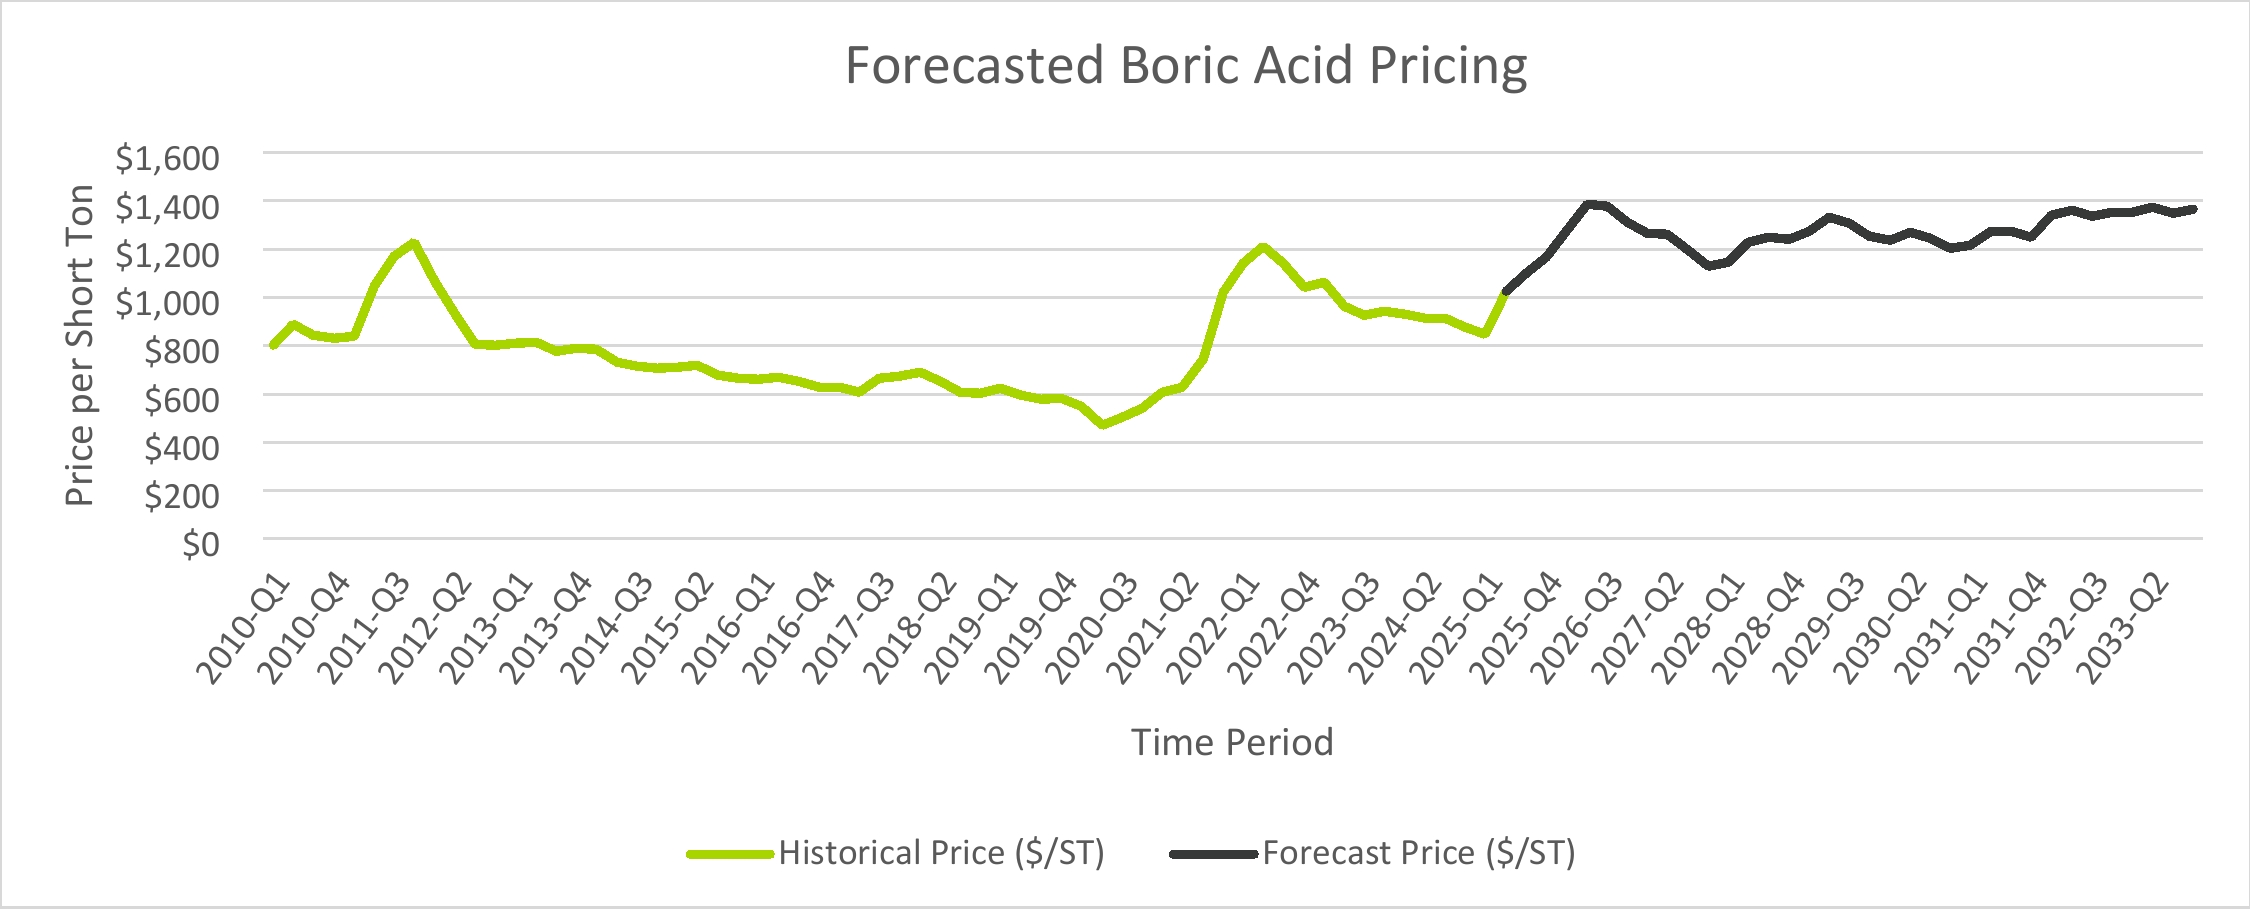
Boric acid is commercially available in two primary grades: granular and powder. Granular technical grade is the most traded form and serves as the standard product for large industrial customers. Powder grade, typically a byproduct of the screening process, is more variable in quality and availability and is required for high-specification applications such as pharmaceuticals or electronics.
Pricing is also influenced by packaging format. While bulk shipments offer the lowest-cost logistics solution, producers typically charge a $25 – 50 per short ton premium for smaller pack sizes, such as 50 lb. bags, to account for handling and
99
purchasing in smaller quantities. Despite these differences, the underlying production costs for both grades and pack sizes are similar, indicating that pricing differentials are driven more by market dynamics and buyer preferences than by cost structure.
16.2.3 Market Balance
Over the period of 2010 through 2021, supply was sufficient to meet demand. Since 2021, global boric acid demand has steadily outpaced, with the imbalance expected to widen further through the end of the decade. Estimates project boric acid demand to grow from 1,137k metric tonnes in 2024 to 1,834k metric tonnes per year by 2033, driven by strong momentum in specialty glass, agriculture, EVs, and specialty applications. In contrast, supply is forecast to grow at a slower pace relative to demand, increasing from 1,242k metric tonnes in 2024 to 1,488k metric tonnes per year by 2033, resulting in a cumulative market shortfall that begins in 2025 and reaches approximately 346k metric tonnes by 2033.
On the supply side, growth remains limited due to the industry’s high consolidation, with most of the production concentrated among Rio Tinto in the U.S. and Eti Maden in Turkey. Most other global producers operate at smaller scales or focus on lower-grade borates. While Eti Maden has confirmed a capacity expansion of 60k metric tonnes per year by 2027, no other major new supply is expected in the next 3 – 4 years. Several announced projects face delays or uncertainty. Additionally, China’s opportunistic capacity has shifted toward domestic consumption and is often constrained by quality limitations.
Given the limited pipeline of new capacity and rising demand from sectors such as EVs, permanent magnets, and high-end agriculture, the boric acid market is expected to remain imbalanced. This tight supply outlook is likely to support continued pricing strength and enhance the commercial case for new entrants capable of delivering high-purity, reliable supply to strategic regions such as the U.S. and Asia.
The supply-side analysis in Figure 16.1 presumes moderate expansion at existing suppliers, 5E’s anticipated supply per schedule in late 2028, and one additional major boric acid supplier entering the market per their publicly stated timeline. Demand-side analysis was built based on bottom-up analysis of expected and/or published end market expansion, moderated with the end market value in use as price pressures build on lower value applications. With existing market tightness, tailwinds for pricing exist as customers seek new supply sources outside of the existing oligopolistic market.
The analysis of the substitutability of boric acid in end uses concluded that most large volume applications have low or no risk of substitutability. Specifically, boric acid provides unique functionality in applications such as specialty glass, boron steel, and permanent magnets that have limited, and in many cases, higher cost alternatives such as rare earth elements, or would require significant investment to reformulate. Additionally, concerns for moderately substitutable applications have been identified as primarily other borate containing molecules (i.e., colemanite mineral), however, most market participants who can producer end products with a concentrate such as colemanite have already switched versus the boric acid alternative.
16.2.4 Market Costs
Estimating the operating unit cost of boric acid production is challenging due to limited public disclosures. One major supplier, being state-owned, does not report production costs separately, while another producer groups all borate-related products under a broader minerals category in its annual filings, complicating the isolation of boric acid costs. Recent company reports indicate that overall borate production costs are increasing due to input cost inflation, higher third-party expenses, and operational pressures. Although some inflationary effects have begun to stabilize, one of the larger producers faces margin pressure, incurred a reserve downgrade in 2018, and have implemented active cost-control measures with its board reportedly pushing for stronger operational discipline. 5E expected costs are given in Section 18.2.
100
16.2.5 Boric Acid Market
Boric acid is essential in diverse industries, catering to both commodity and specialty markets. Customers include large-scale users in glass and agriculture as well as smaller buyers purchasing through distributors. In high-value applications like specialty glass, flame retardants, and boron derivatives, performance outweighs price. Substitution is uncommon due to boric acid’s reliable boron content and superior downstream performance compared to boron ores like colemanite or ulexite. Figure 16.3 provides an overview of boric acid demand by end use.
Figure 16.3: Boric Acid Demand by End Use, per Kline
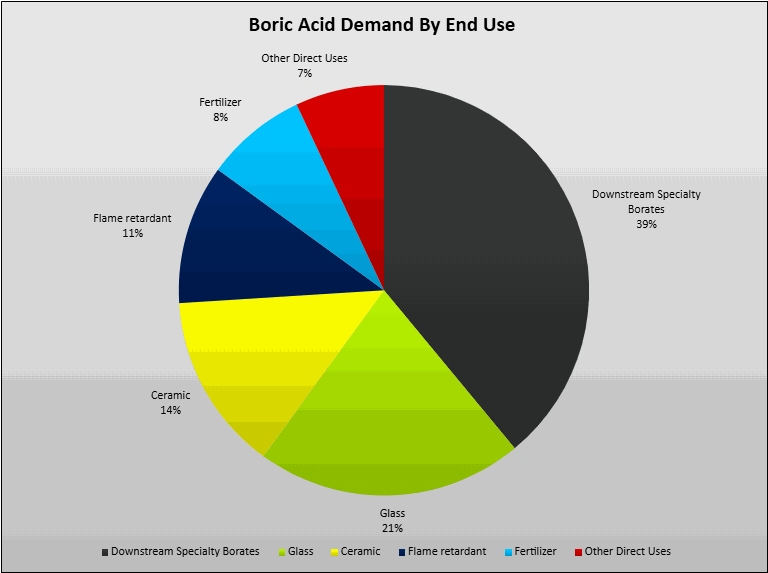
Logistics and customer proximity dictate packaging and shipment formats for boric acid, usually provided in 25-kg bags, one-ton bags, or bulk containers which are transported by truck, rail, or ocean freight. Asia remains the leading sales region due to proximity and demand, but interest is rising in North America and Europe. This along with supply chain security efforts drives demand for high-purity boric acid from nations of reliable jurisdictions. In some areas, reliance on a single supplier prompts buyers to seek diverse and dependable sources.
Geopolitical concerns and consistent quality needs are likely to lead some buyers to pay a scarcity premium for reliable boric acid supply. Governments, especially in the U.S. and European Union, are encouraging domestic production of critical and strategic materials, boosting interest in new market entrants.
The market’s opacity, reliance on negotiated contracts, and duopolistic nature mean there is no standard index price for boric acid. Pricing is highly influenced by demand, purity requirements, and capacity utilization. Kline’s latest model
101
predicts Chinese boric acid prices will increase to about $1,364 per short ton by 2030, driven by ongoing supply constraints and rising demand from high-specification sectors. Figure 16.2 provides forecasted boric acid pricing.
16.2.6 Boric Acid Specifications
Boric acid expected technical grade specifications are as follows:
16.3 Calcium Chloride
16.3.1 Market Overview
Calcium chloride (CaCl2) is a versatile chemical compound widely used in various industries due to its hygroscopic properties and ability to lower the freezing point of water. It is commonly employed in de-icing and dust control applications, where it effectively melts ice and suppresses dust on roads and construction sites. In the oil and gas industry, it is used to increase fluid densities and control swelling. The compound is produced through several methods, both naturally from brine purification and synthetically via the Solvay process, where it is a byproduct of soda ash manufacturing, and by reacting hydrochloric acid with limestone.
The global calcium chloride market was estimated to be 3,825k metric tonnes in 2024, having seen higher-than-normal growth from the previous year of 1.5%. North America represents approximately 40% of global demand, followed by Asia, Europe, the Middle East, Africa, and South America. U.S. demand in 2024 was 1,050k metric tonnes, with growth expectations of 0.6% CAGR until 2034.
16.3.2 Historical Pricing
Calcium chloride pricing has nearly doubled since 2007, when average prices in the U.S. were $267 per metric tonne, reaching $500 in early 2025. The two biggest year-over-year increases during that time were between 2008 and 2009 and 2021 and 2022. The U.S. market has some of the highest average prices seen globally, driven by recent demand for winter road treatment and a supply deficit due to plant closures during the twenty-first century. The U.S. is thus a net importer of calcium chloride, with Mexico, China, Canada, Europe, and the Middle East as the main sources in recent years.
16.3.3 Market Balance
The U.S. calcium chloride market is dominated by two large public companies. The larger company operates a former Dow plant in Ludington, Michigan, with a calcium chloride capacity of 700k metric tonnes per year. The plant processes brine supplied by a Canadian operation. The second largest U.S. producer currently operates four plants throughout the U.S., two brine-based facilities in the Mojave Desert (California), and two facilities that use HCl and limestone feedstock in West Virginia, and Louisiana.
102
Outside of these two market leaders, the U.S. has limited calcium chloride producers. The U.S. market is also supplied by both Canada and Mexico. Leading Canadian producers include two brine-based producers. One Mexican-based producer, is the only plant in North America running the Solvay Process.
16.3.4 Market Cost
Calcium chloride is sold in liquid and solid form, but the market always sells on a dry weight basis (dry metric tonnes – DMT) with pricing and margins determined by application. De-icing and dust control are the lowest price applications, selling for around $240 per metric tonne, followed by construction ($300-350) and oil and gas ($450-550). While not consumed in large quantities, calcium chloride can sell for over $600 per metric tonne and approach $1,000 in food, agriculture, electronics, and chemical industry applications.
Production costs can be as low as $80-100 per metric tonne for liquid calcium chloride produced from brine. Producing flake and pellet grades requires additional capital and operational costs for drying, typically adding around $100 per metric tonne for flake and an additional $50-100 per metric tonne for pellet capabilities.
16.3.5 Calcium Chloride Market
When combined, the use of calcium chloride for road de-icing and dust control represents the largest application, with 2024 demand in the U.S. reaching 252k metric tonnes for each. De-icing is tied to winter weather patterns, where demand in the northern U.S. and Canada was strong in 2024 and early 2025. Historically and looking ahead, both segments are expected to grow at around 0.5% CAGR.
Usage in the oil and gas sector as a drilling fluid is the largest individual use in the U.S. at 294k metric tonnes. Key markets include Permian (West Texas), Marcellus (Appalachia), and offshore (Gulf of Mexico). U.S. oilfield growth projections are roughly 0.75% in 2025 and 2026, with similar growth expected through 2030, followed by a gradual decline.
The remainder of the market comprises construction (147k metric tonnes) and other uses (105k metric tonnes), spread across numerous end-use applications such as food and beverage, agriculture, desiccants, refrigeration and cooling, water treatment, concrete and masonry surface treatment, metallurgy, tire weighting, humidification, and chemical synthesis. Growth for these categories is slightly higher, at 1.0% and 1.25% CAGR for construction and other uses, respectively. Figure 16.4 provides a breakdown of U.S. calcium chloride market demand and growth from 2024 to 2034.
Figure 16.4: U.S. calcium chloride market demand and growth, 2024 – 2034
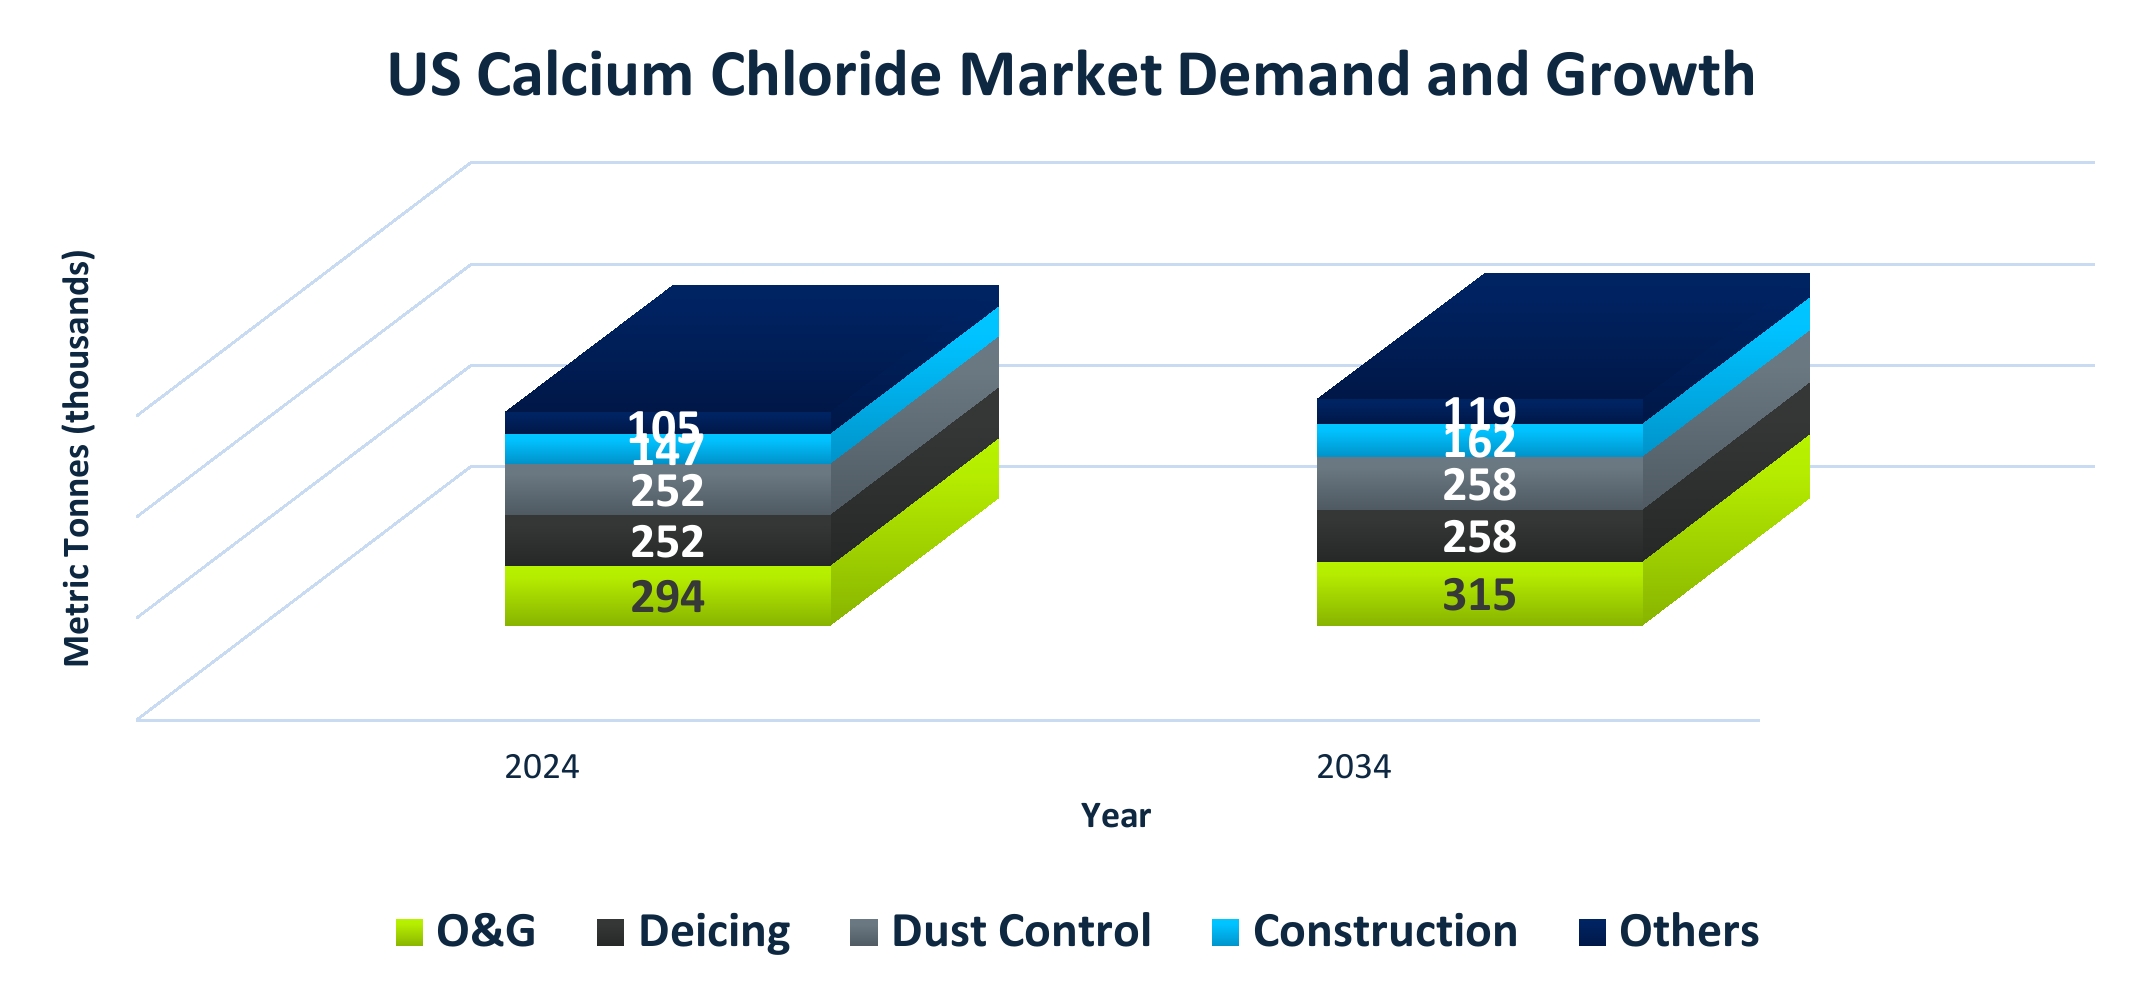
103
16.3.6 Calcium Chloride Specifications
Calcium chloride is sold in the market in various forms: liquid (with concentrations ranging from 28-42%), flake (72-87%), pellets or prill (92-97%), and powder (83-99%). These ranges represent observed concentrations from U.S. producers. Powder is collected from pellet or prill processing. Most applications utilize calcium chloride in liquid form, so solids are dissolved in water for most final uses. Given its exothermic properties, which make solid calcium chloride effective at melting snow, heat management must be considered during dissolution.
Product purity is separate from the above-mentioned criteria. Common contaminants include alkali chlorides (such as NaCl), magnesium (such as MgCl2), and calcium hydroxide and specifications typically call for impurities to be less than 5%. For certain food and beverage applications, producers can obtain various certifications, such as Halal, Kosher, etc.
16.4 Gypsum
16.4.1 Market Overview
Gypsum, a versatile mineral, finds extensive use in construction, agriculture, and industry. Primarily utilized for drywall, plaster, and cement, it provides fire resistance and acoustic insulation in construction. In agriculture, gypsum enhances soil structure by supplying calcium and sulfur. It is obtained through natural mining and as a synthetic byproduct from flue-gas desulfurization (FGD). Between 2019 and 2024, U.S. gypsum demand held steady at approximately 44 million metric tons, with prefabricated products leading the market. During this period, the U.S. market experienced a modest growth rate of 0.1% CAGR.
16.4.2 Historical Pricing
Between 2019 and 2024, gypsum prices rose steadily due to supply constraints and cost pressures. In 2024, the average price for calcined gypsum reached $63 per metric tonne, while uncalcined gypsum averaged $13 per metric tonne. The sharper increase in calcined gypsum prices was driven by value-added processing and strong demand from the construction sector.
In 2024, the price of crude uncalcined gypsum used in cement and agriculture varied and was estimated to range from $36 to $87 per metric tonne, depending on the grade and application. Meanwhile, synthetic gypsum prices remained stable at approximately $6.5 per metric tonne from 2019 to 2024. Figure 16.5 below provides historical pricing for various types of gypsum.
104
Figure 16.5 Average market price for uncalcined gypsum by grade and application, per Kline
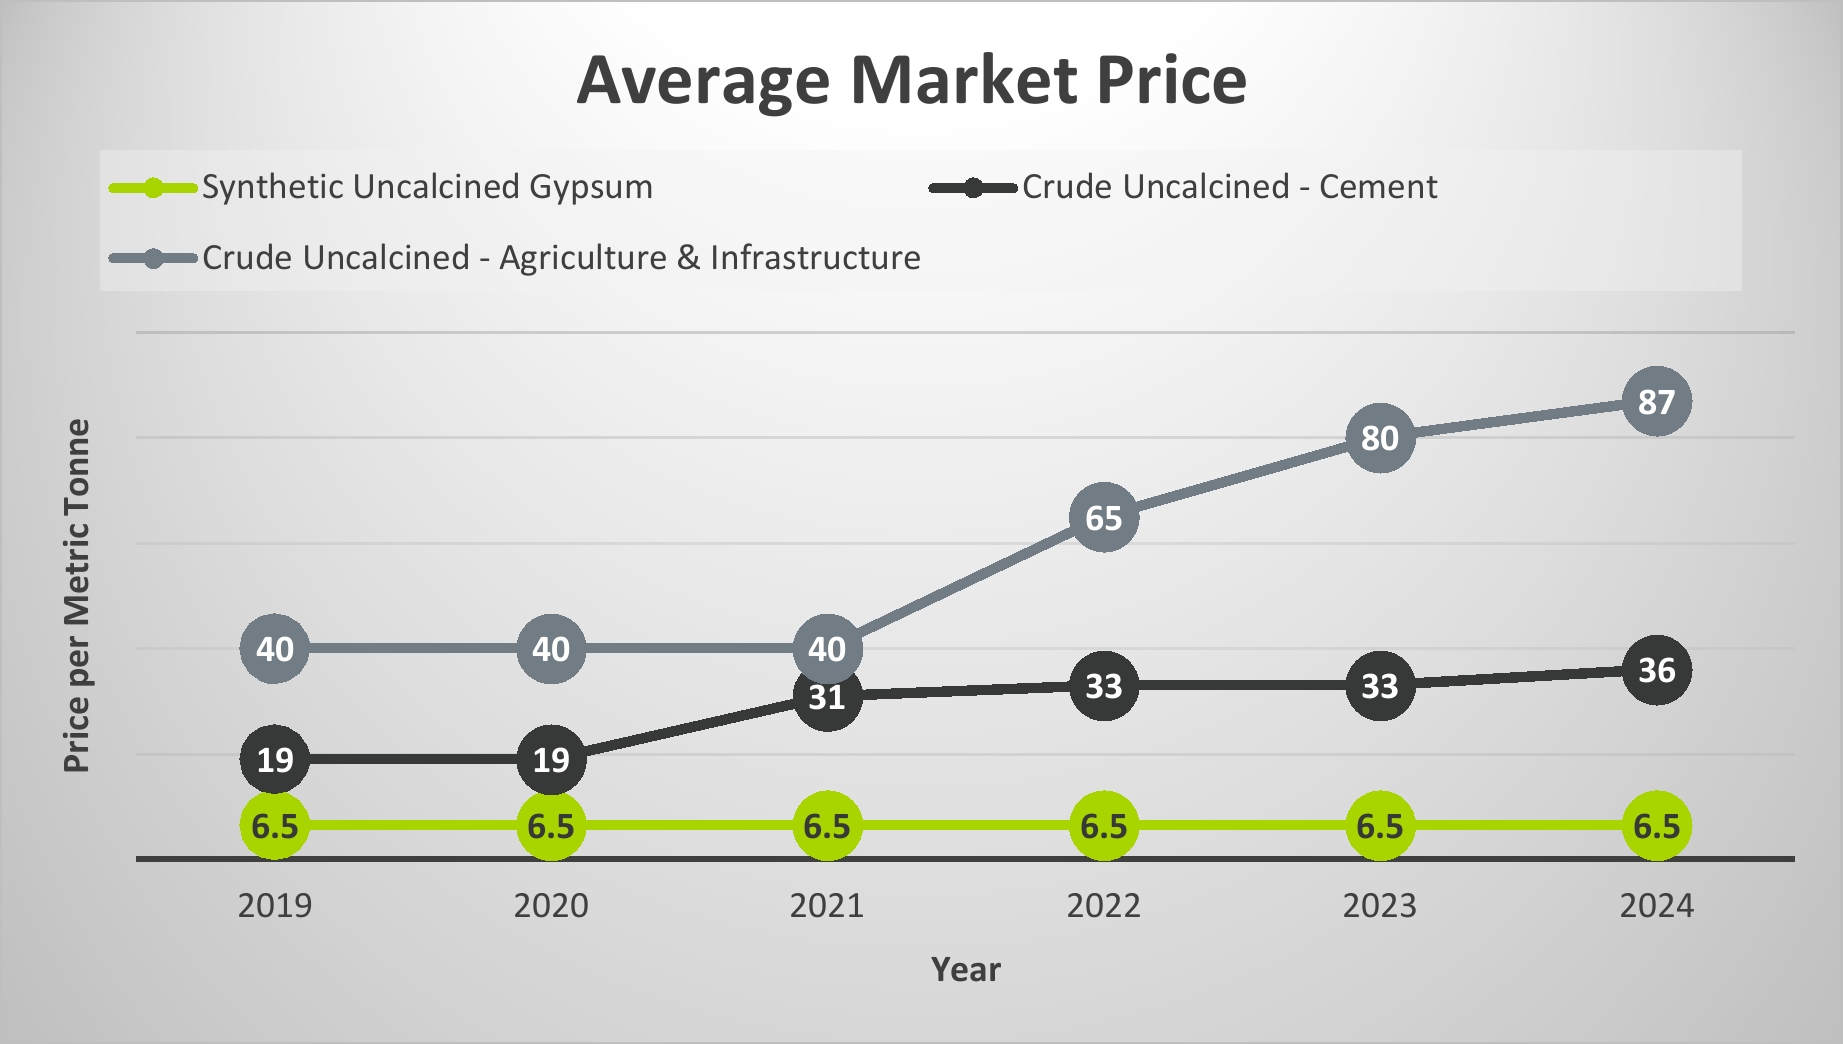
16.4.3 Market Imbalance
The U.S. gypsum market is supported by both domestic production and imports. Imports have risen due to limited local supply near demand centers and the decline in synthetic gypsum output caused by the phase-out of coal-fired power plants. As coal-fired power plants reduce production, the drop in synthetic gypsum supply is anticipated to open market opportunities for 5E's gypsum output. The Project is strategically located near major agricultural demand centers and wallboard manufacturers, which are expected to be primary outlets for the byproduct.
Gypsum is imported from countries such as Mexico, Spain, and Canada. Despite these imports, the U.S. retains substantial domestic production capacity, with major producers including USG, National Gypsum, and Georgia-Pacific. Figure 16.6 provides a breakdown of the U.S. production between crude and synthetic gypsum.
105
Figure 16.6 Gypsum USA production
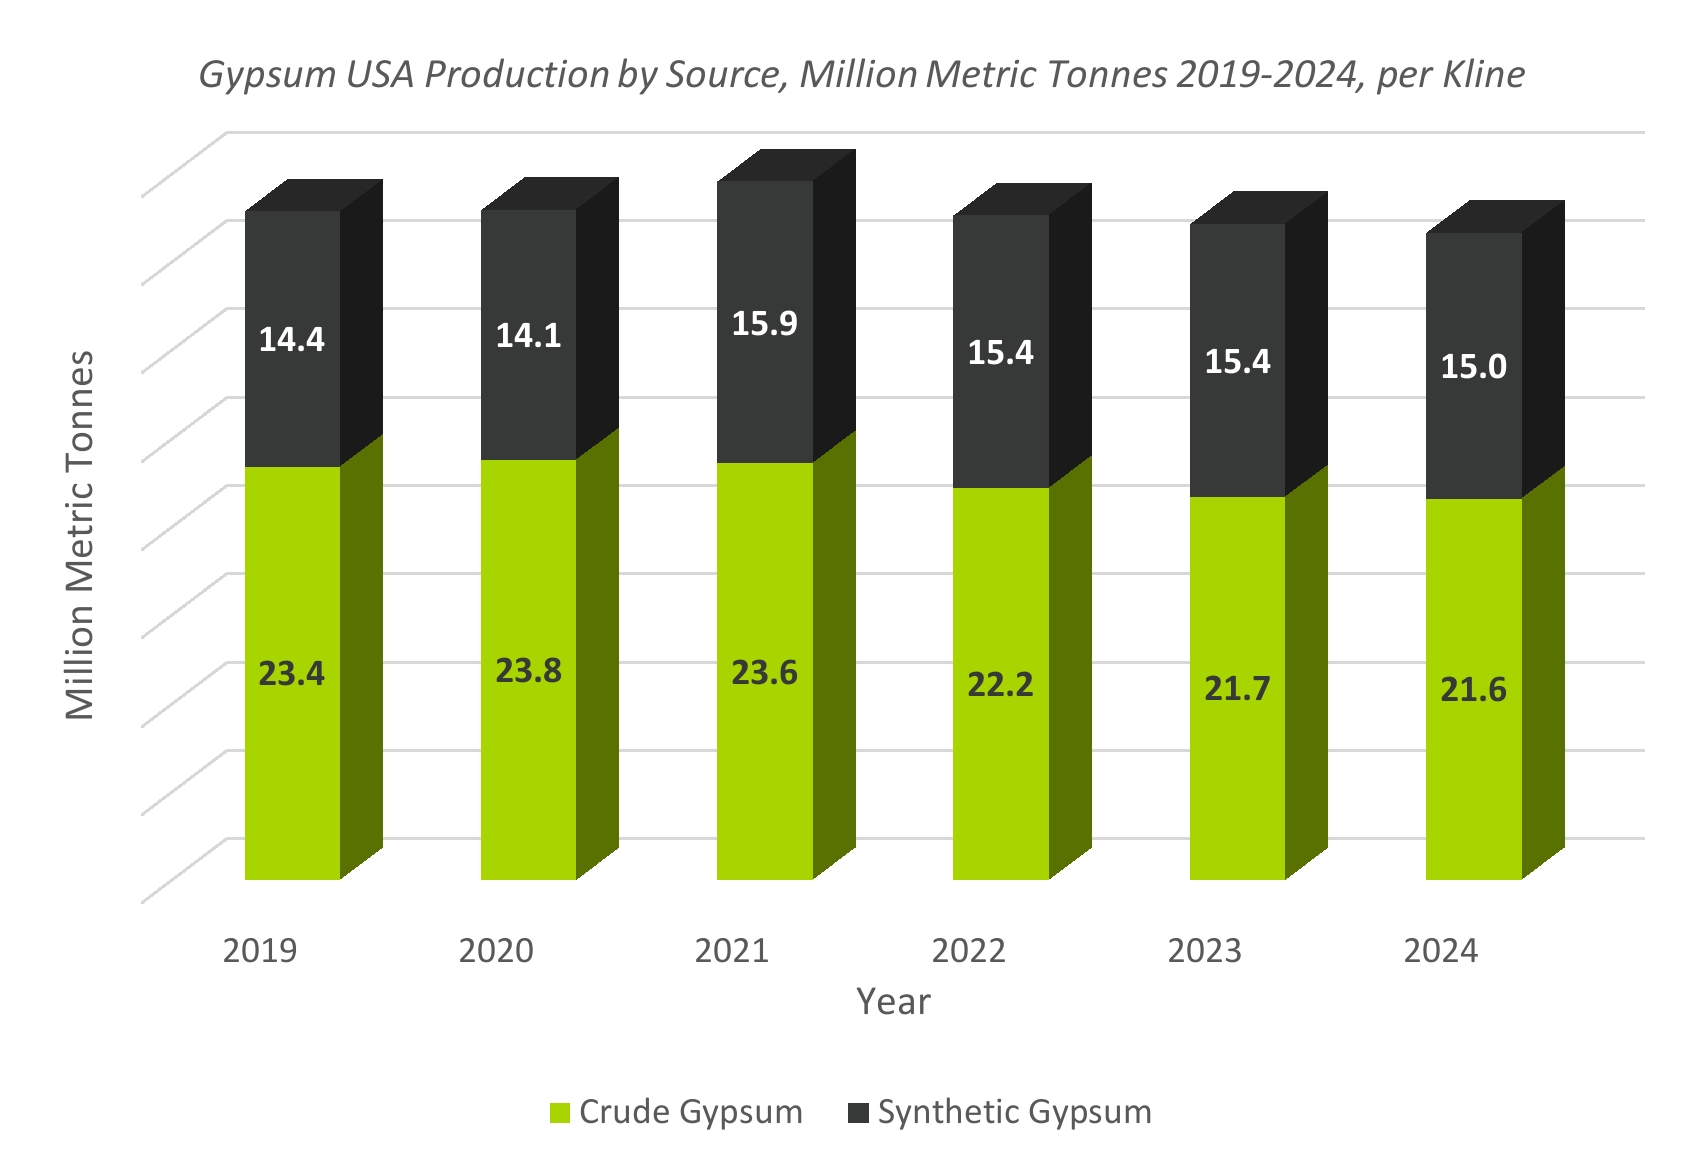
16.4.4 Market Costs
The operating costs for gypsum production can vary significantly due to several factors. Major producers typically do not disclose detailed operating costs publicly, making it difficult to determine the exact figures. However, overall production costs are influenced by factors such as increased manufacturing efficiency, recycling practices, and import dynamics. For example, synthetic gypsum, a byproduct of coal-fired power plants, is favored for its high purity levels (95–99%) and consistent quality. The cost of crude gypsum has increased due to rising energy and transportation expenses, while synthetic gypsum prices fluctuate based on transport distance and contractual agreements. Additionally, regional factors, such as proximity to mines and local demand, are crucial in determining market costs.
16.4.5 Gypsum Market
The U.S. gypsum market is projected to grow steadily at a 2.8% CAGR through 2034, driven by rising use of prefabricated gypsum products like lightweight wallboards, strong construction activity, and consistent cement demand. Agricultural applications are also gaining traction, especially in regions with saline soil and poor water quality, such as California. Specialty uses in plaster, joint compounds, and fillers add niche demand. Limited domestic supply near key consumption hubs has heightened reliance on imports, driving up delivered costs and creating an opportunity for regionally available synthetic gypsum to meet growing demand. Figure 16.7 provides the U.S. gypsum market and demand growth forecasted from 2024 to 2034.
106
Figure 16.7: U.S. gypsum market demand and growth, 2024 – 2034
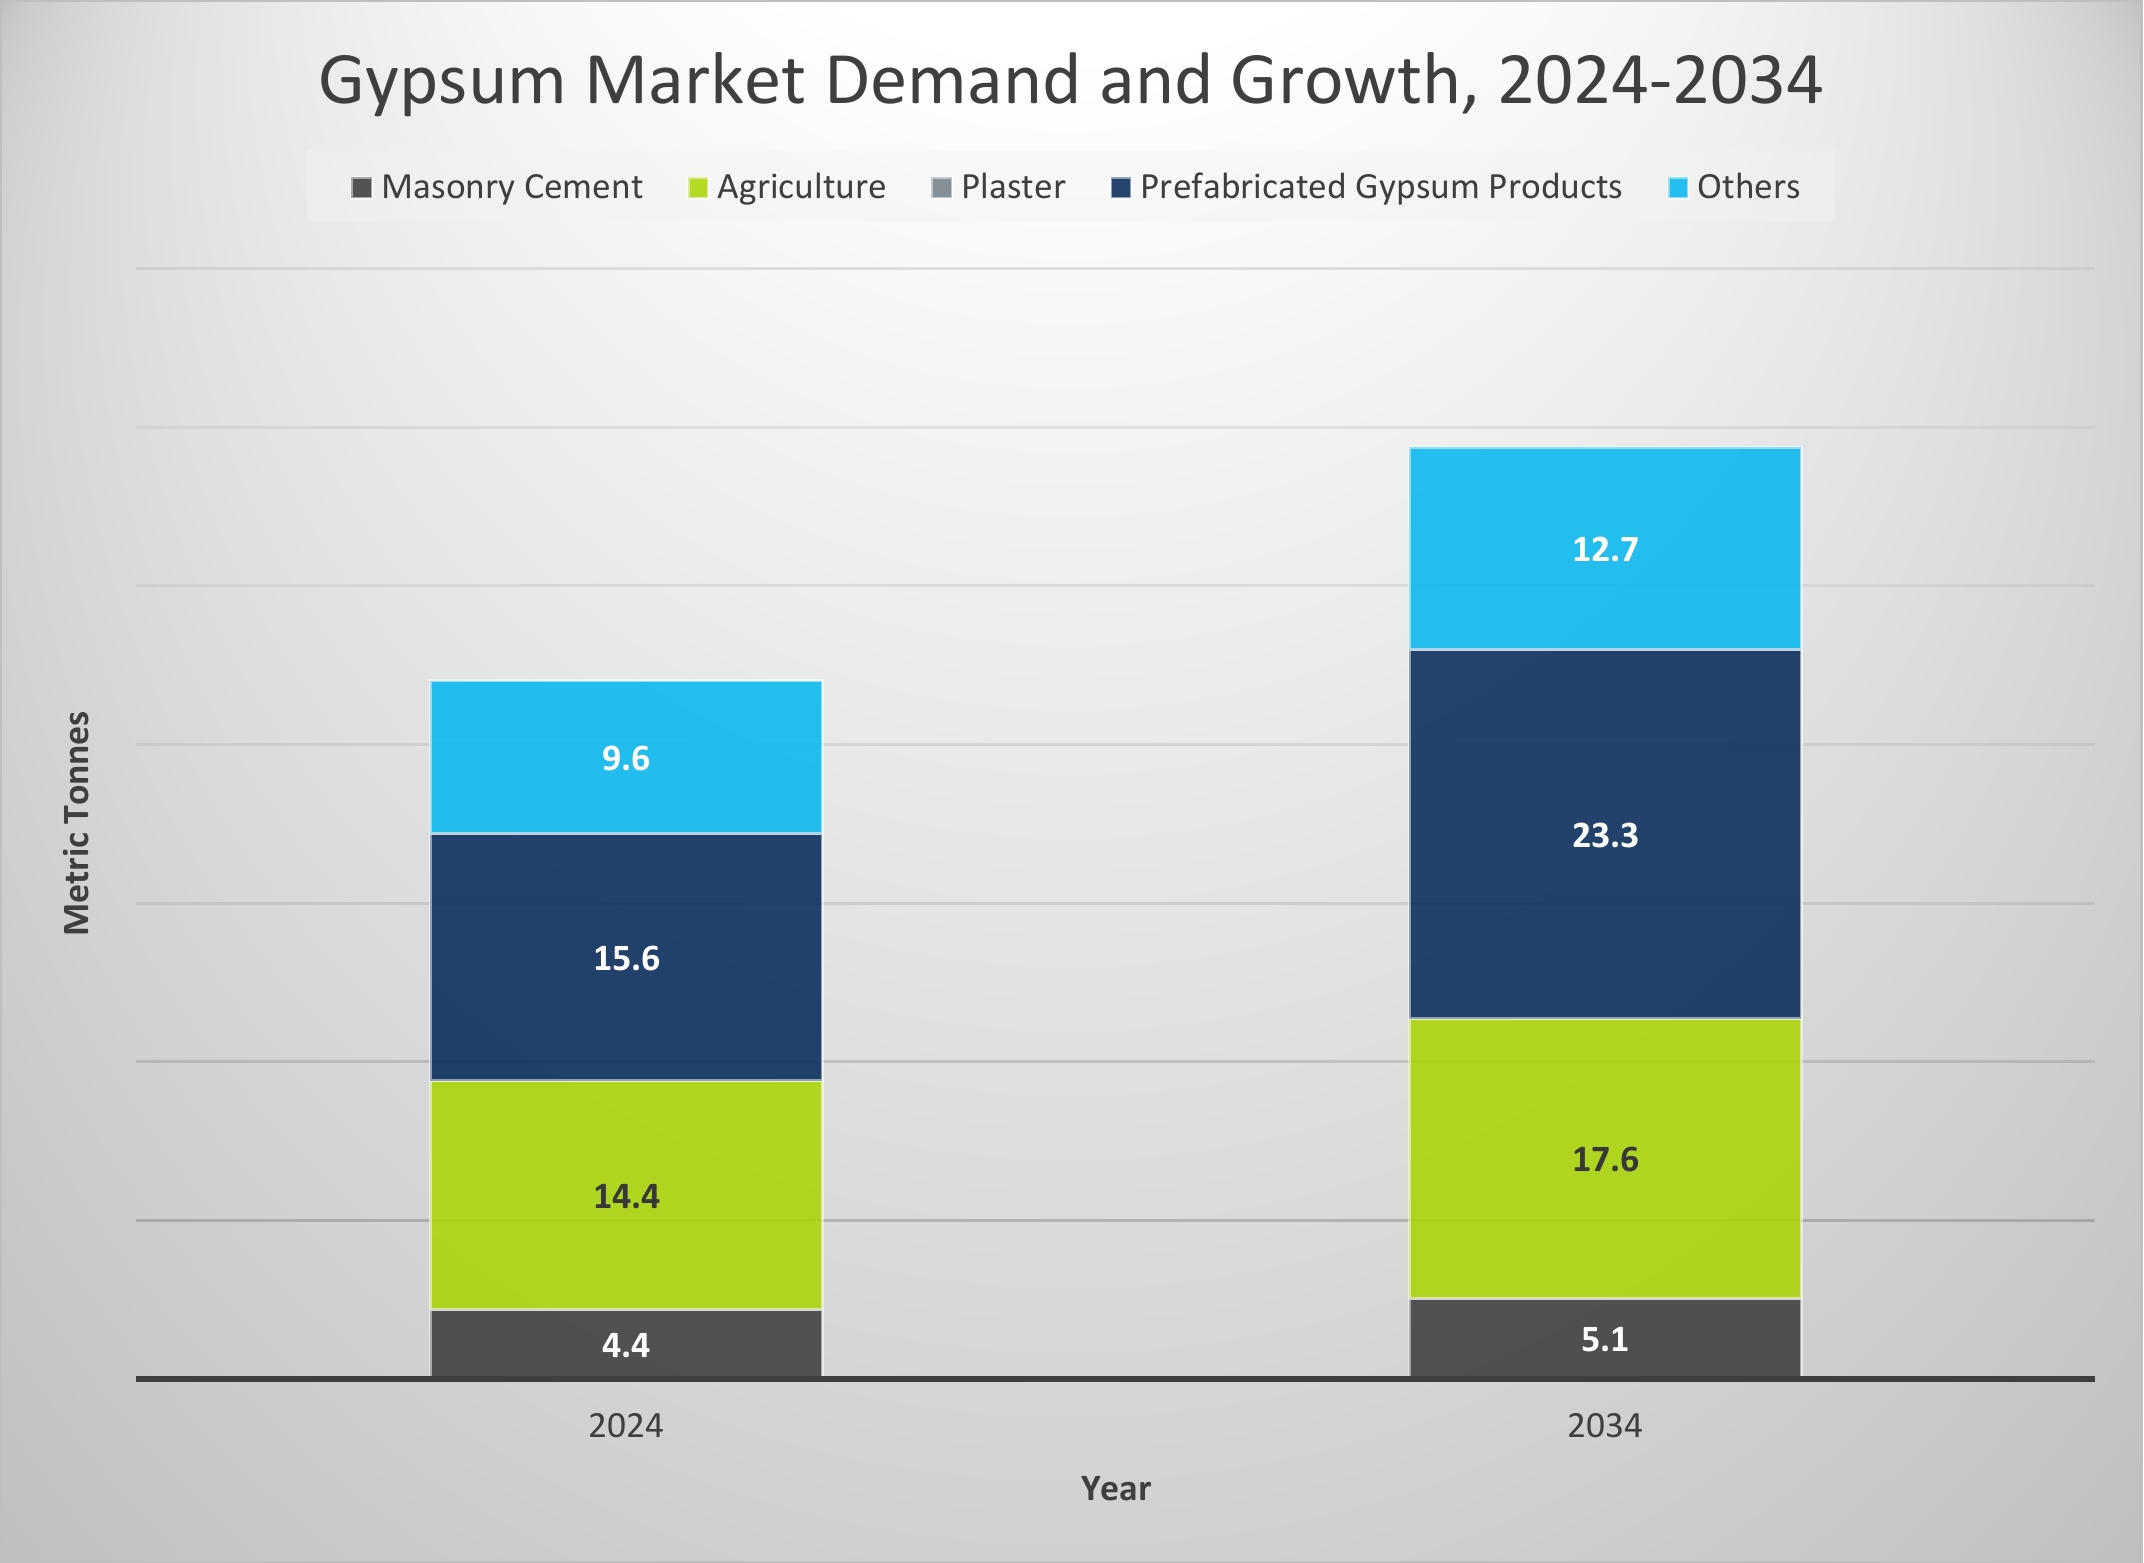
16.4.6 Gypsum Specifications
Final gypsum specifications are not confirmed at this time but it is expected that 5E will meet specification requirements for cement manufacturing.
16.5 Conclusions
Boric acid is a versatile product with hundreds of end-use applications that are critical to food security, national defense, decarbonization, electrification, and consumer consumption, among others. Due to increased demand for existing applications and new projected demand from future-facing technologies, combined with two major suppliers operating at, or near capacity, the supply of boric acid, and many downstream derivatives that require boric acid as feedstock, has been in tight supply, resulting in higher prices over the past 18 months. With existing suppliers unlikely, or unable, to add meaningful capacity, and only six new boric acid projects identified, of which only 5E is substantially permitted, the supply-demand deficit is expected to continue or worsen over the remainder of the decade. As a result, pricing will likely remain elevated and continue to rise. As a US-based producer, 5E is positioned to secure both domestic and strategic global supply chains for boric acid and other key boron derivatives that require boric acid.
16.6 Contracts
5E is engaged in discussions with several direct end-users as well as distributors for supply of boric acid, calcium chloride, and gypsum. 5E also has multiple signed heads of offtake agreements and non-binding letters-of-intent with terms agreed in principle which could result in definitive offtake agreements for multi-year supply. For boric acid
107
specifically, these customers represent multiple end-use applications including specialty glass, insulation, defense, agriculture, and others, as well multiple geographic regions. Since 5E has produced products from its SSF, 5E has supplied and qualified finished products with future customers, with the intent of securing contracts for most of the available phased capacity, while reserving a portion for spot market sales and increased tonnage for contracted customers. 5E is in discussions with a large, local cement manufacturer for offtake of gypsum and the customer has sampled the product. Additionally, 5E is discussing a calcium chloride offtake agreement with two different counterparties who have visited the site. One is a large regional distributor, and the other is a large global manufacturer with operations in the southeastern United States. Delivery and saleable gypsum and calcium chloride will likely focus on customers within a certain geographical radius to minimize overall delivered costs.
17 Environmental Studies, Permitting, and Closure
17.1 Environmental Requirements for Solution Mining
Due to the depth and characteristics of both the ore body and overburden, in the 1980’s the decision was made to recover the ore via solution mining. The Project mineralized deposit is an ideal candidate for solution mining as it is bound by faults. The Project is permitted to produce 90,000 short tons per year of borate, defined as boron oxide or boron oxide equivalent, thus permitting up to approximately 160,000 short tons of boric acid.
17.2 Environmental Study Results
The Project is located on both public and private lands. The public lands are managed by the BLM in accordance with its 43 CFR §§ 3809 Surface Management Regulations, the Federal Land Policy and Management Act, and federal environmental laws. The private lands are administered by San Bernardino County Land Use Planning (SBC – LUS) in accordance with the California Surface Mining and Reclamation Act, the County Development Code, and state environmental laws.
In 1990, a Plan of Operations (PoO) was submitted to the BLM and a Mining Conditional Use Permit and Reclamation Plan was submitted to San Bernardino County, which triggered environmental review under the National Environmental Policy Act (NEPA) and the California Environmental Quality Act (CEQA). BLM and the County prepared a joint Environmental Impact Statement (EIS)/Environmental Impact Report (EIR) to satisfy their environmental review requirements under NEPA and CEQA, respectively.
The EIS/EIR process follows clearly defined requirements for public participation and studies, such as threatened and endangered species, cultural resources, light, noise, and impacts to local communities. The studies were completed, as was the public participation process. Additional studies are currently not required at this time.
In 1994, the EIS/EIR process resulted in the issuance of a ROD from the BLM that approved the PoO and approval of the Mining Condition Use Permit and Reclamation Plan from the SBC – LUS, as discussed below.
17.3 Required Permits and Status
5E currently has the following permits in place:
There is no reclamation or closure requirement under MDAQMD.
108
There is an existing reclamation and closure requirement approved by LRWQCB. The bond amount to close the ponds is included in the SBC – LUS Financial Assurance Cost Estimate (FACE), discussed below. This is currently secured with a partially collateralized surety bond.
There is no reclamation or bonding requirement associated with the NONA.
5E maintains a cash bond with the California State Mining and Reclamation Agency, as administered by SBC – LUS. The FACE is updated annually. The FACE includes demolition of all existing structures, regrading, and revegetation of all disturbance on private lands. This bond also includes plugging and abandonment of all wells located outside the U.S Environmental Protection Agency (EPA) UIC purview (discussed below).
Reclamation and land disturbance for BLM is currently included with the FACE on file with the County and is secured with a partially collateralized surety bond. Previously, we held certificates of deposit, which are expected to be released since the surety bond was accepted and approved.
Per the permit conditions, 5E has installed five upgradient and four downgradient monitoring wells for the initial mining block. As a condition to receive final approval in November 2023, the EPA required modification to the permit and the installation of nine additional water monitoring wells for a total of eighteen monitoring wells. The permit was modified in June 2024, and the nine additional wells were installed in Fall 2024.
5E installed four IR Wells and subsequently modified the permit to include horizontal wells. In July 2025, two of the IR Wells were converted from vertical wells to horizontal-side tracks where each well extends approximately 1,500 ft.
5E has submitted and maintains a fully collateralized surety bond with the EPA for plugging and abandonment of all wells within the EPA AOR boundary.
109
18 Capital and Operating Costs
Capital and operating costs are incurred and reported in US dollars and are estimated at an initial assessment level with an accuracy of approximately ±25%.
18.1 Capital Cost Estimate
The capital cost estimate includes the first phase of commercial production for the LSBF and a summary by scope or area is provided below in Table 18.1. Capital expended for the SSF is excluded as that is in operation and for purposes of this TRS has been sunk.
Table 18.1: Capital summary
|
|
Scope / Area |
Capital Cost |
Process Facility & Infrastructure |
$280.7 |
COGEN |
$50.2 |
Evaporation Ponds |
$5.6 |
Wellfield |
$30.8 |
Sub-total Capital Costs |
$367.3 |
Contingency |
$55.1 |
Owner's Cost |
$12.5 |
Total Capital |
$434.9 |
18.1.1 Capital Cost Estimate – Processing Facility and Infrastructure
The capital cost estimate for the LSBF Project has been developed with a high level of confidence and rigor, in alignment with Association for Advancement of Cost Engineering (AACE) Class 4 standards. This estimate supports the development of a new greenfield processing facility, strategically located adjacent to 5E’s existing SSF. Designed for a production capacity of 130,000 short tons per year of boric acid and associated byproducts, the LSBF Project marks a significant milestone in the company’s long-term growth strategy.
Led by Fluor, an industry leading engineering and construction firm, in close collaboration with 5E and Tier 1 equipment vendors, the estimate reflects the project’s scope as defined in February 2025. Between February and June 2025, the project team successfully completed a targeted value engineering program and additional technical test work. These efforts resulted in meaningful refinements to both the process design and execution strategy, which have been integrated into the project’s critical engineering deliverables, including updated process narratives, flow diagrams, material balances, and equipment list/pricing.
These refinements have contributed to a more efficient and cost-effective project configuration. Key improvements included optimizing the boric acid head grade, removing the need for upfront solid/liquid separation equipment such as clarifiers, and incorporating evaporation ponds for sodium chloride handling. Additional efficiencies were achieved through the optimization of utilities and tankage, the removal of the boiler system (now supported by the Cogen WHRS), reuse of existing site infrastructure, and a more compressed facility layout.
110
Collectively, these enhancements have led to a reduction in the capital expenditure estimate while simultaneously increasing the facility’s design capacity. The improvements have also strengthened the project’s financial model, resulting in a more favorable internal rate of return (IRR) and improved overall economic performance. Furthermore, the process modifications and supporting test work have increased confidence in the technical basis of design, providing a solid foundation for the next phase of project development. Table 18.2 provides a detailed breakdown of the Process Facility and Infrastructure portion of the estimate in Table 18.1.
Table 18.2: Detailed breakdown of process facility and infrastructure
|
|
Description |
Total Cost |
Direct Field Costs |
$265.1 |
Indirect Field Costs |
$28.3 |
Total Field Costs |
$293.4 |
Home Office Costs |
$18.6 |
Total Field and Office Costs |
$312.0 |
Escalation |
$12.4 |
Contingency |
$46.8 |
Sales and Use Taxes |
$3.3 |
February 2025 Class 4 – Indicated Total Cost |
$374.6 |
Value Engineering and Process Refinements |
($47.1) |
July 2025 Class 4 – Indicated Total Cost with Adjustment |
$327.5 |
The capital estimate summary above reflects the outcome of a structured and disciplined development process. To support this estimate, a robust methodology was applied—grounded in industry best practices and tailored to the specific characteristics of the LSBF Project. The following section outlines the basis of estimate, including the data sources, engineering inputs, pricing strategies, and assumptions that underpin the capital cost model.
18.1.2 .Processing Facility and Infrastructure – Basis and Methodology
The capital estimate methodology integrates a combination of vendor budget pricing, historical cost data, and engineering-developed material take-offs (MTOs), and Fluor’s proprietary unit rate databases. Direct field costs were calculated using Fluor’s Standard Unit Effort Hours Catalog, adjusted for site-specific productivity factors derived from a proprietary algorithm that considers labor availability, climate, site logistics, and project complexity. Mechanical equipment pricing was based on a mix of formal vendor quotes and internal benchmarks from similar projects.
111
Figure 18.1: Summary of equipment pricing
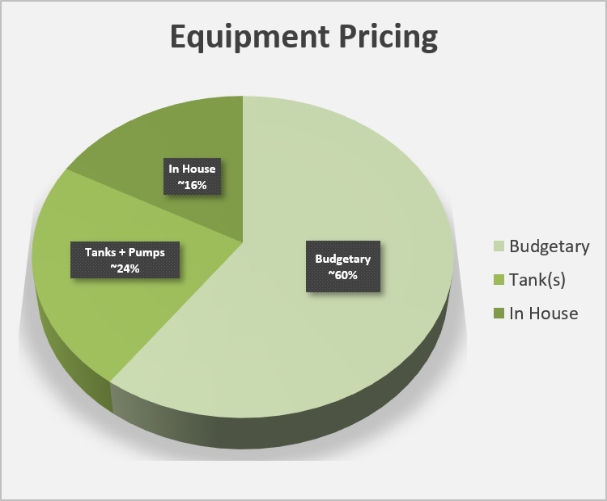
Table 18.3: Bid summary
|
|
|
|
Tier # |
Equipment Description |
Bid(s) Requested |
Bid(s) Received |
1 |
Crystallizer/Evaporator Package (including Heat Exchangers and Ancillaries) |
3 |
3 |
1 |
Centrifuge Package |
4 |
3 |
1 |
Filter Press Package |
4 |
4 |
1 |
Belt Filter Package |
4 |
3 |
1 |
Sedimentation Package (Clarifier/Thickeners) |
4 |
4 |
1 |
Dryer/Cooler Packages (with Cyclones) |
4 |
4 |
1 |
Chilled Water Package |
1 |
1 |
1 |
Boiler System Package |
1 |
1 |
1 |
Boric Acid Bagging System |
In-house |
N/A |
1 |
Electric House Package |
In-house |
N/A |
The estimate includes detailed cost modeling for civil works, concrete, structural steel, buildings, mechanical equipment, piping, electrical systems, instrumentation, and control systems. Indirect field costs, home office costs, and construction services were applied using historical percentages and industry norms. Allowances were included for material overbuy, construction waste, and MTO uncertainty. Escalation was applied at 4% from Q1 2025 forward, and a deterministic contingency of 15% was included to account for uncertainties within the defined scope.
The estimate assumes an EPCM execution strategy, with contractors providing construction labor, supervision, tools, and equipment. All costs are presented in U.S. dollars and reflect pricing as of Q1 2025. The capital estimate excludes owner’s costs, permitting, land acquisition, environmental remediation, and other external factors. Owner’s costs such as mine well development, insurance, commissioning, and infrastructure outside the battery limits are addressed separately.
The estimated accuracy range for this AACE Class 4 estimate is ±25%, which is consistent with industry standards for projects at the PFS stage. This range reflects the typical level of definition at this phase and is not indicative of the quality of the estimate itself. Rather, it highlights the prudent approach taken to account for early-stage variables. To further demonstrate the strength and maturity of the LSBF estimate, Table 18.4 benchmarks the project’s deliverables against standard AACE Class 4 criteria. The estimate is supported by a comprehensive suite of engineering deliverables,
112
including process flow diagrams, simulation and material balance data, equipment lists, and preliminary design documentation, all of which contribute to a well-substantiated capital cost basis. For further details on the capital basis of estimate refer to 5EAM-G1-PLN-310-00001.
Table 18.4: 5E project deliverables versus standard AACE Class 4 criteria
|
|
|
|
Estimate Accuracy & Deliverable Requirements Class 4 |
|||
Category |
Estimate Items |
AACE Class 4 |
5E PFS |
Maturity Definition |
Engineering % Complete |
1-5% |
2.5-5% |
Project |
Plant Capacity |
Preliminary |
Defined |
Definition |
Class of Facility |
Preliminary |
Defined |
|
Plant Location |
Preliminary |
Defined |
|
Soils Hydrology / Geotech |
Preliminary |
Semi Defined |
|
Project Master Schedule |
Preliminary |
Preliminary |
|
Construction Execution Strategy |
Preliminary |
Preliminary |
|
Procurement & Contracting Strategy |
Preliminary |
Semi Defined |
|
Engineering Design Criteria |
Preliminary |
Semi Defined |
Engineering |
Process Flow Diagrams |
Preliminary |
Defined |
Deliverables |
Plot Plans |
Preliminary |
Preliminary |
|
Mechanical Equipment List & Datasheets |
Partial |
Semi Defined |
|
Piping Line List & Line Classes |
N/A |
Preliminary |
|
Piping Specialty Item List |
N/A |
N/A |
|
Electrical Equipment List |
Preliminary |
Semi Defined |
|
Instrument Index |
N/A |
N/A |
|
Material Specifications |
N/A |
Preliminary |
Bulks |
Equipment Envelope |
Cost Factor |
Equipment Modelling / Layout |
Quantification |
Civil |
Cost Factor |
100% Eng MTO |
|
Concrete |
Cost Factor |
50% Eng MTO / 50% Est MTO |
|
Steel |
Cost Factor |
85% Eng MTO / 15% Est MTO |
|
Piping |
Cost Factor |
65% Eng MTO / 35% Est MTO |
|
Electrical |
Cost Factor |
25% Eng MTO / 75% Est MTO |
|
Infrastructure |
Cost Factor |
100% Eng MTO |
Material Pricing |
Mechanical Equipment |
100% Budgetary or In-house |
60% Budgetary / 40% Inhouse |
Basis |
Electrical Equipment |
||
|
DCS / Control System |
||
|
Pipe & Pipe Fabrication |
Cost Factor |
In-House Prices from nearby representative project firm pricing |
|
Fabricated Structural Steel |
||
|
Bulk Electrical & Instruments |
||
Contract Pricing |
Civil / Site Prep / Piling |
Cost Factor |
In-House Prices |
Basis |
Concrete |
In-House Prices |
|
|
Buildings |
In-House Prices |
|
|
Steel |
In-House Prices |
|
|
Mechanical |
Cost Factor |
|
|
Piping |
In-House Prices |
|
|
Electrical & Instrumentation |
In-House Prices |
|
|
Insulation & Paint |
Cost Factor |
|
|
Module Fabrication |
N/A |
|
|
Logistics Cost |
Cost Factor |
|
113
|
|
|
|
Estimate Accuracy & Deliverable Requirements Class 4 |
|||
Category |
Estimate Items |
AACE Class 4 |
5E PFS |
Construction Inputs |
Temp Facilities & Services |
Cost Factor |
Preliminary; Historical DFC and IFC Factored Average Rates Used |
|
Construction Equipment Utilization plan |
||
|
Heavy Haul & Heavy Lift plan |
||
|
CM Staffing Plan |
||
|
Site Assignment Policy |
||
|
Area Market Labor Analysis |
N/A |
|
Estimate Accuracy |
AACE (18R-97) |
L: -15% to -30% / |
±25% |
|
Typical Contingency |
20% to 30% |
15% |
18.1.3 Capital Cost Estimate – Evaporative Ponds
The capital cost estimate for the solar evaporation pond system was developed by Ad-Infinitum who are recognized in the industry as one of the global leaders in evaporative pond design and execution. The estimate is in alignment with AACE Class 4 standards and is a culmination of a FEL-2 specific study commissioned by 5E.
This estimate supports the development of a new greenfield solar evaporative pond system encompassing a total of 37 acres including a scope taking into site and environmental parameters (topography, evaporation rates, temperature, wind, and radiation) developing steady-state mass and energy balances, and geometric and operational sizing of the ponds and berms, as well as developing a salt harvesting plan.
The capital estimate methodology integrates a combination of vendor and area subcontractor budget and material pricing, historical cost data, and engineering-developed material take-offs (MTOs). A contingency of 15% was included to account for uncertainties within the defined scope. All costs are presented in U.S. dollars and reflect pricing as of Q2 2025.
18.1.4 Capital Cost Estimate – Cogeneration Combined Power & Heat (CHP) Plant
A capital cost estimate for the Combined Power & Heat Plant (CHP) was derived from competitive budgetary bid quotations received from recognized global Tier 1 OEM vendors suppliers. The total direct and indirect packages installation cost was established by using a Lang factor which is a process industry standard methodology that utilizes a multiplier that represents the ration of the total installed cost (TIC) to the total equipment cost (TEC).
18.1.5 Capital Cost Estimate – Wellfield
The operation is an owner operated mining operation. A third-party contractor will perform drilling of the in-situ injection recovery well field and a third-party OEM has designed and will manufacture the artificial lift system. As detailed in Section 13, the wellfield calls for the installation of 27 horizontal wells and jet pumps for artificial lift. Table 18.5 below provides a summary of the wellfield capital cost. The cost for the wellfield includes the following: drill pad construction, 3rd party drilling, downhole material (casing, production tubing, and cement), and artificial lift (jet pumps and jet pump triplex surface pumps).
114
Table 18.5 Mining capital cost estimate
|
|
Description |
Total Cost |
Site Works |
$1.9 |
Well Materials |
$9.4 |
Drilling |
$5.6 |
Logging |
$2.0 |
Stimulation and Completions |
$2.1 |
Surface Facilities |
$3.7 |
Artificial Lift |
$6.1 |
Wellfield Sub-total |
$30.8 |
Contingency |
$4.6 |
Total Wellfield |
$35.4 |
18.1.6 Other Sustaining Capital
The wellfield is designed such that the quantity of wells is expected to be sufficient for the current life of mine and it is expected that overtime the extraction method will transition from injection of the mining fluid until the well becomes hydrostatic and then recovery of the fluid (i.e., “huff and puff” extraction) to complete reservoir flow and recovery. Using the current estimate of the wellfield as a basis, 5E assumed $5.7 million is outlaid incrementally every five years as sustaining for major workovers and any additional necessary wells.
18.1.7 Wellfield Basis
The wellfield capital estimates were based on actual equipment purchased for the SSF, vendor bids, actual costs derived from the injection recovery wells for the small-scale facility and July 2025 drill program, and third-party quotes. The quantity of wells estimated to provide the chemical plant with PLS to achieve the stated design is based on engineering simulations, actual wellfield data from the SSF, and incorporates work from MSME.
Mining equipment, initial wells, and sustaining capital cost estimates were based on the following:
18.1.8 Closure Costs
Closure costs have not been included in this estimate as the reserve and life of mine only account for 41% of the measured and indicated resource and it is assumed that expansion capital can be deployed in the future and the wellfield and mine plan can be updated to convert incremental resources to reserves.
18.1.9 Owner’s Costs
Table 18.6 provides the breakout of Owner’s Costs breakout and totals $12.5 million. This estimate was provided by 5E. No formal contingency is applied to Owner’s Cost.
Table 18.6: Owner’s cost breakdown
|
|
Item |
Cost |
Owner's team |
$4.2 |
Construction insurance |
$3.6 |
Taxes |
$4.7 |
Total |
$12.5 |
115
18.2 Operating Cost Estimates
Operating costs have been forecasted based on the material and energy balance provided by Fluor. Operating costs are segregated as variable operating costs and fixed operating costs in the financial model. Variable operating costs include packaging, logistics, and raw materials such as natural gas, hydrochloric acid, sulfuric acid, and lime. Fixed operating costs include administrative labor, operating labor, general and administrative overhead, repair labor, repair materials, depreciation as well as taxes and insurance.
As with capital costs, operating costs are captured in US dollars and are estimated at an initial assessment level with an accuracy of approximately ±25%.
18.2.1 Variable Operating Cost
Variable operating costs are derived from a material balance with the following assumptions:
Variable materials and prices represented on the basis of cost per a produced short ton of boric acid are shown in Table 18.7. Cost figures include estimated freight to 5E. Pricing for raw materials is based on historical costs for the 12-month period from July 2024 thru June 2025.
Table 18.7 Variable materials cost
|
|
|
Material |
Units |
Cost |
HCl 36% solution basis |
1,416.7 lb/ST H₃BO₃ |
$158.61 |
Sulfuric acid |
1,180.6 lb/ST H₃BO₃ |
$124.13 |
Lime |
423 lb/ST H₃BO₃ |
$197.47 |
The basis for packaging and logistics included the following:
The basis for utilities included the following:
18.2.2 Fixed Operating Cost
Fixed operating costs include the following:
116
Operating labor was derived from a principle first plan of operations with 80 operators and 30 employees for site administrative labor. Cost per person was estimated at $86,680 and the basis for fixed overhead was derived by the current overhead rate of spend for 5E which is approximately $150,000 per quarter and this is assumed to double for the LSBF. Repair labor and maintenance is estimated to be 3.0% of cumulative capital including sustaining capital. Taxes and insurance are assumed to be 1.5% of cumulative capital including sustaining capital. Depreciation assumes a 10-year useful life for initial capital and any sustaining capital is depreciated in the year incurred.
18.2.3 Other Operating Costs
Other operating costs include costs and credits associated with the material balance and process flow sheet which includes a byproduct credit for gypsum and calcium chloride and costs associated with metals precipitation waste. Gypsum is assumed to be net neutral cost and sold in the market at cost. Table 18.8 provides the breakdown of units and cost associated with other operating costs and Figure 19.2 provides the total operating costs and credits over life of mine.
Table 18.8 Other operating costs
|
|
|
Material |
Units |
Cost |
Metals precipitation waste |
$/ST |
45 |
Gypsum |
$/ST |
12 |
Calcium chloride |
$/ST |
55 |
18.2.4 Basis for Operating Cost Estimates
Operating assumptions were based on the following assumptions:
19 Economic Analysis
19.1 General Description
5E prepared a cash flow model to evaluate the Project’s reserves on a real basis. This model was prepared on an annual basis from the reserve effective date to the exhaustion of mineral reserves for the current mine plan. As discussed in previous sections, additional resources could be converted to additional reserves with expansion of the wellfield or mine plan in the future. This section presents the main assumptions used in the cash flow model and the resulting indicative economics. The model results are presented in U.S. dollars US$, unless otherwise stated.
All results in this section are presented on a 100% basis. As with the capital and operating forecasts, the economic analysis is inherently a forward-looking exercise. These estimates rely upon a range of assumptions and forecasts that are subject to change depending upon macroeconomic conditions, operating strategy and new data collected through operation of the small-scale facility.
117
19.2 Basic Model Parameters
Key criteria used in the analysis are presented throughout this section. Basic model parameters are summarized in Table 19.1.
Table 19.1 Basic model parameters
|
|
Description |
Value |
Mine Life |
37 years with partial last year using Proven and Probable Reserve |
Discount Rate |
7% |
All costs incurred prior to the model’s start date are considered sunk costs. The potential impact of these costs on the economics of the operation is not evaluated. This includes contributions to depreciation and the small-scale facility as these items are assumed to have a zero balance at model start. The selected discount rate is 7% given the Projects risk profile, U.S. jurisdiction, permitting status, capability to secure U.S.-agency financing and was chosen as a reasonable cost for funding based on review of comparable projects in the development phase of the mining cycle. Additionally, economic analysis is performed on a real basis that does not capture the nominal aspects of inflation, thus driving a slightly lower discount rate than would traditionally be captured on a nominal basis.
19.3 External Factors
19.3.1 Pricing
Modeled prices are based on the prices developed in the Market Studies and Contracts section of this report Section 16 (see Figure 16.2) and were developed on a real basis. 5E engaged Kline to perform a preliminary market study and the assumptions and inputs for revenue in the financial model were based on the preliminary market study. A sensitivity analysis is performed below, and the financial model is most sensitive to boric acid pricing and this forecast is a material assumption. The prices are modeled as:
All products produced by the operation are modeled based on independent pricing forecasts as described in Section 16 and were prepared as part of a preliminary market study performed by Kline. Kline built a regression pricing model forecast for boric acid on a real basis with key inputs and drivers of the forecast utilization of supply and demand, sulfuric acid pricing, and cost of freight. The material driver to the pricing forecast is supply and demand utilization whereby the boric acid market is forecasted to grow at 5.5% as disclosed in Section 16 but supply is forecasted to fall short. Gypsum pricing was based on actual 2024 real pricing and the model assumes 5E handles freight and logistics. The netback price for gypsum is $20.66 per short ton. Calcium chloride pricing was based on actual 2024 real pricing to the end market customers. This price was further discounted in the model to assume 5E would sell to distribution at bulk and the model assumes 5E handles freight and logistics. The netback price for calcium chloride is $119.64.
19.3.2 Taxes and Royalties
As modeled, the operation is subject to a combined 27.98% federal and state income tax rate. The model does not include any tax loss carryforwards and no existing depreciation pools are accounted for in the model. Any application of tax loss carryforwards would reduce the tax burden of the operation. The capital for the project is subject to depreciation over a 10-year period and sustaining capital is depreciated in the year incurred for purposes of financial modeling. There are no royalties to account for currently. The project is being evaluated as a standalone entity for this initial assessment without a corporate structure. As such, tax calculations presented here may differ significantly from the actual incurred by 5E.
118
19.3.3 Working Capital
The assumptions used for working capital in this analysis are as follows:
19.4 Technical Factors
19.4.1 Mining and Production Profile
The modeled mining profile was developed by 5E. The details of the mining profile are presented previously in this report. No modifications were made to the profile for use in the economic model. The modeled profile is presented in Figure 19.1.
Figure 19.1: Resource Extraction Profile
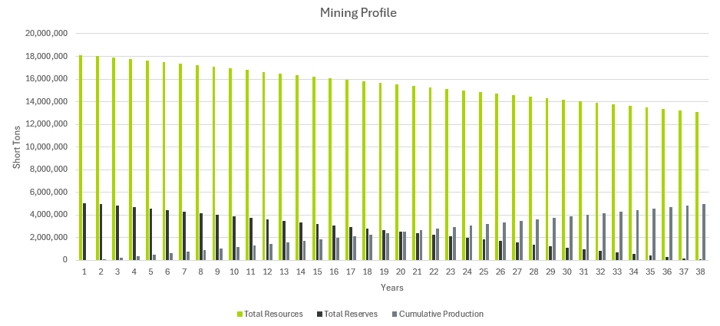
A summary of the modeled mine life profile is presented in Table 19.2 Life of Mine Summary.
Table 19.2: Life of mine summary
|
|
|
Description |
Unit |
Value |
Life of mine |
Years |
37.5 |
Reserves – Boric Acid |
Short Tons |
5.1 M |
Resources (total measured and indicated, exclusive of reserves) – Boric Acid |
Short Tons |
21.4 M |
19.4.2 Operating Costs
Operating costs modeled in US dollars can be categorized as variable, fixed and other operating costs credits. A summary of operating costs over the life of operation is presented in Figure 19.3 and Figure 19.4.
119
Figure 19.2: Operating costs (first ten years)
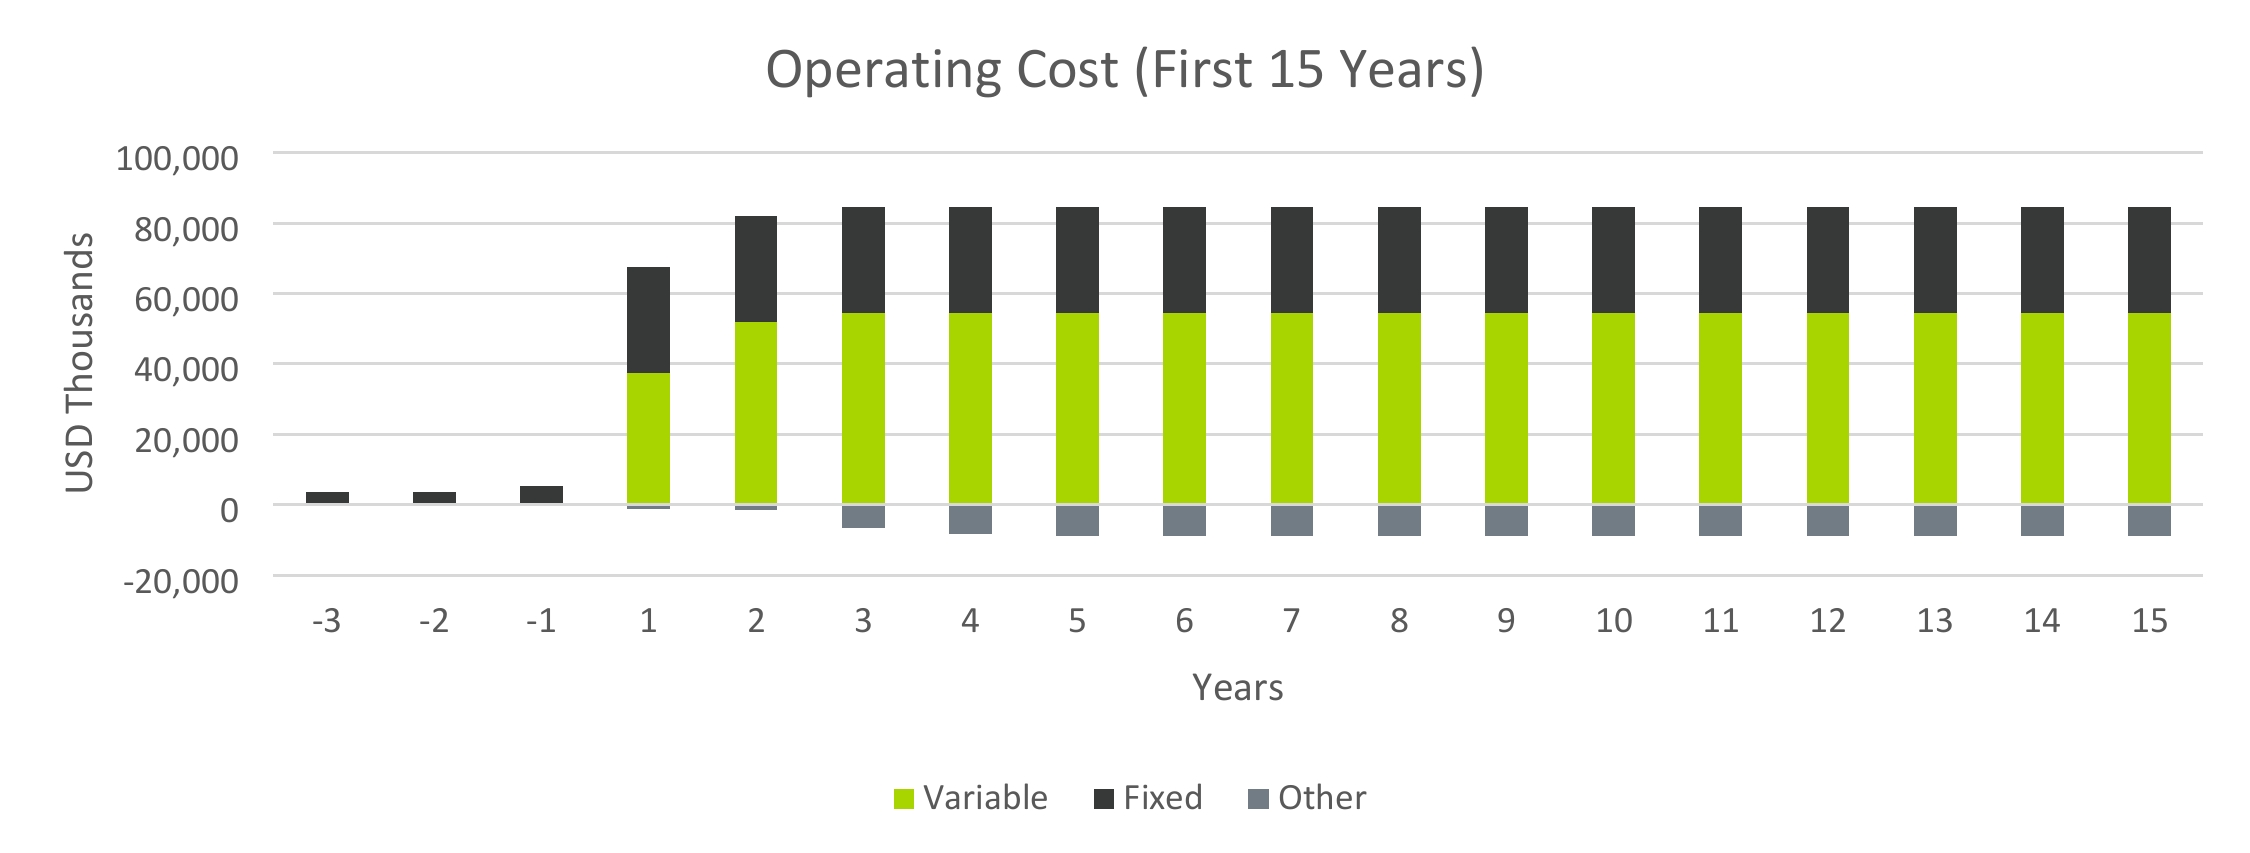
19.4.3 Variable Costs
Total variable operating costs over the life of mine are provided in Table 19.3 and Table 19.4.
Table 19.3: Variable operating cost over life of mine
|
|
Variable operating cost: |
Total US$ |
Materials |
$1,239,267 |
Logistics |
$573,214 |
Natural gas |
$197,341 |
Total |
$2,009,822 |
19.4.4 Fixed Costs
Table 19.4: Total fixed operating cost over life of mine excluding depreciation
|
|
Fixed operating cost: |
Total US$ |
Administrative labor |
$94,560 |
Operating labor |
$271,801 |
General and administrative overhead |
$48,600 |
Repair labor |
$203,883 |
Repair materials |
$285,436 |
Taxes and insurance |
$244,659 |
Total |
$1,148,939 |
19.4.5 Other operating costs / (credits)
Table 19.5: Total other operating costs / (credits) over life of mine
|
|
Other operating cost / credit: |
Total US$ |
Calcium chloride |
($250,590) |
Metals precipitation waste |
$39,507 |
Gypsum |
($103,530) |
Total |
($314,613) |
120
19.4.6 Capital Costs
Capital is modeled on an annual basis and is used in the model as developed in previous sections with 15% contingency. The modeled capital profile is presented in Figure 19.3.
Figure 19.3: Capital profile of the mine
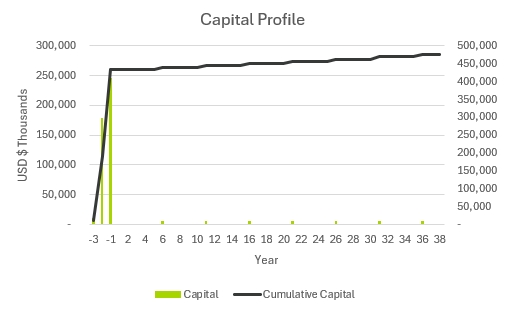
19.4.7 Infrastructure and Logistics
The economic analysis includes OSBL and ISBL capital, which includes a warehouse for boric acid storage and calcium chloride loadout station. Boric acid and calcium chloride transport will be serviced via truck with calcium chloride sold as a by-product credit in the local California market. Boric acid transport will be serviced via truck to local customers in the western United States, to the Los Angeles ports for shipment to Asia, and either shipped via truck to the eastern United States or shipped to rail for further transport. Capital includes a covered storage facility for gypsum which will be serviced via truck with gypsum sold as a by-product credit in the local California market. While revenue and by-product credits are captured in the economic model at F.O.B. pricing, freight and logistics are assumed as costs to 5E and included in operating costs estimates. Capital also includes an upgrade to the SoCal Edison service road that provides the main access to the Project. While a trade-off study is being performed, utility is assumed to be sourced via natural gas and main power delivered via gas COGEN. The capital estimate includes the cost and installation of the COGEN facility as well as a metering station and connection to the gas pipeline and all required piping to the COGEN facility. While it is common for similar projects to finance COGEN off-balance sheet and include as part of operating expenditure, the economic analysis assumes the COGEN is 5E operated and owned.
19.4.8 Economic Results
The economic analysis metrics are prepared on an annual after-tax basis in U.S. dollars. The results of analysis are presented in Table 19.6. The annual project after tax cash flow is presented in Figure 19.4.
121
Figure 19.4: Cash flow projection
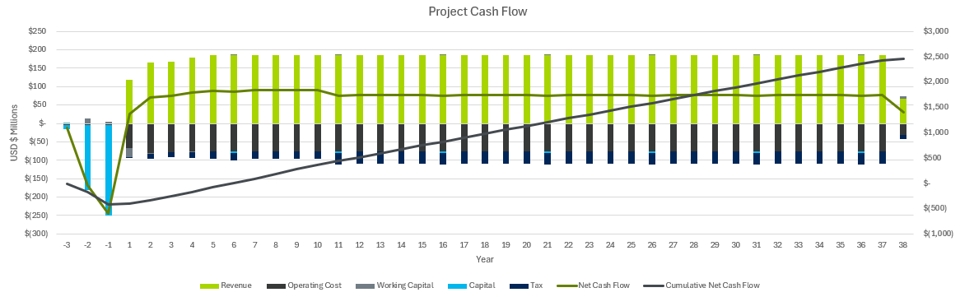
122
Table 19.6: Results of economic analysis
|
|
|
Life of Mine Cashflow |
Units |
Value |
Total Revenue |
US$ Million |
6,838.6 |
Operating Expenses |
US$ Million |
2,844.1 |
Operating Margin Ratio |
% |
58.4 |
Capital Outlay |
US$ Million |
474.8 |
Taxes Paid |
US$ Million |
1,054.0 |
Depreciation |
US$ Million |
474.8 |
Free Cash Flow |
US$ Million |
2,465.7 |
NPV @ 7% |
US$ Million |
711.3 |
IRR |
% |
19.2 |
Payback |
Years |
6.1 |
19.4.9 Sensitivity Analysis
Sensitivity analysis for the financial model was performed based on changes to boric acid price, annual production, discount rate, variable cost pricing, gypsum price, labor cost per person, and raw material acid utilization. Using a ±10% change for each variable, NPV7 is plotted in real dollars for comparison and arranged in order of total variability in Figure 19.5.
Figure 19.5: Sensitivity analysis
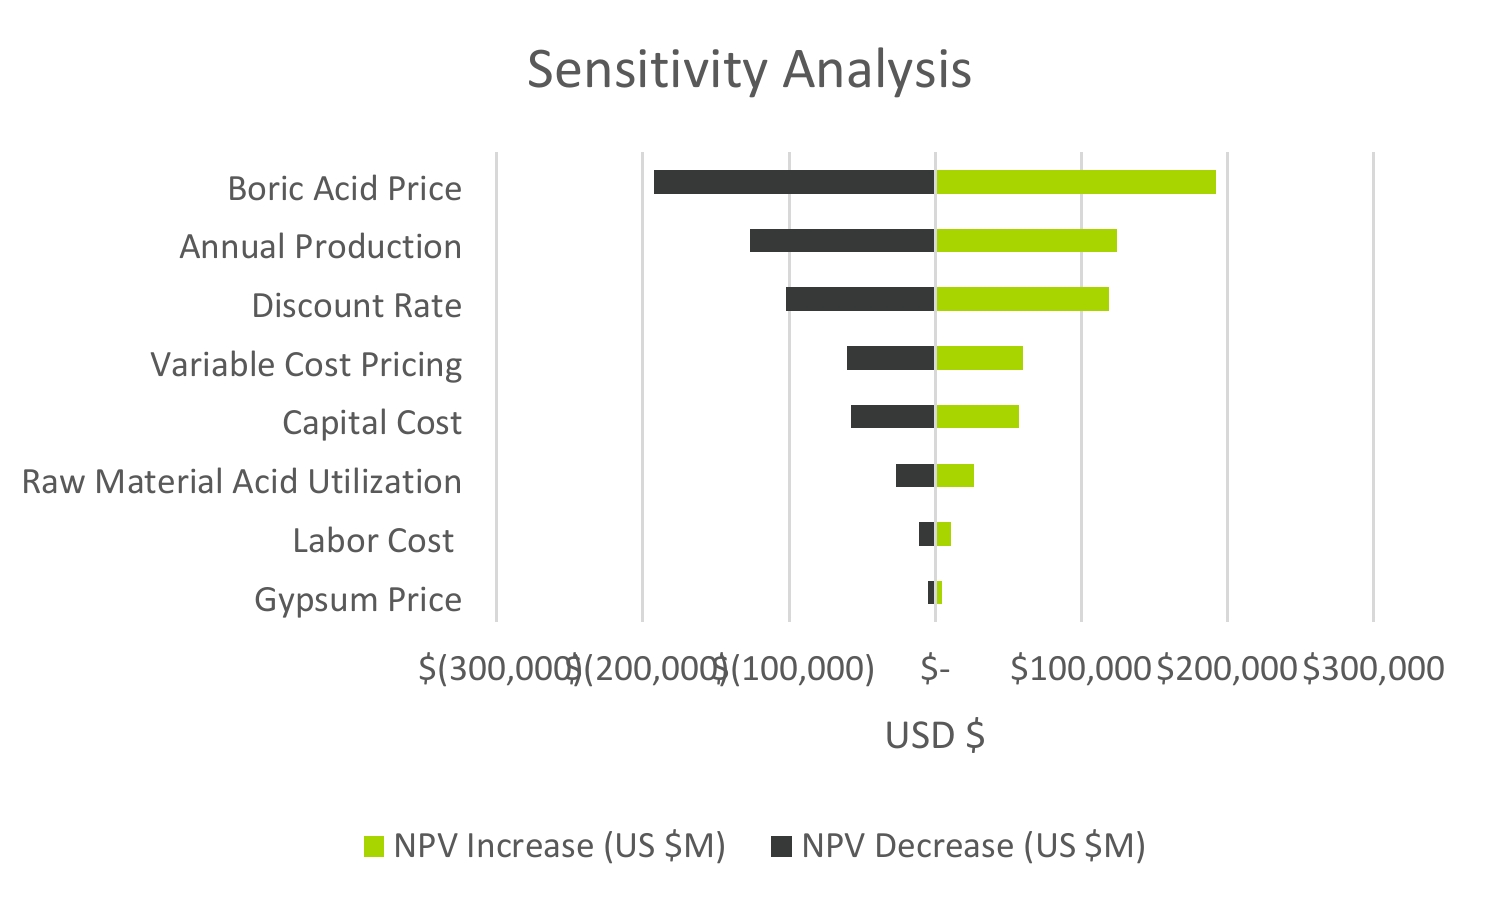
19.4.10 Cash Flow Snapshot
The annual cashflow, expressed in million U.S. dollars, is presented in Figure 19.7.
123
Table 19.7 Summary of annual cash flow, US$ millions
|
|
|
|
|
|
|
|
|
|
|
|
|
|
|
|
|
|
|
|
|
|
|
|
|
|
Pre-Production |
|
Production |
|||||||||||||||||
Description |
LOM Total |
Units |
YR-3 |
YR-2 |
YR-1 |
|
YR1 |
YR2 |
YR3 |
YR4 |
YR5 |
YR6 |
YR7 |
YR8 |
YR9 |
YR10 |
YR11 |
YR12 |
YR13 |
YR14 |
YR15 |
YR16-40 |
Assumptions |
|
|
|
|
|
|
|
|
|
|
|
|
|
|
|
|
|
|
|
|
|
|
Production Quantity |
5,050.2 |
ST |
— |
— |
— |
|
93.6 |
130.0 |
136.5 |
136.5 |
136.5 |
136.5 |
136.5 |
136.5 |
136.5 |
136.5 |
136.5 |
136.5 |
136.5 |
136.5 |
136.5 |
3,052.1 |
Boric Acid Price |
1,354.1 |
$/ST |
— |
— |
— |
|
1,273 |
1,266 |
1,234 |
1,305 |
1,353 |
1,360 |
1,364 |
1,364 |
1,364 |
1,364 |
1,364 |
1,364 |
1,364 |
1,364 |
1,364 |
1,364 |
|
|
|
|
|
|
|
|
|
|
|
|
|
|
|
|
|
|
|
|
|
|
|
Income |
|
|
|
|
|
|
|
|
|
|
|
|
|
|
|
|
|
|
|
|
|
|
Revenue |
6,838.6 |
$M |
— |
— |
— |
|
119.2 |
164.6 |
168.4 |
178.1 |
184.7 |
185.6 |
186.2 |
186.2 |
186.2 |
186.2 |
186.2 |
186.2 |
186.2 |
186.2 |
186.2 |
4,162.5 |
|
|
|
|
|
|
|
|
|
|
|
|
|
|
|
|
|
|
|
|
|
|
|
Operating Expenditure |
|
|
|
|
|
|
|
|
|
|
|
|
|
|
|
|
|
|
|
|
|
|
Variable |
(2,009.8) |
$M |
— |
— |
— |
|
(37.2) |
(51.7) |
(54.3) |
(54.3) |
(54.3) |
(54.3) |
(54.3) |
(54.3) |
(54.3) |
(54.3) |
(54.3) |
(54.3) |
(54.3) |
(54.3) |
(54.3) |
(1,214.6) |
Fixed |
(1,148.9) |
$M |
(3.5) |
(3.5) |
(5.3) |
|
(30.3) |
(30.3) |
(30.3) |
(30.3) |
(30.3) |
(30.3) |
(30.3) |
(30.3) |
(30.3) |
(30.3) |
(30.3) |
(30.3) |
(30.3) |
(30.3) |
(30.3) |
(681.9) |
Other (Operating)/Credit |
314.6 |
$M |
— |
— |
— |
|
1.2 |
1.6 |
6.6 |
8.5 |
8.9 |
8.9 |
8.9 |
8.9 |
8.9 |
8.9 |
8.9 |
8.9 |
8.9 |
8.9 |
8.9 |
198.8 |
Total |
(2,844.1) |
$M |
(3.5) |
(3.5) |
(5.3) |
|
(66.4) |
(80.4) |
(78.0) |
(76.1) |
(75.7) |
(75.7) |
(75.7) |
(75.7) |
(75.7) |
(75.7) |
(75.7) |
(75.7) |
(75.7) |
(75.7) |
(75.7) |
(1,697.8) |
|
|
|
|
|
|
|
|
|
|
|
|
|
|
|
|
|
|
|
|
|
|
|
Working Capital Costs |
0.0 |
$M |
1.2 |
13.8 |
5.7 |
|
(25.0) |
(2.6) |
(0.5) |
(1.0) |
(0.6) |
0.4 |
(0.5) |
— |
— |
— |
0.5 |
(0.5) |
— |
— |
— |
9.1 |
|
|
|
|
|
|
|
|
|
|
|
|
|
|
|
|
|
|
|
|
|
|
|
Capital Costs |
|
|
|
|
|
|
|
|
|
|
|
|
|
|
|
|
|
|
|
|
|
|
Initial |
(435.0) |
$M |
(10.9) |
(178.3) |
(245.7) |
|
— |
— |
— |
— |
— |
— |
— |
— |
— |
— |
— |
— |
— |
— |
— |
— |
Sustaining |
(39.9) |
$M |
— |
— |
— |
|
— |
— |
— |
— |
— |
(5.7) |
— |
— |
— |
— |
(5.7) |
— |
— |
— |
— |
(28.5) |
Total Capital |
(474.8) |
$M |
(10.9) |
(178.3) |
(245.7) |
|
— |
— |
— |
— |
— |
(5.7) |
— |
— |
— |
— |
(5.7) |
— |
— |
— |
— |
(28.5) |
|
|
|
|
|
|
|
|
|
|
|
|
|
|
|
|
|
|
|
|
|
|
|
Pre-Tax Cash Flow |
3,519.6 |
$M |
(13.2) |
(168.1) |
(245.4) |
|
27.8 |
81.6 |
89.9 |
101.1 |
108.4 |
104.6 |
109.9 |
110.4 |
110.4 |
110.4 |
105.2 |
110.0 |
110.4 |
110.4 |
110.4 |
2,445.3 |
|
|
|
|
|
|
|
|
|
|
|
|
|
|
|
|
|
|
|
|
|
|
|
Income Tax |
(1,054.0) |
$M |
— |
— |
— |
|
(2.8) |
(12.2) |
(14.0) |
(17.5) |
(19.5) |
(18.1) |
(20.0) |
(20.0) |
(20.0) |
(20.0) |
(31.3) |
(33.0) |
(33.0) |
(33.0) |
(33.0) |
(727.0) |
|
|
|
|
|
|
|
|
|
|
|
|
|
|
|
|
|
|
|
|
|
|
|
After-Tax Cash Flow |
2,465.7 |
$M |
(13.2) |
(168.1) |
(245.4) |
|
25.0 |
69.5 |
75.9 |
83.6 |
88.9 |
86.5 |
89.9 |
90.5 |
90.5 |
90.5 |
73.9 |
77.0 |
77.5 |
77.5 |
77.5 |
1,718.3 |
124
20 Adjacent Properties
Elementis operates their hectorite mine adjacent to the west side of the Project. The mine produces hectorite, a specialty clay mineral used in ceramics, cosmetics, and other specialties requiring high viscosity or high thermal stability. While the mine is adjacent to the Project it produces a product that does not compete with 5E.
Land status around the Project area includes the following:
21 Other Relevant Data and Information
There is currently no other relevant information or data to present.
22 Interpretation and Conclusions
This pre-feasibility study provides substantial updates to sections 10, 11, 12, 13, 14, 18, and 19. This report is a work product of many months of actual in-situ mining, over 24 months of operating 5E’s SSF, comprehensive testing with various OEMs on specific pieces of equipment that have been incorporated into the design, and over 15,000 engineering hours. The LSBF mine plan includes 27 directional wells feeding a chemical plant designed by Fluor with pregnant leach solution at a feed rate of 25.6 short tons per hour with a boric acid head grade of 10.2% weight. The head grade in the plant feed plays a critical role for process control and for the sizing of the plant’s equipment, piping and instrumentation. Variations in the in-situ mining conditions can drive a variable range of boric acid head grades with boric acid solubility, HCl concentration and temperature being drivers to head grade. The head grade assumption reflects both what is realistically achievable as demonstrated by the SSF and an optimal value for equipment design to meet the stated production goals of 130,000 short tons of boric acid and achieving a 95.1% recovery rate in the chemical plant. Byproducts produced include gypsum and calcium chloride, with the production rate of gypsum being 129,000 short tons per annum on a dry basis and the projected rate of calcium chloride being 60,000 short tons per annum in solution (38% weight).
Crystallization is a pivotal step in achieving purity and meeting customer specifications and represents a major capital investment due to the complexity and material requirements of the equipment. Kemetco performed a comprehensive metallurgical test program and was critical in further understanding process behavior and optimizing the overall design. The testing confirmed that two-stage crystallization leaves behind too many impurities, necessitating a selective dissolution and recrystallization phase where boric acid slurry is filtered, washed, redissolved, and then recrystallized. This approach enables tighter control over crystal growth and significantly improves product quality. The impurity removal process is another critical component, particularly for managing magnesium levels, which are highly pH dependent. Precise control of sequential pH adjustments is essential to selectively precipitating and removing impurities while minimizing boron losses and this step is vital for maintaining the integrity of the in-situ mining process as recycled process streams are re-injected into the wellfield. Inadequate removal of impurities could negatively impact boron leaching efficiencies and this purification step supports the downstream process and refinement of the byproducts.
125
Given the high temperature and aridity of the local climate, the most cost-effective approach to concentrate the calcium rich return brine is by maximizing the use of evaporation ponds.
The total capital estimate for the project is $435 million and economic analysis yields an NPV7 of $711.3 million and project IRR of 19.2%. Based on the economic analysis, mineral resources and mineral reserves have been estimated and reported using a cut-off grade of 2.0% B2O3. Measured, Indicated, and Inferred resources for the Project, inclusive of mineral reserves, total 204.8 MSTs of ore, 28.8 MSTs of boric acid and 0.3 Mt of lithium carbonate equivalent. Proven reserves total 2.6 MSTs of H3BO3 and probable reserves total 2.5 MSTs of H3BO3.
5E has an established mineral holding through ownership of fee lands and unpatented placer and lode claims. The property has undergone prior exploration primarily conducted in the 1980’s along with more recent drilling conducted in 2017 which validated previous exploration and expanded known mineral occurrences. Drilling completed on the Project is sufficient for the delineation of a mineral resource estimate and economic analysis has provided justification for establishing mineral reserves.
Geologic interpretation of the deposit describes mineralization as lacustrine evaporite sediments containing colemanite, a hydrated calcium borate mineral. The deposit also contains appreciable quantities of lithium. Geologic modeling based on drilling and sampling results depicts an elongate deposit of lacustrine evaporite sediments containing colemanite. The deposit is approximately 2.1 mi. long by 0.6 mi. wide, and ranges in thickness from 70 to 262 ft. with mineralization that has been defined in four distinct horizons defined by changes in lithology and B2O3 analyses.
In conclusion, there are reasonable prospects for economic extraction for the mineral resources and reserves estimated and presented in this pre-feasibility study. 5E has been diligent in validating the work completed by the previous operators and further expanding the size and classification assurance of the deposit. Current and previous evaluations of mining methods indicate a deposit well suited for ISL solution mining as a preferred method for economic extraction. Progression to FEL-3 or FEED engineering will further define the accuracy and optimization of the capital cost estimates for the chemical processing plant and some additional exploration and in-fill drilling can further bolster the resource and reserve. Using the samples produced from the SSF, 5E is positioned to secure bankable offtake agreements for commercialization. Once these steps are completed, the Company is well positioned to update this pre-feasibility study to a feasibility study.
23 Recommendations
The QP’s have made the following recommendations:
126
24 References
5E SSF high frequency wellfield instrumentation results via SSF DCS.
5E SSF Injection Schedule and Results.
5E July 2025 Horizontal Drill Program ICP results.
Ardent Technologies, Test Work Report – Consolidated Ardent Testing Data.
Bartlett, R.W., 1998. Solution Mining: Leaching and Fluid Recovery of Materials, Second Edition, Routledge Publishing.
Confluence Water Resources, LLC 2019. 2019 Fault B Program Results, Technical Report, March 2019.
Confluence Water Resources, LLC 2022. Shallow Groundwater Characterization Report Mining Block 2 Near Pisgah Fault, June 2022.
Confluence Water Resources, LLC 2023. Results from OW-3A and MW3B Hydraulic Testing, Technical Memorandum, March 2023.
Core Laboratories, Inc., 1981. Boron Analysis of Core Leachings Well SMT-1, San Bernadino County by D. Burnett, July 1981.
Fort Cady California Corporation, 2019. Revised 2019 Mining/Land Reclamation Plan and Plan of Operations. Revised April 2019.
Haliburton Micro-deformation instrumentation results.
Hazen Research, Inc., 2019. Recovery and Purification of Boric Acid from Colemanite Leach Liquor using Solvent Extraction – Report 12574, September 2019.
127
Hydro-Engineering, 1996. Aquifer Characteristics and potential well field geometry, by G Hoffman & E Sandberg, February 1996.
Kemetco Research, Inc., Test Work Report – Scoping Boric Acid Production Testing: T0903 Report
Kline Preliminary Market Study, June 2025.
Simon Hydro-Search, 1993. Fort Cady Mineral Corporation Solution Mining Project Feasibility Report, San Bernardino County, California. Prepared for Southern California Edison by Simon Hydro-Search. October 22, 1993.
Swenson Technology, Inc. 2019. Test Report – Crystallization of Boric Acid by J Majors, April 2019.
Wilkinson & Krier, 1985. Geological Summary – Duval Corp. internal review, by P Wilkinson and Krier N, January 1985.
25 Reliance on Information Provided by the Registrant
5E has provided the external QP’s with a variety of materials for the preparation of this report. These materials include the following:
128