
Confidential Information – Do Not Distribute Investor Presentation September 2026 © 2026 CoreWeave, Inc. All rights reserved
Confidential Information – Do Not Distribute Safe Harbor Disclaimer 2 This presentation is strictly confidential and is being furnished solely in reliance on applicable exemptions from the regist rat ion requirements under the U.S. Securities Act of 1933 (the “Act”). This presentation contains selected information derived f rom the preliminary offering memorandum (the “offering memorandum”) of CoreWeave, Inc. (the "Company") and the portions of the documents that the Company has filed with the U.S. Securities and Exchange Commission (the “SEC”) that are incorporated by reference in the offering memoran du m. The information contained in this presentation is provided as of the date of this presentation and is subject to change without n oti ce. The notes have not been and will not be registered under the Act, or any state securities laws or the laws of any foreign jur isd iction. The notes will be offered in the U.S. only to persons reasonably believed to be “qualified institutional buyers” purs uan t to Rule 144A under the Act and outside the U.S. in reliance on Regulation S under the Act. Accordingly, this document is being provided only to persons that are rea son ably believed to be “qualified institutional buyers,” as defined in Rule 144A under the Act and to persons that are non - U.S. persons (as defined in Regulation S under the Securities Act) in transactions outside the United States. By accepting this presentation, you will be deemed to re pre sent that you are a qualified institutional buyer or a non - U.S. person outside the United States. The notes have not been approved or disapproved by the SEC, or any other securities regulating body or agency, nor has any su ch authority, commission, or body passed on the accuracy or adequacy of this presentation. Any representation to the contrary is a criminal offense. The notes will be subject to restrictions on transferability and resale and may not be transferred or resold except as permitted under the Act and applicable state securities laws pursuant to registration or exemption therefrom. Investors should be aware that they may be required to bear the financial risks of an investment in the notes for an indefinite period of time. There is no obligation on the part of any per son to make a market for the notes. No action has been made or will be taken that would permit a public offering of any securitie s in any jurisdiction in which action for that purpose is required. No offers, sales, resales or delivery of any securities or any distribution of any offering material rel ati ng to any securities may be made in or from any jurisdiction except in circumstances which will result in compliance with any ap plicable laws and regulations and which will not impose any obligation on the Company. Before you make a decision to invest in the notes, you should read the offering memorandum and the portions of the documents tha t the Company has filed with the SEC that are incorporated by reference in the offering memorandum for more complete informat ion about the Company and the offering to which this presentation relates. Any statements, whether oral or written, that are not consistent with th e o ffering memorandum are not authorized and should not be relied upon by prospective investors. This presentation does not cons titute an offer to sell or a solicitation of an offer to buy the notes. The offer to sell, or the solicitation of an offer to buy, the notes is made only pur suant to the offering memorandum. This presentation and the accompanying oral commentary contain “forward - looking” statements based on the Company’s beliefs and a ssumptions and on information currently available to the Company. Forward - looking statements include all statements other than s tatements of historical fact contained in this presentation, including information or predictions concerning the future of the Company’s b usi ness or financial performance. The words “believe,” “may,” “will,” “potentially,” “estimate,” “continue,” “anticipate,” “inte nd, ” “could,” “would,” “project,” “target,” “plan,” “expect,” and similar expressions are intended to identify forward - looking statements, although not all forwar d - looking statements contain these identifying words. These forward - looking statements are subject to a number of risks, uncerta inties, and assumptions, including those described in the section titled “Risk Factors” in the Company’s Quarterly Report on Form 10 - Q for the three mont hs ended June 30, 2026 filed with the Securities and Exchange Commission (the “2026 Q2 10- Q”). Moreover, the Company operates in a very competitive and rapidly changing environment, and new risks emerge from time to time. The Company may not actually achieve the plans, int ent ions, or expectations disclosed in these forward - looking statements, and you should not place undue reliance on these forward - lo oking statements. Actual results or events could differ materially from the plans, intentions, and expectations disclosed in these forward - looking statements. In addition, the forward - looking statements included in this presentation represent the Company’s views as of the d ate of this presentation. The Company anticipates that subsequent events and developments will cause its views to change. However, while the Company may el ect to update these forward - looking statements at some point in the future, it specifically disclaims any obligation to do so excep t as required by law. These forward - looking statements should not be relied upon as representing the Company’s views as of any date subsequent to the date of this presentation. In addition, this presentation contains certain projected financial information with respect to the Company's future results. Su ch projected financial information was not prepared with a view to public disclosure or compliance with the guidelines establ ish ed by the Public Company Accounting Oversight Board, published guidance or rules of the SEC or U.S. generally accepted accounting principles ("GAAP"). Su ch projected financial information constitutes forward - looking information, is presented for illustrative purposes only and shou ld not be relied upon as being indicative of future results. The projected financial information is based on estimates and assumptions that the manage men t of the Company believed to be reasonable at the time they were made and are inherently subject to significant uncertainties an d contingencies, many of which are beyond the Company’s control, that could cause actual results to differ materially from the projected financial inf orm ation. In particular, the value of terms of actual contracts, interest rates and financial results and measures may vary, and the figures included in this presentation are presented for illustrative purposes only and should not be considered to be an indication of the actual contract terms or va lues, or the Company’s financial position or results of operations for any historical or future periods. The projected financ ial information also does not reflect future changes in general business or economic conditions, or any other transaction or event that may occur and that was not ant icipated at the time this information was prepared and is subject to risks, uncertainties, and other factors, including those de scribed in the section titled “Risk Factors” in the 2026 Q2 10- Q. The inclusion of such information in this presentation should not be regarded as a representation by any person that the results reflected in such projections will be achieved. Neither the Company's independent auditors, nor any other independent accountants, have compiled, examined, or performed any procedures with respect to the prospective financial information conta ine d herein, nor have they expressed any opinion or any other form of assurance on such information or its achievability, and as sum e no responsibility for, and disclaim any association with, the prospective financial information. This presentation includes references to Revenue Backlog. Revenue Backlog includes remaining performance obligations, plus o the r amounts the Company estimates will be recognized as revenue in future periods under committed customer contracts, in each c ase , subject to the satisfaction of delivery and availability of service requirements. Revenue Backlog is expected to fluctuate from period to pe riod, given the nature of the Company's committed contract business and the size of committed contracts. This presentation inclu des certain financial measures not presented in accordance with GAAP, including Adjusted Operating Income (Loss), Adjusted Operating Income (Loss) margin, A dju sted EBITDA, Adjusted EBITDA margin, Adjusted Net Loss and Adjusted Net Loss margin. Such non - GAAP measures are used by manageme nt in making operating decisions, allocating financial resources, and for internal planning and forecasting and business strategy purposes . The non - GAAP measures included in this presentation have certain limitations, and should not be construed as alternatives to fina ncial measures determined in accordance with GAAP. The non - GAAP measures as defined by us may not be comparable to similar non - GAAP measures presented by oth er companies. The Company's presentation of such measures, which may include adjustments to exclude unusual or non - recurring ite ms, should not be construed as an inference that the Company's future results will be unaffected by other unusual or non - recurring items. P lease refer to the documents filed and furnished by the Company with the SEC for more information with respect to the Company 's use of non - GAAP financial measures, including reconciliations thereof. Please refer to the Appendix for a reconciliation of each non - GAAP financial measur e presented herein to the most directly comparable financial measure stated in accordance with GAAP. This presentation also contains estimates and other statistical data made by independent parties and by the Company relating to market size and growth and other data about the Company’s industry and estimated total addressable market. This data involves a number of assumptions and limitations, and you are cautioned not to give undue weight to such estimates. Although we are responsible for all of the di sclosures contained in this presentation and we believe the third - party market position, market opportunity, and market size dat a included in this presentation are reliable, we have not independently verified the accuracy or completeness of this third - party data. In addition, projections , assumptions, and estimates of the Company’s future performance and the future performance of the markets in which the Compa ny operates are necessarily subject to a high degree of uncertainty and risk. This presentation shall not constitute an offer to sell or the solicitation of an offer to buy securities, nor shall there be an y sale of securities in any state or jurisdiction in which such offer, solicitation or sale would be unlawful prior to regist rat ion or qualification under the securities laws of any such state or jurisdiction. Any decision to purchase securities of the Company should be made solely on the basis of the info rma tion contained in a prospectus to be issued by the Company in relation to a specific offering. All third - party trademarks, including names, logos, and brands, referenced by the Company in this presentation are property of t heir respective owners. All references to third - party trademarks are for identification purposes only and shall be considered no minative fair use under trademark law.
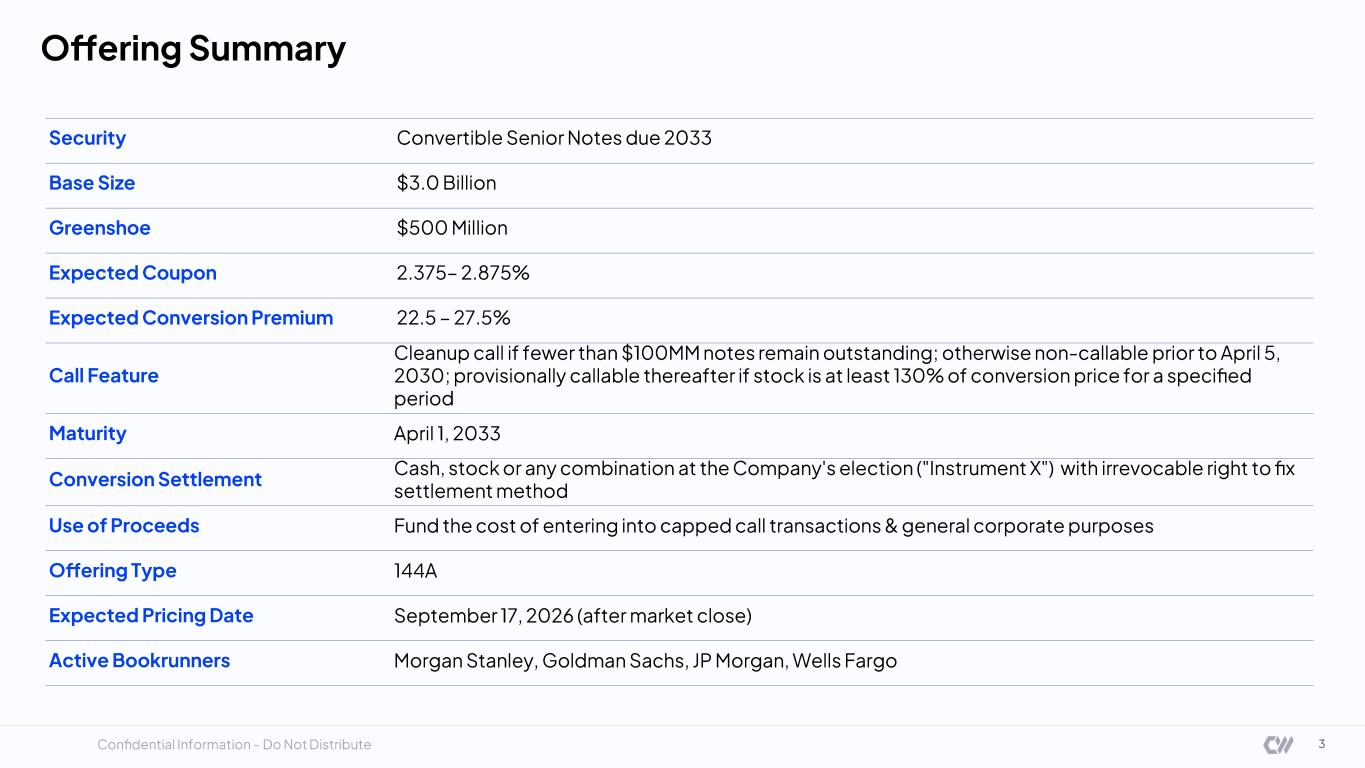
Confidential Information – Do Not Distribute Offering Summary 3 Security Convertible Senior Notes due 2033 Base Size $3.0 Billion Greenshoe $500 Million Expected Coupon 2.375 – 2.875% Expected Conversion Premium 22.5 – 27.5% Call Feature Cleanup call if fewer than $100MM notes remain outstanding; otherwise non - callable prior to April 5, 2030; provisionally callable thereafter if stock is at least 130% of conversion price for a specified period Maturity April 1, 2033 Conversion Settlement Cash, stock or any combination at the Company's election ("Instrument X") with irrevocable right to fix settlement method Use of Proceeds Fund the cost of entering into capped call transactions & general corporate purposes Offering Type 144A Expected Pricing Date September 17, 2026 (after market close) Active Bookrunners Morgan Stanley, Goldman Sachs, JP Morgan, Wells Fargo

Business Update
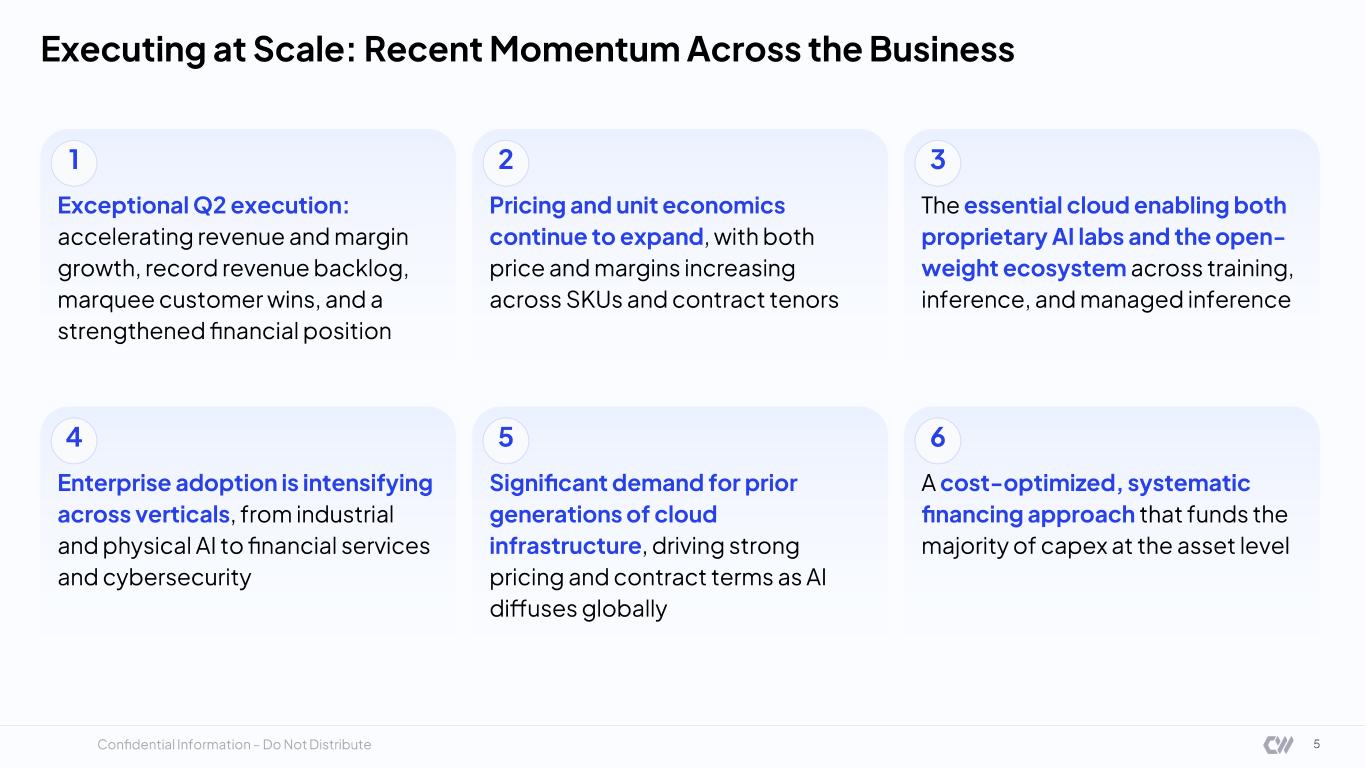
Confidential Information – Do Not Distribute Executing at Scale: Recent Momentum Across the Business 5 1 2 3 4 5 6 Exceptional Q2 execution: accelerating revenue and margin growth, record revenue backlog, marquee customer wins, and a strengthened financial position Pricing and unit economics continue to expand , with both price and margins increasing across SKUs and contract tenors The essential cloud enabling both proprietary AI labs and the open - weight ecosystem across training, inference, and managed inference Enterprise adoption is intensifying across verticals , from industrial and physical AI to financial services and cybersecurity Significant demand for prior generations of cloud infrastructure , driving strong pricing and contract terms as AI diffuses globally A cost - optimized, systematic financing approach that funds the majority of capex at the asset level
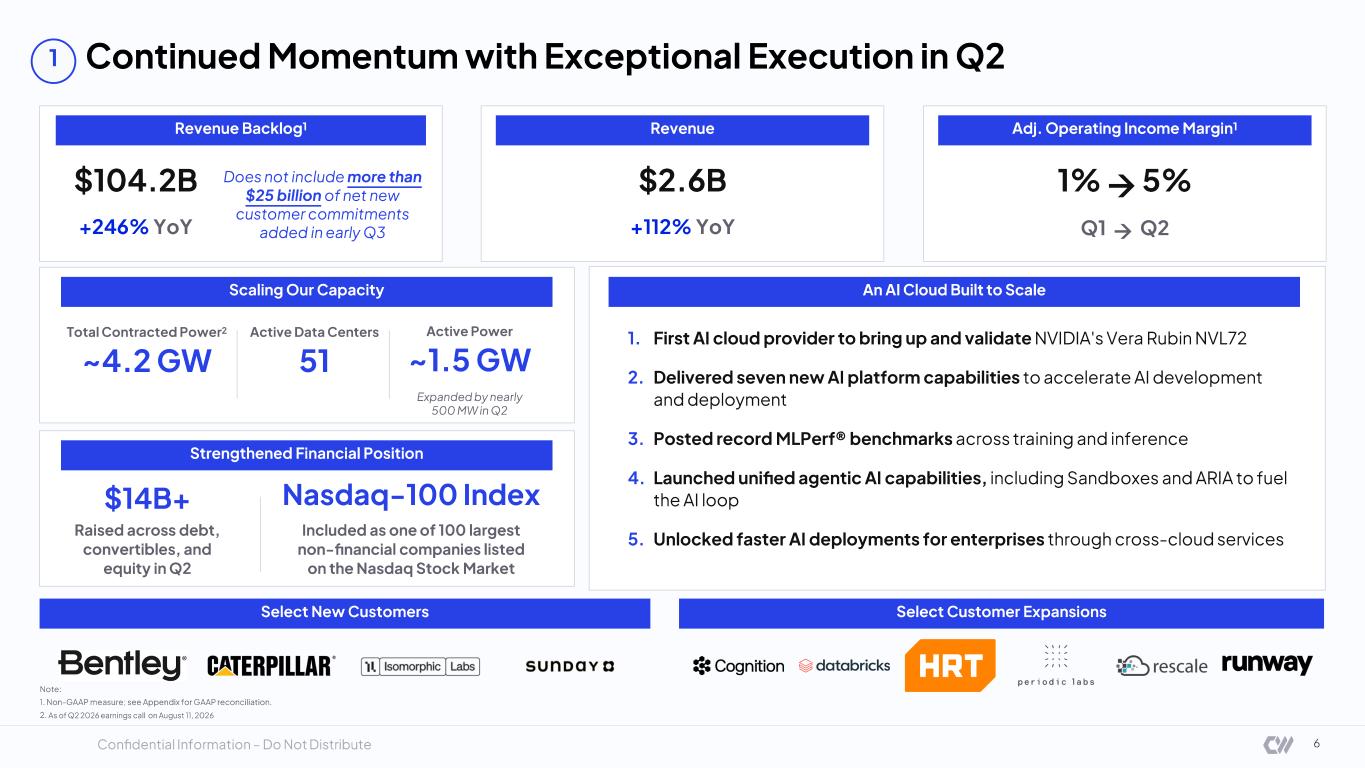
Confidential Information – Do Not Distribute Continued Momentum with Exceptional Execution in Q2 6 1 Revenue Backlog¹ $ 104.2B +246% YoY Does not include more than $25 billion of net new customer commitments added in early Q3 Revenue $ 2.6B +112% YoY Adj. Operating Income Margin ¹ Strengthened Financial Position $ 14B + An AI Cloud Built to Scale 1. First AI cloud provider to bring up and validate NVIDIA's Vera Rubin NVL72 2. Delivered seven new AI platform capabilities to accelerate AI development and deployment 3. Posted record MLPerf ® benchmarks across training and inference 4. Launched unified agentic AI capabilities, including Sandboxes and ARIA to fuel the AI loop 5. Unlocked faster AI deployments for enterprises through cross - cloud services Select New Customers Select Customer Expansions Note: 1. Non- GAAP measure; see Appendix for GAAP reconciliation. 2. As of Q2 2026 earnings call on August 11, 2026 Scaling Our Capacity Active Data Centers 51 Total Contracted Power 2 ~4.2 GW Active Power ~ 1.5 GW Expanded by nearly 500 MW in Q2 Raised across debt, convertibles, and equity in Q2 Nasdaq - 100 Index Included as one of 100 largest non - financial companies listed on the Nasdaq Stock Market 1% → 5% Q1 → Q2
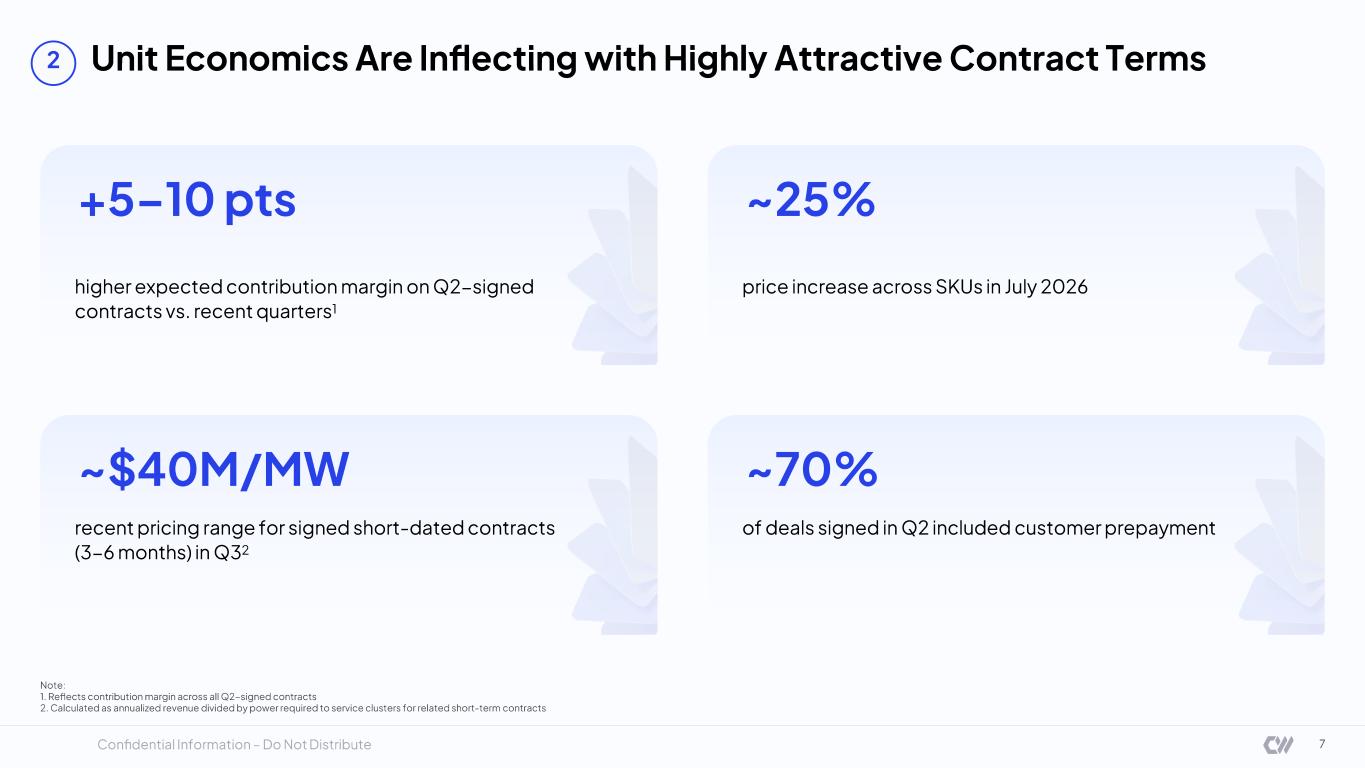
Confidential Information – Do Not Distribute Unit Economics Are Inflecting with Highly Attractive Contract Terms 7 Note: 1. Reflects contribution margin across all Q2 - signed contracts 2. Calculated as annualized revenue divided by power required to service clusters for related short - term contracts recent pricing range for signed short - dated contracts (3- 6 months) in Q3 2 ~$ 40M /MW of deals signed in Q2 included customer prepayment ~70% price increase across SKUs in July 2026 ~25% higher expected contribution margin on Q2 - signed contracts vs. recent quarters 1 +5 – 10 pts 2
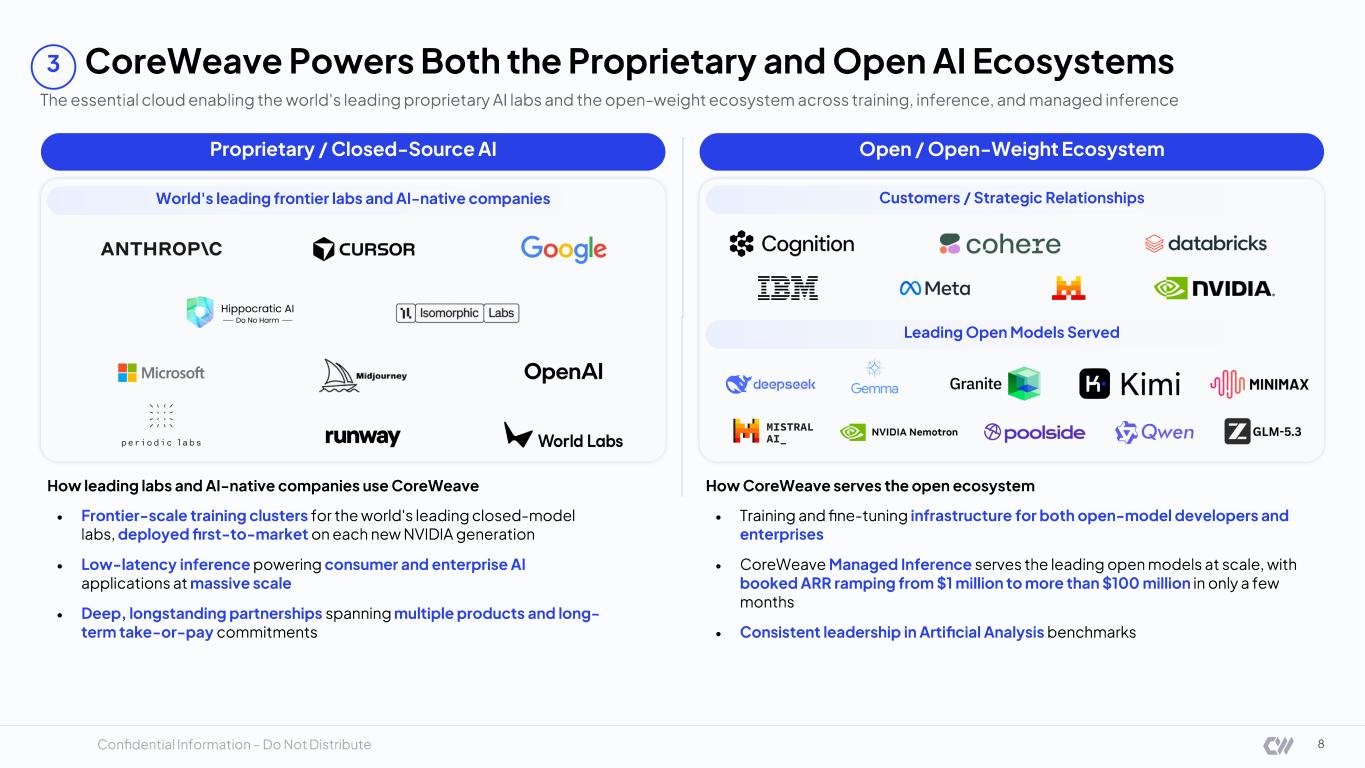
Confidential Information – Do Not Distribute 8 CoreWeave Powers Both the Proprietary and Open AI Ecosystems The essential cloud enabling the world's leading proprietary AI labs and the open - weight ecosystem across training, inference, a nd managed inference Proprietary / Closed - Source AI World's leading frontier labs and AI - native companies How leading labs and AI - native companies use CoreWeave • Frontier - scale training clusters for the world's leading closed - model labs, deployed first - to - market on each new NVIDIA generation • Low - latency inference powering consumer and enterprise AI applications at massive scale • Deep, longstanding partnerships spanning multiple products and long - term take - or - pay commitments Open / Open - Weight Ecosystem Customers / Strategic Relationships Leading Open Models Served How CoreWeave serves the open ecosystem • Training and fine - tuning infrastructure for both open - model developers and enterprises • CoreWeave Managed Inference serves the leading open models at scale , with booked ARR ramping from $1 million to more than $100 million in only a few months • Consistent leadership in Artificial Analysis benchmarks 3
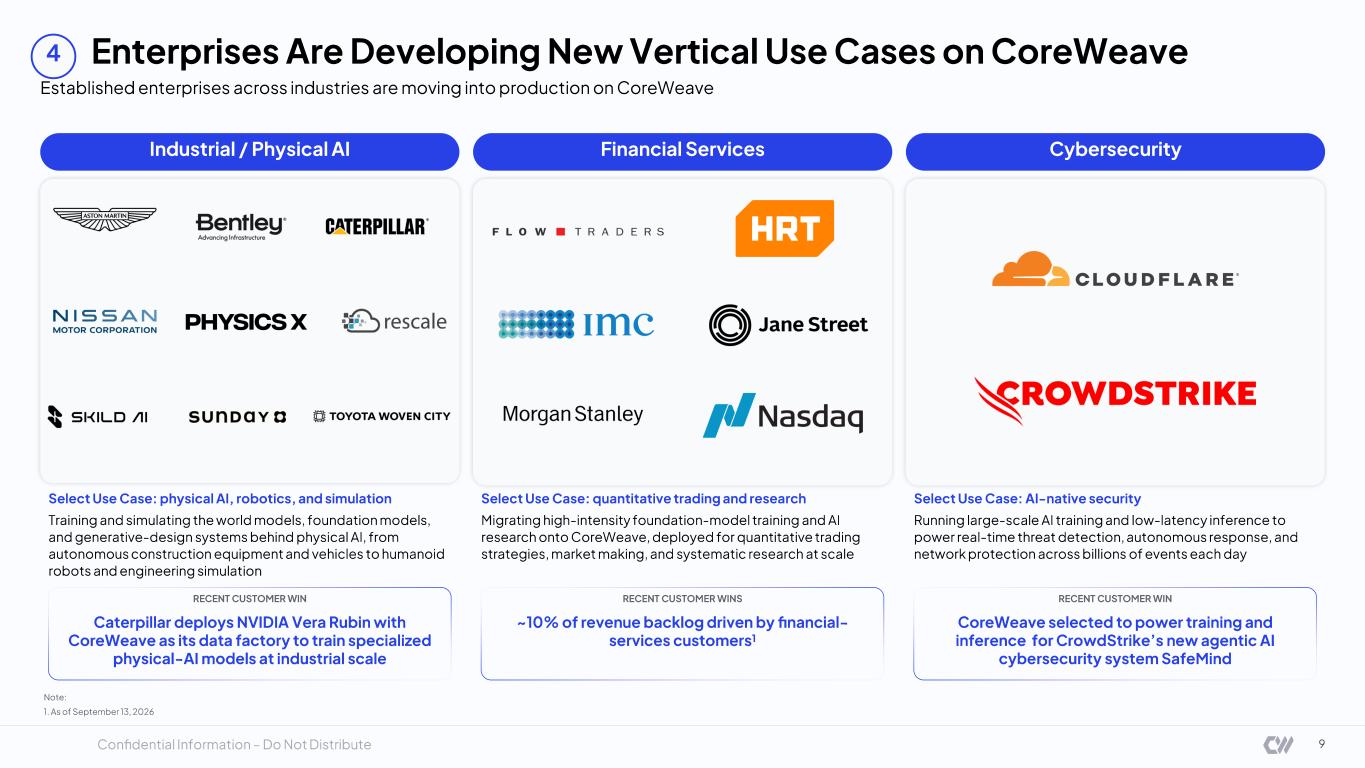
Confidential Information – Do Not Distribute RECENT CUSTOMER WINS ~10% of revenue backlog driven by financial - services customers 1 RECENT CUSTOMER WIN Caterpillar deploys NVIDIA Vera Rubin with CoreWeave as its data factory to train specialized physical - AI models at industrial scale RECENT CUSTOMER WIN CoreWeave selected to power training and inference for CrowdStrike’s new agentic AI cybersecurity system SafeMind Enterprises Are Developing New Vertical Use Cases on CoreWeave Established enterprises across industries are moving into production on CoreWeave 9 Select Use Case: physical AI, robotics, and simulation Training and simulating the world models, foundation models , and generative - design systems behind physical AI, from autonomous construction equipment and vehicles to humanoid robots and engineering simulation Select Use Case: quantitative trading and research Migrating high - intensity foundation - model training and AI research onto CoreWeave, deployed for quantitative trading strategies, market making , and systematic research at scale Select Use Case: AI - native security Running large - scale AI training and low - latency inference to power real - time threat detection, autonomous response , and network protection across billions of events each day Note: 1. As of September 13, 2026 4 Industrial / Physical AI Financial Services Cybersecurity
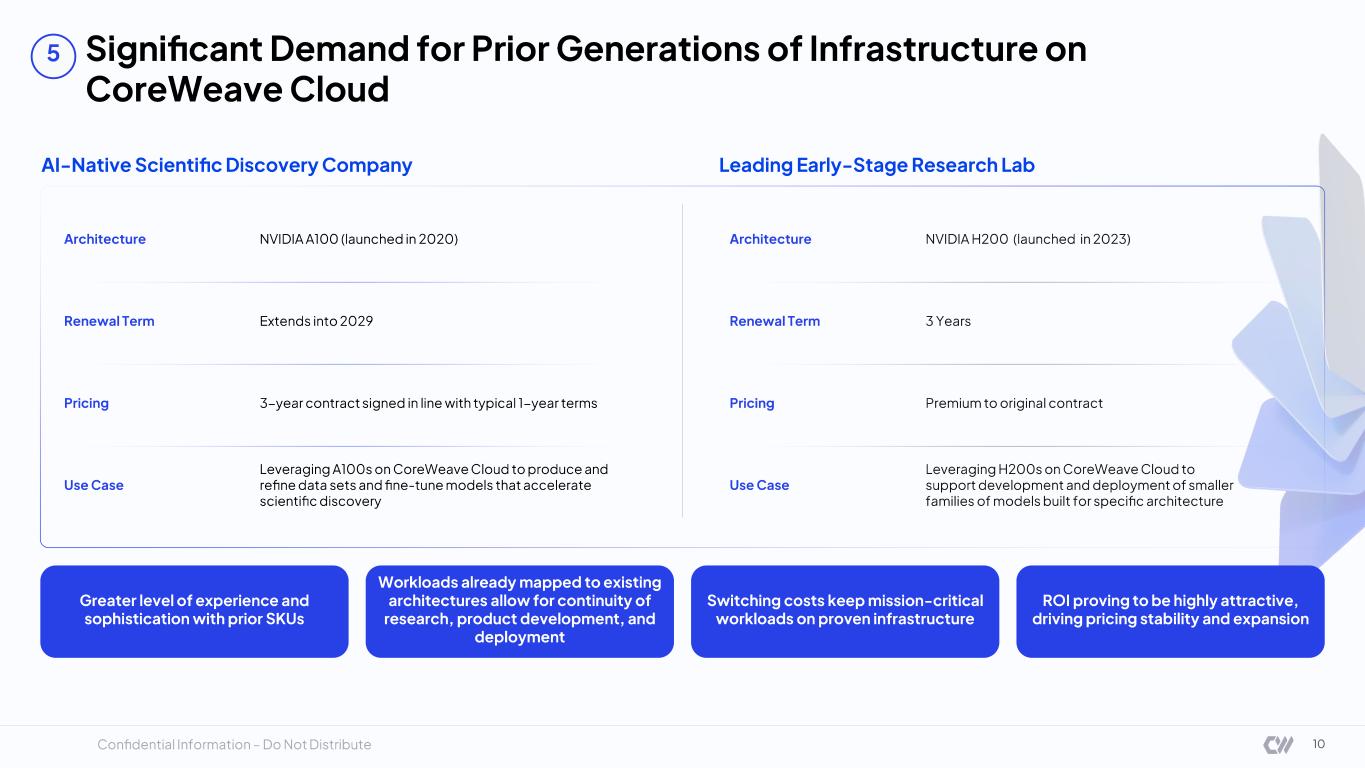
Confidential Information – Do Not Distribute Significant Demand for Prior Generations of Infrastructure on CoreWeave Cloud 10 AI - Native Scientific Discovery Company Leading Early - Stage Research Lab 5 Greater level of experience and sophistication with prior SKUs Architecture NVIDIA A100 (launched in 2020) Architecture NVIDIA H 200 (launched in 202 3) Renewal Term Extends into 2029 Renewal Term 3 Years Pricing 3- year contract signed in line with typical 1 - year terms Pricing Premium to original contract Use Case Leveraging A100s on CoreWeave Cloud to produce and refine data sets and fine - tune models that accelerate scientific discovery Use Case Leveraging H200s on CoreWeave Cloud to support development and deployment of smaller families of models built for specific architecture Workloads already mapped to existing architectures allow for continuity of research, product development, and deployment ROI proving to be highly attractive, driving pricing stability and expansion Switching costs keep mission - critical workloads on proven infrastructure
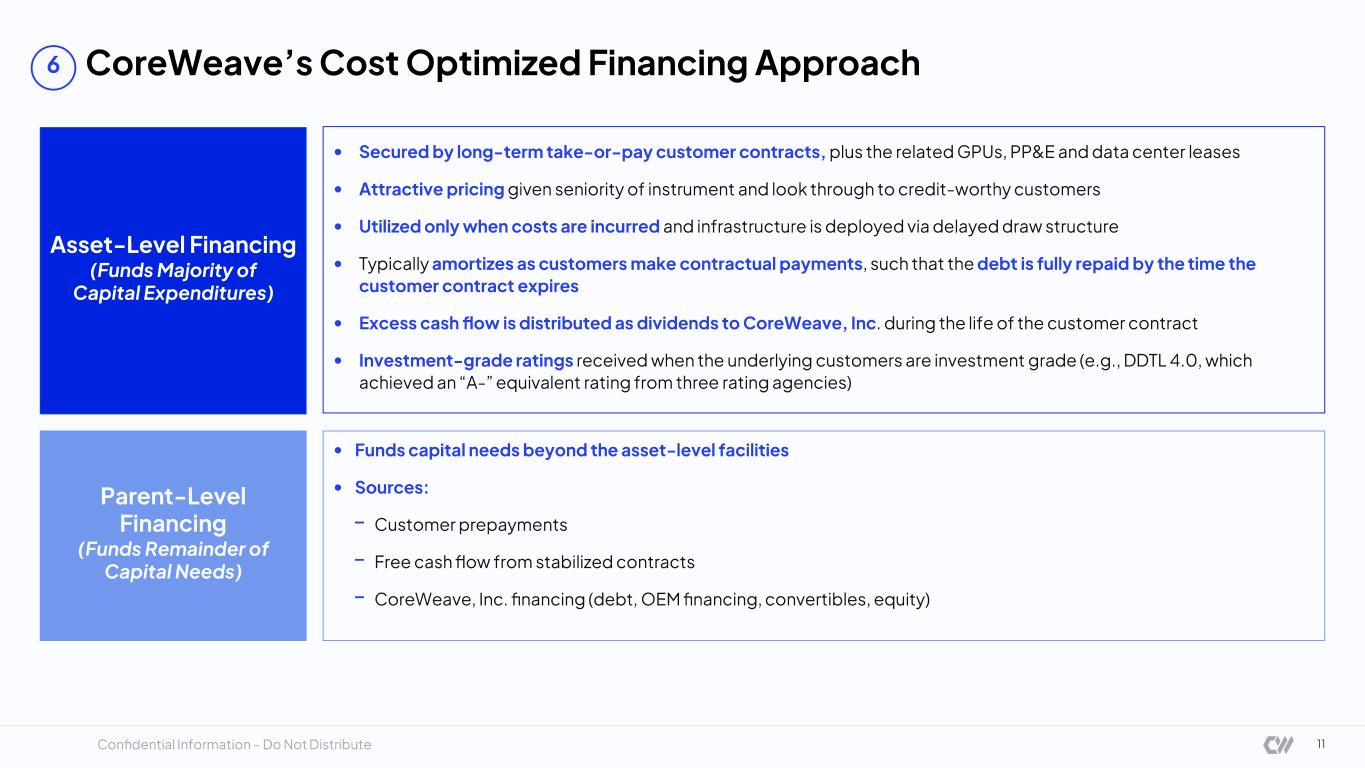
Confidential Information – Do Not Distribute CoreWeave’s Cost Optimized Financing Approach 11 Asset - Level Financing (Funds Majority of Capital Expenditures) Parent - Level Financing (Funds Remainder of Capital Needs) • Funds capital needs beyond the asset - level facilities • Sources: - Customer prepayments - Free cash flow from stabilized contracts - CoreWeave, Inc. financing (debt, OEM financing, convertibles, equity) • Secured by long - term take - or - pay customer contracts, plus the related GPUs, PP&E and data center leases • Attractive pricing given seniority of instrument and look through to credit - worthy customers • Utilized only when costs are incurred and infrastructure is deployed via delayed draw structure • Typically amortizes as customers make contractual payments , such that the debt is fully repaid by the time the customer contract expires • Excess cash flow is distributed as dividends to CoreWeave, Inc . during the life of the customer contract • Investment - grade ratings received when the underlying customers are investment grade (e.g., DDTL 4.0, which achieved an “A - ” equivalent rating from three rating agencies) 6

CoreWeave: The Essential Cloud for AI
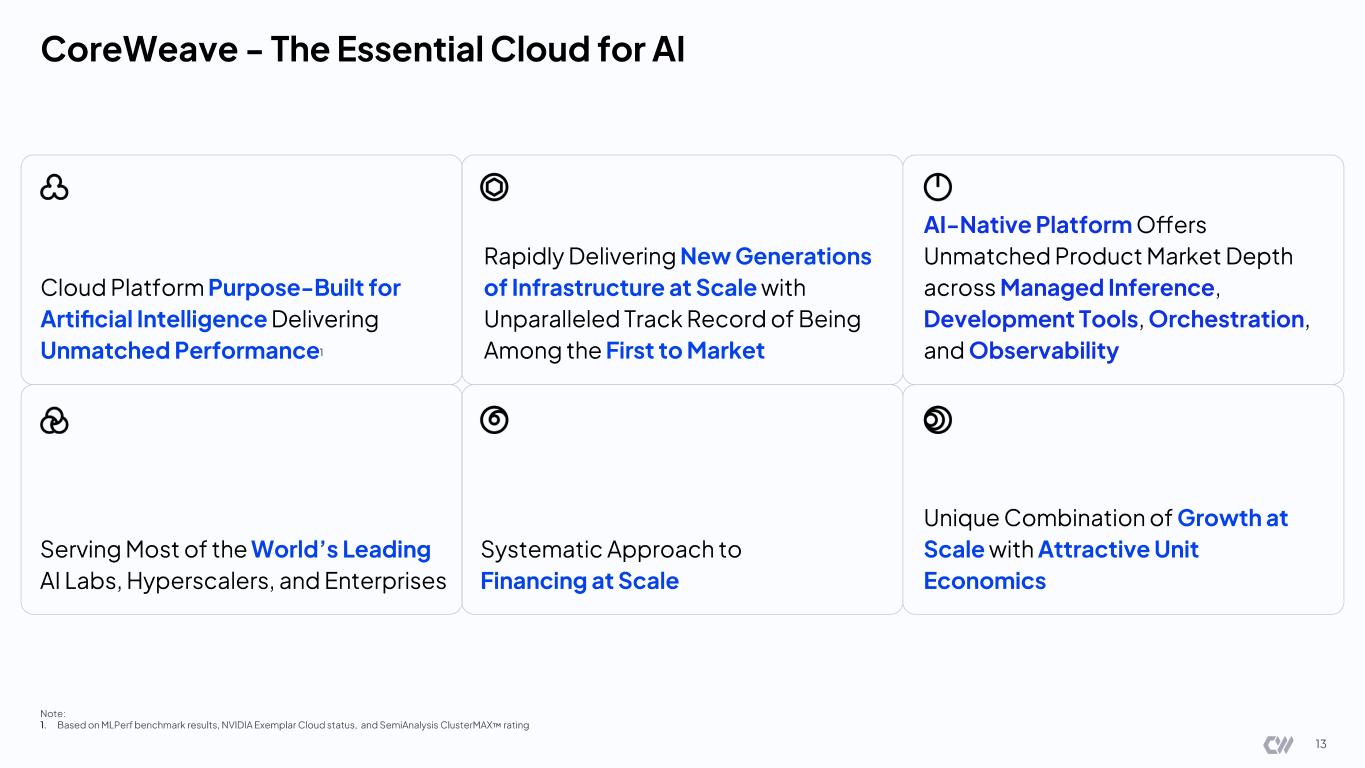
CoreWeave - The Essential Cloud for AI Cloud Platform Purpose - Built for Artificial Intelligence Delivering Unmatched Performance 1 Rapidly Delivering New Generations of Infrastructure at Scale with Unparalleled Track Record of Being Among the First to Market AI - Native Platform Offers Unmatched Product Market Depth across Managed Inference , Development Tools , Orchestration , and Observability Serving Most of the World’s Leading AI Labs, Hyperscalers , and Enterprises Systematic Approach to Financing at Scale Unique Combination of Growth at Scale with Attractive Unit Economics 13 Note: 1. Based on MLPerf benchmark results, NVIDIA Exemplar Cloud status, and SemiAnalysis ClusterMAX rating
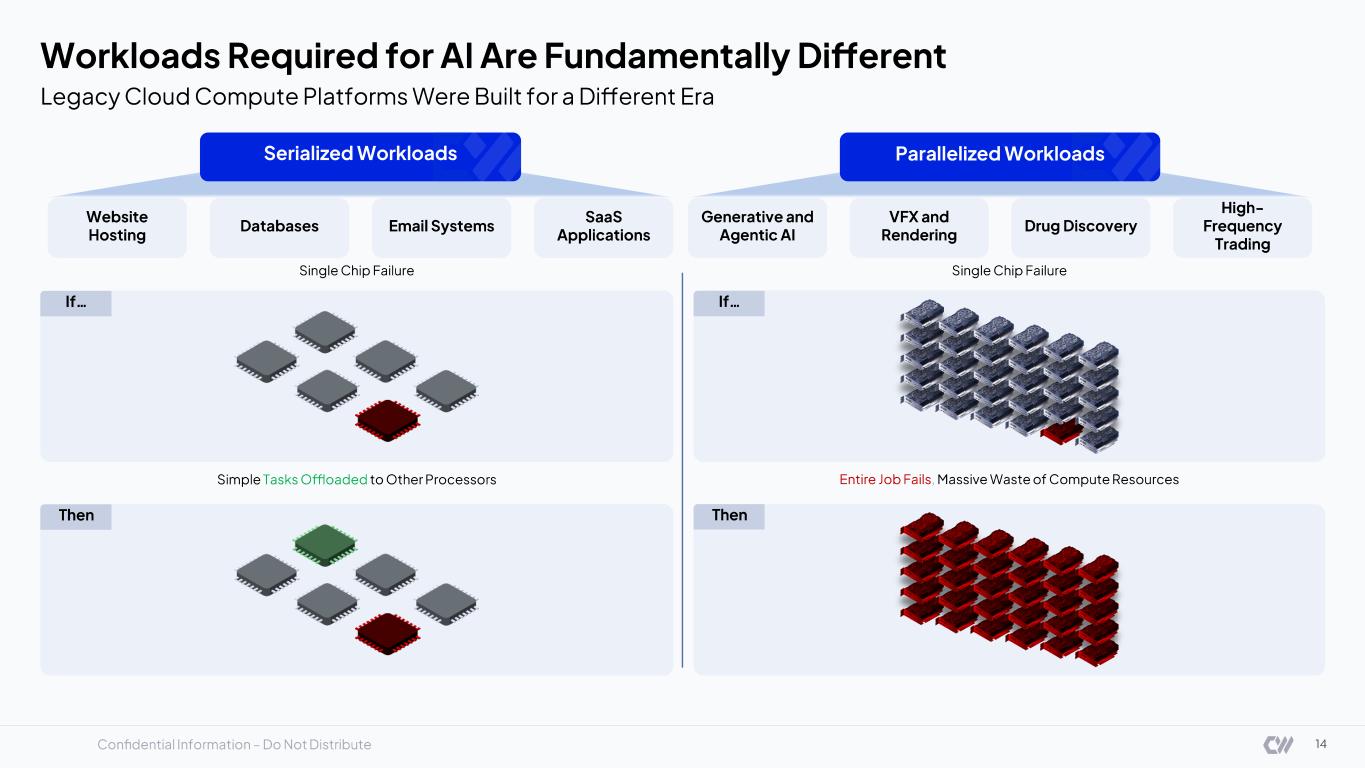
Confidential Information – Do Not Distribute Single Chip Failure If… Entire Job Fails , Massive Waste of Compute Resources Then Parallelized Workloads Generative and Agentic AI VFX and Rendering Drug Discovery High - Frequency Trading Single Chip Failure If… Simple Tasks Offloaded to Other Processors Then Serialized Workloads Website Hosting Databases SaaS Applications Email Systems 14 Workloads Required for AI Are Fundamentally Different Legacy Cloud Compute Platforms Were Built for a Different Era
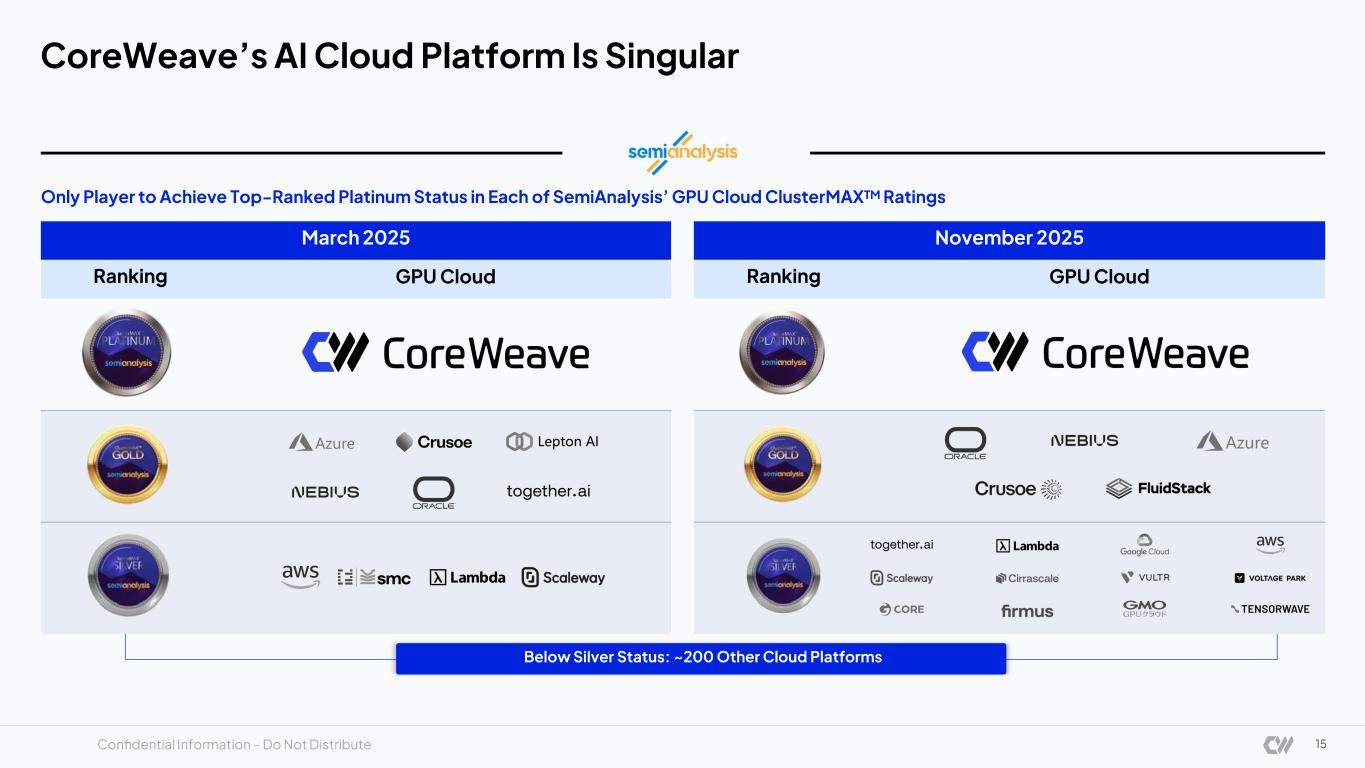
Confidential Information – Do Not Distribute CoreWeave’s AI Cloud Platform Is Singular March 2025 Ranking GPU Cloud November 2025 Ranking GPU Cloud Below Silver Status: ~200 Other Cloud Platforms Only Player to Achieve Top - Ranked Platinum Status in Each of SemiAnalysis’ GPU Cloud ClusterMAX TM Ratings 15
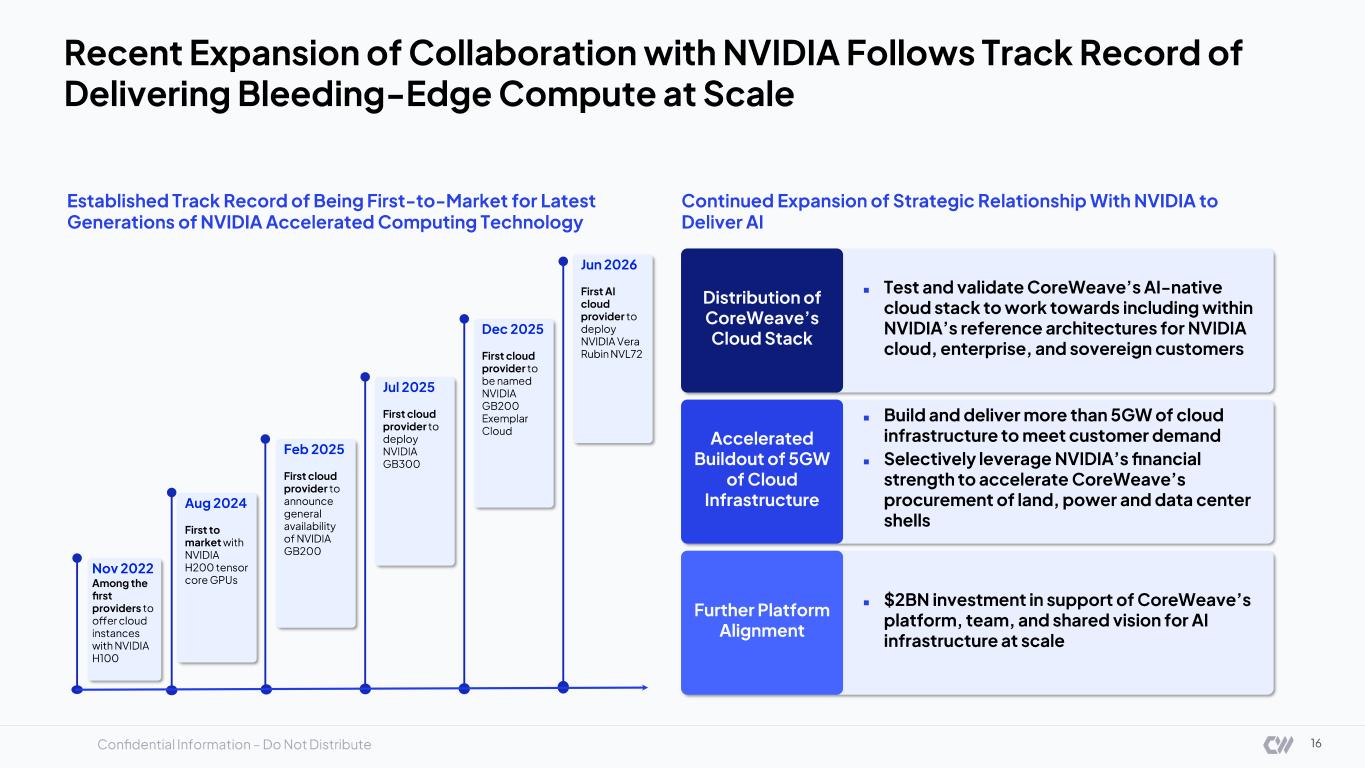
Confidential Information – Do Not Distribute 16 Recent Expansion of Collaboration with NVIDIA Follows Track Record of Delivering Bleeding - Edge Compute at Scale Continued Expansion of Strategic Relationship With NVIDIA to Deliver AI Nov 2022 Among the first providers to offer cloud instances with NVIDIA H100 Aug 2024 First to market with NVIDIA H200 tensor core GPUs Feb 2025 First cloud provider to announce general availability of NVIDIA GB200 Jul 2025 First cloud provider to deploy NVIDIA GB300 Dec 2025 First cloud provider to be named NVIDIA GB200 Exemplar Cloud Jun 2026 First AI cloud provider to deploy NVIDIA Vera Rubin NVL72 ▪ $2BN investment in support of CoreWeave’s platform, team, and shared vision for AI infrastructure at scale Further Platform Alignment ▪ Build and deliver more than 5GW of cloud infrastructure to meet customer demand ▪ Selectively leverage NVIDIA’s financial strength to accelerate CoreWeave’s procurement of land, power and data center shells ▪ Test and validate CoreWeave’s AI - native cloud stack to work towards including within NVIDIA’s reference architectures for NVIDIA cloud, enterprise, and sovereign customers Distribution of CoreWeave’s Cloud Stack Accelerated Buildout of 5GW of Cloud Infrastructure Established Track Record of Being First - to - Market for Latest Generations of NVIDIA Accelerated Computing Technology
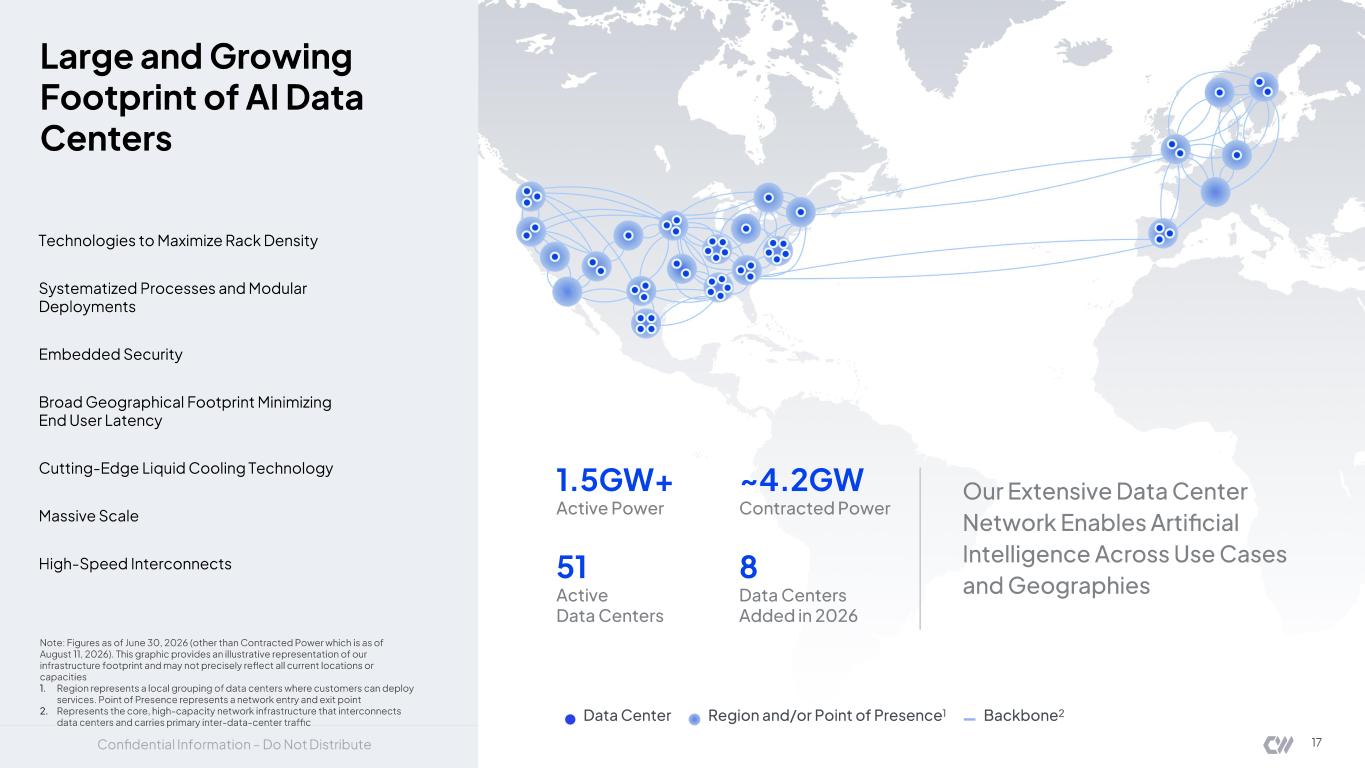
Confidential Information – Do Not Distribute Our Extensive Data Center Network Enables Artificial Intelligence Across Use Cases and Geographies Note: Figures as of June 30, 2026 (other than Contracted Power which is as of August 11 , 2026). This graphic provides an illustrative representation of our infrastructure footprint and may not precisely reflect all current locations or capacities 1. Region represents a local grouping of data centers where customers can deploy services. Point of Presence represents a network entry and exit point 2. Represents the core, high - capacity network infrastructure that interconnects data centers and carries primary inter - data - center traffic 8 Data Centers Added in 2026 Active Power Contracted Power ~ 4.2 GW Technologies to Maximize Rack Density Systematized Processes and Modular Deployments Embedded Security Broad Geographical Footprint Minimizing End User Latency Cutting - Edge Liquid Cooling Technology Massive Scale High - Speed Interconnects Large and Growing Footprint of AI Data Centers Data Center Region and/or Point of Presence 1 17 Backbone 2 51 Active Data Centers 1.5GW+
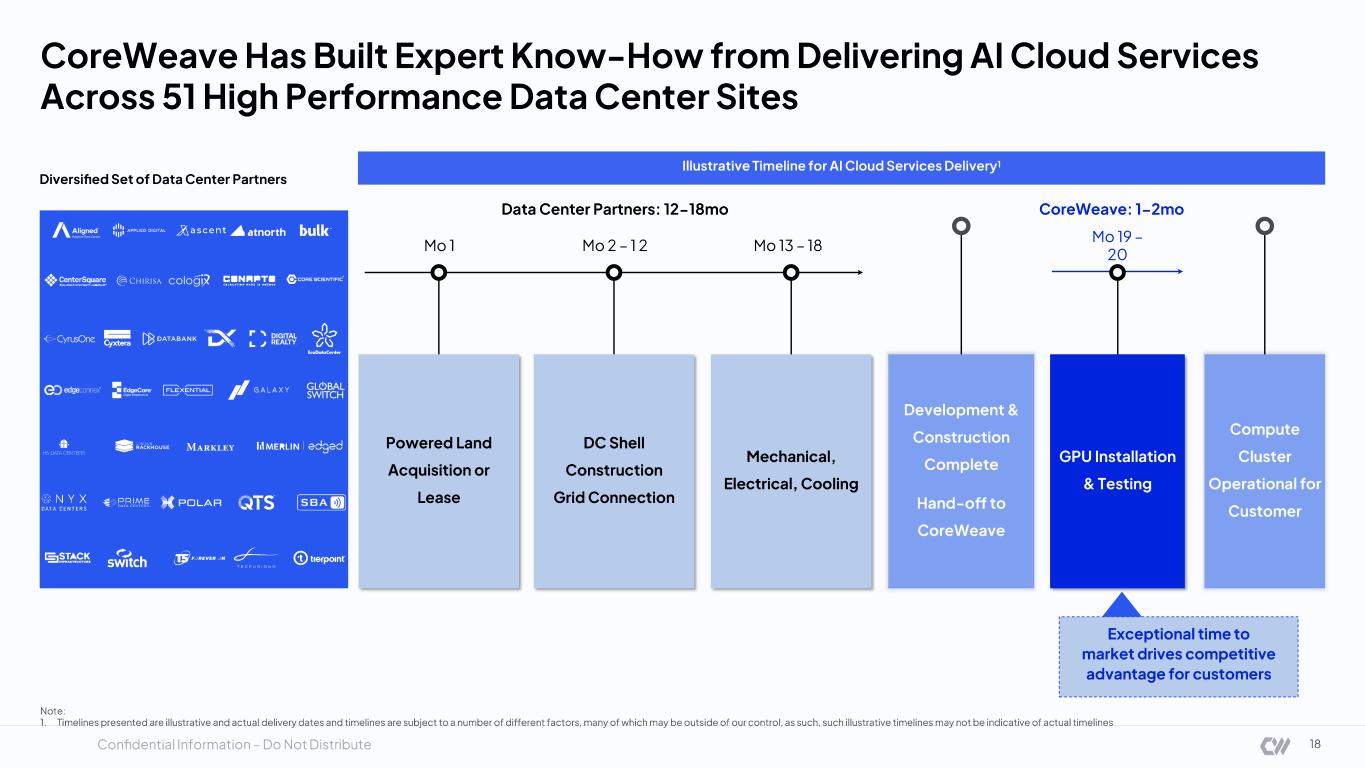
Confidential Information – Do Not Distribute Diversified Set of Data Center Partners Exceptional time to market drives competitive advantage for customers Illustrative Timeline for AI Cloud Services Delivery 1 Data Center Partners: 12 - 18mo Development & Construction Complete Hand - off to CoreWeave DC Shell Construction Grid Connection Mechanical, Electrical, Cooling CoreWeave: 1 - 2mo GPU Installation & Testing Powered Land Acquisition or Lease Compute Cluster Operational for Customer Mo 1 Mo 2 – 1 2 Mo 13 – 18 Mo 19 – 20 18 CoreWeave Has Built Expert Know - How from Delivering AI Cloud Services Across 51 High Performance Data Center Sites Note: 1. Timelines presented are illustrative and actual delivery dates and timelines are subject to a number of different factors, ma ny of which may be outside of our control, as such, such illustrative timelines may not be indicative of actual timelines
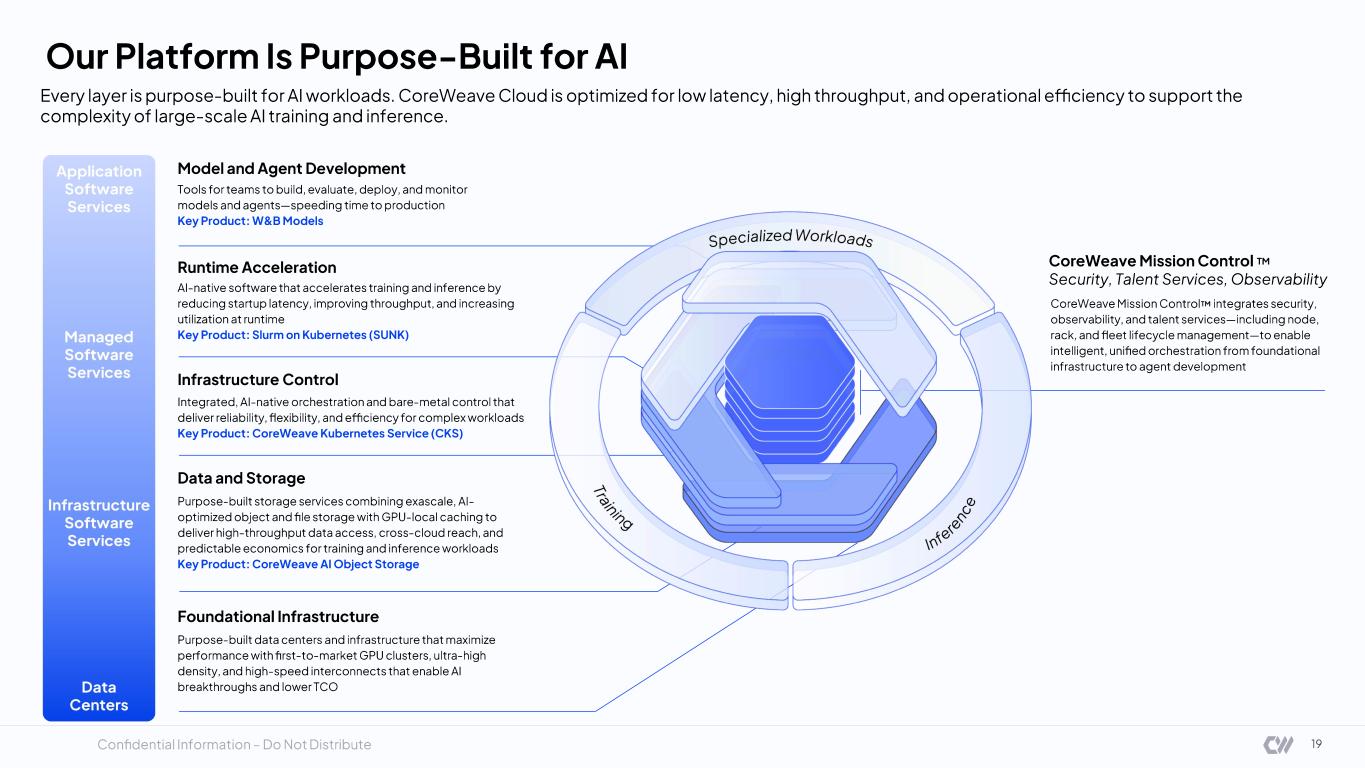
Confidential Information – Do Not Distribute Our Platform Is Purpose - Built for AI CoreWeave Mission Control Security, Talent Services, Observability Runtime Acceleration Infrastructure Control Integrated, AI - native orchestration and bare - metal control that deliver reliability, flexibility, and efficiency for complex workloads Key Product: CoreWeave Kubernetes Service (CKS) Data and Storage Purpose - built storage services combining exascale, AI - optimized object and file storage with GPU - local caching to deliver high - throughput data access, cross - cloud reach, and predictable economics for training and inference workloads Key Product: CoreWeave AI Object Storage Model and Agent Development Tools for teams to build, evaluate, deploy, and monitor models and agents —speeding time to production Key Product: W&B Models Foundational Infrastructure Purpose - built data centers and infrastructure that maximize performance with first - to - market GPU clusters, ultra - high density, and high - speed interconnects that enable AI breakthroughs and lower TCO CoreWeave Mission Control integrates security, observability, and talent services —including node, rack, and fleet lifecycle management —to enable intelligent, unified orchestration from foundational infrastructure to agent development Every layer is purpose - built for AI workloads. CoreWeave Cloud is optimized for low latency, high throughput, and operational effi ciency to support the complexity of large - scale AI training and inference. AI- native software that accelerates training and inference by reducing startup latency, improving throughput, and increasing utilization at runtime Key Product: Slurm on Kubernetes (SUNK) 19
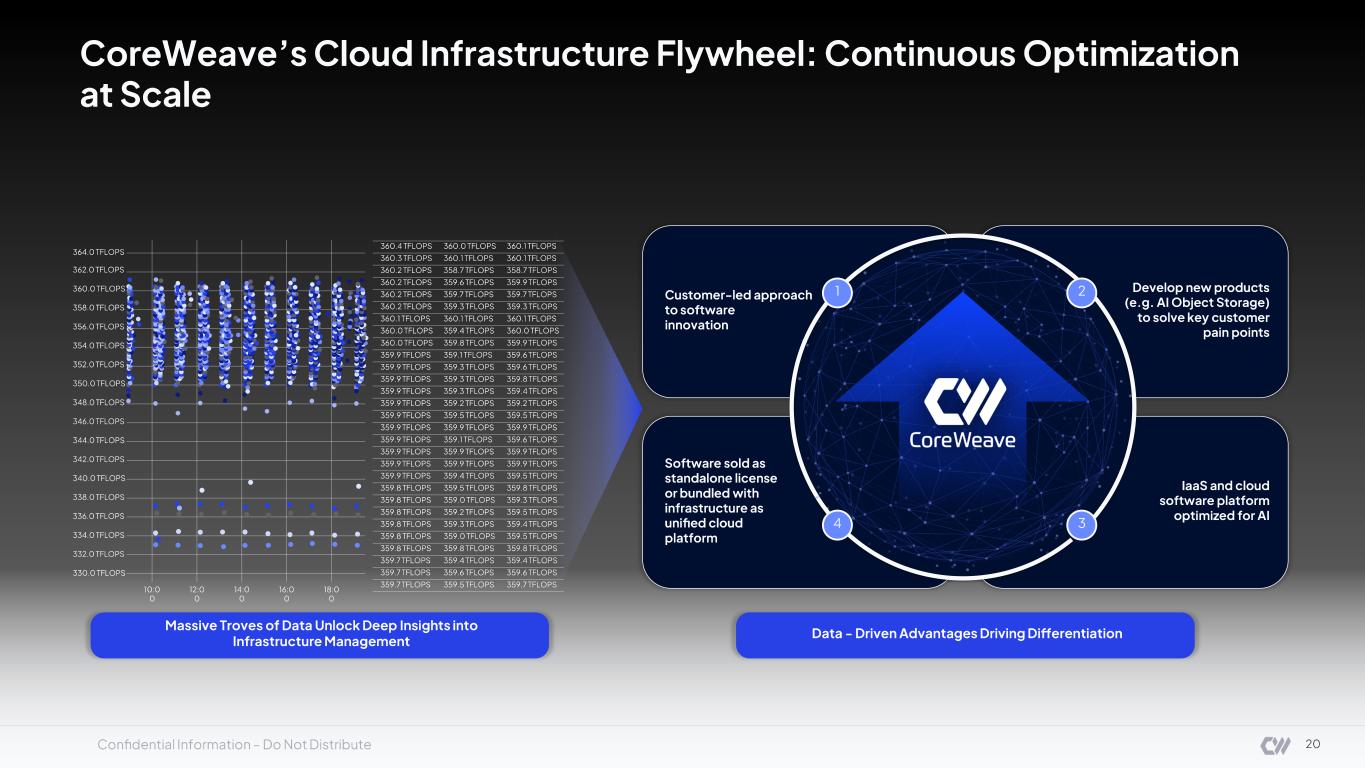
Confidential Information – Do Not Distribute Massive Troves of Data Unlock Deep Insights into Infrastructure Management 364.0 TFLOPS 362.0 TFLOPS 360.0 TFLOPS 358.0 TFLOPS 356.0 TFLOPS 354.0 TFLOPS 352.0 TFLOPS 350.0 TFLOPS 348.0 TFLOPS 346.0 TFLOPS 344.0 TFLOPS 342.0 TFLOPS 340.0 TFLOPS 338.0 TFLOPS 336.0 TFLOPS 334.0 TFLOPS 332.0 TFLOPS 330.0 TFLOPS 10:0 0 12:0 0 14:0 0 16:0 0 18:0 0 360.4 TFLOPS 360.3 TFLOPS 360.2 TFLOPS 360.2 TFLOPS 360.2 TFLOPS 360.2 TFLOPS 360.1 TFLOPS 360.0 TFLOPS 360.0 TFLOPS 359.9 TFLOPS 359.9 TFLOPS 359.9 TFLOPS 359.9 TFLOPS 359.9 TFLOPS 359.9 TFLOPS 359.9 TFLOPS 359.9 TFLOPS 359.9 TFLOPS 359.9 TFLOPS 359.9 TFLOPS 359.8 TFLOPS 359.8 TFLOPS 359.8 TFLOPS 359.8 TFLOPS 359.8 TFLOPS 359.8 TFLOPS 359.7 TFLOPS 359.7 TFLOPS 359.7 TFLOPS 360.0 TFLOPS 360.1 TFLOPS 358.7 TFLOPS 359.6 TFLOPS 359.7 TFLOPS 359.3 TFLOPS 360.1 TFLOPS 359.4 TFLOPS 359.8 TFLOPS 359.1 TFLOPS 359.3 TFLOPS 359.3 TFLOPS 359.3 TFLOPS 359.2 TFLOPS 359.5 TFLOPS 359.9 TFLOPS 359.1 TFLOPS 359.9 TFLOPS 359.9 TFLOPS 359.4 TFLOPS 359.5 TFLOPS 359.0 TFLOPS 359.2 TFLOPS 359.3 TFLOPS 359.0 TFLOPS 359.8 TFLOPS 359.4 TFLOPS 359.6 TFLOPS 359.5 TFLOPS 360.1 TFLOPS 360.1 TFLOPS 358.7 TFLOPS 359.9 TFLOPS 359.7 TFLOPS 359.3 TFLOPS 360.1 TFLOPS 360.0 TFLOPS 359.9 TFLOPS 359.6 TFLOPS 359.6 TFLOPS 359.8 TFLOPS 359.4 TFLOPS 359.2 TFLOPS 359.5 TFLOPS 359.9 TFLOPS 359.6 TFLOPS 359.9 TFLOPS 359.9 TFLOPS 359.5 TFLOPS 359.8 TFLOPS 359.3 TFLOPS 359.5 TFLOPS 359.4 TFLOPS 359.5 TFLOPS 359.8 TFLOPS 359.4 TFLOPS 359.6 TFLOPS 359.7 TFLOPS Data - Driven Advantages Driving Differentiation Customer - led approach to software innovation Develop new products (e.g. AI Object Storage) to solve key customer pain points IaaS and cloud software platform optimized for AI Software sold as standalone license or bundled with infrastructure as unified cloud platform 2 34 1 CoreWeave’s Cloud Infrastructure Flywheel: Continuous Optimization at Scale 20
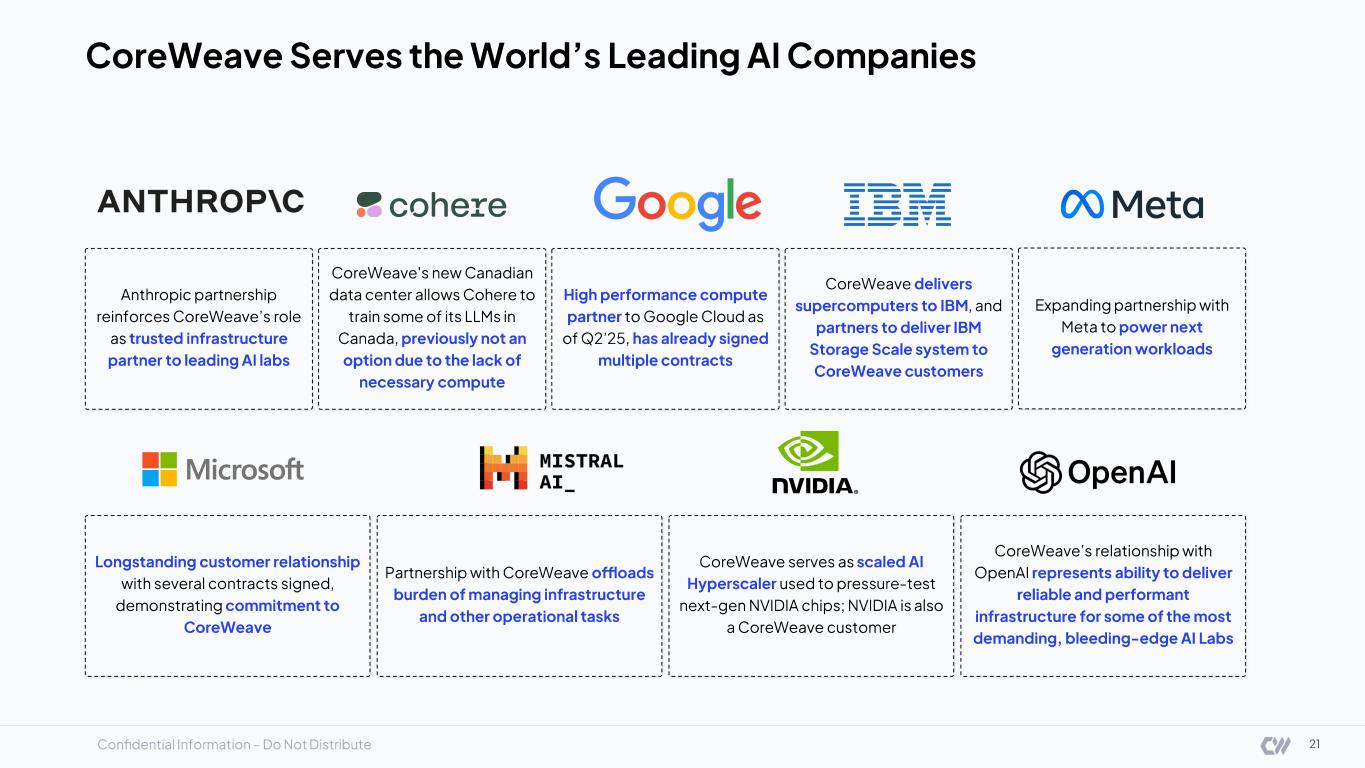
Confidential Information – Do Not Distribute High performance compute partner to Google Cloud as of Q2’25, has already signed multiple contracts CoreWeave's new Canadian data center allows Cohere to train some of its LLMs in Canada, previously not an option due to the lack of necessary compute Partnership with CoreWeave offloads burden of managing infrastructure and other operational tasks CoreWeave serves as scaled AI Hyperscaler used to pressure - test next - gen NVIDIA chips; NVIDIA is also a CoreWeave customer 21 CoreWeave Serves the World’s Leading AI Companies CoreWeave’s relationship with OpenAI represents ability to deliver reliable and performant infrastructure for some of the most demanding, bleeding - edge AI Labs Longstanding customer relationship with several contracts signed, demonstrating commitment to CoreWeave CoreWeave delivers supercomputers to IBM , and partners to deliver IBM Storage Scale system to CoreWeave customers Anthropic partnership reinforces CoreWeave’s role as trusted infrastructure partner to leading AI labs Expanding partnership with Meta to power next generation workloads
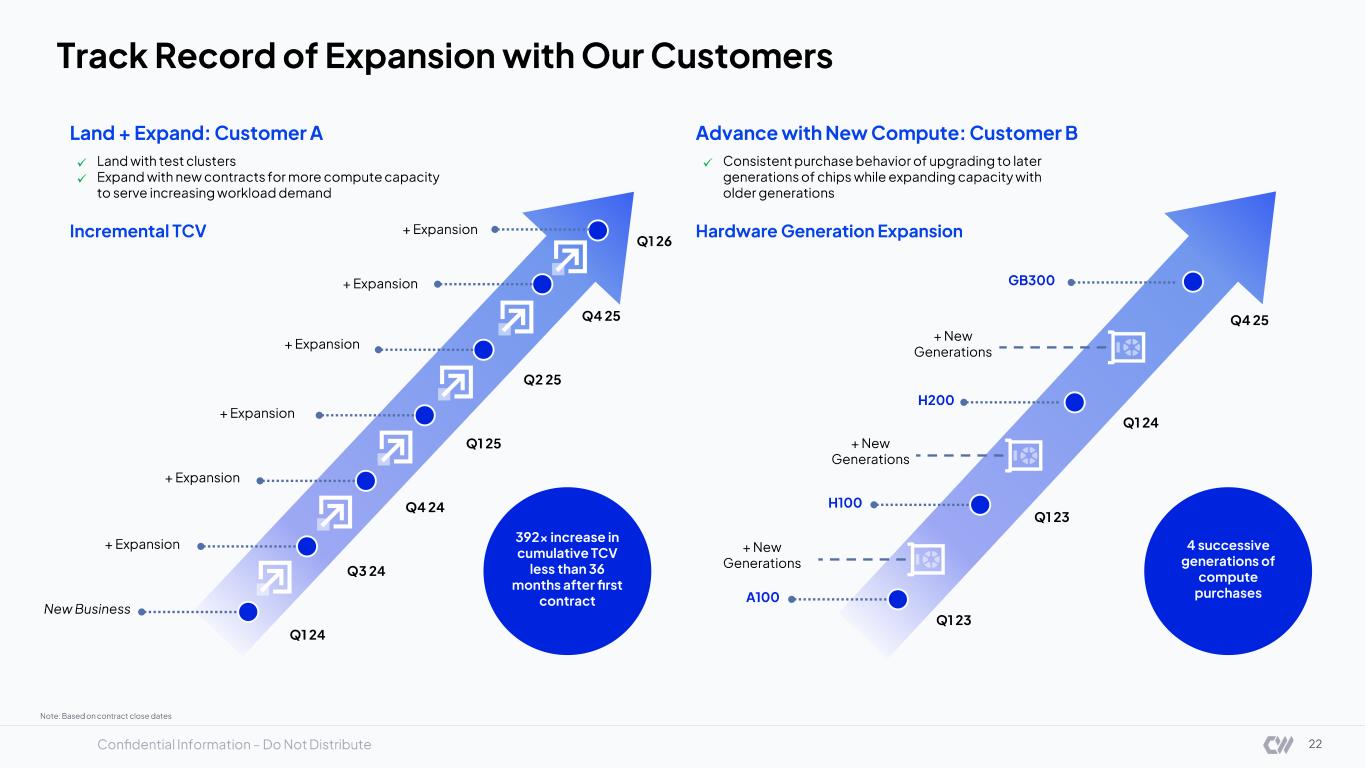
Confidential Information – Do Not Distribute 22 Track Record of Expansion with Our Customers Land + Expand: Customer A Advance with New Compute: Customer B ✓ Land with test clusters ✓ Expand with new contracts for more compute capacity to serve increasing workload demand ✓ Consistent purchase behavior of upgrading to later generations of chips while expanding capacity with older generations Incremental TCV Hardware Generation Expansion 4 successive generations of compute purchases 392x increase in cumulative TCV less than 36 months after first contract + Expansion + Expansion New Business Q1 25 Q3 24 Q1 24 + Expansion GB300 Q4 25 H200 Q1 24 A100 Q1 23 Q4 24 + New Generations + New Generations H100 Q1 23 + New Generations + Expansion Q4 25 Note: Based on contract close dates Q2 25 + Expansion Q1 26 + Expansion
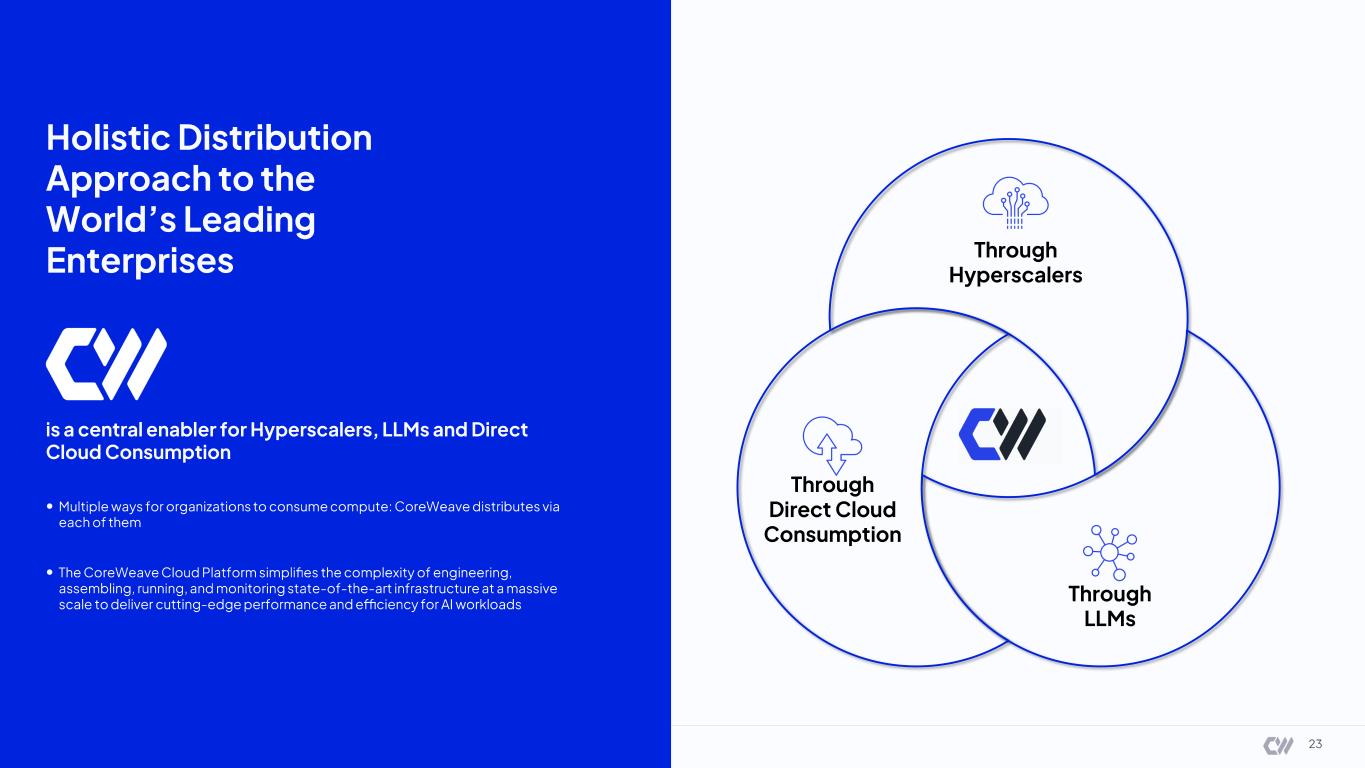
Confidential Information – Do Not Distribute is a central enabler for Hyperscalers , LLMs and Direct Cloud Consumption • Multiple ways for organizations to consume compute: CoreWeave distributes via each of them • The CoreWeave Cloud Platform simplifies the complexity of engineering, assembling, running, and monitoring state - of - the - art infrastructure at a massive scale to deliver cutting - edge performance and efficiency for AI workloads Holistic Distribution Approach to the World’s Leading Enterprises Through LLMs Through Direct Cloud Consumption Through Hyperscalers 23
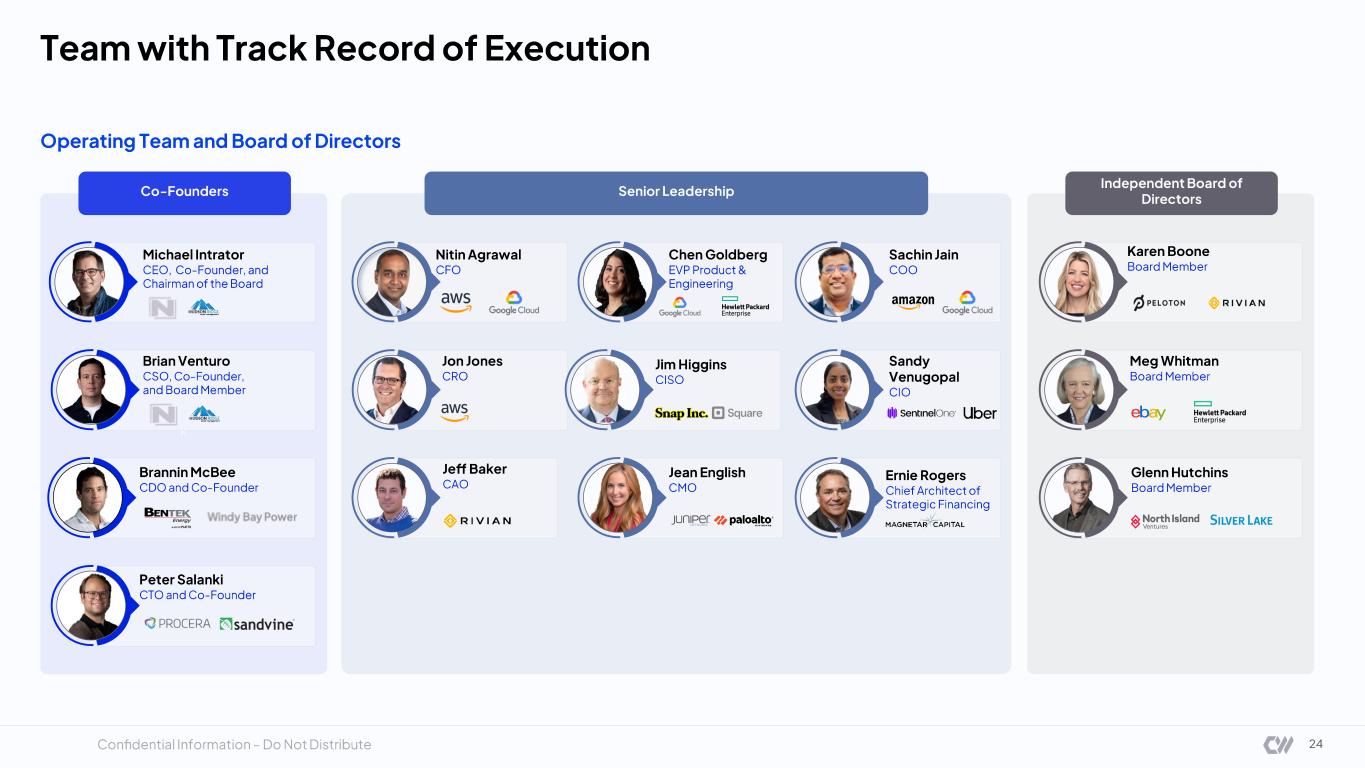
Confidential Information – Do Not Distribute k Team with Track Record of Execution 24 Operating Team and Board of Directors Co - Founders Brian Venturo CSO, Co - Founder, and Board Member Brannin McBee CDO and Co - Founder Michael Intrator CEO, Co - Founder, and Chairman of the Board Peter Salanki CTO and Co - Founder Independent Board of Directors Karen Boone Board Member Meg Whitman Board Member Glenn Hutchins Board Member Senior Leadership Nitin Agrawal CFO Jon Jones CRO Jim Higgins CISO Chen Goldberg E VP Product & Engineering Jean English CMO Jeff Baker CAO Sachin Jain COO Ernie Rogers Chief Architect of Strategic Financing Sandy Venugopal CIO

Confidential Information – Do Not Distribute Financial Highlights © 2026 CoreWeave, Inc. All rights reserved
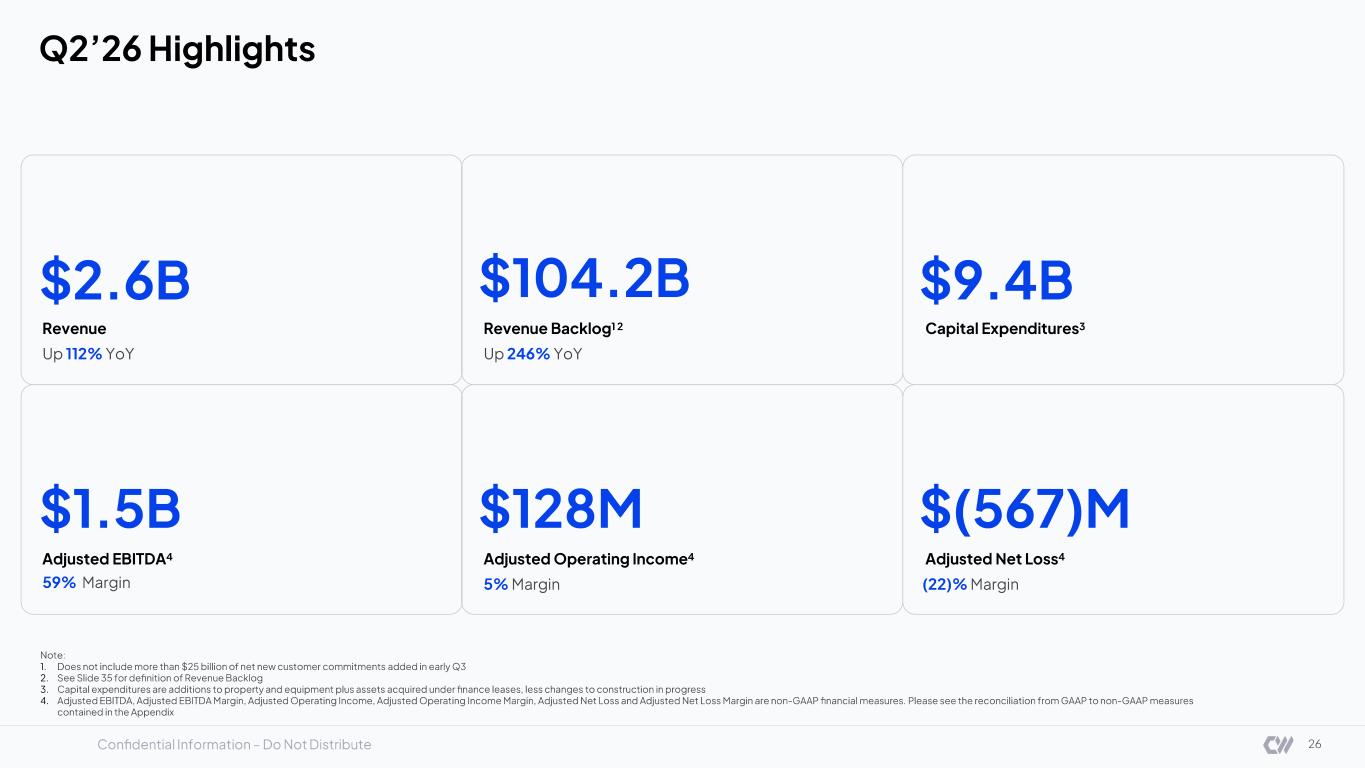
Confidential Information – Do Not Distribute 5% Margin $1.5B $128M $(567)M Note: 1. Does not include more than $25 billion of net new customer commitments added in early Q3 2. See Slide 3 5 for definition of Revenue Backlog 3. Capital expenditures are additions to property and equipment plus assets acquired under finance leases, less changes to const ruc tion in progress 4. Adjusted EBITDA, Adjusted EBITDA Margin, Adjusted Operating Income, Adjusted Operating Income Margin, Adjusted Net Loss and A dju sted Net Loss Margin are non - GAAP financial measures. Please see the reconciliation from GAAP to non - GAAP measures contained in the Appendix $2.6B Up 112% YoY $104.2B $9.4B Q2’26 Highlights Revenue Revenue Backlog 1 2 Up 246% YoY Capital Expenditures 3 Adjusted EBITDA 4 Adjusted Operating Income 4 Adjusted Net Loss 4 (22)% Margin 26 59% Margin
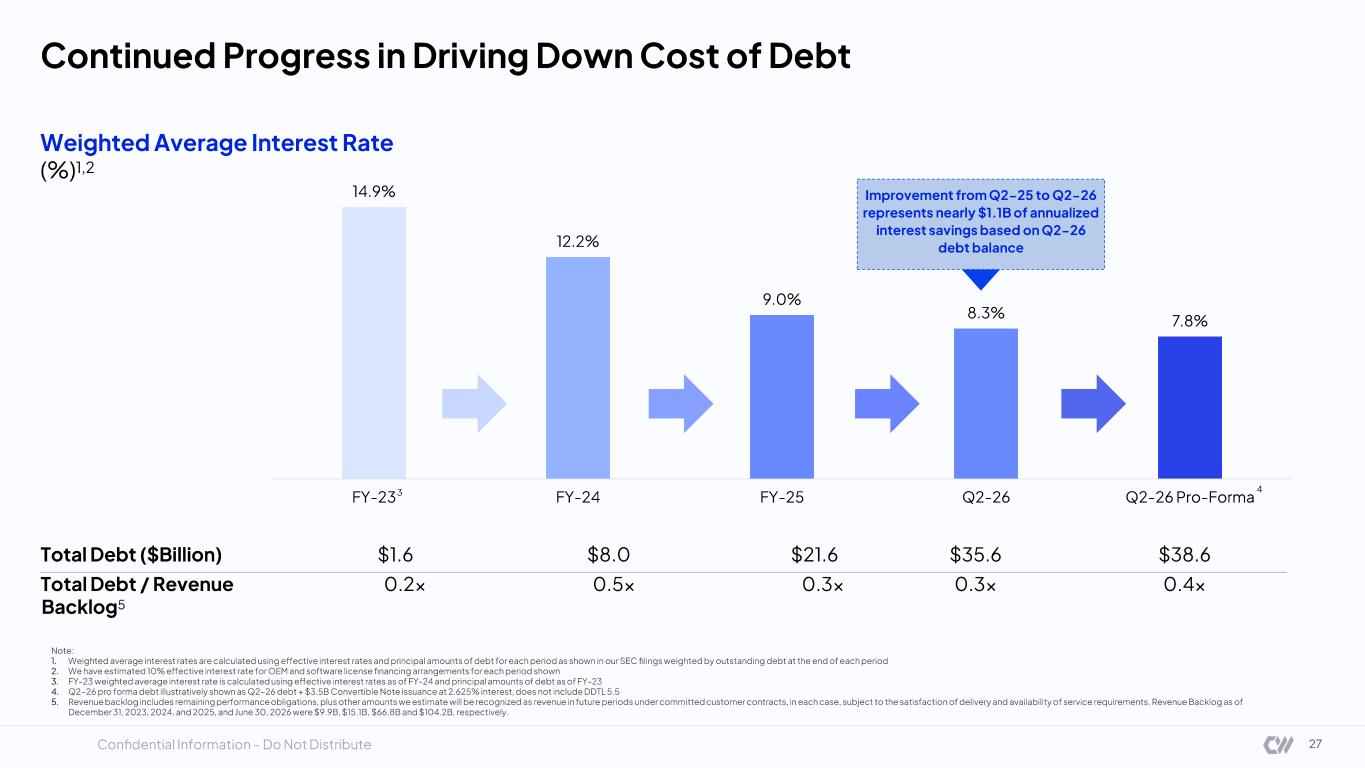
Confidential Information – Do Not Distribute 14.9% 12.2% 9.0% 8.3% 7.8% FY-23 FY-24 FY-25 Q2-26 Q2-26 Pro-Forma Continued Progress in Driving Down Cost of Debt Note: 1. Weighted average interest rates are calculated using effective interest rates and principal amounts of debt for each period a s s hown in our SEC filings weighted by outstanding debt at the end of each period 2. We have estimated 10% effective interest rate for OEM and software license financing arrangements for each period shown 3. FY - 23 weighted average interest rate is calculated using effective interest rates as of FY - 24 and principal amounts of debt as o f FY - 23 4. Q2 - 26 pro forma debt illustratively shown as Q2 - 26 debt + $ 3.5B Convertible Note issuance at 2. 625 % interest, does not include DDTL 5.5 5. Revenue backlog includes remaining performance obligations, plus other amounts we estimate will be recognized as revenue in f utu re periods under committed customer contracts, in each case, subject to the satisfaction of delivery and availability of serv ice requirements. Revenue Backlog as of December 31, 2023, 2024, and 2025, and June 30, 2026 were $ 9.9B , $15.1B, $ 66.8B and $ 104.2B , respectively. 27 Weighted Average Interest Rate (%) 1,2 Total Debt ($Billion) $1.6 $8.0 $21.6 $35.6 $ 38.6 Total Debt / Revenue Backlo g 5 0.2x 0.5x 0.3x 0.3x 0.4x Improvement from Q2 - 25 to Q2 - 26 represents nearly $ 1.1B of annualized interest savings based on Q2 - 26 debt balance 3 4
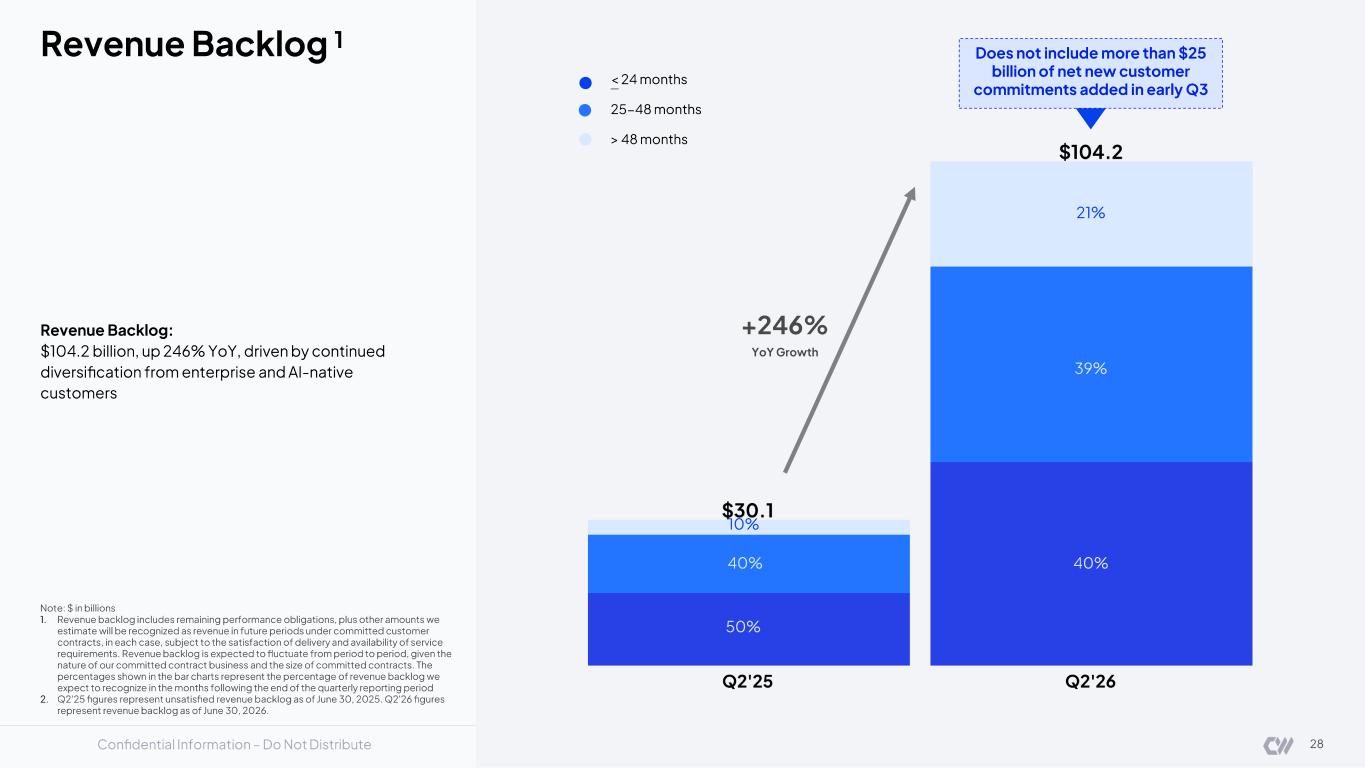
Confidential Information – Do Not Distribute < 24 months 25 - 48 months > 48 months +246% YoY Growth Note: $ in billions 1. Revenue backlog includes remaining performance obligations, plus other amounts we estimate will be recognized as revenue in future periods under committed customer contracts, in each case, subject to the satisfaction of delivery and availability of service requirements. Revenue backlog is expected to fluctuate from period to period, given the nature of our committed contract business and the size of committed contracts. The percentages shown in the bar charts represent the percentage of revenue backlog we expect to recognize in the months following the end of the quarterly reporting period 2. Q2'25 figures represent unsatisfied revenue backlog as of June 30, 2025. Q2'26 figures represent revenue backlog as of June 30, 2026. Revenue Backlog 1 10% 50% 40% 21% 39% 40% 28 Revenue Backlog: $104.2 billion, up 246% YoY, driven by continued diversification from enterprise and AI - native customers Does not include more than $25 billion of net new customer commitments added in early Q3
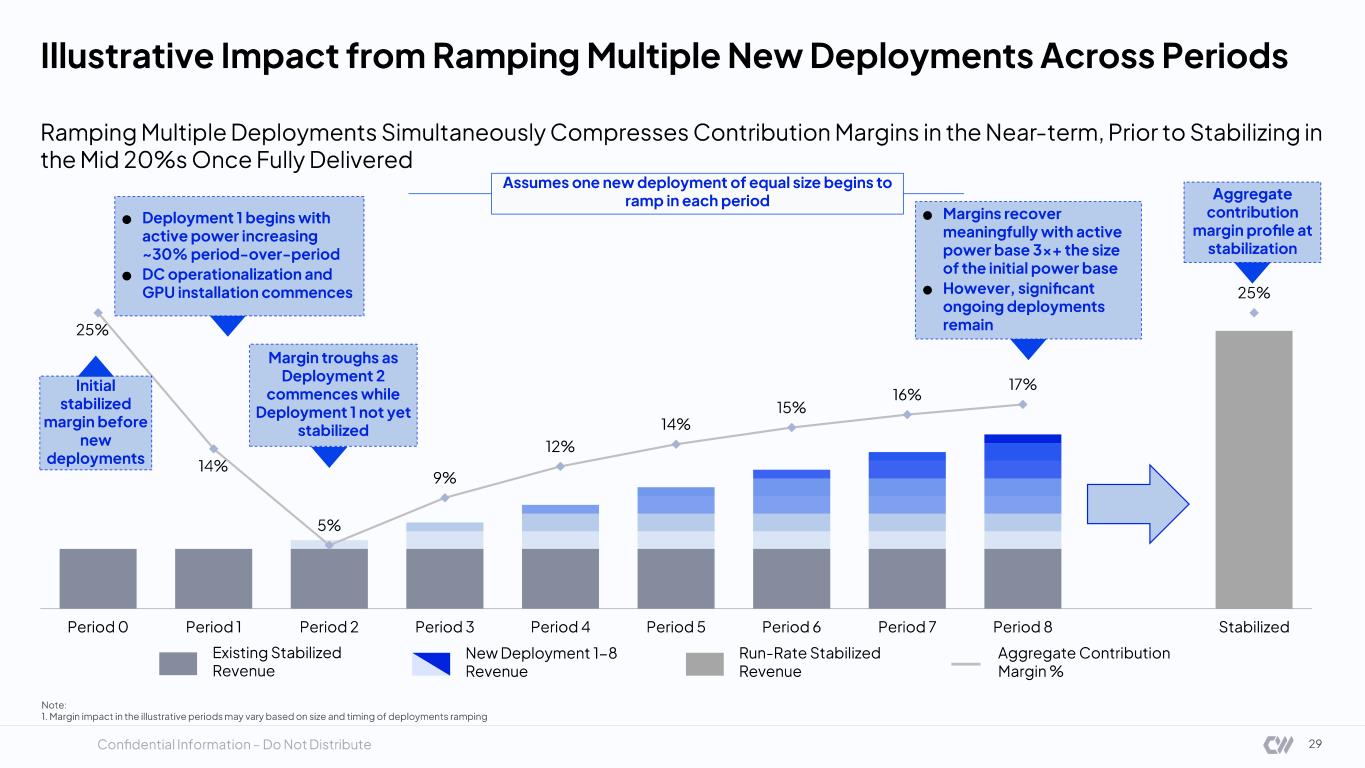
Confidential Information – Do Not Distribute Illustrative Impact from Ramping Multiple New Deployments Across Periods Note: 1. Margin impact in the illustrative periods may vary based on size and timing of deployments ramping 29 Ramping Multiple Deployments Simultaneously Compresses Contribution Margins in the Near - term, Prior to Stabilizing in the Mid 20%s Once Fully Delivered 25% 14% 5% 9% 12% 14% 15% 16% 17% 25% Period 0 Period 1 Period 2 Period 3 Period 4 Period 5 Period 6 Period 7 Period 8 Stabilized Initial stabilized margin before new deployments ● Deployment 1 begins with active power increasing ~30% period - over - period ● DC operationalization and GPU installation commences Aggregate contribution margin profile at stabilization ● Margins recover meaningfully with active power base 3x+ the size of the initial power base ● However, significant ongoing deployments remain Assumes one new deployment of equal size begins to ramp in each period Existing Stabilized Revenue New Deployment 1 - 8 Revenue Aggregate Contribution Margin % Run - Rate Stabilized Revenue Margin troughs as Deployment 2 commences while Deployment 1 not yet stabilized
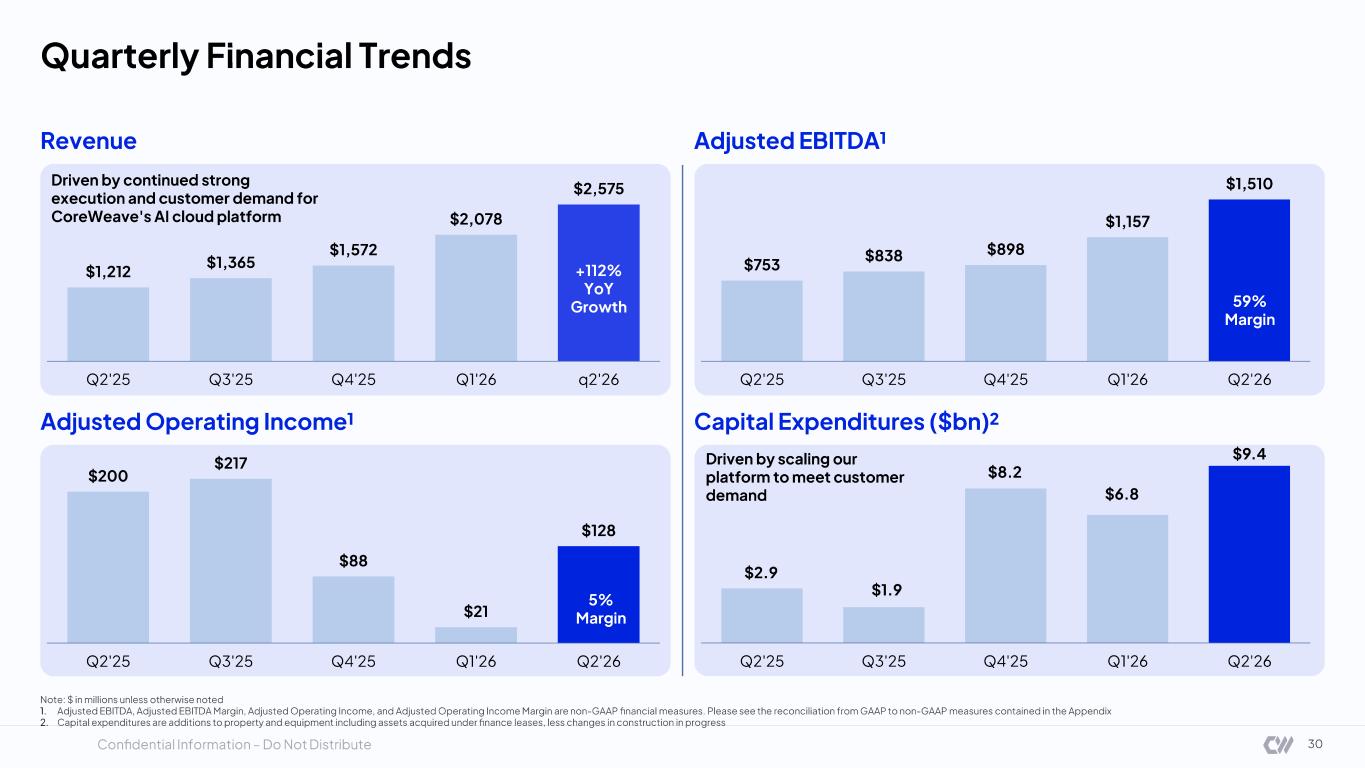
Confidential Information – Do Not Distribute Quarterly Financial Trends 30 Revenue Adjusted EBITDA¹ Adjusted Operating Income¹ Capital Expenditures ($bn)² $1,212 $1,365 $1,572 $2,078 $2,575 Q2'25 Q3'25 Q4'25 Q1'26 q2'26 +112% YoY Growth Driven by continued strong execution and customer demand for CoreWeave's AI cloud platform $753 $838 $898 $1,157 $1,510 Q2'25 Q3'25 Q4'25 Q1'26 Q2'26 59 % Margin $200 $217 $88 $21 $128 Q2'25 Q3'25 Q4'25 Q1'26 Q2'26 $2.9 $1.9 $8.2 $6.8 $9.4 Q2'25 Q3'25 Q4'25 Q1'26 Q2'26 Driven by scaling our platform to meet customer demand 5% Margin Note: $ in millions unless otherwise noted 1. Adjusted EBITDA, Adjusted EBITDA Margin, Adjusted Operating Income, and Adjusted Operating Income Margin are non - GAAP financial measures. Please see the reconciliation from GAAP to non - GAAP measures contained in the Appendix 2. Capital expenditures are additions to property and equipment including assets acquired under finance leases, less changes in con struction in progress
Confidential Information – Do Not Distribute Appendix A: Non - GAAP Reconciliations © 2026 CoreWeave, Inc. All rights reserved
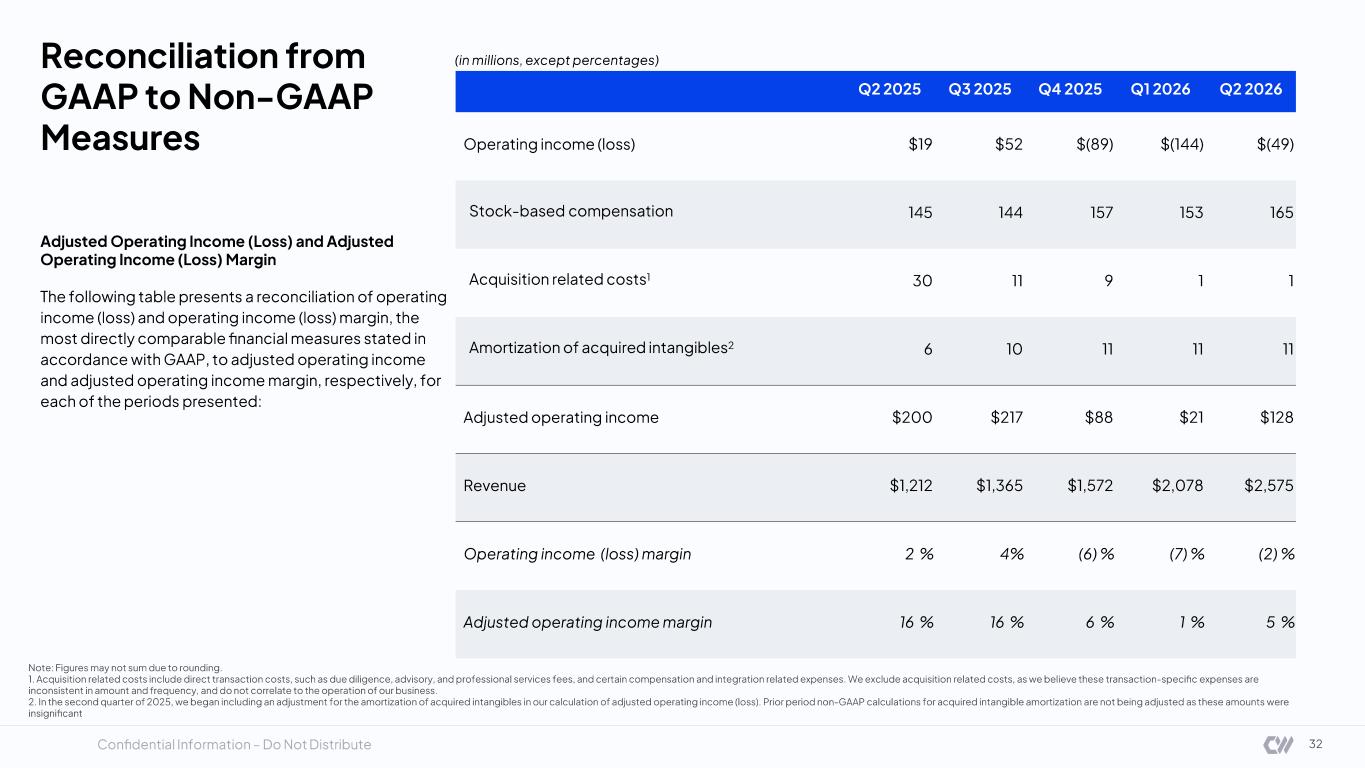
Confidential Information – Do Not Distribute Q2 2025 Q3 2025 Q4 2025 Q1 2026 Q2 2026 Operating income (loss) $19 $52 $(89) $(144) $(49) Stock - based compensation 145 144 157 153 165 Acquisition related costs 1 30 11 9 1 1 Amortization of acquired intangibles 2 6 10 11 11 11 Adjusted operating income $200 $217 $88 $21 $128 Revenue $1,212 $1,365 $1,572 $2,078 $2,575 Operating income (loss) margin 2 % 4% (6) % (7) % (2) % Adjusted operating income margin 16 % 16 % 6 % 1 % 5 % (in millions, except percentages)Reconciliation from GAAP to Non - GAAP Measures 32 Adjusted Operating Income (Loss) and Adjusted Operating Income (Loss) Margin The following table presents a reconciliation of operating income (loss) and operating income (loss) margin, the most directly comparable financial measures stated in accordance with GAAP, to adjusted operating income and adjusted operating income margin, respectively, for each of the periods presented: Note: Figures may not sum due to rounding. 1. Acquisition related costs include direct transaction costs, such as due diligence, advisory, and professional services fee s, and certain compensation and integration related expenses. We exclude acquisition related costs, as we believe these transact ion - specific expenses are inconsistent in amount and frequency, and do not correlate to the operation of our business. 2. In the second quarter of 2025, we began including an adjustment for the amortization of acquired intangibles in our calcul ati on of adjusted operating income (loss). Prior period non - GAAP calculations for acquired intangible amortization are not being ad justed as these amounts were insignificant
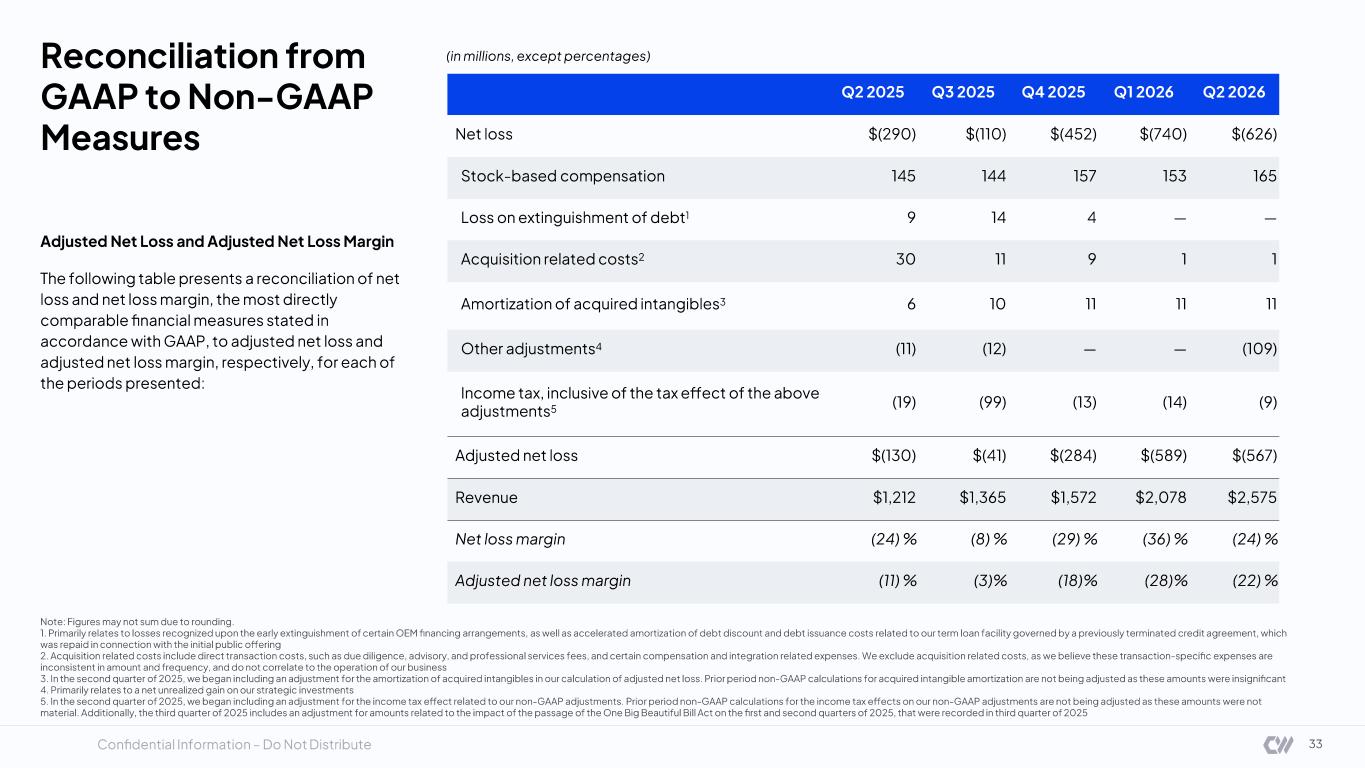
Confidential Information – Do Not Distribute (in millions, except percentages) Q2 2025 Q3 2025 Q4 2025 Q1 2026 Q2 2026 Net loss $(290) $(110) $(452) $(740) $(626) Stock - based compensation 145 144 157 153 165 Loss on extinguishment of debt 1 9 14 4 — — Acquisition related costs 2 30 11 9 1 1 Amortization of acquired intangibles 3 6 10 11 11 11 Other adjustments 4 (11) (12) — — (109) Income tax, inclusive of the tax effect of the above adjustments 5 (19) (99) (13) (14) (9) Adjusted net loss $(130) $(41) $(284) $(589) $(567) Revenue $1,212 $1,365 $1,572 $2,078 $2,575 Net loss margin (24) % (8) % (29) % (36) % (24) % Adjusted net loss margin (11)% (3) % (18)% (28) % (22) % Reconciliation from GAAP to Non - GAAP Measures 33 Adjusted Net Loss and Adjusted Net Loss Margin The following table presents a reconciliation of net loss and net loss margin, the most directly comparable financial measures stated in accordance with GAAP, to adjusted net loss and adjusted net loss margin, respectively, for each of the periods presented: Note: Figures may not sum due to rounding. 1. Primarily relates to losses recognized upon the early extinguishment of certain OEM financing arrangements, as well as acc ele rated amortization of debt discount and debt issuance costs related to our term loan facility governed by a previously termin ate d credit agreement, which was repaid in connection with the initial public offering 2. Acquisition related costs include direct transaction costs, such as due diligence, advisory, and professional services fee s, and certain compensation and integration related expenses. We exclude acquisition related costs, as we believe these transact ion - specific expenses are inconsistent in amount and frequency, and do not correlate to the operation of our business 3. In the second quarter of 2025, we began including an adjustment for the amortization of acquired intangibles in our calcul ati on of adjusted net loss. Prior period non - GAAP calculations for acquired intangible amortization are not being adjusted as these amounts were insignificant 4. Primarily relates to a net unrealized gain on our strategic investments 5. In the second quarter of 2025, we began including an adjustment for the income tax effect related to our non - GAAP adjustments . Prior period non - GAAP calculations for the income tax effects on our non - GAAP adjustments are not being adjusted as these amou nts were not material. Additionally, the third quarter of 2025 includes an adjustment for amounts related to the impact of the passage of the One Big Beautiful Bill Act on the first and second quarters of 2025, that were recorded in third quarter of 2025
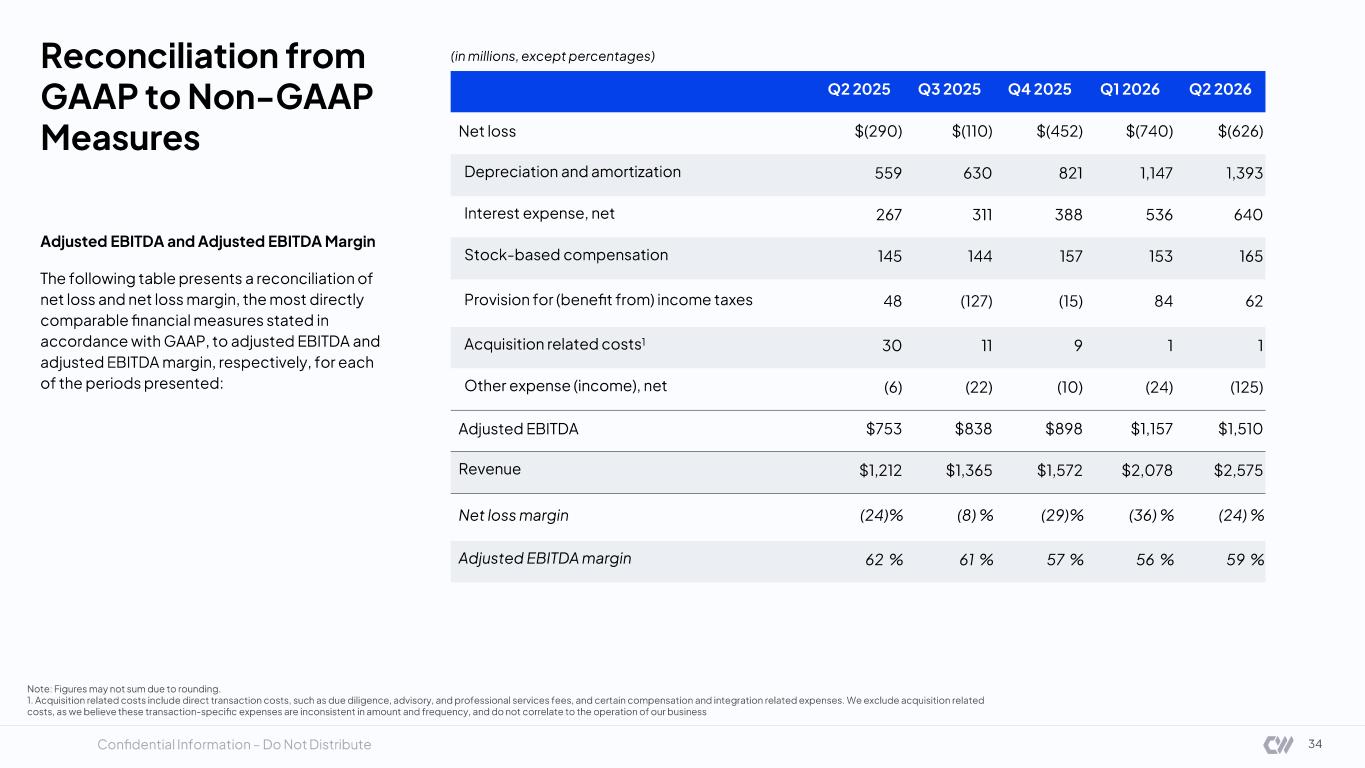
Confidential Information – Do Not Distribute Adjusted EBITDA and Adjusted EBITDA Margin The following table presents a reconciliation of net loss and net loss margin, the most directly comparable financial measures stated in accordance with GAAP, to adjusted EBITDA and adjusted EBITDA margin, respectively, for each of the periods presented: Q2 2025 Q3 2025 Q4 2025 Q1 2026 Q2 2026 Net loss $(290) $(110) $(452) $(740) $(626) Depreciation and amortization 559 630 821 1,147 1,393 Interest expense, net 267 311 388 536 640 Stock - based compensation 145 144 157 153 165 Provision for (benefit from) income taxes 48 (127) (15) 84 62 Acquisition related costs 1 30 11 9 1 1 Other expense (income), net (6) (22) (10) (24) (125) Adjusted EBITDA $753 $838 $898 $1,157 $1,510 Revenue $1,212 $1,365 $1,572 $2,078 $2,575 Net loss margin (24) % (8) % (29) % (36) % (24) % Adjusted EBITDA margin 62 % 61 % 57 % 56 % 59 % (in millions, except percentages)Reconciliation from GAAP to Non - GAAP Measures 34 Note: Figures may not sum due to rounding. 1. Acquisition related costs include direct transaction costs, such as due diligence, advisory, and professional services fee s, and certain compensation and integration related expenses. We exclude acquisition related costs, as we believe these transaction - specific expenses are inconsistent in amount and frequency, and do not correlate to the o peration of our business
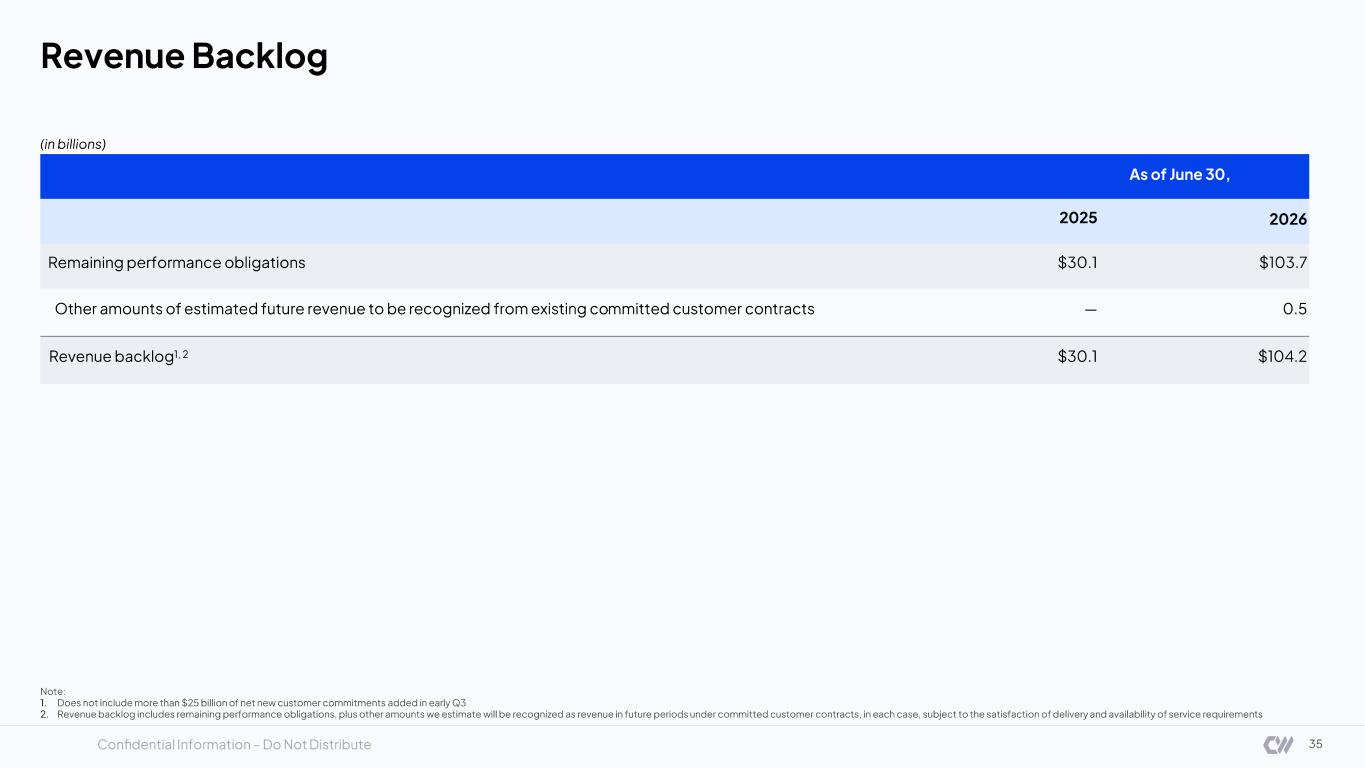
Confidential Information – Do Not Distribute As of June 30, 2025 2026 Remaining performance obligations $30.1 $103.7 Other amounts of estimated future revenue to be recognized from existing co mm itted customer contracts — 0.5 Revenue backlog 1, 2 $30.1 $104.2 (in billions) Revenue Backlog Note: 1. Does not include more than $25 billion of net new customer commitments added in early Q3 2. Revenue backlog includes remaining performance obligations, plus other amounts we estimate will be recognized as revenue in f utu re periods under committed customer contracts, in each case, subject to the satisfaction of delivery and availability of serv ice requirements 35
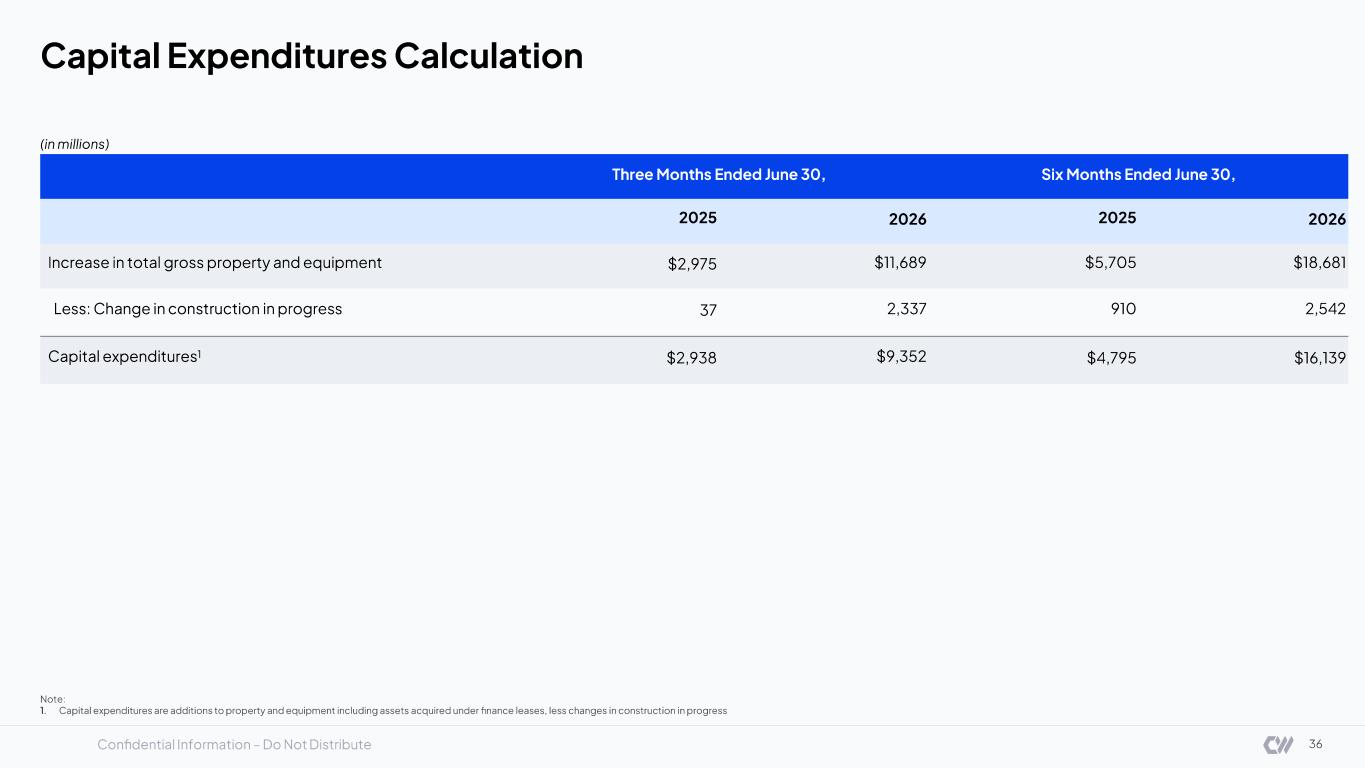
Confidential Information – Do Not Distribute Three Months Ended June 30, Six Months Ended June 30, 2025 2026 2025 2026 Increase in total gross property and equipment $2,975 $11,689 $5,705 $18,681 Less: Change in construction in progress 37 2,337 910 2,542 Capital expenditures 1 $2,938 $9,352 $4,795 $16,139 Capital Expenditures Calculation Note: 1. Capital expenditures are additions to property and equipment including assets acquired under finance leases, less changes in co nstruction in progress (in millions) 36

Confidential Information – Do Not Distribute Thank You