Exhibit 96.1
| S-K 1300 TECHNICAL REPORT SUMMARY PRE-FEASIBILITY STUDY – INDIVIDUAL DISCLOSURE PILOT MOUNTAIN TUNGSTEN FOR GUARDIAN METAL RESOURCES PREPARED BY Guardian Metal Resources 74-76 Temple Chambers, 3-7 Temple Avenue, London, England, EC4Y 0DT 720.635.3143 Samuel Engineering, Inc. 8450 East Crescent Pkwy. Ste. 200 Greenwood Village, CO 80111-2816 303.714.4840 NewFields Mining Design & Technical Services 9540 Maroon Circle, Ste. 300 Englewood, CO 80112 720.508.330 RESPEC Company, LLC 210 South Rock Boulevard Reno, NV 89502 775-997-0681 SE Project No. 25173-01, Rev 0 Effective Date: June 30, 2026 Report Date: August 21, 2026 Qualified Persons Steven Alan Pozder, P.E., MBA, Samuel Engineering, Inc. Cameron Wolf, P.E., Samuel Engineering, Inc. Adrien Butler, P.E., NewFields Mining Design & Technical Services Nathan Forsythe, CPG, RESPEC Company, LLC Thomas L. Dyer, P.E., RESPEC Company, LLC |
| Engineering ◆ Project Controls ◆ Estimating ◆ Construction Management DATE AND SIGNATURE PAGE This report, titled “S-K 1300 TECHNICAL REPORT SUMMARY PRE-FEASIBILITY STUDY – INDIVIDUAL DISCLOSURE PILOT MOUNTAIN TUNGSTEN, located near the town of Mina in Mineral County, Nevada, dated August 21, 2026, with an effective date of June 30, 2026, was prepared and signed by: Samuel Engineering, Inc. Dated August 21, 2026 /s/ Samuel Engineering, Inc. NewFields Mining Design & Technical Services Dated August 21, 2026 /s/ NewFields Mining Design & Technical Services RESPEC Company, LLC Dated August 21, 2026 /s/ RESPEC Company, LLC This report was authored by the qualified persons (each a “QP” and collectively, the “QPs”) listed in Section 2.3. Each QP and their respective Company only assumes responsibility for those sections or areas of the report that are referenced opposite their name in Section 2.3. None of such QPs, however, accepts any responsibility or liability for the sections or areas of this report that other QPs prepared. |
| Engineering ◆ Project Controls ◆ Estimating ◆ Construction Management Table of Contents 1.0 EXECUTIVE SUMMARY....................................................................................................1 1.1 PROPERTY LOCATION, DESCRIPTION, AND OWNERSHIP ..................................................2 1.2 HISTORY ..........................................................................................................................3 1.3 GEOLOGIC SETTING AND MINERALIZATION .....................................................................4 1.4 MINERAL RESOURCE AND RESERVE ESTIMATES...............................................................7 1.5 MINING METHODS ........................................................................................................11 1.6 METALLURGICAL TESTWORK AND RECOVERY METHODS ...............................................12 1.7 INFRASTRUCTURE..........................................................................................................13 1.8 ENVIRONMENTAL STUDIES, SOCIAL OR COMMUNITY IMPACT AND PERMITTING..........14 1.9 CLOSURE........................................................................................................................22 1.10 CAPITAL COST................................................................................................................22 1.11 OPERATING COST ..........................................................................................................23 1.12 FINANCIAL ECONOMICS AND METRICS ..........................................................................24 1.13 OPPORTUNITIES ............................................................................................................26 1.14 RISKS .............................................................................................................................26 1.15 RECOMMENDATIONS ....................................................................................................26 2.0 INTRODUCTION.............................................................................................................28 2.1 PRE-FEASIBILITY STUDY OVERVIEW................................................................................28 2.2 TERMS OF REFERENCE ...................................................................................................29 2.3 QUALIFIED PERSONS AND SOURCES OF INFORMATION.................................................29 2.4 PERSONAL INSPECTION .................................................................................................30 3.0 PROPERTY DESCRIPTION...............................................................................................31 3.1 LOCATION......................................................................................................................31 3.2 PROPERTY AND TITLE.....................................................................................................33 3.3 OWNERSHIP ..................................................................................................................36 3.4 ROYALTIES AND RETENTIONS ........................................................................................36 3.5 BACK-IN RIGHTS.............................................................................................................37 4.0 ACCESSIBILITY, CLIMATE, LOCAL RESOURCES, INFRASTRUCTURE AND PHYSIOGRAPHY ......................................................................................................................................38 4.1 ACCESSIBILITY................................................................................................................38 4.2 CLIMATE AND LENGTH OF OPERATING SEASON ............................................................38 4.3 LOCAL RESOURCES AND INFRASTRUCTURE....................................................................38 4.4 TOPOGRAPHY, ELEVATION AND VEGETATION ...............................................................38 4.5 AVAILABILITY OF AREA FOR MINE AND PROCESSING FACILITIES ....................................39 5.0 HISTORY........................................................................................................................40 5.1 PROPERTY HISTORY .......................................................................................................40 5.2 HISTORICAL MINERAL RESOURCE ESTIMATES ................................................................42 6.0 GEOLOGICAL SETTING, MINERALIZATION, AND DEPOSIT .............................................43 6.1 GEOLOGICAL SETTING ...................................................................................................43 |
| Engineering ◆ Project Controls ◆ Estimating ◆ Construction Management 6.2 MINERALIZATION...........................................................................................................48 6.3 DEPOSIT TYPE ................................................................................................................50 7.0 EXPLORATION...............................................................................................................51 7.1 EXPLORATION HISTORY .................................................................................................51 7.2 GEOLOGICAL MAPPING AND STUDIES ...........................................................................51 7.3 GEOPHYSICS ..................................................................................................................52 7.4 FUTURE EXPLORATION ..................................................................................................52 7.5 DRILLING .......................................................................................................................52 8.0 SAMPLE PREPARATION, ANALYSES, AND SECURITY .....................................................55 8.1 SAMPLING METHODS AND QA/QC ................................................................................55 8.2 SAMPLE PREPARATION AND ANALYSES .........................................................................56 8.3 QUALITY ASSURANCE/QUALITY CONTROL .....................................................................58 8.4 QP OPINION ..................................................................................................................66 9.0 DATA VERIFICATION......................................................................................................68 9.1 SITE VISITS AND PERSONAL INSPECTIONS ......................................................................68 9.2 DRILL-HOLE DATA VERIFICATION ...................................................................................68 9.3 LIMITATIONS .................................................................................................................75 9.4 ADEQUACY OF DATA......................................................................................................75 10.0 MINERAL PROCESSING AND METALLURGICAL TESTING ...............................................77 10.1 REVIEW OF HISTORICAL METALLURGICAL TESTWORK ...................................................77 10.2 CURRENT METALLURGICAL TESTWORK PROGRAMS ......................................................88 11.0 MINERAL RESOURCE ESTIMATES ................................................................................103 11.1 DATABASE ...................................................................................................................105 11.2 GEOLOGIC MODEL.......................................................................................................106 11.3 MINERAL DOMAINS.....................................................................................................106 11.4 SPECIFIC GRAVITY........................................................................................................111 11.5 ASSAY CODING, CAPPING, AND COMPOSITING............................................................112 11.6 VARIOGRAPHY.............................................................................................................115 11.7 BLOCK MODEL CODING ...............................................................................................117 11.8 GRADE INTERPOLATION...............................................................................................118 11.9 CLASSIFICATION...........................................................................................................122 11.10 MINERAL RESOURCES ..................................................................................................123 11.11 MODEL VALIDATION....................................................................................................130 11.12 DISCUSSION OF RESOURCES ........................................................................................131 12.0 MINERAL RESERVE ESTIMATES ...................................................................................135 12.1 INTRODUCTION ...........................................................................................................135 12.2 PIT OPTIMIZATION.......................................................................................................135 12.3 PIT DESIGNS.................................................................................................................141 12.4 ULTIMATE PIT DESIGNS AND PIT PHASING...................................................................142 12.5 PROBABLE RESERVES ...................................................................................................148 |
| Engineering ◆ Project Controls ◆ Estimating ◆ Construction Management 13.0 MINING METHODS......................................................................................................149 13.1 INTRODUCTION ...........................................................................................................149 13.2 WASTE ROCK STORAGE................................................................................................154 13.3 PRODUCTION SCHEDULE .............................................................................................155 13.4 EQUIPMENT & PERSONNEL REQUIREMENTS ...............................................................157 14.0 PROCESSING AND RECOVERY METHODS ....................................................................160 14.1 INTRODUCTION ...........................................................................................................160 14.2 PROCESS PLANT DESIGN..............................................................................................160 14.3 PROCESS PLANT DESCRIPTION.....................................................................................161 14.4 PROCESS PLANT MANPOWER.......................................................................................166 15.0 INFRASTRUCTURE .......................................................................................................168 15.1 INTRODUCTION ...........................................................................................................168 15.2 SITE ACCESS ROADS .....................................................................................................170 15.3 SITE ROADS..................................................................................................................170 15.4 WATER SUPPLY............................................................................................................170 15.5 POWER SUPPLY ...........................................................................................................171 15.6 BUILDINGS AND ANCILLARY FACILITIES........................................................................171 15.7 WASTE ROCK STORAGE FACILITY (WRSF) .....................................................................172 15.8 TAILINGS STORAGE FACILITY (TSF) ...............................................................................172 15.9 FIRE PROTECTION........................................................................................................175 15.10 LOGISTICS AND TRANSPORTATION ..............................................................................176 16.0 MARKET STUDIES AND CONTRACTS............................................................................177 16.1 INTRODUCTION ...........................................................................................................177 16.2 TUNGSTEN DEMAND AND FORECAST ..........................................................................177 16.3 TUNGSTEN PRICES & FORECAST...................................................................................178 16.4 TUNGSTEN SUPPLY OUTLOOK......................................................................................180 16.5 PAYABLES, TREATMENT AND REFINING CHARGES .......................................................181 16.6 ZINC AND SILVER PRICE AND PAYMENT .......................................................................181 16.7 CONTRACTS .................................................................................................................182 17.0 ENVIRONMENTAL STUDIES, PERMITTING AND PLANS, NEGOTIATIONS, OR AGREEMENTS WITH LOCAL INDIVIDUALS OR GROUPS...............................................184 17.1 INTRODUCTION ...........................................................................................................184 17.2 BASELINE STUDIES .......................................................................................................184 17.3 ENVIRONMENTAL CONSIDERATIONS/MONITORING PROGRAMS.................................189 17.4 KEY ENVIRONMENTAL ISSUES......................................................................................190 17.5 SOCIAL OR COMMUNITY IMPACT ................................................................................190 17.6 PERMITTING................................................................................................................190 18.0 CAPITAL AND OPERATING COSTS................................................................................192 18.1 CAPITAL COST..............................................................................................................192 18.2 OPERATING COST ........................................................................................................196 |
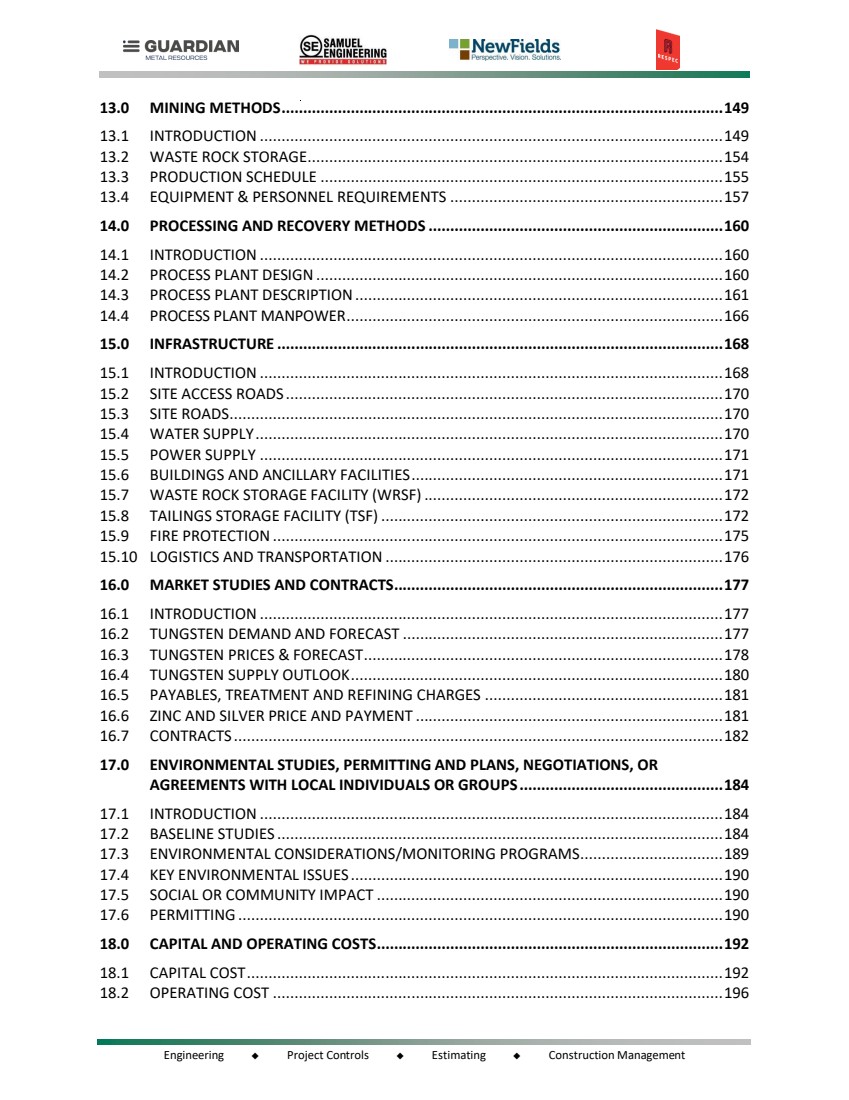
| Engineering ◆ Project Controls ◆ Estimating ◆ Construction Management 19.0 ECONOMIC ANALYSIS..................................................................................................202 19.1 CAUTIONARY STATEMENT ...........................................................................................202 19.2 METHODOLOGY USED .................................................................................................203 19.3 FINANCIAL MODEL PARAMETERS ................................................................................203 19.4 CAPITAL COSTS ............................................................................................................204 19.5 OPERATING COST ........................................................................................................205 19.6 ROYALTIES ...................................................................................................................205 19.7 TAXES ..........................................................................................................................206 19.8 ECONOMIC RESULTS....................................................................................................206 19.9 SENSITIVITY ANALYSIS..................................................................................................209 20.0 ADJACENT PROPERTIES...............................................................................................213 21.0 OTHER RELEVANT DATA AND INFORMATION.............................................................214 21.1 ENVIRONMENTAL FOOTPRINT AND BENCHMARKING..................................................214 21.2 LOCAL PROSPERITY......................................................................................................214 22.0 INTERPRETATION AND CONCLUSIONS........................................................................215 22.1 PILOT MOUNTAIN TUNGSTEN PROJECT .......................................................................215 22.2 OVERALL RISKS AND OPPORTUNITIES SUMMARY ........................................................215 22.3 UPSIDE POTENTIALS ....................................................................................................215 22.4 SAMPLE PREPARATION, ANALYSES, AND SECURITY......................................................216 22.5 MINERAL RESOURCE ESTIMATES .................................................................................216 22.6 MINERAL RESERVE ESTIMATES ....................................................................................218 22.7 MINE PLAN AND MINING METHODS............................................................................218 22.8 METALLURGY AND MINERAL PROCESSING ..................................................................218 22.9 ENVIRONMENTAL STUDIES, PERMITTING AND SOCIAL OR COMMUNITY IMPACT........219 22.10 TAILINGS STORAGE FACILITY........................................................................................219 23.0 RECOMMENDATIONS .................................................................................................220 23.1 INTRODUCTION ...........................................................................................................220 23.2 RECOMMENDATIONS BUDGET SUMMARY ..................................................................221 23.3 GEOLOGY.....................................................................................................................221 23.4 MINING .......................................................................................................................222 23.5 METALLURGY AND MINERAL PROCESSING ..................................................................223 23.6 TAILINGS STORAGE FACILITY (TSF) ...............................................................................223 23.7 ENVIRONMENTAL AND PERMITTING ...........................................................................224 23.8 DFS/FEED ENGINEERING DESIGN.................................................................................225 24.0 REFERENCES ................................................................................................................226 25.0 RELIANCE ON INFORMATION PROVIDED BY THE REGISTRANT ...................................228 26.0 APPENDICES................................................................................................................229 26.1 APPENDIX A – UNITS OF MEASURE AND ABBREVIATIONS AND ACRONYMS.................229 26.2 APPENDIX B – MINERAL STATUS REPORT AND CLAIMS ................................................235 |
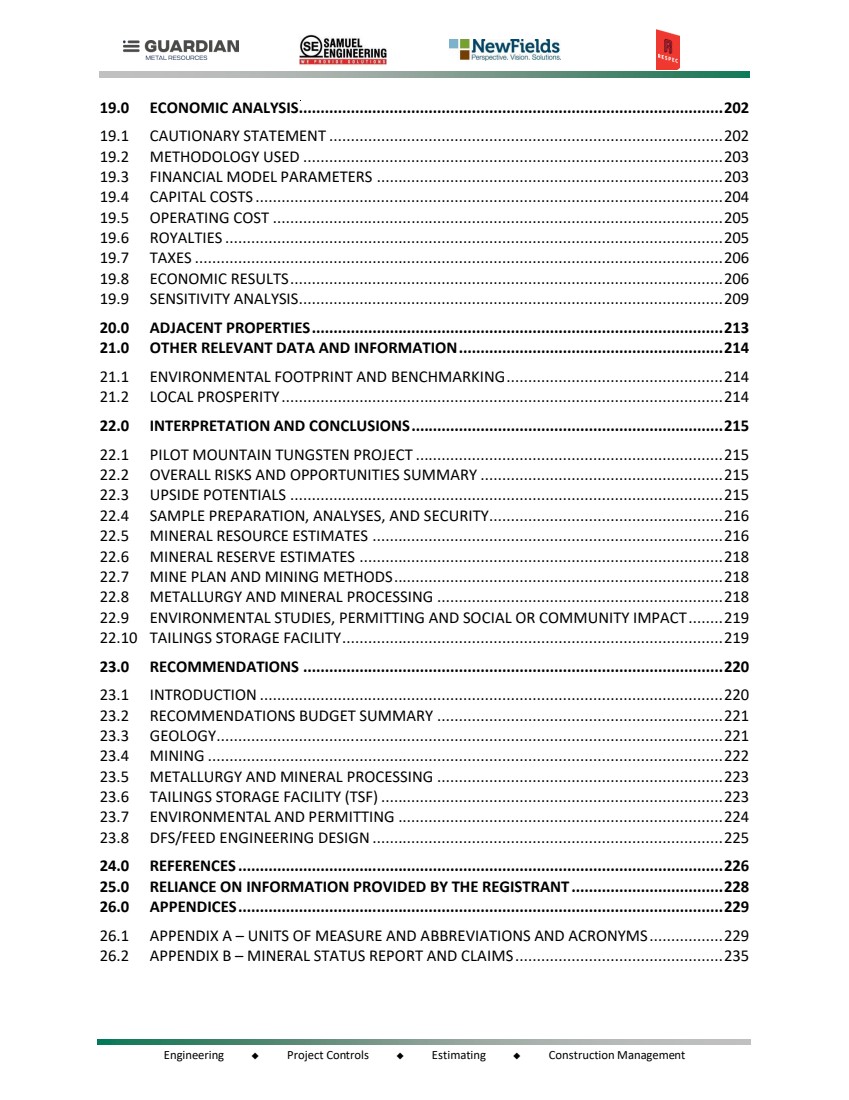
| Engineering ◆ Project Controls ◆ Estimating ◆ Construction Management List of Tables Table 1.1: Desert Scheelite Inclusive Reserves ...........................................................................7 Table 1.2: Garnet Resources Inclusive Reserves.........................................................................8 Table 1.3: Mineral Reserves Statement....................................................................................10 Table 1.4: Yearly Pilot Mountain Project Mine Production ......................................................12 Table 1.5: Guardian Metal Resources Environmental Baseline Studies....................................15 Table 1.6: Required Permits and Regulatory Authorizations....................................................21 Table 1.7: Initial Capital Cost Summary....................................................................................22 Table 1.8: Project Operating Cost Summary.............................................................................23 Table 1.9: Economic Model Results – Base Case Price of $197,300 per tonne WO3 .................25 Table 2.1: Summary of Qualified Persons.................................................................................29 Table 5.1: Summary of Historical Drilling by Operator and Others...........................................40 Table 5.2: Desert Scheelite Mineral Resources.........................................................................42 Table 7.1: Guardian Drilling in 2024-2026 ................................................................................52 Table 8.1: CRMs Used by Guardian Metal ................................................................................60 Table 8.2: Summary of ALS Analyses for Guardian Certified Reference Materials 2024- 2026 ........................................................................................................................60 Table 8.3: Summary of MSALABS Analyses for Guardian Certified Reference Materials 2026 ........................................................................................................................61 Table 8.4: CRM Failures by Metal .............................................................................................61 Table 8.5: Summary of Results for Field Duplicates in 2024-2025 ............................................62 Table 8.6: Summary of Results for Preparation Duplicates in 2024–2025................................65 Table 8.7: Summary of Results for Pulp Duplicates in 2024-2025.............................................65 Table 9.1: Positional Offset Statistics WGS84 Versus NAD83 Coordinate Comparison ............69 Table 9.2: Verification GPS Checks of Drill Collars at the Pilot Mountain Project.....................70 Table 9.3: Desert Scheelite WO3 Population Statistics by Company.........................................72 Table 9.4: Garnet WO3 Population Statistics by Company .......................................................73 Table 9.5: Assay Results from Independent Confirmation Testing of Field Grab Samples .......76 Table 10.1: Material Balance for Whole Ore Flotation .............................................................82 Table 10.2: Material Balance for WHIMS plus Flotation...........................................................83 Table 10.3: Material Balance with Desulfurization...................................................................86 Table 10.4: Material Balance without Desulfurization .............................................................87 |
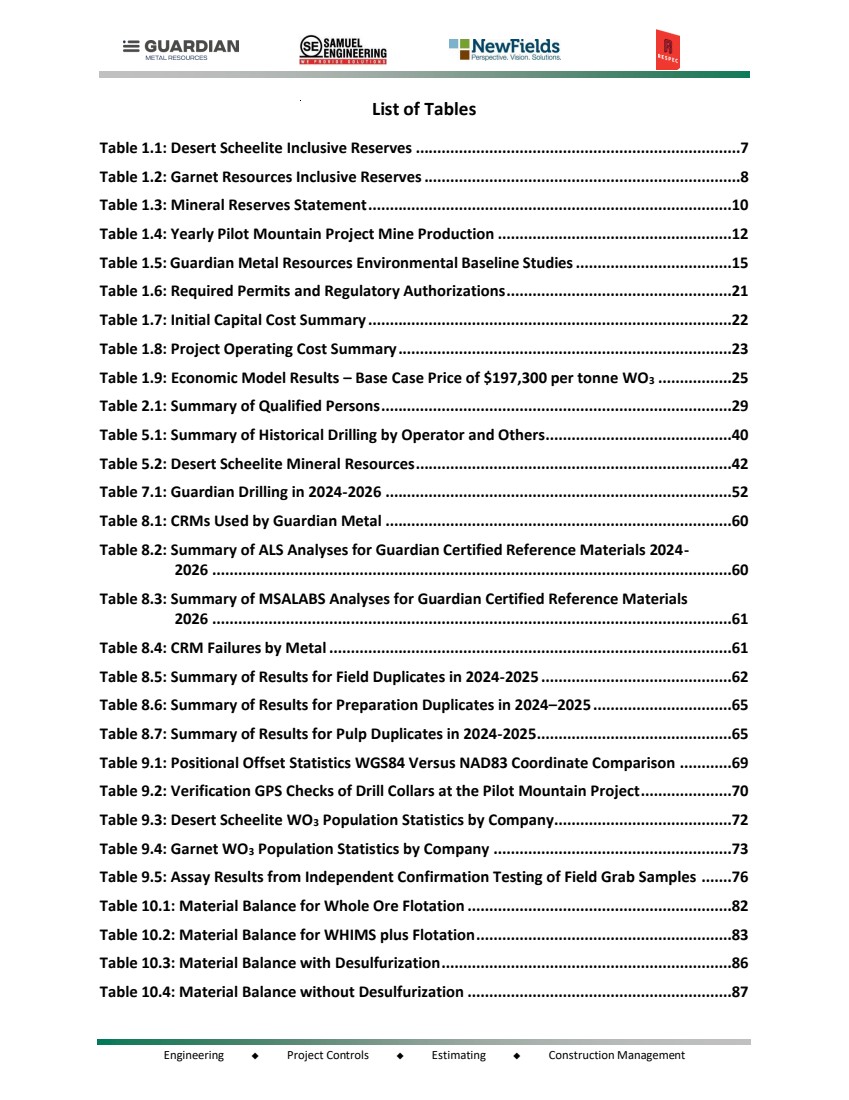
| Engineering ◆ Project Controls ◆ Estimating ◆ Construction Management Table 10.5: Composite Information..........................................................................................88 Table 10.6: Sample Mineralization ...........................................................................................89 Table 10.7: Oxide Composite Mineralization............................................................................90 Table 10.8: Sulfide Composite Mineralization..........................................................................91 Table 10.9: Oxide Composite Scheelite Liberation ...................................................................91 Table 10.10: Sulfide Composite Scheelite Liberation................................................................92 Table 10.11: Comminution Testwork Results ...........................................................................92 Table 10.12: Locked Cycle Test Parameters..............................................................................94 Table 10.13: Sulfide Rougher Flotation Results........................................................................96 Table 10.14: Sulfide Cleaner Flotation Results .........................................................................97 Table 10.15: Tungsten Rougher Flotation Results ....................................................................98 Table 10.16: Tungsten Cleaner Flotation Results......................................................................99 Table 10.17: Concentrate Mineralization ...............................................................................100 Table 10.18: Concentrate Assays............................................................................................101 Table 11.1: Desert Scheelite Resource Database Descriptive Statistics—For All Accepted Sample Data Only..................................................................................105 Table 11.2: Garnet Resource Database Descriptive Statistics—For All Accepted Sample Data Only ..............................................................................................................106 Table 11.3: Desert Scheelite Grade Ranges of Tungsten, Silver, Copper, and Zinc Domains Determined from CPPs...........................................................................106 Table 11.4: Garnet Grade Ranges of Tungsten and Silver-Copper-Zinc Domains Determined from CPPs..........................................................................................109 Table 11.5: Desert Scheelite Density Statistics and Values Applied to the Different Lithologies in the Block Model ..............................................................................111 Table 11.6: Garnet Density Statistics and Values Applied to the Different Lithologies in the Block Model ....................................................................................................111 Table 11.7: Desert Scheelite Capping Levels for Tungsten, Silver, Copper, and Zinc by Domain..................................................................................................................112 Table 11.8: Desert Scheelite Tungsten Composite Descriptive Statistics................................112 Table 11.9: Desert Scheelite Silver Composite Descriptive Statistics......................................112 Table 11.10: Desert Scheelite Copper Composite Descriptive Statistics.................................113 Table 11.11: Desert Scheelite Zinc Composite Descriptive Statistics......................................113 Table 11.12: Garnet Capping Levels for Tungsten, Silver, Copper, and Zinc by Domain .........114 Table 11.13: Garnet Tungsten Composite Descriptive Statistics.............................................114 |
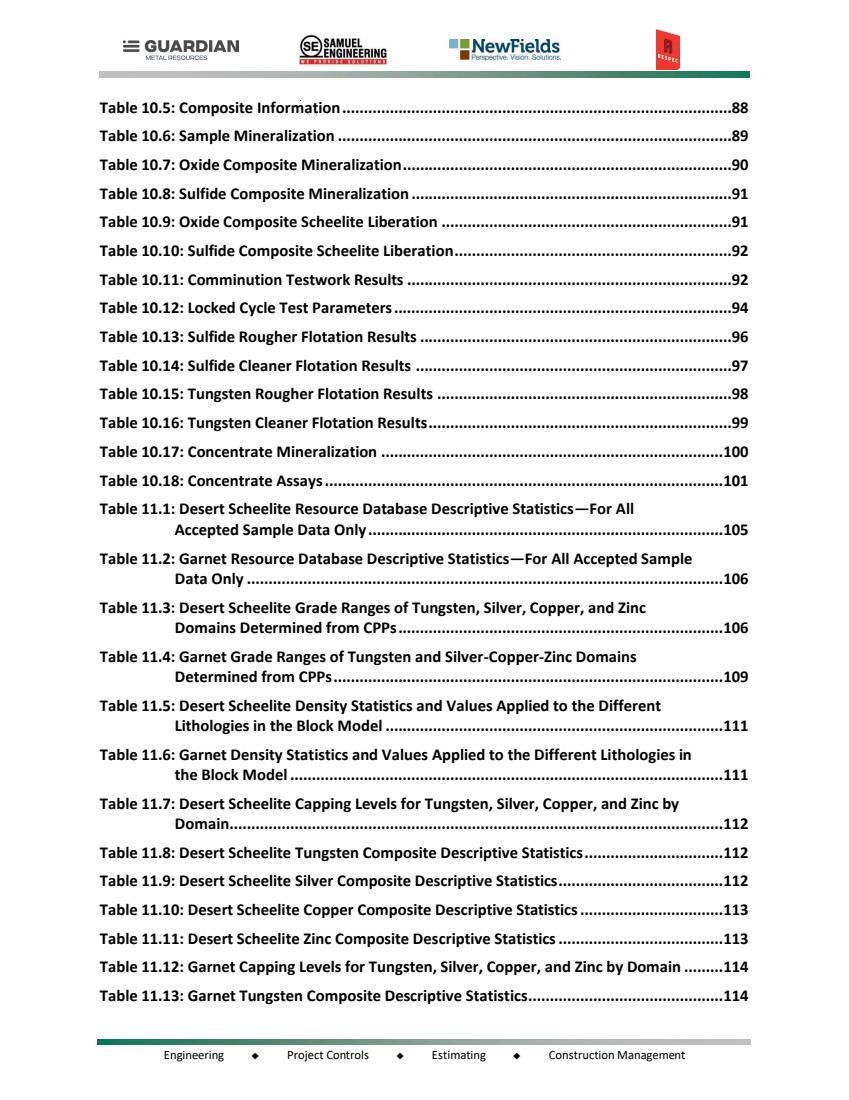
| Engineering ◆ Project Controls ◆ Estimating ◆ Construction Management Table 11.14: Garnet Silver Composite Descriptive Statistics ..................................................114 Table 11.15: Garnet Copper Composite Descriptive Statistics................................................114 Table 11.16: Garnet Zinc Composite Descriptive Statistics.....................................................115 Table 11.17: Desert Scheelite Variography by Metal Domain ................................................115 Table 11.18: Garnet Variography by Metal Domain and Estimation Area ..............................116 Table 11.19: Desert Scheelite Search Ellipse Orientations......................................................117 Table 11.20: Garnet Search Ellipse Orientations ....................................................................118 Table 11.21: Desert Scheelite Estimation Parameters............................................................118 Table 11.22: Garnet Tungsten Estimation Parameters...........................................................120 Table 11.23: Garnet Silver, Copper, and Zinc Estimation Parameters ....................................121 Table 11.24: Pit Optimization Parameters..............................................................................123 Table 11.25: Desert Scheelite Inclusive Reserves ...................................................................124 Table 11.26: Desert Scheelite Exclusive Reserves...................................................................125 Table 11.27: Garnet Resources Inclusive Reserves.................................................................127 Table 11.28: Garnet Resources Exclusive Reserves ................................................................128 Table 12.1: Economic Parameters ..........................................................................................136 Table 12.2: Metal Recoveries and Payable Percentages.........................................................136 Table 12.3: PFS Metal Prices for Pit Optimization and Design................................................136 Table 12.4: Pit Optimization Slopes – Scheelite......................................................................137 Table 12.5: Pit Optimization Slopes – Garnet.........................................................................138 Table 12.6: WO3 % Cutoff Grades by WO3 Price per Metric Ton Unit (MTU)..........................138 Table 12.7: Desert Scheelite Pit Optimization Results............................................................139 Table 12.8: Garnet Pit Optimization Results...........................................................................139 Table 12.9: Desert Scheelite Pit by Pit Results........................................................................140 Table 12.10: Garnet Pit by Pit Results.....................................................................................141 Table 12.11: Haul Road Design Parameters............................................................................142 Table 12.12: In-Pit Probable Reserves and Contained Waste by Phase..................................148 Table 12.13: Mineral Reserves Statement..............................................................................148 Table 13.1: Yearly Desert Scheelite Mine Production.............................................................156 Table 13.2: Yearly Garnet Mine Production ...........................................................................156 Table 13.3: Yearly Total Pilot Mountain Project Mine Production .........................................156 Table 13.4: Process Material Delivery Summary ....................................................................157 |
| Engineering ◆ Project Controls ◆ Estimating ◆ Construction Management Table 13.5: Stockpile Balance Summary .................................................................................157 Table 13.6: Equipment Requirements ....................................................................................158 Table 13.7: Personnel Requirements......................................................................................159 Table 14.1: Major Design Criteria ...........................................................................................160 Table 14.2: Pilot Mountain Salaried Personnel ......................................................................166 Table 14.3: Pilot Mountain Hourly Personnel.........................................................................167 Table 15.1: Electrical Load Analysis Summary ........................................................................171 Table 17.1: Guardian Metal Resources Environmental Baseline Studies................................185 Table 17.2: Required Permits and Regulatory Authorizations................................................190 Table 18.1: Initial Capital Cost Summary ................................................................................192 Table 18.2: Capital Cost Estimate Responsibilities .................................................................194 Table 18.3: Mine Capital Costs ...............................................................................................195 Table 18.4: General Operating Cost Assumptions ..................................................................196 Table 18.5: Process Operating Cost Summary ........................................................................196 Table 18.6: Labor Cost............................................................................................................197 Table 18.7: Process Power Cost..............................................................................................198 Table 18.8: Reagents Cost.......................................................................................................198 Table 18.9: Operating Supplies...............................................................................................199 Table 18.10: Miscellaneous Supplies Cost ..............................................................................199 Table 18.11: Mine Contractor Operating Costs.......................................................................200 Table 18.12: Forced Work Costs .............................................................................................200 Table 18.13: Mine General Costs............................................................................................201 Table 19.1: Economic Model Parameters...............................................................................203 Table 19.2: Initial Capital Cost Summary ................................................................................204 Table 19.3: Sustaining and Working Capital Cost Summary ...................................................205 Table 19.4: Project Operating Cost Summary.........................................................................205 Table 19.5: Economic Model Results - $197,300 W per tonne...............................................207 Table 19.6: Cash Flow Projections..........................................................................................208 Table 19.7: Tungsten Price Sensitivity ....................................................................................209 Table 19.8: CAPEX Sensitivity (Initial + Sustaining).................................................................211 Table 19.9: OPEX Sensitivity ...................................................................................................211 Table 23.1: Recommended DFS and FEED Budgets.................................................................221 |
| Engineering ◆ Project Controls ◆ Estimating ◆ Construction Management |

| Engineering ◆ Project Controls ◆ Estimating ◆ Construction Management List of Figures Figure 1.1: Pilot Mountain Tungsten Project Site Layout (Samuel, 2026)...................................2 Figure 1.2: OPEX Split ...............................................................................................................24 Figure 3.1: Pilot Mountain Tungsten Project Location (RESPEC,2026)......................................31 Figure 3.2: Pilot Mountain Tungsten Project Site Access Route (RESPEC, 2026).......................32 Figure 3.3: Pilot Mountain Tungsten Project Tenement Map (RESPEC, 2026)..........................33 Figure 3.4: Regional Claims Map ..............................................................................................36 Figure 4.1: Desert Scheelite Test Pit in July 2025, Looking West, Showing Steeply Dipping Garnet Skarn (Brown) in Contact with Quartz Monzonite (White). ...........39 Figure 6.1: Property Geology of the Pilot Mountain Tungsten Project.....................................45 Figure 6.2: Desert Scheelite North-South Cross-Section 424305E Showing Tungsten Mineral Domain and Geology. ................................................................................46 Figure 6.3: Generalized Stratigraphic Column for the Pilot Mountain Tungsten Project..........47 Figure 7.1: Map of Drill Holes at the Pilot Mountain Project....................................................54 Figure 8.1. Tungsten Field Duplicate vs. Original, Desert Scheelite 2024-2025. .......................63 Figure 8.2: Zinc Field Duplicate vs. Original, Desert Scheelite 2024-2025.................................64 Figure 8.3: Silver Field Duplicate vs. Original, Desert Scheelite 2024-2025. .............................64 Figure 9.1: Box Plots of WO3 Data Sorted by Company............................................................72 Figure 9.2: Cumulative Probability Plots of Desert Scheelite WO3 Assays by Company— Guardian Metal in Blue, Duval in Green, and UCC in Red. ......................................73 Figure 9.3: Sample Length vs. WO3 Grade for Garnet Assay Sources........................................74 Figure 10.1: Tungsten trioxide recoveries versus grind size (GZRINM, 2013) ...........................79 Figure 10.2: Flowsheet for Whole Flotation scenario (GZRINM, 2013).....................................81 Figure 10.3: Flowsheet for WHIMS plus Flotation (GZRINM, 2013)..........................................82 Figure 10.4: Overall process flow with desulfurization (GZRINM, 2013) ..................................86 Figure 10.5: Overall process flow without desulfurization (GZRINM, 2013).............................87 Figure 10.6: Testwork Block Flow Diagram...............................................................................93 Figure 10.7: Sulfide Mass Pull...................................................................................................95 Figure 10.8: Tungsten Rougher Recovery .................................................................................98 Figure 11.1: Desert Scheelite North-South Cross-Section 424305E Showing Tungsten Mineral Domains and Geology..............................................................................108 Figure 11.2: Garnet East-West Cross-Section 4247980N Looking North, Showing Tungsten Mineral Domains and Geology ..............................................................110 |
| Engineering ◆ Project Controls ◆ Estimating ◆ Construction Management Figure 11.3: North-South Cross-Section 424305E Showing WO3 Grades in the Desert Scheelite Block Model...........................................................................................126 Figure 11.4: East-West Cross-Section 4247980N Showing WO3 Grades in the Garnet Block Model ..........................................................................................................129 Figure 11.5: Desert Scheelite WO3 Bench Composite Grades versus Coincident Block Grades Interpolated by OK, ID2, and NN...............................................................130 Figure 11.6:. Garnet WO3 Bench Composite Grades versus Coincident Block Grades Interpolated by OK, ID2, and NN...........................................................................131 Figure 12.1: Desert Scheelite Geotechnical Zones..................................................................137 Figure 12.2: Desert Scheelite Ultimate Pit Design ..................................................................143 Figure 12.3: Desert Scheelite Phase 1a & Phase 1 ..................................................................144 Figure 12.4: Desert Scheelite Phase 2.....................................................................................145 Figure 12.5: Desert Scheelite Phase 3.....................................................................................146 Figure 12.6: Garnet Phase 1 & 2 .............................................................................................147 Figure 13.1: Pilot Mountain Project End of Mine Life .............................................................149 Figure 13.2: Pilot Mountain Project End of Year -2.................................................................150 Figure 13.3: Pilot Mountain Project End of Year -1.................................................................150 Figure 13.4: Pilot Mountain Project End of Year 1..................................................................151 Figure 13.5: Pilot Mountain Project End of Year 2..................................................................151 Figure 13.6: Pilot Mountain Project End of Year 3..................................................................152 Figure 13.7: Pilot Mountain Project End of Year 4..................................................................152 Figure 13.8: Pilot Mountain Project End of Year 5..................................................................153 Figure 13.9: Pilot Mountain Project End of Year 6..................................................................153 Figure 13.10: Pilot Mountain Project End of Year 7................................................................154 Figure 15.1: Site Plan (Samuel, 2026) .....................................................................................169 Figure 15.2: Site Access Route (RESPEC, 2026) .......................................................................170 Figure 16.1: Forecast Primary Tungsten Demand Scenarios to 2035 ......................................178 Figure 16.2: Forecast Primary Tungsten Demand Scenarios to 2035 ......................................178 Figure 16.3: Historical Tungsten APT Prices, 2024 - 2026 .......................................................179 Figures 16.4: Tungsten APT price forecast to 2040 (Rotterdam, $/mtu) ................................180 Figure 16.5: Forecast Primary Tungsten Supply Scenarios to 2035 (t W)................................181 Figure 19.1: OPEX Split ...........................................................................................................205 Figure 19.2: Tungsten Price per MTU Sensitivity on NPV 8%..................................................210 |
| Engineering ◆ Project Controls ◆ Estimating ◆ Construction Management Figure 19.3: Tungsten Price per MTU Sensitivity on IRR .........................................................210 Figure 19.4: Multiple % Sensitivity on NPV 8%.......................................................................212 Figure 19.5: Multiple % Sensitivity on IRR ..............................................................................212 Figure 26.1: Units of Measure ...................................................................................................229 Figure 26.2: Abbreviations and Acronyms..............................................................................231 |
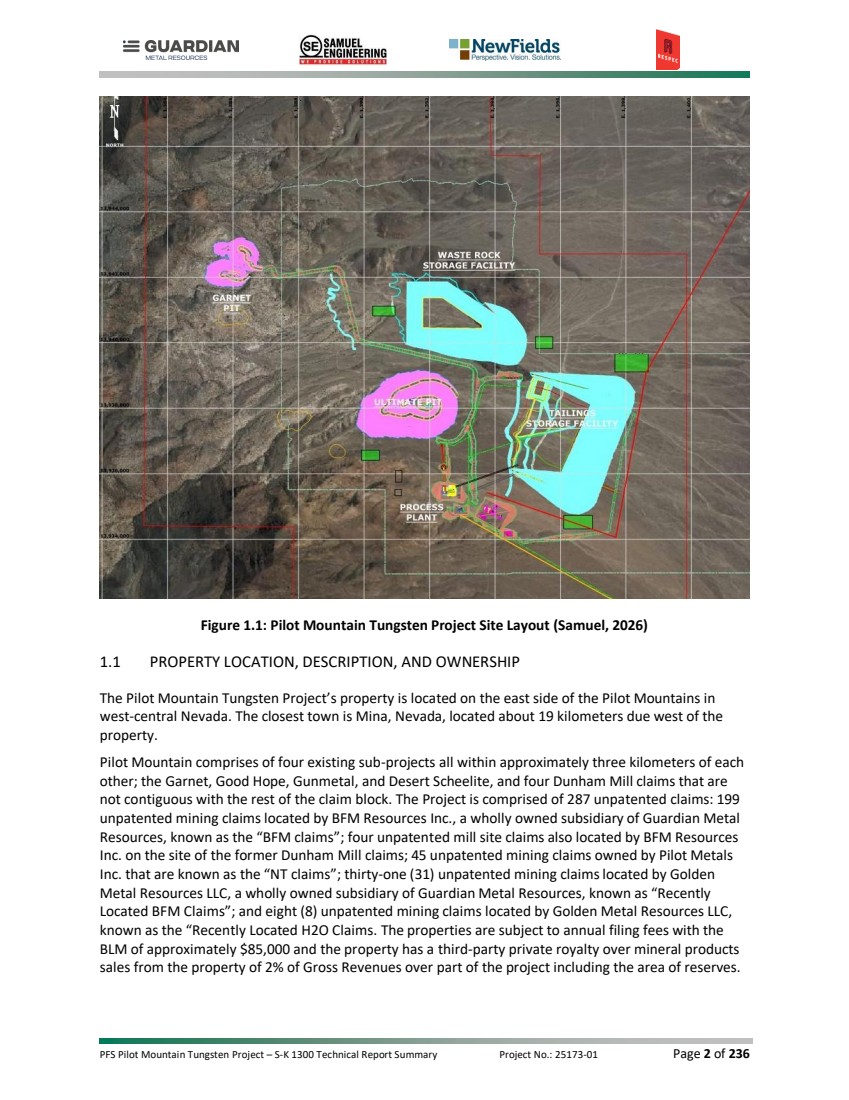
| PFS Pilot Mountain Tungsten Project – S-K 1300 Technical Report Summary Project No.: 25173-01 Page 1 of 236 1.0 EXECUTIVE SUMMARY This Technical Report Summary (“Report”) is prepared for Guardian Metal Resources plc (“Guardian Metal” or the “Company”), a strategic exploration and development company focused on tungsten in Nevada, USA. Guardian Metal trades under the symbols NYSE.A: GMTL, LON: GMET, OTCQB: GMTLF, for the purposes of disclosing current updates and information related to its wholly owned Pilot Mountain tungsten project (“Pilot Mountain” or the “Project”). This report is a Technical Report Summary (TRS) which summarizes the findings of the Pre-feasibility Study (“PFS” or the “Study”) completed for the Pilot Mountain project in accordance with The United States Securities Exchange Commission (SEC) 17 CFR Part §229.1300 (S-K 1300) Standard Instructions for Regulation S-K subpart 1300 SEC S-K §229. 1304 and §229.601(b)(96). This TRS is intended to meet the requirements of S-K 1300 as considered for a pre-feasibility level of study and disclosure as defined in the regulations and supporting reference documents. The Report has been prepared in accordance with the standards and guidelines of S-K 1300 for the disclosure of material information and serves as the basis for declaring Mineral Reserves. The PFS draws upon Indicated resources from the Desert Scheelite and Garnet deposits which have been converted to reserves. The Mineral Resources are comprised of 21,600 tonnes of WO3 (12,136,000 tonnes grading 0.178% of WO3 Indicated), with Probable Mineral Reserves of 20,275 tonnes of WO3 (11,822,000 tonnes @ 0.171% WO3). As shown in Figure 1.1, the Project includes open pit mining from the Desert Scheelite and Garnet deposits. A total of 4,000 mtpd of run-of-mine (ROM) ore will be crushed and processed via flotation methods to create a tungsten concentrate, with tailings stored in the geomembrane-lined Tailings Storage Facility (TSF). Waste rock generated from open pit mining activities will be used to construct the TSF and additional waste rock will be stored in a separate waste rock storage facility. With the completion of this PFS, the Pilot Mountain project has progressed to the point of achieving the level of technical and economic confidence required to support Mineral Reserve estimation. The Qualified Persons (QP) meet the standards for a PFS-level assessment and confirm the Guardian Metal project's technical and financial viability, supporting the transition to the next stages of permitting, financing, and project development. There are no known impediments to the permits for the project or establishing sales of the mine mineral products. The Effective Date for this report is June 30, 2026. |
| PFS Pilot Mountain Tungsten Project – S-K 1300 Technical Report Summary Project No.: 25173-01 Page 2 of 236 Figure 1.1: Pilot Mountain Tungsten Project Site Layout (Samuel, 2026) 1.1 PROPERTY LOCATION, DESCRIPTION, AND OWNERSHIP The Pilot Mountain Tungsten Project’s property is located on the east side of the Pilot Mountains in west-central Nevada. The closest town is Mina, Nevada, located about 19 kilometers due west of the property. Pilot Mountain comprises of four existing sub-projects all within approximately three kilometers of each other; the Garnet, Good Hope, Gunmetal, and Desert Scheelite, and four Dunham Mill claims that are not contiguous with the rest of the claim block. The Project is comprised of 287 unpatented claims: 199 unpatented mining claims located by BFM Resources Inc., a wholly owned subsidiary of Guardian Metal Resources, known as the “BFM claims”; four unpatented mill site claims also located by BFM Resources Inc. on the site of the former Dunham Mill claims; 45 unpatented mining claims owned by Pilot Metals Inc. that are known as the “NT claims”; thirty-one (31) unpatented mining claims located by Golden Metal Resources LLC, a wholly owned subsidiary of Guardian Metal Resources, known as “Recently Located BFM Claims”; and eight (8) unpatented mining claims located by Golden Metal Resources LLC, known as the “Recently Located H2O Claims. The properties are subject to annual filing fees with the BLM of approximately $85,000 and the property has a third-party private royalty over mineral products sales from the property of 2% of Gross Revenues over part of the project including the area of reserves. |
| PFS Pilot Mountain Tungsten Project – S-K 1300 Technical Report Summary Project No.: 25173-01 Page 3 of 236 1.2 HISTORY 1.2.1 PROPERTY HISTORY Pilot Mountain has been subject to exploration activities since the early twentieth century, resulting in a substantial body of geological, geophysical, and drilling data. Despite this history of exploration, only limited production has been recorded. In 1916, scheelite was first discovered on the east flank of the Pilot Mountains. The discovery, as well as the discoveries of other similar skarn deposits in Nevada and California, directly resulted from a prospecting wave stimulated by high tungsten prices and the opening of several tungsten mills in the Bishop district in California. Reportedly, several properties were developed at this time in the Pilot Mountains, however, none of them recorded any production. In 1921, Hess and Larson of the United States Geological Survey (“USGS”) inspected the district and recognized the association of scheelite with the Gunmetal stock, mapped the location of tactites relative to the general outline of the stock, and identified three types of mineralization on the property: tactite, quartz-calcite-scheelite veins, and clots of quartz, calcite, silver-bearing galena, and scheelite. Hess and Larson considered the tactite mineralization to be the only type with significant tonnage potential. They examined the Gunmetal Adit on the northeast contact of the monzonite stock and observed grades up to 1% WO3 along this contact. In 1946, Kerr reported that additional underground development work at the Gunmetal location had been disappointing. Kerr noted that an association of quartz with higher-grade scheelite and the presence of quartz concentrations in the form of irregular, vertical, chimney-like masses, both within the granite porphyry and around its margins. Union Carbide Corporation (“UCC”) reported 130 short tons through 1943 for the Garnet mine but presented no figures for Gunmetal. In 1952, Kenneth W. Dunham reopened the old Gunmetal Mine. Union Carbide Corporation internal reports report approximately 15,378 short tons produced from Gunmetal between 1952-1956. Hecla Mining began exploring the Pilot Mountain property in 1968. To test porphyry Cu-Mo targets, Hecla drilled approximately 1,652m in 16 percussion holes between the Good Hope and Desert Scheelite zones and drilled several holes into tactite at Desert Scheelite. Hecla dropped the property after the drilling campaign. In 1969, Duval Corporation leased the Desert Scheelite and Gunmetal properties and completed ground magnetic and IP surveys. In 1970, Duval drilled four core holes totaling ~1,420m into an anomalous IP target south of Good Hope hoping to hit porphyry Cu-Mo mineralization. The holes only intersected weakly mineralized Cu-Mo quartz veins. Duval continued drilling in 1971 and encountered Cu-W mineralization in sulfide-rich tactite northeast of Desert Scheelite. In 1972 and 1973, they drilled seven additional core and percussion holes at Desert Scheelite. In 1975, W. R. Grace (“Grace") drilled five angled drill holes, totaling about 728 m, directed at the down-dip extension of the Desert Scheelite deposit. The program confirmed the width of the steeply dipping mineralization at Desert Scheelite, which had previously only been intersected in vertical drill holes. Grace did not exercise its option on the property. |
| PFS Pilot Mountain Tungsten Project – S-K 1300 Technical Report Summary Project No.: 25173-01 Page 4 of 236 Duval continued exploration until 1977, when UCC optioned the property. UCC sampling programs in the underground exposures of the Gunmetal Mine averaged between 0.40 and 0.50% WO3. In December 1978, UCC exercised their option to purchase Duval's interest. UCC completed mining feasibility studies on the property and conducted trial mining on the Desert Scheelite deposit through a 70,000-tonne bulk sampling exercise. Low tungsten prices halted their activities. 1.2.2 EXPLORATION - 2011-2021 In September 2011, Black Fire Minerals Ltd. (“Black Fire”) acquired an option on the property and completed a 15-hole drilling program designed to verify historical assay data. This program’s results supported the preparation of an initial mineral resource estimate for the Desert Scheelite deposit in 2012. In 2014, Thor Mining PLC (“Thor”) acquired an interest in the property. In 2017, Thor completed nine holes targeting copper-silver mineralization within the Desert Scheelite and Garnet deposits. 1.2.3 HISTORICAL RESOURCE ESTIMATES In 2012, Black Fire commissioned the first modern mineral resource estimate for the Desert Scheelite deposit in accordance with the JORC (2004) Code. The estimate outlined tungsten resources with copper and silver credits. Following additional drilling and project advancement, Thor Mining updated the resource estimate in 2018. The revised estimate reported 10.7 million tonnes at 0.26% WO₃, 19.4 g/t Ag, 0.15% Cu, and 0.38% Zn above a 0.15% WO₃ cut‑off, with the majority classified as indicated resources. The 2018 update incorporated zinc into the resource inventory for the first time, which added a potential by‑product stream to the project. The reader is cautioned not to treat the mineral resources estimate discussed above, or any part of them, as current mineral resources or mineral reserves. Neither RESPEC nor Guardian Metal is treating these historical estimates as current estimates. The historical mineral resource estimate discussed above is relevant only for historical completeness. RESPEC did not rely on any of the previous resource estimates in preparing the current work. 1.3 GEOLOGIC SETTING AND MINERALIZATION 1.3.1 REGIONAL GEOLOGY The Pilot Mountain property lies within the central Walker Lane structural belt of western Nevada, a northwest‑trending zone of strike‑slip faulting, extensional basins, and associated magmatism that accommodates a significant portion of the displacement between the Pacific and North American tectonic plates. The Walker Lane is interpreted as an incipient transform boundary, with deformation expressed through complex fault networks, localized subsidence, and magmatic intrusions that have influenced mineralization patterns across the belt and most directly influences the current geographic expressions of rock units [Wesnousky, 2005; Faulds and Henry, 2008]. The oldest rocks in the Pilot Mountains are Permian to Jurassic in age, and were deposited in back-arc basins related to remnant oceanic arcs and the initiation of the Sierra Nevada arc in the Triassic [Dickinson, 2006]. Subsequent closure of the back-arc basin in the Jurassic resulted in compressional deformation, known as the Luning-Fencemaker thrust. |
| PFS Pilot Mountain Tungsten Project – S-K 1300 Technical Report Summary Project No.: 25173-01 Page 5 of 236 During the Early to Middle Jurassic, orogenesis and erosion resulted in quartzose sandstones and other clastic rocks being deposited unconformably over older sediments. Additionally, volcanic material becomes progressively more abundant within the Jurassic successions, indicating that magmatism intensified in response to ongoing arc magmatism. In the Middle to Upper Tertiary, widespread felsic to intermediate volcanic rocks were deposited across the region. These volcanic units outcrop extensively and locally host precious‑metal mineralization outside the Pilot Mountain project area. Later tectonic activity in the region is primarily expressed as northwest‑trending right‑lateral trans-tensional faulting associated with the Walker Lane belt. This deformation overprints and offsets earlier structures. Within 50 kilometers to the northeast of the Pilot Mountains, Tertiary faulting transitions to classic Basin and Range extension 1.3.2 PROPERTY GEOLOGY The Pilot Mountain project area is underlain by a thick succession of Permian to Jurassic sedimentary and volcanic rocks locally intruded by Cretaceous granitic stocks, dykes, and sills. Overlying these rocks and around the margins of the project are a series of Tertiary volcanic units. Pre-Tertiary rocks have been complexly deformed by thrust faulting and have a combined stratigraphic thickness that exceeds 6,000 m. The oldest unit exposed is the Permian Mina Formation, a thick accumulation of marine turbidites, chert, and volcanogenic tuffaceous strata. South of the Desert Scheelite resource area, the Permian Mina Formation is prominently exposed in high cliffs across a major east-west trending fault scarp. The Mina is stratigraphically overlain by the Triassic Luning Formation, the principal host of mineralization on the property. Although no continuous stratigraphic section is preserved locally, the Luning is at least 2,300 m thick in its type locality and is subdivided into lower, middle, and upper members (Oldow, 1981). The Lower Jurassic Dunlap Formation stratigraphically overlies the Luning formation but only occurs in fault contact inside the property boundary, where instead it unconformably overlies the Mina formation with disconformable contact and locally the Dunlap is exposed along the southwestern edge of the property. It is ~1,500 m thick in the central Pilot Mountains and records both subaerial and submarine depositional environments. Lithologies include sandstone, siltstone, shale, conglomerate, and minor bioclastic limestone and tuff. Intrusion of a Jurassic Cretaceous biotite quartz monzonite stock produced contact metamorphism, converting adjacent carbonate rocks to marble and pelitic clastic rocks to hornfels. Skarn and calc‑silicate alteration, formed locally by metasomatic processes within marble and calcareous metaclastic units, occurred during the latter phases of emplacement. Evidence of metamorphism extends up to 300 m laterally from the northern contact of the stock, although significant mineralization in the modeled resource area is largely confined to within ~90 m of the contact. Near the intruding quartz monzonite stocks, large areas of the Luning Formation’s carbonate section have undergone recrystallization accompanied by bleaching. These effects have obscured original sedimentary structures and fossil remains. The degree of recrystallization varies from bed to bed, with some units becoming very coarsely crystalline. |

| PFS Pilot Mountain Tungsten Project – S-K 1300 Technical Report Summary Project No.: 25173-01 Page 6 of 236 1.3.3 MINERALIZATION The Desert Scheelite, Garnet, Good Hope, and Gunmetal deposits are tungsten skarn deposits formed where quartz monzonite intrusions interacted with carbonate-bearing sedimentary rocks of the Triassic Luning Formation. Mineralization formed through intrusion-related metasomatic processes that produced calc-silicate skarn (tactite) and associated tungsten-bearing mineralization. The Pilot Mountain deposits are hosted within the Triassic Luning Formation, with mineralization at Desert Scheelite and Good Hope occurring primarily in the lower Luning sequence and mineralization at Garnet and Gunmetal occurring within the upper Luning sequence. The Desert Scheelite and Good Hope deposits comprise steeply dipping to subvertical mineralized bodies that generally strike east-west, whereas the Garnet and Gunmetal deposits occur as stratabound, shallow-dipping to subhorizontal mineralized horizons. Mineralization is characterized by disseminated and locally vein-controlled scheelite hosted within garnet-pyroxene skarn that has undergone varying degrees of retrograde alteration. In addition to tungsten, the deposits contain variable concentrations of copper, zinc, and silver. Sulfide mineralization is dominated by pyrite, chalcopyrite, and sphalerite, which commonly occur with scheelite and locally form significant concentrations within unoxidized portions of the deposits. 1.3.4 EXPLORATION AND DRILLING Since acquiring the Pilot Mountain Project in 2021, Guardian Metal has completed a systematic exploration program consisting of geological mapping, geochemical sampling, geophysical surveys, and drilling designed to validate and expand mineral resources at the Desert Scheelite and Garnet deposits while evaluating additional exploration targets across the property. Geological investigations completed between 2024 and 2026 improved the understanding of mineralization controls and deposit geometry. Surface mapping and geochemical sampling confirmed the spatial relationship between tungsten-skarn mineralization and quartz monzonite intrusions. Geochemical fingerprinting indicates that the quartz monzonite bodies exposed across the project area are likely part of a common intrusive system. Additional mapping conducted south of the Desert Scheelite deposit identified extensive quartz-sericite-pyrite alteration, quartz-monzonite dikes, and increased quartz veining, supporting the interpretation of a larger mineralized porphyry-skarn system. Re-Os dating of molybdenite-bearing samples returned Late Cretaceous ages of approximately 88.5 Ma and 86 Ma, providing age constraints for mineralizing intrusive activity. Petrographic studies conducted on drill core from Desert Scheelite confirmed a skarn assemblage dominated by garnet and pyroxene with varying degrees of retrograde alteration. Scheelite mineralization commonly occurs with sulfide minerals including pyrite, chalcopyrite, and sphalerite, supporting the current geological interpretation of the deposit. Geophysical surveys have identified and refined exploration targets across the project. A high-resolution induced polarization survey completed in 2023 delineated multiple chargeability anomalies associated with disseminated sulfide mineralization adjacent to the Desert Scheelite deposit. Ground magnetic surveying completed in 2024 assisted in mapping concealed intrusive bodies and alteration patterns. A subsequent three-dimensional induced polarization survey completed in 2025 expanded coverage southward and confirmed several chargeability anomalies that remain prospective for additional skarn and porphyry-style mineralization. |
| PFS Pilot Mountain Tungsten Project – S-K 1300 Technical Report Summary Project No.: 25173-01 Page 7 of 236 Between 2024 and 2026, Guardian Metal completed 189 drill holes totaling approximately 22,459 m, consisting of 157 diamond core holes and 32 reverse circulation holes. Drilling focused primarily on the Desert Scheelite and Garnet deposits, with additional drilling conducted on exploration, condemnation, and porphyry targets. Approximately 11,108 m were drilled at Desert Scheelite and 6,427 m at Garnet. Drill-hole collar locations were surveyed by licensed professional surveyors, and downhole deviation surveys were completed using gyroscopic tools. The drilling programs successfully increased geological confidence in the Desert Scheelite and Garnet deposits, provided data supporting mineral resource estimation, geotechnical evaluation, and metallurgical studies, and identified new exploration opportunities. Of particular significance is the newly identified Tremor Zone east of Desert Scheelite, where drilling intersected mineralization along a concealed quartz monzonite contact beneath post-mineral volcanic and alluvial cover. The discovery demonstrates the potential for blind mineralized systems elsewhere on the property and represents a high-priority target for future exploration. Future exploration is expected to focus on extending known mineralization at Desert Scheelite and Garnet, testing interpreted fault-offset positions of existing deposits, evaluating the extent of mineralized intrusive bodies identified through geophysical surveys, and advancing emerging targets including the Tremor Zone, Gunmetal, Good Hope, and other prospective areas within the Pilot Mountain Project. 1.4 MINERAL RESOURCE AND RESERVE ESTIMATES 1.4.1 MINERAL RESOURCE ESTIMATES At Desert Scheelite, Guardian’s geologic model is well defined with distinctive rock units and forms the principal control for the metal domain modelling and resource estimation. RESPEC interpreted a tungsten mineral domain for Desert Scheelite to estimate tungsten trioxide, silver, copper, and zinc. Separate interpolations were run with ordinary kriging, inverse distance, and nearest neighbor for each metal. The kriged interpolation is reported in Table 1.1. The mineral resource estimate reported in Table 1.1 is inclusive of material categorized as mineral reserve. A mineral resource statement exclusive of mineral reserves is provided in Table 11.26. The Desert Scheelite mineral resources have been estimated to reflect potential open-pit extraction and processing by standard flotation and milling techniques. Resources were reported at a 0.04% WO3 cut-off. Silver and zinc are reported within the mineral resources using the WO3 cut-off grade. No independent cut-off grades were applied to silver or zinc. Those metals are considered by-products contingent upon economic extraction of WO3. RESPEC has classified Desert Scheelite mineral resources in accordance with the definitions for mineral resources in S-K 1300. Table 1.1: Desert Scheelite Inclusive Reserves Cut-off Average Grade Contained Metal Classification % WO3 Tonnes % WO3 g Ag/t % Zn t WO3 oz Ag t Zn Indicated 0.04 9,978,000 0.189 11.39 0.3 18,900 3,656,000 29,900 Inferred 0.04 1,933,000 0.158 11.48 0.286 3,000 713,000 5,500 Notes: 1. The effective date of Desert Scheelite mineral resources is May 26, 2026. |
| PFS Pilot Mountain Tungsten Project – S-K 1300 Technical Report Summary Project No.: 25173-01 Page 8 of 236 2. The estimate of mineral resources was done by RESPEC in metric tonnes. 3. The point of reference is in situ mineralization prior to extraction by open pit mining methods. 4. The average grades of the tabulations are comprised of the weighted average of block-diluted grades within an optimized pit. 5. The Desert Scheelite mineral resource cut‑off grade of 0.04% WO₃ was selected by the authors. Operating assumptions were applied to establish a theoretical pit limit, including a WO₃ price of $115,000/t, an average recovery of 75% WO₃, a processing rate of 4,000 tonnes/day, $3.50/t mining cost for open pit, $23.00/t processing cost, $5.17/t processed for G&A, and an 84% payability. Blocks outside the pit limit are considered not economic currently. 6. The accessory metals Ag and Zn shown in Table 11.24 are the quantities contained within the mineral resources using the cut-off grade established for the primary commodity (WO3). No independent cut-off grade has been applied to these accessory metals. Reported quantities of accessory metals are therefore considered by-products of the primary metal resource and their value is contingent upon the ability to economically extract the by-products along with the primary commodity. 7. The estimate of mineral resources may be materially affected by geology, environmental, permitting, legal, title, taxation, sociopolitical, marketing, or other relevant issues. 8. Rounding as required by reporting guidelines may result in apparent discrepancies between tonnes, grade, and contained metal content. 9. Mineral resources are reported inclusive of mineral reserves. Mineral reserves are a subset of the reported mineral resources and should not be added to the mineral resource estimates. 10. Mineral resources are not mineral reserves and do not have demonstrated economic viability. An inferred mineral resource has a lower level of confidence than an indicated mineral resource and must not be converted to a mineral reserve. RESPEC reasonably expects that continued exploration and delineation will upgrade most inferred mineral resources to indicated mineral resources. At Garnet, Guardian developed a geologic model defining flat-lying skarn horizons and interpreted fault offsets that help constrain the distribution of scheelite mineralization. RESPEC interpreted a tungsten mineral domain and a separate Ag-Zn domain to reflect the distribution of base-metal mineralization. Tungsten trioxide, silver, copper, and zinc were estimated using ordinary kriging, inverse distance, and nearest neighbor methods, with the kriged results reported in Table 1.2. The mineral resource estimate reported in Table 1.2 is inclusive of material categorized as mineral reserve. A mineral resource statement exclusive of mineral reserves is provided in Table 11.28. The Garnet mineral resources were evaluated assuming potential open-pit extraction and processing by standard flotation and milling techniques and are reported at a 0.04% WO3 cut-off grade. Silver and zinc are included within the reported resources using the WO3 cut-off and are treated as by-products contingent upon economic extraction of WO3. RESPEC has classified Garnet mineral resources in accordance with the definition for mineral resources in S-K 1300. Table 1.2: Garnet Resources Inclusive Reserves Cut-off Average Grade Contained Metal Classification % WO3 Tonnes % WO3 g Ag/t % Zn t WO3 oz Ag t Zn Indicated 0.04 2,158,000 0.127 3.18 0.233 2,700 221,000 5,000 Inferred 0.04 364,000 0.11 1.87 0.111 400 22,000 400 Notes: 1. The effective date of Garnet mineral resources is May 26, 2026. 2. The estimate of mineral resources was done by RESPEC in metric tonnes. 3. The point of reference is in situ mineralization prior to extraction by open pit mining methods. 4. The average grades of the tabulations are comprised of the weighted average of block-diluted grades within an optimized pit. 5. The Garnet mineral resource cut‑off grade of 0.04% WO₃ was selected by the authors. Operating assumptions were applied to establish a theoretical pit limit, including a WO₃ price of $115,000/t, an average recovery of 75% WO₃, a |
| PFS Pilot Mountain Tungsten Project – S-K 1300 Technical Report Summary Project No.: 25173-01 Page 9 of 236 processing rate of 4,000 tonnes/day, $3.50/t mining cost for open pit, $23.00/t processing cost, $5.17/t processed for G&A, and an 84% payability. Blocks outside the pit limit are considered not economic currently. 6. The accessory metals Ag and Zn shown in Table 11.24 are the quantities contained within the mineral resources using the cut-off grade established for the primary commodity (WO3). No independent cut-off grade has been applied to these accessory metals. Reported quantities of accessory metals are therefore considered by-products of the primary metal resource and their value is contingent upon the ability to economically extract the by-products along with the primary commodity. 7. The estimate of mineral resources may be materially affected by geology, environmental, permitting, legal, title, taxation, sociopolitical, marketing, or other relevant issues. 8. Rounding as required by reporting guidelines may result in apparent discrepancies between tonnes, grade, and contained metal content. 9. Mineral resources are reported inclusive of mineral reserves. Mineral reserves are a subset of the reported mineral resources and should not be added to the mineral resource estimates. 10. Mineral resources are not mineral reserves and do not have demonstrated economic viability. An inferred mineral resource has a lower level of confidence than an indicated mineral resource and must not be converted to a mineral reserve. RESPEC reasonably expects that continued exploration and delineation will upgrade most inferred mineral resources to indicated mineral resources. 1.4.2 MINERAL RESERVE ESTIMATES RESPEC has used Indicated resources as the basis to define reserves for both the Scheelite and Garnet deposits which together compose the Pilot Mountain project. Open pit mining was selected as the mining method. Mineral reserves have been defined by: • Defining economic and geometrical parameters; • Run pit optimizations to determine the ultimate pit limits and sequencing; • Define pit design parameters; • Create pit designs; • Identify waste-rock storage locations; • Producing mine and process production schedules; • Creating a Request for Quotation (RFQ) for mining contractors; and • Estimating mining capital and operating costs based on contractor quotations and mining general personnel and supply costs. Pit optimizations have been estimated using input economics, and geometry. The cutoff grades are based on the economic parameters and inputs for processing recoveries. The pit optimizations provided guidance for the ultimate pit designs and pit phases. Economic parameters used for pit limit analysis were developed by RESPEC and other consultants and applied to pit optimizations. Geotechnical recommendations for pit optimizations were flattened to represent anticipated ramp systems within the pit designs. The resulting pit shells from the optimizations were used to guide phased and ultimate pit designs which form the basis of the reserves. Of note, metal prices of $115,000/t WO3 were used as the basis for cutoff grades and pit design. While these are the prices used for resources, pit optimizations, and ultimately cutoff grades, they are lower than the final metal prices used for cashflow analysis. The lower metal prices enhance the economics by maintaining a higher cog than would be the case using the higher metal prices. The primary impact of the higher metal prices is immaterial to the size of the ultimate pit, though there could be additional low-grade material stockpiled and processed at the end of the mine life. The value of this low-grade material is considered to be non-material, and the exclusion of this material is reasonable based on the QP’s experience. |

| PFS Pilot Mountain Tungsten Project – S-K 1300 Technical Report Summary Project No.: 25173-01 Page 10 of 236 The Scheelite resource model assumes 2.5m X 5m X 5m blocks in the X, Y, Z directions. The 2.5 m in the X direction is perpendicular to the strike of the deposit. In the resource estimates, the blocks were domain diluted to the final block size and contain an inherent amount of dilution accordingly. The RESPEC believes that the block size represents a reasonable selective mining unit (“SMU”) and that the dilution implied is appropriate for the statement of reserves. The Garnet resource model assumes 5m X 5m X 2.5m in the X, Y, Z directions. The deposit ore has a distinct color difference from the surrounding gang which will allow selective mining to the SMU size. The Garnet resource has also been diluted to the SMU size and RESPEC believes that this is a reasonable SMU size for the mining of the deposit. For these reasons, no additional dilution has been added to the reserves. Desert Scheelite ultimate pit design is achieved by mining in 5 different pit phases with the first 2 pits named Phase 1a and Phase 1 followed by Phase 2, 3, and 4. Garnet pit designs were completed using the same parameters as Desert Scheelite. Garnet is to be mined with the Phase 1 to the south of the Phase 2. The 2 pit phases merge to have a common ridge between them. Mineral Reserves are defined by applying modifying factors to the Mineral Resources. The modifying factors include economic and geometrical factors to pit optimizations followed by pit designs as discussed above. In addition, production scheduling and mine costs were completed as described in Section 13 (Mining Methods). This information has been provided to Samuel Engineering who completed the financial modeling that supports the statement of Mineral Reserves. Of note, no Measured Resources were defined in the resource model. The QP used Indicated Resources within the pit designs and above the 0.040% WO3 cutoff grade as defined by the economic parameters to estimate Probable Reserves. Table 1.3 shows Probable Reserves for the project along with notes. Table 1.3: Mineral Reserves Statement Notes: 1. The effective date of Desert Scheelite and Garnet Mineral Reserves is June 15,2026. 2. The point of reference for Mineral Reserves is the crusher. 3. Resource blocks were diluted to the selective mining unit (SMU), and now additional dilution was added for reporting of Reserves. The QP, RESPEC, responsible for the statement of reserves, believes that the blocks can be reasonably mined at the SMU size. Desert Scheelite SMU blocks were 5m by 2.5m by 5m in the X, Y, and Z directions, respectively. Garnet SMU blocks were 5m by 5m by 2.5m in the X, Y, and Z directions, respectively. 4. Reserves are reported based on a 0.040% WO3 cutoff grade. The cutoff grade was applied only to the WO3 grades. Silver, Tungsten, and Zinc are reported as the contained metals within the Probable material processed. 5. Rounding may result in apparent discrepancies between tonnages and contained metal totals. 6. Indicated material has been converted to Probable Reserves. The resources do not contain any Measured material, so no Proven Reserves are reported. All Inferred resources are considered as waste material. 7. Reserves are reported by RESPEC. Probable Reserves Deposit k Tonnes WO3% WO3 t g Ag/t K Ozs Ag Zn% Zn t Desert Scheelite 9,738 0.182 17,768 10.68 3,343 0.30 28,813 Garnet 2,085 0.120 2,507 2.78 186 0.22 4,583 Total Probable 11,822 0.171 20,275 9.28 3,529 0.28 33,396 |
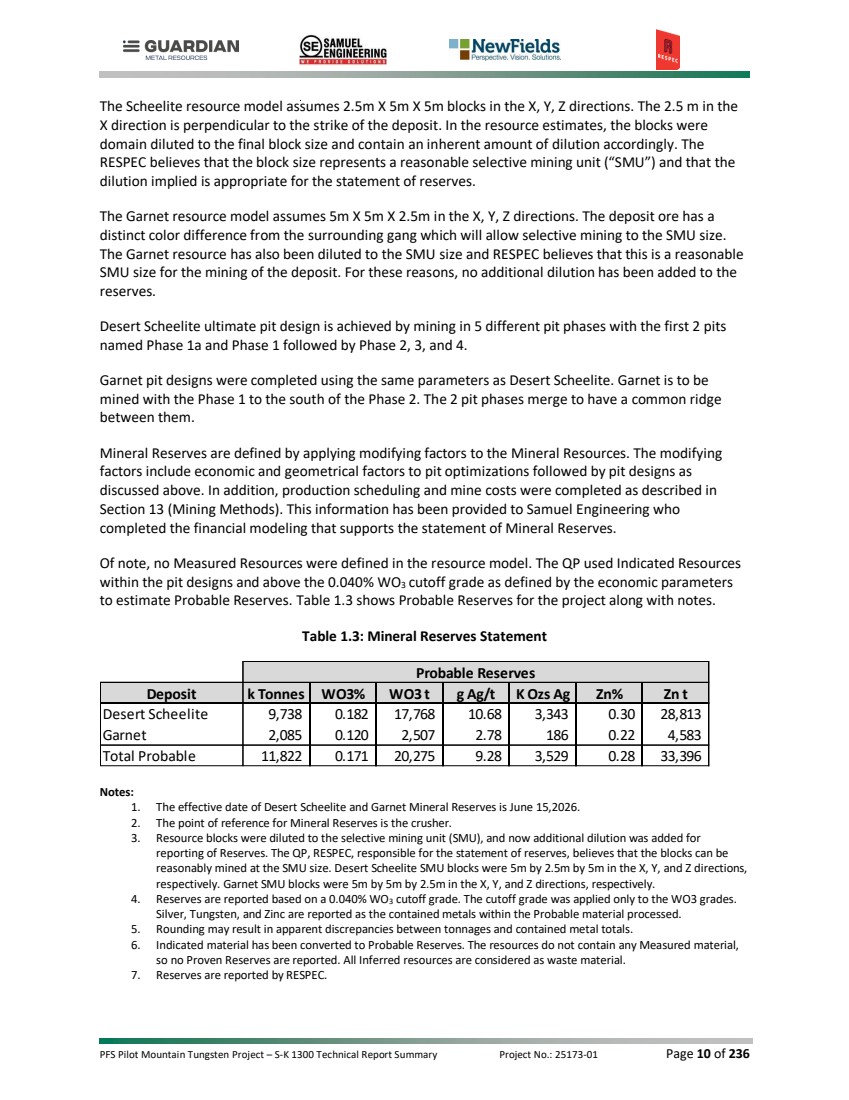
| PFS Pilot Mountain Tungsten Project – S-K 1300 Technical Report Summary Project No.: 25173-01 Page 11 of 236 Reserves are reported based on $115,000/t WO3, $38.00/oz Ag, and $2,700/t Zn metal prices. Note that the final cashflow analysis uses a higher WO3 price. The lower price is reasonable with the reporting of reserves as RESPEC considers material below the reporting cutoff grade to be immaterial. 1.5 MINING METHODS The PFS presented in this report examines open-pit mining of the Pilot Mountain Tungsten project. This project consists of the Desert Scheelite and Garnet deposits, with waste material being sent to the tailings storage facility (“TSF”) to the east and a single waste rock storage facility (“WRSF”) to the north, as shown in Figure 1.1. Waste rock has been planned to be moved from the 2 deposits to either one waste rock storage facility (“WRSF”), as construction material to a tailings storage facility (“TSF”), or as backfill to one of the mined-out pits. The single WRSF located in the north (shown in Figure 1.1) has a designed capacity of 36M cubic meters of material. The TSF is located to the east of the Scheelite ultimate pit. The TSF includes a built-in pond area, and the total material requirements are 17M cubic meters. Production scheduling was completed using MineSched software (Version 2025). The production was completed by targeting ore and waste materials required for construction needs, and to maintain the process plant production capacity. Where possible, waste material was used for construction requirements including the material needed for roads and the TSF area. Additional associated waste material will be hauled to either the northern WRSF or, as available, will be placed into backfill locations. The backfill locations will primarily be in the western portions of the Desert Scheelite pit and into the southern Garnet pit. The designs for the backfill will be further defined in a definitive feasibility study. The nameplate capacity for the process plant is assumed to be 4k tonnes per day or 1.46M tonnes per year. A ramp-up in production is assumed to be 10%, 30%, and 60% of the nameplate capacity in months -3, -2, and -1. The start of commercial production is assumed to be in month 1 at 90% of nameplate capacity, with full production achieved in month 2. The mining schedule assumes contract mining, and the contractor will be required to provide equipment and personnel to maintain the production schedule. Contractors were provided with the production schedule and mining costs based on contractor quotations. The life-of-mine (“LOM”) is estimated to require about 7.5 years of mining. The LOM mine production schedule is shown in Table 1.4. RESPEC also provided process and stockpile balance sheets to Samuel Engineering for use in economical modeling. |
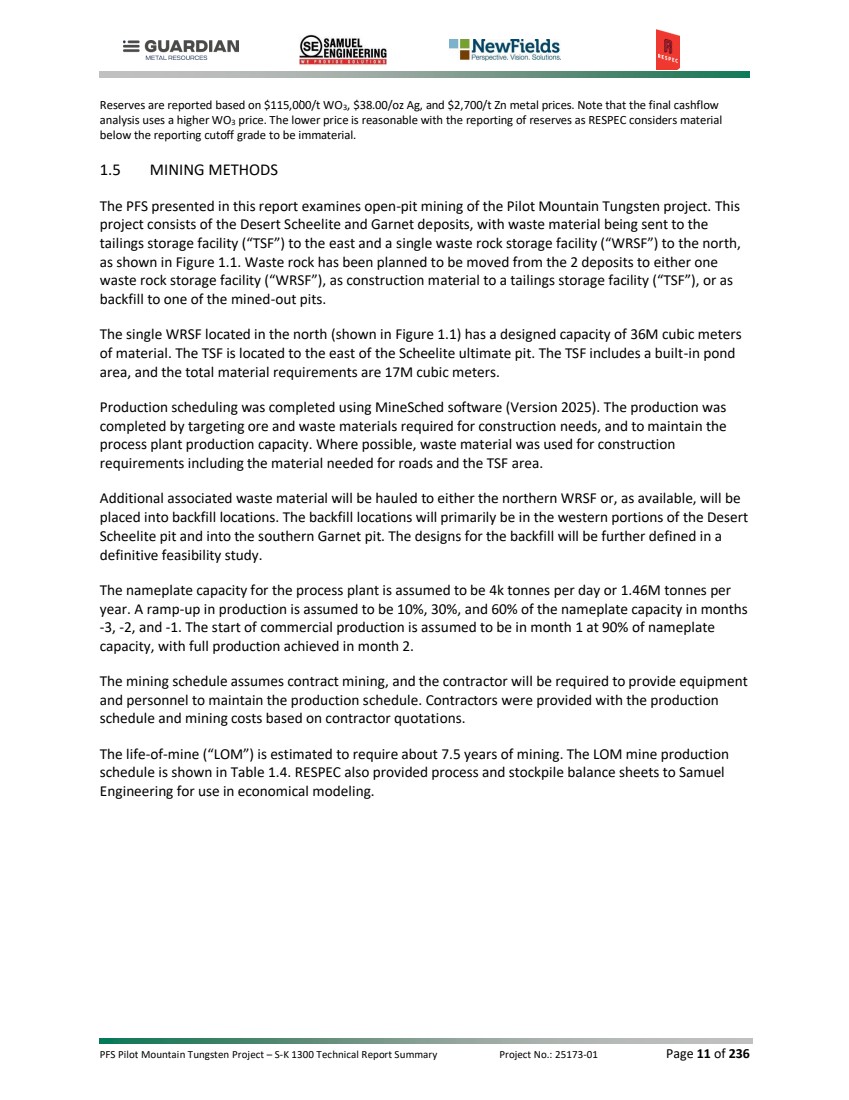
| PFS Pilot Mountain Tungsten Project – S-K 1300 Technical Report Summary Project No.: 25173-01 Page 12 of 236 Table 1.4: Yearly Pilot Mountain Project Mine Production Equipment and contractor personnel will be the responsibility of the mining contractor. Within the contractor quotations, they have specified the use of CAT 992 type loaders with 91-tonne (100-ton) type of rigid haul trucks. RESPEC has estimated the required yearly equipment and personnel based on the productivity estimated for the CAT 992 and 91t loader/truck match. Total equipment requirements are estimated to require a maximum of 4 loaders and 16 haul trucks with additional drills, support, and maintenance equipment to maintain the operations. Personnel requirements have been estimated based on the contractor's equipment and the mine general personnel required to operate the mine. The personnel requirements estimate a maximum of 153 contractor personnel to operate two shifts 24 hours per day and 7 days per week. In addition, owner mining personnel will be required to manage the contractor, provide short term mine planning guidance, and coordinate ore control. The maximum owner personnel totals 9 professionals, which brings the maximum mining personnel to 162 people. 1.6 METALLURGICAL TESTWORK AND RECOVERY METHODS Multiple metallurgical test work programs have been carried out at different laboratories between 2012 and 2026. This work has helped to identify froth flotation as the preferred processing technology for the beneficiation of the contained tungsten mineralization. Great effort was put into the identification and understanding of factors affecting the flowsheet performance, with grind targets and reagent recipes modified and progressively optimized. The selection of samples for composites, focusing on the mineralization within the deposit was also given considerable focus, resulting in the latest series of tests in 2026. A brief chronology of work and sample selection criteria is given below. The 2012 testwork at Amdel Laboratories Perth characterized samples with between 0.3% to 0.4% WO₃ grades. The testwork explored both flotation and gravity recovery of tungsten mineralization. Tungsten recoveries were 63% to 65% with WO₃ concentrate grades of 65%. Testwork was continued in 2019 at the Guangdong Institute of Resources Comprehensive Utilization (GIRCU) where samples were tested on their response to gravity separation, magnetic separation, and flotation. Flotation was again selected as the best flowsheet for the second stage of testwork. Tungsten recovery for the final flowsheet in 2019 was 76% with a WO₃ concentrate grade of 68%. Units Yr -2 Yr -1 Yr 1 Yr 2 Yr 3 Yr 4 Yr 5 Yr 6 Yr 7 Yr 8 Yr 9 Total Total Mined K Tonnes - 454 1,576 1,160 1,880 1,280 1,321 1,567 1,368 1,218 - 11,822 Above COG WO3% - 0.265 0.186 0.160 0.188 0.143 0.155 0.160 0.143 0.198 - 0.171 WO3 t - 1,201 2,925 1,854 3,539 1,836 2,049 2,505 1,951 2,415 - 20,275 g Ag/t - 10.66 11.46 11.48 9.04 5.96 9.15 7.48 5.52 14.45 - 9.28 K Ozs Ag - 156 580 428 546 245 388 377 243 565 - 3,529 Zn% - 0.304 0.375 0.429 0.305 0.170 0.208 0.229 0.203 0.337 - 0.282 Zn t - 1,378 5,913 4,978 5,726 2,171 2,749 3,594 2,781 4,107 - 33,396 Pond K Tonnes 296 - - - - - - - - - - 296 TSF K Tonnes 2,297 6,570 5,645 11,781 5,369 - - - - - - 31,662 WRSF K Tonnes - 616 2,384 2,599 12,071 20,680 20,269 14,318 13,140 6,269 - 92,346 Required Backfill K Tonnes - - - - - - - 3,053 14,902 6,269 - 24,224 Total Waste K Tonnes 2,592 7,186 8,029 14,380 17,440 20,680 20,269 17,371 28,042 12,538 - 148,528 Total Mined K Tonnes 2,592 7,639 9,605 15,540 19,320 21,960 21,590 18,938 29,410 13,756 - 160,350 Strip Ratio O:W NA 15.84 5.10 12.39 9.28 16.15 15.35 11.08 20.50 10.30 12.56 |
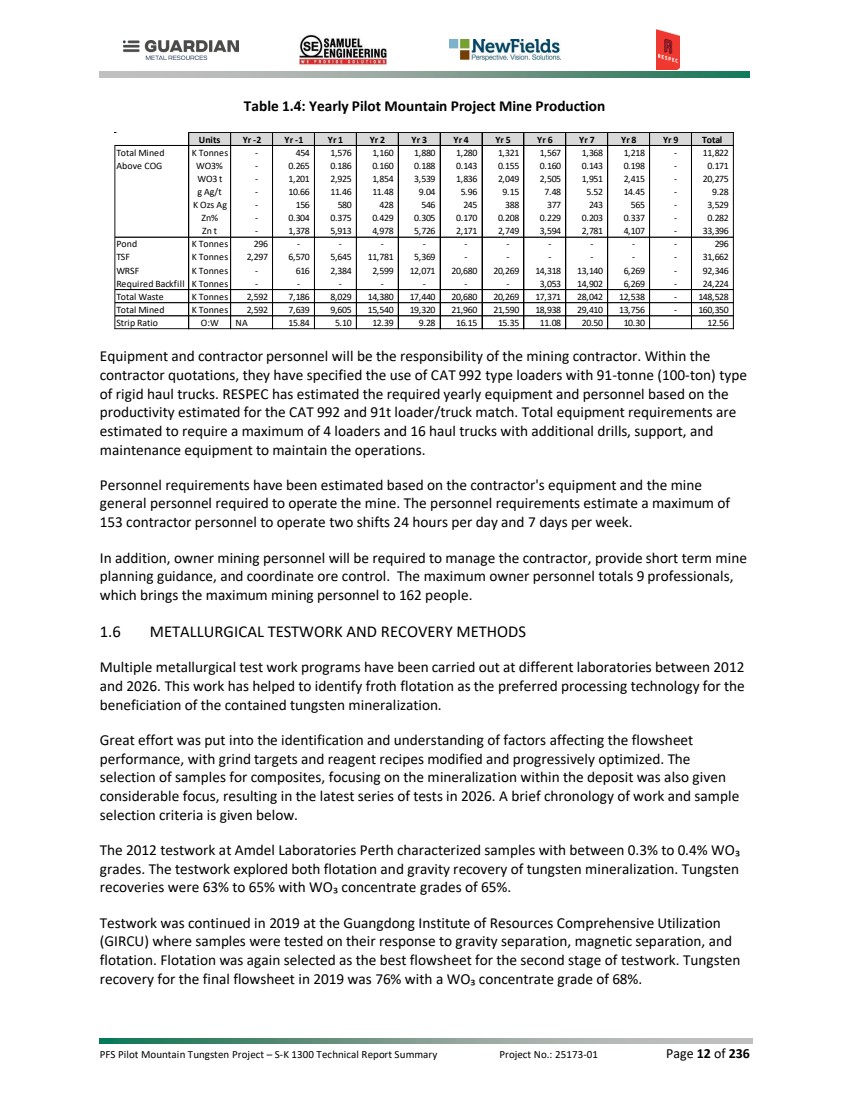
| PFS Pilot Mountain Tungsten Project – S-K 1300 Technical Report Summary Project No.: 25173-01 Page 13 of 236 Base Met Laboratories was contracted in 2025-2026 to perform the latest testwork campaign. The testwork focused on optimizing the GIRCU flowsheet on samples selected to represent the current mineral resource. The test program analyzed two composite and nine variability samples to develop the current flowsheet. The main oxide composite achieved a tungsten recovery of 78.5%, with a concentrate grade of 62% WO₃, in a locked cycle flotation test. Six additional composites were also used to determine comminution parameters. 1.7 INFRASTRUCTURE 1.7.1 OPERATING AND ADMINISTRATIVE FACILITIES The major operating and administrative infrastructure to be constructed at the Pilot Mountain site include the following: • Site and access roads • Topsoil storage areas • Primary and secondary crusher, crushed ore stockpile conveyor systems • Water pipeline • Substation and overhead power lines • Process facility with concentrator building • Administration and laboratory buildings • Truck shop, warehouse, fuel depot, truck wash, and other mine facilities • Guard shack and scale • Explosive and detonator magazine sand explosive ANFO/diesel storage • Water storage and distribution • Waste Rock Storage Facility (WRSF) • Tailings Storage Facility (TSF) Power will be sourced from an existing 120 kV power line and fresh water to the site will be from wells. A wildlife fence will encompass the entire plant site and security fencing will be installed around the process facility, electrical substation and other critical areas. 1.7.2 TAILINGS STORAGE FACILITY The Tailings Storage Facility (TSF) was designed as a fully geomembrane-lined impoundment created by a rockfill dam, with embankments on the north, east, and south sides. The native ground, sloping from west to east, forms the containment on the west side. The ultimate embankment was designed with 3H:1V downstream slopes to accommodate future closure and reclamation activities. Upstream slopes were designed at 2.5H:1V to facilitate installation and preparation of the 5-meter-wide finer-grained fill that will be constructed directly over the rockfill as a transition to and bedding for the geomembrane liner. The TSF will consist of two cells for the two separate tailings streams: the bulk tailings and the sulfide concentrate. The main impoundment will contain approximately 12 million dry tonnes of tailings from the tungsten milling and floatation process. The sulfide concentrate will be stored in a separate cell, or the “Con Pond,” located in the northeast corner of the main impoundment. The Con Pond will contain approximately 0.3 million tonnes of sulfide concentrate, which is anticipated to be a filter cake product. The Con Pond will be constructed in two phases (Starter and Ultimate), while the main TSF, including the embankment, will likely be constructed in a total of four phases. |
| PFS Pilot Mountain Tungsten Project – S-K 1300 Technical Report Summary Project No.: 25173-01 Page 14 of 236 The geomembrane-lined impoundment will be covered by a gravel blanket drain and a network of perforated and corrugated polyethylene (CPe) pipes to promote tailings consolidation and drainage. The CPe pipes will transition to HDPE pipes and convey flows to a double-lined pond with a leak detection system. The underdrain pond will be located outside the ultimate embankment toe. The sulfide filtered tailings will be trucked to the Con Pond and end-dumped, scarified, and compacted in-place. Due to the low water content of the filter cake, no supernatant pond is expected in this area. The remaining tailings will be pumped as a slurry to the TSF and deposited sub-aerially via zoned spigots located along the embankment crest. The supernatant pond will be stored against native ground; no water will be stored against the embankments under normal operations. Water will be reclaimed from the supernatant pond via a shore-mounted pump with a floating intake located on a pump ramp constructed in the native basin portion of the impoundment. Water will be pumped to the processing facilities for reuse in the processing circuit. The first three phases of the TSF were designed to fully contain flows resulting from the Probable Maximum Precipitation (“PMP”) event with 1 meter of freeboard, with no spillway included in the design. For the fourth and final phase, an operational spillway will be graded into the southwest embankment corner. The operational spillway will also function as the final closure spillway. Toward the end of the facility life, the tailings beach and supernatant pond will be shaped, through careful tailings deposition, to direct the low point to the spillway to help facilitate closure. The conceptual closure plan includes placing cover fill over the embankment surface and revegetating. The tailings surface will be allowed to drain down and consolidate before the tailings can be trafficked over to place cover fill material. Post-closure, water reporting to the TSF will drain to the closure spillway, lined with reinforced concrete for erosion protection, and the outfall to the downstream termination point in the native drainage will be lined with riprap. 1.7.3 WASTE ROCK STORAGE FACILITY Waste rock from the Desert Scheelite and Garnet deposits to a single WRSF to the north, as shown in Figure 1.1 and discussed in Section 1.5 above. Appropriate stormwater controls have been included in the WRSF designs. The overall slope configuration meets a minimum recommended target static factor of safety of 1.3 and acceptable deformations under seismic loading for this type of facility. 1.8 ENVIRONMENTAL STUDIES, SOCIAL OR COMMUNITY IMPACT AND PERMITTING 1.8.1 INTRODUCTION Exploration and mining activities on private land in Nevada are regulated by Nevada Division of Environmental Protection (NDEP) Bureau of Mining Regulation and Reclamation (BMRR; collectively the NDEP–BMMR), and by the BLM or USFS on public land. For exploration projects on public land creating less than five acres of disturbance, a Notice and reclamation bond is required by the BLM. For projects proposing disturbance of over five acres, a Plan of Operations (PoO) and National Environmental Policy Act (NEPA) compliance is required by the land management agency along with a reclamation permit issued by NDEP–BMRR. Regulatory authority for the reclamation permit requirement is set forth in Sections 519A.010 through 519A.290 of the Nevada Revised Statute (NRS) and Sections 519A.120 through 519A.345 of the Nevada Administrative Code (NAC). Additional regulations regarding surety, trust funds for fluid management and enforcement are provided in Sections 519A.350 through 519A.392. |

| PFS Pilot Mountain Tungsten Project – S-K 1300 Technical Report Summary Project No.: 25173-01 Page 15 of 236 The Project is located on public lands with the public lands administered by the BLM through the Stillwater Field Office located in Carson City, Nevada. 1.8.2 ENVIRONMENTAL SETTING The Project site is situated on the eastern slopes of the Pilot Mountain Range in Mineral County, Nevada. The topography in the area is typical of that found in the Basin and Range Physiographic Province and is defined by north south trending mountain ranges separated by wide basins. The basin to the east of the Plan Area is Monte Cristo Valley. The site slopes generally to the east with elevation decreasing from 7,500 to 5,900 feet above mean sea level (amsl) across a distance of 2.5 miles. The landscape of the Project is moderately rugged on the east at the higher elevations and transitions to alluvial fan topography to the west. According to the Western Regional Climate Center (WRCC), the average maximum temperature in Mina, Nevada, located 4.3 air miles northwest of the Survey Area, is 95.6 degrees (°) Fahrenheit (F) in July, and the average minimum temperature is 20.7 °F in January. The average annual precipitation is 4.5 inches, peaking in May, and average snowfall is 7.2 inches peaking in January (WRCC 2016). The average annual evaporation rate is estimated to be approximately 66 inches per year. There are no perennial streams or standing waters (lakes, ponds, or wetlands) in the Project Area. 1.8.3 BASELINE STUDIES Baseline studies have been completed for the current exploration permitting to support the Exploration Plan of Operations (EPO) and the Environmental Assessment (EA) that have been approved by the BLM (Appendix B). These studies included Biological Resources and Cultural Resources. The baseline studies needed to support mine operation permitting are currently being developed utilizing the drilling being done for the exploration program. Key environmental resources including geochemistry, surface and groundwater hydrology, geology and soils have been advanced based on the geologic models to ensure full characterization of each geologic unit. The data presented in the baseline reports will be used to inform the development of the Mine Plan of Operations. The Environmental Baseline Reports (EBR) will follow the current BLM pre-planning format that includes preliminary impact analyses for each resource area that is critical in identifying sensitive resources and guide mine planning to specifically avoid or minimize environmental impacts. A series of Environmental Protection Measures (EPMs) will be developed for each resource in the baseline reports that will be carried into the PoO for use in the BLM NEPA analysis. Table 1.5 summarizes the baseline studies to be completed for the project. Table 1.5: Guardian Metal Resources Environmental Baseline Studies Study Resources Surveyed Status Cultural Resources Class III Cultural Resource Inventory completed for entire project area. Completed Results confidential. Biological Survey Report Pilot Mountain Biological Survey Report: Completed Vegetation Special Status Plant Species Noxious Weeds |

| PFS Pilot Mountain Tungsten Project – S-K 1300 Technical Report Summary Project No.: 25173-01 Page 16 of 236 Table 1.5: Guardian Metal Resources Environmental Baseline Studies Study Resources Surveyed Status General Wildlife Greater Sage Grouse and Habitat Assessment Pygmy Rabbit and Habitat Assessment Migratory Birds and Raptors Bats Threatened, Endangered and Candidate Wildlife Species Waste Rock and Ore Characterization A review of ore and waste rock to determine the long-term potential for metals leaching and acidic drainage. In Progress Static Testing /Acid base accounting Meteoric water mobility procedures Humidity cell testing Whole rock geochemistry Mineralogy Hydrogeology Report Report on the site hydrogeologic conditions that control surface and groundwater flow. In Progress Groundwater Hydrologic Modeling Report Groundwater flow model generated from groundwater monitoring and pump tests to determine aquifer characteristics and flow rate. In Progress Visual Resources Survey Report Analysis of impacts on visual resources To be Completed Paleontology Survey A review of the potential for paleontological resources that could be impacted by site development in conformance with the BLM Paleontological Resources Preservation requirements. To be Completed Transportation Survey Report A review of transportation resources and potential impacts from the project activities incorporated directly into baseline report To be Completed Socioeconomics A review of socioeconomics for current project To be Completed Recreation and Wilderness Areas A review of recreation and wilderness baseline conditions and potential impacts incorporated directly into the baseline report. To be Completed Air Quality Survey Report Report on baseline air quality conditions and preliminary modeling of air quality impacts from mine plan that will inform equipment selection and location for PoO and Air Quality Permit. In Progress Wild Horses Review of baseline wild horse conditions and analysis of potential impacts. To be Completed |
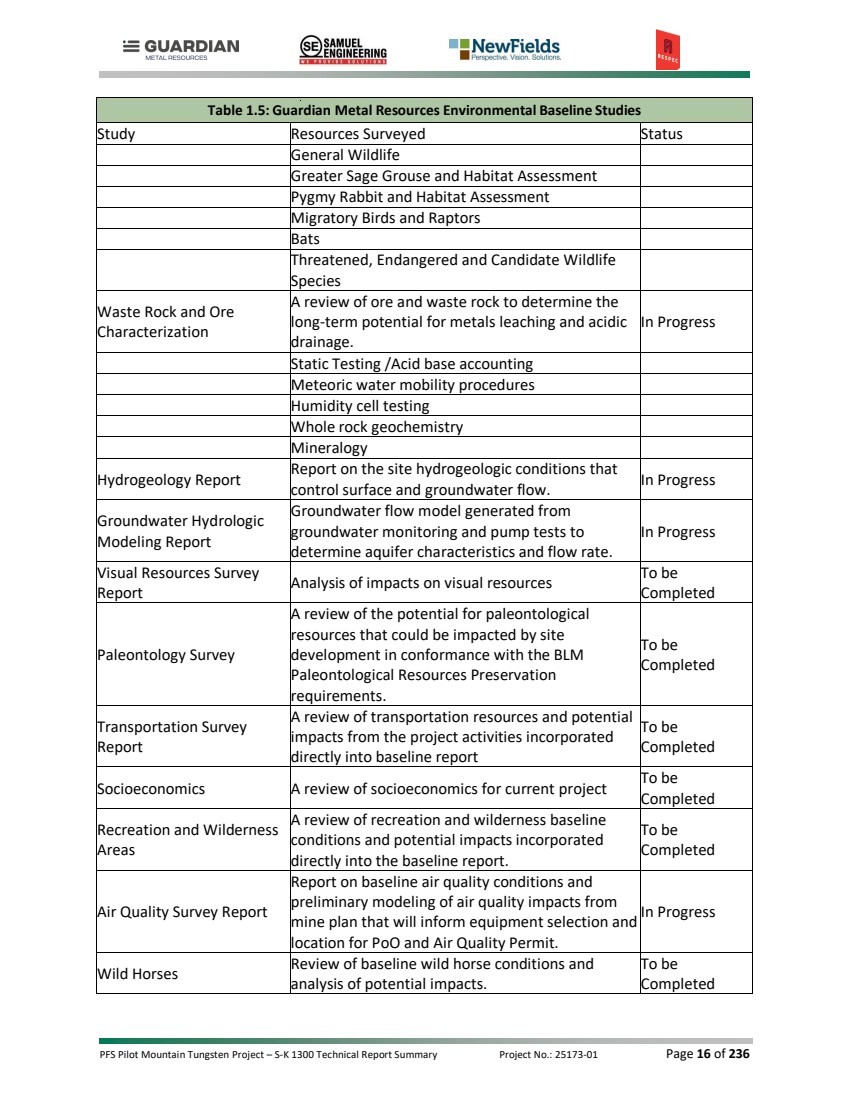
| PFS Pilot Mountain Tungsten Project – S-K 1300 Technical Report Summary Project No.: 25173-01 Page 17 of 236 Table 1.5: Guardian Metal Resources Environmental Baseline Studies Study Resources Surveyed Status Noise Review of baseline noise conditions and modeling of potential noise levels from proposed operations on nearest sensitive receptors. To be Completed Geology Review of baseline geologic conditions and assessment of potential impacts to geologic resources. Completed Soils Review of baseline soils conditions and analysis of available soil resources to reclaim the mine plan. Completed 1.8.4 BIOLOGICAL RESOURCES Westland Resources has completed the baseline biological studies for the project area. The baseline study included vegetation community and wildlife habitat mapping, noxious weed and invasive species surveys, BLM Special Status Species surveys, greater sage-grouse presence and absence surveys, pygmy rabbit presence and absence surveys, migratory bird and raptor surveys, acoustic bat surveys, golden eagle habitat analysis, and an Ecological Site Inventory analyzing rangeland health indicators. No sage grouse leks were found within the Project boundary. Three golden eagle nests have been identified within the project area that have not been active for at least the last two years. Due to the proximity of these nests to the Desert Scheelite Pit, it was determined that there was potential for impacts to the Golden Eagles during nesting season. After consultation with the U.S. Fish and Wildlife Service, it was decided that a General Take Permit may be necessary. An application has been submitted to the U.S. Fish and Wildlife Service for a general take permit that will be issued this year. The Mine Plan of Operations (MPO) prepared by GMR will include environmental protection measures and project design features to avoid or minimize the potential for significant impact to biological resources. Additional protection measures and mitigation may be identified during the NEPA analysis. 1.8.5 CULTURAL RESOURCES Westland Resources has compiled the full inventory of Class III Cultural Inventories, and the reports have been submitted and approved by the BLM and the Nevada State Historic Preservation Office (SHPO) in compliance with Section 106 of the National Historic Preservation Act of 1966 (NHPA). 1.8.6 SURFACE WATER RESOURCES Surface water features at the Site include ephemeral streams exhibiting surface flow only during significant precipitation or snowmelt events. Streamflow in these channels is typically ephemeral, short-lived and highly seasonal. Two minor springs are present near the Site that exhibit low or intermittent flow, contributing only minimally to the hydrologic budget. Spring discharge is generally confined to fractured rock zones. An analysis was performed as part of the supporting documentation for an Approved Jurisdictional Determination (AJD) request to the U.S. Army Corps of Engineers (USACE). Findings are based on a desktop review of publicly available geospatial and environmental datasets, including aerial imagery, USGS topographic maps, the U.S. Fish and Wildlife Service National Wetlands Inventory (NWI), and NRCS Web Soil Survey data. The evaluation found that all surface water features within or immediately |
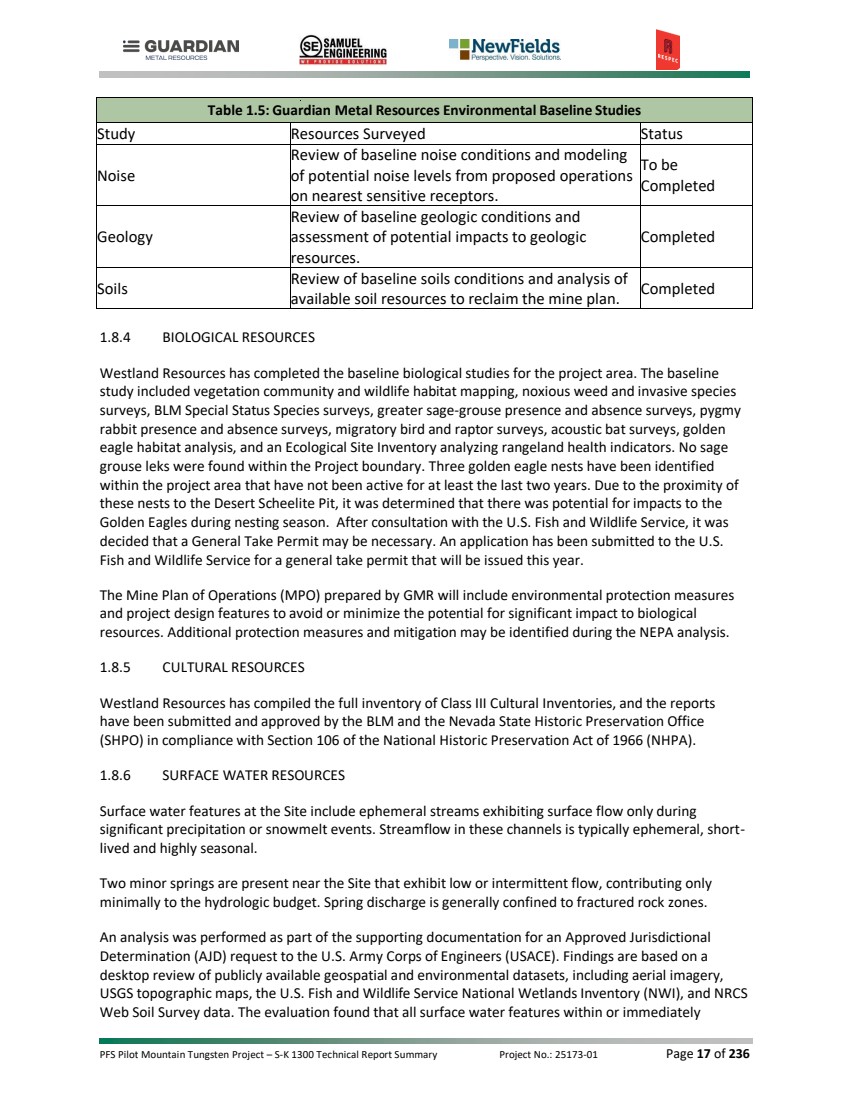
| PFS Pilot Mountain Tungsten Project – S-K 1300 Technical Report Summary Project No.: 25173-01 Page 18 of 236 adjacent to the project area did not meet federal definitions of jurisdictional waters under the Clean Water Act (CWA) and a Non-Jurisdictional Determination was issued by the USACE. 1.8.7 GROUNDWATER RESOURCES A water budget for Monte Cristo Valley has been developed for the project. The only identified component of groundwater recharge to the basin is from direct precipitation that is infiltrated near the mountain front. This is recognized as “mountain-front recharge” and has been estimated at approximately 400 afy. Monte Cristo valley is a closed basin, and therefore no surface water inflow or outflow exists. Additionally, historic estimates have not identified any groundwater underflow (inflow) from adjacent basins. Under heavy precipitation events, surface water (or shallow sub-flow) may reach the playa at the center of the valley where it is evaporated. Precipitation to the valley floor is erratic and is mostly evapotranspired. Infiltration to the aquifer from precipitation on the valley floor is negligible. Sources of imported water to the basin have not been identified. Sources of groundwater outflow have been identified as either evapotranspiration or direct extraction (e.g., production wells). It is estimated that evapotranspiration equals mountain front recharge under steady state conditions (i.e., prior to development or groundwater extraction). However, per the Nevada Division of Water Resources (NDWR) (2026), committed groundwater uses in the basin is estimated at 398.5 afy, which is dominated by mining water use (351 afy), and includes stockwater (43 afy) and wildlife (4.5 afy) uses. Although approximately 99.6% of the estimated groundwater recharge (i.e., 400 afy) is committed for productive use, accurate pumpage or extraction values are not known. Any excess recharge is assumed to be evapotranspired by native vegetation. 1.8.7.1 Well Installation Three monitoring wells (Well-1S, Well-1D, Well-2) and one piezometer (PZ-1) were installed and tested to assess aquifer properties and allow for groundwater characterization and the collection of baseline groundwater quality conditions. Prior to drilling, technical specifications were developed and a hydrogeologist was onsite to oversee the drilling, well construction, well development, and testing. Prior to drilling activities at each site, GMR submitted well permit applications, including requests for a waiver for observation or monitor well(s) with the Nevada Department of Water Resources (NDWR) for all wells. Upon completion of borehole drilling, downhole geophysical logging was conducted in MW-1D. Due to borehole stability issues, no other boreholes were logged for geophysics. Well casing and annular materials were installed following borehole drilling and geophysical logging. The monitoring wells and piezometer PZ-1 were developed via airlifting, followed by pump development (for monitoring wells only). Relatively short duration pumping tests were completed for each monitoring well, and slug tests were performed on the piezometer. Water quality samples were collected from each new monitoring well at the end of pump testing. Based on the test data, the aquifer formations have relatively low hydraulic conductivity and transmissivity. Hydraulic conductivity values range from 0.02 – 0.69 feet per day (ft/d) for the alluvium, and 0.001 – 0.01 ft/d for the bedrock aquifer. Furthermore, the alluvial aquifer and the bedrock aquifer at the MW-1S and MW-1D location appear to be hydraulically disconnected, as there was no observed influence on water levels in the adjacent wells during the respective development and pumping periods. These wells are located approximately 30 feet apart and have been completed at different depths, in different formations. Due to the relatively short duration of the pumping tests, a longer-duration |
| PFS Pilot Mountain Tungsten Project – S-K 1300 Technical Report Summary Project No.: 25173-01 Page 19 of 236 pumping test at a lower flow rate (to sustain available drawdown) could provide better data to evaluate potential connection between the alluvial and bedrock aquifers. 1.8.7.2 Hydrologic Study Area (HAS) and Groundwater Flow Direction The Pilot Mountain Project is in the western part of Monte Cristo Valley groundwater basin, located in the central hydrographic region. The Monte Cristo Valley groundwater basin covers 276 square miles (157,440 acres) and is in a rural area between Tonopah and Mina. The hydrogeology at the project area includes Pleistocene to Quaternary basin fill sediments (e.g., alluvium and alluvial fan deposits) of variable thickness overlying moderately fractured bedrock consisting of a variety of formations. The alluvium, or the basin-fill deposits, comprise the primary aquifer reservoir of the valley. The perennial yield of the basin is estimated at 400 acre-feet per year (afy) per the NDWR. Committed groundwater uses in the basin is estimated at 398.5 afy, which is dominated by mining water use (351 afy), and includes stockwater (43 afy) and wildlife (4.5 afy) uses. Monte Cristo Valley is a closed basin with no surface water inflow or outflow. Groundwater elevations basically follow surface topography, and groundwater flows from west to east. The hydraulic gradient is steeper near the planned mine facilities at the toe of the mountain and gradually flattens into the valley to the east. 1.8.8 GEOCHEMICAL CONSIDERATIONS Geochemical characterization activities are being conducted by GMR in support of the Pilot Mountain Project, focused on waste rock, ore-grade, and tailings materials to be generated through open pit mining of the Desert Scheelite and Garnet deposits. The primary purpose of the program is to evaluate the environmental behavior of these materials in terms of acid rock drainage (ARD) and metals leaching (ML) potential, to support mine design and planning, develop waste and process materials management strategies, and to inform water quality analyses and closure strategies. These deposits occur primarily within carbonate-rich skarn and altered marble of the Luning Formation. The area is underlain by Triassic and Jurassic sedimentary and volcanic rocks, locally intruded by Cretaceous granitic stocks and bordered by Tertiary volcanics. The characterization program is consistent with Nevada, US BLM, and industry guidance, utilizing static geochemical test methods, including Acid-Base Accounting (ABA), Net Acid Generation (NAG) pH, total inorganic carbon (TIC), paste pH, and Meteoric Water Mobility Procedure (MWMP) rinse testing, supplemented by existing assay bulk chemical composition, to establish baseline geochemical characteristics. Kinetic humidity cell testing (HCT) and mineralogical analyses are currently in progress to evaluate long-term environmental behavior. Based on current hydrogeologic information, it is anticipated that a pit lake may form in the Desert Scheelite open pit during the post-closure period and testing was conducted following Nevada guidance based on the assumption of ‘saturated conditions’ at closure. However, a pit lake is not currently expected at Garnet due to its shallow depth above the water table. Static ABA testing of 187 waste rock samples indicated that the vast majority (97 percent) of materials were classified as non-potentially acid generating (NPAG) due to low sulfide content and strong neutralization capacity associated with carbonate-rich lithologies. Unoxidized intrusive material was the only grouped lithologic unit that included a limited number of individual samples classified as potentially acid generating (PAG). However, the consistently circumneutral to alkaline paste pH and NAG pH values in all waste rock samples supports the low likelihood of acid generation under both short-term and oxidizing conditions. On average, the 29 samples of ore-grade materials contained somewhat higher |
| PFS Pilot Mountain Tungsten Project – S-K 1300 Technical Report Summary Project No.: 25173-01 Page 20 of 236 average total sulfur content but also exhibited abundant neutralization potential as mineralization is hosted largely in carbonate-rich skarns and marbles. Ore samples were also classified overwhelmingly as NPAG. At Desert Scheelite, thin bands of sulfide-enriched materials were identified within the ore-grade skarns (currently estimated at 3 percent of the ore-grade material) and were classified as PAG material. Special-handling the sulfide-enriched, ore-grade material is currently proposed by GMR as part of their materials management plan. MWMP rinse testing of waste and ore-grade samples provided an indication of short-term contact water quality and reflected low metals concentrations with most analytes below Nevada reference water quality standards. Some localized variability was identified including samples with elevated concentrations of arsenic, antimony, selenium, molybdenum, and uranium in isolated occurrences, particularly within specific lithologies (including intrusives, marbles, and hornfels units). A kinetic humidity cell testing (HCT) program with mineralogical analyses was initiated to evaluate the timing and magnitude of constituent release under controlled weathering conditions. Nineteen samples were selected for testing across ore and waste materials and the range of observed environmental behavior. Kinetic HCT testing has been completed through 20 weeks and further supports stable, neutral to alkaline geochemical conditions with limited evidence of sustained sulfide oxidation at this point in the testing. Trace element results indicate variable but generally low-level metal/metalloid release, with some materials releasing elevated arsenic and antimony, as well as selenium, molybdenum, and uranium in early rinsing. Overall, the results suggest neutral conditions with metal release driven largely by initial flushing rather than sustained oxidation. The HCTs will continue to operate until stable trends are observed, and termination is approved by NDEP BMRR. Tailings characterization is ongoing in parallel with metallurgical testing. Composite samples of whole tailings, segregated (non-sulfide) tailings, and sulfide rougher concentrate have undergone static geochemical testing and HCTs have been initiated on whole tailings composite and the segregated (non-sulfide) composite. Both whole and segregated (non-sulfide) tailings contain low total sulfur and high neutralization capacity, classifying them as NPAG. However, some metals (e.g., arsenic, antimony, cadmium, iron, lead, manganese, molybdenum, and uranium) may be elevated in tailings supernatant, with implications for water management or process recycle. The sulfide concentrate tailings were classified as PAG and will require special handling in tailings management. Because tailings management options remain under evaluation, the geochemical data will play an important role in determining whether sulfide separation, dry stacking, or conventional impoundment is most appropriate. The completed and ongoing geochemical characterization program supports a targeted, risk-based materials management approach and provides a defensible foundation for mine design, closure planning, and permitting while ensuring that long-term environmental performance is appropriately evaluated. 1.8.9 ENVIRONMENTAL CONSIDERATIONS/MONITORING PROGRAMS Monitoring programs will be developed based on requirements of the regulatory agencies and the associated permits/approvals issued by those agencies. Some of the major permits required would include WPCP, Reclamation Permit, Air Quality Operating Permit, NEPA Record of Decision, and various other federal, state and local permits and approvals. Reclamation bonds associated with the reclamation permit must be posted prior to the transfer of the federal and state permits and will be reviewed and updated every three years to assess adequacy of the bond to cover current reclamation costs. |
| PFS Pilot Mountain Tungsten Project – S-K 1300 Technical Report Summary Project No.: 25173-01 Page 21 of 236 1.8.10 KEY ENVIRONMENTAL ISSUES Baseline studies have been focused on identifying potential environmental impacts and ensuring that the scope of the baseline studies have been expanded where needed to fully analyze the resource to ensure the data necessary for permitting will be completed. To date, no significant environmental issues have been identified. 1.8.11 SOCIAL OR COMMUNITY IMPACT A socioeconomic baseline report will be included in the EBRs completed for permitting. To date there has been no community concerns documented as evidenced by the Exploration Environmental Assessment public comment period receiving zero comments. Meetings with the Mineral County Commissioners have been held and the project was very well received. 1.8.12 PERMITTING Table 1.6 provides a complete list of the permits that may be required for mine construction and operations. Table 1.6: Required Permits and Regulatory Authorizations Permits and Authorizations Regulatory Agency Plan of Operations/Record of Decision Bureau of Land Management Explosives Permit U.S. Department of the Treasury, Bureau of Alcohol, Tobacco, and Firearms Surface Disturbance Permit and Class II Air Quality Operating Permit Nevada Department of Conservation and Natural Resources, Division of Environmental Protection, Bureau of Air Quality Water Pollution Control Permit Nevada Department of Conservation and Natural Resources, Division of Environmental Protection, Bureau of Mining Regulation and Reclamation Mining Reclamation Permit Nevada Department of Conservation and Natural Resources, Division of Environmental Protection, Bureau of Mining Regulation and Reclamation Industrial Artificial Pond Permit Nevada Department of Conservation and Natural Resources, Nevada Department of Wildlife (NDOW) Class III Waiver Landfill Permit Nevada Department of Conservation and Natural Resources, Division of Environmental Protection, Bureau of Solid Waste General Discharge Permit (Stormwater) Nevada Department of Conservation and Natural Resources, Division of Environmental Protection, Bureau of Water Pollution Control Hazardous Materials Storage Permit State of Nevada, Fire Marshall Division Hazardous Waste Identification Number United States Environmental Protection Agency Septic Treatment Permit Sewage Disposal System Permit Nevada Department of Conservation and Natural Resources, Division of Environmental Protection, Bureau of Water Pollution Control |
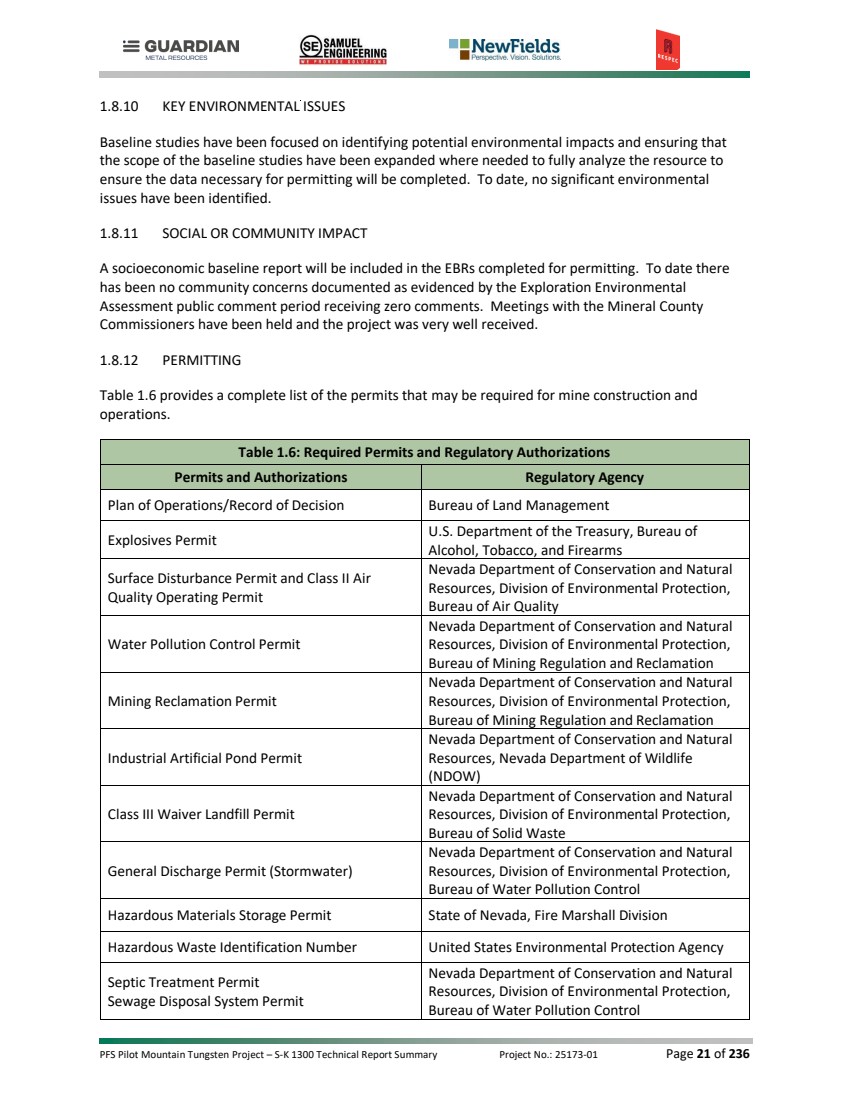
| PFS Pilot Mountain Tungsten Project – S-K 1300 Technical Report Summary Project No.: 25173-01 Page 22 of 236 Table 1.6: Required Permits and Regulatory Authorizations Permits and Authorizations Regulatory Agency Potable Water System Permit Nevada Department of Conservation and Natural Resources, Division of Environmental Protection, Bureau of Safe Drinking Water Dam Safety Permit State of Nevada Division of Water Resources Local Permits County Road Use and Maintenance Permit/Agreement Mineral County Building Planning Department 1.9 CLOSURE Nevada’s mine closure framework requires advance planning, detailed stabilization strategies, rigorous monitoring, and long-term post-closure oversight to protect water quality and ensure environmental safety. The Project emphasizes a robust closure plan and a fully funded reclamation and closure bond which will ensure safe closure of the mine at the end of operations that meets the post mining land use objectives for this site. The closure strategy involves returning the mine site and affected areas to productive self-sustaining ecosystems that meet or exceed the regulatory requirements of the State of Nevada and the Bureau of Land Management. Key activities of closure will be the physical and chemical stabilization of the site, decommissioning of equipment, demolition of physical structures; management of infrastructure; regrading and contouring to allow for stormwater drainage; and revegetation of disturbed land. Environmental monitoring of the site will continue from establishment of baseline conditions, through operations and closure, and finally into the post-closure period until the site is accepted as fully closed. 1.10 CAPITAL COST The capital cost estimate encompasses all direct and indirect expenditures, complete with appropriate contingencies for the various facilities required to commence production. It has been developed to align with the requirements of a PFS, encompassing the costs associated with designing, constructing, and commissioning the necessary facilities. The initial capital cost for the Project, as summarized in Table 1.7, is estimated at $288.7 million in US currency. Table 1.7: Initial Capital Cost Summary Description Cost ($000s) DIRECT COSTS General Site Facilities & Mine 31,513 Crushing 11,928 Grinding 21,137 Sulfide Flotation 19,743 Oxide Flotation 9,256 Concentrate Handling 6,842 Tailings Handling 2,772 Tailings Facility 17,651 Reagents 17,322 Water Pipeline 11,649 Utilities 5,444 INDIRECT COSTS |

| PFS Pilot Mountain Tungsten Project – S-K 1300 Technical Report Summary Project No.: 25173-01 Page 23 of 236 Table 1.7: Initial Capital Cost Summary Description Cost ($000s) Contractor Indirects 6,393 Construction Equipment 2,877 Third Party Surveying/Testing - Process 630 Third Party Surveying & QA/QC - TSF 1,103 Construction Camp 12,500 EPCM - Process & Ancillary Facilities 15,156 EPCM - Tailings Facilities 662 Pre-Operational Testing 400 Vendor Reps 327 Process Facilities Spare Parts 1,633 Initial Fills 1,169 Plant Mobile Equipment 2,053 Mine Equipment 1,705 Preproduction Mining 34,315 Freight 5,240 Owner's Cost 9,623 Contingency 37,657 TOTAL INITIAL CAPITAL 288,701 1.11 OPERATING COST The total Life-of-Mine (LOM) operating cost as depicted in Table 1.8 is estimated at $936 million. Figure 1.2 is a graphical representation of the operating cost, split between mining, processing and general and administrative costs. Table 1.8: Project Operating Cost Summary Description LOM Cost ($000s) LOM Cost/tonne Mineralized Material ($) LOM Cost/MTU WO3 ($) Mining 569,318 48.16 357.70 Processing 293,902 24.86 184.66 General & Administrative 73,682 6.23 46.29 LOM Operating Cost 936,902 79.25 588.64 |
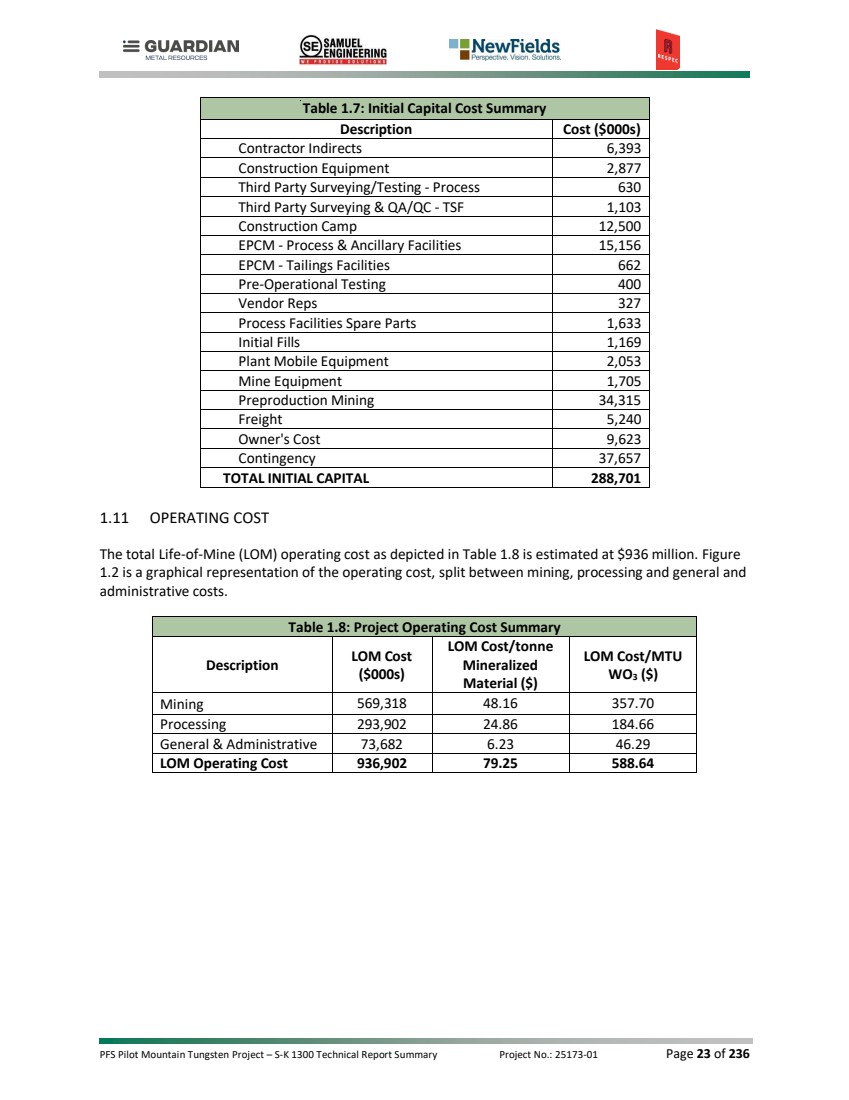
| PFS Pilot Mountain Tungsten Project – S-K 1300 Technical Report Summary Project No.: 25173-01 Page 24 of 236 Figure 1.2: OPEX Split 1.12 FINANCIAL ECONOMICS AND METRICS 1.12.1 Cautionary Statement Certain information and statements contained in this section and in the Report are “forward looking” in nature. Forward-looking statements include, but are not limited to, statements with respect to the economic and study parameters of the Project; Mineral Resource estimates; the cost and timing of any development of the Project; the proposed mine plan and mining methods; dilution and extraction recoveries; processing method and rates and production rates; projected metallurgical recovery rates; infrastructure requirements; capital, operating and sustaining cost estimates; the projected life of mine and other expected attributes of the Project; the net present value (NPV) and internal rate of return (IRR after-tax) and payback period of capital; capital; future metal prices; the timing of the environmental assessment process; changes to the Project configuration that may be requested as a result of stakeholder or government input to the environmental assessment process; government regulations and permitting timelines; estimates of reclamation obligations; requirements for additional capital; environmental risks; and general business and economic conditions. All forward-looking statements in this Report are necessarily based on opinions and estimates made as of the date such statements are made and are subject to important risk factors and uncertainties, many of which cannot be controlled or predicted. Material assumptions regarding forward-looking statements are discussed in this Report, where applicable. In addition to, and subject to, such specific assumptions discussed in more detail elsewhere in this Report, the forward-looking statements in this Report are subject to the following assumptions: • There being no significant disruptions affecting the development and operation of the Project. • The availability of certain consumables and services and the prices for power and other key supplies being approximately consistent with assumptions in the Report. • Labor and materials costs being approximately consistent with the assumptions in the Report. • Permitting and arrangements with stakeholders being consistent with current expectations as outlined in the Report. • All environmental approvals, required permits, licenses and authorizations will be obtained from the relevant governments and other relevant stakeholders. • Certain tax rates, including the allocation of certain tax attributes, being applicable to the Mining 61% Process 31% G & A 8% Operating Cost Split |
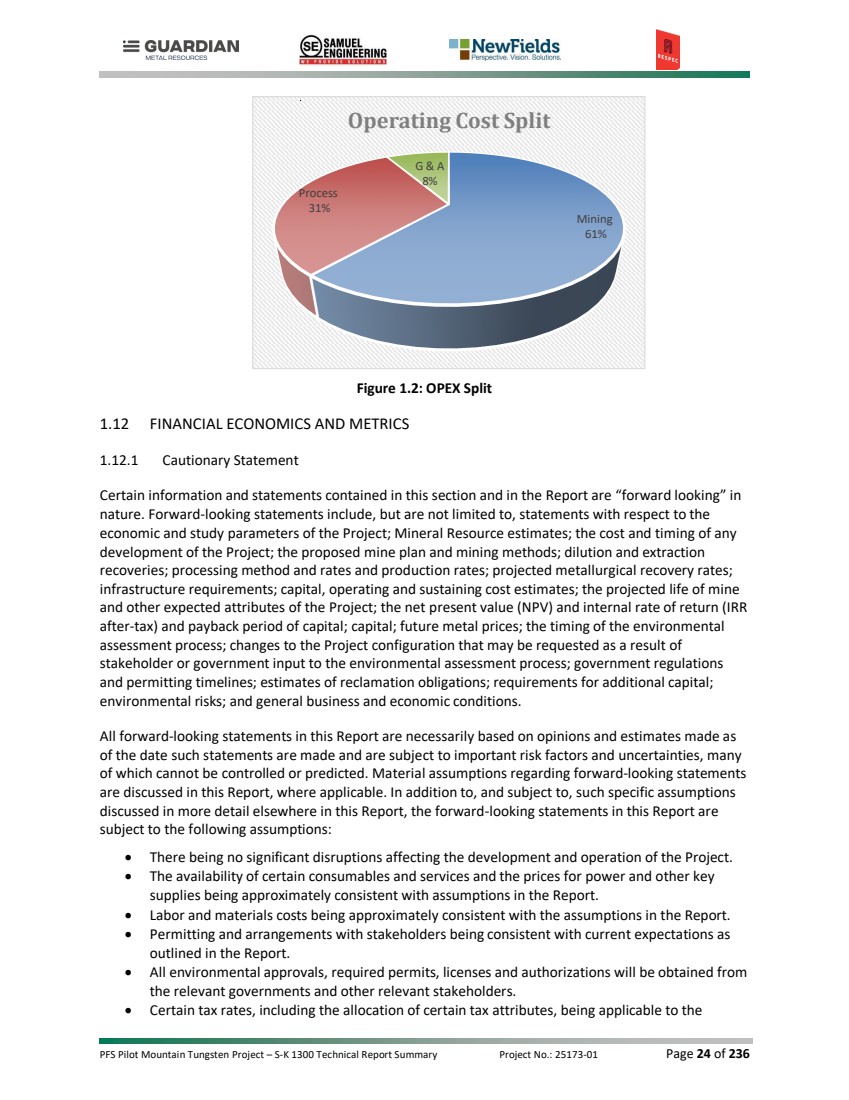
| PFS Pilot Mountain Tungsten Project – S-K 1300 Technical Report Summary Project No.: 25173-01 Page 25 of 236 Project. • The availability of financing for the planned development activities. • The timelines for exploration and development activities on the Project. • Assumptions made in Mineral Resource estimate and the financial analysis based on that estimate, including, but not limited to, geological interpretation, grades, commodity price assumptions, extraction and mining recovery rates, hydrological and hydrogeological assumptions, capital and operating cost estimates, and general marketing, political, business, and economic conditions. The production schedules and financial analysis annualized cash flow table are presented with conceptual years shown. Years shown in these tables are for illustrative purposes only. This PFS supports a Mineral Reserve declaration, with the mine plan and financial analysis based on Probable Mineral Reserves as defined under S-K 1300 standards. The PFS provides a higher level of confidence than previous studies, but like all forward-looking information, there is no guarantee that results, estimates, or projections will be realized as anticipated. 1.12.2 Economics, Pricing and Capex • After-tax NPV8 of US$660.3 million and Project IRR of 59.6%, with a capital payback period of 12 months generating after-tax free cash flow of US$1.058 billion. * • Expected low initial Project capital expenditure ("capex") of US$288.7 million, with sustaining capital of US$33.9 million and closure costs of US$22.3 million. Capex includes 15% contingency (US$37,656,635). • In its first full year of operations, the Project is modelled to generate US$348 million in Earnings Before Interest, Taxes, Depreciation, and Amortization (“EBDITA”) at the base case price of US$197,300 per tonne of WO3. • As of the 12 June 2026 spot price of US$304,000 per tonne, first year EBITDA is modelled to increase to US$569 million, representing an uplift of approximately 64% from the EBITDA base case price. • At the spot price the Project generates after-tax free cash flow of US$2.088 billion with a 101.6% IRR and NPV8 of US$1.366 billion and has a capital payback period of 6 months from first commercial production. • Expected adjusted operating cost of US$54,622 per tonne of WO3 in concentrate (including royalties, transportation, refining along with zinc and silver credits), with a targeted concentrate grade of 60% WO3. *Base case price assumption of US$197,300 per tonne of WO3, representing a 35% discount to the current spot price of approximately US$304,000 per tonne. All prices are for APT with the study assuming a payable factor of 82%. 1.12.3 Economics Summary The results of the economic analysis are further provided in Table 1.9. Table 1.9: Economic Model Results – Base Case Price of $197,300 per tonne WO3 Key Project Indicators Value US$ (000's) Pre Tax Economics IRR 67.8% Cash Flow (Undiscounted) $1,360,773 NPV 8% Discount Rate $856,682 |
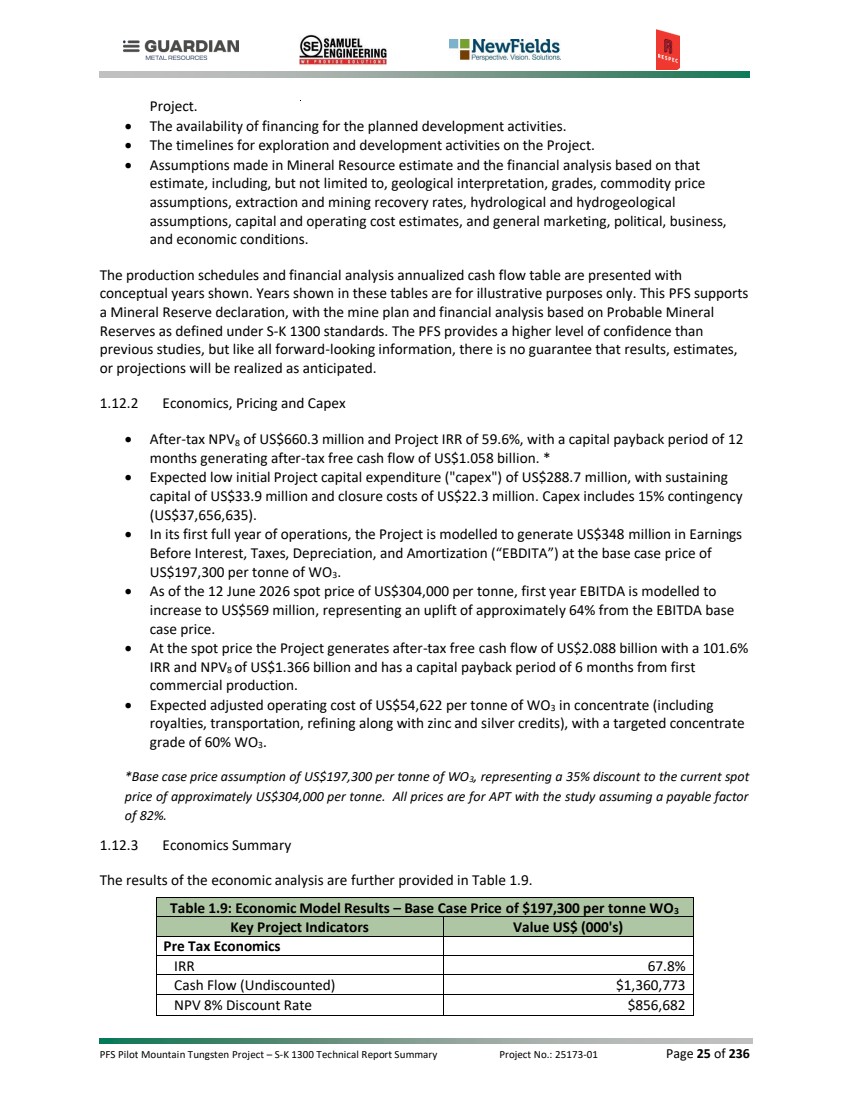
| PFS Pilot Mountain Tungsten Project – S-K 1300 Technical Report Summary Project No.: 25173-01 Page 26 of 236 Table 1.9: Economic Model Results – Base Case Price of $197,300 per tonne WO3 Key Project Indicators Value US$ (000's) 1st 3 Years Net Profit (Avg) $181,372 After Tax Results IRR 59.6% Cash Flow (Undiscounted) $1,058,090 NPV 8% Discount Rate $660,273 Payback (years) 1.0 1.13 OPPORTUNITIES The PFS identified several opportunities that could enhance the Project’s value, reduce risk, or improve operational flexibility during the next phase of study. These opportunities are not required to support the current pre-feasibility case; however, further evaluation could provide upside through resource expansion, improved metallurgical performance, optimized mine design, and refinements to tailings management. The principal opportunities identified for follow-up are summarized below: • Continue exploration across the claim area to test for additional tungsten resources. • Evaluate the Tremor, Gun Metal, and Good Hope areas to determine whether additional mineral resources can be defined. • Assess the relationship between concentrate grade and recovery to identify opportunities to improve tungsten recovery while maintaining a commercially saleable concentrate. • Improve geotechnical understanding of the rock masses forming the pit walls to determine whether pit wall angles can be steepened. • Evaluate a co-mingled tailings storage approach as an alternative to placing sulfide concentrate in a discrete holding cell within the TSF, as this may improve containment, reduce environmental risk, lower costs, and simplify operations. 1.14 RISKS Risk considerations are central to the pre-feasibility assessment, as they help determine whether the proposed project can advance with an acceptable level of uncertainty. This section identifies the key technical, financial, environmental, regulatory, operational, and stakeholder-related risks that could influence project viability, schedule, cost, and decision-making. The list is intended to highlight principle risks specific to this project: • Recovery of very low-grade material • Permitting delays • Staffing • Tungsten price volatility 1.15 RECOMMENDATIONS The Pilot Mountain project should advance to the next stages of design, engineering, and planning. Given its strong projected returns, the urgent need for tungsten, and its compact layout with well-understood environmental impacts, the PFS design should proceed to a Definitive Feasibility Study (DFS) and Front-End Engineering Design (FEED). |

| PFS Pilot Mountain Tungsten Project – S-K 1300 Technical Report Summary Project No.: 25173-01 Page 27 of 236 The PFS design is intended to support the Plan of Operations filing with the BLM, which will describe the project for permitting purposes. Accordingly, the DFS is not expected to require significant additional options analysis or introduce new operating concepts. Instead, the DFS should add engineering detail and increase confidence in the elements defined in the PFS. Further drilling may increase resources and extend mine life, but reserves and the mine plan are expected to remain largely unchanged. During the DFS and before permit submission, the TSF location should be specifically evaluated for optimization. Recent exploration drilling has identified potential resource expansion near the PFS TSF design area, and a more efficient water-diversion design may be possible for the permit application and final designs. Further investigation of this alternative is recommended. The DFS should be completed to SK-1300 standards by qualified specialists, with capital and operating costs estimated to an accuracy of ±15% and contingency of ≤10%. Consistent with SK-1300 guidelines, the study results may support a final decision by a proponent or financial institution to proceed with, or finance, project development. The FEED, recommended in addition to the DFS, will define critical-path activities in greater detail than the DFS and establish the technical and project-specific requirements needed to understand the full project scope. During FEED, initial concepts are developed into a comprehensive plan, including an updated risk and opportunities register. Given the project’s planned 15- to 18-month construction period, detailed planning will be essential. FEED should also define regulatory compliance requirements for construction and operation, incorporate stakeholder engagement, and ensure that engineering and design meet industry standards, regulatory requirements, and client specifications, thereby strengthening quality assurance for the completed project. |

| PFS Pilot Mountain Tungsten Project – S-K 1300 Technical Report Summary Project No.: 25173-01 Page 28 of 236 2.0 INTRODUCTION 2.1 PRE-FEASIBILITY STUDY OVERVIEW Guardian Metal Resources plc (“Guardian Metal” or the “Company”) engaged the services of Samuel Engineering, Inc. (“Samuel”) of Denver, Colorado, in conjunction with RESPEC Company LLC (“RESPEC”) of Reno Nevada, and NewFields Mining Design & Technical Services, LLC (“NewFields”) of Englewood, Colorado to prepare a Technical Report Summary (“TRS” or “Report”) as a Pre-Feasibility Study (PFS) on its Pilot Mountain Tungsten Project (“Pilot Mountain” or the “Project”) located near the town of Mina, Nevada, USA. This Technical Report been prepared in accordance with 17 CFR Part §229.1300 (S-K 1300) Standard Instructions for Regulation S-K subpart 1300 SEC S-K §229.1304 and §229.601(b)(96), and to comply with the disclosure requirements of Subpart 1300 of Regulation S-K, adopted by the U.S. Securities and Exchange Commission (SEC) for mining property disclosure, and is based on the results of the PFS, and updated estimate of mineral resources developed since the last Technical Report (RSI-3732) prepared by RESPEC, dated December 15, 2025. Guardian Metal is a strategic exploration and development company focused on tungsten in Nevada, USA and trades under the symbols NYSE.A: GMTL, LON: GMET, OTCQB: GMTLF, for the purposes of disclosing current updates and information related to its wholly-owned Pilot Mountain tungsten project. The Pilot Mountain Pre-feasibility Study demonstrates the technical and economic viability of the project, supporting the declaration of mineral reserves and providing a basis for future permitting, financing, and development decisions. This study incorporates: • Updated mineral resource and reserve estimates • Engineering and cost estimation • Mine planning and process design • Assessment of infrastructure, logistics, and execution planning • Environmental and closure considerations Previous studies included an initial assessment S-K 1300 TRS for the project prepared in 2025. It provided early-stage technical and economic assessments of the Pilot Mountain Project. This Pre-feasibility Study supersedes this earlier report and incorporates significant advancement in geology, metallurgy, engineering, and environmental planning. Key advancements from the previous TRS include: • Expanded site geological, hydrological, geotechnical, hydrogeological, and geochemical characterization. • Capital and operating cost estimates • Updated Mineral Resource Estimation • Mineral Reserve declaration • Mine design and production schedule • Process flowsheets • Plant layout and infrastructure design • Consideration of mine reclamation and closure This PFS confirms the Pilot Mountain Project's technical and financial viability, supporting the transition to the next stages of permitting, financing, and project development. |
| PFS Pilot Mountain Tungsten Project – S-K 1300 Technical Report Summary Project No.: 25173-01 Page 29 of 236 2.2 TERMS OF REFERENCE The Qualified Persons (QP) have prepared this Technical Report Summary under the assumption that all technical data provided by Guardian Metal Resources through its subsidiary Golden Metal and its consultants were accurate and complete as of the effective date. No significant limitations were imposed on the scope of work, and the QPs exercised professional judgment in all interpretations and conclusions presented herein. 2.3 QUALIFIED PERSONS AND SOURCES OF INFORMATION This Technical Report Summary was prepared by Samuel Engineering Inc. and other consultants in collaboration with Guardian Metal to declare Mineral Reserves for the Pilot Mountain Project. The PFS results and the Pilot Mountain property are material to Guardian Metal Resources and its subsidiary Golden Metal. The conclusions, interpretations, and estimates contained herein are based on: • Information available at the time of preparation, • Data supplied by outside sources, and • Assumptions, conditions, and qualifications outlined in this report. This report is intended to be read as a whole, as individual sections may not fully represent the context of the study. Each QP assumes responsibility only for the specific sections assigned to them, as detailed in Table 2.1 and does not assume liability for sections authored by other QPs. The QPs believe the report complies with 17 CFR Part §229.1300 (S-K 1300) Standard Instructions for Regulation S-K subpart 1300 SEC S-K §229. 1304 and §229.601(b)(96) and meets the requirements of S-K 1300 as considered for a Feasibility Study (FS) level of study and reporting disclosure as defined in the regulations and supporting reference documents. A summary of the QPs, as defined in S-K 1300, and their respective areas of responsibility is provided below in Table 2.1. The QP firms are not employees of, or affiliated with, the Company or any entity that has ownership, royalty, or other interest in the property. Table 2.1: Summary of Qualified Persons Areas of Responsibility QP (QP) Company S-K 1300 Item No. Property Description and Ownership, Project History, Geology, Mineralization, Deposit Types, Exploration, Drilling, Sample Preparation and Data Verification and QA/QC, Resource Estimation Nathan Forsythe, CPG RESPEC 3, 4 (except 4.5), 5, 6, 7, 8, 9, 11 Process, Metallurgy and Testing, Project Infrastructure, Process Operating Cost, Environmental Studies and Permitting, Geochemistry Cameron Wolf, P.E. Samuel 4.5, 10, 14, 15 (except 15.7 and 15.8), 17, 18.2.1, 18.2.2, 21 Mineral Reserve Estimate and Mining Methods, Waste Rock Storage Facility Thomas L. Dyer, P.E. RESPEC 12, 13, 15.7, 18.1.7, 18.2.3 Tailings Storage Facility Adrien Butler, P.E. NewFields 15.8, 18.1.8 |
| PFS Pilot Mountain Tungsten Project – S-K 1300 Technical Report Summary Project No.: 25173-01 Page 30 of 236 Table 2.1: Summary of Qualified Persons Areas of Responsibility QP (QP) Company S-K 1300 Item No. Market Studies, Pricing and Contracts, Adjacent Properties, Process Capital Cost, Economic Analysis Steven Alan Pozder, P.E., MBA Samuel 16, 18.1 (except 18.1.7 and 18.1.8), 19, 20 Information relating to areas of responsibility for Sections All All 1, 2, 22, 23, 24, 25 2.4 PERSONAL INSPECTION In compliance with SEC S-K 1300 disclosure requirements, multiple Qualified Persons have conducted site visits to Pilot Mountain for technical verification. Key site inspections include: • Nathan Forsythe (RESPEC) – July 8 and 9, 2025; conducted field examinations of altered and mineralized rocks, reviewed, core sample handling, processing, and storage protocols at the sample-processing and storage facilities, observed core drilling and discussed QA/QC, logging procedures, and specific gravity (“SG”) measurements with Guardian Metal personnel, and collected confirmation samples for assay. • Adrien Butler (NewFields) – August 13 and 14, 2025. NewFields staff visited several potential sites for the TSF and WRSF, the existing open pit, existing waste dump, existing water supply wells, and the offsite core shed. • Cameron Wolf (Samuel Engineering) – August 13 and 14, 2025; focused on process design and infrastructure. |
| PFS Pilot Mountain Tungsten Project – S-K 1300 Technical Report Summary Project No.: 25173-01 Page 31 of 236 3.0 PROPERTY DESCRIPTION 3.1 LOCATION As shown in Figure 3.1, the Pilot Mountain Tungsten Project’s property is located on the east side of the Pilot Mountains in west-central Nevada, centered at 38°23’9” N, 117°52’26” W. The closest town is Mina, Nevada, located about 19 air kilometers due west of the property, or about 39km via a well-graded gravel road (Figure 3.2). The closest larger town, Hawthorne, Nevada, is located about 68 air kilometers west-northwest of the property. Figure 3.1: Pilot Mountain Tungsten Project Location (RESPEC,2026) |
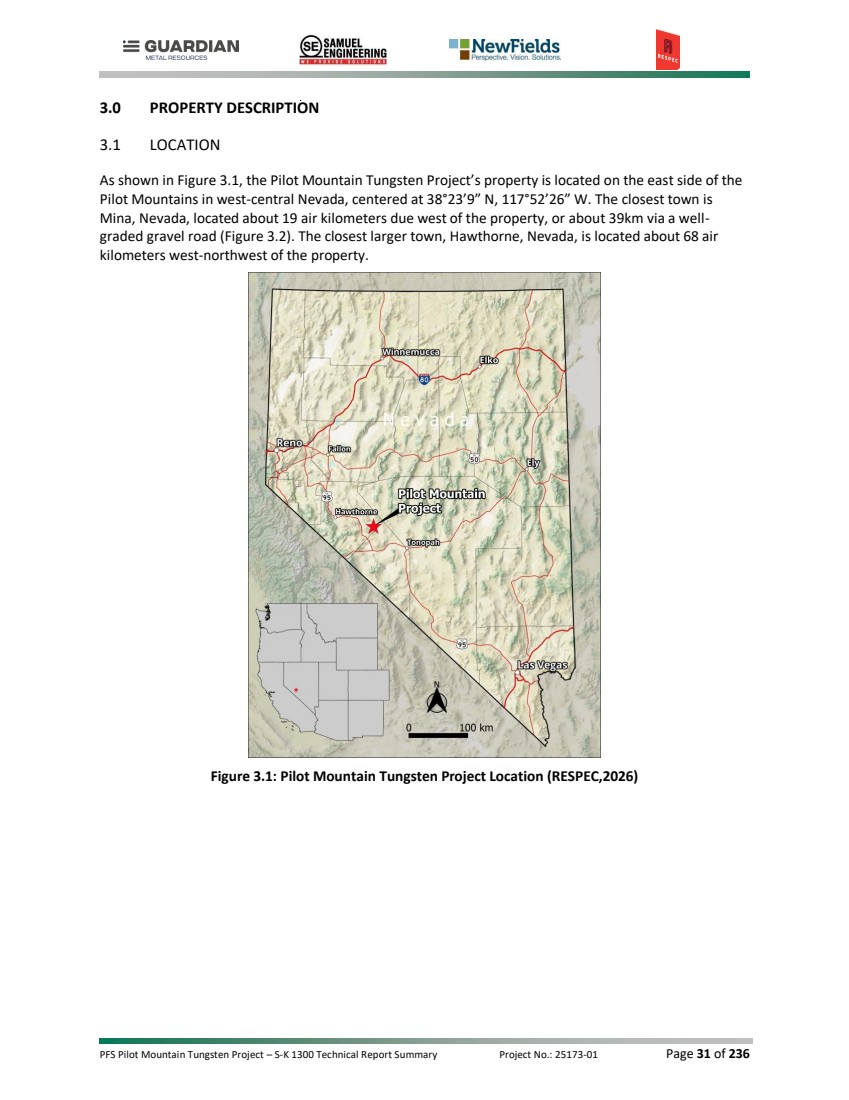
| PFS Pilot Mountain Tungsten Project – S-K 1300 Technical Report Summary Project No.: 25173-01 Page 32 of 236 Figure 3.2: Pilot Mountain Tungsten Project Site Access Route (RESPEC, 2026) As shown in Figure 3.3, the project is located within 2,259.46ha of unpatented lode mining claims and 4 unpatented mill sites covering 8.09ha on public land administered by the BLM in Sections 7 through 9 and 15 through 18, Township 6 North, Range 37 East (T6N, R37E), Mount Diablo Base and Meridian in Mineral County, Nevada. |
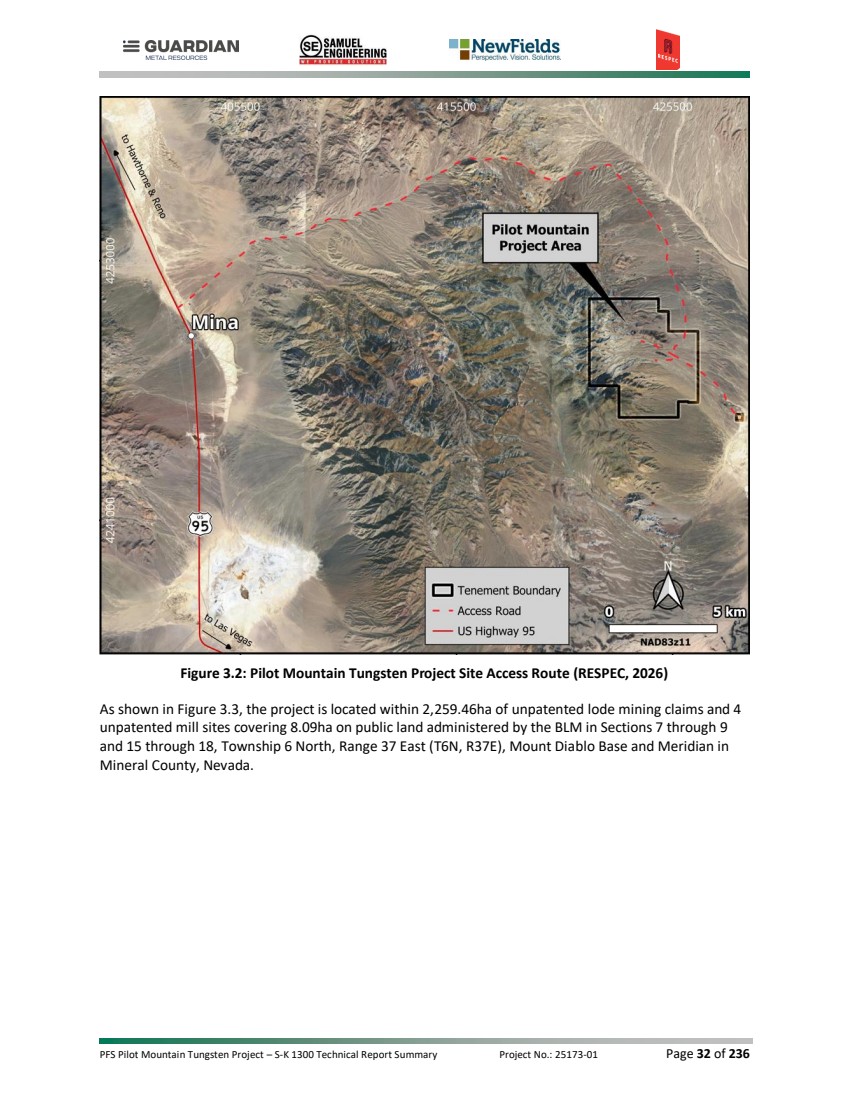
| PFS Pilot Mountain Tungsten Project – S-K 1300 Technical Report Summary Project No.: 25173-01 Page 33 of 236 Figure 3.3: Pilot Mountain Tungsten Project Tenement Map (RESPEC, 2026) 3.2 PROPERTY AND TITLE RESPEC is not an expert regarding land, legal, environmental, social, and permitting matters. For the information presented in this section, they relied entirely on data provided by Guardian Metal Resources and on a report provided by the legal firm of Erwin Thompson Faillers dated June 4, 2026, that describes the record title and status of the unpatented mining claims which are controlled by Guardian Metal Resources and BFM Resources, Inc., a Nevada corporation that is a wholly-owned subsidiary of Guardian Metal Resources. RESPEC has reviewed the information provided by Guardian and Erwin Thompson Faillers and considers the third-party data suitable for use in this Technical Report Summary. The list of claims referenced in Erwin Thompson Faillers’ record title and status report is presented in Appendix B. RESPEC is not aware of any significant factors and/or risks beyond those described in this report that affect access, title, or the right or ability to perform work on the property. All discussion of total claim amounts are correct at the timing of the Erwin Thomas Felders’ report shown in Appendix B. |
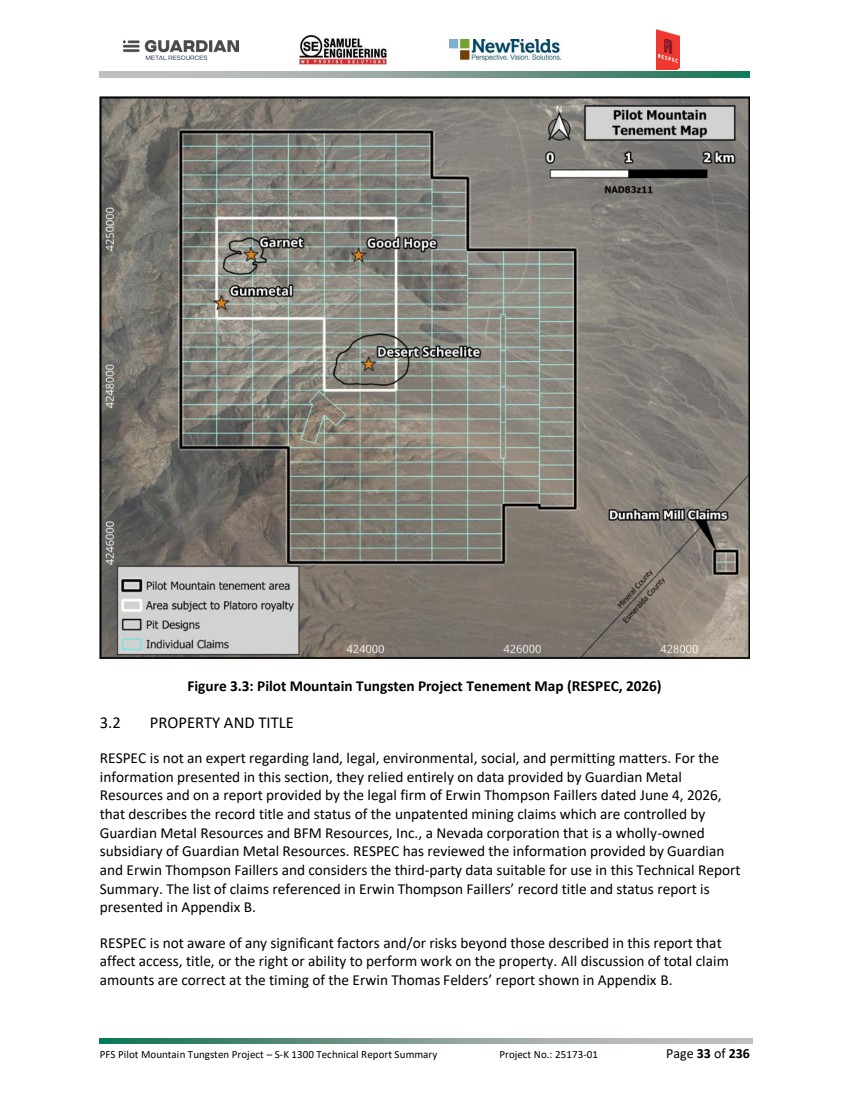
| PFS Pilot Mountain Tungsten Project – S-K 1300 Technical Report Summary Project No.: 25173-01 Page 34 of 236 3.2.1 Property and Title The Pilot Mountain Tungsten project comprises four existing sub-projects all within approximately three kilometers of each other; the Garnet, Good Hope, Gunmetal, and Desert Scheelite, and four Dunham Mill claims that are not contiguous with the rest of the claim block (Figure 3.3). The Project’s exterior boundaries of the land packages, location of deposits and the boundary of the Platoro royalty area are also shown on Figure 3.3. The Pilot Mountain Project is comprised of 287 unpatented claims: 199 unpatented mining claims located by BFM Resources Inc., a wholly owned subsidiary of Guardian Metal Resources, known as the “BFM claims”; four unpatented mill site claims also located by BFM Resources Inc. on the site of the former Dunham Mill claims; 45 unpatented mining claims owned by Pilot Metals Inc. that are known as the “NT claims”; thirty-one (31) unpatented mining claims located by Golden Metal Resources LLC, a wholly owned subsidiary of Guardian Metal Resources, known as “Recently Located BFM Claims”; and eight (8) unpatented mining claims located by Golden Metal Resources LLC, known as the “Recently Located H2O Claims”. 3.2.2 The BFM Claims The Claims include the one hundred and ninety-nine (199) unpatented lode mining claims identified as the BFM 1 through 199 claims situated in Sections 4 through 10 and 15 through 22, T. 6 N., R. 37 E., MDM, in Mineral County, Nevada, which are more particularly described in Exhibit A-1 attached to and by this reference incorporated in this Report (collectively, the “Filed BFM Claims”). 3.2.3 Four Unpatented Mill Site Claims The Claims include the four (4) unpatented mill sites identified as the MS 1 through MS-4 situated in Section 24, T. 6 N., R. 37 E., MDM, in Esmeralda County, Nevada, which are more particularly described in Exhibit A-3 attached to and by this reference incorporated in this Report (collectively, the “MS Mill Sites”). 3.2.4 NT Claims The Claims include the forty-five (45) unpatented lode mining claims identified as the NT #1 through #7, #9 through #22, and #41 through #64 claims situated in Sections 8, 9, and 16, T. 6 N., R. 37 E., MDM, in Mineral County, Nevada, which are more particularly described in Exhibit A-2 attached to and by this reference incorporated in this Report (collectively, the “NT Claims”). 3.2.5 Two Overlapping Claims Two unpatented mining claims located on November 1, 1989, in the southwest quarter of Section 16 and the southeast quarter of Section 17, Township 6 North, Range 37 East, Turquoise Bonanza 4 and Turquoise Bonanza Ex, overlap certain of the BFM claims. These two claims are senior to the BFM Claims. Generally, when two unpatented mining claims conflict (overlap), the senior unpatented mining claim (the first to be located) has the superior title. Guardian Metal has determined that the lands within the Turquoise Bonanza 4 and Turquoise Bonanza Ex are not material to the Pilot Mountain Project. |
| PFS Pilot Mountain Tungsten Project – S-K 1300 Technical Report Summary Project No.: 25173-01 Page 35 of 236 3.2.6 Recently Located BFM Claims The Claims include the thirty-one (31) unpatented lode mining claims identified as the BFM 200 through 230 claims situated in Sections 10, 15, and 22, T. 6 N., R. 37 E., MDM, in Mineral County, Nevada, which are more particularly described in Exhibit A-4 attached to and by this reference incorporated in this Report (collectively, the “Recently Located BFM Claims”). 3.2.7 Recently Located H2O Claims The Claims include the eight (8) unpatented lode mining claims identified as H2O 1 through 6, 8, and 9 claims situated in Section 5, T. 7 N., R. 38 E., and Section 32, T. 8 N., R. 38 E., MDM, in Mineral County, Nevada, which are more particularly described in Exhibit A-6 attached to and by this reference incorporated in this Report (collectively, the “Recently Located H2O Claims”). The Company recently drilled RC exploration holes on these claims (See Figure 3.4). |

| PFS Pilot Mountain Tungsten Project – S-K 1300 Technical Report Summary Project No.: 25173-01 Page 36 of 236 Figure 3.4: Regional Claims Map 3.3 OWNERSHIP Ownership of unpatented mining claims is in the name of the holder (locator), subject to the paramount title of the United States of America, under the administration of the BLM. Under the Mining Law of 1872, which governs the location of unpatented mining claims on federal lands, the holder has the right to explore, develop, and mine minerals on unpatented mining claims without payments of production royalties to the United States Government, subject to the surface management regulation of the BLM and all other applicable state and federal environmental regulations. 3.4 ROYALTIES AND RETENTIONS 3.4.1 BFM Claims and Mill Site Claims There are no royalties associated with the 199 BFM claims and the four unpatented mill site claims. |
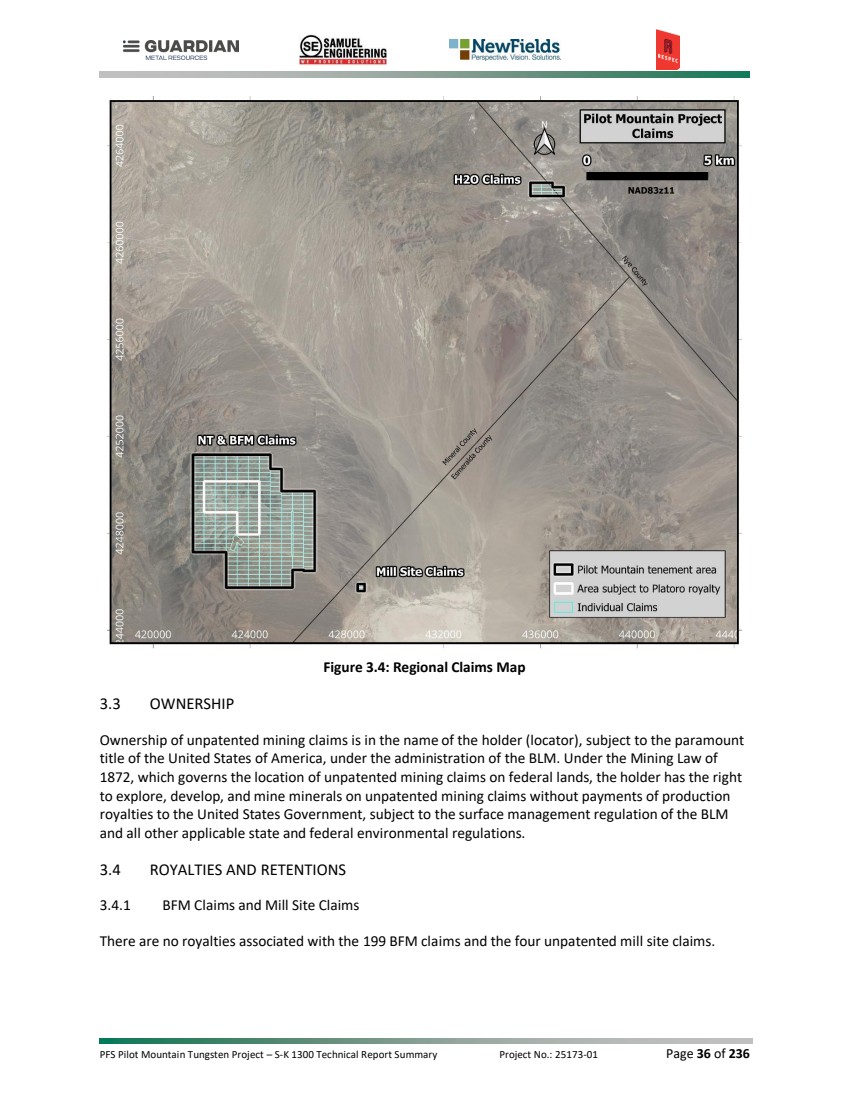
| PFS Pilot Mountain Tungsten Project – S-K 1300 Technical Report Summary Project No.: 25173-01 Page 37 of 236 3.4.2 NT Claims Third parties control a royalty of 2% of the gross revenues from the production and sale of minerals from the 45 NT Claims (Platoro Royalty). As shown on the map above, the royalty applies to the area of the current resources and reserves. 3.5 BACK-IN RIGHTS There are no back-in rights. |

| PFS Pilot Mountain Tungsten Project – S-K 1300 Technical Report Summary Project No.: 25173-01 Page 38 of 236 4.0 ACCESSIBILITY, CLIMATE, LOCAL RESOURCES, INFRASTRUCTURE AND PHYSIOGRAPHY 4.1 ACCESSIBILITY The Pilot Mountain Tungsten Project is in a sparsely populated area characterized by gently rolling topography that hosts ranching and mining activities. The site is approximately 260 road kilometers southeast of Reno, 146 km southeast of Yerington, and 113 km northwest of Tonopah via road. Hawthorne, the nearest large town, is approximately 89 road kilometers to the west of the project area on U.S. Highway 95 (Figure 3.1 and Figure 3.2). The closest railhead is in the much smaller town of Mina about 39 road kilometers west of the project area via a well-maintained gravel road. 4.2 CLIMATE AND LENGTH OF OPERATING SEASON The climate at the Pilot Mountain Tungsten Project is arid, with average summer maximums around 35°C and winter minimums around -7°C (data for Hawthorne). The average annual precipitation is approximately 25cm and tends to peak in May [Western Regional Climate Center, 2013]. Neither exploration, nor mine construction, nor mine operations are likely to be significantly impacted by weather at seasonal extremes. 4.3 LOCAL RESOURCES AND INFRASTRUCTURE Yerington, with a population of approximately 4,000, and Tonopah, with a population of approximately 1,900, serve as a regional support hub with a major airport and well-developed infrastructure and services that support the surrounding mining industry. Yerington, Tonopah, and Reno can supply sufficient skilled labor for the project. Nevada offers a strong mining infrastructure and access to skilled personnel and suppliers. 4.4 TOPOGRAPHY, ELEVATION AND VEGETATION The site lies on the lower eastern slope of the Pilot Mountains, northeast of Pilot Peak, in Mineral County, Nevada. Site elevations range from ~1,830 to ~2,290 m above sea level. Steeper topography on the west side of the property provides good exposure of geology, while to the east and northeast, alluvial cover surrounds isolated hills of black basalt. The site is sparsely vegetated, mostly by sagebrush, rabbitbrush and associated vegetation (Figure 4.1). At higher elevations on the west side of the property, pinyon and juniper trees are present. Despite steeper slopes in some areas, roads constructed for drill rig access have been established across much of the site. |

| PFS Pilot Mountain Tungsten Project – S-K 1300 Technical Report Summary Project No.: 25173-01 Page 39 of 236 Figure 4.1: Desert Scheelite Test Pit in July 2025, Looking West, Showing Steeply Dipping Garnet Skarn (Brown) in Contact with Quartz Monzonite (White). 4.5 AVAILABILITY OF AREA FOR MINE AND PROCESSING FACILITIES 4.5.1 Water and Site Access Local groundwater is sufficient to support current exploration activities. However, a 28 km water pipeline and pumping system will be constructed to meet the plant’s process water needs. Site access road meets current requirements but it may need to be upgraded during full production. 4.5.2 Power An existing 120 kV, Nevada Energy power utility line located south of the Project’s property boundary will provide the Point of Interconnection (POI) for a new 16 km, 120 kV single-circuit, overhead transmission line that will supply power to a new 120 kV /13.8 kV substation at the project site. |
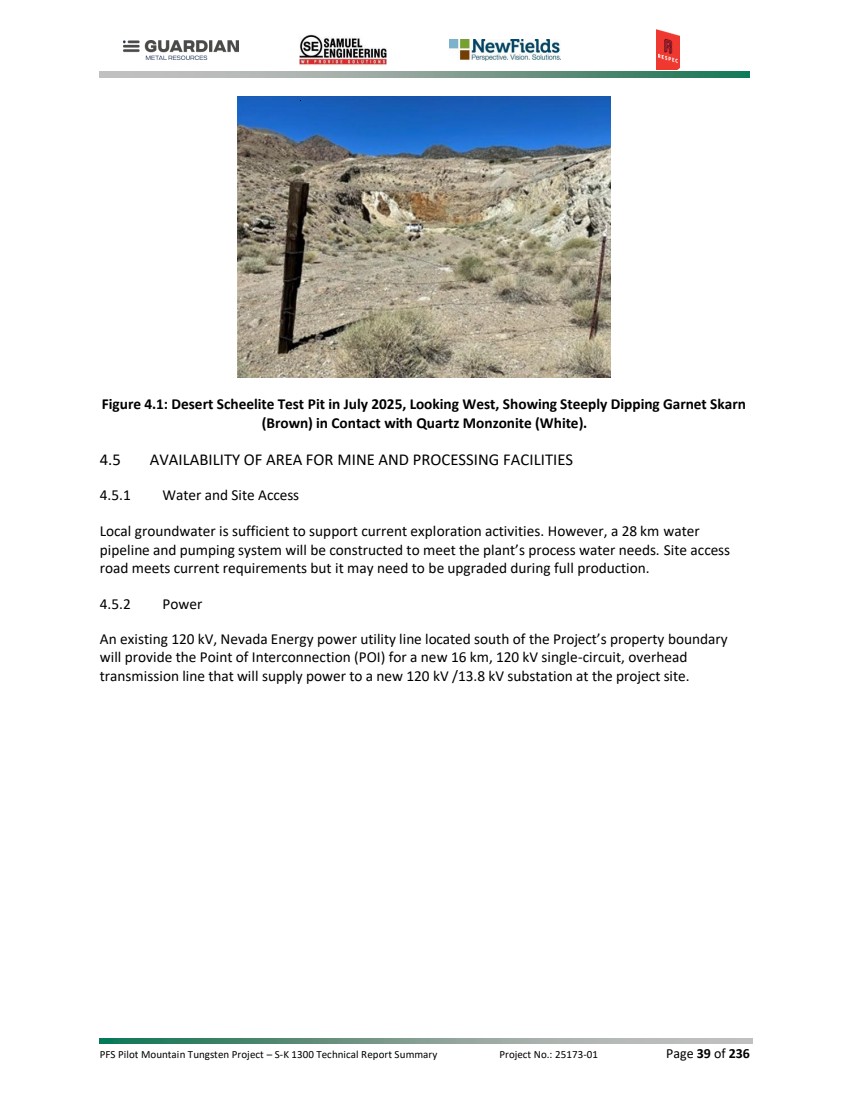
| PFS Pilot Mountain Tungsten Project – S-K 1300 Technical Report Summary Project No.: 25173-01 Page 40 of 236 5.0 HISTORY The Pilot Mountain Tungsten Project has been subject to exploration activities since the early twentieth century, resulting in a substantial body of geological, geophysical, and drilling data. Despite this history of exploration, only limited production has been recorded. The sub-sections below provide a summary of past work and production history recorded at the Pilot Mountain Tungsten Project. Table 5.1 summarizes the drilling that historical operators and others completed at the Pilot Mountain Project from 1968-2017. Table 5.1: Summary of Historical Drilling by Operator and Others Company Years Total Holes Type Total (m) Hecla Mining 1968 16 Percussion 1,652 Duval 1970-1977 66 Core, Percussion, Unknown 12,587 Grace 1975 5 Unknown 728 Union Carbide 1978-1980 185 Core, Rotary, Unknown 23,234 Black Fire 2011-2012 15 Core 3,047 Thor Mining 2017 9 RC 953 Total 296 42,073 5.1 PROPERTY HISTORY 5.1.1 Exploration – 1900 - 1978 Scheelite was first discovered on the east flank of the Pilot Mountains in 1916 [Ross, 1961]. The discovery, as well as the discoveries of other similar skarn deposits in Nevada and California, directly resulted from a prospecting wave stimulated by high tungsten prices and the opening of several tungsten mills in the Bishop district in California [Hess and Larson, 1921]. Reportedly, several properties were developed at this time in the Pilot Mountains. However, none of them recorded any production. In 1921, Hess and Larson of the United States Geological Survey (“USGS”) inspected the district. They recognized the association of scheelite with the Gunmetal stock, mapped the location of tactites relative to the general outline of the stock, and identified three types of mineralization on the property: tactite, quartz-calcite-scheelite veins, and clots of quartz, calcite, silver-bearing galena, and scheelite. Hess and Larson considered the tactite mineralization to be the only type with significant tonnage potential. They examined the Gunmetal Adit on the northeast contact of the monzonite stock and reported a crushed zone along the stock contact with a "rather regular, nearly vertical vein which has slickensided walls and is from a few inches to three feet across, made up mostly of quartz, calcium-iron carbonate, and carrying some apatite, which is in part, at least, high grade scheelite ore" [Hess and Larson, 1921]. The adit followed this zone for about 185 feet. Hess and Larson observed grades up to 1% WO3 along this contact. Kerr [1946] reported that additional underground development work at the Gunmetal location had been disappointing. A long, crosscut tunnel that was driven through granite porphyry to intersect a projected tactite zone on the other side encountered only barren marble. Kerr also noted an association of quartz with higher-grade scheelite and the presence of quartz concentrations in the form of irregular, vertical, chimney-like masses, both within the granite porphyry and around its margins. |
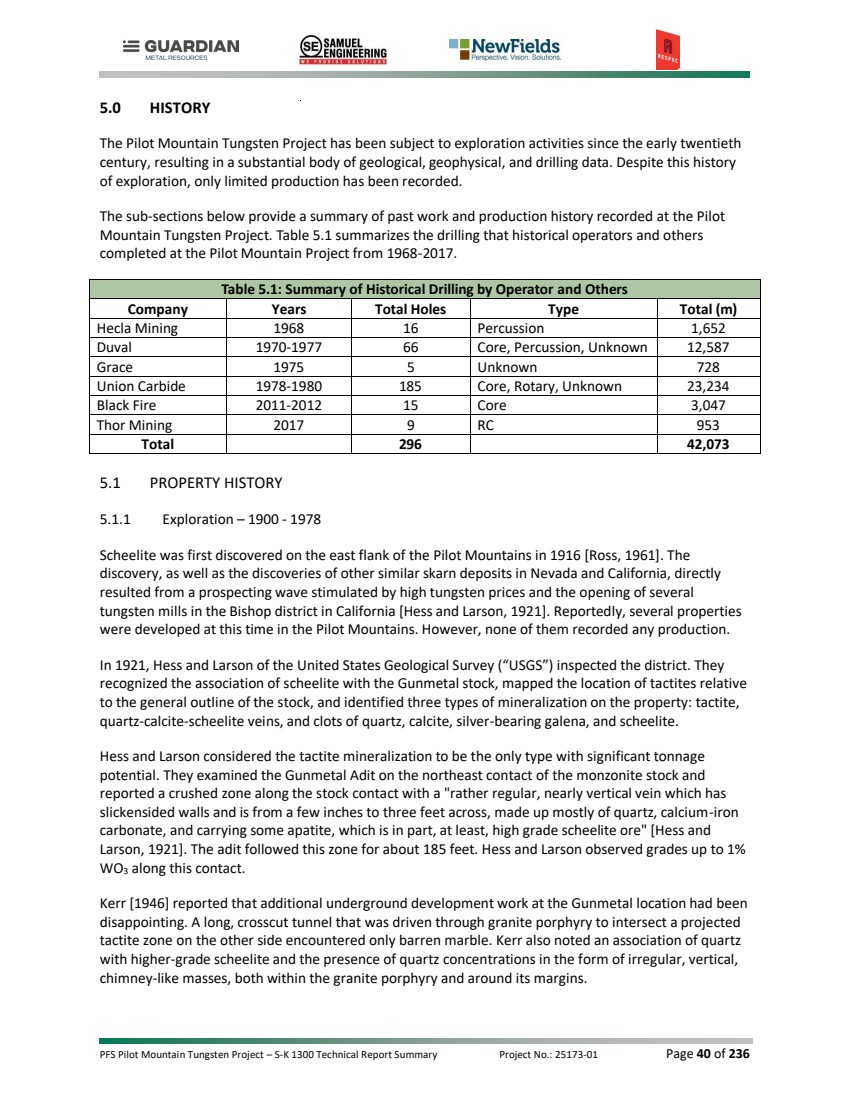
| PFS Pilot Mountain Tungsten Project – S-K 1300 Technical Report Summary Project No.: 25173-01 Page 41 of 236 Union Carbide Corporation (“UCC”) internal reports for the Garnet mine recorded a small production of 130 short tons through 1943 but presented no figures for Gunmetal. In 1952, Kenneth W. Dunham reopened the old Gunmetal Mine. UCC internal reports report approximately 15,378 short tons produced from Gunmetal between 1952-1956. Hecla Mining (“Hecla”) began exploring the Pilot Mountain property in 1968. To test porphyry Cu-Mo targets, Hecla drilled approximately 1,652m in 16 percussion holes between the Good Hope and Desert Scheelite zones and drilled several holes into tactite at Desert Scheelite. Hecla dropped the property after the drilling campaign. Duval Corporation (“Duval") leased the Desert Scheelite and Gunmetal properties in 1969. They completed ground magnetic and IP surveys. In 1970, Duval drilled four core holes totaling ~1,420m into an anomalous IP target south of Good Hope hoping to hit porphyry Cu-Mo mineralization. The holes only intersected weakly mineralized Cu-Mo quartz veins. Duval continued drilling in 1971 and encountered Cu-W mineralization in sulfide-rich tactite northeast of Desert Scheelite. In 1972 and 1973, they drilled seven additional core and percussion holes at Desert Scheelite. In 1975, W. R. Grace (“Grace") obtained a lease-option agreement on the property and drilled five angled drill holes, totaling about 728m, directed at the down-dip extension of the Desert Scheelite deposit. The program confirmed the width of the steeply dipping mineralization at Desert Scheelite, which had previously only been intersected in vertical drill holes. Grace did not exercise its option on the property. Duval continued exploration until 1977, when UCC optioned the property. UCC sampling programs in the underground exposures of the Gunmetal Mine averaged between 0.40 and 0.50% WO3. UCC evaluated the Duval geophysical and drilling data and initiated a ground magnetic survey and a drilling program to evaluate the property further. After their drilling intersected scheelite mineralization in both an extension of the Desert Scheelite and in the Middle Gunmetal/South Contact areas, UCC exercised their option to purchase Duval's interest in December 1978. UCC completed mining feasibility studies on the property and conducted trial mining on the Desert Scheelite deposit through a 70,000-tonne bulk sampling exercise. Low tungsten prices halted their activities. 5.1.2 EXPLORATION - 2011-2021 Black Fire Minerals Ltd. (“Black Fire”) acquired an option on the property in September 2011 and completed a 15-hole drilling program designed to verify historical assay data. This program’s results supported the preparation of an initial mineral resource estimate for the Desert Scheelite deposit in 2012. Thor Mining PLC (“Thor”) acquired an interest in the property in 2014 and initiated a comprehensive exploration program that included a detailed review of archival data generated by UCC. In 2017, Thor completed nine holes targeting copper-silver mineralization within the Desert Scheelite and Garnet deposits. |
| PFS Pilot Mountain Tungsten Project – S-K 1300 Technical Report Summary Project No.: 25173-01 Page 42 of 236 5.2 HISTORICAL MINERAL RESOURCE ESTIMATES In 2012, Black Fire commissioned the first modern mineral resource estimate for the Desert Scheelite deposit. That estimate, prepared in accordance with the JORC (2004) Code, outlined tungsten resources with copper and silver credits. Following additional drilling and project advancement, Thor Mining updated the resource estimate in 2018. The revised estimate reported 10.7 million tonnes at 0.26% WO₃, 19.4 g/t Ag, 0.15% Cu, and 0.38% Zn above a 0.15% WO₃ cut‑off, with the majority classified as indicated resources. The 2018 update incorporated zinc into the resource inventory for the first time, which added a potential by‑product stream to the project [RES, 2018]. The reader is cautioned not to treat the mineral resources estimate discussed above, or any part of them, as current mineral resources or mineral reserves. A qualified person has not done sufficient work to classify these historical estimates as current mineral resources or mineral reserves. Neither RESPEC nor Guardian Metal is treating these historical estimates as current estimates. The historical mineral resource estimate discussed above is relevant only for historical completeness. RESPEC did not rely on any of the previous resource estimates in preparing the current work. The mineral resources reported in Section 11.0 of this technical report summary supersede Thor’s 2018 estimate and are the Desert Scheelite deposit’s only current mineral resources. The Company completed a mineral resource estimate announced on December 19, 2025. Table 5.2: Desert Scheelite Mineral Resources Mineral Resource Classification Cut-off Grade Tonnes Average Grade Contained Metal % WO3 WO3 (%) Ag (g/t) Cu (%) Zn (%) WO3 (t) Ag (oz) Cu (t) Zn (t) Indicated 0.06 8,694,000 0.206 12.43 0.085 0.315 17,900 3,475,000 7,400 27,400 Inferred 0.06 1,784,000 0.169 12.00 0.063 0.225 3,000 689,000 1,100 4,000 Notes: 1. The effective date of Desert Scheelite Mineral Resource statement is December 1, 2025. 2. Mineral Resource stated in metric tonnes. 3. Average grades of the tabulations are comprised of the weighted average of block-diluted grades within an optimised pit. 4. The Desert Scheelite Mineral Resource cut-off grade of 0.06% WO₃ was selected by the authors. Operating assumptions were applied to establish a theoretical pit limit, including a WO₃ price of $65,500/t, an average recovery of 80% WO₃, a processing rate of 4,000 tonnes/day, $2.75/t mining cost for open pit, $15.64/t processing cost, $3.00/t processed for G&A, and an 83% payability. Blocks outside the pit limit are not considered to be economic at this time. 5. The accessory metals Ag, Cu, and Zn shown in this table are the quantities contained within the mineral resources using the cut-off grade established for the primary commodity (WO3). No independent cut-off grade has been applied to these accessory metals. Reported quantities of accessory metals are therefore considered by-products of the primary metal resource and their value is contingent upon the ability to economically extract the by-products along with the primary commodity. 6. The estimate of mineral resources may be materially affected by geology, environmental, permitting, legal, title, taxation, sociopolitical, marketing, or other relevant issues. 7. Rounding as required by reporting guidelines may result in apparent discrepancies between tonnes, grade, and contained metal content. 8. Mineral Resources are not Mineral Reserves and do not have demonstrated economic viability. An Inferred Mineral Resource has a lower level of confidence than an Indicated Mineral Resource and must not be converted to a Mineral Reserve. RESPEC reasonably expects that continued exploration and delineation will upgrade the majority of Inferred Mineral Resources to Indicated Mineral Resources. |
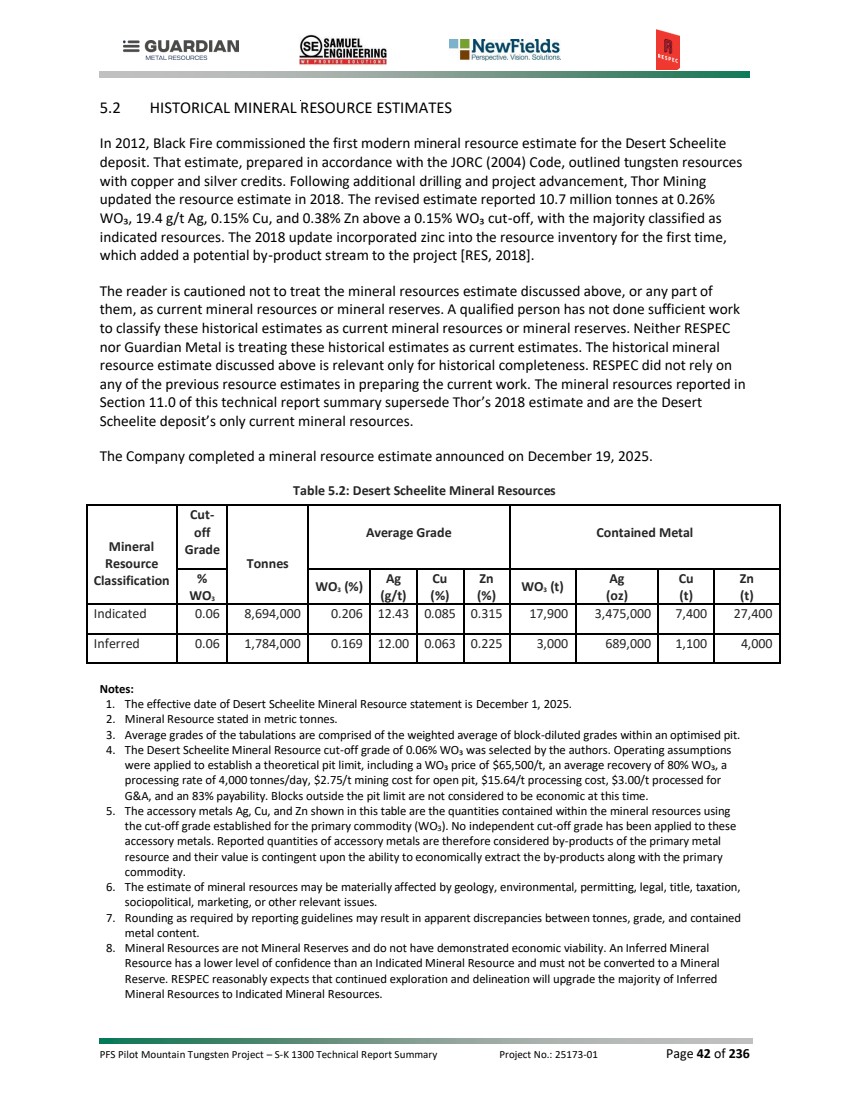
| PFS Pilot Mountain Tungsten Project – S-K 1300 Technical Report Summary Project No.: 25173-01 Page 43 of 236 6.0 GEOLOGICAL SETTING, MINERALIZATION, AND DEPOSIT 6.1 GEOLOGICAL SETTING The geology and geologic setting of the Pilot Mountain property were originally described in Union Carbide’s Pilot Mountain Project Geologic Setting and Field Trip Guide prepared by D. E. Grabher [1984], which is the primary source for much of the following information. RESPEC has reviewed it and other sources and considers the information they present to be a materially accurate summary of the geology and mineralization of the Pilot Mountain property as presently understood. 6.1.1 Regional Geology The Pilot Mountain property lies within the central Walker Lane structural belt of western Nevada, a northwest‑trending zone of strike‑slip faulting, extensional basins, and associated magmatism that accommodates a significant portion of the displacement between the Pacific and North American tectonic plates. The Walker Lane is interpreted as an incipient transform boundary, with deformation expressed through complex fault networks, localized subsidence, and magmatic intrusions that have influenced mineralization patterns across the belt and most directly influences the current geographic expressions of rock units [Wesnousky, 2005; Faulds and Henry, 2008]. The oldest rocks in the Pilot Mountains are Permian to Jurassic in age and were deposited in back-arc basins related to remnant oceanic arcs and the initiation of the Sierra Nevada arc in the Triassic [Dickinson, 2006]. Subsequent closure of the back-arc basin in the Jurassic resulted in compressional deformation, known as the Luning-Fencemaker thrust. This orogenic even is expressed in the Pilot Mountains as the Luning allochthon, a thrust‑stack containing up to thirteen nappes, each generally composed of a single lithologic unit. These thrust sheets contain rocks of the Permian Mina formation, Triassic Luning formation and Jurassic Dunlap formation. These units vary from dominantly calcareous to sequences dominated by siltstones sandstones and conglomerates [Grabher, 1984; Oldow, 1981]. Geologists interpret the age of thrusting as lying between post‑late Early Jurassic (~175Ma) and Late Cretaceous (~68.7Ma) [Grabher, 1984; Speed, 1977] During the Early to Middle Jurassic, orogenesis and erosion resulted in quartzose sandstones and other clastic rocks being deposited unconformably over older sediments. Additionally, volcanic material becomes progressively more abundant within the Jurassic successions, indicating that magmatism intensified in response to ongoing arc magmatism. Regionally, back-arc satellite plutons of the Jurassic, and Cretaceous to Tertiary plutons related to shallowing and subsequent rollback of the Farallon plate were emplaced into the sedimentary rock package. Skarn mineralization is variably associated with these intrusions. In the Middle to Upper Tertiary, widespread felsic to intermediate volcanic rocks were deposited across the region. These volcanic units outcrop extensively and locally host precious‑metal mineralization outside the Pilot Mountain project area. Later tectonic activity in the region is primarily expressed as northwest‑trending right‑lateral trans-tensional faulting associated with the Walker Lane belt. This deformation overprints and offsets earlier structures. Within 50 kilometers to the northeast of the Pilot Mountains, Tertiary faulting transitions to classic Basin and Range extension |
| PFS Pilot Mountain Tungsten Project – S-K 1300 Technical Report Summary Project No.: 25173-01 Page 44 of 236 6.1.2 Property Geology The Pilot Mountain project area is underlain by a thick succession of Permian to Jurassic sedimentary and volcanic rocks locally intruded by Cretaceous granitic stocks, dykes, and sills. Overlying these rocks and around the margins of the project are a series of Tertiary volcanic units. Pre-Tertiary rocks have been complexly deformed by thrust faulting and have a combined stratigraphic thickness that exceeds 6,000 m. The oldest unit exposed is the Permian Mina Formation, a thick accumulation of marine turbidites, chert, and volcanogenic tuffaceous strata. South of the Desert Scheelite resource area, the Permian Mina Formation is prominently exposed in high cliffs across a major east-west trending fault scarp. The Mina is stratigraphically overlain by the Triassic Luning Formation, the principal host of mineralization on the property. Although no continuous stratigraphic section is preserved locally, the Luning is at least 2,300 m thick in its type locality and is subdivided into lower, middle, and upper members (Oldow, 1981). • The lower Luning member, which hosts mineralization at Desert Scheelite, is ~800m thick and composed of ~60% clastic rocks and ~40% carbonates. Lithologies include fine‑grained crystalline limestone and bioclastic carbonate (calcarenite) beds ranging from centimeters up to 30 m thick. • The middle Luning member crops out in thicknesses of 100–450 m but can be up to 900 m thick regionally (Oldow, 1981). The unit is dominated by siliciclastic facies, ranging from conglomerates to sandstones (arenites and wackes) and shales, but locally can contain minor limestone. It forms gradational contact with the lower member. • The upper Luning member, which hosts mineralization in the Gunmetal–Garnet areas, is composed of ~80% limestone and ~20% fine‑grained clastic rocks. Massive calcarenite beds up to 5 m-thick cyclically alternate with dark colored laminated micritic limestone, limey mudstone, and sandy mudstone up to 10 m thick. The Lower Jurassic Dunlap Formation stratigraphically overlies the Luning formation but only occurs in fault contact inside the property boundary, where it instead unconformably overlies the Mina formation. with disconformable contact and locally the Dunlap is exposed along the southwestern edge of the property. It is ~1,500 m thick in the central Pilot Mountains and records both subaerial and submarine depositional environments. Lithologies include sandstone, siltstone, shale, conglomerate, and minor bioclastic limestone and tuff. Intrusion of a Jurassic Cretaceous biotite quartz monzonite stock produced contact metamorphism, converting adjacent carbonate rocks to marble and pelitic clastic rocks to hornfels. Skarn and calc‑silicate alteration, formed locally by metasomatic processes within marble and calcareous metaclastic units, occurred during the latter phases of emplacement. Evidence of metamorphism extends up to 300 m laterally from the northern contact of the stock, although significant mineralization in the modeled resource area is largely confined to within ~90 m of the contact. Near the intruding quartz monzonite stocks, large areas of the Luning Formation’s carbonate section have undergone recrystallization accompanied by bleaching. These effects have obscured original sedimentary structures and fossil remains. The degree of recrystallization varies from bed to bed, with some units becoming very coarsely crystalline. The southern contact of the stock is concealed beneath Quaternary alluvium and sheetwash deposits [Golder, 2012]. |
| PFS Pilot Mountain Tungsten Project – S-K 1300 Technical Report Summary Project No.: 25173-01 Page 45 of 236 Figure 6.1: Property Geology of the Pilot Mountain Tungsten Project |
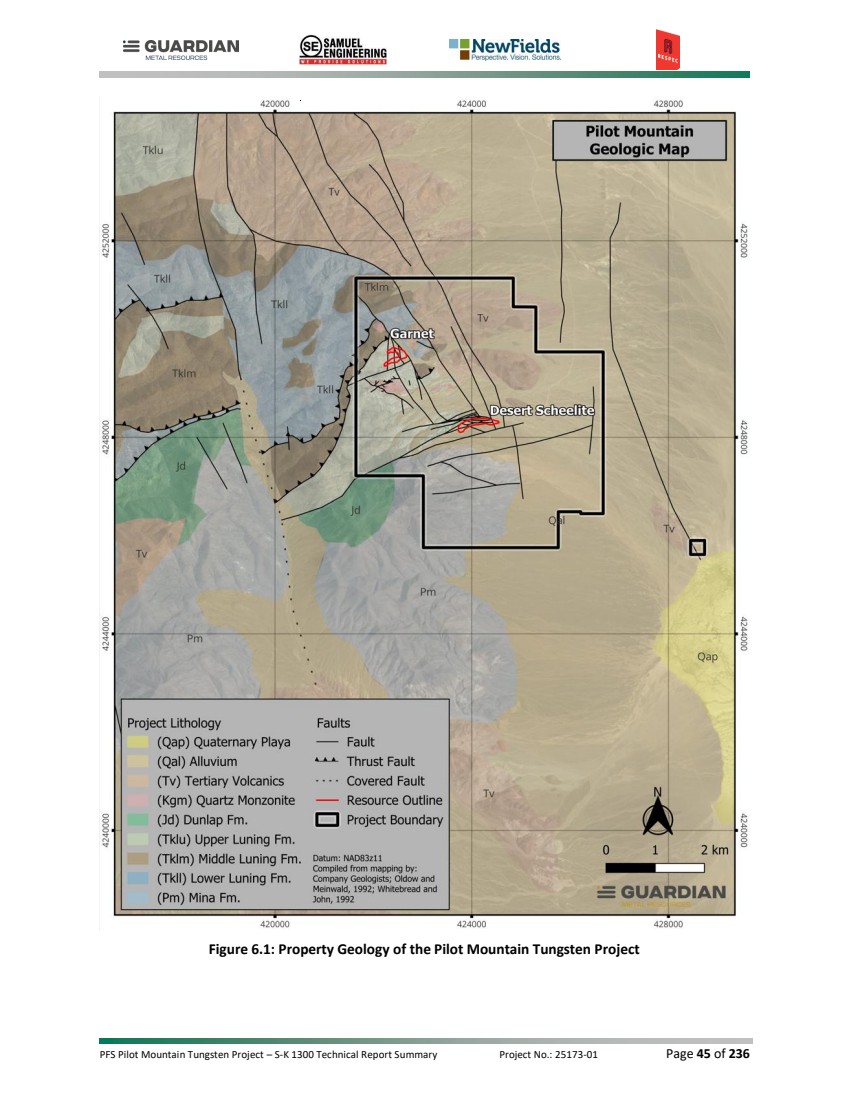
| PFS Pilot Mountain Tungsten Project – S-K 1300 Technical Report Summary Project No.: 25173-01 Page 46 of 236 Figure 6.2: Desert Scheelite North-South Cross-Section 424305E Showing Tungsten Mineral Domain and Geology. |
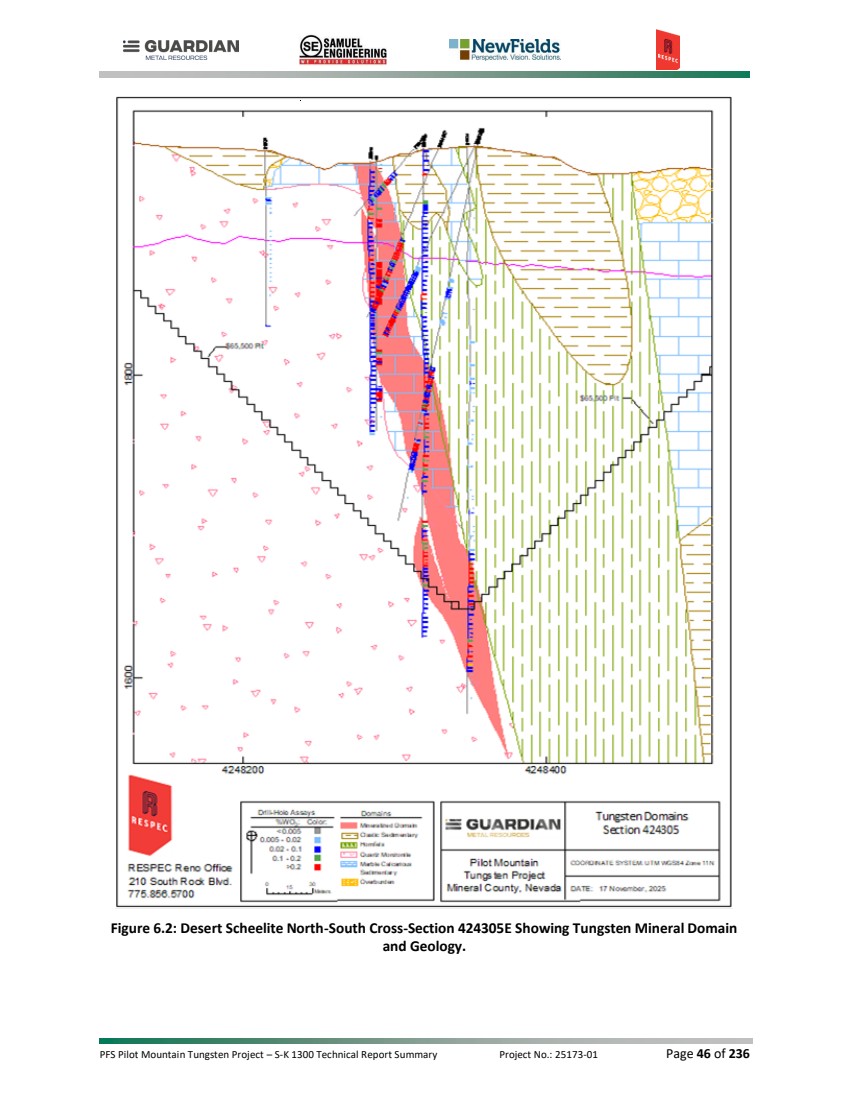
| PFS Pilot Mountain Tungsten Project – S-K 1300 Technical Report Summary Project No.: 25173-01 Page 47 of 236 Figure 6.3: Generalized Stratigraphic Column for the Pilot Mountain Tungsten Project. |
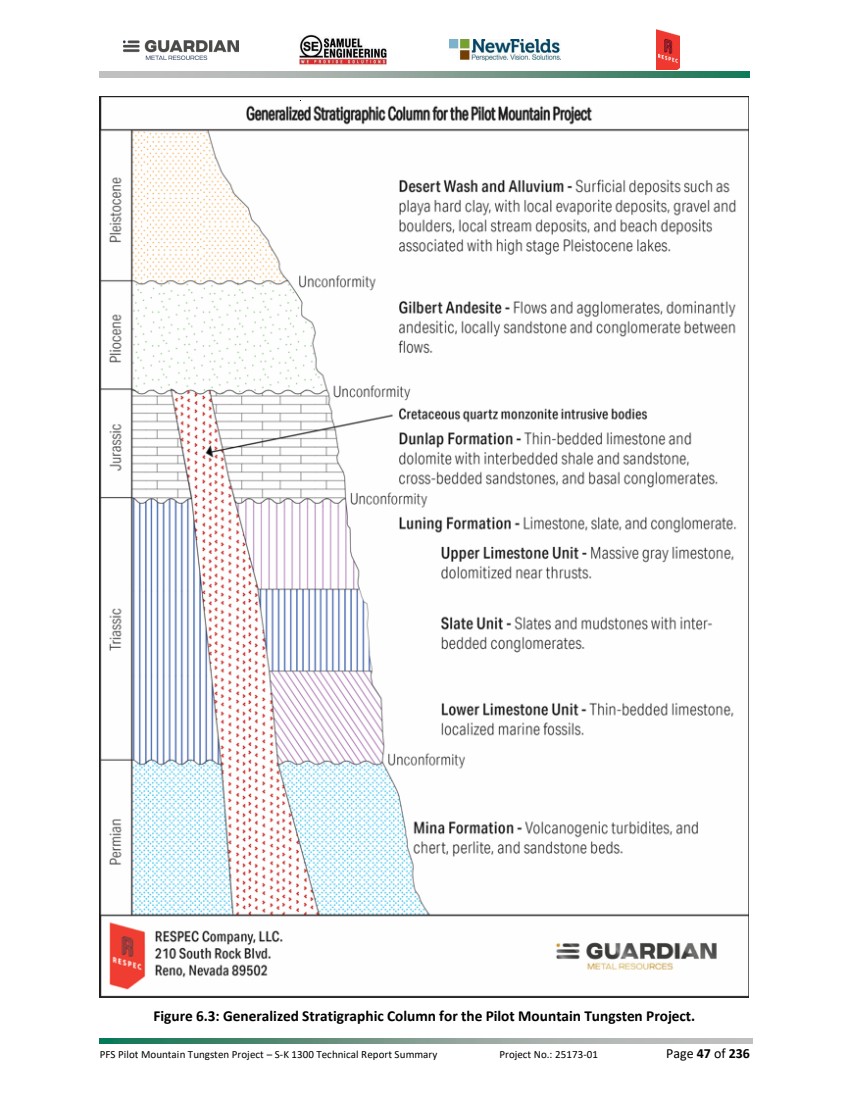
| PFS Pilot Mountain Tungsten Project – S-K 1300 Technical Report Summary Project No.: 25173-01 Page 48 of 236 Calc‑silicate alteration of marbles, and conversion of mixed calcareous–argillaceous and marly sediments to calc‑silicate hornfels is widespread. The character of the altered rock depends largely on the original composition and degree of, metasomatism versus isocheimal metamorphism. though metasomatic processes may also have contributed. Thin diopside–feldspar–tremolite–clinozoisite beds of marly origin, as well as dense, light‑colored diopside–tremolite–K‑feldspar marbles, occur near mineralized centers but predate tungsten mineralization [Grabher, 1984]. Toward mineralized centers, the distinction between purely metamorphic and metasomatic effects becomes less clear. Hornfels typically darken to green, and pale grossularitic garnet and idocrase appear as lenses, veinlets, or knots within the marbles. Veinlets containing garnet, thulite, idocrase, tremolite, clinozoisite, and K‑feldspar crosscut the hornfels or follow bedding planes. Lenticular masses of grossularite garnet + idocrase ± sericite also occur in proximity to skarn [Grabher, 1984]. Volcanic rocks thicken on the northern and eastern portions of the project. There are no known dates for these units, but in terms of relative ages they consist of a volcanogenic sandstone up to 10m thick, a volcaniclastic debris flow with thicknesses up to 30 m thick, and columnar basalt flows. The volcaniclastic debris flow contains clasts of various lithologies, including skarn locally. The structural geology of the project area contains evidence of both Mesozoic compressional deformation and younger Walker Lane-style faulting. Mesozoic deformation related to the Luning-Fencemaker thrust is manifested as bedding parallel, ductile to semi-ductile attenuation localized along laminated micritic carbonate beds, but units lack the intense isoclinal folding associated with thrust nappes throughout the range as mapped by Oldow (1981). Large wavelength, gentle to open folding has been documented, specifically in the Garnet resource area, and is attributed to Mesozoic compression. Walker Lane style faulting consists of a series of sub-parallel, northwest trending, dextral, trans-tensional faults that offset rock units and locally deposits on the order of 10s of meters. This fault zone is interpreted to be a splay of the regional Petrified Spring-Bettles Well fault (USGS, 2020, Wesnousky, 2005). The NW trending fault zone is truncated in the area of the Desert Scheelite orebody by a series of east-northeast trending, steeply dipping faults that have been mapped by previous workers. These faults are localized at rheologic boundaries between skarn and quartz monzonite and on transitions between carbonate and siliciclastic beds. These faults display evidence of both normal and reverse motion and are interpreted to be the result of a restraining, left-stepping bend in the dextral fault system, which resulted in the formation of positive flower structure, which was then subjected to normal motion with continued regional trans-tensional tectonics. Other east-west faults occur south of Desert Scheelite, are through-going, and define a major lithologic transition between the Luning formation to the north and the Dunlap and Mina formations to the south. These structures bear resemblance to larger magnitude east-west faults of the central Walker Lane documented by Wesnousky (2005), particularly those of the Mina deflection, although their orientation and sense of motion within the project area are not fully understood. 6.2 MINERALIZATION The mineralization‑hosting skarn at Pilot Mountain is classified into two principal compositional types: pyroxene‑rich skarn and garnet‑rich skarn. The garnet‑rich variety occurs in two subtypes, one enriched in base metals and one relatively base‑metal poor. Skarn composition is largely controlled by the character of the host carbonate rocks and distance from the causative intrusion, while the degree of base‑metal enrichment appears to reflect the geochemical variability associated with typical retrograde skarn assemblages. |
| PFS Pilot Mountain Tungsten Project – S-K 1300 Technical Report Summary Project No.: 25173-01 Page 49 of 236 6.2.1 Desert Scheelite The Desert Scheelite deposit is a base‑metal enriched tungsten skarn developed within lower Luning Formation carbonates and interbedded biotite hornfels. The skarn zone extends for approximately 650 m along the contact of the Desert Scheelite quartz monzonite stock and persists for at least 300 m down‑dip. The skarn dips steeply north, containing two mineralized zones on both the footwall and hanging wall sides. Garnet compositions, based on limited petrographic and X‑ray diffraction studies, are dominantly grossular‑andradite solid solution, with Fe‑rich andradite rims on garnet porphyroblasts [Grabher, 1984]. Retrograde assemblages containing amphibole, epidote and chlorite contain a greater abundance of sulfides typically, including pyrite, chalcopyrite, sphalerite and galena. Mineralization is characterized by disseminated scheelite, along with pyrite and base‑metal sulfides, principally chalcopyrite and sphalerite, which locally exceed 20% combined in unoxidized samples. Tungsten grades within this skarn are notably consistent compared to other deposits on the property. Desert Scheelite contains relatively abundant ankerite and siderite, in addition to pyroxene and quartz. Both iron carbonates and quartz are observed replacing garnet [Grabher, 1984]. 6.2.2 Garnet Both garnet skarns and pyroxene skarns are present at the Garnet deposit. Garnet skarns are commonly interbedded with marble and early‑stage pyroxene skarns. Mineralization occurs as high‑grade scheelite horizons within pyroxene–quartz–garnet skarn and as disseminations in the outer rims of zoned, porphyroblastic garnets set in a calcareous matrix. Mineralization is focused along the margins of quartz monzonite sills, which are locally altered to endoskarn. At depth, pyroxene skarns are expressed in two distinct subtypes: (1) a dark green pyroxene skarn with brown garnet veinlets developed from an inferred dolomitic limestone host, which outside the altered zone contains chlorite and serpentine bands; this subtype is consistently very low‑grade to barren in scheelite, though molybdenite may occur; and (2) a scheelite‑rich skarn, possibly formed by replacement of pre‑existing diopside–tremolite hornfels layers, characterized by quartz and fibrous amphibole replacing coarse tremolite and diopside, occurring as beds up to 60cm thick and as a green matrix enclosing dark brown isotropic garnet porphyroblasts, which themselves are barren [Grabher, 1984]. Garnet lacks the more sulfide-rich retrograde phases observed at Desert Scheelite, but sphalerite does commonly occur throughout the deposit. Garnet skarns are sub-horizontal to gently dipping to the east, which reflects the gentle folding of the Luning formation. The skarn is locally offset by dextral faults on the order of several 10s of meters, and is underlain by a larger body of quartz monzonite. 6.2.3 Gunmetal Exposures at the Gunmetal deposit are characterized by low‑sulfide garnet skarn. The skarn exhibits both contact‑related vertical replacement and flat‑lying stratiform replacement of upper Luning carbonates. Petrographic and X‑ray diffraction studies indicate garnet compositions within the grossular‑andradite solid solution, with Fe‑rich rims on garnet porphyroblasts [Grabher, 1984]. Pyroxene and quartz are the principal accessory minerals. Scheelite grades vary both between beds and with distance from the intrusive contact, with higher grades adjacent to marble and lower grades near quartz monzonite. |

| PFS Pilot Mountain Tungsten Project – S-K 1300 Technical Report Summary Project No.: 25173-01 Page 50 of 236 The deposit also contains a narrow contact skarn and multiple stratiform skarns extending outward from the Gunmetal stock. These skarns are generally thinner, but locally include a zone of thin, higher‑grade skarn interbedded with thicker barren hornfels. Gunmetal is separated from Garnet by an east-northeast trending normal fault which down drops Garnet relative to Gunmetal. This is evidenced by the relative exposures of the quartz monzonite stock, which is exposed on surface at Gunmetal, but intersected at typical depths of 100 m at Garnet. 6.2.4 Good Hope Good Hope consists of skarn altered Luning formation exposed in a window below younger basalt outcrops, and between multiple northwest trending dextral Walker Lane faults. Skarn outcrops strike east-west and dip moderately to the north and are juxtaposed against quartz monzonite to the south. Mineralization contains more sulfides than Garnet and Gunmetal, including common copper oxides where skarn is weathered on surface. 6.3 DEPOSIT TYPE The Desert Scheelite and Garnet deposits are a tungsten skarn deposit. Tungsten skarn deposits in the Great Basin formed along the North American Cordilleran magmatic arc, where granitic to granodioritic plutons intruded carbonate-rich basement rocks. Great Basin skarns are concentrated along the margins and roof zones of the Sierra Nevada batholith in California and in dispersed plutons across Nevada. The host rocks include Paleozoic continental shelf and slope facies dominated by limestone, dolomite, and mixed siliciclastic assemblages, as well as Triassic to Jurassic back-arc basin carbonates interlayered with volcaniclastic and siliciclastic units. Skarn ages range from Jurassic to Cenozoic, with most deposits forming during the Cretaceous, coincident with pulsed Cordilleran arc magmatism and crustal thickening [Lederer et al, 2021]. Plutons associated with tungsten skarns are typically coarse-grained granitoids crystallized at depths greater than 3km. Extensive fractional crystallization enrich incompatible elements, such as tungsten, in residual felsic melts, where tungsten can partition into chlorine-rich magmatic fluids, driving metasomatic alteration of carbonate host rocks. Both reduced and oxidized plutons can generate tungsten skarns, though the highest grades are commonly linked to reduced granitic intrusions [Lederer et al, 2021]. Metasomatism of carbonates produces zoned calc-silicate assemblages through prograde and retrograde alteration assemblages. Prograde skarn minerals include garnet, pyroxene, and wollastonite, while retrograde assemblages are dominated by hydrous phases, including amphibole, chlorite and epidote. Skarn geometry is often controlled by depth of formation. Deep systems (>5–10km) can form as narrow, vertically extensive bodies along plutonic contacts surrounded by larger thermal aureoles, whereas shallow systems (<5km) can be more broadly developed as the result of sharper temperature and chemical gradients and display intense retrograde alteration due to meteoric water influx. Economic tungsten mineralization is typically restricted to exoskarns, where scheelite occurs as the dominant ore mineral [Lederer et al, 2021]. |
| PFS Pilot Mountain Tungsten Project – S-K 1300 Technical Report Summary Project No.: 25173-01 Page 51 of 236 7.0 EXPLORATION 7.1 EXPLORATION HISTORY Since acquiring the Pilot Mountain project in 2021, Guardian Metal has advanced exploration through a combination of data review, updated geological modeling, and targeted drilling programs. Work has focused on validating the historical resource base, assessing extensions of known mineralization, and collecting samples to support metallurgical and geotechnical evaluations. These activities provide the foundation for pre‑feasibility assessment, with detailed results and methodologies discussed in the subsections that follow. 7.2 GEOLOGICAL MAPPING AND STUDIES In 2024, 21 rock chip samples were taken, and mapping activities were conducted across the property. Rocks were analyzed for both whole-rock and multi-element geochemistry. Samples of quartz-monzonite were analyzed for geochemical fingerprinting to help identify causative intrusions and whether multiple stocks were present. Results were similar across the various quartz-monzonite samples, suggesting that they all belong to the same pluton, but represent different levels with the broader porphyry/skarn system. In 2025, a larger mapping and sampling campaign was conducted, focused on the area south of Desert Scheelite that had previously seen only limited work. Mapping defined large zones of quartz-sericite-pyrite alteration associated with quartz monzonite dikes intruding the Mina formation, and an increase in quartz veining. 189 rock chip samples were analyzed for multi-element geochemistry. Additional samples of both quartz-molybdenite-pyrite and molybdenite fracture coatings in the quartz monzonite were taken for Re-Os dating of molybdenite. Results yielded ages of 88.5 and 86 Ma respectively, constraining the quartz-monzonite intrusion adjacent to Desert Scheelite to Cretaceous in age (Carter, 2025). In 2025, a suite of 17 drill core samples were selected for thin sectioning and petrographic analysis to better understand the mineralogy of Desert Scheelite (Colombo, 2025). The thin sections predominantly showed hydrogrossular garnet + pyroxene skarn in various stages of overprinting by retrograde and weathering minerals such as chlorite, amphibole, clay and carbonate. Varying amounts of sulfides were also noted, with pyrite occurring in many samples and chalcopyrite + sphalerite occurring together along scheelite commonly associated with sphalerite. Sulfides were most associated with samples containing overprinting minerals such as clays and amphiboles. In December of 2025, detailed mapping of the Garnet area was conducted to support a geologic model of the deposit for resource estimation, and in early 2026 limited mapping was conducted in the west Desert Scheelite and Good Hope areas to improve understanding of the structural architecture of the project area and controls on mineralization, in addition to generating exploration targets. In early 2026, a quaternary fault study was commissioned to determine the extent to which mapped quaternary faults crossed the project area, to assist with the location of facilities (Sawer, 2026). The original USGS mapped locations of some faults were determined to be mis-located due to a projection issue with the USGS data. Additionally, the Bettles-Well fault was mapped by the USGS in a location that conflicted with the Companies interpretation, so the mapped location was analyzed for any evidence of Quaternary fault rupture. No Quaternary fault rupture was identified for the Bettles-Well fault, and other faults further to the east in Monte Cristo valley were properly located. |

| PFS Pilot Mountain Tungsten Project – S-K 1300 Technical Report Summary Project No.: 25173-01 Page 52 of 236 7.3 GEOPHYSICS In June 2023, while operating under the name Golden Metal Resources PLC, Guardian Metal completed a high‑resolution induced polarization (“IP”) geophysical survey across the Pilot Mountain Project. The program encompassed the Desert Scheelite deposit and adjacent quartz monzonite stock, and it delineated three significant chargeability anomalies interpreted as disseminated sulfide mineralization. These anomalies provided early evidence of possible porphyry‑style systems and defined priority targets for follow‑up exploration. In June 2024, a ground-based magnetometer survey was conducted across the project to map magnetic features such as concealed intrusions and hornfels aureoles. The survey consisted of 30 survey lines at 100m spacing, with lengths varying from 450m to 2,000m. In 2025, Guardian Metal completed a three‑dimensional induced polarization (“3DIP”) survey targeting porphyry-style alteration and mineralization that extended coverage southward from the 2023 IP survey area. The 3DIP results, integrated with the 2023 IP, confirmed the presence of chargeability anomalies. Although geophysical work remains at an early-stage relative to drilling and metallurgical studies, the results may provide support for refinement of exploration targets and potential resource expansion. 7.4 FUTURE EXPLORATION Future exploration should focus on drilling high-priority targets that have the potential to define significant additional resources. Areas of interest include potential extensions of the Desert Scheelite ore body, which should focus on testing the extent of the quartz monzonite stock as outlined by magnetics, and areas where fault offsets of the known ore body may occur. The newly discovered Tremor Zone, located east of the Desert Scheelite deposit, was identified through drilling targeting a quartz monzonite contact interpreted from magnetic survey data. The mineralization is entirely concealed beneath alluvial fan deposits and Pliocene volcanic rocks and has no known surface expression. This target will be investigated with further drilling in the year ahead. Additional drilling at Garnet also has the potential to expand known mineralization, as well as drilling at Gunmetal, which has seen historic production but no drilling by the Company. The Company did some drilling at the Good Hope area during 2026. 7.5 DRILLING Table 7.1 summarizes the meters drilled in each target area at the Pilot Mountain Project. Guardian Metal has drilled a total of 157 core drill holes and 32 RC holes, which includes 81 holes at the Desert Scheelite deposit, 78 holes at the Garnet deposit, 29 holes on various exploration and condemnation targets, and one hole targeting Porphyry South. All drilling was conducted using diamond core and reverse circulation methods, and drill-hole locations were surveyed by contracted professional land surveyors. Table 7.1: Guardian Drilling in 2024-2026 Target Type of Drilling Total Holes Total (m) Desert Scheelite Core 78 10,626 Desert Scheelite RC 3 482 Garnet Core 71 5,802 Garnet RC 7 625 |
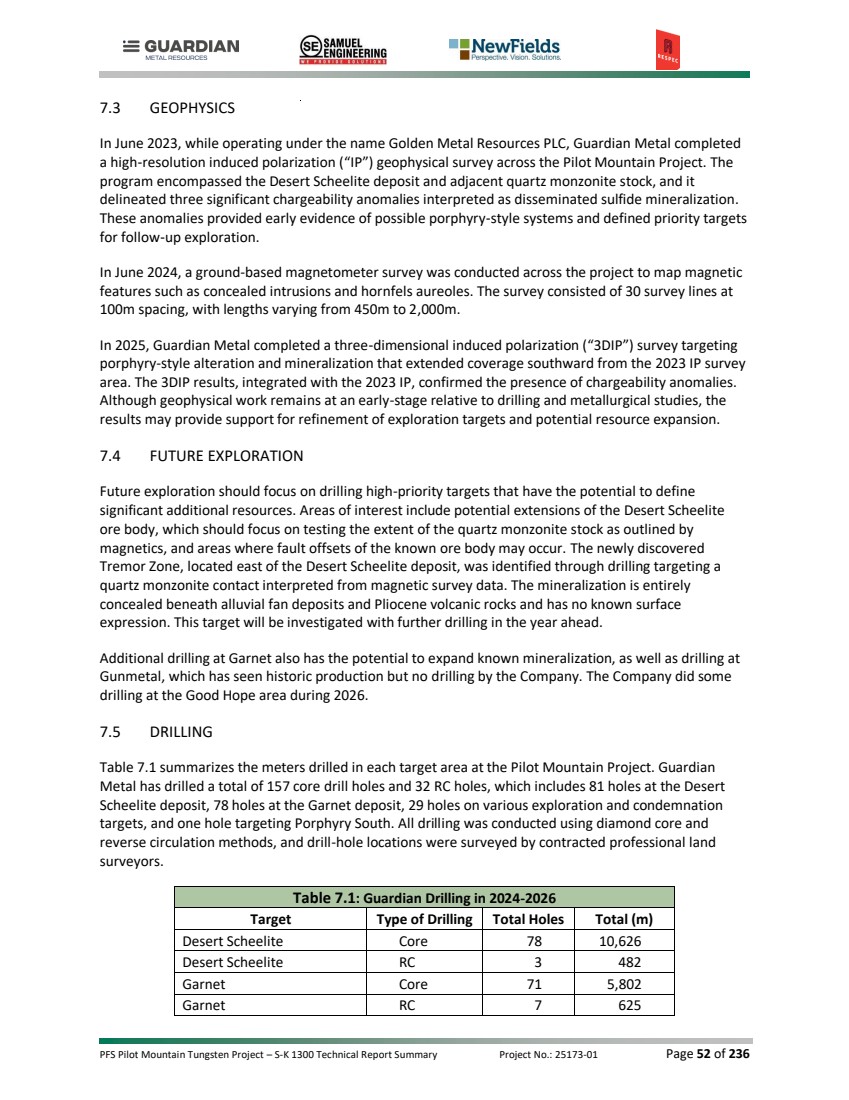
| PFS Pilot Mountain Tungsten Project – S-K 1300 Technical Report Summary Project No.: 25173-01 Page 53 of 236 Table 7.1: Guardian Drilling in 2024-2026 Target Type of Drilling Total Holes Total (m) Porphyry South Core 1 407 Exploration/Condemnation Core 7 747 Exploration/Condemnation RC 22 3,770 Total 189 22,459 Guardian Metal contracted Diamondback Drilling, who operated Boart Longyear LF Super 90 rigs for core drilling. The crew applied barium‑based grease with organic compounds during coring. At shallow depths, they advanced short runs of one to two feet to manage broken core. The crew relied on mechanical methods to remove core from the barrel, including hammering the outside with a rubber mallet or claw hammer, ramming a metal stake into the back end, and shaking the barrel when necessary. The crew labeled cardboard core boxes with Guardian Metal information, including hole ID, box number, and from and to depths. They marked each run with wood blocks noting footage, interval length, and recovered length in feet. The crew washed tubes and core with a plastic brush and water before placing samples in boxes, ensuring clean presentation and accurate labeling. As drilling progressed, core recovery improved, with later runs producing more intact samples. Guardian Metal contracted Alloy drilling for all RC drilling, who operated a RC1500 rig capable of reaching max depths around 1500 feet. Sample bags were pre-labeled by Guardian Metal geologists with the hole ID and footage in 5-foot intervals and given to the drill crews who would rotary split a portion of the interval for an assay sample as well as retaining chips for a chip tray to be logged by geologists. All RC drilling was done with a face sampling hammer to minimize potential downhole contamination. Field duplicate samples were taken every 100 feet. After drilling, geologists would select what footages to assay and then transfer the original sample to a new bag with a unique sample ID. |
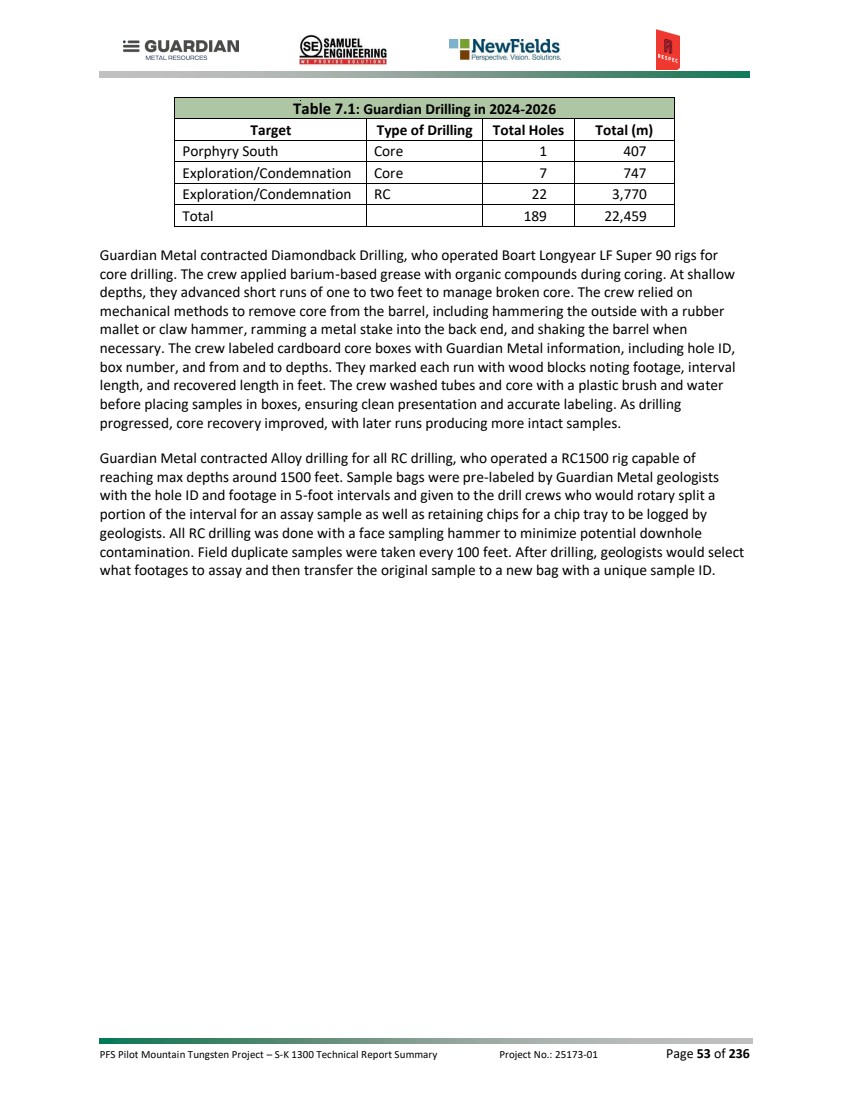
| PFS Pilot Mountain Tungsten Project – S-K 1300 Technical Report Summary Project No.: 25173-01 Page 54 of 236 Figure 7.1: Map of Drill Holes at the Pilot Mountain Project. Advanced Surveying & Professional Services (“ASPS”) surveyed all the drill collar locations for the 2024– 2026 program, along with 30 historical collars that remained physically identifiable on the project site. All collar positions were reported in Universal Transverse Mercator (“UTM”) coordinates using the WGS84 geodetic datum. Guardian Metal collected down-hole survey readings for the 2024–2025 drilling program at 10m intervals using the Gyromaster instrument manufactured by Stockholm Precision Tools. In 2026 downhole surveys were conducted with a Reflex Omnix42, utilizing both continuous gyro surveys where appropriate and multishot surveys every 50 feet on near vertical holes. Acoustic televiewer surveys were conducted on 6 holes that were drilled for geotechnical purposes. |
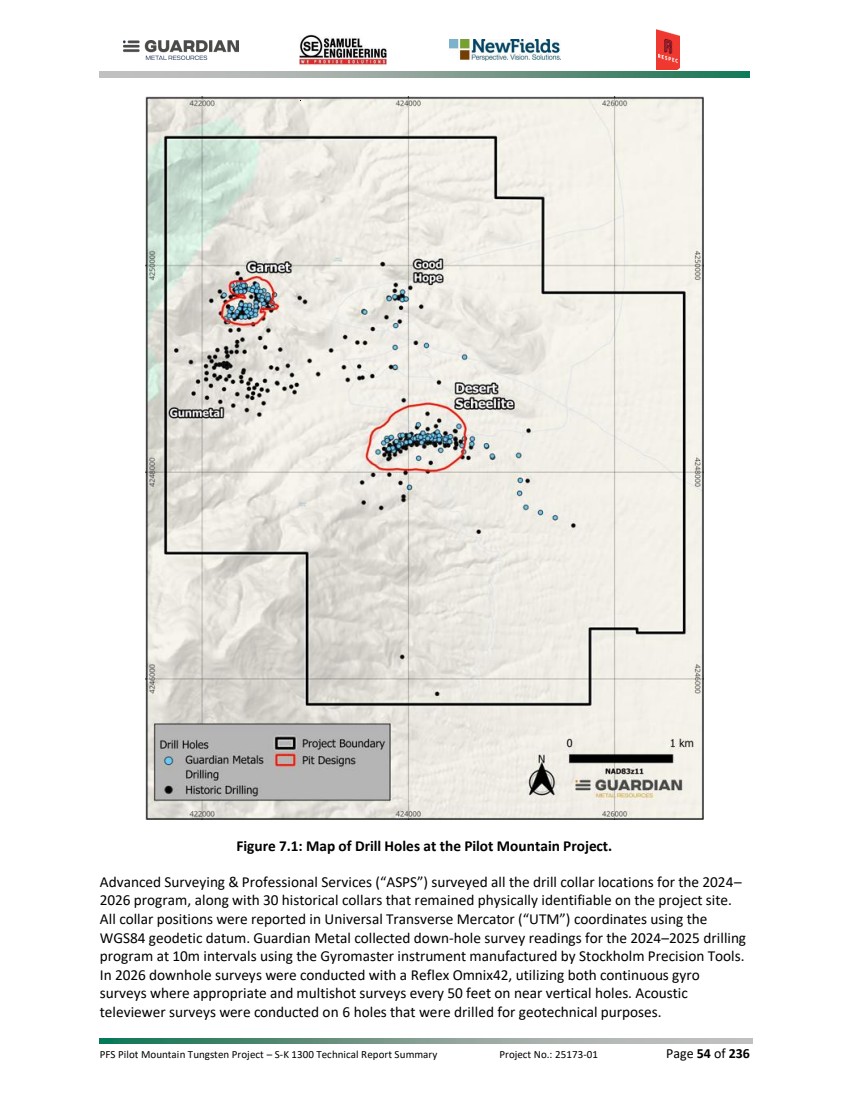
| PFS Pilot Mountain Tungsten Project – S-K 1300 Technical Report Summary Project No.: 25173-01 Page 55 of 236 8.0 SAMPLE PREPARATION, ANALYSES, AND SECURITY 8.1 SAMPLING METHODS AND QA/QC 8.1.1 Guardian Metal Sampling Methods Every day of active drilling, Guardian Metal geologists transported drill core from the drill site to the core facility in Hawthorne, Nevada. Once there, they placed the core on racks, pieced together and washed the core, and converted footages to meters labeled on the boxes and wood blocks. The geologists logged recovery, RQD, the primary and secondary lithologies, color, the presence and intensity of carbonate and quartz veining, faulting and structural intensity, alteration type and intensity, mineralization with visual estimates of modal mineral percentages, and the oxidation minerals present. They also documented jointing and other structural features and the redox state. Guardian Metal geologists selected sample intervals based on geology (e.g., skarn, oxidation zones). Intervals ranged from a minimum of 0.1 m to a maximum of 1.5 m. The geologists stapled pre‑numbered sample tags into the core box at the beginning of each run, with two tags inserted when duplicates were required. They marked sample intervals directly on the core with red lumber crayon and used blue crayon to mark UV-fluorescent scheelite, and yellow crayon to indicate powellite. The geologists initiated sampling once mineralized zones were encountered in the core and continued sampling through the entire mineralized interval. To ensure representative coverage, 5m of buffer samples were collected on both sides of each mineralized zone. Guardian Metal geologists photographed wet and dry core samples. Recently, they began photographing core boxes under UV light to highlight scheelite, powellite, and calcite fluorescence. After logging, the geologists placed core boxes next to the core saw. Sampling technicians cut the core from the top of the hole downward using a bench‑mounted saw. Cutters consistently sampled the right side of the core and returned the left side to the box in its original sequence. They sampled broken or rubbly intervals by volume. To make field duplicates, the cutters split the right half again, producing two quarter‑core samples. Technicians placed samples in large cloth bags with bar‑coded tags attached to the label, also inserted bar‑coded tags inside the bag, and transferred the bagged samples to supersacks labeled with the ALS client code and batch number. For quality assurance/quality control (“QA/QC”), Guardian Metal geologists inserted certified reference materials (“CRMs” or “standards”), blanks, and field, coarse, and pulp duplicates at defined frequencies into the sample register. The QA/QC samples were placed in gallon Ziplock bags with sample tags and hole numbers on the bag. The crew palletized the supersacks, which were stored inside a locked Quonset hut. Guardian Metal personnel delivered the supersacks directly to the ALS laboratory in Reno, Elko, or Carson City. Guardian Metal personnel obtained chain-of-custody documentation at the lab and scanned the documentation into the project database. Guardian Metal geologists also collected density samples every 10 m. They wax‑coated the density samples and measured their densities using the water immersion method without oven drying for dry weight. They chose density samples to represent the range of lithologies, alteration types, and mineralization styles present. However, only intact samples were measured, so lithologies that tended to be broken or fractured might not be accurately represented. Guardian Metal stores historical core outside under tarps in shipping containers that are not within the locked facility. |
| PFS Pilot Mountain Tungsten Project – S-K 1300 Technical Report Summary Project No.: 25173-01 Page 56 of 236 8.1.2 Historical Sampling Methods RESPEC reviewed drilling and sample collection methods conducted by Black Fire and Thor, relying primarily on prior reports prepared under JORC standards to compile available details [Golder 2012, RES 2018]. In 2012, Black Fire contracted Timberline Drilling Inc. (“Timberline”) to conduct core drilling using a track-mounted Boart Longyear LF90 drill rig. The drillers pre-collared the first 30m with a tri-cone roller bit due to poor ground conditions. RESPEC is not aware of any documentation identifying the specific procedures employed during drilling and core recovery. Black Fire geologists logged recovery, RQD, and the quality of the mark for core orientation. They also recorded UV fluorescence, lithology, alteration, mineralization, veining, and structures on geologic logs. Black Fire personnel photographed wet and dry core and marked samples on geological intervals using pre-numbered sample registers. Black Fire technicians cut the core, sent half for analysis, and retained the remaining half for reference. Black Fire personnel submitted QA/QC samples, including CRMs and blanks, with the core samples. RESPEC is not aware of any additional documentation identifying the specific procedures used for sampling and QA/QC insertion beyond what is available in the Golder [2012] and RES [2018] reports. Black Fire stored samples in a locked shed at Black Fire’s facility in Hawthorne, Nevada. After the completion of each hole, a Black Fire technician delivered the samples to ALS in Reno, Nevada. RESPEC does not have documentation indicating which drilling contractor or rig Thor used for the RC drilling they conducted. The drill crew collected 2 kg subsamples at 0.76 m (2.5 ft) intervals using a rotary splitter. Thor personnel collected, logged, and photographed chip tray samples. Thor geologists logged UV fluorescence, lithology, alteration, and mineralization. RESPEC is not aware of any additional documentation identifying the specific procedures Thor used to manage sampling and QA/QC insertion beyond what they reported. Thor stored samples in a locked shed at their facility in Hawthorne, Nevada. A Thor technician delivered the samples to ALS in Reno, Nevada. RESPEC has not identified or reviewed any documentation detailing the sample handling, preparation, security procedures, or chain of custody protocols employed during the 1970s drilling at the Pilot Mountain project. 8.2 SAMPLE PREPARATION AND ANALYSES 8.2.1 Guardian Metal Sample Preparation and Analytical Methods ALS Laboratories in Reno, Nevada prepared and analyzed the samples Guardian Metal submitted using established geochemical methods suitable for multi-element and ore-grade analysis. To conduct the initial assays for tungsten, silver, copper, and zinc, ALS used method ME-ICP61, a four-acid digestion followed by inductively coupled plasma–atomic emission spectroscopy (“ICP-AES”). This methodology provides reliable detection across a broad range of metal concentrations. To ensure accurate quantification of initial assays that exceeded upper detection limits (overlimits), ALS re-analyzed overlimit samples using ore-grade methods. ALS re-assayed overlimit silver samples using aqua regia (“OG46”) and four-acid (“OG62”) methodologies. ALS used OG62 to re-assay overlimit copper and zinc samples. These methods incorporate enhanced digestion and detection protocols designed for |
| PFS Pilot Mountain Tungsten Project – S-K 1300 Technical Report Summary Project No.: 25173-01 Page 57 of 236 high-concentration samples. Any tungsten samples that reported greater than 450 ppm W were re-analyzed using x-ray fluorescence (“ME-XRF15c”), a pressed pellet technique appropriate for quantifying tungsten trioxide (“WO3”) in high-grade material. ALS Laboratories is accredited to ISO/IEC 17025 for laboratory competence and ISO 9001 for quality management systems. These certifications confirm that ALS maintains rigorous analytical protocols and traceable procedures. RESPEC knows of no relationship between ALS and Guardian Metal other than that of an independent commercial laboratory providing analytical services to a client. MSALABS, an independent commercial geochemical laboratory headquartered in Langley, British Columbia, analyzed a portion of the Garnet samples using established multi‑element and ore‑grade analytical methods. For initial determinations of tungsten, silver, copper, and zinc, MSALABS used four‑acid digestion followed by inductively coupled plasma–atomic emission spectroscopy (“ICP‑230”). To quantify tungsten concentrations that exceeded the upper detection limit of the ICP‑230 method, MSALABS re‑analyzed overlimit samples using fused‑disk x‑ray fluorescence (“WRX4W”). Guardian Metal defined a threshold of 450 ppm W for triggering WRX4W re‑analysis, and MSALABS applied this threshold when selecting samples for fused‑disk x‑ray fluorescence measurement of WO3 in high‑grade material. MSALABS is accredited to ISO/IEC 17025 for laboratory competence and maintains ISO 9001–certified quality management systems. These accreditations confirm that MSALABS operates under rigorous analytical protocols and traceable procedures. RESPEC knows of no relationship between MSALABS and Guardian Metal other than that of an independent commercial laboratory providing analytical services to a client. 8.2.2 Historical Sample Preparation and Analytical Methods Analytical protocols for the Black Fire and Thor drilling campaigns at Desert Scheelite involved standardized sample preparation and multi-element analysis conducted by ALS. Upon receipt, ALS registered, weighed, dried, and crushed the samples to achieve greater than 70% passing a 2mm screen. The lab then obtained a 1,000 g split and pulverized it to greater than 85% passing a 75-micron screen. ALS subjected a portion of the prepared samples to a multi-acid digestion method suitable for near-total decomposition of silicate-rich material, then performed the elemental analysis using ICP-AES. To confirm analytical consistency, American Assay Laboratories (“AAL”) processed check samples using the same methodology. AAL is accredited under ISO/IEC 17025:2017, covering both sample preparation and analytical procedures. RESPEC knows of no relationship between ALS or AAL and Black Fire or Thor other than that of an independent commercial laboratory providing analytical services. Guardian Metal recovered a partial set of original assay certificates from the 1970s drilling programs conducted by UCC and Duval. These records provide limited insight into the analytical work performed for some of the assays obtained during that period. The laboratories identified in the available documentation include Rocky Mountain Geochemical, Skyline Labs, and Southwestern Assayers and Chemists. Sample preparation techniques used by these laboratories were not recorded in the available documentation and remain unknown to RESPEC. The |
| PFS Pilot Mountain Tungsten Project – S-K 1300 Technical Report Summary Project No.: 25173-01 Page 58 of 236 analytical methods employed included atomic absorption spectroscopy for multi-element analysis and colorimetric techniques for tungsten determination. Certification status for these laboratories during the 1970s is not fully documented. However, Skyline Labs is known to have held ISO 9001:2015 and ISO 17025:2017 certifications in later years, while no publicly available records confirm accreditation for Rocky Mountain Geochemical or Southwestern Assayers and Chemists. 8.3 QUALITY ASSURANCE/QUALITY CONTROL RESPEC compiled and evaluated QA/QC results from Guardian Metal’s 2024–2026 drilling programs and reviewed published QA/QC data for Black Fire and Thor. Results from CRMs, blanks, and field duplicates are summarized and discussed in this section. Certified Reference Materials CRMs are powdered materials containing known concentrations of target metals and are used to assess analytical accuracy. Commercial suppliers provide certified values and associated standard deviations derived from multiple laboratory analyses. Analytical results are typically considered acceptable when they fall within the certified value ± three standard deviations. Blanks Blanks contain metal concentrations below detection limits and are used to monitor laboratory contamination. Two types are commonly used: coarse blanks and analytical (pulp) blanks. Coarse blanks are crushed and pulverized through the full preparation process and are most effective for detecting contamination introduced during sample preparation. Analytical blanks, consisting of barren pulp material, monitor contamination at the analytical stage but are less diagnostic. Blanks returning values greater than five times the detection limit are considered failures. Duplicates Field duplicates are secondary splits of drill core or reverse circulation (“RC”) samples collected at the drill site or during core sampling. They are used to evaluate the natural heterogeneity of metal distribution in the deposit but also provide a measure of sampling precision and can identify potential issues with sample splitting. Preparation duplicates are coarse reject splits usually prepared by the laboratory at the request of project staff. Pulp duplicates are also produced by the lab for their internal QA/QC programs. 8.3.1 Guardian Metal QA/QC Results 8.3.1.1 CERTIFIED REFERENCE MATERIAL During their 2024-2026 drill programs, Guardian Metal used a combination of commercially produced and internally prepared CRMs. They obtained a commercial CRM from Geostats Pty Ltd. (“Geostats”) and another from CDN Resource Laboratories Ltd. (“CDN”). Both CRMs were certified for tungsten, but the CRM from CDN was also certified for copper (Table 8.1). Internally prepared standards were derived from Desert Scheelite drill material collected by Guardian Metal and certified for tungsten, silver, copper, lead, and zinc through round-robin testing managed by Moment Exploration Geochemistry Labs (“MEG”). The insertion rate for CRMs in Guardian Metal’s drilling program was approximately 6% for tungsten assays. |
| PFS Pilot Mountain Tungsten Project – S-K 1300 Technical Report Summary Project No.: 25173-01 Page 59 of 236 Table 8.2 and Table 8.3 summarize the evaluation of tungsten, silver, copper, and zinc analyses for all CRMs used by Guardian Metal. Analytical performance was generally within acceptable limits, and no consistent analytical bias evident across elements. Tungsten shows a modest but persistent negative bias (-3% to -15%) relative to the certified values. Although this bias is directional, its magnitude is within the range commonly observed for tungsten assay methods and is not considered material to the current resource estimate. Copper and zinc results plot close to the expected means, with biases typically within ±6%. Silver results display greater analytical variability than the other elements, however, the variability is not directional, the failure rate is low, and the results do not indicate a systematic analytical issue. Overall CRM failure rates across all elements were low (Table 8.4), with 48 failures out of 1,114 insertions (4.4%). Tungsten returned 26 failures from 344 CRMs (7.6%), including 20 low and six high outliers. This elevated failure rate, combined with the observed low bias, indicates that tungsten analyses show greater dispersion and a tendency to report low. The failures occur sporadically across batches, time periods, and laboratories and provide no evidence of a procedural or analytical issue. Silver returned six failures from 237 CRMs (2.5%), all on the high side. Copper showed 16 failures from 296 CRMs (5.4%), consisting of 13 low and three high outliers. Zinc returned one failure from 237 CRMs (0.4%). These results indicate generally strong QA/QC performance, with tungsten requiring closer monitoring. The apparent copper failures for CRM W311001X at MSALABS are attributed to incorrect analytical methodology, as all copper values reported at the upper detection limit. The three silver failures in W311001X are interpreted as genuine analytical inaccuracies, likely reflecting greater-than-expected variability in silver analyses, consistent with the higher standard deviation observed for this CRM. The cause of the elevated failure rate of GW-02 remains unknown. No clear analytical or procedural issues were identified, and the available information does not allow further evaluation. Guardian Metal reported that no CRM re-assays were requested because it considered the frequency of CRM failures to be insufficient to indicate deficiencies in the QA/QC program or analytical methods. Guardian Metal also noted that many of the low-side tungsten CRM failures occurred in the internally developed reference materials W311001X and W311003X, which exhibited a low bias in the 2024 round-robin certification program. The low bias observed in the current dataset is consistent with the results of that certification work. |
| PFS Pilot Mountain Tungsten Project – S-K 1300 Technical Report Summary Project No.: 25173-01 Page 60 of 236 Table 8.1: CRMs Used by Guardian Metal CRM ID Source Drill Years Insertion Count Certified W ppm W Std Dev ppm Certified Ag ppm Ag Std Dev ppm Certified Cu ppm Cu Std Dev ppm Certified Zn ppm Zn Std Dev ppm CDN-W-4 CDN 2024-2026 34 3,660 240 1,390 80 GW-02 Geostats 2024-2026 7 1,231 20 W311001X Guardian 2024-2026 62 1,930.8 224.1 52.06 1.74 42,370.3 1,378.1 7,236.2 293.3 W311002X Guardian 2024-2026 54 1,401.7 77.2 10.73 1 2,859.36 80.54 4,037.2 255.6 W311003X Guardian 2024-2026 6 3,550.2 318.3 20.93 1.17 357.03 17.72 10,221.7 486.4 Table 8.2: Summary of ALS Analyses for Guardian Certified Reference Materials 2024-2026 CRM ID Period Laboratory Element Insertions Expected Value ppm Grades in ppm Failure Counts Bias as % Low Mean High Low High CDN-W-4 2024-2026 ALS W 40 3,660 3,300 3,550 3,710 3 0 -3.0 CDN-W-4 2024-2026 ALS Cu 40 1,390 1,335 1,398 1,470 0 0 0.6 GW-02 2024-2026 ALS W 34 1,231 1,050 1,146 1,300 5 0 -6.9 W311001X 2024-2026 ALS W 120 1,931 1,590 1,748 2,000 0 0 -9.5 W311001X 2024-2026 ALS Ag 116 52.1 49.0 52.4 56.0 0 2 0.7 W311001X 2024-2026 ALS Cu 116 42,370 40,400 42,320 44,700 0 0 -0.1 W311001X 2024-2026 ALS Zn 116 7,236 6,870 7,320 7,820 0 1 1.2 W311002X 2024-2026 ALS W 70 1,402 1,230 1,355 1,510 4 0 -3.3 W311002X 2024-2026 ALS Ag 66 10.7 10.0 11.1 13.0 0 2 3.4 W311002X 2024-2026 ALS Cu 66 2,859 2,710 2,890 3,050 0 2 1.1 W311002X 2024-2026 ALS Zn 66 4,037 3,870 4,150 4,430 0 0 2.8 W311003X 2024-2026 ALS W 19 3,550 1,140 3,020 3,510 6 0 -14.9 W311003X 2024-2026 ALS Ag 19 20.9 20.0 21.6 24.0 0 1 3.2 W311003X 2024-2026 ALS Cu 19 357 326 348 370 0 0 -2.5 W311003X 2024-2026 ALS Zn 19 10,222 9,750 10,380 10,850 0 0 1.5 |
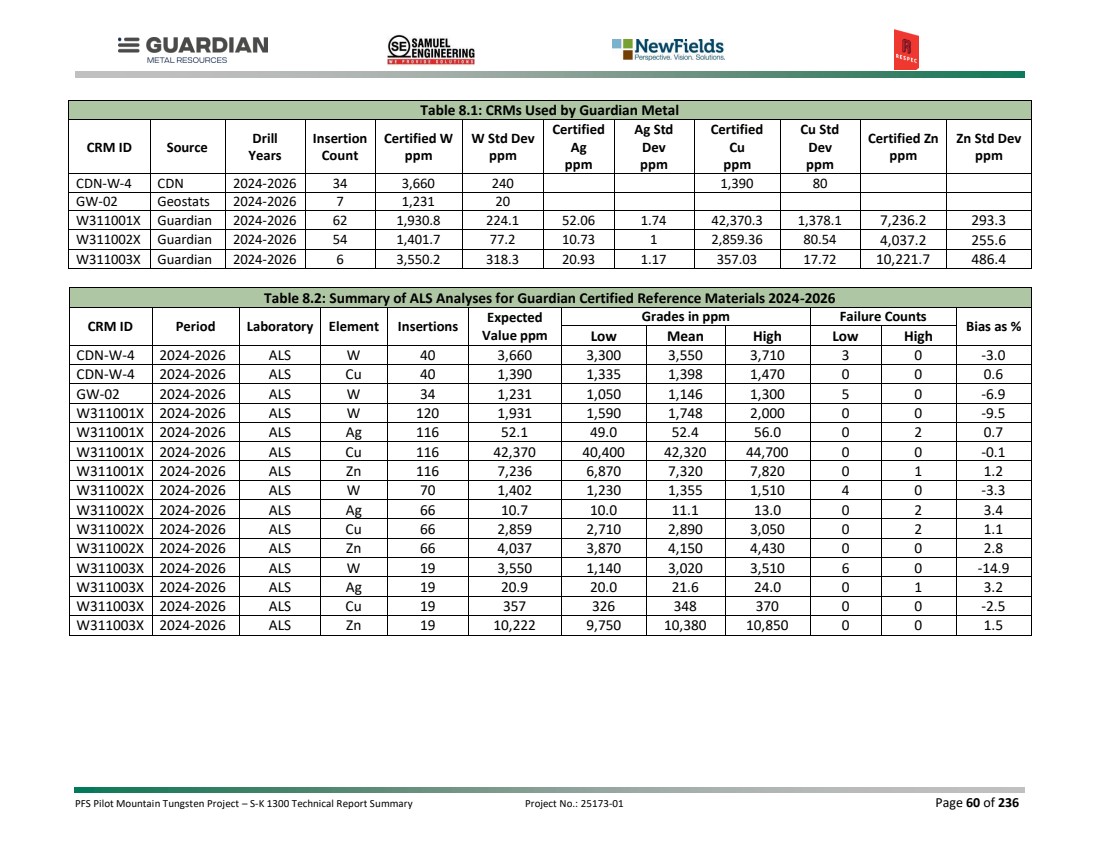
| PFS Pilot Mountain Tungsten Project – S-K 1300 Technical Report Summary Project No.: 25173-01 Page 61 of 236 Table 8.3: Summary of MSALABS Analyses for Guardian Certified Reference Materials 2026 CRM ID Period Laboratory Element Insertions Expected Value ppm Grades in ppm Failure Counts Bias as % Low Mean High Low High CDN-W-4 2026 MSALABS W 19 3,660 3,422 3,610 3,895 0 0 -1.4 CDN-W-4 2026 MSALABS Cu 19 1,390 1,351 1,400 1,436 0 0 0.7 GW-02 2026 MSALABS W 6 1,231 1,531 1,638 1,715 0 6 33.1 W311001X 2026 MSALABS W 13 1,931 1,928 1,938 1,939 0 0 0.4 W311001X 2026 MSALABS Ag 13 52.1 49.5 53.7 58.6 0 1 3.2 W311001X 2026 MSALABS Cu 13 42,370 10,000 10,000 10,000 13 0 -76.4 W311001X 2026 MSALABS Zn 13 7,236 6,746 6,940 7,150 0 0 -4.1 W311002X 2026 MSALABS W 21 1,402 1,260 1,362 1,503 0 0 -2.8 W311002X 2026 MSALABS Ag 21 10.7 9.9 10.8 11.7 0 0 0.7 W311002X 2026 MSALABS Cu 21 2,859 2,744 2,856 3,065 0 1 -0.1 W311002X 2026 MSALABS Zn 21 4,037 3,698 4,048 3,870 0 0 0.3 W311003X 2026 MSALABS W 2 3,550 2,032 2,207 2,382 2 0 -37.8 W311003X 2026 MSALABS Ag 2 20.9 20.8 21.1 21.3 0 0 0.6 W311003X 2026 MSALABS Cu 2 357 343 347 350 0 0 -3.0 W311003X 2026 MSALABS Zn 2 10,222 9,593 9,795 9,996 0 0 -4.2 Table 8.4: CRM Failures by Metal Metal Total CRMs Low High Failures Total Rate W 344 20 6 26 7.6% Ag 237 0 6 6 2.5% Cu 296 13 3 16 5.4% Zn 237 0 1 1 0.4% Total 1,114 33 16 49 4.4% |
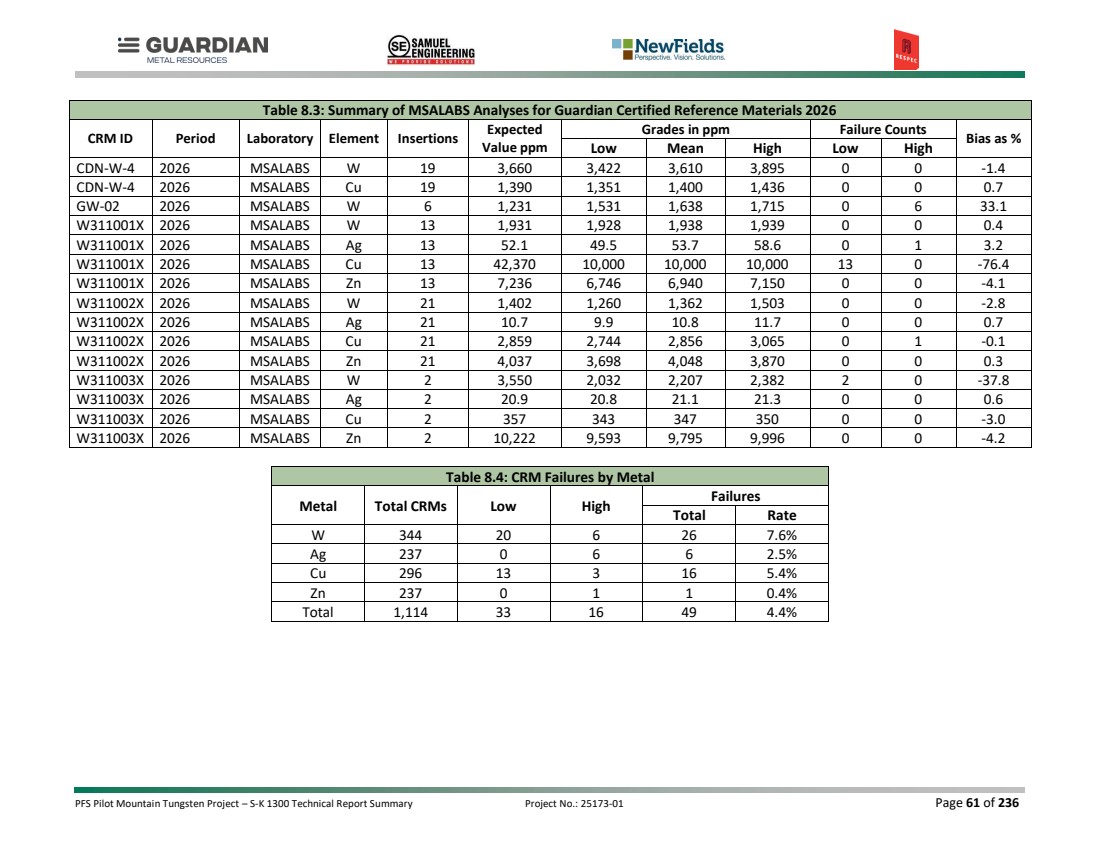
| PFS Pilot Mountain Tungsten Project – S-K 1300 Technical Report Summary Project No.: 25173-01 Page 62 of 236 8.3.1.2 BLANKS The blanks used during 2024–2026 were procured from MEG Labs and are certified. They consist of rhyolite cobbles sourced from western Nevada. The insertion rate was approximately 6%. For tungsten, 280 of the 419 analyses reported values below the detection limit of 10 ppm W. Another 135 analyses returned between 10 and 90 ppm W, all below the warning limit of 100 ppm W. Three analyses near 100 ppm W and one at 2,350 ppm W occurred after the processing of higher-grade samples and indicate limited contamination during sample preparation. For silver, 128 of the 419 analyses returned results below the detection limit of 0.5 ppm Ag, with one blank assay at 7.7 ppm Ag considered a failure. For copper, 33 of the 419 analyses reported results below the detection limit of 1 ppm Cu. A total of 343 analyses reported between 1 and 9 ppm Cu, below the warning limit of 10 ppm Cu. Forty-five analyses exceeded 10 ppm Cu and indicate minor contamination during sample preparation after higher-grade samples were processed. One failure at 4,050 ppm Cu corresponded to the same blank that returned 2,350 ppm W. The coarse blank returned repeated failures for zinc. However, the blank material had not been evaluated or certified for zinc and may therefore be unsuitable for monitoring potential contamination of this element. Consequently, the zinc blank results are not considered reliable indicators of laboratory or sample preparation contamination. 8.3.1.3 FIELD DUPLICATES RESPEC notes that additional field duplicate data were generated after the data cutoff for this QA/QC review and will be incorporated into a subsequent QA/QC update. These results were not included in the present evaluation. The interpretations in this subsection are based on the field duplicate dataset available to RESPEC at the time of review, which provides adequate basis for assessing sampling precision. Guardian Metal collected 34 field duplicates, consisting of quarter-core splits. RESPEC evaluated the results for these statistically, on scatterplots, and relative percent difference (“RPD”) analyses. The results are summarized in Table 8.5. Table 8.5: Summary of Results for Field Duplicates in 2024-2025 Type Start Date End Date Metal Counts RMA Regression Rel Pct Diff Corr Coeff All Used Outliers (y = dup, x = orig) ¼ core Field duplicate Sep-24 May-25 W 34 34 0 y = 1.036x - 24.022 3.5 0.958 Ag 34 29 2 y = 0.897x + 0.228 –10.9 0.962 Cu 34 34 0 y = 0.987x + 39.662 –1.3 0.998 Zn 34 34 0 y = 1.009x + 2.377 0.9 0.992 The RPDs for the elements in Table 8.5 indicate minimal bias between analyses of original and field duplicate samples for tungsten (Figure 8.1) and zinc (Figure 8.2). Tungsten duplicates returned an average RPD of 3.5% with a correlation coefficient of 0.958, reflecting low variability and strong reproducibility. Copper duplicates showed an average RPD of -1.3% and a correlation coefficient of 0.998, indicating excellent agreement. Zinc duplicates reported an average RPD of 0.9% with a correlation coefficient of 0.992, also demonstrating strong reproducibility. A slight negative bias was |
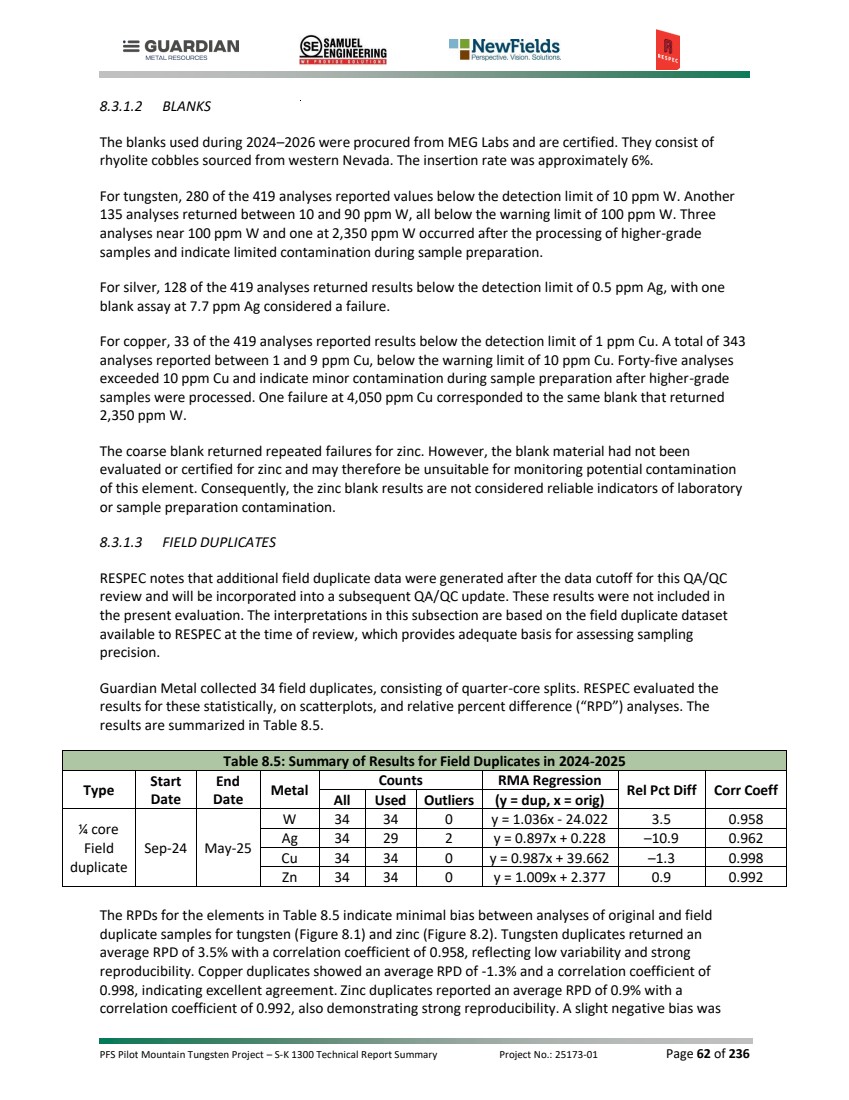
| PFS Pilot Mountain Tungsten Project – S-K 1300 Technical Report Summary Project No.: 25173-01 Page 63 of 236 observed in the silver assay duplicates, with duplicate values consistently reporting lower concentrations than the original assays (Figure 8.3). After removal of two outlier pairs, the average RPD remained at approximately -10%, though correlation remained strong at 0.962. The variability in field duplicates generally reflects natural heterogeneity in the deposit rather than systemic analytical errors. Sampling inconsistencies can also cause variability or bias in the RPD data. Figure 8.1. Tungsten Field Duplicate vs. Original, Desert Scheelite 2024-2025. |
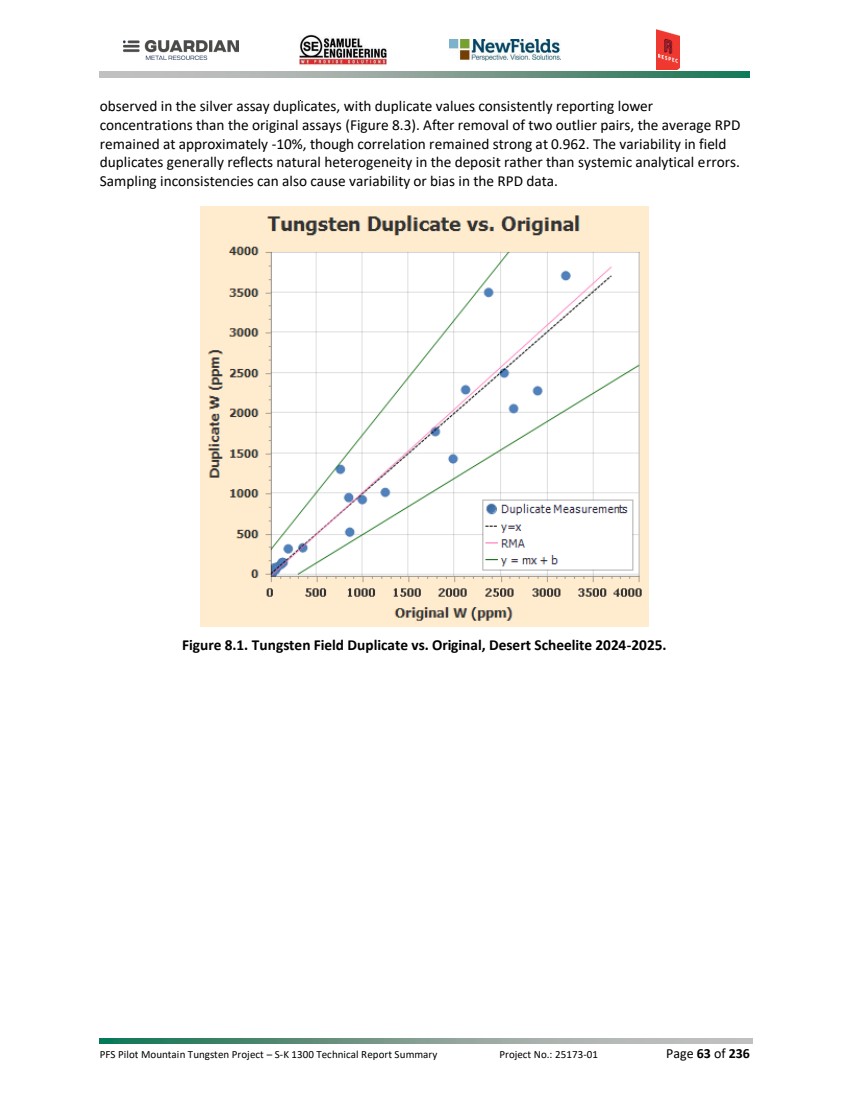
| PFS Pilot Mountain Tungsten Project – S-K 1300 Technical Report Summary Project No.: 25173-01 Page 64 of 236 Figure 8.2: Zinc Field Duplicate vs. Original, Desert Scheelite 2024-2025. Figure 8.3: Silver Field Duplicate vs. Original, Desert Scheelite 2024-2025. |
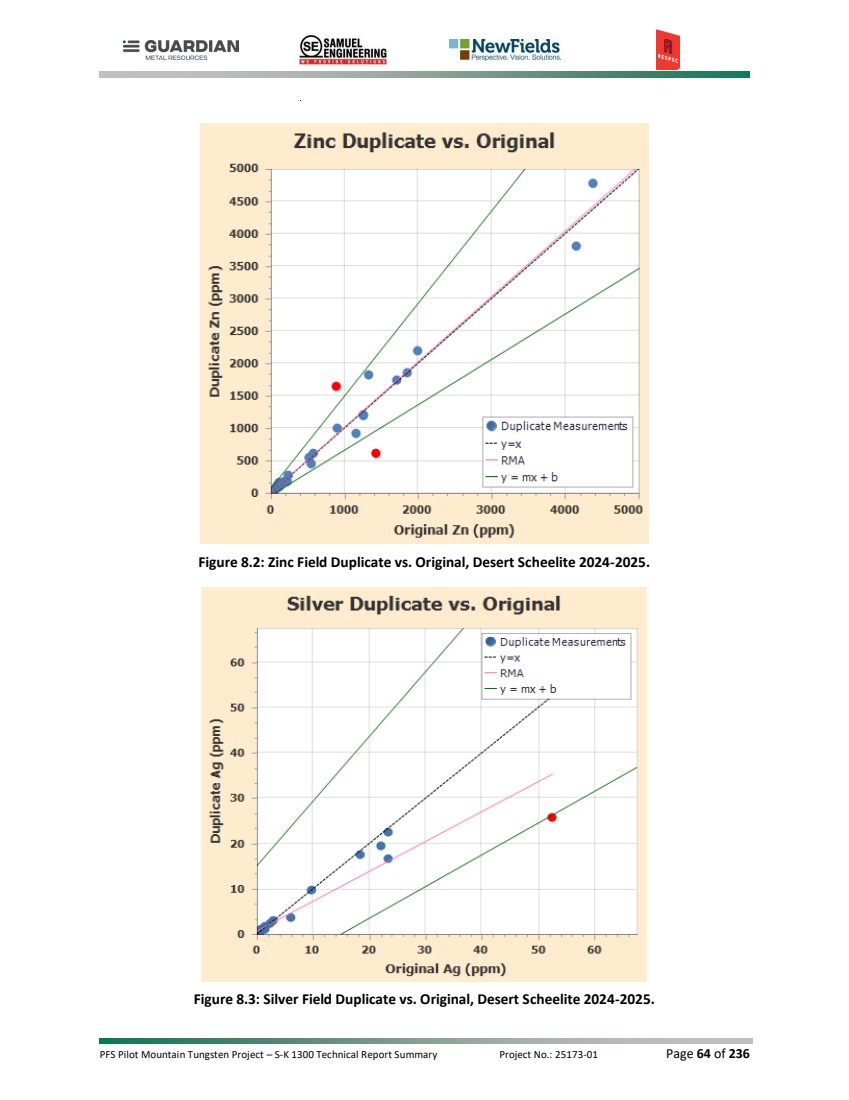
| PFS Pilot Mountain Tungsten Project – S-K 1300 Technical Report Summary Project No.: 25173-01 Page 65 of 236 8.3.1.4 PREPARATION DUPLICATES RESPEC notes that additional preparation duplicate data were generated after the data cutoff for this QA/QC review and will be incorporated into a subsequent QA/QC update. These results were not included in the present evaluation. The interpretations in this subsection are based on the preparation duplicate dataset available to RESPEC at the time of review, which provides an adequate basis for assessing sample preparation precision. Guardian Metal marked 26 coarse duplicate samples in the original sample stream and instructed ALS to prepare duplicates from the coarse rejects of the original sample. RESPEC evaluated these duplicate pairs in the same manner as field duplicates. A summary of the results is presented in Table 8.6. Table 8.6: Summary of Results for Preparation Duplicates in 2024–2025 Type Start Date End Date Metal Counts RMA Regression Rel Pct Diff Corr Coeff All Used Outliers (y = dup, x = orig) coarse prep dup. Sep-24 May-25 W 26 26 0 y = 0.995x - 3.072 –0.5 0.989 Ag 26 26 0 y = 1.029x + 0.484 2.8 0.988 Cu 26 26 0 y = 0.999x + 20.583 –0.1 1.000 Zn 26 26 0 y = 0.973x + 33.281 –2.7 0.998 The analysis used all samples. No outliers were removed. RMA regression results indicate strong linear relationships between original and duplicate assays, with correlation coefficients ranging from 0.988 to 1.000. RPDs were minimal, ranging from -2.7% to +2.8%, which suggests good analytical precision and negligible bias across all metals. Regression slopes were near unity, further supporting the reproducibility of the preparation duplicate assays. Variability and bias in RPD data tends to decrease at each stage of crushing, such that variability is highest in field duplicates, lower in preparation duplicates, and lowest in pulp duplicates. 8.3.1.5 PULP DUPLICATES RESPEC notes that additional pulp duplicate data were generated after the QA/QC data cutoff and will be incorporated into a subsequent QA/QC update. These results were not included in the present evaluation. The interpretations in this subsection are based on the pulp duplicate dataset available to RESPEC at the time of review, which provides an adequate basis for assessing analytical precision. Guardian Metal also marked 23 pulp duplicate samples in the original sample stream and instructed ALS to prepare pulp duplicates by splitting the original pulp material. A summary of the results is presented in Table 8.7. Table 8.7: Summary of Results for Pulp Duplicates in 2024-2025 Type Start Date End Date Metal Counts RMA Regression Rel Pct Diff Corr Coeff All Used Outliers (y = dup, x = orig) pulp dup. Sep-24 May-25 W 23 23 0 y = 1.031x + 40.811 3.0 0.979 Ag 23 18 1 y = 0.930x - 0.216 –7.2 0.988 Cu 23 23 0 y = 0.985x - 46.092 –1.5 0.984 Zn 23 23 0 y = 1.033x - 13.139 –0.5 0.995 RESPEC used all samples in the evaluation except for silver. For silver, RESPEC used 18 samples and excluded one outlier. RMA regression results show strong correlations between original and duplicate |
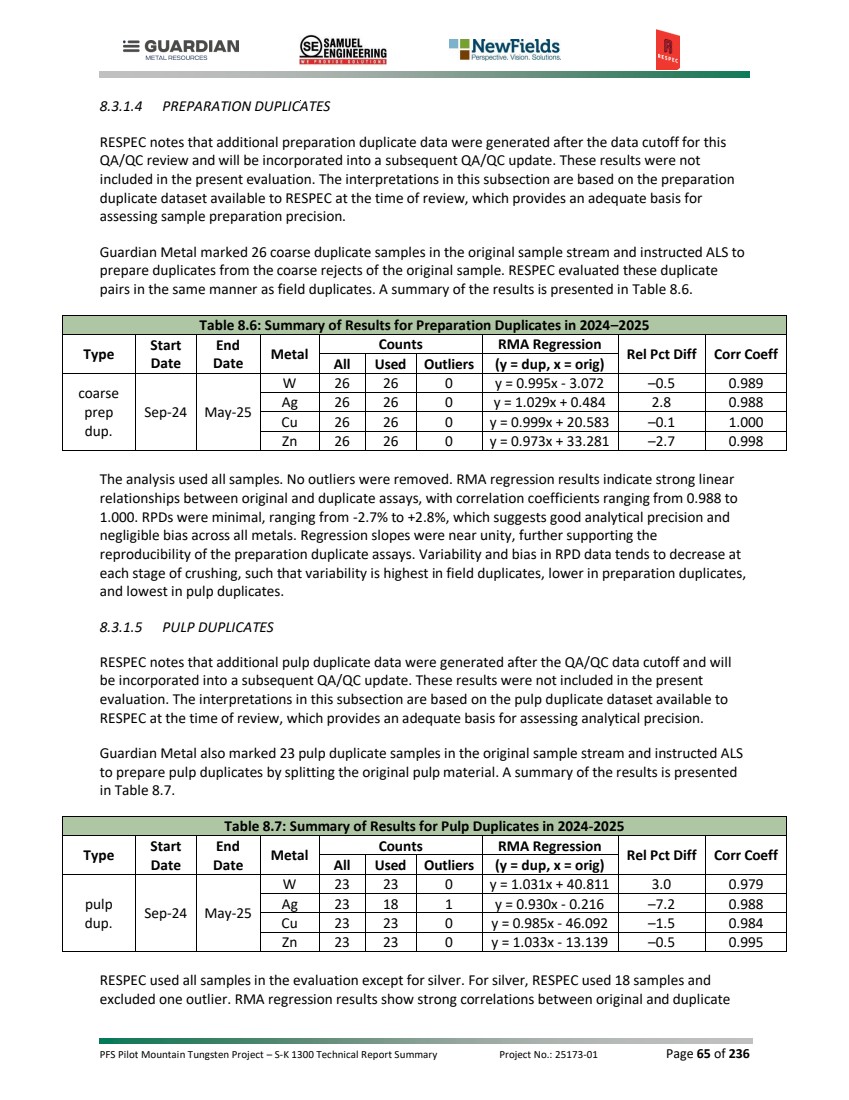
| PFS Pilot Mountain Tungsten Project – S-K 1300 Technical Report Summary Project No.: 25173-01 Page 66 of 236 assays, with correlation coefficients ranging from 0.979 to 0.995. RPDs were low across all metals, ranging from –7.2% to +3.0%. The silver assays exhibited a slight negative bias (RPD = –7.2%), consistent with earlier observations of lower duplicate values at low grades. Overall, the pulp duplicate results demonstrate good analytical precision and minimal bias. 8.3.1.6 SUMMARY OF HISTORICAL QA/QC RESULTS No QA/QC data are available for the original 1970s drilling or for the 2017 program completed by Thor. During the preparation of this resource estimate, no independent assessment of Black Fire’s 2011–2012 QA/QC program was possible, as the supporting data were not available for review. Although earlier technical reports—Golder [2012] and RES [2018]—describe Black Fire’s QA/QC procedures and results from their campaigns, the absence of underlying data precluded RESPEC from evaluating or verifying the conclusions. As a result, all conclusions by RESPEC regarding data quality for the Thor and Blackfire QA/QC are based solely on the current dataset and accompanying documentation. 8.4 QP OPINION Based on the documentation reviewed, the authors believe that the sample preparation, analytical procedures, and QA/QC protocols implemented by Guardian Metal during the 2024–2026 drilling programs are adequate to support the resource estimate presented in Section 11.0. Guardian Metal’s core handling, sampling, and chain-of-custody procedures followed reasonable standard operating procedures and were applied consistently throughout the drilling programs. ALS and MSALABS conducted sample preparation and analysis using appropriate multi-element and ore-grade analytical methods, with re-analysis of overlimit samples using methods suitable for higher-grade material. Guardian Metal’s QA/QC measures included insertion of certified reference materials, blanks, and field, coarse, and pulp duplicates at statistically meaningful frequencies. RESPEC reviewed the available QA/QC dataset using statistical evaluation, RPD, and regression analysis. The results indicate acceptable analytical accuracy and precision for the purposes of mineral resource estimation. Tungsten CRM results exhibited a modest but persistent negative bias and a slightly elevated failure rate relative to the other analyzed elements; however, the bias was generally small, the failures occurred sporadically across laboratories and time periods, and the results do not indicate a systematic analytical or procedural issue. Blank sample performance was generally acceptable, with isolated failures attributable to localized contamination events rather than persistent contamination. Duplicate data demonstrate acceptable reproducibility and indicate no material sampling, preparation, or analytical issues affecting the assay dataset. The authors conclude that the QA/QC results are adequate to support the use of Guardian Metal assay data in resource estimation. The observed analytical variability and minor biases are not considered material to the classification or reporting of Mineral Resources. Historical drilling completed by Black Fire and Thor utilized recognized sampling, preparation, and analytical procedures and incorporated QA/QC programs that included standards and blanks. However, the underlying QA/QC datasets were not available for independent review by RESPEC. Due to the absence of QA/QC data, the authors place lower confidence in the Black Fire and Thor datasets compared to Guardian Metal’s drilling programs. Nevertheless, data validation and comparative analyses discussed in Section 9.0 support the inclusion of selected Black Fire and Thor drilling data in the mineral resource estimate presented in Section 11.0. |
| PFS Pilot Mountain Tungsten Project – S-K 1300 Technical Report Summary Project No.: 25173-01 Page 67 of 236 Historical drilling data completed during the 1970s lacks documented sampling protocols and QA/QC records. The authors place lower confidence in the historical assay data compared to more recent drilling programs. However, as discussed in Section 9.0, data validation and reconciliation against more recent drilling support the inclusion of selected historical data in the estimate of mineral resources presented in Section 11.0. |

| PFS Pilot Mountain Tungsten Project – S-K 1300 Technical Report Summary Project No.: 25173-01 Page 68 of 236 9.0 DATA VERIFICATION RESPEC performed a variety of tasks to verify the Desert Scheelite and Garnet project data. The authors compared the current drilling database to original digital records, which included assay results, collar coordinates, and down-hole orientation surveys. Because historical drilling documentation was limited and consisted primarily of scanned assay certificates, RESPEC manually audited a representative subset of the dataset. As detailed in Section 8.3, the authors evaluated the available QA/QC data associated with assays. In addition to the data review, RESPEC conducted a site visit that included direct inspection of the deposit area and Guardian Metal’s operational facility in Hawthorne, Nevada. 9.1 SITE VISITS AND PERSONAL INSPECTIONS Accompanied by Guardian Metal geological personnel, RESPEC geologists visited the Pilot Mountain project on July 8 and 9, 2025, and conducted field examinations of altered and mineralized rocks of the Desert Scheelite, Garnet and Gun Metal deposits. They reviewed core from Desert Scheelite deposit holes PM24-12 and PM24-04 at Guardian Metal’s sample processing facility in Hawthorne, Nevada. The RESPEC geologists also reviewed core sample handling, processing, and storage protocols at the sample-processing and storage facilities, directly observed core handling at a rig drilling into the Garnet deposit, discussed QA/QC, logging procedures, and specific gravity (“SG”) measurements with Guardian Metal personnel, performed GPS collar checks at locations of select holes at drill sites, and collected confirmation samples for assay. 9.2 DRILL-HOLE DATA VERIFICATION Guardian Metal compiles and manages Desert Scheelite and Garnet drill-hole data in a digital database. The database incorporates information sourced from original field records and laboratory-issued data files. Guardian Metal provided RESPEC with the complete dataset, including original down-hole survey records and collar location documentation. RESPEC obtained the assay certificates for the 2024–2026 drilling program by directly downloading the data from ALS’s secure reporting system. For MSALABS results, RESPEC verified that the assay data contained in the database were internally consistent and matched the sample intervals, identifiers, and analytical methods documented in the laboratory data provided by Guardian Metal. RESPEC’s verification of the Desert Scheelite and Garnet project data included audits of the assay, down-hole survey, and collar location tables. For each dataset, RESPEC constructed independent comparison tables using original source files and evaluated them against Guardian Metal’s database. Software tools used for this process included Microsoft Excel and the Hexagon MS Torque program. RESPEC and Guardian Metal collaboratively reviewed and resolved any identified discrepancies. The final data tables used for resource estimation incorporated all necessary corrections. 9.2.1 Drill-Hole Collar Locations 9.2.1.1 COORDINATE COMPARISONS Guardian Metal’s coordinate datum usage has been clearly documented. During the collar audit, RESPEC identified historical records that had previously been transformed to UTM coordinates using the NAD83 datum. To assess the positional implications of this discrepancy, RESPEC performed coordinate comparisons between WGS84 and NAD83 datums across all collar locations with ASPS survey records. |
| PFS Pilot Mountain Tungsten Project – S-K 1300 Technical Report Summary Project No.: 25173-01 Page 69 of 236 RESPEC calculated the positional offsets using Euclidean distance between Easting/Northing pairs. As summarized in Table 9.1, the mean offset was 0.1093 m with a standard deviation of 0.0006 m. These results confirm sub-decimeter consistency across the dataset. Table 9.1: Positional Offset Statistics WGS84 Versus NAD83 Coordinate Comparison Offset Statistic Value Minimum Offset 0.1087 Maximum Offset 0.1099 Mean Offset 0.1093 Median Offset 0.1097 Standard Deviation 0.0006 Number of Collar Points 70 Given the minimal positional difference and the consistent use of WGS84 in modern data acquisition, all coordinates in this report are retained in UTM WGS84. This approach ensures internal consistency and avoids unnecessary transformation artifacts. Based on the comparison results, the positional tolerance is well within acceptable limits. 9.2.1.2 GPS COLLAR CHECKS During the July 2025 Pilot Mountain project site visit, RESPEC geologists took GPS measurements on eight drill pads, or suspected drill pads, to spot-check coordinates in Guardian Metal’s collar tables (Table 9.2). Field measurements and collar coordinates in the database were taken in NAD83 meters for comparison in Table 9.2. RESPEC found direct evidence of drill holes—concrete plugs, drill pipe, or open holes—at six sites. Four sites had drill-hole identifications marked in some way, of which two were Guardian Metal holes. Two sites were suspected or determined to be pads using less direct evidence, such as the presence of cuttings, or level spots likely constructed for no other reason than drilling. Where no drill-hole identification was found at the site, the closest drill collar in the database was used for comparison. Table 9.2 gives the best-case comparisons (although unconfirmed). The RESPEC geologists used a Garmin eTrex - Legend non-differential GPS to measure coordinates at the drill sites and pads. The Garmin website indicates that the eTrex - Legend device is accurate to within “3- 5 m (10-16 ft), 95% typical with DGPS corrections, <15 m (49 ft) RMS, 95% typical.” The overall results were good for all holes and suspected pads, drill sites, and inferred collar locations. All measured coordinates were within an expected range of the non-differential GPS accuracy when compared to the database coordinates. The largest discrepancy was 3.6 m for northings and eastings. Differences up to 6.4 m were noted for elevations, although GPS readings in the vertical sense tend to be less accurate. |
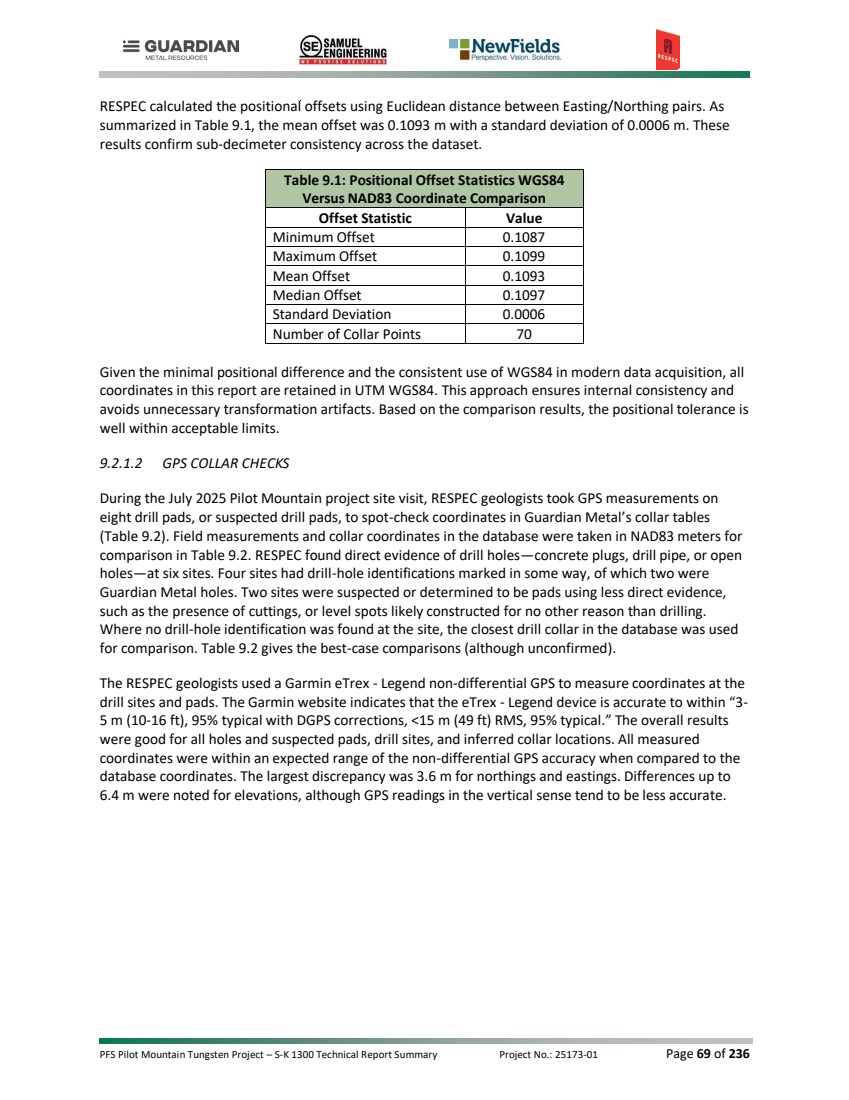
| PFS Pilot Mountain Tungsten Project – S-K 1300 Technical Report Summary Project No.: 25173-01 Page 70 of 236 Table 9.2: Verification GPS Checks of Drill Collars at the Pilot Mountain Project Location Drill-Hole ID Description RESPEC GPS Collar Coordinates Guardian Database Collar Coordinates Difference - RESPEC vs Database Easting (m) Northing (m) Elevation (m) Easting (m) Northing (m) Elevation (m) Easting (m) Northing (m) Elevation (m) Desert Scheelite - Test pit DSDD-02? Old wood stake in ground with no apparent markings or concrete plug 424,040 4,248,272 1,955 424,040 4,248,273.41 1,956.2 0 1.41 1.2 Desert Scheelite - Test pit DSDD-03 2ft diameter concrete plug with hole ID carved into surface 424,083 4,248,286 1,954 424,083 4,248,288.78 1,956.7 0 2.78 2.7 Desert Scheelite - Test pit 87 Rebar with orange plastic cap possibly embedded in concrete; Adjacent orange pin flag marked with '87' 424,124 4,248,289 1,955 424,125 4,248,287.26 1,957.923 1 –1.74 2.923 Desert Scheelite - Near trench west of test pit PM24-33 1½in x 1½in wood stake marked with hole ID, proposed hole ID, and dip of hole; Painted red and embedded in concrete plug 423,906 4,248,252 1,989 423,908 4,248,248.73 1,990.148 2 –3.27 1.148 Desert Scheelite - South of test pit PM24-17 Same 1½in x 1½in wood stake embedded in concrete plug as PM24-17; Also has aluminum tag at base of stake marked with hole ID 424,305 4,248,331 1,945 424,307 4,248,328.79 1,948.363 2 –2.21 3.363 Good Hope DH-81 5½in-diameter casing extending 8in to 10in above ground surface on old drill pad. 423,916 4,249,462 1,953 423,917 4,249,458.4 1,957.8 1 –3.60 4.8 Garnet - At site of Guardian drill hole PMGR25- 119 in progress GR-070? Metal casing with metal cap is likely created on-site with cutting torch; Hole not marked, but GR-070 is the only drill hole with reasonable coordinates 422,230 4,249,455 2,176 422,233 4,249,452 2,175.7 3 –3.00 –0.3 Gun Metal GM-31 Metal cap with handle over open hole; Aluminum tag marked with hole ID attached to handle of cap with wire tie or bailing wire; Buried over time with 3in to 4in of loose sediment 422,447 4,248,861 2,143 422,448 4,248,858.6 2,149.4 1 –2.40 6.4 Note: Coordinates measured in UTM NAD 83 Zone 11 meters projection |
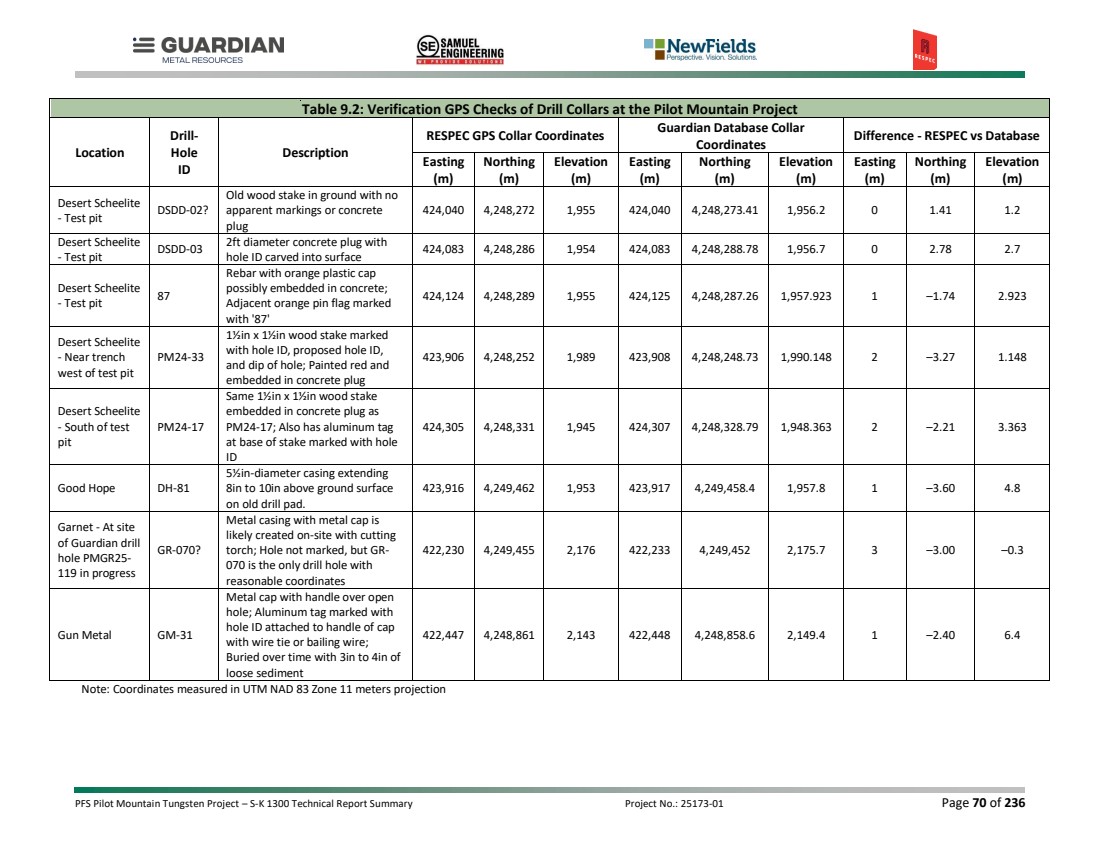
| PFS Pilot Mountain Tungsten Project – S-K 1300 Technical Report Summary Project No.: 25173-01 Page 71 of 236 9.2.2 Down-Hole Surveys Guardian Metal provided RESPEC with digital copies of the raw survey data in Excel format for each drill hole. RESPEC used these files to verify the down-hole orientation data stored in Guardian Metal’s database. RESPEC did not identify any discrepancies. No down-hole orientation data were available for the historical drill holes. As a result, survey verification was limited to the 2024–2026 dataset. No assessment of deviation parameters or survey accuracy was possible for earlier drilling campaigns. 9.2.3 Assays 9.2.3.1 AUDIT OF ASSAYS Using digital data files downloaded directly from ALS, RESPEC audited tungsten, silver, copper, and zinc assay values from Guardian Metal’s drilling programs in Guardian Metal’s database. RESPEC used scanned original certificates from Rocky Mountain Geochemical, Skyline Labs, and Southwestern Assayers and Chemists provided by Guardian Metal to verify historical drill-hole assays in the historical drill database. RESPEC identified minor discrepancies, primarily in historical silver, copper, or zinc assays where sample intervals were recorded as nil values in the database but reported as below detection limit on the original certificates. In addition, RESPEC discovered that the conversion factor from elemental tungsten to tungsten trioxide (WO3) was inconsistently applied across the assay records. RESPEC resolved all discrepancies in consultation with Guardian Metal personnel. During the audit of the historical tungsten assay dataset, RESPEC noted that the analytical method employed by UCC and Duval for Desert Scheelite was colorimetry, as indicated on original certificates from laboratories active during the 1970s, including Skyline. Colorimetric analysis was a routine and widely accepted technique for tungsten determination during that period. Although no QA/QC data from the original campaigns are available, RESPEC chose to use select historical colorimetric data in the current Desert Scheelite resource model based on the corroborating evidence from comparative analyses. For the Garnet deposit, RESPEC identified significant inconsistencies in the historical UCC assay data. The UCC samples were composited to variable and often excessively long intervals, and the resulting tungsten grades were consistently higher than comparable intervals in the modern Guardian Metal dataset. RESPEC used the UCC data only to support geological interpretation and excluded them from grade interpolation in the Garnet resource model. A detailed comparative assessment of the historical assays is provided in Section 9.2.3.2.2. 9.2.3.2 ASSESSMENT OF HISTORICAL ASSAYS 9.2.3.2.1 Desert Scheelite Population Comparison To assess the compatibility of the assay datasets generated by different operators, RESPEC constructed box plots and cumulative probability plots (“CPP”) for WO₃ values grouped by company. This method enabled visual comparison of distribution characteristics, including grade ranges, detection limits, and population continuity (Figure 9.1). |
| PFS Pilot Mountain Tungsten Project – S-K 1300 Technical Report Summary Project No.: 25173-01 Page 72 of 236 Figure 9.1: Box Plots of WO3 Data Sorted by Company. RESPEC evaluated the Guardian Metal, Duval, and UCC WO₃ datasets to assess their compatibility and impact on resource estimation. As summarized in Table 9.3, Guardian Metal and Duval report broadly similar grade distributions, with mean values near 0.12% WO₃ and medians around 0.02% WO3. Both datasets show high variability, strong skewness, and numerous outliers. This variability results from the broader sampling coverage that Guardian Metal and Duval conducted to capture the full range of WO₃ grades across the deposit. In contrast, the UCC dataset reflects a higher-grade population with a mean of 0.31% WO3, a median of 0.27% WO3, and shows tighter clustering with fewer outliers. The UCC distribution appears less skewed and more stable, but the smaller sample size and higher detection limit reduce its direct comparability to Guardian Metal and Duval. At the upper end of the distribution, Guardian Metal reports slightly higher WO₃ values, which RESPEC attributes to the use of XRF analysis for overlimit assays during the 2024–2025 drilling program. Overall, Guardian Metal and Duval provide a statistically compatible foundation for resource estimation, while UCC contributes valuable higher-grade context within its restricted population. Table 9.3: Desert Scheelite WO3 Population Statistics by Company Company Number of Samples Min Max Mean Median Co. of Variation Skewness Kurtosis Max Non-Outlier Guardian 2,174 0.00063 3.04 0.121 0.021 2.05 5.18 40.86 0.34 Duval 1,964 0.0003 2.84 0.115 0.021 1.89 4.05 27.93 0.34 UCC 516 0.02 1.93 0.312 0.270 0.78 1.77 6.05 0.82 The population distributions for Duval, Guardian Metal, and UCC show broadly similar grade profiles (Figure 9.2). Although the UCC dataset represents a smaller and more restricted population, its cumulative curve breaks at approximately 0.2% WO3 with a slope angle that closely matches those observed in the Duval and Guardian Metal datasets. Between approximately 10% and 90% of the data, the slope and spacing of the curves remain consistent across all three operators, indicating comparable grade populations despite differences in dataset size and detection limits. At the upper end of the distribution, Guardian Metal’s dataset extends to slightly higher WO₃ values, which RESPEC attributes to the use of XRF analyses for overlimit assays during the 2024-2026 drilling program. |
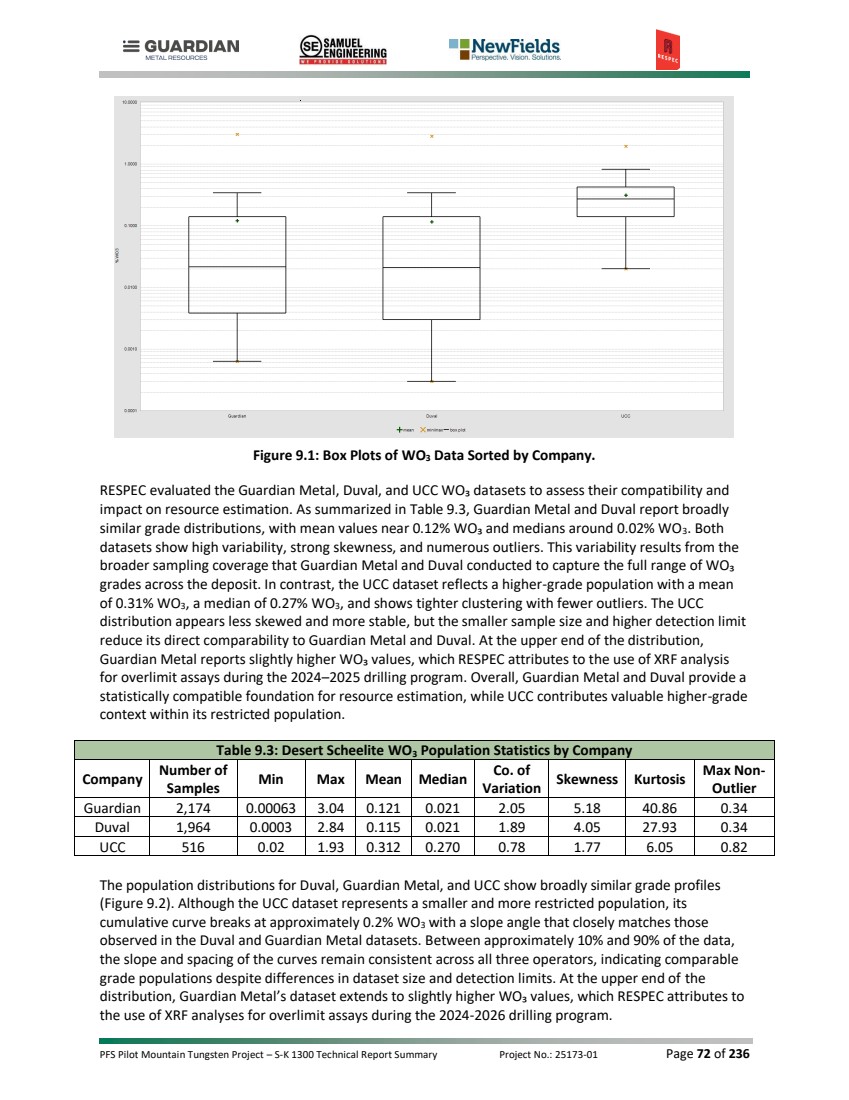
| PFS Pilot Mountain Tungsten Project – S-K 1300 Technical Report Summary Project No.: 25173-01 Page 73 of 236 Figure 9.2: Cumulative Probability Plots of Desert Scheelite WO3 Assays by Company—Guardian Metal in Blue, Duval in Green, and UCC in Red. To further assess the compatibility of the historical and modern assay datasets, RESPEC performed a comparison interpolation on a spatially constrained subset of the data. The analysis indicated that the historical-only dataset returned WO₃ grades approximately 17% higher than the Guardian Metal-only dataset. The overall grade populations appear broadly similar, but the limited number of lower grade samples, particularly in the UCC dataset, combined with selective sampling of mineralized intervals and higher detection limits, likely placed greater emphasis on higher grades in the interpolation. Another contributing factor is the drilling orientation of the historical holes. The vertical historical holes intersected the subvertical deposit at low angle oblique intercepts, which likely exaggerated the apparent thickness of higher-grade zones. In contrast, Guardian Metal designed its drilling program with angled holes to approximate true thickness and reduce geometric bias. RESPEC considers the observed difference to reflect sampling population effects and drilling geometry rather than a systematic analytical bias, although RESPEC cannot entirely rule out alternative explanations. 9.2.3.2.2 Garnet Assay Population Comparison RESPEC evaluated the Guardian Metal, Thor, and UCC assay datasets for the Garnet deposit (Table 9.4) to determine their suitability for combined use in grade interpolation. The analysis shows that Guardian Metal and Thor form a consistent modern population, while UCC represents a separate historical dataset with materially different grade characteristics. Table 9.4: Garnet WO3 Population Statistics by Company Company Number of Samples Min Max Mean Median Co. of Variation Skewness Kurtosis Max Non-Outlier Guardian 2,815 0.00009 1.23 0.048 0.003 2.53 4.17 22.15 0.05 Thor 593 0.003 1.97 0.060 0.003 3.00 6.28 51.84 0.05 UCC 107 0.001 1.24 0.326 0.255 0.79 1.43 2.20 0.87 |
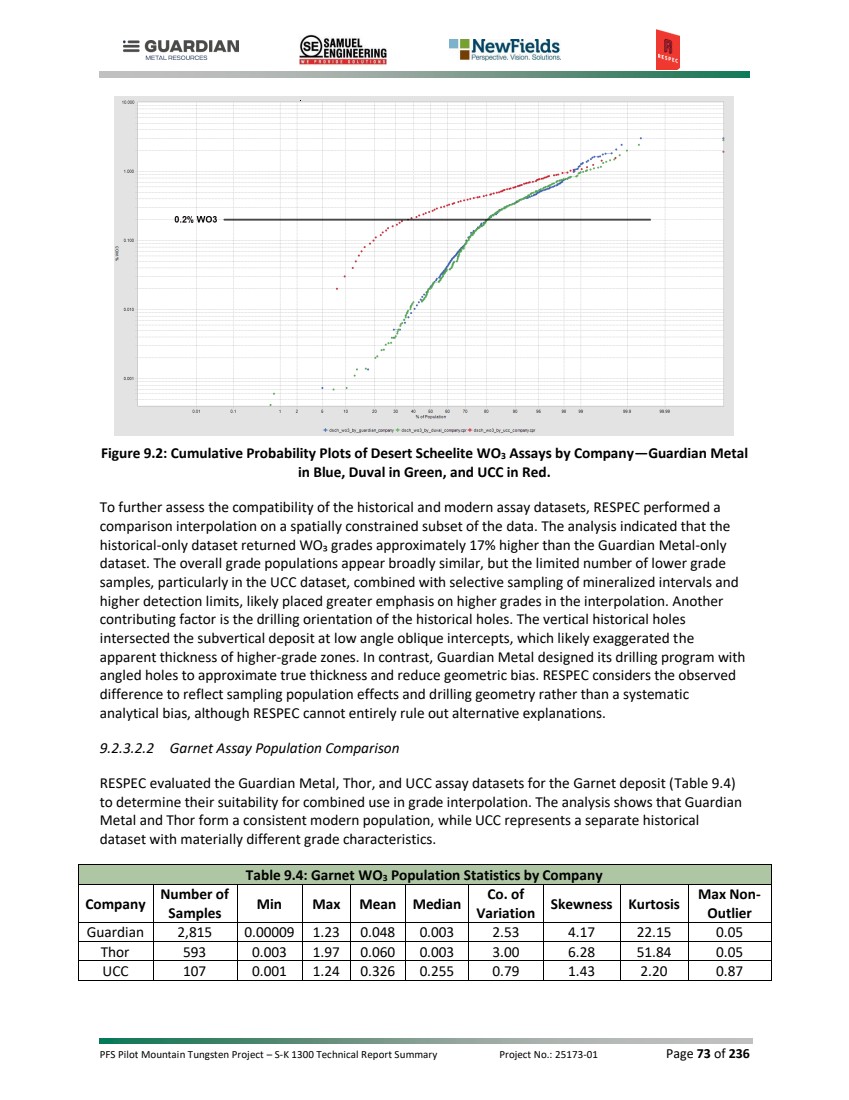
| PFS Pilot Mountain Tungsten Project – S-K 1300 Technical Report Summary Project No.: 25173-01 Page 74 of 236 Guardian Metal and Thor display aligned grade distributions and sampling behavior. Both datasets contain numerous short‑interval samples and show low central‑tendency values with high relative variability. Their statistical profiles indicate systematic sampling across both mineralized and unmineralized intervals, with infrequent high‑grade values occurring as isolated tail events. These characteristics support treating Guardian Metal and Thor as a unified population for estimation. The UCC dataset exhibits substantially higher grades, lower relative variability, and longer sample intervals (Figure 9.3). These characteristics indicate preferential sampling of mineralized zones and historical compositing practices rather than comprehensive coverage of the full grade range. The UCC grade distribution does not align with the modern datasets and would bias the modeled grade distribution if included in interpolation. Figure 9.3: Sample Length vs. WO3 Grade for Garnet Assay Sources Based on these results, RESPEC included Guardian Metal and Thor in the estimation dataset and excluded UCC from grade interpolation. RESPEC used the UCC data only to support geologic interpretation and to confirm the presence and general distribution of mineralized zones. The historical sampling intervals and grade characteristics differ from the modern drilling, and the available records do not allow RESPEC to verify that the UCC assays represent the same geologic grade population. 9.2.3.3 CONFIRMATION SAMPLES RESPEC geologists collected field grab samples from outcropping mineralized zones within the Desert Scheelite and Gunmetal deposits. They obtained these samples to provide independent confirmation of mineralization style and tenor, recorded the sample locations using a handheld GPS, and made basic lithologic descriptions of the samples at the time of collection. The samples were submitted to ALS for multi-element analysis (Table 9.5). |
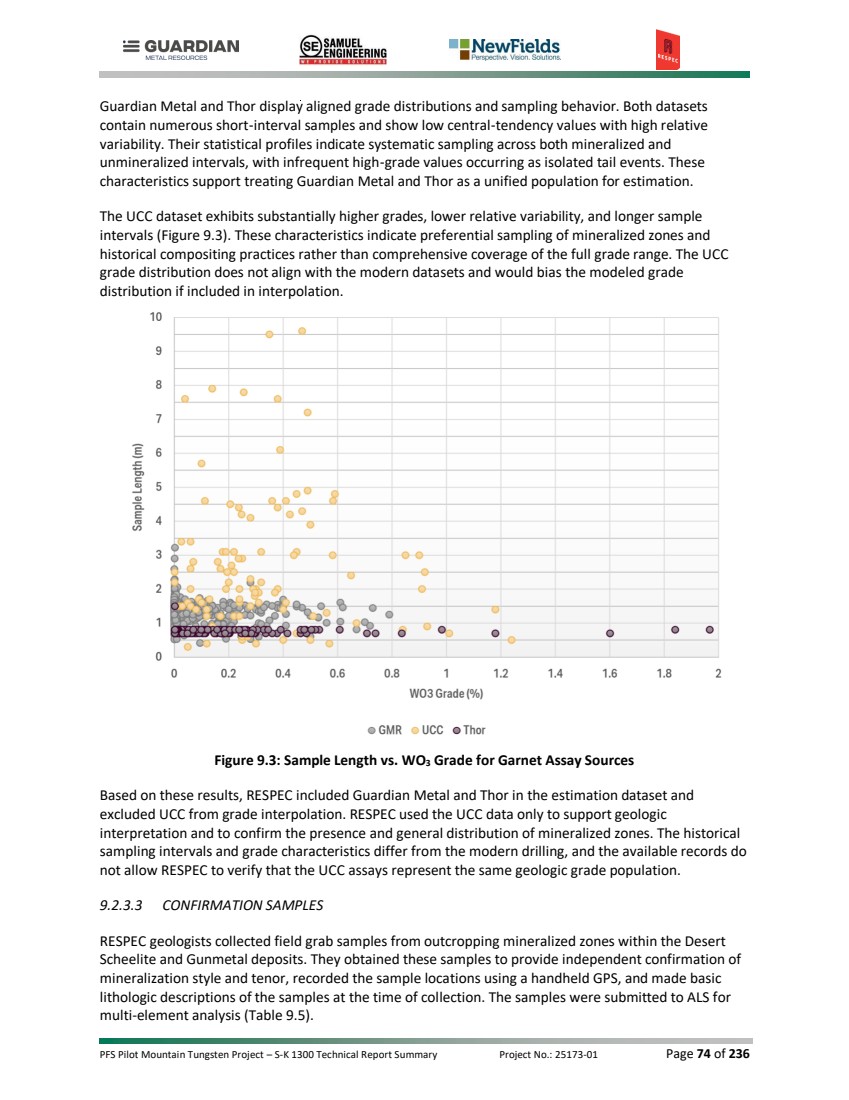
| PFS Pilot Mountain Tungsten Project – S-K 1300 Technical Report Summary Project No.: 25173-01 Page 75 of 236 Independent analysis of the grab samples confirmed the existence of the tungsten and base metal mineralization that occurs at the Pilot Mountain project. Assay results were consistent with the observed lithologic associations, providing qualitative support for the geological interpretations and mineralization model. 9.3 LIMITATIONS The verification of the historical data was subject to several limitations. The lack of down-hole survey records for historical drill holes, prevented RESPEC from validating their orientation parameters or deviation profiles. In addition, incomplete or missing assay certificates from early campaigns, limited RESPEC’s ability to confirm original analytical results for some intervals. Where original documentation was unavailable, RESPEC necessarily relied on database entries. RESPEC documented these limitations and considered them in the assessment of the reliability of the historical data and in decisions regarding the use of that historical data in the estimate of mineral resources presented in Section 11.0. 9.4 ADEQUACY OF DATA In the authors’ opinions, the data reviewed and verified during the audit are adequate for use in mineral resource estimation and disclosure under S-K 1300. Limitations in the historical dataset, which include incomplete down-hole survey records and inconsistent assay documentation, were identified and addressed through comparative analysis. Confidence is lower in areas influenced predominantly by pre‑Guardian Metal drilling, particularly where vertical holes intersect steeply dipping mineralized zones at Desert Scheelite. These configurations may have introduced local bias toward wider zones of estimated higher grades. However, comparative analysis supports the overall inclusion of this historical data in the Desert Scheelite resource estimate, with the limitations noted. Guardian Metal’s dataset generated during the 2024-2026 drilling program meets current industry standards and supports the reliability of the resource model. Guardian Metal and RESPEC integrated the historical data with appropriate caution. While acknowledging that there is some risk associated with the estimated volume of higher-grade material, the resulting database is suitable for technical reporting, resource estimation, and regulatory compliance. Assays determined by colorimetric methods during the 1970s drilling campaigns are considered acceptable for inclusion in the mineral resource estimate. Although these methods are less precise than modern instrumental techniques, colorimetry was a recognized and widely used procedure for tungsten analysis at the time. Partial assay certificates recovered by Guardian Metal provide traceability, and one of the original laboratories, Skyline Labs, was later accredited to ISO 9001 and ISO/IEC 17025 standards. Although no QA/QC data from the original campaigns are available, the corroborating evidence from comparative analyses justifies the use of select historical colorimetric data in the current resource model. For the Garnet deposit, RESPEC noted more pronounced limitations in the historical dataset. The UCC drilling reflects older sampling practices, including unusually long composite intervals for which no supporting documentation or rationale has been recovered. These factors reduce confidence in the representativeness of the UCC assays relative to the modern Guardian Metal and Thor drilling and limit RESPEC’s ability to confirm that the historical samples characterize the same geologic grade population. As a result, RESPEC used the UCC dataset only to support geologic interpretation and to confirm the general distribution of mineralized zones and excluded the UCC assays from grade interpolation in the Garnet resource model. |
| PFS Pilot Mountain Tungsten Project – S-K 1300 Technical Report Summary Project No.: 25173-01 Page 76 of 236 Table 9.5: Assay Results from Independent Confirmation Testing of Field Grab Samples Sample ID Location Description RESPEC GPS Sample Location W Ag Pb Zn Cu Mo Easting Northing Elevation (ppm) (ppm) (ppm) (ppm) (ppm) (ppm) DS-01 Desert Scheelite - Test pit Oxidized garnet skarn with abundant black, dark brown and orange FeOx; Cu stain up dip in possible E-W, 70° north-dipping structure 424,033 4,248,259 1,960 1,360 25.6 15.0 13,150 7,600.0 213.0 DS-02 Desert Scheelite - Test pit Oxidized garnet skarn - Mixed garnet-rich, weakly to moderately oxidized skarn and strongly oxidized rock with dark brown to black FeOx; To south of DS-01 across quartz monzonite 'dike' 424,037 4,248,261 1,959 3,510 3.24 42.3 11,300 5,440.0 382.0 DS-03 Desert Scheelite - Trench Sample across 1m- to 2m-wide [possible] fault-breccia zone with abundant silicification, quartz and calcite veins and black FeOx stain; Within moderately to strongly oxidized skarn with high garnet content 423,920 4,248,246 1,986 760 1.8 47.8 654 57.5 36.6 DS-04 Gun Metal - In open cuts at east end of series of cuts and underground workings Grab sample from skarn cobbles and boulders in cut; Contains 80% to 90% garnet No GPS coordinates of location 2,780 3.33 4.6 1,170 26.0 27.1 DS-05 Gun Metal - In open cut in central portion of series of cuts and underground workings Skarn containing 80% to 90% garnet and abundant quartz veins 422,241 4,249,031 2,206 1,430 0.33 6.1 189 17.9 64.5 Note: Coordinates measured in UTM NAD 83 Zone 11 meters projection |
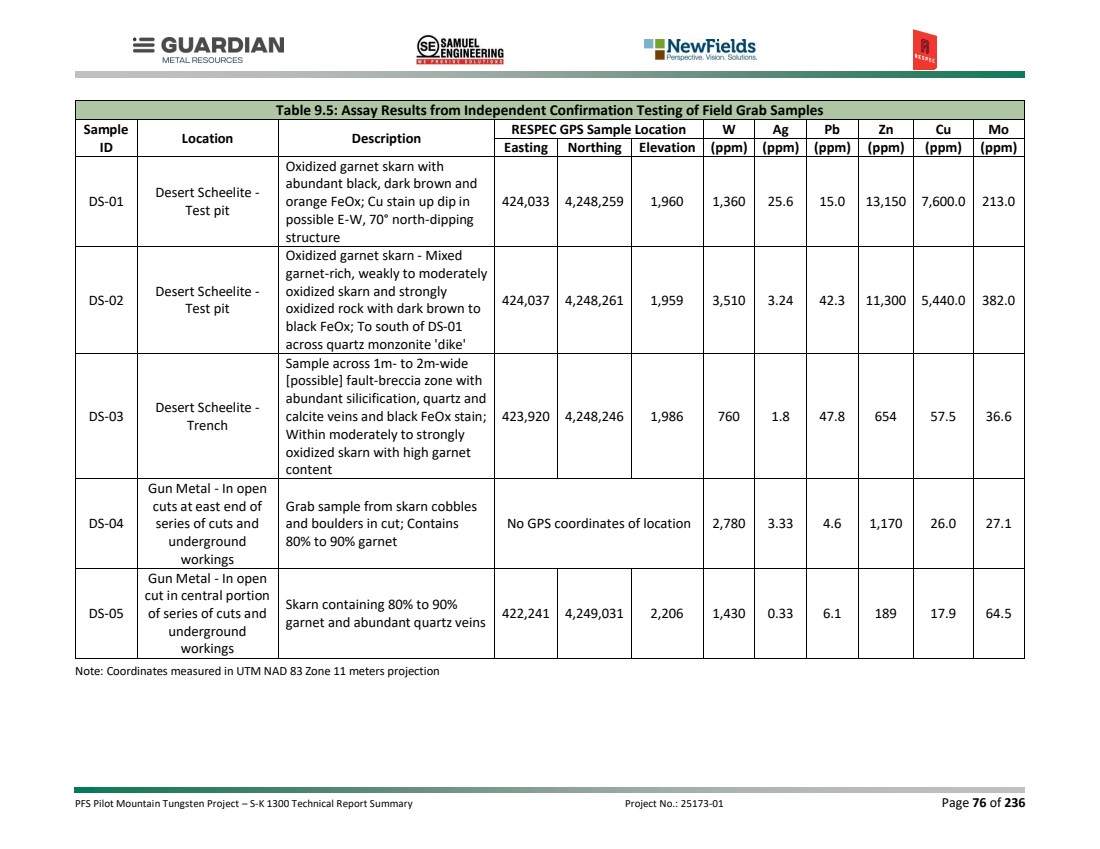
| PFS Pilot Mountain Tungsten Project – S-K 1300 Technical Report Summary Project No.: 25173-01 Page 77 of 236 10.0 MINERAL PROCESSING AND METALLURGICAL TESTING 10.1 REVIEW OF HISTORICAL METALLURGICAL TESTWORK 10.1.1 Pilot Mountain Historical Testwork Several metallurgical testwork programs have been completed on multiple samples of mineralization from the Pilot Mountain project. The work dates to 2012, when Black Fire Minerals contracted Amdel Laboratories Perth to perform initial mineralogical characterization and metallurgical testwork, overseen by Coffey Mining. Testwork was also performed in 2013 at Guangzhou Research Institute of Non-Ferrous Metals (GZRINM) to expand on the mineralogy and metallurgical testwork. The last major test program before the current program was performed in 2019 at the Guangdong Institute of Resources Comprehensive Utilization (GIRCU). 10.1.1.1 Amdel Laboratories/Coffey Mining, 2012 Pilot Mountain testwork conducted by Coffey Mining in 2012 at Amdel Laboratories Perth indicated the target tungsten-containing mineral as scheelite, existing as an inclusion or composite with gangue materials garnet, quartz, calcite, and various silicates. Tungsten trioxide (WO₃) grades across different samples obtained from different deposits ranged from 0.3% to 0.4%. Sulfide ores, namely pyrite, chalcopyrite, sphalerite, and to a lesser extent galena, were also identified in the samples. Mineralogy was performed using an initial liberation P₈₀ 106 µm followed by wet screening into ±45 µm fractions. The 45 µm oversize was subjected to two rounds of gravity separation, utilizing a Wilfrey table in the roughing stage and a Mozley table in the cleaning stage. The initial testwork found upgrade ratios ranging from 5 to 8 with 75% to 87% tungsten recovery in the concentrate streams, which account for 10% to 15% of the feed mass. Gravity cleaning further improved the tungsten grade, improving the concentrate-to-feed ratio to 27:1, with 72.5% tungsten stage recovery and a concentrate mass percentage of 1.7% of the mass presented to the gravity section. Rougher flotation was conducted on both P₈₀ 106 and 45 µm samples. Initial attempts aimed to produce two sulfide concentrates and an oxide concentrate. This testwork revealed some improvement to grade at the expense of significant tungsten losses that could reveal slow flotation kinetics, need for gangue depressants, and/or overgrinding of the softer scheelite. A second round of testing concluded calcite as the major dilutant, necessitating calcite depressants such as sodium silicate and pH modifiers such as sodium carbonate. This attempt obtained tungsten recoveries of 90.7% and an upgrade ratio of only 2:1. In the concentrate stream, calcium was identified as a major dilutant, with 70% Ca recovery in the concentrate. This test combined P₈₀ 45 µm undersize of gravity concentration middlings and tailings. The test yielded promising results for sulfide separation with sulfide recovery in the concentrate of 6.2% and oxide recovery in the concentrate of 57.1%. The sulfide concentrate displayed 92.6% copper recovery, 91.5% silver recovery, with a small (1.6% recovery) loss of tungsten. Kinetic testing of the flotation revealed sulfide kinetics were fast, while the oxide (tungsten) kinetics were slower. Rare Met Consulting expands on the conclusions of Coffey Mining that gravity separation can be a feasible pre-concentration step followed by non-classical flotation methods tailored to Pilot Mountain that can separate sulfide and oxide ores. |
| PFS Pilot Mountain Tungsten Project – S-K 1300 Technical Report Summary Project No.: 25173-01 Page 78 of 236 The report suggests that further mineral liberation studies be performed at narrower particle size ranges: 106 µm, 75 µm, 45 µm, and minus 45 µm; especially given the finer dissemination of sulfide ores that may necessitate a finer grind to liberate the materials of interest. For separation methods, it was recommended that the investigation of gravity concentration be continued, with particular attention to the grinding and further wet table scavenging/cleaning of the middling and tailing products. This further research was recommended to be performed by the Guangzhou Research Institute of Non-Ferrous Metals. 10.1.1.2 GZRINM Testwork, 2013 GZRINM developed two exploratory flowsheets capable of producing tungsten concentrate at grades and recoveries above 60%. Additional recovery of copper and silver mineralization was targeted, with concentrate grades of 22% Cu and 1200-1275 g/t Ag, and recoveries of 55% and 35%, respectively. Both flowsheets employ flotation methods, while one also utilizes high-intensity magnetic separation. GZRINM found that lead, zinc, molybdenum, tin, bismuth, manganese, and arsenic are present in ore samples but not in sufficient economic quantity. Iron and calcium were identified to be present in large quantities that could prove as an obstacle to the beneficiation of the target metals. 10.1.1.2.1 Mineralogy The grain sizes of scheelite and chalcopyrite minerals were found to be relatively coarse, with the majority of scheelite ranging from 10 µm and 320 µm and chalcopyrite from 10 µm to 40 µm. Scheelite and chalcopyrite liberation was shown to be greater than 93% when samples are ground at a passing size of 54.3% minus 74 µm. Finer grinding to greater than 78.3% passing 74 µm improved liberation to greater than 98%, with a small fraction (<1%) of micro-fine inclusions of ore that are difficult to liberate at any grinding. Minerology showed that scheelite accounted for 90.1% of the occurrence of tungsten in the samples provided. Scheelite was also found to contain on average 2.4% (but up to 12.6%) molybdenum as an impurity. Sulfide ores accounted for an additional 0.97% of the tungsten’s occurrence, non-magnetic gangue materials for 2.47%, and magnetic gangue materials for 6.45%. This distribution indicates a theoretical recovery of tungsten of ~90%, and exploratory particle size testing indicates that the distribution of tungsten is uniformly distributed across run-of-mine particle sizes, eliminating classification and desliming as potential beneficiation solutions. Copper mineralization was found to be; ~74% chalcopyrite (with common impurities being calcium, aluminum, and silicon); chalcocite, bornite, enargite, and malachite accounting for ~10%; 3.29% in other sulfide ores; 6.11% in non-magnetic gangue; and 6.54% in magnetic gangue. This distribution indicates a reported theoretical recovery of copper of ~84%. Silver predominantly occurs in galena (31.2%), pyrite (27.7%), magnetic gangue (24.1%), non-magnetic gangue (9.1%), and chalcopyrite, enargite, and similar copper-containing minerals (7.5%), to a concluded theoretical silver recovery of 38% into a primary copper concentrate. 10.1.1.2.2 Initial Testwork The froth flotation of sulfides and tungsten was investigated assuming the following workflow: • Grinding of ore to a nominal 74 µm |
| PFS Pilot Mountain Tungsten Project – S-K 1300 Technical Report Summary Project No.: 25173-01 Page 79 of 236 • Rougher flotation of sulfides • Rougher scavenger flotation of sulfides • Rougher flotation of tungsten • Two scavenger flotation steps for tungsten It was found that increasing the fineness of the flotation feed (54.3% passing to 92.3% passing 74 µm) increases tungsten recovery (decreasing tungsten grade) in the first tungsten flotation concentrate stream and decreases losses to tailings, as seen in Figure 10.1. As grinding becomes finer, it was observed that tungsten losses to the sulfide flotation concentrates increase. GZRINM recommended a 74 µm passing percentage between 65.4 and 78.3%. Figure 10.1: Tungsten trioxide recoveries versus grind size (GZRINM, 2013) Due to the large concentration of paramagnetic garnet gangue, high-intensity magnetic separation (HIMS) was also investigated as an option to aid separation. The report suggests two methods, typical HIMS as well as wet high-intensity magnetic separation (WHIMS). The HIMS method would employ one round of HIMS where the magnetic gangue concentrate was removed, and non-magnetic tailings were sent through a second round of HIMS to yield two magnetic concentrates and non-magnetic tailings. For this process, it was found that only 61.5% of the tungsten was recovered in the non-magnetic tailings and therefore not recommended. The WHIMS method, which utilizes a pulsation action onto the slurry, was also designed in two stages. The rougher magnetic concentrate was scavenged by a second step of WHIMS, yielding only one magnetic concentrate stream as well as tungsten-enriched middlings and tailings. This method recovers 73.5-76.6% of the tungsten, depending on grind size (with 65.40% passing 74 µm determined to be the optimum grind). The magnetic field intensity was also varied, and it was determined that 0.6 T was the optimal setpoint to balance tungsten recovery and gangue removal (81.8% tungsten recovery). |
| PFS Pilot Mountain Tungsten Project – S-K 1300 Technical Report Summary Project No.: 25173-01 Page 80 of 236 Gravity separation was also considered for use in tungsten separation. The test protocol uses two gravity tables, in series, on a sample milled to a varying grind size passing 74 µm. It was found that this method of gravity separation alone was insufficient for significant grade improvements, leading the study to include screening in the workflow as well. A 120 µm screen was added to the feed, with the oversize being ground to produce an overall grind size of 93.4% passing 120 µm entering the first shaker table. This workflow found greater levels of upgrading but observed losses of nearly 22% of the tungsten in the tailings. 10.1.1.2.3 Second Phase Testwork GZRINM identified two flowsheets for further testwork for the beneficiation of tungsten and sulfide minerals. The first proposed method was the “Whole Flotation” flowsheet, which features only froth flotation. The feed to this system was ore ground to a P₇₀ 74 µm. This results in a tungsten grade of 5.44% in the first concentrate tungsten concentrate stream with losses of 10.89% in the tailings, which accounts for 63.29% of the total mass of the feed. This flowsheet also concluded that separation of sulfides from tungsten occurs efficiently for this process to be considered feasible. The second flowsheet employs WHIMS followed by flotation and gravity separation (“WHIMS-gravity-flotation”). The feed conditions are identical to that of the Whole Flotation case, which was fed into a single WHIMS unit. The magnetic concentrate was gravity separated into tungsten concentrate, middlings, and tailings, while the non-magnetic tailings are subject to the flotation cascade previously discussed with the change that rougher and scavenger concentrate streams for their respective materials are combined. This flowsheet achieves tungsten grades and recoveries of 2.5% and 65.2% in the tungsten flotation concentrate and a decrease in the tungsten losses to sulfide or tailings streams. This workflow also reduces the area required for tabling compared to processes not using magnetic separation to pre-concentrate for gravity separation. 10.1.1.2.4 Optimization To optimize sulfide flotation, it was found that adding sodium carbonate decreases losses of tungsten in the sulfide concentrate at the expense of decreased tungsten concentrate grades. As a result, no sodium carbonate was recommended to be added. Further, the addition of 120 g/t butyl xanthate in the sulfide rougher and 60 g/t in the scavenger was found to optimize sulfide recovery without sacrificing tungsten grades. It was found that adopting a locked-cycle flowsheet, where the rougher sulfide concentrate was subjected to a cleaning step, and the tailings are recycled back into roughing, and the sulfide concentrate from the scavenging step was recycled into roughing, greatly improved tungsten recoveries from 87.8% to 99.3%. Following removal of sulfide ores, copper can be concentrated using two flotation cleaners. The addition of a regrind to 85.3% passing 74 µm following roughing was found to achieve 52.9% copper recovery at 22.6% grades in the cleaned concentrate. To optimize tungsten flotation, between 500-1000 g/t sodium carbonate was added to the tungsten rougher. It was observed that the reagent slightly increased recovery with a slight decrease in tungsten grade. It was recommended that between 3000-4000 g/t sodium silicate be added to the rougher as a calcite depressant, increasing the grade and yield of tungsten. GZRINM also recommended using PZL, a proprietary collector produced by GZRINM, as the tungsten collector. The tests achieved tungsten grades of 1.8% and recoveries of 85.4% in the rougher. More selective scheelite collectors, such as 731 |
| PFS Pilot Mountain Tungsten Project – S-K 1300 Technical Report Summary Project No.: 25173-01 Page 81 of 236 and 733, reached grades exceeding 8% but with lower recoveries of 60-70%. Less selective collectors, such as oleate or tar soap, reached recoveries of 87-89% but at lower grades. PZL concentrations of between 254-380 g/t achieved concentrate grades of 2-3% with 81-84% recovery. Following rougher flotation, the addition of two cleaning flotation stages with the addition of 1167 g/t sodium silicate at each stage increases grades to nearly 5%, decreasing recovery to 77.1%. Following cleaning, GZRINM thickened the tungsten concentrate and performed a second round of flotation consisting of one rougher stage and two scavenger stages. The slurry was subjected to the Petrov Method, heating to 90°C with 4284 g/t sodium silicate, to improve grade and recovery. Dosages of 28 g/t of PZL collector and 69-138 g/t sodium hydroxide were added before additional flotation. The scavengers were recommended to be dosed with 135-170 g/t PZL each. 10.1.1.2.5 Results Flowsheets and material balances for both proposed flowsheets can be found below in Figure 10.2 and Figure 10.3. Both processes produce tungsten concentrate grades exceeding 65% WO₃ with recoveries of 63-65%. Table 10.1 and Table 10.2 below show the test results for locked cycle tests using the respective flowsheets. Figure 10.2: Flowsheet for Whole Flotation scenario (GZRINM, 2013) |
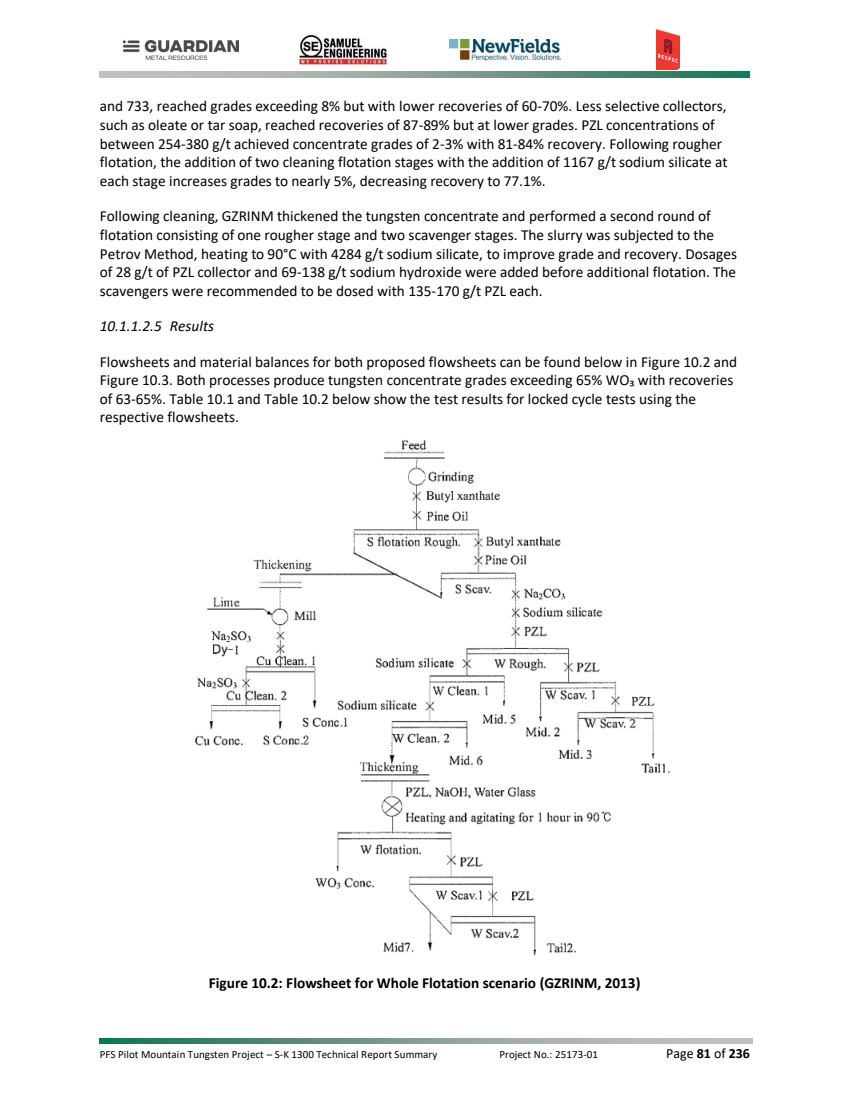
| PFS Pilot Mountain Tungsten Project – S-K 1300 Technical Report Summary Project No.: 25173-01 Page 82 of 236 Table 10.1: Material Balance for Whole Ore Flotation Product Yield WO₃ Grade WO₃ Recovery Cu Grade Cu Recovery S Grade S Recovery Ag Grade (g/t) Ag Recovery Cu Conc. 0.43 0.005 0.01 20.24 53.91 30.34 5.71 1200.1 35.42 S Conc. 2 1.58 0.011 0.05 2.14 20.94 33.88 23.44 243.21 26.38 S Conc. 1 3.36 0.017 0.15 0.53 11.03 34.71 51.07 44.18 10.19 WO₃ Cone 0.38 65.08 64.6 0.01 0.02 0.03 0 10.31 0.27 Middling2 3.78 0.34 3.36 0.04 0.94 1.01 1.67 7.54 1.96 Middling3 2.93 0.29 2.22 0.05 0.91 1.32 1.69 7.94 1.6 Middling5 3.97 0.27 2.8 0.03 0.74 0.31 0.54 3.76 1.02 Middling6 3.25 0.24 2.04 0.03 0.6 0.33 0.47 4.11 0.92 Middling7 0.71 2.68 4.97 0.028 0.12 0.26 0.08 4.08 0.2 Tailing1 71.81 0.072 13.5 0.021 9.34 0.47 14.78 4.02 19.82 Tailing2 7.8 0.31 6.3 0.03 1.45 0.16 0.55 4.17 2.22 Total 100 0.38285 100 0.161452 100 2.283855 100 14.56827 100 Figure 10.3: Flowsheet for WHIMS plus Flotation (GZRINM, 2013) |
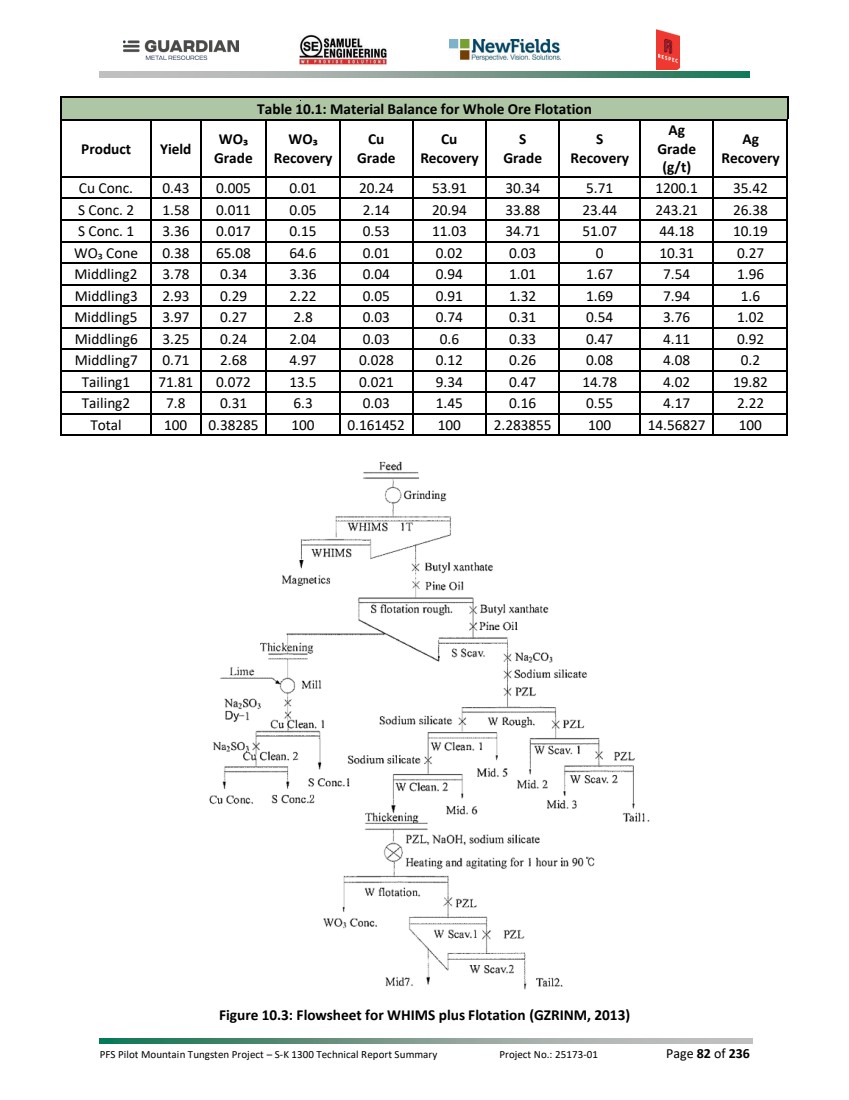
| PFS Pilot Mountain Tungsten Project – S-K 1300 Technical Report Summary Project No.: 25173-01 Page 83 of 236 Table 10.2: Material Balance for WHIMS plus Flotation Product Yield WO₃ Grade WO₃ Recovery Cu Grade Cu Recovery S Grade S Recovery Ag Grade (g/t) Ag Recovery Magnetics 51.34 0.077 10.403 0.01 3.21 1.57 35.35 5.88 20.68 Cu Conc. 0.41 0.003 0.003 22.61 57.93 31.68 5.7 1274.7 35.8 S Conc. 2 0.67 0.001 0.002 6.13 25.67 36.62 10.76 498.66 22.88 S Conc. 1 2.06 0.001 0.005 0.34 4.38 41.5 37.5 44.18 6.23 WO₃ Cone 0.37 65.11 63.39 0.01 0.02 0.05 0.01 10.31 0.26 Middling2 0.78 0.29 0.595 0.05 0.24 1.18 0.4 8.11 0.43 Middling3 2.38 0.26 1.628 0.06 0.89 1.52 1.59 9.57 1.56 Middling5 1.86 0.26 1.273 0.03 0.35 0.5 0.41 4.45 0.57 Middling6 1.03 0.25 0.678 0.03 0.19 0.5 0.23 4.65 0.33 Middling7 0.08 41.74 8.787 0.028 0.01 0.29 0.01 4.26 0.02 Tailing1 34.21 0.057 5.131 0.029 6.2 0.52 7.8 4.17 9.77 Tailing2 4.81 0.64 8.101 0.03 0.91 0.12 0.24 4.45 1.47 Total 100 0.38 100 0.16 100 2.28 100 14.6 100 10.1.1.3 Guangdong Institute of Resources Comprehensive Utilization (GIRCU), 2019 10.1.1.3.1 Mineralogy Phase analysis reports approximately 84.0% of tungsten was found to be in scheelite, with the remainder being found in wolframite (11.3%) and tungstite (4.7%). MLA test contradicted the phase analysis in reporting scheelite as the only primary tungsten mineral. Scheelite grain sizes were up to 320 µm (11.3% being minus 10 µm). This report found the grade of copper was lower than other reports, about 0.075%. MLA also revealed the previously unreported presence of chrysocolla along with the other copper-containing minerals. Copper sulfide ores, which account for only 24.3% of the total copper, had grain sizes less than 80 µm, which varied from the GZRINM analysis, and much of the copper found (74.3%) was determined to be locked in gangue, leading to lower theoretical recoveries of 24% to a grade of 41.30%. Copper containing ores had some zinc and silver content as well as minor amounts of aluminum, silicon, arsenic, and iron. Notably, the ore body’s zinc grade was larger than previous reports, about 0.52%, with sphalerite grain sizes ranging from 20 µm to 640 µm. Zinc minerology indicated that only 15.3% of the zinc existed in sphalerite, while 83.9% is locked in various gangue mineralization, leading to a theoretical recovery of only 15%. Iron (1.7%) and cadmium (0.7%), as well as manganese, aluminum, silicon (<0.5%) were detected as impurities in sphalerite. |
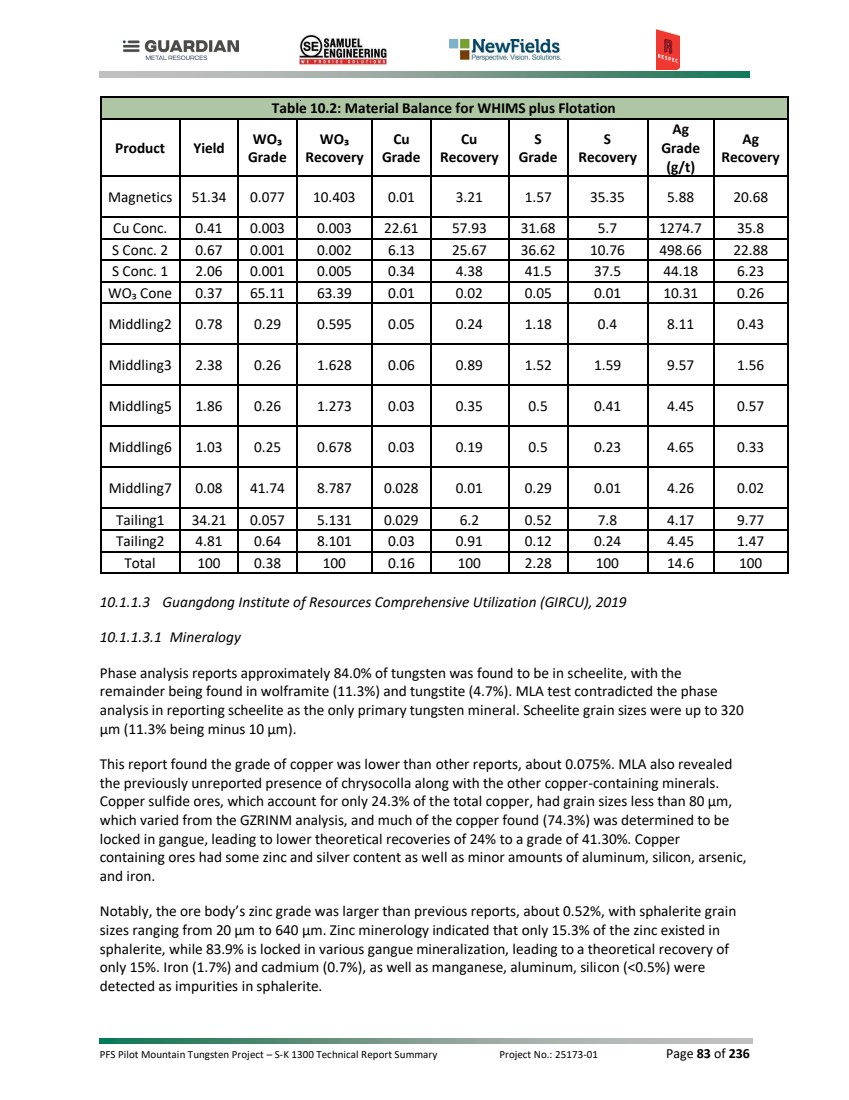
| PFS Pilot Mountain Tungsten Project – S-K 1300 Technical Report Summary Project No.: 25173-01 Page 84 of 236 Liberation was slightly worse than the GZRINM analysis, with scheelite, sulfides, and sphalerite liberations of 86.8%, 72.1%, and 93.2%, respectively at 59.4% passing 75 µm. liberations these minerals increase to 96.9%, 90.0%, and 97.7% at 81.7% passing 75 µm. The lower liberation for copper sulfide minerals was attributed to its much finer grain size. 10.1.1.3.2 Separation Methods The report offers heavy medium separation (HMS) as a potential pre-concentration method to remove the large quantities of garnet gangue that can pose grinding and flotation difficulties. HMS was proposed using three stages of heavy media with specific gravities of 3.1, 2.9, and 2.7, where the light stream sent to the next stage, and the less than 2.7 material discarded. This results in average loss of 28.9% tungsten, likely eliminating HMS as a feasible separation method. Gravity table separation was also considered, grinding to some percentage passing 75 µm, with the oversize and undersize products each going to their own set of two-stage tables. The middling products for each size are sent to the next table, while the concentrates and tailings for each set of tables are combined. The combined concentrates recover about 40% of tungsten in the undersize and 18% in the oversize, with a greater passing percentage in the feed leading to less recovery, but higher grades in the undersize concentrate. Magnetic separation was also considered as a garnet removal method. It was found that increasing magnet intensity increases the yield of magnetic waste as well as loss of tungsten until approximately 0.6 T, where yields and losses level out. Increasing the fineness of the feed decreases loss of tungsten to the magnetic stream, but losses are still greater than 30%. To mitigate this, two cleaning stages of magnetic separation were added, which reduces the losses of tungsten in the cleaned magnetic stream to ~12% while maintaining rejection of approximately 50% of the total mass in the feed. The study also considered the effect of regrinding the rougher magnetic concentrate and found minimal effect. Flotation was also considered using the same general process as previously investigated: a sulfide rougher-scavenger system and tungsten rougher-scavenger-scavenger system. An assessment of the optimal feed fineness determined 70.4% passing 75 µm to minimize tungsten losses in the sulfide concentrate and tailings. 10.1.1.3.3 Flotation Optimization For sulfide flotation, 1000 g/t sodium carbonate or a mixture of 500 g/t sodium carbonate and 500 g/t sodium silicate was found to minimize tungsten loss to the sulfide concentrate, although copper and zinc recovery was not maximized at this dose. Doses of butyl xanthate were determined to be optimal at 60 g/t at the rougher and 30 g/t in the scavenger, with pine oil doses of 28.6 and 10.7 g/t. The adoption of a locked-cycle flowsheet and two cleaning stages for the roughed sulfide concentrate shrank tungsten losses to 0.6%. The copper grade and recovery in the cleaned concentrate are 1.6% and 23.6%, respectively; the zinc grade and recovery are 8.5% and 16.8% respectively. A second option of copper roughing followed by sulfide roughing and scavenging was explored by using lime or sodium carbonate, but found that in doing so, recovery dropped sharply; potentially only 10% to15% at a grade of 20% or less, concluding that the isolation of copper and zinc, as opposed to the removal of sulfide minerals, is likely infeasible. |
| PFS Pilot Mountain Tungsten Project – S-K 1300 Technical Report Summary Project No.: 25173-01 Page 85 of 236 For scheelite flotation, it was determined that 1000 g/t sodium hydroxide should be used as pH regulator to maximize tungsten recovery. Other regulators such as sodium carbonate improve grade at the expense of loss in recovery. A proprietary collector developed by GIRCU was chosen to decrease tungsten losses and yield higher grades than competitors with similar recoveries. The determined collector dose was 340 g/t at the rougher, 170 g/t at the first scavenger, and 100 g/t at the second. Sodium silicate doses of 3500 g/t for the rougher and 1000 g/t for the scavenger were found to not decrease tungsten recovery but to have the greatest grade. A pulp density of 36% was chosen because of higher recoveries without a large decrease in grade. It was determined that flotation time should be 5 minutes for each flotation stage. For a two-stage cleaning of the tungsten rougher concentrate, it was found that the addition of sodium silicate improves grades, naturally at the expense of recovery. Adopting a locked cycle configuration scheelite flotation to the tailings of a locked cycle sulfide flotation process observes a concentrate recovery of 76.2% with a grade of 4.4%, in up to 4.6% of the total fed mass pull. In the absence of pre-desulfurization, grade and recovery decrease to 3.9% and 76.1%, respectively, as the mass pull increases to 5.3%. Since the grade of the cleaned concentrate was still low, a heated cleaning step like that discussed in the GZRINM report was suggested. The heated flotation feed will be dosed with 2000 g/t sodium hydroxide, 1000 g/t sodium sulfide, and 90,000 to 120,000 g/t sodium silicate and should be of a higher pulp density such as 65%. It was recommended that the feed be heated to 90°C and kept warm for 90 minutes. The open circuit heated flotation yields a tungsten concentrate with a grade of 60.8% and recovery of 88.2%, and switching to locked circuit increases these values to 68.2% and 96.6%. Without pre-desulfurization, the locked circuit decreased to 66.9% and 93.5%. 10.1.1.3.4 Overall Flowsheets Flowsheets and material balances for both flowsheets can be found in Figure 10.4 and Figure 10.5 below. Table 10.3 and Table 10.4 below show the test results using the respective flowsheets. |

| PFS Pilot Mountain Tungsten Project – S-K 1300 Technical Report Summary Project No.: 25173-01 Page 86 of 236 Figure 10.4: Overall process flow with desulfurization (GZRINM, 2013) Table 10.3: Material Balance with Desulfurization Stage Product Wt% Assay, WO₃ Recovery, WO₃% Stage For ROM Stage For ROM S flotation S.R. Conc. 11.11 0.15 0.62 Scheelite rougher flotation W.R. Conc. 4.64 4.4 76.17 W.R. Tail 94.25 0.07 23.21 Scheelite cleaner flotation H.G. Conc. 6.23 0.29 68.22 96.59 73.57 H.G. Tail 93.77 4.35 0.16 3.41 2.6 W.R. Conc. 4.64 4.4 76.17 Head 100 0.27 100 |
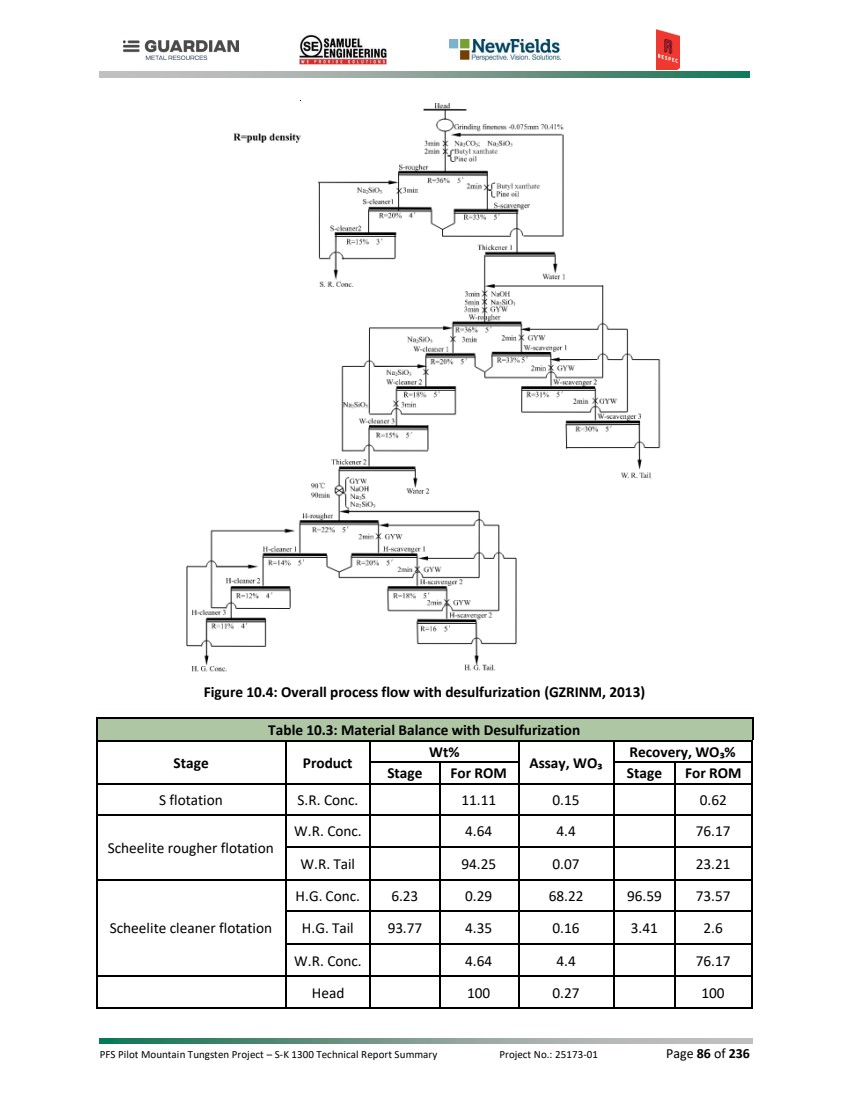
| PFS Pilot Mountain Tungsten Project – S-K 1300 Technical Report Summary Project No.: 25173-01 Page 87 of 236 Figure 10.5: Overall process flow without desulfurization (GZRINM, 2013) Table 10.4: Material Balance without Desulfurization Stage Product Wt% Assay, WO₃ Recovery, WO₃% Stage For ROM Stage For ROM Scheelite rougher flotation W.R. Conc. 5.32 3.92 76.11 W.R. Tail 94.68 0.07 23.89 Scheelite cleaner flotation H.G. Conc. 5.47 0.29 66.94 93.48 71.16 H.G. Tail 94.53 5.03 0.27 6.51 4.95 W.R. Conc. 5.32 3.92 76.11 Head 100 0.27 100 10.1.1.3.5 Product and Feedstock Analysis The tungsten concentrate was assayed as 68.2% WO₃, with major impurities present in concentrations above 1% being calcite, fluorite, and molybdenum. The heated cleaning stream was principally calcite, fluorite, and quartz, and the tungsten flotation tailings was quartz, calcite, iron, and alumina. |
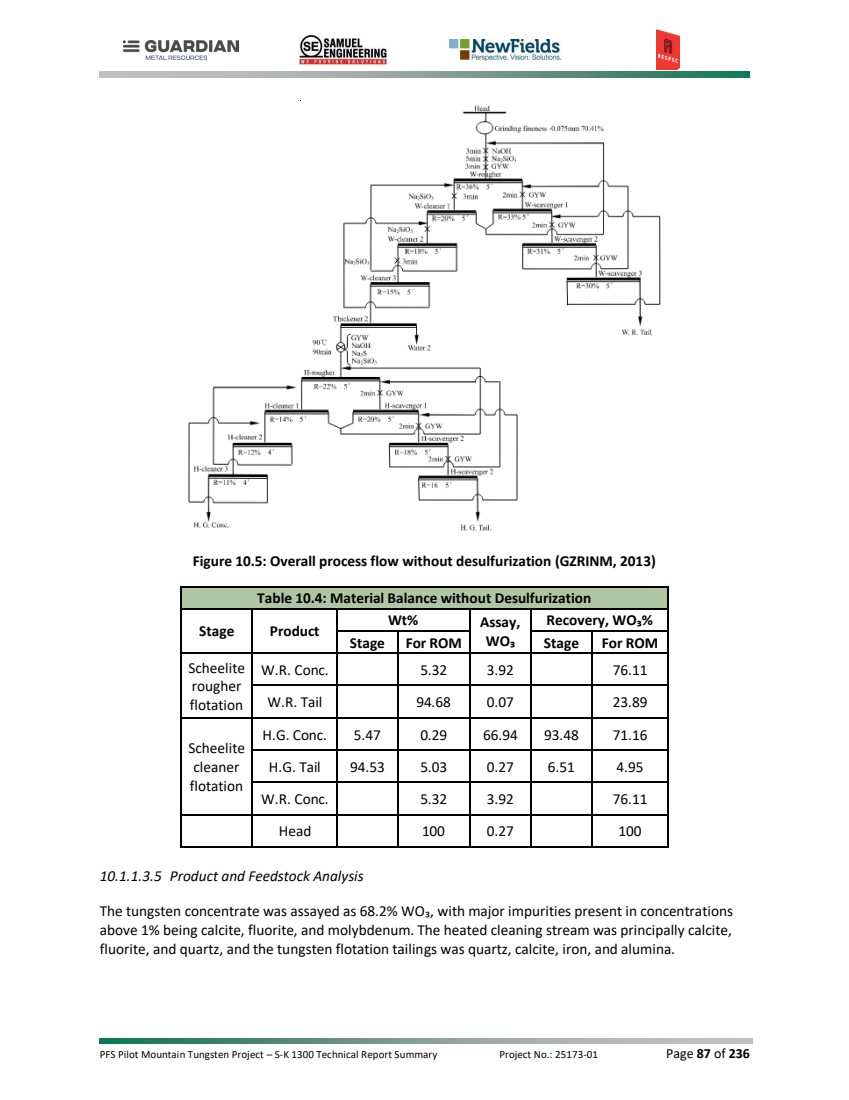
| PFS Pilot Mountain Tungsten Project – S-K 1300 Technical Report Summary Project No.: 25173-01 Page 88 of 236 10.2 CURRENT METALLURGICAL TESTWORK PROGRAMS 10.2.1 Base Met Laboratories, 2025-2026 Base Metallurgical Laboratories Ltd. (Base Met Labs) was contracted in 2025 to perform testwork on collected geological drill core samples as well as three dedicated metallurgical drill holes. The GZRINM flotation flowsheet and results were used as a starting point for which this new testwork program was built. At the time of publication of this study, the testwork was completed on the main baseline composite and much of the variability samples. Testwork is ongoing on some variability samples as well as samples from the Garnet deposit. At the conclusion of the metallurgical program, an estimated recovery of 78.5% for a concentrate of > 50% WO3 was recommended to be used for the Project’s financial model. This estimate was based on the full metallurgical program including but not limited to the optimized lock-cycle tests. 10.2.1.1 Composite and Variability Sample Selection Base Met Labs received approximately 1,080 kg of sample from 14 geological drill holes and three metallurgical drill holes from the Desert Scheelite deposit. The samples contained 804 kg of samples classified as oxide or transition ore, and 276 kg of samples classified as sulfides. Samples from the oxide and transition samples were composited to create 132 kg of an “oxide” composite to use as a consistent baseline material for the initial testwork. The samples for the oxide composite were selected from 12 of the drill holes (five drill holes only contained sulfide samples) to create a composite to both spatially represent the ore body as well as represent an average WO₃ head grade. Due to the mineralization existing primarily in a single lithology, compositing did not consider lithology. In addition to the main oxide composite, samples were combined for a sulfide composite, as well nine variability composites, designed to test a variety of different ore compositions and spatial regions of the deposit. Three samples were taken from the Garnet deposit for testing on the established flowsheet. Table 10.5 contains all 11 composite samples for the Desert Scheelite deposit as well as the three Garnet deposit samples, with expected feed grades and sample weights. Six additional spatially representative samples were used for comminution testing. Table 10.5: Composite Information Composite Name Description Mass, kg %W %S % Cu %Zn Mo (ppm) gpt Ag Oxide Comp Main Composite 132 0.23 0.9 0.05 0.58 127 21 Sulfide Comp Sulfide Composite 112 0.24 2.1 0.094 0.351 106 13 High Mo Ox Oxide Sample - High Molybdenum 23 0.3 0.9 0.023 0.248 230 35 High S/W Sulfide Sample - High Sulfur and Tungsten 42 0.44 12.7 1.16 1.51 83 29 High W Ox Oxide Sample - High Grade Tungsten 44 0.58 0.8 0.091 0.25 93 5 |
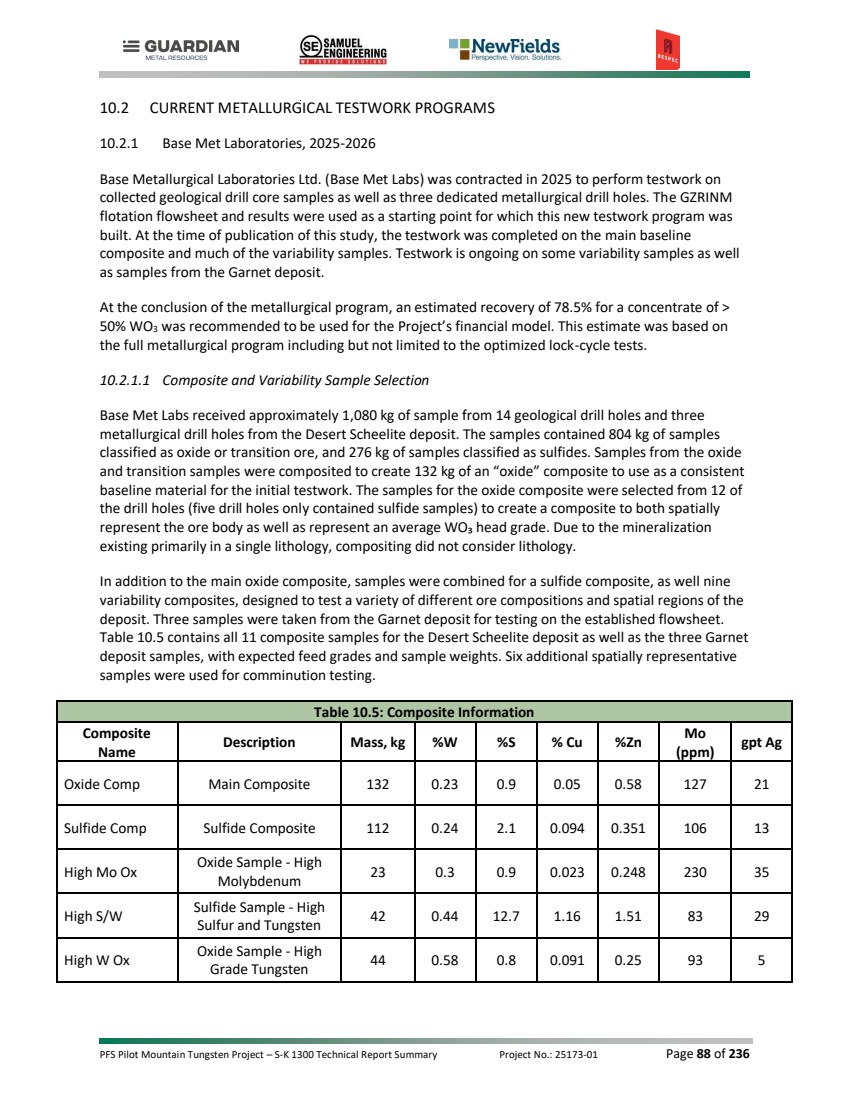
| PFS Pilot Mountain Tungsten Project – S-K 1300 Technical Report Summary Project No.: 25173-01 Page 89 of 236 Table 10.5: Composite Information Composite Name Description Mass, kg %W %S % Cu %Zn Mo (ppm) gpt Ag Low W Ox Oxide Sample - Low Grade Tungsten 59 0.084 0.47 0.023 0.063 50 4 High Zn Oxide Sample - High Zinc 23 0.35 6.8 0.80 7.90 93 22 Hole 53 Location Sample - Hole 53 20 0.17 0.17 0.01 0.35 52 2 Hole 54 Location Sample - Hole 54 20 0.29 1.4 0.031 1.19 140 83 Hole 55 Deep Location Sample - Hole 55 - 145-156 m depth 22 0.24 2.4 0.017 0.80 6 3 Hole 55 Shallow Location Sample - Hole 55 - 197-205 m depth 24 0.24 2 0.065 0.75 81 116 PMGR25-007 Garnet Pit - West Sample 21 0.12 1.04 0.009 1.07 39 2 PMGR25-015 Garnet Pit - Central Sample 21 0.1 0.015 0.004 0.07 29 0 PMGR25-020 Garnet Pit - East Sample 22 0.21 0.50 0.012 0.27 36 2 10.2.1.2 Minerology QEMSCAN minerology was performed on multiple samples throughout the test program. The first set of QEMSCAN tests were performed on six samples to investigate discrepancies between different assay tungsten assay methods noticed in the geological logging process. The six samples were selected because the core assays had high variation between using a four-acid assay method and a boron-fusion assay method. The tests confirmed that the boron-fusion test methodology is the more accurate method and would be the assay method used for the test program. The tests also provided information on the variability of the minerology across the deposit. Mineral abundance for the samples shown below in Table 10.6. Table 10.6: Sample Mineralization Mineral Abundance (wt%) H498467 HD H498470 HD H498473 HD M434557 HD H498408 HD H498408 HD H498408 HD Pyrite 1.63 1.15 18 34.3 0.01 2.72 0.02 Chalcopyrite 0.03 0.07 2.34 0.95 0 0.47 0.01 Other Cu Sulphides 0.01 0.01 0.31 0.1 0 0.02 0 Sphalerite 0.07 0.05 1.8 1.11 0 4.94 0 Other Sulphides 0.01 0 0.03 0.04 0 0.07 0.01 Quartz 8.38 6.09 27.9 16.5 41.4 14.6 15.2 Plagioclase 1.52 23.4 6.35 0.4 7.3 0.74 0.48 |
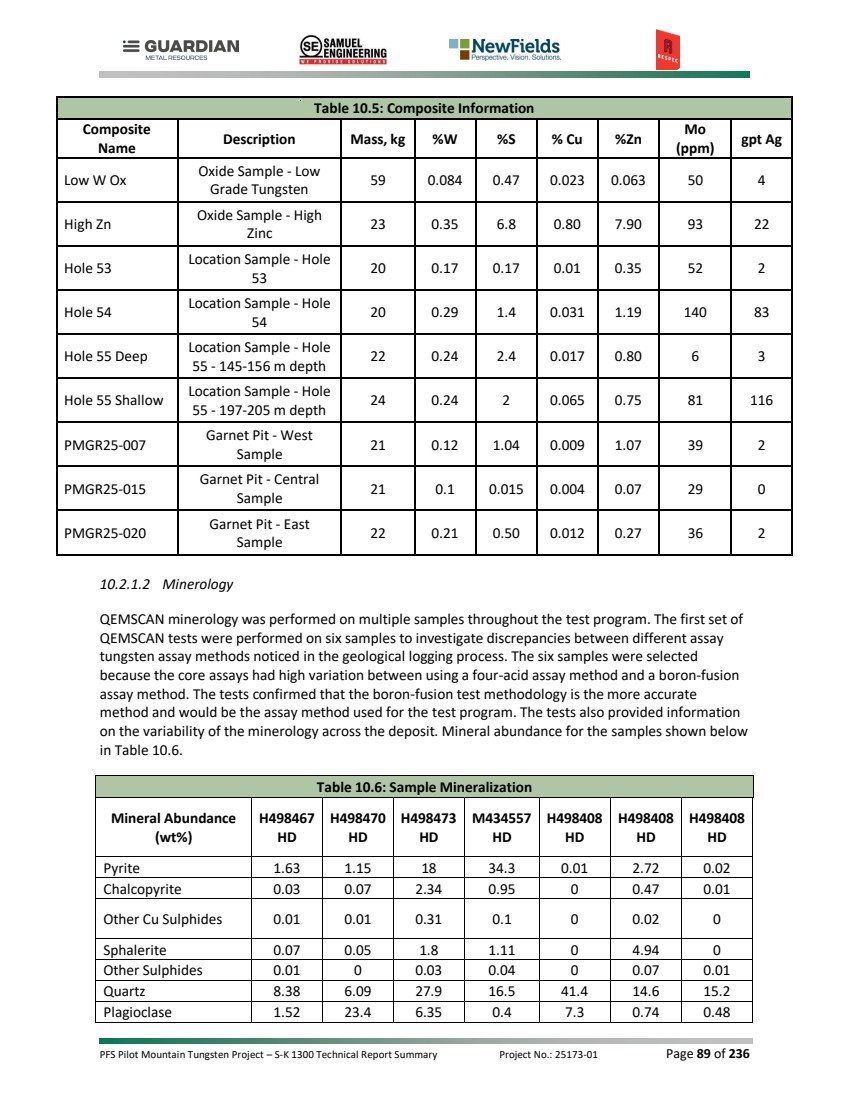
| PFS Pilot Mountain Tungsten Project – S-K 1300 Technical Report Summary Project No.: 25173-01 Page 90 of 236 Table 10.6: Sample Mineralization Mineral Abundance (wt%) H498467 HD H498470 HD H498473 HD M434557 HD H498408 HD H498408 HD H498408 HD K-Feldspar 0.01 0.13 0 0.01 0.01 0 0 Muscovite/Illite 0.15 2.84 0.5 0.06 1.25 0.04 0.18 Chlorite 0.25 2.18 0.39 0.17 2.09 0.52 0.12 Garnet 50.5 20.2 10.8 6.85 22.3 32.6 56.5 Clays 0.19 16 0.66 0.23 5.06 0.12 0.48 Other Silicates 13.5 15.2 9.03 4.53 7.98 33.9 9.43 Scheelite 0.26 0.11 1.3 2.47 0.23 0.32 0.99 Fe-Oxides 0.06 0.07 0.1 0.31 3.88 0.28 0.31 Other Oxides 0.07 0.75 0.09 0.29 0.74 0.04 0.1 Calcite 1.83 2.65 1.72 0.86 5.38 5.85 11.9 Other Carbonates 21.2 8.49 18.5 30 1.75 2.54 4.03 Apatite 0.31 0.57 0.24 0.58 0.57 0.16 0.18 Other 0.01 0.08 0.03 0.24 0.04 0.06 0 Total 100 100 100 100 100 100 100 QEMSCAN mineralization and liberation analysis was performed on the oxide and sulfide composites to determine the exposure of liberated scheelite particles at the selected grind size of P₈₀ 89 µm. Mineral abundance for the samples shown below in Table 10.7 and Table 10.8. Scheelite liberation for the composites is shown in Table 10.9 and Table 10.10 below. Table 10.7: Oxide Composite Mineralization Mineral Mineral Abundance (wt% Normalized to Fraction) Combined +106 µm +75 µm +38 µm -38 µm Pyrite 1.29 1.31 1.14 1.37 1.29 Chalcopyrite 0.09 0.07 0.06 0.07 0.12 Other Cu Sulphides 0.01 0.01 0.01 0.01 0.01 Sphalerite 0.62 0.3 0.4 0.67 0.77 Other Sulphides 0.12 0.07 0.05 0.15 0.15 Quartz 14.1 20.4 15.9 14.4 11.5 Plagioclase 0.33 0.17 0.23 0.27 0.45 K-Feldspar 0.15 0.1 0.13 0.12 0.18 Muscovite/Illite 0.12 0.12 0.11 0.1 0.15 Chlorite 0.34 0.19 0.17 0.17 0.58 Amphibole/Pyroxene 11.3 7.67 8.49 10.2 14.2 Garnet 47.4 52.9 55.2 51.6 39.5 Epidote 0.56 0.27 0.37 0.4 0.84 Clays 0.37 0.17 0.17 0.22 0.62 Other Silicates 1.01 0.72 0.63 0.86 1.38 Scheelite 0.39 0.17 0.16 0.39 0.55 Fe-Oxides 1.27 1.03 0.79 1.02 1.74 Other Oxides 0.79 0.76 0.62 0.6 1.02 |
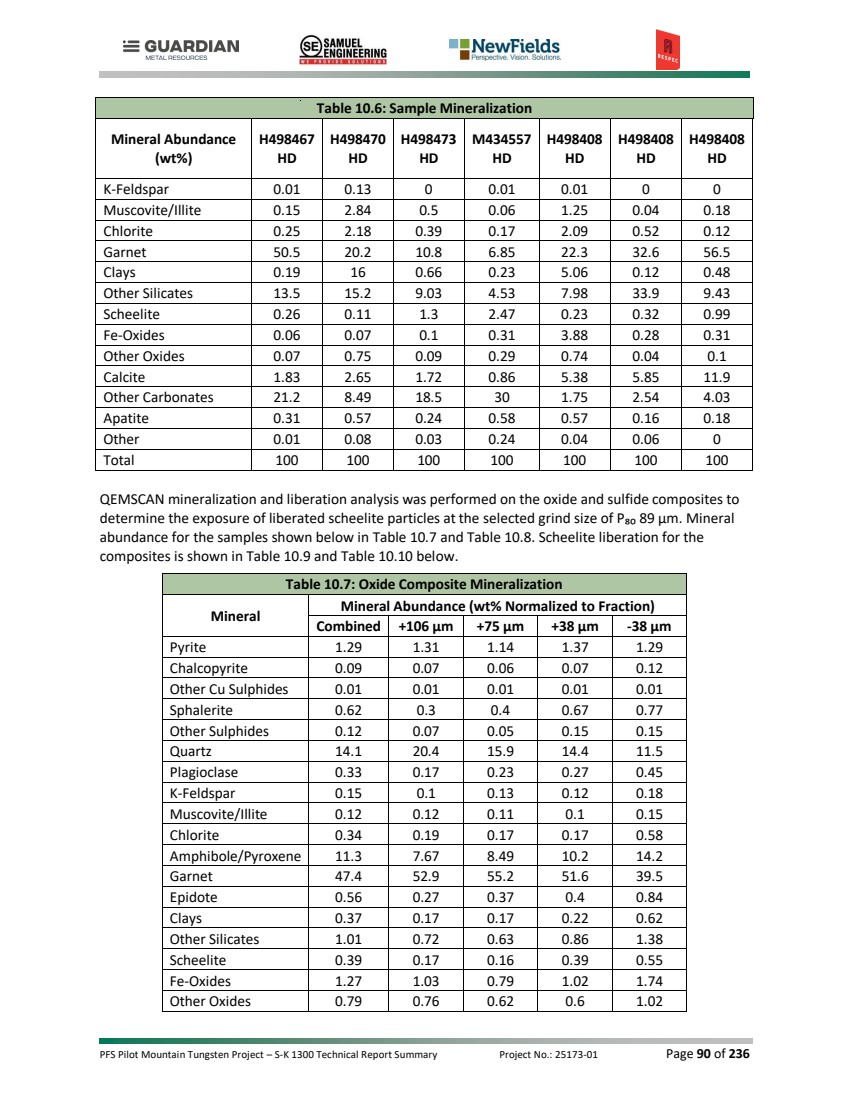
| PFS Pilot Mountain Tungsten Project – S-K 1300 Technical Report Summary Project No.: 25173-01 Page 91 of 236 Table 10.7: Oxide Composite Mineralization Mineral Mineral Abundance (wt% Normalized to Fraction) Combined +106 µm +75 µm +38 µm -38 µm Calcite 16.5 11.4 12.9 14.9 20.7 Other Carbonates 2.85 2.06 2.25 2.33 3.68 Apatite 0.33 0.11 0.13 0.22 0.55 Other 0.02 0.02 0.01 0.01 0.03 Total 100 100 100 100 100 Table 10.8: Sulfide Composite Mineralization Mineral Mineral Abundance (wt% Normalized to Fraction) Combined +106 µm +75 µm +38 µm -38 µm Pyrite 4.1 4.72 4.8 4.73 3.25 Chalcopyrite 0.26 0.1 0.13 0.12 0.44 Other Cu Sulphides 0.04 0.03 0.04 0.04 0.04 Sphalerite 0.37 0.16 0.23 0.43 0.44 Other Sulphides 0.07 0.07 0.06 0.04 0.1 Quartz 15.1 20.4 17.1 15.3 12.7 Plagioclase 2.54 1.38 1.51 1.98 3.63 K-Feldspar 0.24 0.22 0.2 0.26 0.25 Muscovite/Illite 0.56 0.41 0.3 0.36 0.85 Chlorite 0.56 0.11 0.15 0.22 1.07 Amphibole/Pyroxene 5.3 5.13 4.61 4.9 5.89 Garnet 42.6 50 50.7 46.9 34.5 Epidote 0.7 0.42 0.49 0.54 0.97 Clays 0.51 0.23 0.22 0.35 0.8 Other Silicates 0.63 0.24 0.23 0.29 1.11 Scheelite 0.33 0.26 0.38 0.49 0.24 Fe-Oxides 0.29 0.28 0.2 0.24 0.36 Other Oxides 0.14 0.06 0.07 0.08 0.22 Calcite 6.54 3.69 4.35 5.62 8.79 Other Carbonates 18.8 12 14 16.8 23.8 Apatite 0.34 0.13 0.19 0.39 0.43 Other 0.02 0.01 0.01 0.02 0.03 Total 100 100 100 100 100 Table 10.9: Oxide Composite Scheelite Liberation Exposure Scheelite Exposure by Size Combined +106 µm +75 µm +38 µm -38 µm 90-100% 86.7 85.5 78.6 89.3 86.7 70-90% 9.16 3.47 6.26 7.88 10.6 50-70% 1.29 0.09 0.29 0.83 1.74 20-50% 1.7 4.11 10.6 1.13 0.58 |
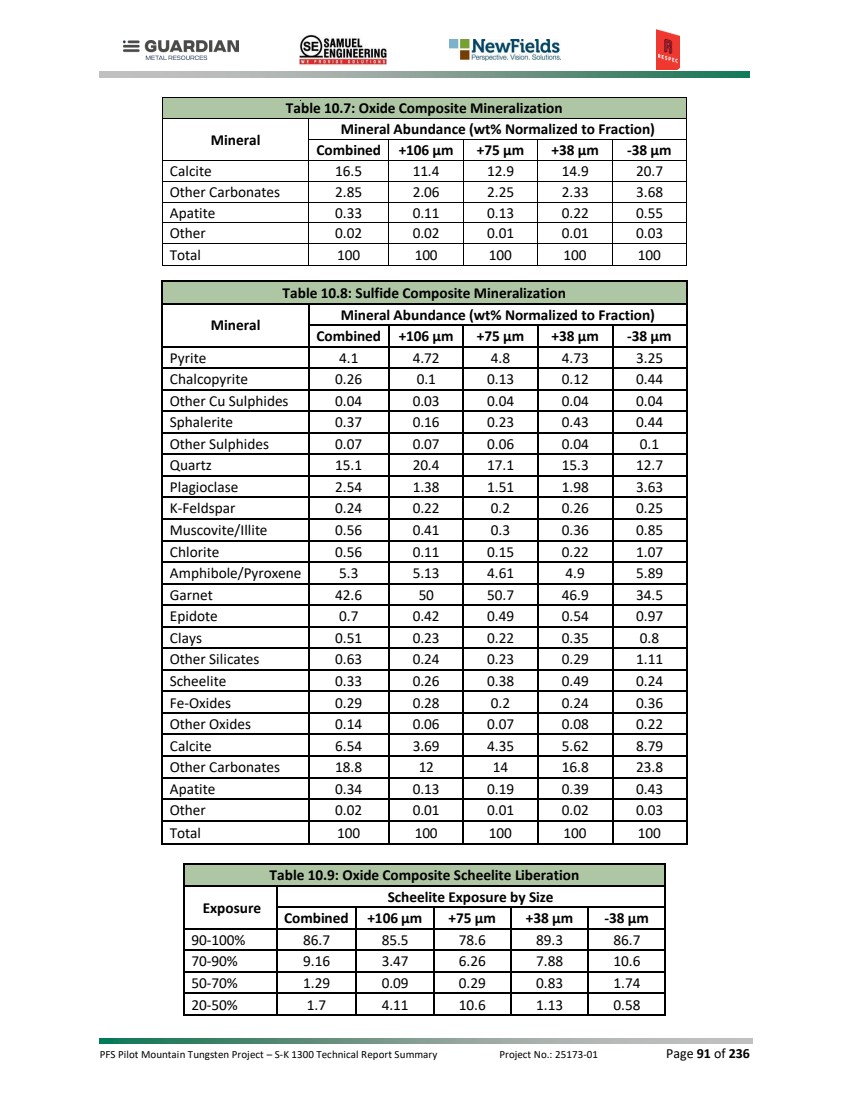
| PFS Pilot Mountain Tungsten Project – S-K 1300 Technical Report Summary Project No.: 25173-01 Page 92 of 236 Table 10.9: Oxide Composite Scheelite Liberation Exposure Scheelite Exposure by Size Combined +106 µm +75 µm +38 µm -38 µm 0-20% 1.07 6.32 4.05 0.82 0.39 Locked 0.04 0.52 0.21 0.01 0 Total 100 100 100 100 100 Table 10.10: Sulfide Composite Scheelite Liberation Exposure Scheelite Exposure by Size Combined +106 µm +75 µm +38 µm -38 µm 90-100% 88.3 63.2 87.7 99.1 82.6 70-90% 8.16 19.3 8.49 0.68 14.1 50-70% 2.24 10.3 2.67 0 2.44 20-50% 0.87 4.91 1.08 0 0.66 0-20% 0.36 2.17 0.1 0.2 0.24 Locked 0.01 0.11 0.01 0 0.01 Total 100 100 100 100 100 Due to mineralization existing primarily in a single lithology, no samples were selected or tested based on lithology. 10.2.1.3 Comminution Testing Six comminution samples were selected for SAG Mill Comminution (SMC), Bond Rod Mill Work Index (RWi), Bond Ball Mill Work Index (BWi), and Bond Abrasion Index (Ai). Results are summarized in Table 10.11 below. Table 10.11: Comminution Testwork Results Composite Name Description BWi (kWh/t) RWi (kWh/t) Ai (g) Axb ta SCSE (kWh/t) 25comm comp 1 Hole 53 Shallow 13.5 NA 0.070 224.8 2.40 5.61 25comm comp 2 Hole 53 Deep 15.6 11.9 0.190 72.5 0.73 7.63 25comm comp 3 Hole 54 Shallow 12.8 11.8 0.009 68.0 0.67 7.93 25comm comp 4 Hole 54 Deep 14.9 10.2 0.139 83.6 0.81 7.27 25comm comp 5 Hole 55 Shallow 14.7 13.6 0.139 60.2 0.53 8.65 25comm comp 6 Hole 55 Deep 17.6 17.1 0.195 40.9 0.35 10.5 10.2.1.4 Preliminary Flotation Testing Flotation was selected as the method for both sulfide and tungsten concentration based on results from the previous testwork. An initial set of 32 preliminary batch flotation tests was performed on the 2 kg charges of the oxide composite to determine the test protocol. The tests were designed to investigate the effects of different test parameters and reagent dosages on the rougher and cleaner flotation |
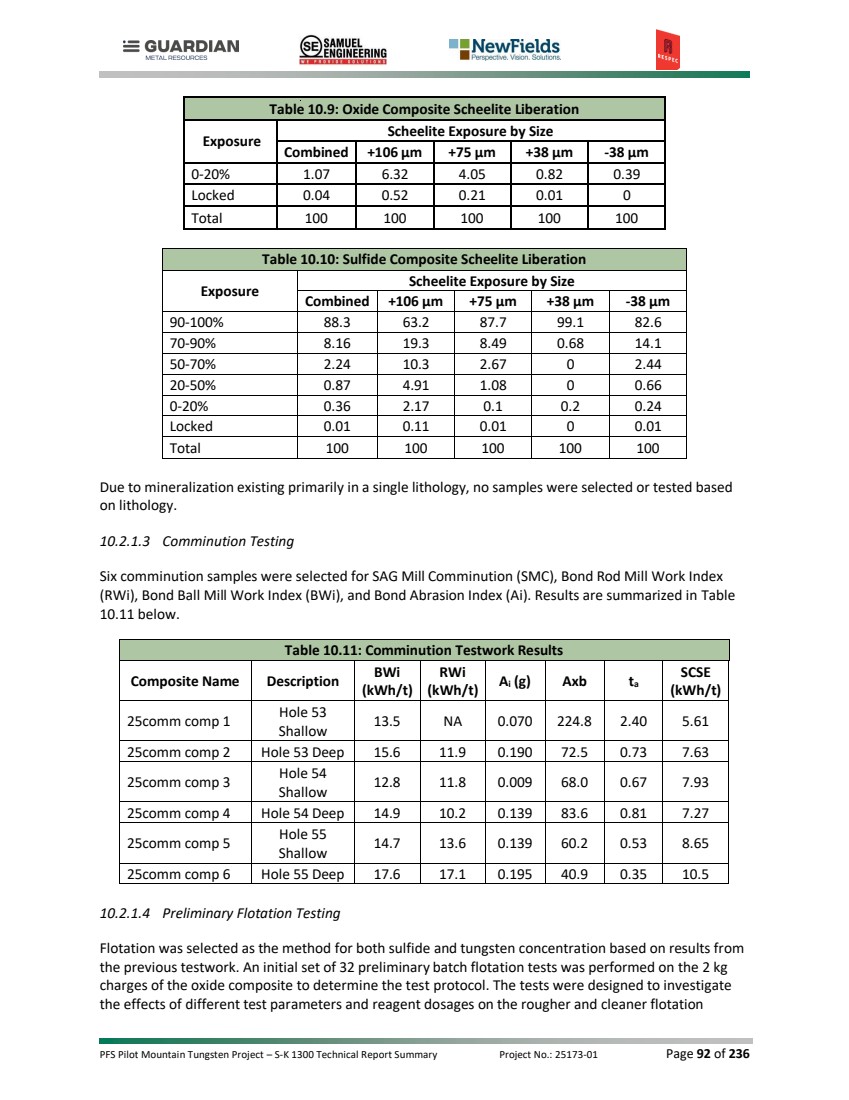
| PFS Pilot Mountain Tungsten Project – S-K 1300 Technical Report Summary Project No.: 25173-01 Page 93 of 236 responses. A primary grind size of P₈₀ 89 µm was selected after analysis of the mineralogical liberation from the QEMSCAN testing. This flotation testwork was used to refine the GZRINM results into the current flowsheet shown in Figure 10.6 below. Figure 10.6: Testwork Block Flow Diagram Flotation parameters used for the locked cycle test are shown below in Table 10.12. Reagent dosages in the cleaner circuit are relative to rougher concentrate mass. |
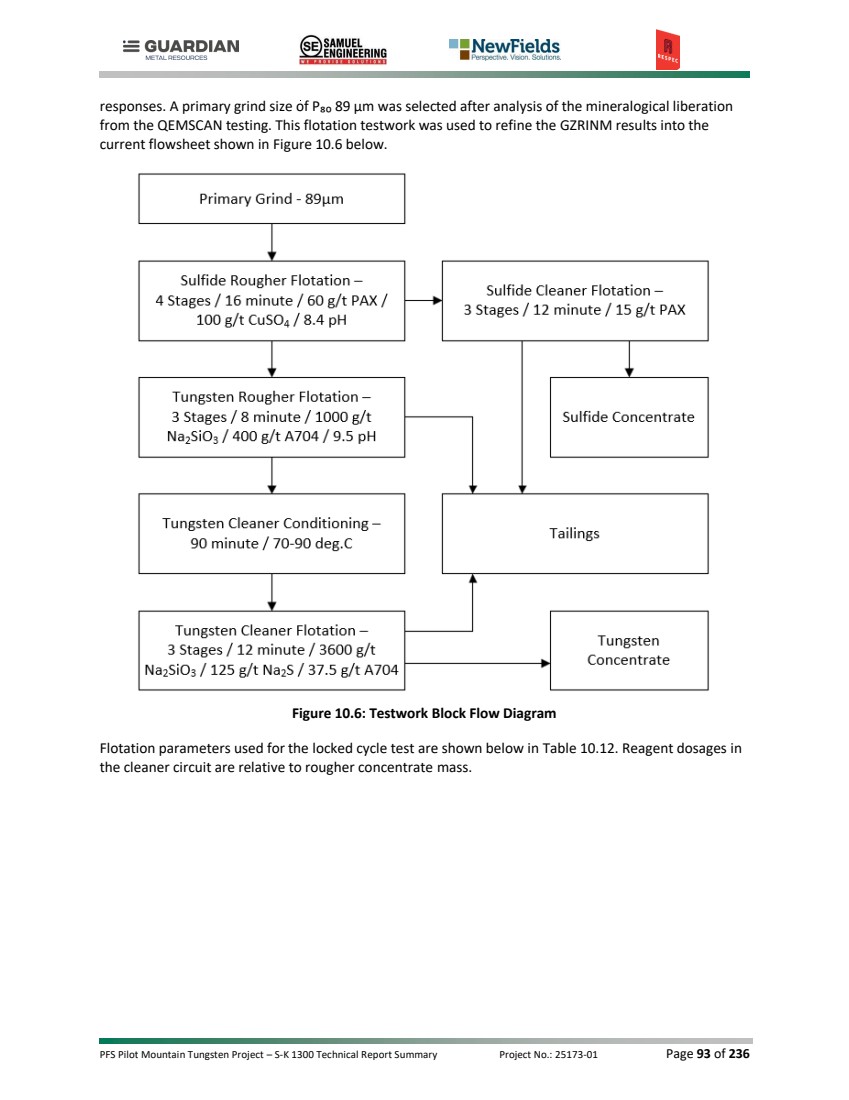
| PFS Pilot Mountain Tungsten Project – S-K 1300 Technical Report Summary Project No.: 25173-01 Page 94 of 236 Table 10.12: Locked Cycle Test Parameters 10.2.1.5 Sulfide Flotation Sulfide flotation was identified as the first step in the beneficiation process to remove sulfide materials from the process streams to eliminate any possibility of acid rock drainage in the tailings facility as well as recover possible economic sulfide minerals into a secondary zinc and silver concentrate. Sulfide flotation was shown to be effective at removing sulfur from the main process stream, recovering greater than 90% of the sulfur in the sulfide roughers. Zinc recovery in the sulfide circuit averaged ~70% into the sulfide concentrate but was highly variable, ranging from 25% to 95%. The recovery of zinc into the sulfide concentrate was better in the samples classified as sulfide regardless of contained sulfur values. Zinc concentrate grades were variable, with grades as low as 1% in low sulfide samples and as high as 40% in the high-grade zinc composite. Mass pull for the sulfide concentrate correlated directly with sulfur head grade as seen in Figure 10.7 below. |
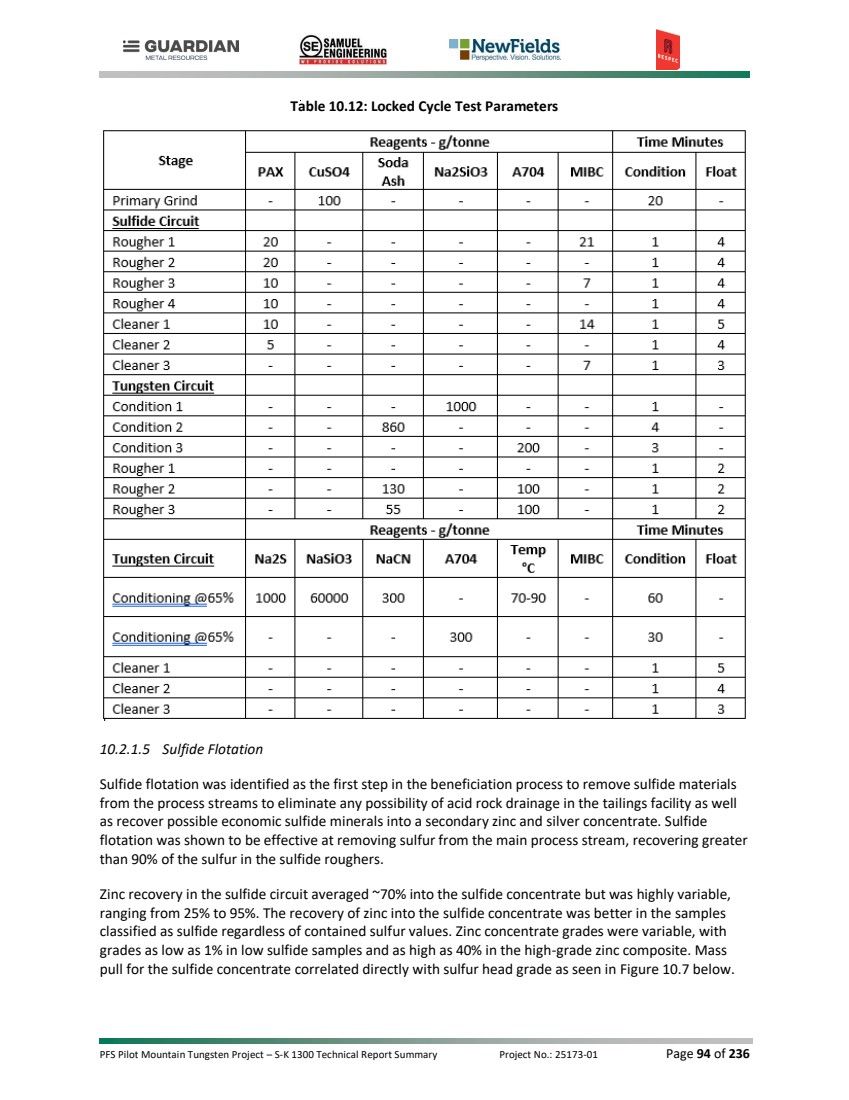
| PFS Pilot Mountain Tungsten Project – S-K 1300 Technical Report Summary Project No.: 25173-01 Page 95 of 236 Figure 10.7: Sulfide Mass Pull Silver recovery into the sulfide concentrate ranged from 50% to 95%, with an average of 74%. Silver grade in the concentrate depends on feed grade with lower grade samples, less than 10 g/t, inconsistently upgrading to minimum marketable concentrate grades. Silver appears to be associated with lead mineralization (galena) supporting the high silver recoveries regardless of head grade. Results for the sulfide rougher and cleaner stages are shown below in Table 10.13 and Table 10.14 0.0 2.0 4.0 6.0 8.0 10.0 12.0 14.0 16.0 18.0 0.0 1.0 2.0 3.0 4.0 5.0 6.0 7.0 8.0 Sulfide Mass Pull Sulfide Head Grade % |
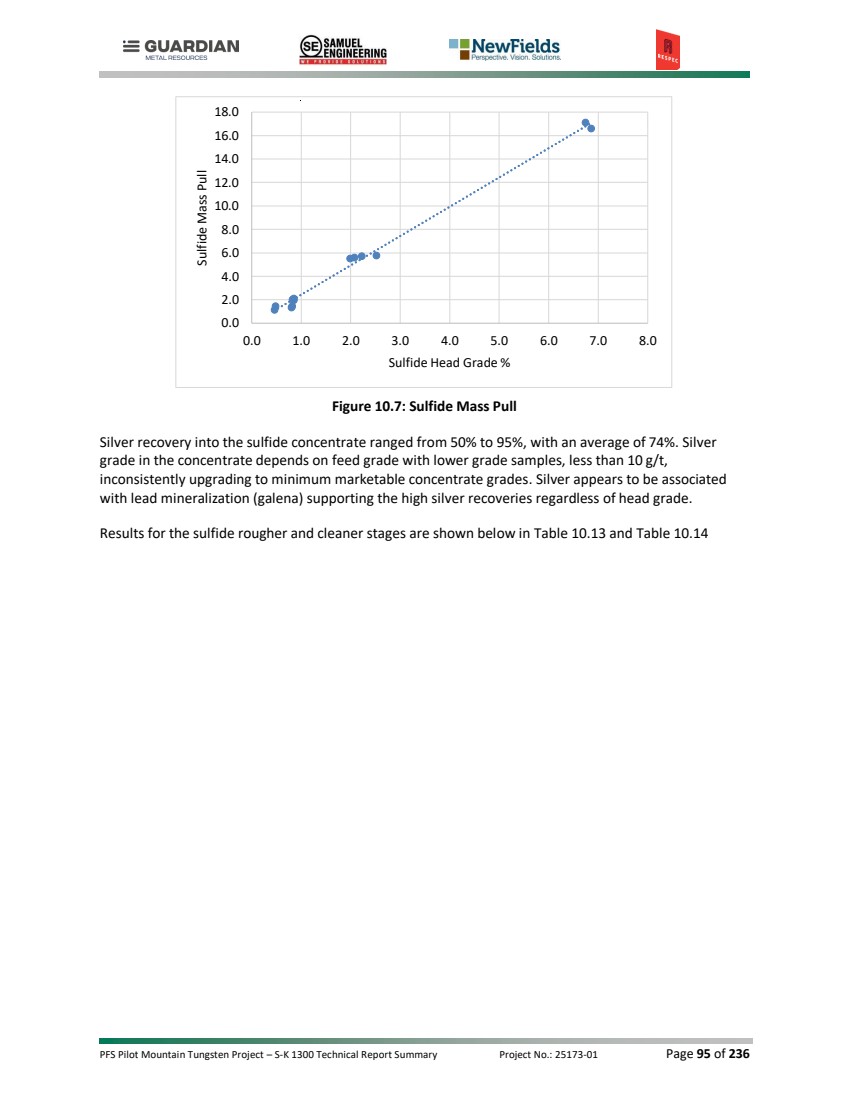
| PFS Pilot Mountain Tungsten Project – S-K 1300 Technical Report Summary Project No.: 25173-01 Page 96 of 236 Table 10.13: Sulfide Rougher Flotation Results Test Product Composite Name Weight Assay - percent or g/t Distribution - percent % grams W S Cu Zn Fe Ag W S Cu Zn Fe Ag R29 SO3 Ro Oxide Comp 9.2 182.2 0.13 9.7 0.3 4.0 13.7 181 5.6 96.2 58.9 69.0 13.2 77.7 R31 SO3 Ro Sulfide Comp 8.2 163.4 0.08 25.4 1.2 2.8 26.9 132 2.8 98.0 90.7 61.8 20.1 81.2 R32 SO3 Ro High S/W 33.1 658.1 0.11 38.1 3.4 4.3 31.5 79 8.1 99.2 98.1 94.8 67.8 91.9 R38 SO3 Ro Hole 53 4.2 81.7 0.17 3.6 0.1 1.4 17.6 16 4.3 87.6 35.8 16.8 6.2 30.5 R39 SO3 Ro Hole 54 10.3 198.6 0.11 7.4 0.2 9.4 5.3 559 3.9 51.1 81.4 81.0 12.0 70.1 R40 SO3 Ro Hole 55 Deep 9.4 186.1 0.13 24.9 0.2 8.6 21.4 22 4.4 97.4 84.6 94.8 17.0 80.1 R41 SO3 Ro Hole 55 Shallow 10.2 202.9 0.07 19.8 0.6 7.5 16.3 1022 2.7 98.3 93.9 96.6 26.3 97.2 R42 SO3 Ro High Mo Ox 6.5 127.0 0.14 14.6 0.3 3.3 16.1 544 2.8 95.4 78.1 81.7 9.7 94.4 R43 SO3 Ro High Zn 22.3 442.7 0.05 30.0 3.3 34.9 11.4 86 2.2 97.9 95.0 94.5 28.1 89.6 R44 SO3 Ro Low W Ox 5.2 103.7 0.09 8.5 0.2 0.5 13.5 36 4.0 95.5 62.1 39.5 8.3 55.8 R45 SO3 Ro High W Ox 4.8 93.0 0.22 15.1 1.2 2.4 22.4 64 1.6 97.0 64.0 53.1 9.5 46.6 R50 SO3 Ro Hole 54 15.3 299.8 0.12 5.8 0.2 6.9 5.5 414 7.0 60.5 80.5 86.4 18.7 75.9 R51 SO3 Ro High W Ox 8.2 161.8 0.29 10.8 0.7 1.4 18.9 33 4.7 97.8 65.1 40.8 12.2 96.4 C52 SO3 Ro Hole 55 Deep 14.3 286.8 0.11 15.8 0.1 4.8 17.9 12 8.2 90.1 102.0 81.9 22.1 76.1 C53 SO3 Ro Hole 55 Shallow 15.2 304.7 0.10 13.3 0.4 4.8 12.7 834 6.7 97.6 91.8 96.3 28.7 97.9 C54 SO3 Ro High Mo Ox 10.6 218.6 0.16 7.7 1.7 13.0 291 6.0 95.9 77.8 12.9 94.1 C55 SO3 Ro High Zn 25.4 506.8 0.09 26.8 3.3 27.4 11.4 77 5.2 99.1 96.3 94.2 30.6 93.7 C56 SO3 Ro Low W Ox 8.8 176.4 0.08 5.1 0.3 0.3 11.3 30 6.4 97.6 80.3 39.4 11.9 72.3 LCT58 SO3 Ro Oxide Comp 8.2 656.0 0.03 37.0 1.3 16.6 26.6 677 4.6 91.7 56.5 65.9 11.7 76.6 C59 SO3 Ro Hole 55 Deep 10.6 214.6 0.09 20.5 0.2 6.3 21.4 21 4.0 98.1 89.1 93.9 19.3 78.0 C60 SO3 Ro Hole 55 Shallow 12.7 256.6 0.09 15.4 0.5 5.4 14.6 855 4.7 98.2 93.4 96.3 30.1 98.4 C61 SO3 Ro High Mo Ox 8.2 165.9 0.14 10.0 0.2 2.3 15.9 416 4.0 96.9 80.4 76.9 12.7 95.9 C62 SO3 Ro High Zn 23.4 466.7 0.07 28.4 3.1 32.5 12.0 89 31.8 98.7 95.4 94.5 30.6 92.3 C63 SO3 Ro Low W Ox 7.5 150.3 0.11 6.2 0.2 0.3 13.2 57 30.0 95.6 65.4 39.1 11.5 78.4 |
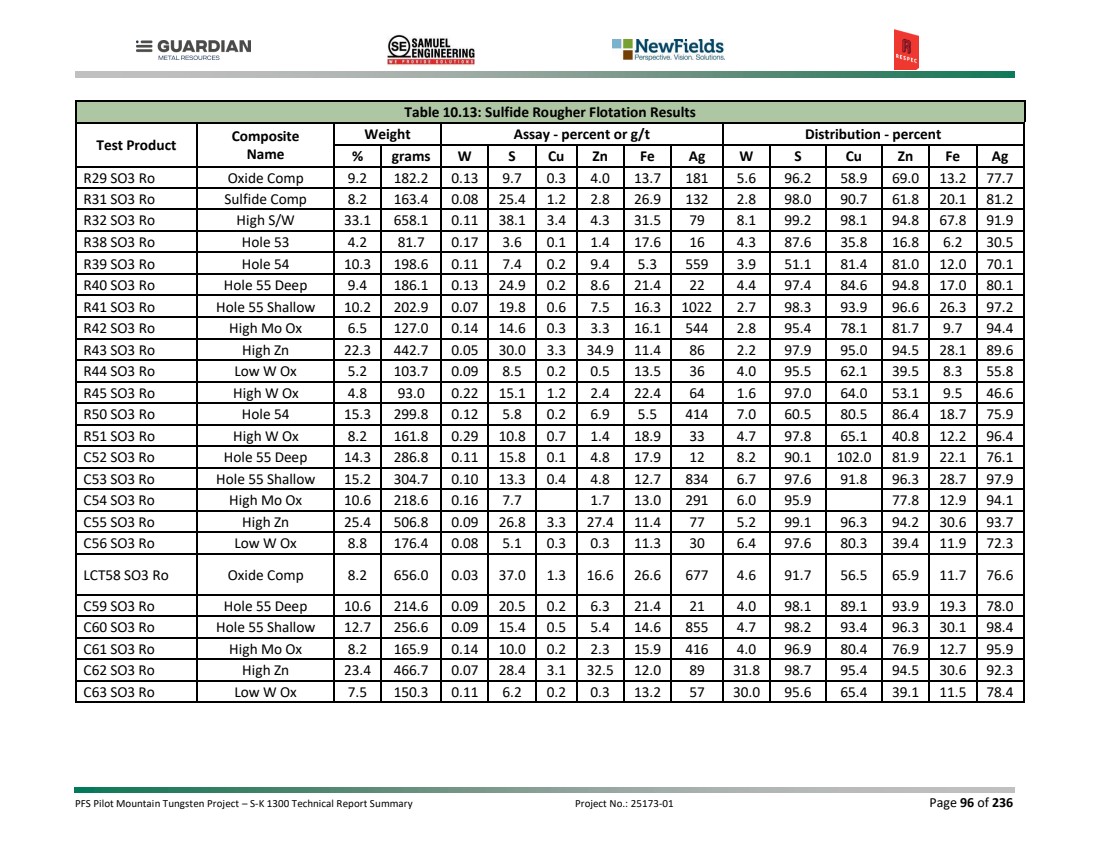
| PFS Pilot Mountain Tungsten Project – S-K 1300 Technical Report Summary Project No.: 25173-01 Page 97 of 236 Table 10.14: Sulfide Cleaner Flotation Results Test Product Composite Name Weight Assay - percent or g/t Distribution - percent % grams W S Cu Zn Fe Ag W S Cu Zn Fe Ag R52 SO3 3RD CL Hole 55 Deep 5.8 115.4 0.01 37.2 0.2 11.5 27.8 26 0.3 85.1 88.5 79.0 13.8 68.2 R53 SO3 3RD CL Hole 55 Shallow 5.6 112.1 0.01 34.4 1.0 12.6 24.9 2182 0.2 92.9 85.2 93.4 20.7 94.2 R54 SO3 3RD CL High Mo Ox 2.0 40.9 0.05 38.0 0.8 8.3 27.3 1380 0.4 88.6 70.2 5.1 83.4 R55 SO3 3RD CL High Zn 16.6 331.5 0.01 36.1 3.8 40.0 10.4 102 0.4 87.4 72.6 89.9 18.2 81.7 R56 SO3 3RD CL Low W Ox 1.2 23.0 0.04 36.0 0.7 1.3 32.9 157 0.4 90.7 23.8 25.1 4.5 49.9 LCT58 SO3 3RD CL Oxide Comp 2.0 80.6 0.03 36.3 1.2 16.5 26.2 669 0.2 88.2 47.1 59.7 5.6 68.2 C59 SO3 3RD CL Hole 55 Deep 5.7 115.7 0.03 36.4 0.3 11.4 29.3 37 0.8 93.8 80.0 92.1 14.2 72.8 C60 SO3 3RD CL Hole 55 Shallow 5.5 111.7 0.02 34.0 1.0 12.3 25.0 1900 0.5 94.5 88.9 94.8 22.6 95.2 C61 SO3 3RD CL High Mo Ox 2.1 42.5 0.03 36.8 0.7 8.4 31.1 1500 0.2 91.3 69.8 71.6 6.4 88.7 C62 SO3 3RD CL High Zn 17.1 340.7 0.01 34.9 3.8 42.6 11.0 104 2.3 88.7 85.3 90.4 20.5 79.2 C63 SO3 3RD CL Low W Ox 1.4 28.9 0.22 30.2 0.7 1.3 31.3 255 11.5 90.4 53.2 28.4 5.2 67.4 |
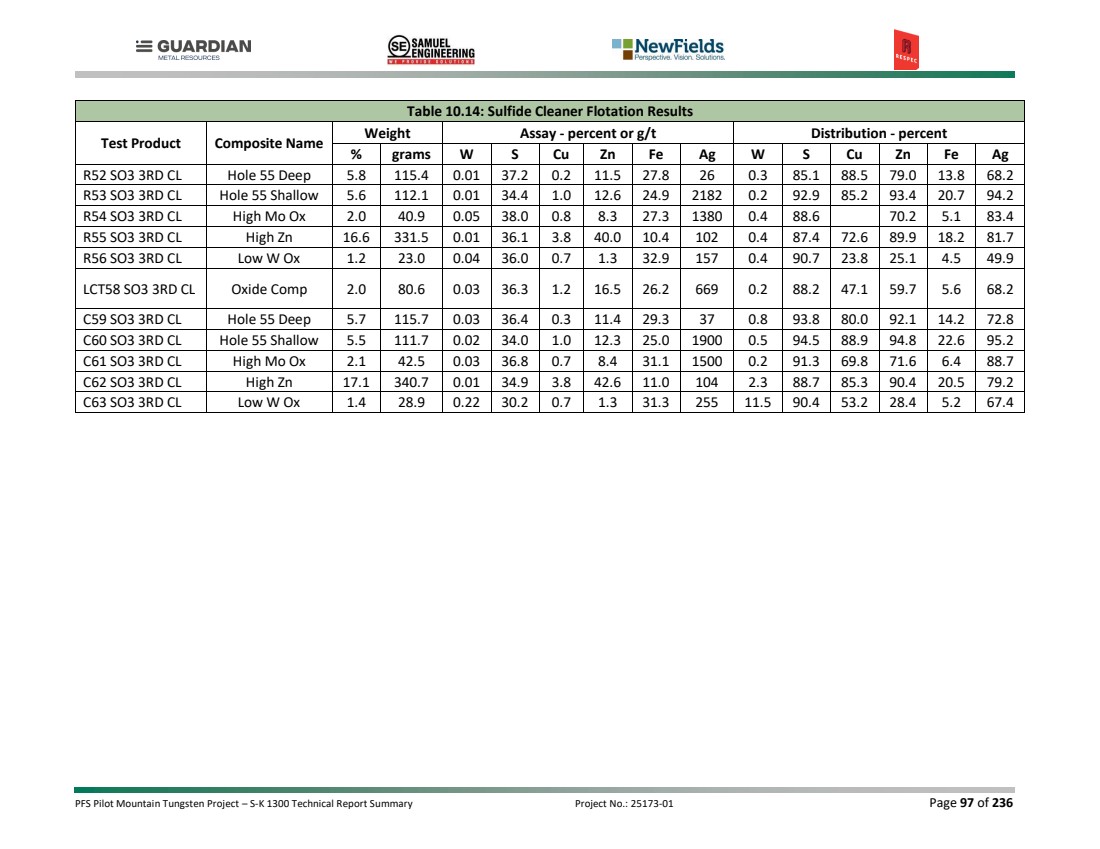
| PFS Pilot Mountain Tungsten Project – S-K 1300 Technical Report Summary Project No.: 25173-01 Page 98 of 236 10.2.1.6 Tungsten Flotation Rougher flotation recovery for the selected flowsheet averaged 82% tungsten and ranged from 70% to 91%. Mass pull into the rougher concentrate varied from 3.4% to 30% with the amount of calcite being the largest gangue component. Mass pull into the cleaner circuit is an important parameter for the process due to the sodium silicate dosage in the cleaner being proportional to the mass pull. Tungsten recoveries into the rougher concentrate were insensitive to head grade as shown in Figure 10.8 below. Results for the tungsten rougher stage are shown below in Table 10.15. Figure 10.8: Tungsten Rougher Recovery Table 10.15: Tungsten Rougher Flotation Results Test Product Composite Name Weight Assay - percent or g/t Distribution - percent % grams W Mo Ca Si W Mo Ca Si R29 W Ro Oxide Comp 3.4 66.8 4.94 1478 21.1 14.5 79.8 39.2 3.9 2.7 R31 W Ro Sulfide Comp 5.0 100.3 3.28 510 16.9 12.5 70.3 24.4 5.4 3.6 R32 W Ro High S/W 4.6 92.1 7.48 306 17.0 9.8 78.9 17.0 6.6 3.4 R38 W Ro Hole 53 3.4 67.0 3.75 606 15.0 17.8 76.3 40.0 3.5 2.6 R39 W Ro Hole 54 6.7 129.7 3.31 1096 13.0 13.2 73.2 50.3 5.5 4.4 R40 W Ro Hole 55 Deep 7.0 139.3 3.09 42 26.0 8.9 81.1 54.1 9.2 3.7 R41 W Ro Hole 55 Shallow 6.9 136.5 3.24 233 25.5 10.6 89.1 16.8 9.2 3.9 R42 W Ro High Mo Ox 5.8 113.4 4.91 2427 24.7 9.2 90.6 46.5 6.6 3.2 R43 W Ro High Zn 5.6 111.2 8.41 581 19.3 11.5 84.5 29.3 7.2 4.4 R44 W Ro Low W Ox 7.1 142.3 1.35 576 27.8 8.1 85.0 63.3 8.8 3.4 R45 W Ro High W Ox 4.2 82.9 11.74 1463 20.5 11.3 75.7 62.1 4.9 2.8 R50 W Ro Hole 54 10.9 213.2 2.08 713 16.7 14.4 84.3 53.2 11.3 7.9 R51 W Ro High W Ox 10.0 196.4 4.23 481 22.2 11.1 84.7 55.6 12.3 6.1 0.0 10.0 20.0 30.0 40.0 50.0 60.0 70.0 80.0 90.0 100.0 0.00 0.10 0.20 0.30 0.40 0.50 0.60 0.70 Tungsten Rougher Recovery % Tungsten Head Grade % |
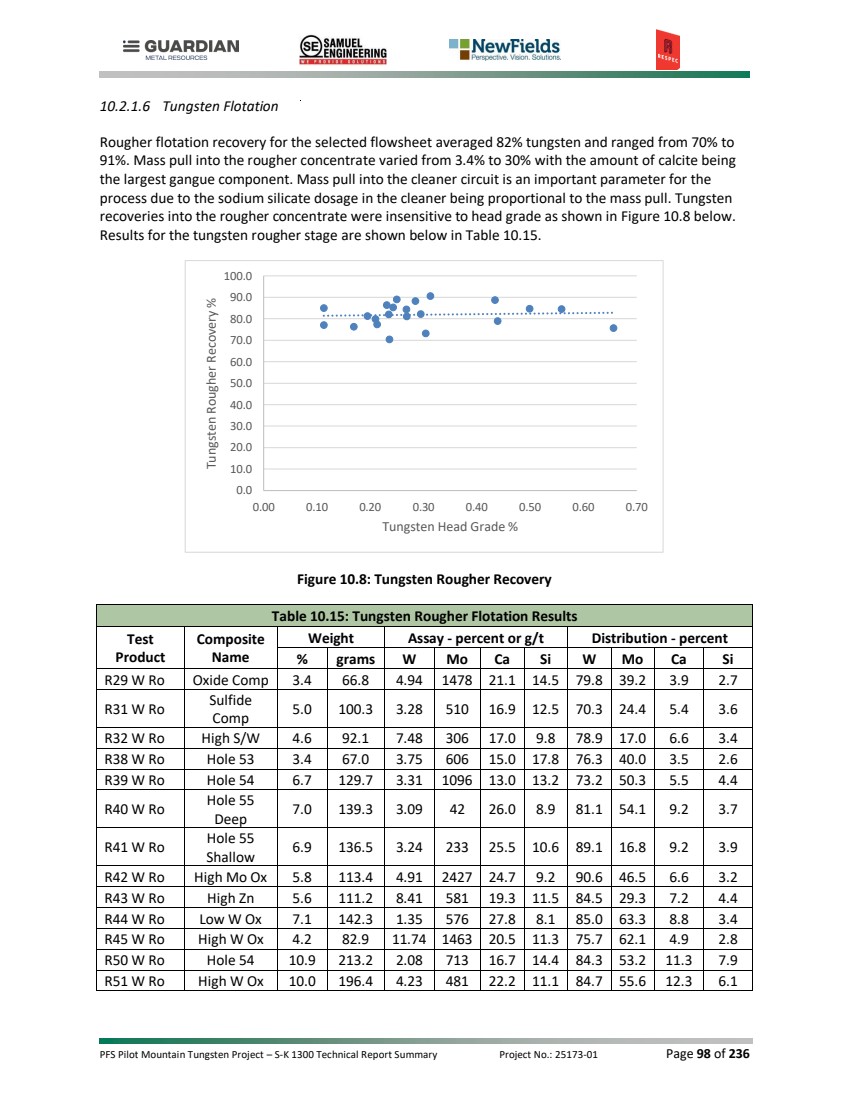
| PFS Pilot Mountain Tungsten Project – S-K 1300 Technical Report Summary Project No.: 25173-01 Page 99 of 236 Table 10.15: Tungsten Rougher Flotation Results Test Product Composite Name Weight Assay - percent or g/t Distribution - percent % grams W Mo Ca Si W Mo Ca Si C52 W Ro Hole 55 Deep 30.6 611.2 0.52 31 23.2 11.4 81.2 81.6 37.4 21.3 C53 W Ro Hole 55 Shallow 19.2 383.5 1.04 87 24.6 10.3 86.4 20.4 26.0 10.6 C54 W Ro High Mo Ox 26.7 552.4 0.94 480 25.3 7.1 88.3 49.7 34.1 12.4 C55 W Ro High Zn 12.8 255.5 3.01 181 21.3 11.4 88.7 26.3 18.9 10.1 C56 W Ro Low W Ox 14.0 279.5 0.62 273 27.4 7.6 77.1 62.4 18.9 6.9 R57 W Ro Hole 54 8.5 166.6 2.85 1021 19.1 18.0 82.2 68.2 8.9 7.3 LCT58 W Ro Oxide Comp 13.5 1078.9 1.43 495 25.5 9.5 82.1 57.9 19.7 6.9 C59 W Ro Hole 55 Deep 11.7 236.4 1.63 90 22.6 10.0 85.2 83.6 14.8 7.3 C60 W Ro Hole 55 Shallow 10.8 218.1 1.81 180 22.9 10.3 88.2 22.6 14.3 6.1 C61 W Ro High Mo Ox 11.2 225.8 2.28 1010 22.1 12.9 86.3 46.0 12.5 8.9 C62 W Ro High Zn 7.8 155.0 4.50 451 18.4 13.9 87.9 31.0 9.9 7.2 C63 W Ro Low W Ox 8.3 165.1 1.34 604 22.6 11.7 80.0 66.5 9.0 5.8 A heated conditioning step is required to deactivate gangue material, primarily calcite, prior to tungsten cleaner flotation. The rougher concentrate is heated to 70° C to 90° C and conditioned for one hour with 1000 g/t sodium sulfide and 60,000 g/t sodium silicate, both based on rougher mass pull. After conditioning, the material is cleaned with three stages of cleaner flotation to increase tungsten concentration. The program performed 11 cleaner tests on 6 composites utilizing the final flowsheet, including one locked cycle test on the main oxide composite. The cleaner tests showed good recoveries and upgrading on the tungsten concentrate on all samples except for the low-grade tungsten composite, which did not upgrade well despite having good recovery. Additional testwork on the low head grade portions of the deposit will be required to assess the steps needed to upgrade the concentrate at low grades. The stage recovery for the cleaner flotation averaged 92.4% tungsten recovery. The overall tungsten recovery for these samples averaged 76.1% and ranged from 63.4% to 82.0%. Tungsten concentrate grades averaged 44.6% W (56.3% WO₃). The tests for the oxide composite indicated that the use of locked cycle flow increases the tungsten recovery by as much as 3% while still maintaining concentrate grades above 50% WO₃. Results for the tungsten cleaner flotation are shown below in Table 10.16. Table 10.16: Tungsten Cleaner Flotation Results Test Product Composite Name Weight Assay - percent or g/t Distribution - percent % grams W Mo Ca Si W Mo Ca Si CL29B W Cl Oxide Comp 0.3 5.4 56.00 15758 13.2 1.4 73.1 33.8 0.2 0.0 CL53B W Cl Hole 55 Shallow 0.4 7.5 47.99 3911 13.5 1.1 63.4 21.5 0.1 0.0 CL54B W Cl High Mo Ox 0.5 10.4 46.30 23131 20.5 1.1 82.0 45.1 0.5 0.0 |
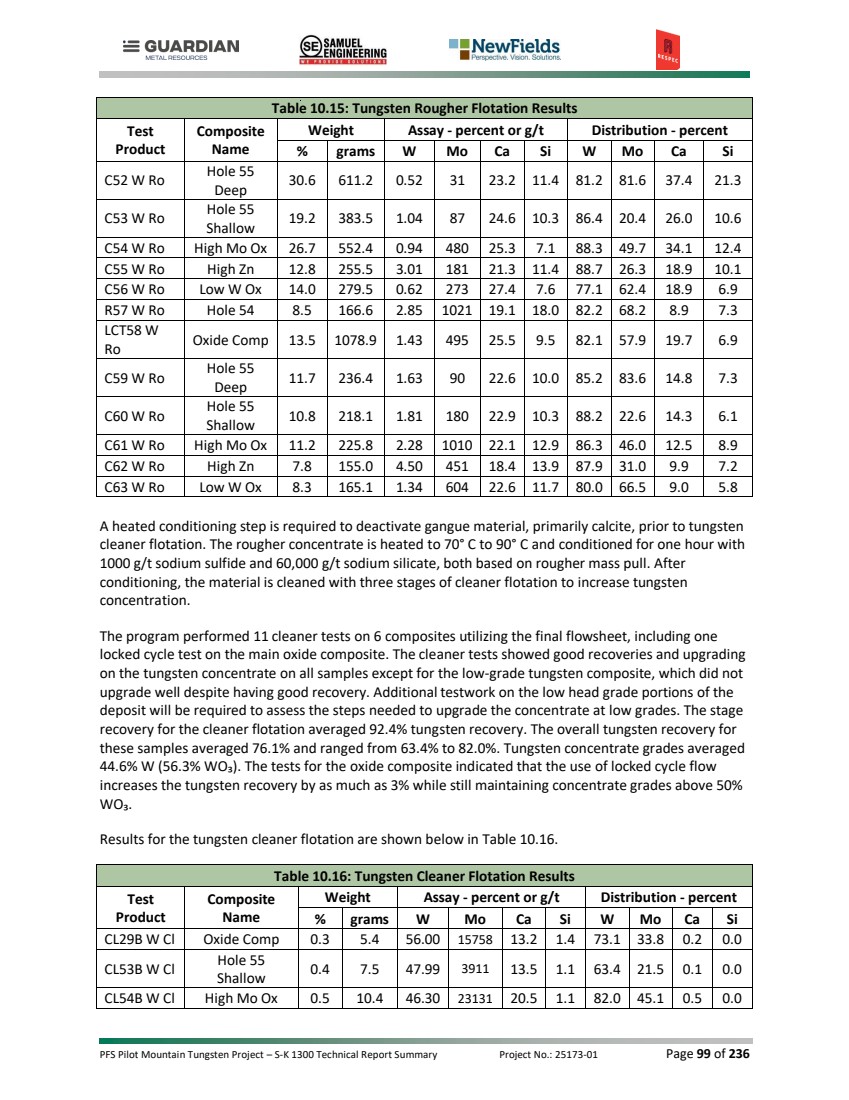
| PFS Pilot Mountain Tungsten Project – S-K 1300 Technical Report Summary Project No.: 25173-01 Page 100 of 236 Table 10.16: Tungsten Cleaner Flotation Results Test Product Composite Name Weight Assay - percent or g/t Distribution - percent % grams W Mo Ca Si W Mo Ca Si CL55B W Cl High Zn 0.6 12.8 54.62 3108 12.4 1.2 80.7 22.6 0.6 0.1 CL56B W Cl Low W Ox 0.5 10.7 14.72 6610 23.3 1.6 69.9 57.9 0.6 0.1 LCT58 W Cl Oxide Comp 0.4 15.1 46.44 10363 16.7 0.6 78.2 38.2 0.4 0.0 C59 W Cl Hole 55 Deep 0.3 6.4 57.10 2994 15.3 0.8 80.7 75.2 0.3 0.0 C60 W Cl Hole 55 Shallow 0.3 6.2 59.11 5747 12.5 0.7 81.7 20.6 0.2 0.0 C61 W Cl High Mo Ox 0.4 8.0 58.34 25726 14.6 0.5 78.1 41.6 0.3 0.0 C62 W Cl High Zn 0.7 13.8 46.68 4628 13.7 1.0 81.1 28.3 0.7 0.0 C63 W Cl Low W Ox 3.3 65.1 3.28 1445 31.3 2.1 77.1 62.8 4.9 0.4 10.2.1.7 Concentrate Analysis Mineralogical data, using QEMSCAN, and analytical assays were collected from both the sulfide and tungsten concentrates. The tungsten concentrate analyzed was from the high molybdenum sample because molybdenum is the primary penalty element. The tungsten concentrate contained ~2.3% Mo, slightly higher than the 2.0% threshold. Because the high Mo sample was roughly 8 times the average Mo head grade in the deposit, it is expected that Mo concentrations in concentrate will fall below the penalty threshold without additional ore blending. The QEMSCAN also showed that at the high Mo concentrations approximately one-third of the total scheelite contains molybdenum, as powellite (CaMoO₄), in solid solution within the scheelite crystalline structure. Within this combined structure approximately 20% exists as Powellite, and 80% as Scheelite. Mineralogical and assay data for the concentrates are shown below in Table 10.17 and Table 10.18. Table 10.17: Concentrate Mineralization Mineral Abundance (wt%) Sulfide Concentrate High Mo Oxide Concentrate Pyrite 48.4 0.06 Chalcopyrite 3.45 0.02 Other Cu Sulphides 0.32 0 Sphalerite 28.4 0.05 Galena 3.49 0.45 Molybdenite 0.28 ND Other Sulphides 0.12 0.05 Quartz 2.56 0.99 Plagioclase 0.05 0.12 K-Feldspar 0.01 ND Muscovite/Illite 0.03 0.01 Chlorite 0.03 0.02 Amphibole/Pyroxene 3.55 0.69 Garnet 1.46 1.32 Talc 3.31 0.01 Clays 0.05 0.07 Other Silicates 0.3 0.11 |
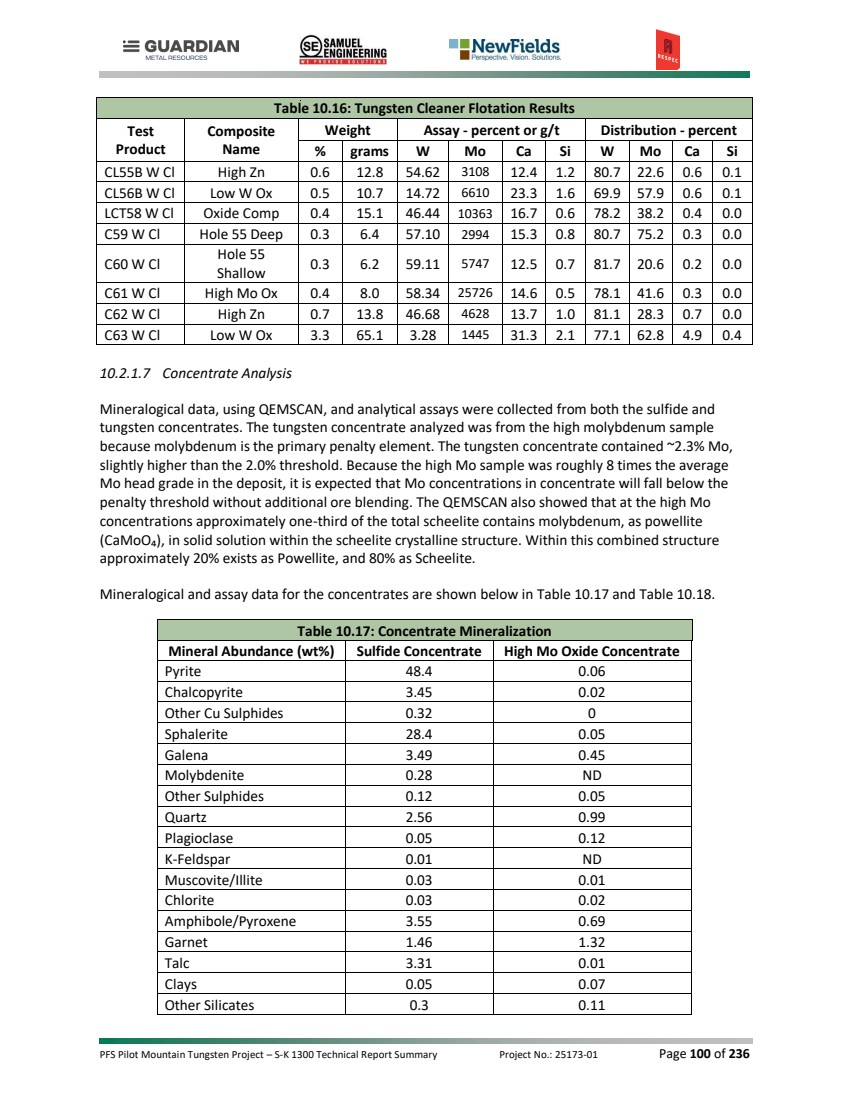
| PFS Pilot Mountain Tungsten Project – S-K 1300 Technical Report Summary Project No.: 25173-01 Page 101 of 236 Table 10.17: Concentrate Mineralization Mineral Abundance (wt%) Sulfide Concentrate High Mo Oxide Concentrate Scheelite 0.02 51.7 Powellite-Scheelite ND 24.4 Pb-Tungstate ND 0.39 Fe-Oxides 1.06 0.05 Other Oxides 0.13 0.01 Calcite 2.53 18.7 Ferroan Dolomite 0.23 0.3 Siderite 0.17 0.23 Apatite 0.07 0.16 Other 0.02 0.06 Total 100 100 Table 10.18: Concentrate Assays Element Assay Method Sulfide Concentrate High Mo Oxide Concentrate Ca QEMSCAN 1.86 18.5 Chemical 1.91 20.5 Cu QEMSCAN 1.32 0.01 Chemical 1.30 0.01 Fe QEMSCAN 25.7 0.54 Chemical 25.4 0.6 Mg QEMSCAN 0.98 0.13 Chemical 1.16 0.23 Mo QEMSCAN 0.13 2.27 Chemical 0.15 2.31 Pb QEMSCAN 3.00 NA Chemical 2.79 NA S QEMSCAN 37.0 0.13 Chemical 37.0 0.11 Si QEMSCAN 3.61 1.07 Chemical 3.42 1.08 W QEMSCAN 0.02 46.5 Chemical 0.03 46.3 Zn QEMSCAN 18.3 0.03 Chemical 17.1 0.03 10.2.1.8 Additional Testwork Testwork is currently ongoing at Base Met Labs to expand and complete the testwork on the current set of samples, including samples for the Garnet deposit. Additional cleaner testwork is planned and ongoing for all the variability composites, and an additional locked cycle test is planned on the sulfide bulk composite. Flocculant screening and thickening tests, as well as filtration test will be completed on the tailings samples. These tests are also planned for both the sulfide and tungsten concentrates if there is sufficient sample available. |
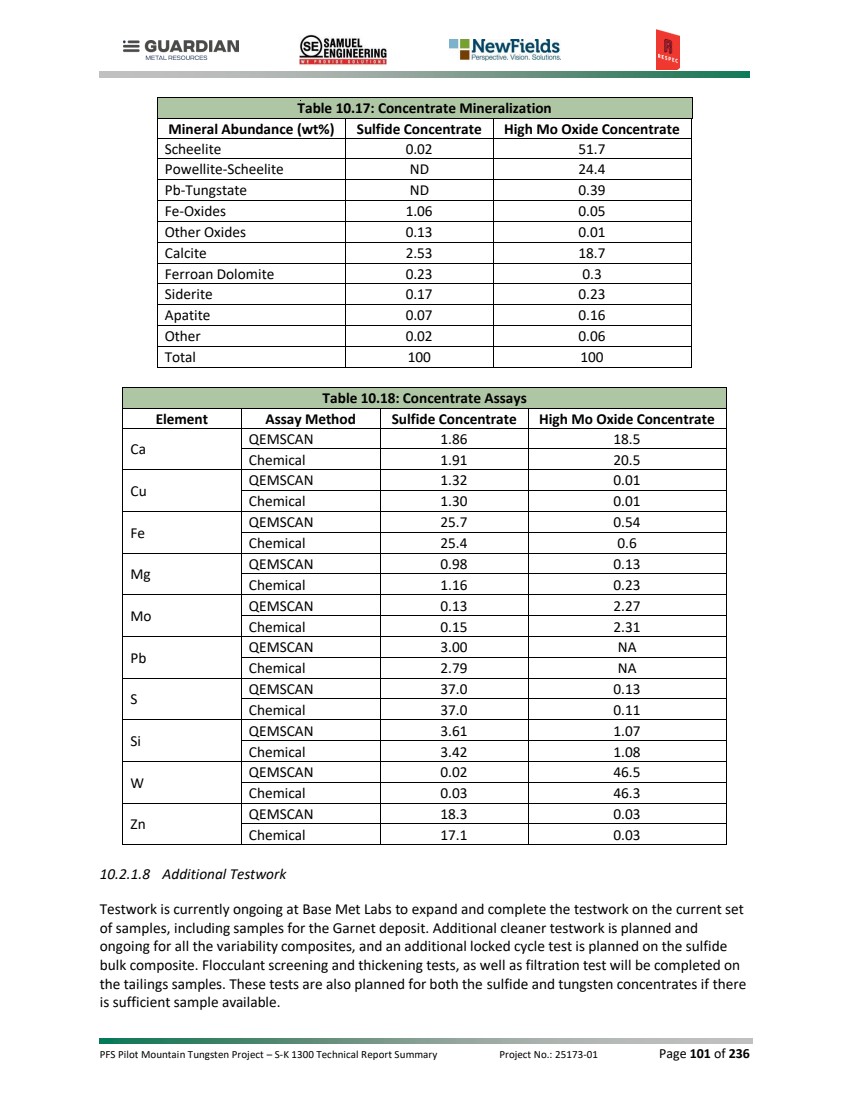
| PFS Pilot Mountain Tungsten Project – S-K 1300 Technical Report Summary Project No.: 25173-01 Page 102 of 236 10.2.1.9 Conclusions of Metallurgical Results The historical testwork at GZRINM and GIRCU, as well as the current test program at BML all support the decision to use froth flotation as the beneficiation method to produce a salable tungsten concentrate. The locked cycle test at BML was used as the basis for tungsten recovery for this study at 78.5%. This number is supported by numerous other batch tests achieving overall tungsten recoveries at that level or higher. The testwork also indicates that the recovery is generally insensitive to head grade, supporting the use of a single recovery value. The head grade versus recovery relationship should be further investigated in future testwork. A final concentrate grade of 60% WO₃, as supported by the numerous cleaner concentrates from the test program, was used as the study basis. |

| PFS Pilot Mountain Tungsten Project – S-K 1300 Technical Report Summary Project No.: 25173-01 Page 103 of 236 11.0 MINERAL RESOURCE ESTIMATES The Mineral Resource Estimate presented herein supersedes the Mineral Resource Estimate disclosed in the S-K 1300 Technical Report Summary, Pilot Mountain Tungsten Project, Mineral County, Nevada, USA (RESPEC Report RSI-3732, dated December 15, 2025). The current estimate for the Desert Scheelite deposit reflects additional drilling, updated geological modeling, revised resource classification, and updated economic parameters completed since December 15, 2025. This report also includes the first Mineral Resource Estimate for the Garnet deposit. Collectively, these estimates represent the current Mineral Resource Estimate for the Project. This estimate of mineral resources for the Pilot Mountain Tungsten Project was completed for disclosure in accordance with reporting requirements outlined in the United States Securities and Exchange Commission’s (“SEC”) Modernized Property Disclosure Requirements for Mining Registrants as described in Subpart 229.1300 of Regulation S-K, Disclosure by Registrants Engaged in Mining Operations (S-K 1300) and Item 601 (b)(96) Technical Report Summary. As of the date of this report, RESPEC is not aware of any unusual environmental, permitting, legal, title, taxation, socio-economic, marketing, or political factors that may materially affect the estimate of Desert Scheelite and Garnet mineral resources. SEC definitions and requirements relevant to the disclosure of mineral resources are given below, with the SEC’s exact text in italics: Disclosure of mineral resources…must be based on and accurately reflect information and supporting documentation prepared by a qualified person. A mineral resource is a concentration or occurrence of material of economic interest in or on the Earth's crust in such form, grade or quality, and quantity that there are reasonable prospects for economic extraction. A mineral resource is a reasonable estimate of mineralization, considering relevant factors such as cut-off grade, likely mining dimensions, location or continuity, that, with the assumed and justifiable technical and economic conditions, is likely to, in whole or in part, become economically extractable. It is not merely an inventory of all mineralization drilled or sampled. When determining the existence of a mineral resource, a qualified person must: • Be able to estimate or interpret the location, quantity, grade or quality continuity, and other geological characteristics of the mineral resource from specific geological evidence and knowledge, including sampling; and • Conclude that there are reasonable prospects for economic extraction of the mineral resource based on his or her initial assessment. At a minimum, the initial assessment must include the qualified person's qualitative evaluation of relevant technical and economic factors likely to influence the prospect of economic extraction to establish the economic potential of the mining property or project. In addition: • The technical report summary submitted by the qualified person to support a determination of mineral resources must describe the procedures, findings and conclusions reached. • When determining mineral resources, a qualified person must subdivide mineral resources, in order of increasing geological confidence, into inferred, indicated, and measured mineral resources. |

| PFS Pilot Mountain Tungsten Project – S-K 1300 Technical Report Summary Project No.: 25173-01 Page 104 of 236 An inferred mineral resource is that part of a mineral resource for which quantity and grade or quality are estimated based on limited geological evidence and sampling. The level of geological uncertainty associated with an inferred mineral resource is too high to apply relevant technical and economic factors likely to influence the prospects of economic extraction in a manner useful for evaluation of economic viability. Because an inferred mineral resource has the lowest level of geological confidence of all mineral resources, which prevents the application of the modifying factors in a manner useful for evaluation of economic viability, an inferred mineral resource may not be considered when assessing the economic viability of a mining project, and may not be converted to a mineral reserve. For inferred mineral resources, a qualified person: (1) Must have a reasonable expectation that most inferred mineral resources could be upgraded to indicated or measured mineral resources with continued exploration; and (2) Should be able to defend the basis of this expectation before his or her peers. An Indicated Mineral Resource is that part of a mineral resource for which quantity and grade or quality are estimated based on adequate geological evidence and sampling. The level of geological certainty associated with an indicated mineral resource is sufficient to allow a qualified person to apply modifying factors in sufficient detail to support mine planning and evaluation of the economic viability of the deposit. Because an indicated mineral resource has a lower level of confidence than the level of confidence of a measured mineral resource, an indicated mineral resource may only be converted to a probable mineral reserve. A Measured Mineral Resource is that part of a mineral resource for which quantity and grade or quality are estimated based on conclusive geological evidence and sampling. The level of geological certainty associated with a measured mineral resource is sufficient to allow a qualified person to apply modifying factors, as defined in this section, in sufficient detail to support detailed mine planning and final evaluation of the economic viability of the deposit. Because a measured mineral resource has a higher level of confidence than the level of confidence of either an indicated mineral resource or an inferred mineral resource, a measured mineral resource may be converted to a proven mineral reserve or to a probable mineral reserve. Modifying Factors are the factors that a qualified person must apply to indicated and measured mineral resources and then evaluate to establish the economic viability of mineral reserves. A qualified person must apply and evaluate modifying factors to convert measured and indicated mineral resources to proven and probable mineral reserves. These factors include, but are not restricted to: Mining; processing; metallurgical; infrastructure; economic; marketing; legal; environmental compliance; plans, negotiations, or agreements with local individuals or groups; and governmental factors. The number, type, and specific characteristics of the modifying factors applied will necessarily be a function of and depend upon the mineral, mine, property, or project. RESPEC conducted work that included assessment of the recoverability of valuable minerals, evaluation of potential markets for recovered mineral forms, estimation of mining costs, development of a preliminary pit configuration, and analysis of milling and processing costs. These initial evaluations were completed to a level that demonstrates a “prospect of economic extraction.” While the work does not establish reserves or reach feasibility standards, it is sufficient to support the declaration of mineral resources. |

| PFS Pilot Mountain Tungsten Project – S-K 1300 Technical Report Summary Project No.: 25173-01 Page 105 of 236 11.1 DATABASE 11.1.1 Desert Scheelite RESPEC staff audited the Pilot Mountain drilling database in 2025 and finalized the database used for mineral resource estimation on January 23, 2026. A plan map showing drill-hole collar locations and resource outline for the Desert Scheelite deposit is presented in Figure 7.1 in Section 7.5. The database has 8,530 assay records accepted as usable for estimation. RESPEC excluded a total of 292 assay records, all originating from nine drill holes, due to long composited samples and selectively sampled intervals that did not align with Guardian Metal’s drill assays. RESPEC removed these records from the resource database to ensure that only reliable data contributed to the resource estimation. Of the accepted records, 5,315 have elemental tungsten assays, 6,697 have WO3 assays, 6,107 (69% of intervals with W and/or WO3 assays) have silver assays, 7,579 (88%) have copper assays, and 5,762 (65%) have zinc assays. Table 11.1 presents descriptive statistics of all data in the audited database that was imported into MS Torque for modeling and resource estimation in MinePlan. The database also contains logged lithology, alteration, and oxidation. RESPEC used all acceptable drilling data in the estimate, but RESPEC only audited the collar locations, down-hole surveys, and the tungsten, silver, copper, and zinc analyses. Table 11.1: Desert Scheelite Resource Database Descriptive Statistics—For All Accepted Sample Data Only Field Valid Minimum Maximum Mean Median Std. Devn. Co. of Variation Unit From 7,730 0 371.90 m To 7,730 0.5 374.90 m Length 7,730 0.04 187.6 2.952 1.8 m W 3,814 0 2.3 0.09 0.021 0.148 1.656 % WO3 5,921 0 3.04 0.132 0.029 0.229 1.731 % Ag 5,342 0.034 1,749.65 8.742 1.028 41.241 4.718 ppm Cu 6,814 0 5.02 0.058 0.012 0.209 3.613 % Zn 5,098 0 25.25 0.209 0.027 0.805 3.855 % 11.1.2 Garnet RESPEC audited the Garnet deposit drilling database as part of the 2026 data verification program and finalized the database used for mineral resource estimation on April 30, 2026. A plan map showing drill‑hole collar locations and the Garnet resource outline is presented in Figure 7.1 in Section 7.5. The audited database contains 3,828 assay intervals accepted as usable for estimation. RESPEC excluded only the historical assay intervals generated by UCC. Comparative analysis showed that the UCC data were systematically biased high relative to the more recent drilling completed by Thor and Guardian Metal. To maintain internal consistency and avoid introducing grade bias into the estimate, RESPEC removed the UCC intervals and retained only the validated Thor and Guardian Metal assay data. Of the accepted intervals, 3,147 contain elemental tungsten assays, 3,740 contain WO₃ assays, 3,740 contain silver assays, 3,738 contain copper assays, and 3,739 contain zinc assays. Table 11.2 presents descriptive statistics for all assay fields in the audited database imported into MS Torque for modeling and resource estimation in MinePlan. The database also includes logged lithology, alteration, and oxidation. RESPEC used all acceptable drilling data in the estimate, and RESPEC audited the collar locations, down‑hole surveys, and the tungsten, silver, copper, and zinc analyses. |
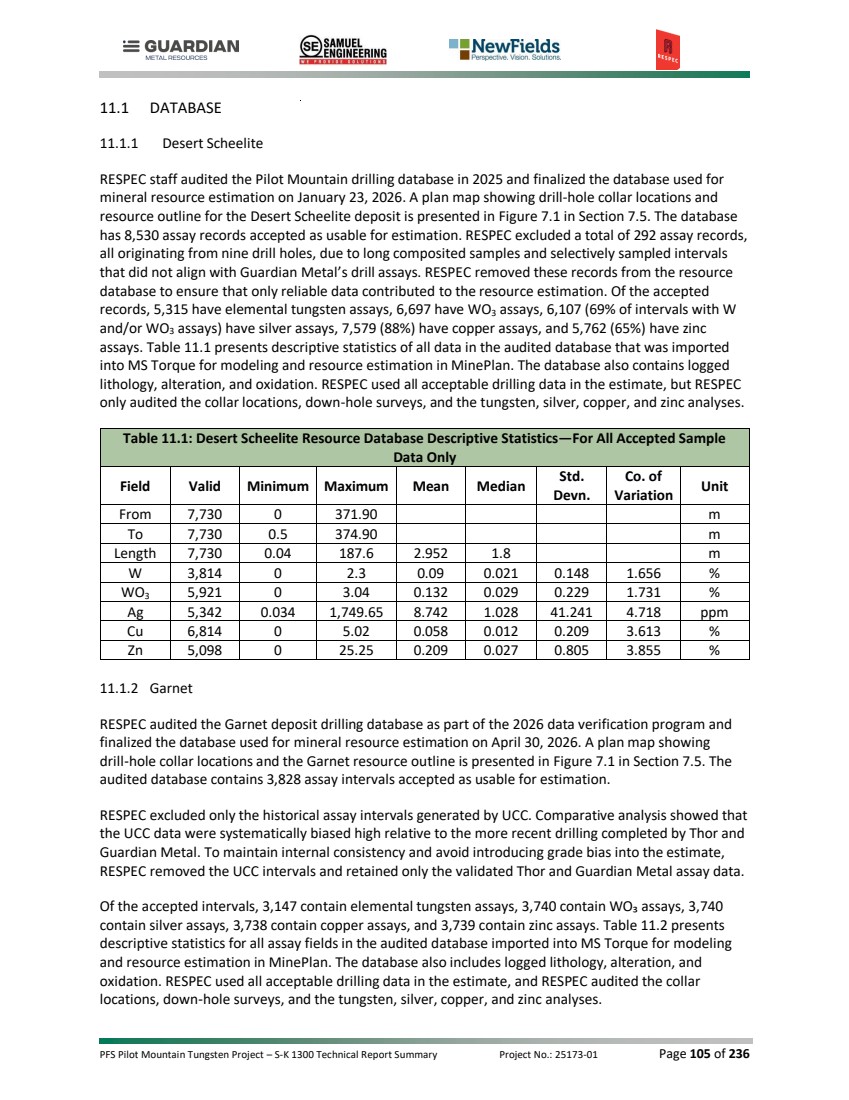
| PFS Pilot Mountain Tungsten Project – S-K 1300 Technical Report Summary Project No.: 25173-01 Page 106 of 236 Table 11.2: Garnet Resource Database Descriptive Statistics—For All Accepted Sample Data Only Field Valid Minimum Maximum Mean Median Std. Devn. Co. of Variation Unit From 3,828 0 131.7 m To 3,828 0.3 133.2 m Length 3,828 0 48.27 1.6 1.43 m W 3,147 0.00007 0.635 0.0311 0.0011 0.074 2.365 % WO3 3,740 0.00009 1.967 0.0480 0.0025 0.130 2.709 % Ag 3,740 0.03 401.00 2.050 0.250 10.927 5.331 ppm Cu 3,738 0.00005 0.345 0.0038 0.0023 0.012 3.056 % Zn 3,739 0.0005 7.74 0.1284 0.0123 0.501 3.906 % 11.2 GEOLOGIC MODEL Guardian Metal provided RESPEC with a comprehensive geologic model for Desert Scheelite and Garnet built from Guardian Metal’s and historical geological logging data. The model includes geologic solids constructed in Leapfrog Geo and used to code the block model. In the same manner, an oxidation model was developed from Guardian Metal’s and historical logging data, with oxidation surfaces generated in Leapfrog Geo and used to code the block model. The geologic basis for the models is described in Section 6.0, and representative schematic cross-sections are presented in Figure 11.1 and Figure 11.2. 11.3 MINERAL DOMAINS 11.3.1 Desert Scheelite Using the geologic model as a control, RESPEC interpreted domains of tungsten, silver, copper, and zinc based on sample assays. RESPEC defined the domains according to population breaks on CPPs of each metal separately. The summary of high- and low-grade domain grade ranges determined for each metal is provided in Table 11.3. Table 11.3: Desert Scheelite Grade Ranges of Tungsten, Silver, Copper, and Zinc Domains Determined from CPPs Domain % WO3 ppm Ag % Cu % Zn Low-grade 0.02 - 0.2 2.0 - 15.0 0.02 - 0.6 0.01 - 1.8 High-grade > 0.2 > 15.0 > 0.6 > 1.8 Higher grade tungsten mineralization within the Desert Scheelite deposit is concentrated in three principal zones. The hanging wall zone occurs within skarn adjacent to the hornfels contact. A mid‑deposit zone is hosted within skarn and marble. The footwall zone is hosted within skarn and marble near the quartz monzonite intrusion. These elevated grades show a strong correlation with skarn alteration developed in marble host rocks, while hornfelsed clastic sedimentary units display weaker associations with tungsten mineralization. The quartz monzonite intrusive does not exhibit endoskarn development and is not mineralized. RESPEC constructed the grade domains in Leapfrog Geo using interval selection, which enabled the low‑grade and high‑grade domains to snap to the appropriate drill intercepts. To capture stratigraphic controls on mineralization and to model the domains consistently, RESPEC performed the interval selection along 25m‑spaced, north–south‑oriented cross‑sections. Tungsten mineralization was |
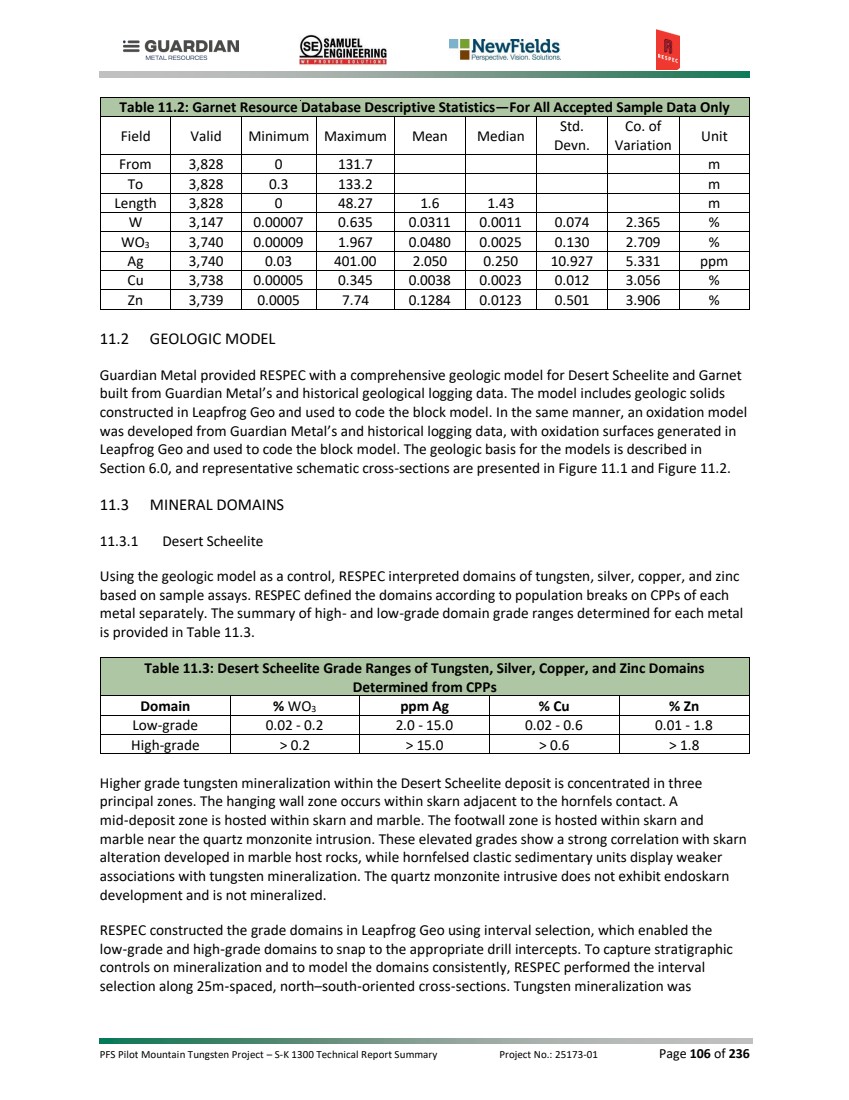
| PFS Pilot Mountain Tungsten Project – S-K 1300 Technical Report Summary Project No.: 25173-01 Page 107 of 236 modeled first. The resulting single set of grade domains provided the basis for defining the corresponding low‑grade silver, copper, and zinc domains. Using the same interval‑selection methodology described above, RESPEC constructed high‑grade domains for tungsten, silver, copper, and zinc. Although RESPEC identified and modeled distinct grade populations, RESPEC applied no separate high‑grade domains in the final resource estimation. To ensure appropriate control of grade estimation within the resource model, RESPEC managed grade continuity according to variogram analyses and the influence of the high‑grade sample population by the application of appropriate estimation parameters, including strong high-grade search restrictions. An example of the geology and the tungsten mineral domain within the Desert Scheelite deposit is illustrated in Figure 11.1. |

| PFS Pilot Mountain Tungsten Project – S-K 1300 Technical Report Summary Project No.: 25173-01 Page 108 of 236 Figure 11.1: Desert Scheelite North-South Cross-Section 424305E Showing Tungsten Mineral Domains and Geology. COORDINATE SYSTEM: UTM WGS84 Zone 11N DATE: 27 May, 2026 RESPEC Reno Office 210 South Rock Blvd. 775.856.5700 %WO3 : <0.005 0.005 - 0.02 0.02 - 0.1 0.1 - 0.2 >0.2 Drill-Hole Assays Color: Mineralized Domain Clastic Sedimentary Hornfels Quartz Monzonite Marble Calcarious Sedimentary Overburden Domains Pilot Mountain Tungsten Project Mineral County, Nevada Tungsten Domains Section 424305 4248200 4248400 1600 1800 Meters 0 15 30 $115,000 WO3 Pit $115,000 WO3 Pit |
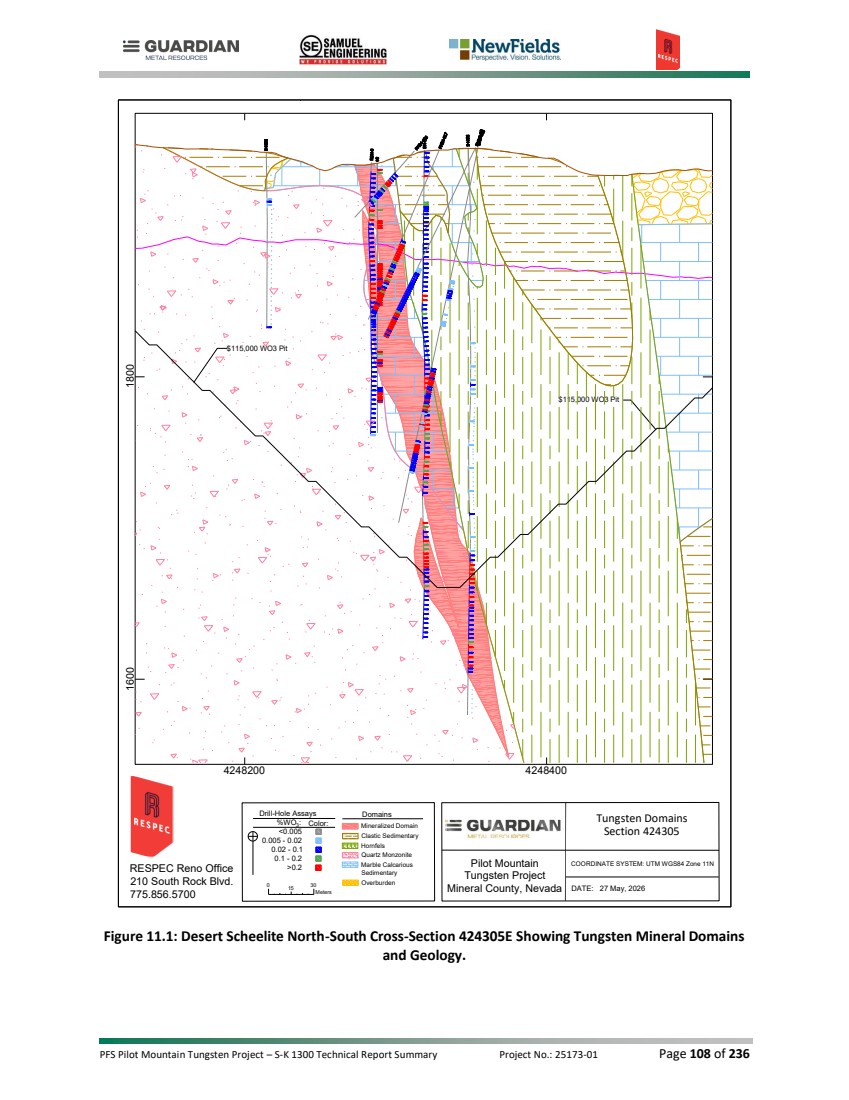
| PFS Pilot Mountain Tungsten Project – S-K 1300 Technical Report Summary Project No.: 25173-01 Page 109 of 236 11.3.2 Garnet Using the geologic model as a control, RESPEC interpreted mineralized domains for tungsten and for silver, copper, and zinc within the Garnet deposit based on sample assays. RESPEC constructed one tungsten mineral domain and a separate mineral domain for silver, copper, and zinc, reflecting the distribution of mineralization observed in drilling. Mineralization at Garnet is hosted within several narrow, near‑horizontal skarn intervals, which represent the primary control on grade distribution. Elevated tungsten, silver, and zinc grades are consistently associated with these skarn horizons. Copper occurs at low grades within the skarn horizons and did not influence the definition of either mineralized domain. No mineralization is associated with non‑skarn lithologies. RESPEC constructed the tungsten mineral domain in Leapfrog Geo using interval selection, enabling the domain to snap directly to the appropriate drill intercepts. To capture stratigraphic controls on mineralization and maintain consistency across the deposit, interval selection was performed on both north–south and east–west oriented cross‑sections spaced at 25 m. The resulting tungsten domain provided the geologic framework for constructing the separate silver–copper–zinc mineral domain, which was modeled using the same interval‑selection methodology. The summary of domain grade ranges determined for each metal is provided in Table 11.4. An example of geology and the tungsten mineral domain within the Garnet deposit is illustrated in Figure 11.2. Table 11.4: Garnet Grade Ranges of Tungsten and Silver-Copper-Zinc Domains Determined from CPPs Domain % WO3 ppm Ag % Zn % Cu Tungsten Domain 0.035 – 1.97 N/A N/A N/A Ag-Zn Domain N/A 2.0 – 401 0.06 – 7.7 Accessory; low values |
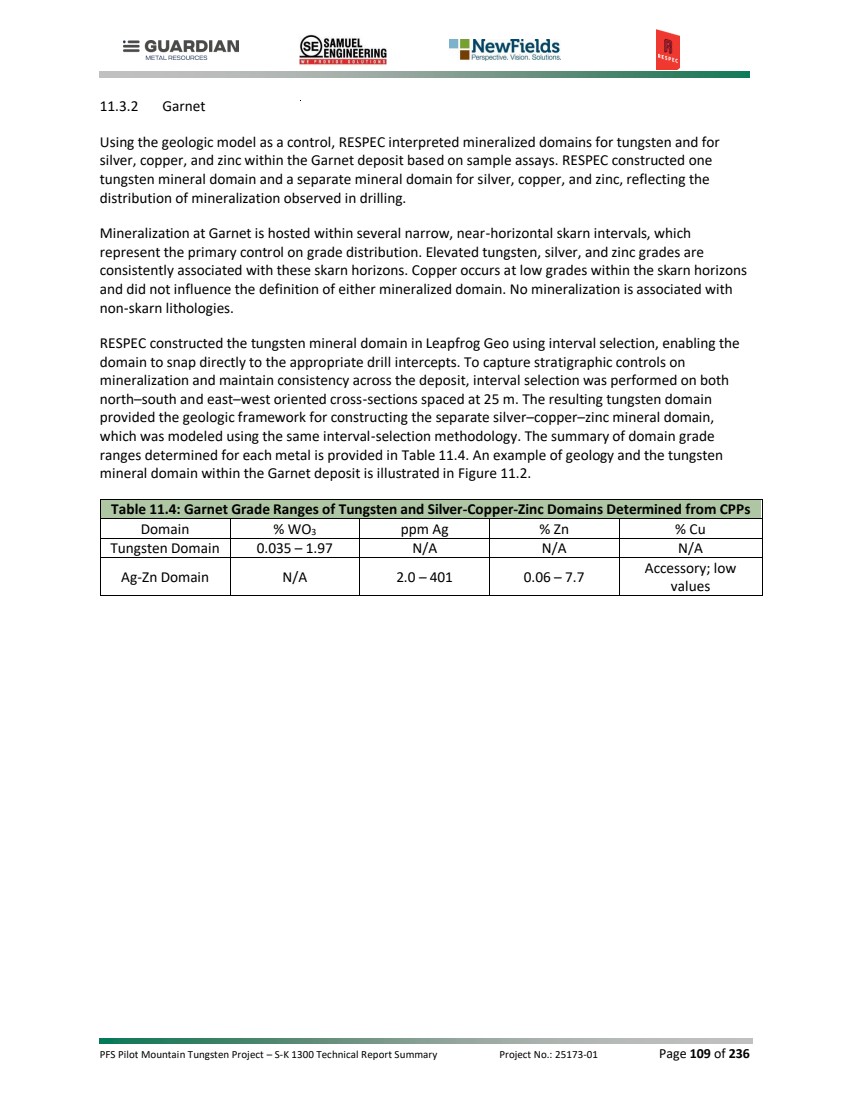
| PFS Pilot Mountain Tungsten Project – S-K 1300 Technical Report Summary Project No.: 25173-01 Page 110 of 236 Figure 11.2: Garnet East-West Cross-Section 4247980N Looking North, Showing Tungsten Mineral Domains and Geology |
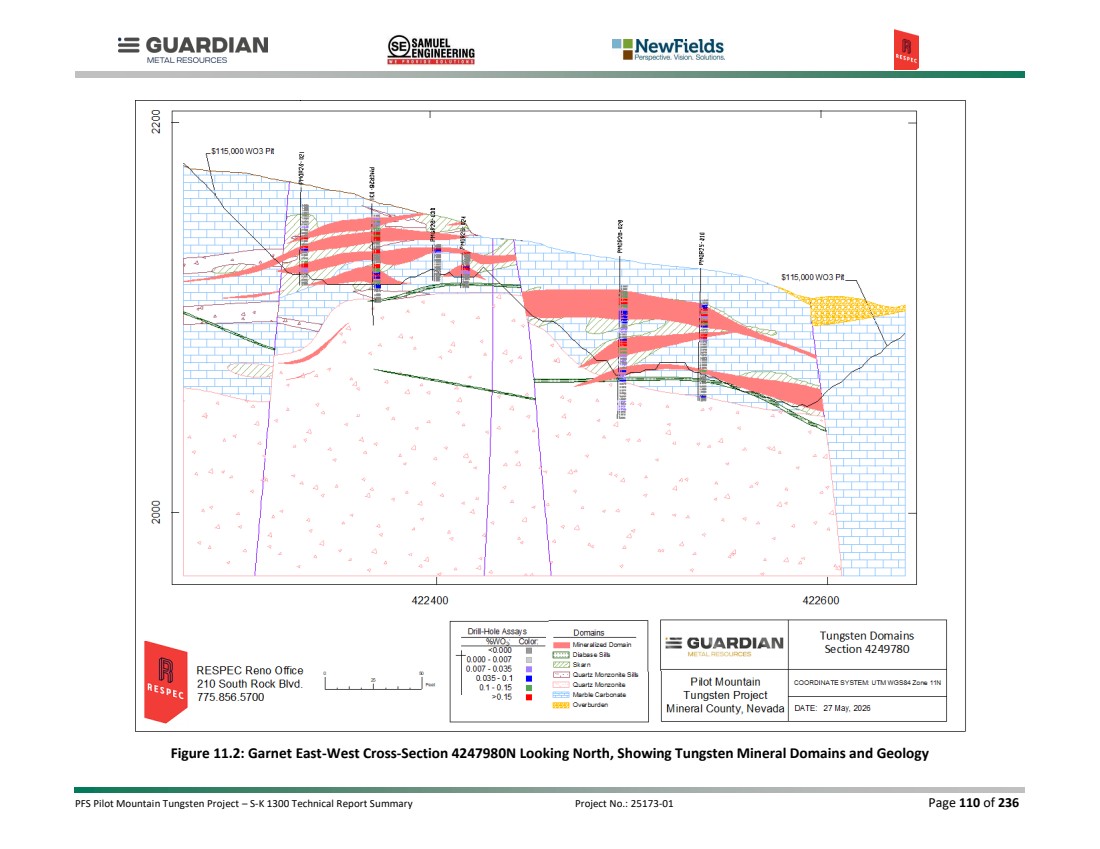
| PFS Pilot Mountain Tungsten Project – S-K 1300 Technical Report Summary Project No.: 25173-01 Page 111 of 236 11.4 SPECIFIC GRAVITY 11.4.1 Desert Scheelite Black Fire and Guardian Metal collected a total of 892 specific gravity measurements on drill-core samples using the water‑immersion method. RESPEC does not know whether Black Fire’s samples were wax-coated during testing. Guardian Metal’s samples were coated with wax. RESPEC evaluated the density dataset both collectively and by logged rock type. Review of measured densities by oxidation type established that oxidation effects on density were minimal. To reduce the influence of outliers and better represent the central tendency of the dataset, RESPEC assigned the median values to the lithologic units in the block model rather than assigning the arithmetic means. The density statistics associated with the different lithologies, and their assigned density values, are summarized in Table 11.5. Table 11.5: Desert Scheelite Density Statistics and Values Applied to the Different Lithologies in the Block Model Lithology Valid Mean Median Std. Dev. CV Minimum Maximum Density Assigned in Model Units Marble 169 2.556 2.680 0.576 0.225 0.000 3.350 2.68 g/cm3 Skarn 318 2.864 2.940 0.345 0.121 1.717 3.717 2.94 g/cm3 Hornfels 163 2.635 2.660 0.531 0.198 0.000 3.569 2.66 g/cm3 Quartz Monzonite 134 2.579 2.596 0.108 0.042 2.070 2.714 2.59 g/cm3 Clastic Sedimentary/Tertiary Volcanics 108 2.198 2.166 0.183 0.083 1.889 2.736 2.16 g/cm3 Alluvium 0 1.8 g/cm3 11.4.2 Garnet Guardian Metal collected a total of 361 specific gravity measurements from drill core at the Garnet deposit using the water immersion method. Guardian Metal coated all samples with wax prior to testing. RESPEC reviewed the density measurements by lithology and assigned the median density value to each lithologic unit in the block model. RESPEC also used the mineralized domain to assign skarn density in areas where the skarn solid showed local discontinuities. Elevated grades correlate with the skarn horizons, and the mineralized domain provided an effective secondary control for assigning skarn density in these areas. Table 11.6 summarizes the density statistics for each lithology and the density values assigned in the model. Table 11.6: Garnet Density Statistics and Values Applied to the Different Lithologies in the Block Model Lithology Valid Mean Median Std. Dev. CV Minimum Maximum Density Assigned in Model Units Marble 235 2.663 2.667 0.185 0.070 2.071 3.358 2.66 g/cm3 Skarn 69 3.099 3.122 0.258 0.083 2.418 3.553 3.12 g/cm3 Quartz Monzonite 41 2.572 2.605 0.138 0.054 2.062 2.765 2.6 g/cm3 Felsic Sills 10 2.603 2.598 0.122 0.047 2.309 2.833 2.59 g/cm3 Diabase Sills 6 2.507 2.530 0.103 0.041 2.291 2.600 2.53 g/cm3 Alluvium 0 1.8 g/cm3 |
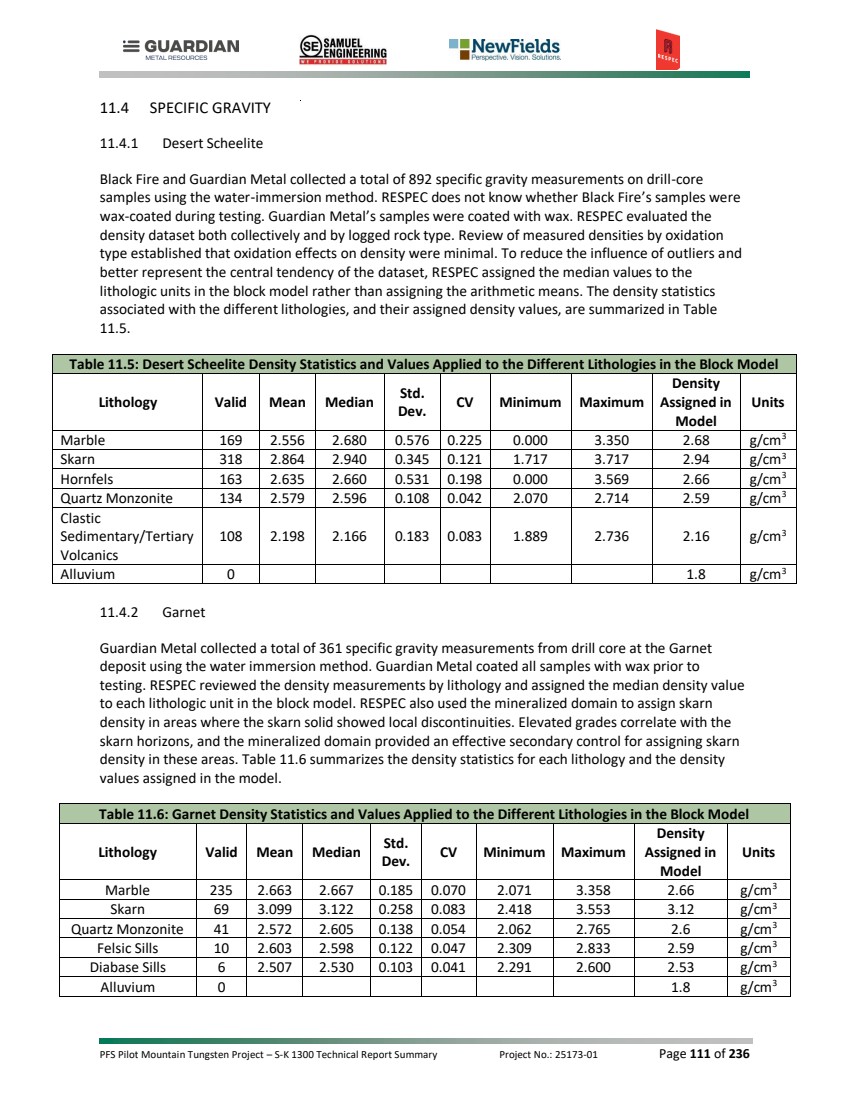
| PFS Pilot Mountain Tungsten Project – S-K 1300 Technical Report Summary Project No.: 25173-01 Page 112 of 236 11.5 ASSAY CODING, CAPPING, AND COMPOSITING 11.5.1 Desert Scheelite After defining and modeling the mineral domains, RESPEC used the resulting solids to code assay samples and evaluated assay caps for each metal by inspection of CPPs and quantile plots of the coded assays to identify potential high‑grade outliers. RESPEC determined capping thresholds for tungsten, silver, copper, and zinc, and for assays located outside the modeled mineral domains. Subsequently, RESPEC visually examined outlier grades in 3D to evaluate their materiality, local grade context, proximity to neighboring samples, and spatial position within the deposit. The final capping levels are summarized in Table 11.7. Table 11.7: Desert Scheelite Capping Levels for Tungsten, Silver, Copper, and Zinc by Domain Domain % WO3 ppm Ag % Cu % Zn Inside – 355 0.95 5.0 Outside 0.17 5.5 0.15 0.15 With capping completed, RESPEC composited the drill holes to 3m intervals that honored the domain boundaries. RESPEC chose three meters because most samples are 1.5m long. The descriptive statistics of the composite database for tungsten, silver, copper, and zinc are summarized in Table 11.8 through Table 11.11. Table 11.8: Desert Scheelite Tungsten Composite Descriptive Statistics Inside Mineralized Domain Field Valid Minimum Maximum Mean Median Std. Devn. Co. of Variation Unit Length 2,345 0.4 4.45 3.003 3 0.239 0.08 m WO3 2,259 0.001 2.64 0.202 0.140 0.223 1.104 % WO3_Cap 2,259 0.001 2.64 0.202 0.140 0.223 1.104 % LITHC 2,339 2 7 Outside Mineralized Domain Field Valid Minimum Maximum Mean Median Std. Devn. Co. of Variation Unit Length 6,030 0.6 4.41 2.993 3 0.203 0.068 m WO3 2,297 0 0.694 0.013 0.003 0.041 3.283 % WO3_Cap 2,297 0 0.17 0.010 0.003 0.022 2.087 % LITHC 6,019 1 7 Table 11.9: Desert Scheelite Silver Composite Descriptive Statistics Inside Mineralized Domain Field Valid Minimum Maximum Mean Median Std. Devn. Co. of Variation Unit Length 2,348 0.4 4.45 2.979 3 0.406 0.136 m Ag 2,059 0.25 754.811 13.758 3.291 39.263 2.854 ppm AG Cap 2,059 0.25 355 12.707 3.291 31.880 2.509 ppm LITHC 2,340 2 7 Outside Mineralized Domain Field Valid Minimum Maximum Mean Median Std. Devn. Co. of Variation Unit |
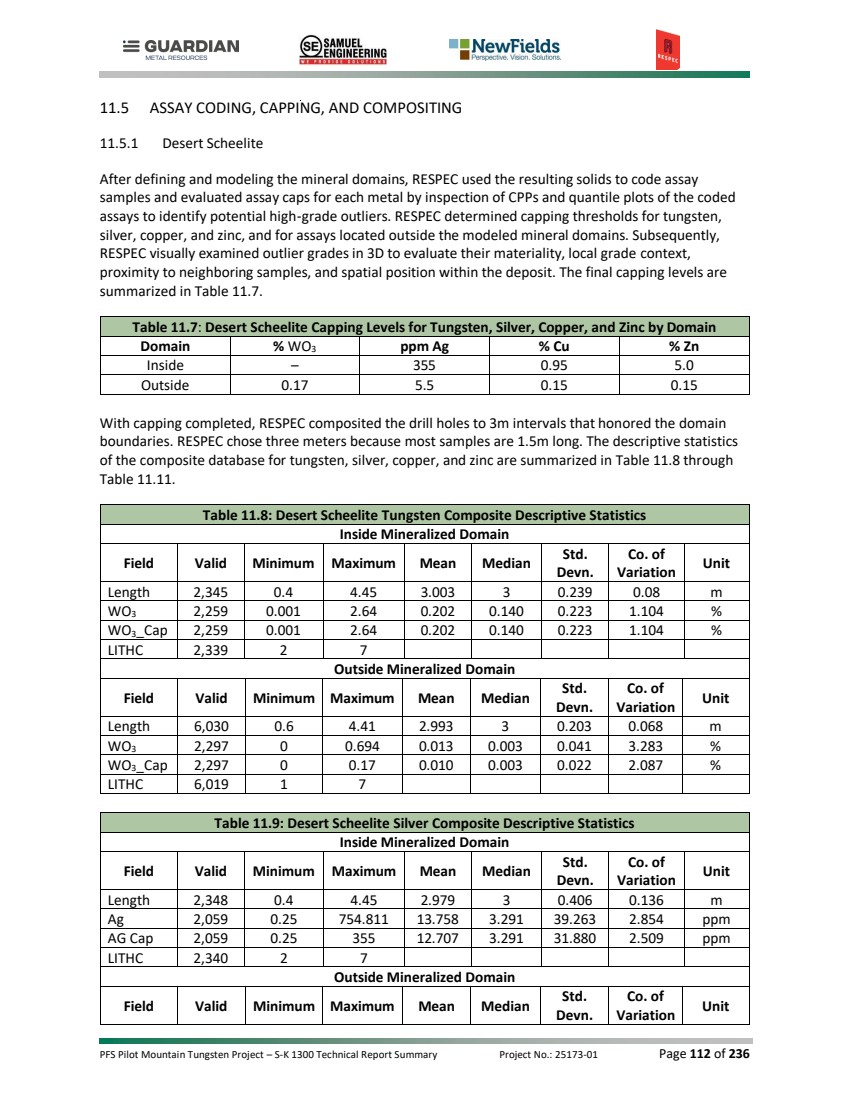
| PFS Pilot Mountain Tungsten Project – S-K 1300 Technical Report Summary Project No.: 25173-01 Page 113 of 236 Table 11.9: Desert Scheelite Silver Composite Descriptive Statistics Length 5,967 0.6 4.41 2.993 3 0.204 0.068 m Ag 2,216 0.034 100.155 1.395 0.5 4.763 3.415 ppm AG Cap 2,216 0.034 5.50 0.961 0.5 1.075 1.119 ppm LITHC 5,967 1 7 Table 11.10: Desert Scheelite Copper Composite Descriptive Statistics Inside Mineralized Domain Field Valid Minimum Maximum Mean Median Std. Devn. Co. of Variation Unit Length 2,333 0.4 4.45 3.003 3 0.237 0.079 m Cu 2,143 0 2.867 0.10 0.025 0.241 2.415 % Cu_Cap 2,143 0 0.95 0.085 0.025 0.163 1.910 % LITHC 2,327 2 7 Outside Mineralized Domain Field Valid Minimum Maximum Mean Median Std. Devn. Co. of Variation Unit Length 5,966 0.6 4.41 2.991 3 0.206 0.069 m Cu 3,252 0 1.49 0.017 0.009 0.054 3.097 % Cu_Cap 3,252 0 0.15 0.015 0.009 0.019 1.332 % LITHC 5,955 1 7 Table 11.11: Desert Scheelite Zinc Composite Descriptive Statistics Inside Mineralized Domain Field Valid Minimum Maximum Mean Median Std. Devn. Co. of Variation Unit Length 2,329 0.4 4.45 3.003 3 0.240 0.080 m Zn 1,867 0.001 17.9 0.394 0.09 1.012 2.567 % Zn_Cap 1,867 0.001 5 0.358 0.09 0.724 2.024 % LITHC 2,323 2 7 Outside Mineralized Domain Field Valid Minimum Maximum Mean Median Std. Devn. Co. of Variation Unit Length 5,967 0.6 4.41 2.993 3 0.204 0.068 m Zn 2,188 0 4.9 0.022 0.007 0.121 5.633 % Zn_Cap 2,188 0 0.15 0.023 0.007 0.023 1.474 % LITHC 5,956 1 7 11.5.2 Garnet After defining and modeling the mineral domains, RESPEC used the resulting solids to code the assay samples. Capping thresholds for tungsten, silver, copper, and zinc were evaluated using cumulative probability plots of the coded assays to identify potential high‑grade outliers. Separate thresholds were established for samples inside the mineralized domain and for samples outside the domain. Outlier grades were then reviewed in three dimensions to assess their materiality, local grade context, proximity to neighboring samples, and spatial position within the deposit. The final capping levels are summarized in Table 11.12. |
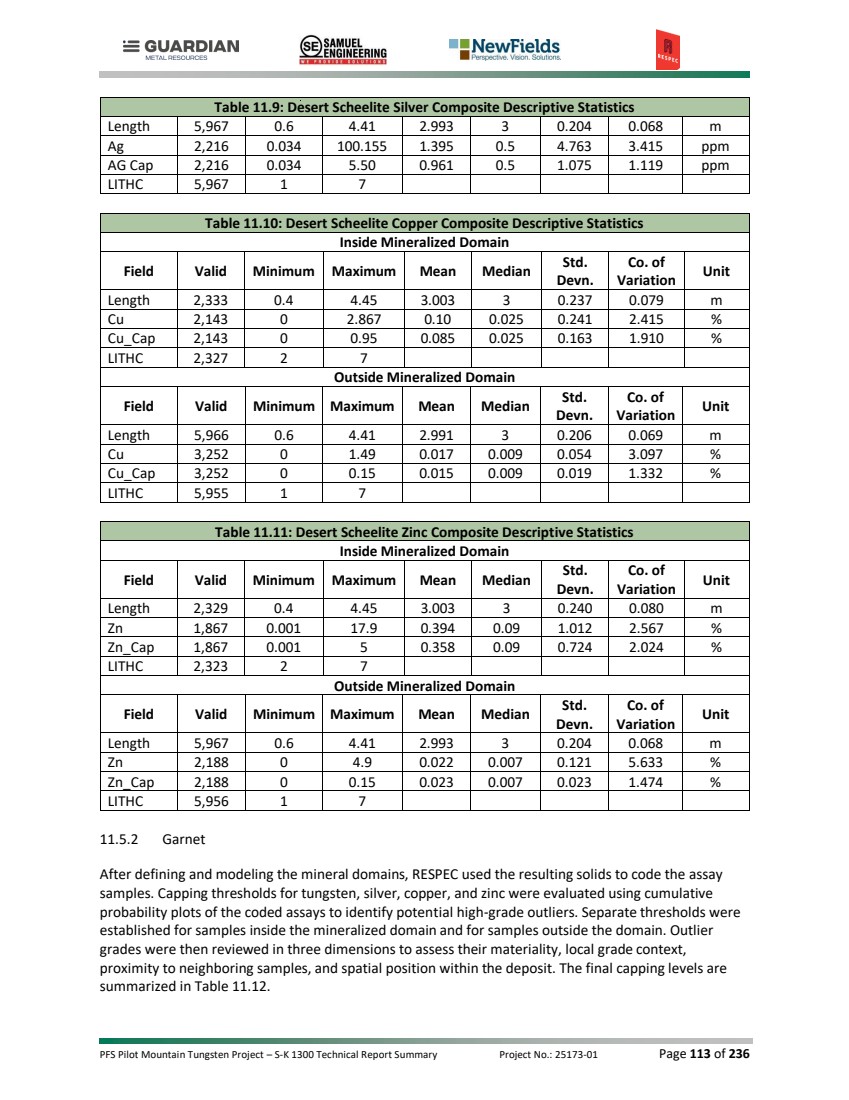
| PFS Pilot Mountain Tungsten Project – S-K 1300 Technical Report Summary Project No.: 25173-01 Page 114 of 236 Table 11.12: Garnet Capping Levels for Tungsten, Silver, Copper, and Zinc by Domain Domain % WO3 ppm Ag % Cu % Zn Inside – 125 – – Outside 0.07 22 – 0.22 With capping complete, drill holes were composited to three‑meter intervals that honored the domain boundaries. A three‑meter length was selected because most samples are 1.5 meters long. Composite statistics for tungsten, silver, copper, and zinc are presented in Table 11.13 through Table 11.16. Table 11.13: Garnet Tungsten Composite Descriptive Statistics Inside Mineralized Domain Field Valid Minimum Maximum Mean Median Std. Devn. Co. of Variation Unit Length 435 0.67 4.47 2.858 3 0.658 0.231 m WO3 435 0.003 1.50 0.149 0.106 0.146 0.979 % WO3_Cap 435 0.003 1.50 0.149 0.106 0.146 0.979 % LITHC 435 2 6 Outside Mineralized Domain Field Valid Minimum Maximum Mean Median Std. Devn. Co. of Variation Unit Length 1,643 1.43 4.49 2.978 3 0.345 0.116 m WO3 1,321 0.0003 0.406 0.005 0.001 0.020 4.106 % WO3_Cap 1,321 0.0003 0.07 0.003 0.001 0.006 1.994 % LITHC 1,643 2 6 Table 11.14: Garnet Silver Composite Descriptive Statistics Inside Mineralized Domain Field Valid Minimum Maximum Mean Median Std. Devn. Co. of Variation Unit Length 300 0.56 4.48 2.789 3 0.783 0.281 m Ag 300 0.218 99.575 7.451 2.177 13.046 1.751 ppm AG Cap 300 0.218 79.212 7.157 2.177 11.878 1.659 ppm LITHC 300 2 6 Outside Mineralized Domain Field Valid Minimum Maximum Mean Median Std. Devn. Co. of Variation Unit Length 1,776 0.99 4.49 2.981 3 0.324 0.109 m Ag 1,450 0.062 25.47 0.577 0.25 1.246 2.161 ppm AG Cap 1,450 0.062 13.60 0.551 0.25 0.933 1.693 ppm LITHC 1,776 2 6 Table 11.15: Garnet Copper Composite Descriptive Statistics Inside Mineralized Domain Field Valid Minimum Maximum Mean Median Std. Devn. Co. of Variation Unit Length 300 0.56 4.48 2.789 3 0.784 0.281 m Cu 300 0.0002 0.236 0.006 0.003 0.020 3.169 % Cu_Cap 300 0.0002 0.236 0.006 0.003 0.020 3.169 % |
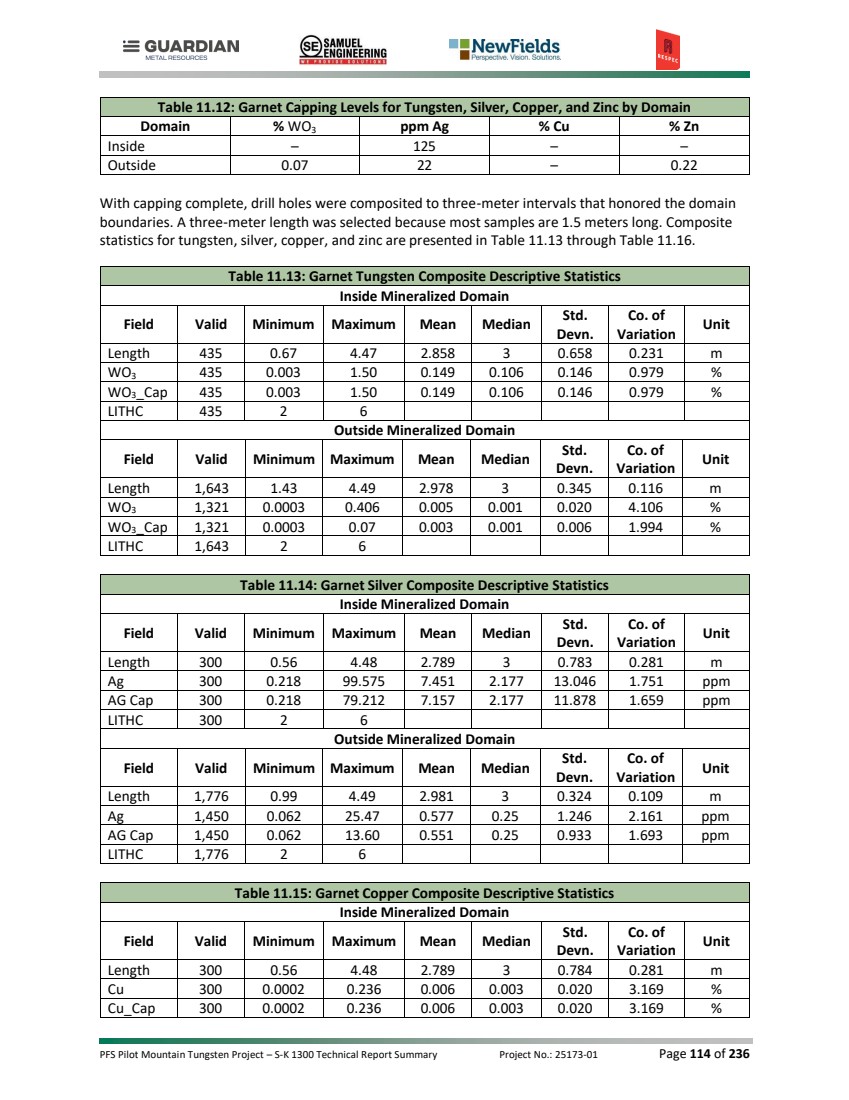
| PFS Pilot Mountain Tungsten Project – S-K 1300 Technical Report Summary Project No.: 25173-01 Page 115 of 236 Table 11.15: Garnet Copper Composite Descriptive Statistics LITHC 300 2 6 Outside Mineralized Domain Field Valid Minimum Maximum Mean Median Std. Devn. Co. of Variation Unit Length 1,776 0.99 4.49 2.981 3 0.325 0.109 m Cu 1,450 0.00005 0.1587 0.0032 0.0025 0.005 1.543 % Cu_Cap 1,450 0.00005 0.1587 0.0032 0.0025 0.005 1.543 % LITHC 1,776 2 6 Table 11.16: Garnet Zinc Composite Descriptive Statistics Inside Mineralized Domain Field Valid Minimum Maximum Mean Median Std. Devn. Co. of Variation Unit Length 300 0.56 4.48 2.789 3 0.784 0.281 m Zn 300 0.007 4.482 0.506 0.180 0.717 1.417 % Zn_Cap 300 0.007 4.482 0.506 0.180 0.717 1.417 % LITHC 300 2 6 Outside Mineralized Domain Field Valid Minimum Maximum Mean Median Std. Devn. Co. of Variation Unit Length 1,776 0.99 4.49 2.981 3 0.325 0.109 m Zn 1,450 0.001 1.005 0.028 0.010 0.074 2.653 % Zn_Cap 1,450 0.001 0.220 0.021 0.010 0.030 1.422 % LITHC 5,555 2 6 11.6 VARIOGRAPHY 11.6.1 Desert Scheelite RESPEC conducted a variography study to evaluate grade continuity within the Desert Scheelite deposit. To assess spatial correlation and directional continuity of grades across the modeled domains, RESPEC generated traditional and pair‑wise variograms for tungsten, silver, copper, and zinc. The results informed the selection of estimation parameters for search ranges and anisotropy, ensuring that the resource model appropriately reflects the grade continuity and geological controls on mineralization. Table 11.17 summarizes the variography study by metal domain. Table 11.17: Desert Scheelite Variography by Metal Domain Domain Direction Nugget First Sill Range (m) Second Sill Range (m) WO3 major 0.3 0.52 38 0.18 100 semimajor 17 40 minor 18 25 Ag major 0.25 0.5 10 0.25 40 semimajor 6.5 20 minor 7.5 14 Cu major 0.3 0.35 21 0.35 45 semimajor 14.5 35 minor 7.5 17 |
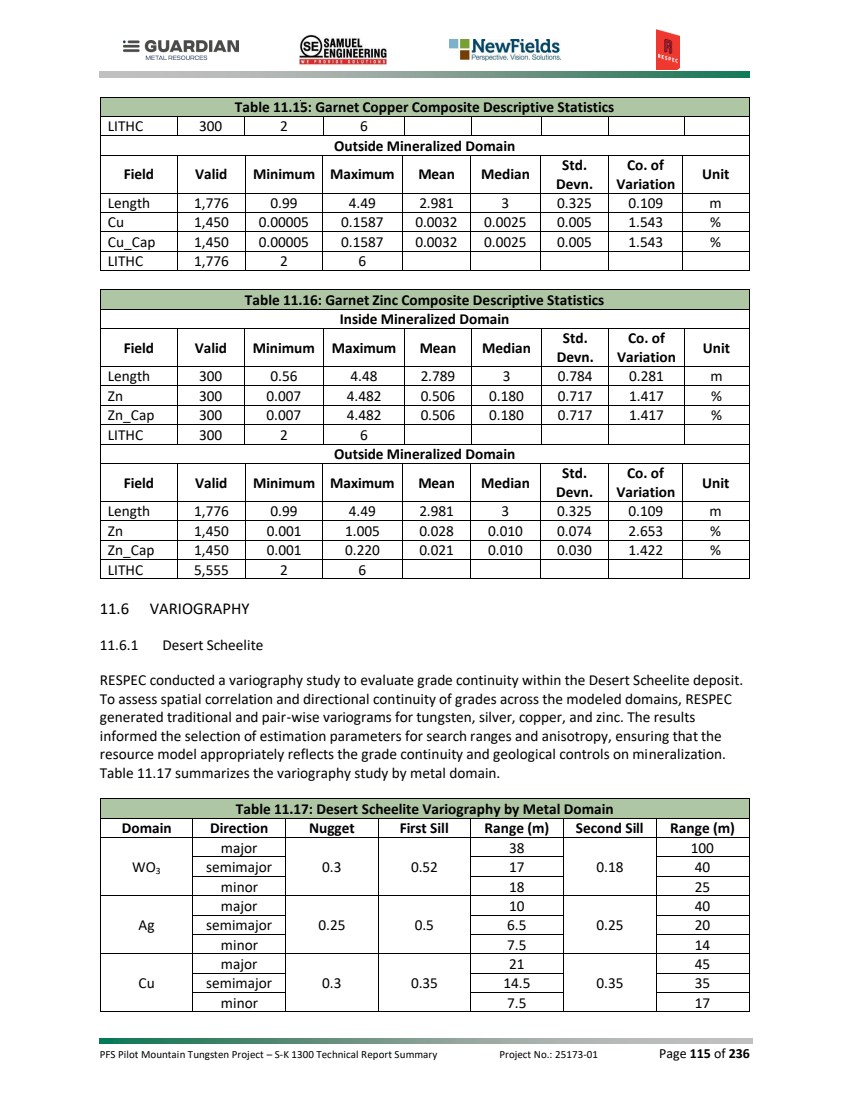
| PFS Pilot Mountain Tungsten Project – S-K 1300 Technical Report Summary Project No.: 25173-01 Page 116 of 236 Table 11.17: Desert Scheelite Variography by Metal Domain Domain Direction Nugget First Sill Range (m) Second Sill Range (m) Zn major 0.2 0.65 24.5 0.15 70 semimajor 11 40 minor 12 34 11.6.2 GARNET RESPEC conducted variography to evaluate grade continuity within the Garnet deposit. Traditional standardized experimental variograms were generated for tungsten, silver, copper, and zinc. The tungsten variograms provided the most stable structures and clearest definition of spatial continuity within the modeled domains. To support a more localized estimation strategy, RESPEC applied slightly shorter ranges from the tungsten variograms when establishing the search parameters. The other metals display similar spatial patterns and are supported by fewer samples, so RESPEC adopted the tungsten variogram orientations and anisotropy for all metals while adjusting search ranges as appropriate. Table 11.18 summarizes the variography results by metal domain for each estimation area. Table 11.18: Garnet Variography by Metal Domain and Estimation Area ESTAR Domain Direction Nugget First Sill Range (m) Second Sill Range (m) 1 WO3 major 0.2 0.3 40 0.5 60 semimajor 30 60 minor 10 30 1 Ag, Cu, Zn major 0.2 0.3 50 0.5 80 semimajor 40 80 minor 10 40 2 WO3 major 0.3 0.25 20 0.45 35 semimajor 15 35 minor 10 15 2 Ag, Cu, Zn major 0.3 0.25 25 0.45 45 semimajor 20 45 minor 10 20 3 WO3 major 0.3 0.7 60 − − semimajor 45 − minor 10 − 3 Ag, Cu, Zn major 0.3 0.7 80 − − semimajor 60 − minor 10 − 4 WO3 major 0.3 0.7 55 − − semimajor 35 − minor 10 − 4 Ag, Cu, Zn major 0.3 0.7 70 − − semimajor 45 − minor 10 − |
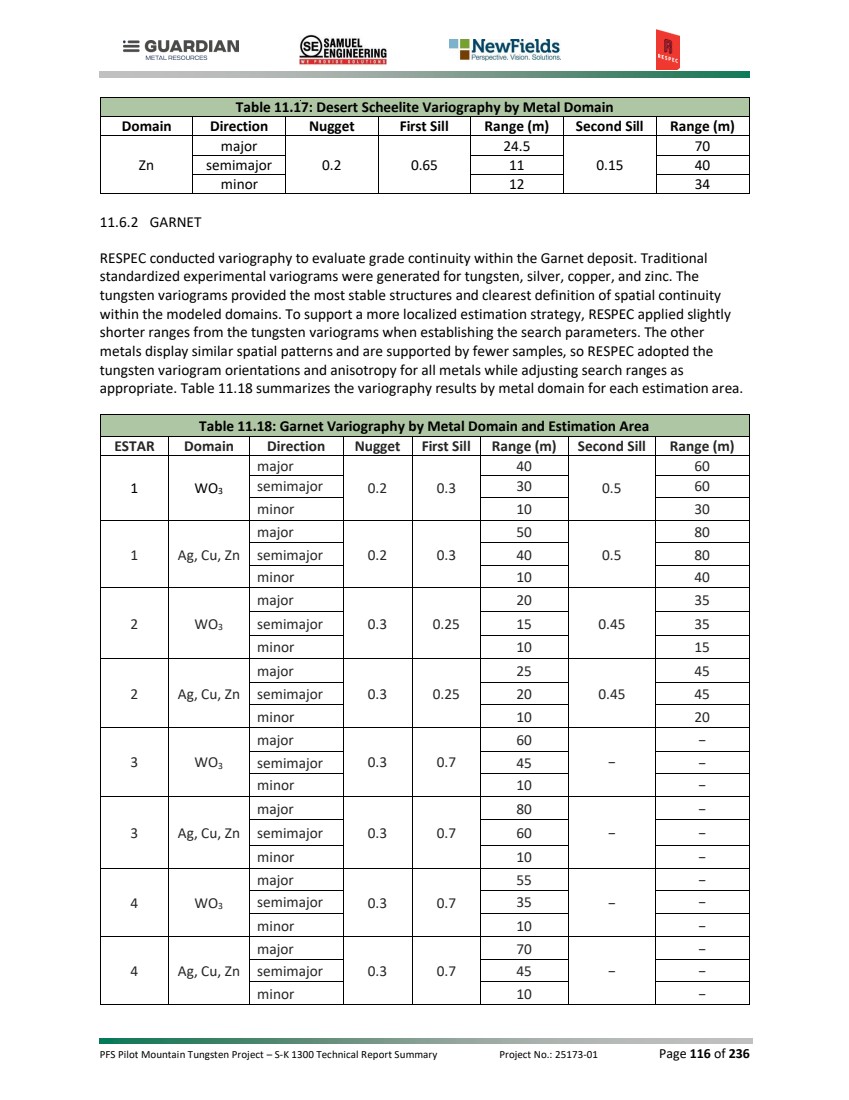
| PFS Pilot Mountain Tungsten Project – S-K 1300 Technical Report Summary Project No.: 25173-01 Page 117 of 236 11.7 BLOCK MODEL CODING 11.7.1 Desert Scheelite RESPEC created a three-dimensional block model comprised of 5m x 2.5m x 5m blocks (model x, y, z). The block model is not rotated with a bearing of 0°. RESPEC chose the block size in consideration of the open pit mining scenario that would be the likely mining method for the Desert Scheelite deposit and used mineral domain solids to code partial volume percentages of the low-grade tungsten domains into blocks in the respective tungsten, silver, copper, and zinc models. The block models were also coded using the digital topographic surface and geology and oxidation solids. RESPEC assigned the bulk density values to each block in the model based on lithology codes given in Table 11.5. (The bulk density values are discussed in Section 11.4.1) The Desert Scheelite deposit is controlled sub‑vertically by lithologic contacts. The orientation of mineralization conforms to the irregular contact of the quartz monzonite intrusion. To properly represent this changing orientation, RESPEC applied MinePlan’s Dynamic Unfolding tool, which transforms sample coordinates into an unfolded reference frame aligned with the local geological controls. Once variograms and estimation parameters are established in the unfolded space, the results are transformed back into the original geometry to ensure that the resource model appropriately reflects the sub‑vertical controls and the curvilinear orientation of mineralization around the intrusion. As a result, a single search ellipse orientation was applied to each metal in the estimation, with local anisotropy accounted for through the unfolding process. The search ellipse orientations are summarized in Table 11.19. Table 11.19: Desert Scheelite Search Ellipse Orientations Domain Azimuth Dip Plunge WO3 256 -70 10 Ag 256 -77 10 Cu 256 -70 10 Zn 256 -80 10 11.7.2 GARNET RESPEC created a three‑dimensional block model for the Garnet deposit using 5m × 5m × 2.5m blocks (model x, y, z). The block model is not rotated and uses a bearing of 0°. RESPEC selected the block size to align with the anticipated open‑pit mining method and used the mineralized domain to code partial volume percentages into the tungsten, silver, copper, and zinc models. The block model was also coded using the digital topographic surface and the geology and oxidation solids. RESPEC assigned bulk density values to each block based on the lithology codes summarized in Table 11.6. The density methodology for Garnet is discussed in Section 11.4.2. The Garnet deposit is controlled by multiple sub‑horizontal skarn beds formed where limestone and marble were metasomatized to skarn. These beds are offset locally by faults, creating fault‑bounded blocks that define distinct structural domains within the deposit. To properly represent these changes in orientation, RESPEC defined estimation areas using the mapped fault boundaries. Variograms and estimation parameters were established separately for each estimation area, and a corresponding search ellipse was applied to each metal within each area. This approach ensured that the resource |
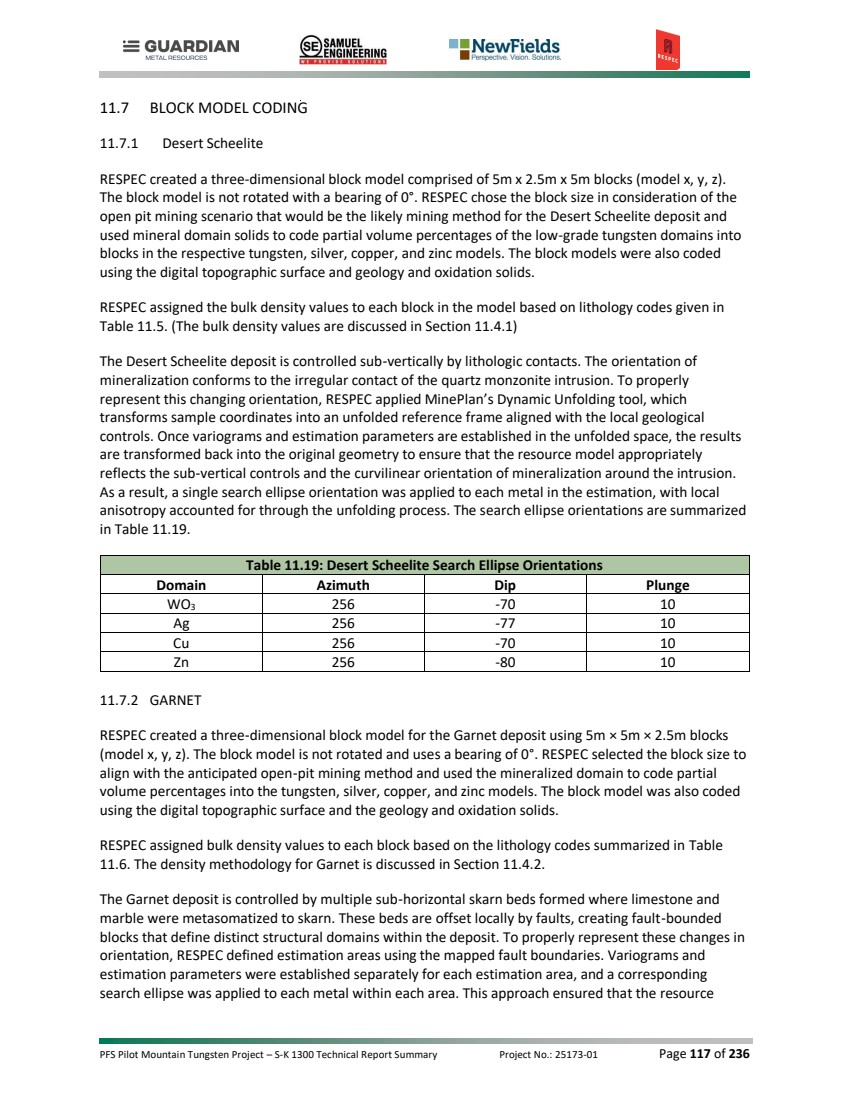
| PFS Pilot Mountain Tungsten Project – S-K 1300 Technical Report Summary Project No.: 25173-01 Page 118 of 236 model reflects the sub‑horizontal stratigraphy, local fault offsets, and the geometry of skarn mineralization. The search ellipse orientations are summarized in Table 11.20. Table 11.20: Garnet Search Ellipse Orientations ESTAR Azimuth Dip Plunge 1 65 0 -10 2 65 10 10 3 50 -5 -20 4 35 0 -15 11.8 GRADE INTERPOLATION 11.8.1 Desert Scheelite RESPEC completed three estimation methods—ordinary kriging (“OK”), inverse distance squared (“ID2”), and nearest neighbor (“NN”)—and selected the kriged estimate as the reported mineral resource estimate. RESPEC used the ID2 and NN estimates as a check on the kriged interpolation. RESPEC performed estimation runs for each metal independently, using only the composites coded to a given low-grade domain or outside modeled domains to estimate grades into respective blocks. For each metal, RESPEC ran two successive passes: an initial long pass projecting 260 m along the primary axes to populate all blocks, followed by a shorter pass. To limit excessive projection of unmodeled higher-grade mineralization, as determined on CPPs for each domain, RESPEC applied strong search range restrictions to the higher‑grade samples. These range restrictions were applied in the long pass for WO₃ and in all passes for silver, copper, and zinc. Strong anisotropic weighting was also applied to confine the estimation of various grade populations within the low-grade domains to narrow zones. The estimation parameters applied to tungsten, silver, copper, and zinc are summarized in Table 11.21. Table 11.21: Desert Scheelite Estimation Parameters Desert Scheelite Description Parameter Long Pass Short Pass WO3 Domain Samples: minimum | maximum | maximum per hole 1 | 9 | 3 1 | 9 | 3 Search anisotropies (m): major | semimajor | minor (vertical) 1 | 0.3 | 0.1 1 | 0.4 | 0.2 Maximum search distance (m) 260 100 High-grade restrictions (grade in % WO3, distance in m) 0.5 | 100 - Outside WO3 Domain Samples: minimum | maximum | maximum per hole 1 | 9 | 3 - Search anisotropies (m): major | semimajor | minor (vertical) 1 | 1 | 0.4 - Maximum search distance (m) 65 - High-grade restrictions (grade in % WO3, distance in m) 0.02 | 10 - Ag Domain Samples: minimum | maximum | maximum per hole 1 | 9 | 3 1 | 9 | 3 Search anisotropies (m): major | semimajor | minor (vertical) 1 | 0.3 | 0.07 1 | 0.5 | 0.5 Maximum search distance (m) 260 40 |
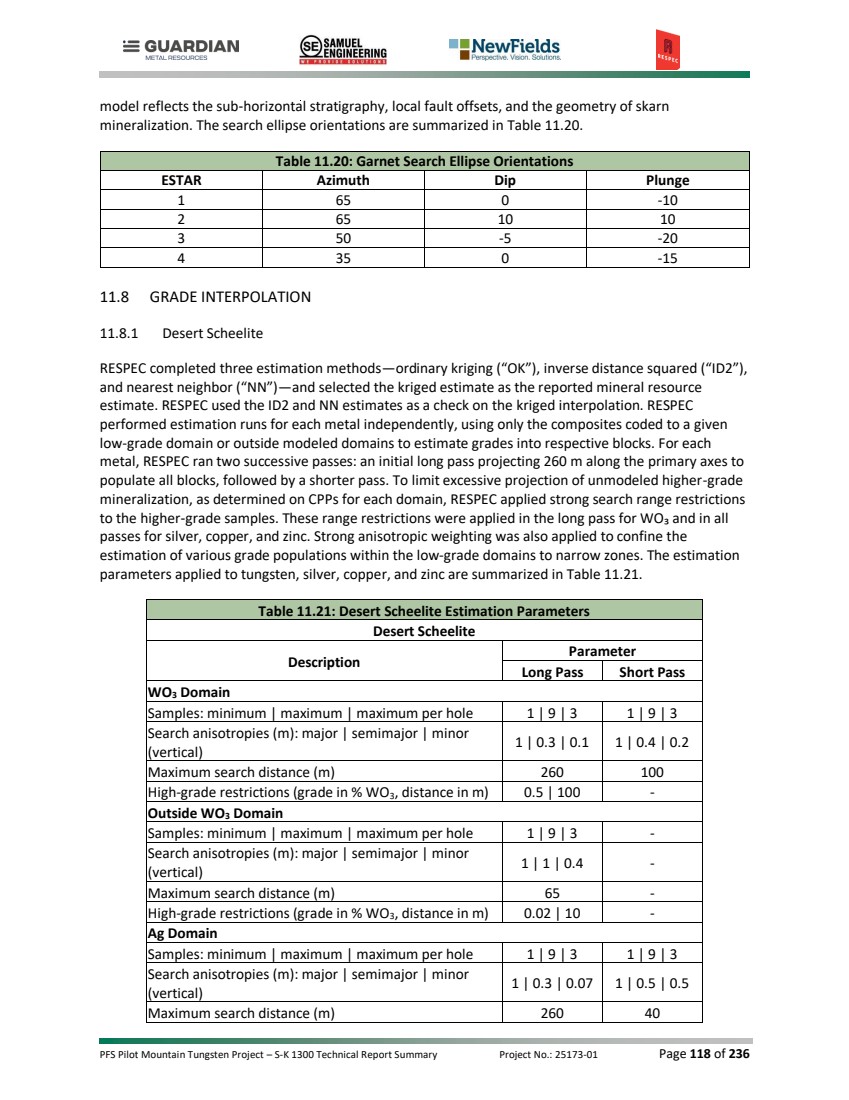
| PFS Pilot Mountain Tungsten Project – S-K 1300 Technical Report Summary Project No.: 25173-01 Page 119 of 236 Table 11.21: Desert Scheelite Estimation Parameters Desert Scheelite Description Parameter Long Pass Short Pass High-grade restrictions (grade in ppm Ag, distance in m) 15 | 40 15 | 40 Outside Ag Domain Samples: minimum | maximum | maximum per hole 1 | 9 | 3 - Search anisotropies (m): major | semimajor | minor (vertical) 1 | 1 | 0.4 - Maximum search distance (m) 65 - High-grade restrictions (grade in ppm Ag, distance in m) 5.5 | 10 - Cu Domain Samples: minimum/maximum/maximum per hole 1 | 9 | 3 1 | 9 | 3 Search anisotropies (m): major/semimajor/minor (vertical) 1 | 0.3 | 0.07 1 | 0.8 | 0.4 Maximum search distance (m) 260 45 High-grade restrictions (grade in % Cu, distance in m) 0.15 | 45 0.15 | 45 Outside Cu Domain Samples: minimum/maximum/maximum per hole 1 | 9 | 3 - Search anisotropies (m): major/semimajor/minor (vertical) 1 | 1 | 0.4 - Maximum search distance (m) 65 - High-grade restrictions (grade in % Cu, distance in m) 0.1 | 10 - 11.8.2 Garnet RESPEC completed OK, ID2, and NN estimation methods and selected the kriged estimate as the reported mineral resource estimate. The ID2 and NN estimates were used as checks on the kriged interpolation. Estimation was completed separately for each metal, using only the composites coded to the Garnet mineralized domain or to the outside‑domain category, as appropriate. Interpolation was performed independently within each estimation area, with variograms and search parameters assigned to each area. For tungsten, RESPEC applied a two‑pass strategy, consisting of an initial long pass to populate all blocks within an estimation area, followed by a shorter pass to refine local grade continuity. For silver, copper, and zinc, RESPEC applied a single‑pass interpolation within each estimation area, consistent with the spatial continuity and sample support for those metals. The estimation parameters applied to tungsten, silver, copper, and zinc are summarized in Table 11.22 and Table 11.23. |
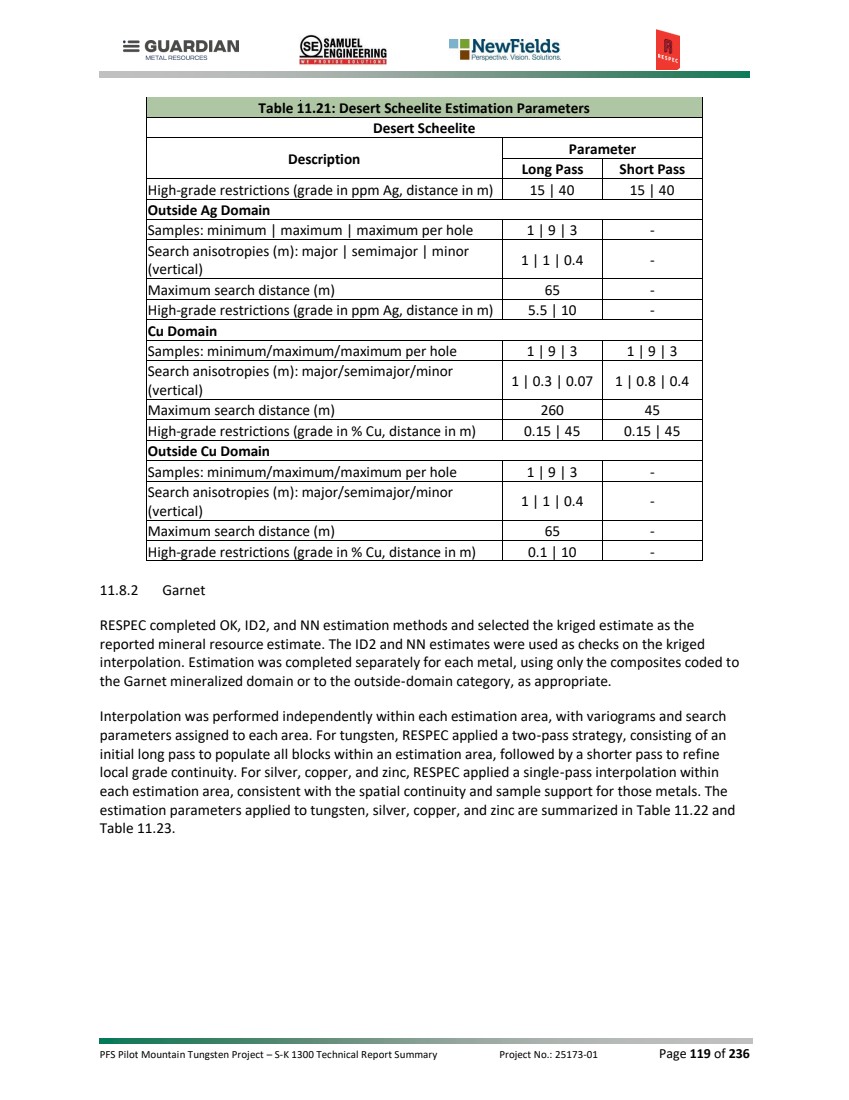
| PFS Pilot Mountain Tungsten Project – S-K 1300 Technical Report Summary Project No.: 25173-01 Page 120 of 236 Table 11.22: Garnet Tungsten Estimation Parameters Garnet Description Estimation Area 1 Estimation Area 2 Estimation Area 3 Estimation Area 4 Parameter Parameter Parameter Parameter Long Pass Short Pass Long Pass Short Pass Long Pass Short Pass Long Pass Short Pass WO3 Domain Samples: minimum | maximum | maximum per hole 1 | 9 | 3 1 | 9 | 3 1 | 9 | 3 1 | 9 | 3 1 | 9 | 3 1 | 9 | 3 1 | 9 | 3 1 | 9 | 3 Search anisotropies (m): major | semimajor | minor (vertical) 1 | 1 | 0.3 1 | 1 | 0.3 1 | 1 | 0.125 1 | 1 | 0.3 1 | 1 | 0.3 1 | 0.7 | 0.3 1 | 1 | 0.35 1 | 0.66 | 0.33 Maximum search distance (m) 80 50 200 30 80 50 70 45 High-grade restrictions (grade in % WO3, distance in m) 0.44 | 25 0.44 | 25 0.44 | 25 0.44 | 25 0.44 | 25 0.44 | 25 0.44 | 25 0.44 | 25 Outside WO3 Domain Samples: minimum | maximum | maximum per hole - 1 | 9 | 3 1 | 9 | 3 1 | 9 | 3 - 1 | 9 | 3 - 1 | 9 | 3 Search anisotropies (m): major | semimajor | minor (vertical) - 1 | 1 | 0.3 1 | 1 | 0.3 1 | 1 | 0.3 - 1 | 1 | 0.3 - 1 | 1 | 0.3 Maximum search distance (m) - 65 150 65 - 65 - 65 High-grade restrictions (grade in % WO3, distance in m) - 0.03 | 10 0.03 | 10 0.03 | 10 - 0.03 | 10 - 0.03 | 10 |
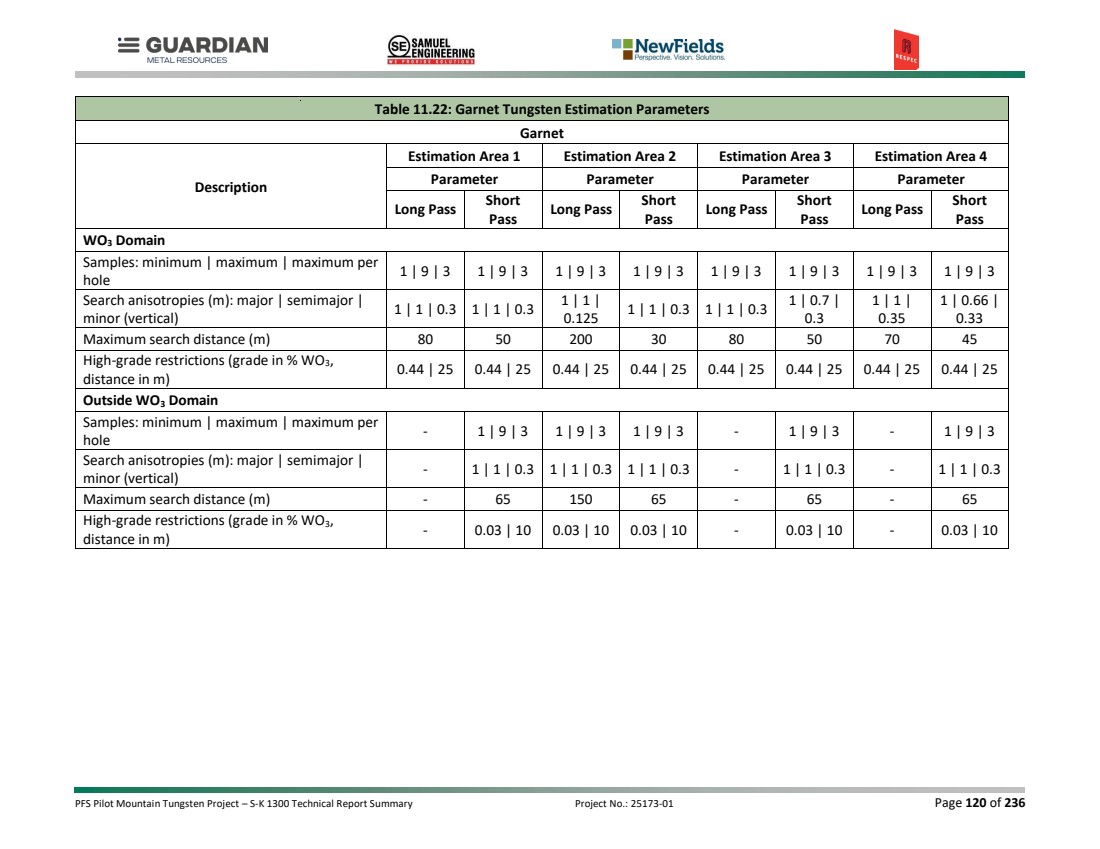
| PFS Pilot Mountain Tungsten Project – S-K 1300 Technical Report Summary Project No.: 25173-01 Page 121 of 236 Table 11.23: Garnet Silver, Copper, and Zinc Estimation Parameters Garnet Description ESTAR 1 ESTAR 2 ESTAR 3 ESTAR 4 Parameter Parameter Parameter Parameter Single Pass Single Pass Single Pass Single Pass Ag Domain Samples: minimum | maximum | maximum per hole 1 | 9 | 3 1 | 9 | 3 1 | 9 | 3 1 | 9 | 3 Search anisotropies (m): major | semimajor | minor (vertical) 1 | 1 | 0.25 1 | 1 | 0.4 1 | 0.75 | 0.25 1 | 0.65 | 0.3 Maximum search distance (m) 80 50 80 70 High-grade restrictions (grade in ppm Ag, distance in m) 31.5 | 40 31.5 | 40 31.5 | 40 31.5 | 40 Outside Ag Domain Samples: minimum | maximum | maximum per hole 1 | 9 | 3 1 | 9 | 3 1 | 9 | 3 1 | 9 | 3 Search anisotropies (m): major | semimajor | minor (vertical) 1 | 1 | 0.3 1 | 1 | 0.3 1 | 1 | 0.3 1 | 1 | 0.3 Maximum search distance (m) 65 65 65 65 High-grade restrictions (grade in ppm Ag, distance in m) 3.5 | 10 3.5 | 10 3.5 | 10 3.5 | 10 Cu Domain Samples: minimum/maximum/maximum per hole 1 | 9 | 3 1 | 9 | 3 1 | 9 | 3 1 | 9 | 3 Search anisotropies (m): major/semimajor/minor (vertical) 1 | 1 | 0.25 1 | 1 | 0.4 1 | 0.75 | 0.25 1 | 0.65 | 0.3 Maximum search distance (m) 80 50 80 70 High-grade restrictions (grade in % Cu, distance in m) 0.25 | 40 0.25 | 40 0.25 | 40 0.25 | 40 Outside Cu Domain Samples: minimum/maximum/maximum per hole 1 | 9 | 3 1 | 9 | 3 1 | 9 | 3 1 | 9 | 3 Search anisotropies (m): major/semimajor/minor (vertical) 1 | 1 | 0.3 1 | 1 | 0.3 1 | 1 | 0.3 1 | 1 | 0.3 Maximum search distance (m) 65 65 65 65 High-grade restrictions (grade in % Cu, distance in m) 0.17 | 10 0.17 | 10 0.17 | 10 0.17 | 10 Zn Domain Samples: minimum/maximum/maximum per hole 1 | 9 | 3 1 | 9 | 3 1 | 9 | 3 1 | 9 | 3 Search anisotropies (m): major/semimajor/minor (vertical) 1 | 1 | 0.25 1 | 1 | 0.4 1 | 0.75 | 0.25 1 | 0.65 | 0.3 Maximum search distance (m) 80 50 80 70 High-grade restrictions (grade in % Zn, distance in m) 2.1 | 40 2.1 | 40 2.1 | 40 2.1 | 40 Outside Zn Domain |
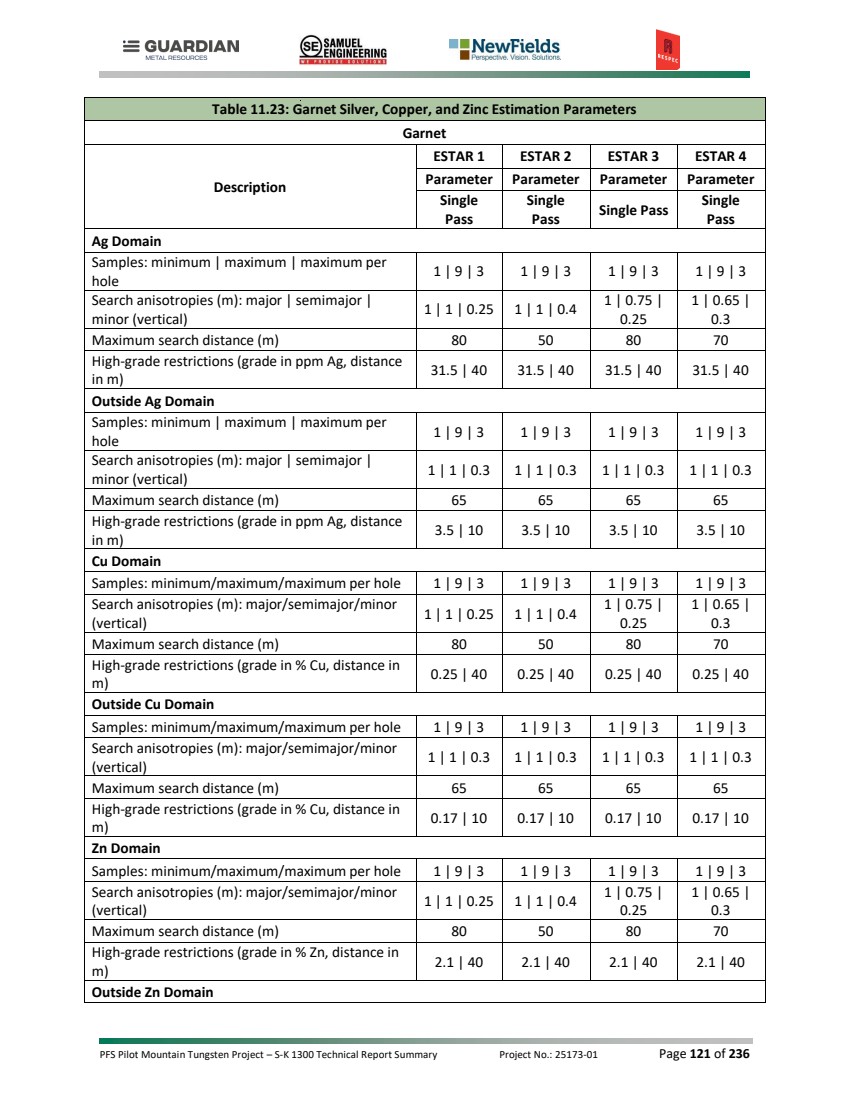
| PFS Pilot Mountain Tungsten Project – S-K 1300 Technical Report Summary Project No.: 25173-01 Page 122 of 236 Table 11.23: Garnet Silver, Copper, and Zinc Estimation Parameters Garnet Description ESTAR 1 ESTAR 2 ESTAR 3 ESTAR 4 Parameter Parameter Parameter Parameter Single Pass Single Pass Single Pass Single Pass Samples: minimum/maximum/maximum per hole 1 | 9 | 3 1 | 9 | 3 1 | 9 | 3 1 | 9 | 3 Search anisotropies (m): major/semimajor/minor (vertical) 1 | 1 | 0.3 1 | 1 | 0.3 1 | 1 | 0.3 1 | 1 | 0.3 Maximum search distance (m) 65 65 65 65 High-grade restrictions (grade in % Zn, distance in m) 0.22 | 10 0.22 | 10 0.22 | 10 0.22 | 10 11.9 CLASSIFICATION 11.9.1 Desert Scheelite RESPEC has classified the Desert Scheelite mineral resources as indicated and inferred based primarily on drilling density and proximity to Guardian Metal’s drilling. Other factors, such as the verification status of the drill-hole database and geologic understanding of the deposit and mineralization were considered. To incorporate these parameters, RESPEC constructed a solid around areas of denser drilling in which most of the Guardian Metal’s drilling is located. Regions with lower drill density, and those more reliant on historical data, were classified as inferred. This approach ensures that the reported resource reflects the greater confidence in the Guardian Metal drill-hole dataset and the lesser confidence in areas predominantly defined by historical sampling. Uncertainties in the resource estimate primarily relate to the quality and reliability of historical data. These include the analytical methodologies employed by historical operators, which may not meet current industry standards, and the selective sampling evident in certain historical drill holes, which introduces potential bias in grade representation. The adequacy of drill-hole spacing, particularly along the downdip extent of the deposit where data density is lower, is considered in resource classification. While the modern drilling completed by Guardian Metal provides a verified dataset that supports indicated classification in areas of higher density drilling, regions more reliant on historical information have been classified as inferred to reflect reduced confidence. Although the historical data cannot be fully verified, RESPEC made efforts to assess its reliability and alignment with Guardian Metal’s drilling. RESPEC reviewed grade population statistics and completed a comparative test interpolation using historical‑only data versus Guardian Metal‑only data. As discussed in Section 9.2.3.2, the analysis indicated that the historical-only dataset returned WO₃ grades approximately 17% higher than the Guardian Metal-only dataset, possibly due to excessive estimated volume of higher grades resulting from the predominance of vertical drilling of steeply-dipping mineralization. Although the difference is relatively high, the comparison demonstrated that the historical dataset is broadly consistent with Guardian Metal’s results, supporting use of the historical data. To reflect the reduced confidence associated with historical analytical methodologies, selective sampling, and the possible excessive volume of higher estimated grades, RESPEC has classified resources informed primarily by historical holes (i.e. outside the indicated solid that delineates the bulk of Guardian Metal drilling) as inferred. RESPEC acknowledges there is some risk associated with potential |
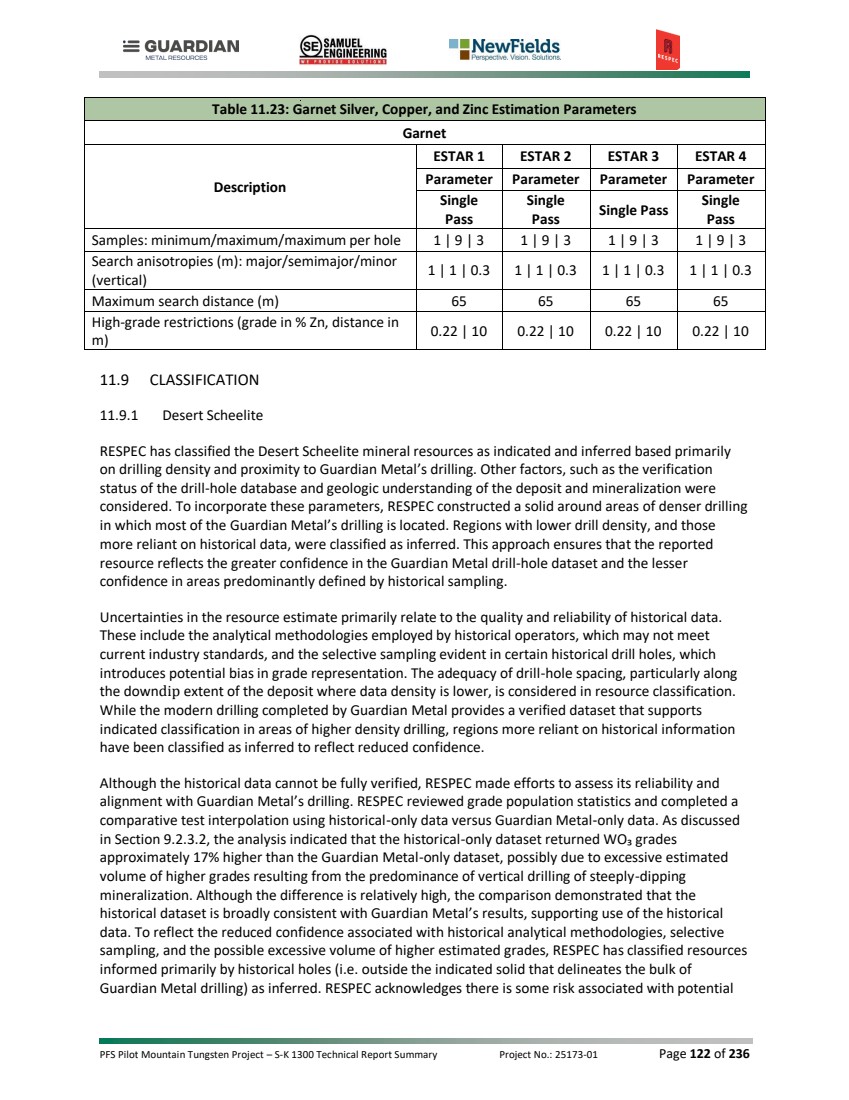
| PFS Pilot Mountain Tungsten Project – S-K 1300 Technical Report Summary Project No.: 25173-01 Page 123 of 236 overstated volume of estimated higher-grade material proximal to historical drill holes within the indicated classification solid. 11.9.2 Garnet RESPEC has classified the Garnet mineral resources as indicated and inferred based primarily on drill‑hole spacing within the Thor and Guardian Metal datasets. Other considerations included the verification status of the drill‑hole database and the geologic understanding of the skarn horizons. Classification was assigned directly from the spatial distribution and density of modern drilling. Areas with tight drill spacing, dominated by Guardian Metal drilling, were classified as indicated, while areas with wider spacing were classified as inferred. Uncertainties in the resource estimate relate mainly to drill‑hole spacing in areas where data density decreases along the lateral extents of the skarn beds. The modern drilling completed by Guardian Metal provides a verified dataset that supports indicated classification where spacing is sufficiently close. Blocks were classified as inferred where they exceeded thresholds for closest distance to sample, average distance to sample, or where the available sample support did not meet the criteria required for indicated classification. The Garnet estimate is based entirely on Thor and Guardian Metal drilling, which provides complete and internally consistent coverage of the deposit. As a result, indicated classification is supported where drill spacing and sample support justify higher confidence, and inferred classification is applied where spacing or sample availability falls below those thresholds. 11.10 MINERAL RESOURCES 11.10.1 Desert Scheelite RESPEC estimated the Desert Scheelite mineral resources to reflect potential open-pit extraction and processing by standard milling techniques. To meet the requirement of the resources having reasonable prospects for eventual economic extraction, a series of pits were optimized assuming open pit mining and processing costs typical for mining in Nevada (Table 11.24). RESPEC and Guardian Metal relied on the five-year average ammonium para-tungstate price forecast published by Argus. In selecting the price assumption used for pit optimization, Guardian Metal applied a discount to that independent forecast. Guardian Metal determined that the five-year forward forecast was more representative of current and expected market conditions than historical pricing and applied the discount to reflect market volatility and the uncertainty inherent in forward-looking price projections. The resulting price assumption represents approximately 50% of the February 2026 spot price and was selected by Guardian Metal to provide a conservative basis for the analysis. RESPEC reviewed and accepted the pricing forecast and payability for concentrate, which is based on the payability assessment included in the Argus forecast, for reliance. Table 11.24: Pit Optimization Parameters Item Value Unit Mining cost 3.50 $/tonne Mill processing cost 23.00 $/tonne processed Process rate 4,000 Tonnes-per-day processed General and Administrative cost 5.17 $/tonne processed WO3 price $115,000 $/tonne Ag price $38.00 $/ounce |
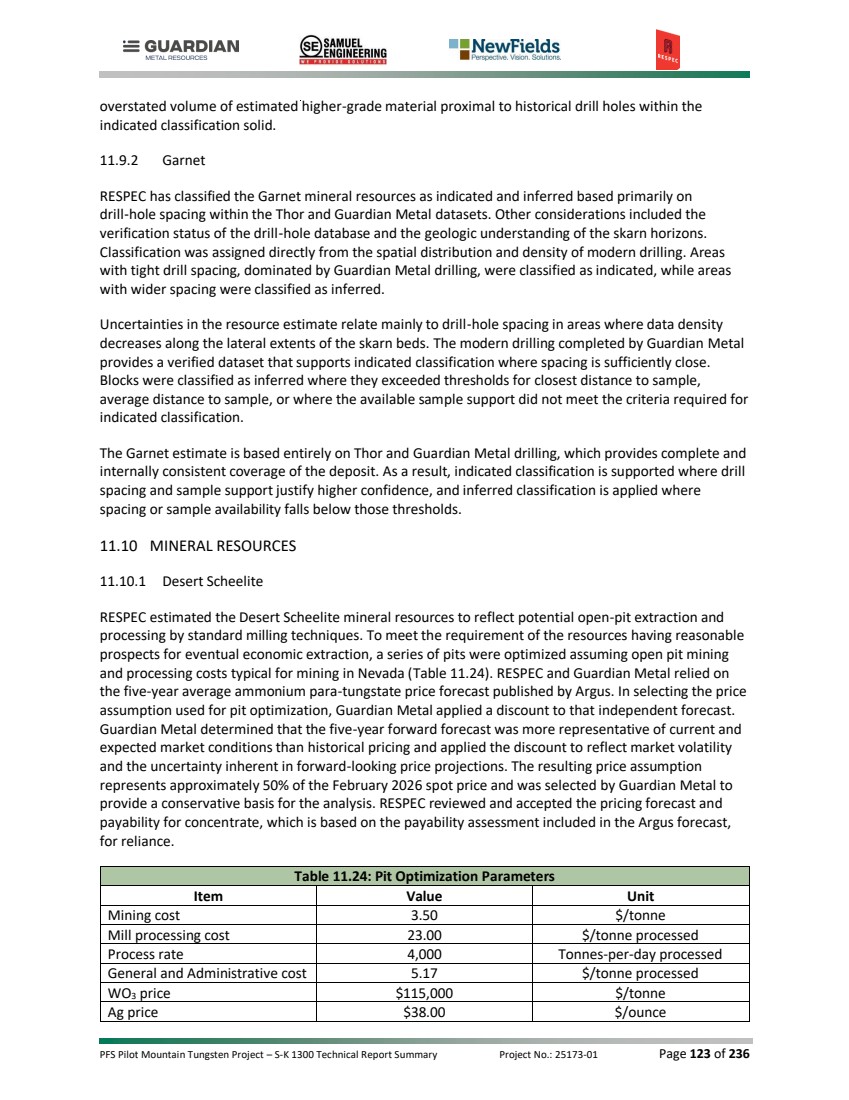
| PFS Pilot Mountain Tungsten Project – S-K 1300 Technical Report Summary Project No.: 25173-01 Page 124 of 236 Table 11.24: Pit Optimization Parameters Item Value Unit Zn price $2,700 $/tonne WO3 recovery 75 Percent Ag recovery 60 Percent Cu recovery 60 Percent Zn recovery 60 Percent WO3 payability 84 Percent Ag payability 75 Percent Cu payability 0 Percent Zn payability 75 Percent Table 11.25 presents the estimates of indicated and inferred mineral resources for the Desert Scheelite deposit. Of the total resources, 86% by contained tonnes WO₃ and 84% by total tonnes mined and processed are classified as indicated. Inferred resources may be upgraded to the indicated category with improved geological understanding and confirmation of the low-grade WO₃ domain model supported by additional drilling and assaying, and refinement of domains for all metals. These mineral resources are not mineral reserves and do not have demonstrated economic viability. The estimates are reported on diluted blocks measuring 5m by 2.5 m by 5 m. A representative cross section of the tungsten block model is shown in Figure 11.3. A mineral resource statement that is exclusive of mineral reserves is provided in Table 11.26. Table 11.25: Desert Scheelite Inclusive Reserves Cut-off Average Grade Contained Metal Classification % WO3 Tonnes % WO3 g Ag/t % Zn t WO3 oz Ag t Zn Indicated 0.04 9,978,000 0.189 11.39 0.3 18,900 3,656,000 29,900 Inferred 0.04 1,933,000 0.158 11.48 0.286 3,000 713,000 5,500 Notes: 1. The effective date of Desert Scheelite mineral resources is May 26, 2026. 2. The estimate of mineral resources was done by RESPEC in metric tonnes. 3. The point of reference is in situ mineralization prior to extraction by open pit mining methods. 4. The average grades of the tabulations are comprised of the weighted average of block-diluted grades within an optimized pit. 5. The Desert Scheelite mineral resource cut‑off grade of 0.04% WO₃ was selected by the authors. Operating assumptions were applied to establish a theoretical pit limit, including a WO₃ price of $115,000/t, an average recovery of 75% WO₃, a processing rate of 4,000 tonnes/day, $3.50/t mining cost for open pit, $23.00/t processing cost, $5.17/t processed for G&A, and an 84% payability. Blocks outside the pit limit are considered not economic currently. 6. The accessory metals Ag and Zn shown in Table 11.24 are the quantities contained within the mineral resources using the cut-off grade established for the primary commodity (WO3). No independent cut-off grade has been applied to these accessory metals. Reported quantities of accessory metals are therefore considered by-products of the primary metal resource and their value is contingent upon the ability to economically extract the by-products along with the primary commodity. 7. The estimate of mineral resources may be materially affected by geology, environmental, permitting, legal, title, taxation, sociopolitical, marketing, or other relevant issues. 8. Rounding as required by reporting guidelines may result in apparent discrepancies between tonnes, grade, and contained metal content. 9. Mineral resources are reported inclusive of mineral reserves. Mineral reserves are a subset of the reported mineral resources and should not be added to the mineral resource estimates. 10. Mineral resources are not mineral reserves and do not have demonstrated economic viability. An inferred mineral resource has a lower level of confidence than an indicated mineral resource and must not be converted to a mineral reserve. RESPEC reasonably expects that continued exploration and delineation will upgrade most inferred mineral resources to indicated mineral resources. |
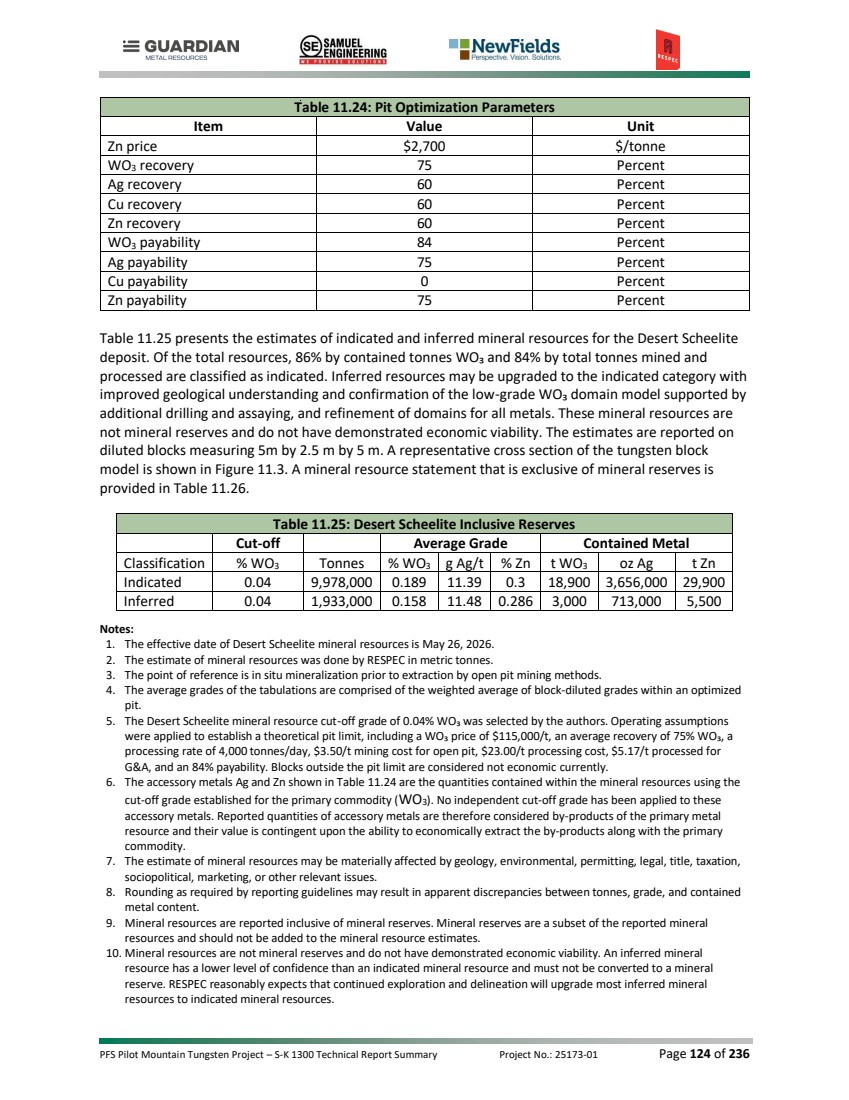
| PFS Pilot Mountain Tungsten Project – S-K 1300 Technical Report Summary Project No.: 25173-01 Page 125 of 236 Table 11.26: Desert Scheelite Exclusive Reserves Cut-off Average Grade Contained Metal Classification % WO3 Tonnes % WO3 g Ag/t % Zn t WO3 oz Ag t Zn Indicated 0.04 539,000 0.222 20.92 0.286 1,200 363,000 1,500 Inferred 0.04 1,933,000 0.158 11.48 0.286 3,000 713,000 5,500 Notes: 1. The effective date of Desert Scheelite mineral resources is May 26, 2026. 2. The estimate of mineral resources was done by RESPEC in metric tonnes. 3. The point of reference is in situ mineralization prior to extraction by open pit mining methods. 4. The average grades of the tabulations are comprised of the weighted average of block-diluted grades within an optimized pit. 5. The Desert Scheelite mineral resource cut‑off grade of 0.04% WO₃ was selected by the authors. Operating assumptions were applied to establish a theoretical pit limit, including a WO₃ price of $115,000/t, an average recovery of 75% WO₃, a processing rate of 4,000 tonnes/day, $3.50/t mining cost for open pit, $23.00/t processing cost, $5.17/t processed for G&A, and an 84% payability. Blocks outside the pit limit are considered not economic currently. 6. The accessory metals Ag and Zn shown in Table 11.24 are the quantities contained within the mineral resources using the cut-off grade established for the primary commodity (WO3). No independent cut-off grade has been applied to these accessory metals. Reported quantities of accessory metals are therefore considered by-products of the primary metal resource and their value is contingent upon the ability to economically extract the by-products along with the primary commodity. 7. The estimate of mineral resources may be materially affected by geology, environmental, permitting, legal, title, taxation, sociopolitical, marketing, or other relevant issues. 8. Rounding as required by reporting guidelines may result in apparent discrepancies between tonnes, grade, and contained metal content. 9. Mineral resources are reported exclusive of mineral reserves. 10. Mineral resources are not mineral reserves and do not have demonstrated economic viability. An inferred mineral resource has a lower level of confidence than an indicated mineral resource and must not be converted to a mineral reserve. RESPEC reasonably expects that continued exploration and delineation will upgrade most inferred mineral resources to indicated mineral resources. |
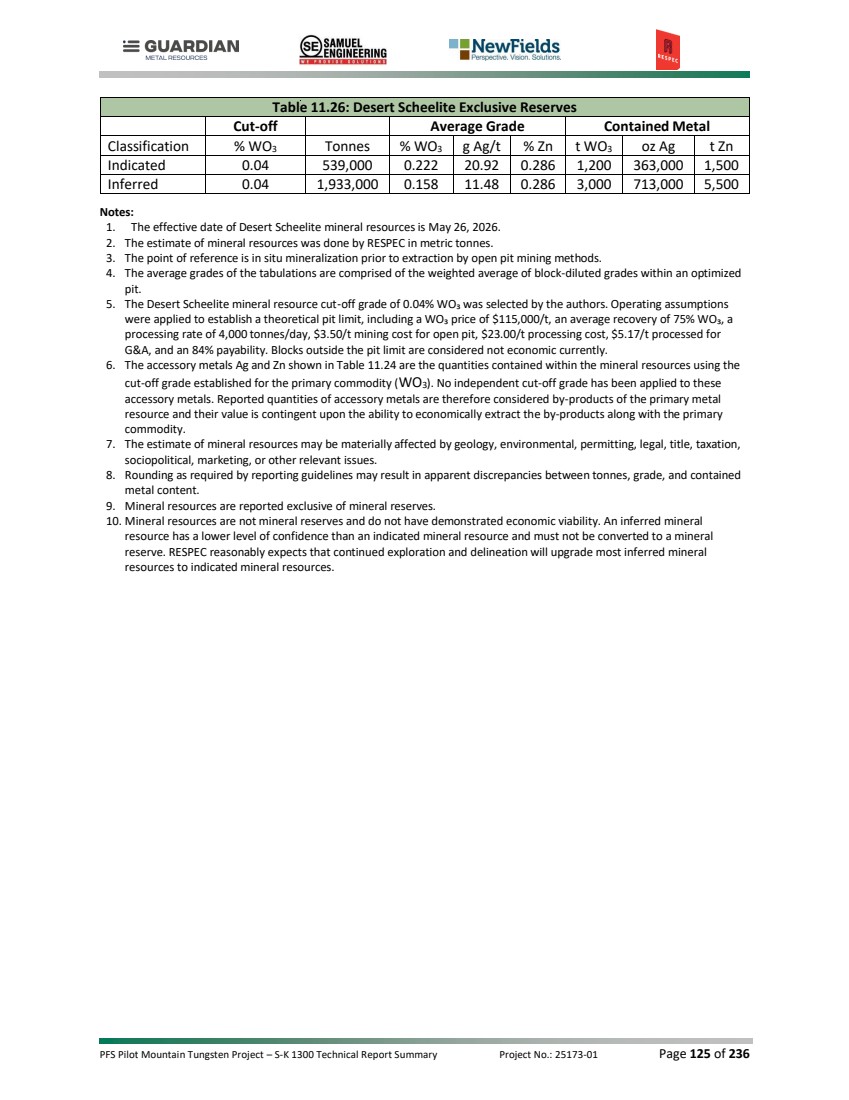
| PFS Pilot Mountain Tungsten Project – S-K 1300 Technical Report Summary Project No.: 25173-01 Page 126 of 236 Figure 11.3: North-South Cross-Section 424305E Showing WO3 Grades in the Desert Scheelite Block Model. |
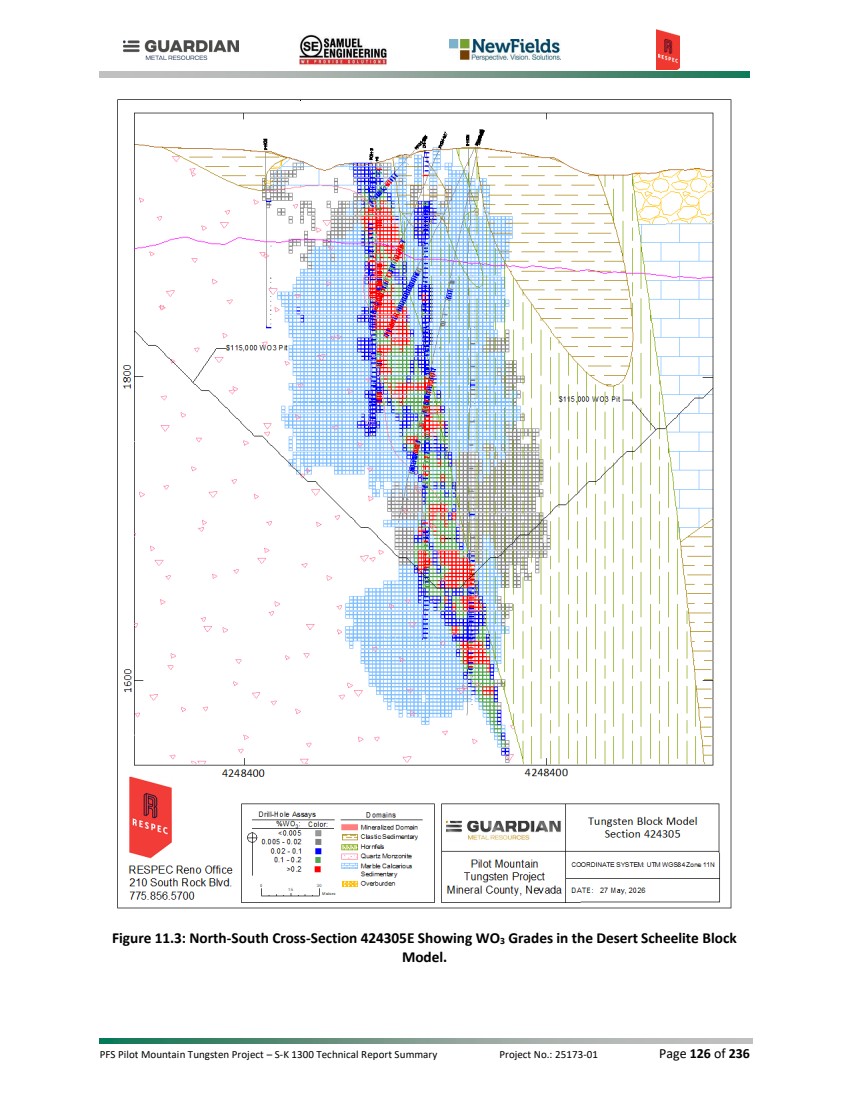
| PFS Pilot Mountain Tungsten Project – S-K 1300 Technical Report Summary Project No.: 25173-01 Page 127 of 236 11.10.2 Garnet RESPEC evaluated the Garnet deposit using the same open‑pit framework applied to Desert Scheelite. The team optimized a series of pits using Nevada‑appropriate mining and processing costs and applied metal prices, recoveries, and payabilities consistent with current market expectations. Guardian Metal used the five‑year forward ammonium para‑tungstate price forecast published by Argus and discounted that forecast to account for market volatility and uncertainty in forward‑looking pricing. RESPEC reviewed and accepted the resulting pricing and payability assumptions for reliance. Table 11.27 presents the indicated and inferred mineral resources for Garnet. Indicated resources contain approximately 87% of the contained WO₃ metal and 86% of the total tonnes within the optimized pit shell. Additional drilling can upgrade inferred resources by improving geological confidence, confirming continuity of mineralized skarn horizons, and refining grade‑shell interpretations for all reported metals. These mineral resources are not mineral reserves and do not demonstrate economic viability. The estimates use diluted block grades consistent with the Garnet block model. Figure 11.4 presents a representative cross section of the model. . A mineral resource statement that is exclusive of mineral reserves is provided in Table 11.28. Table 11.27: Garnet Resources Inclusive Reserves Cut-off Average Grade Contained Metal Classification % WO3 Tonnes % WO3 g Ag/t % Zn t WO3 oz Ag t Zn Indicated 0.04 2,158,000 0.127 3.18 0.233 2,700 221,000 5,000 Inferred 0.04 364,000 0.11 1.87 0.111 400 22,000 400 Notes: 1. The effective date of Garnet mineral resources is May 26, 2026. 2. The estimate of mineral resources was done by RESPEC in metric tonnes. 3. The point of reference is in situ mineralization prior to extraction by open pit mining methods. 4. The average grades of the tabulations are comprised of the weighted average of block-diluted grades within an optimized pit. 5. The Garnet mineral resource cut‑off grade of 0.04% WO₃ was selected by the authors. Operating assumptions were applied to establish a theoretical pit limit, including a WO₃ price of $115,000/t, an average recovery of 75% WO₃, a processing rate of 4,000 tonnes/day, $3.50/t mining cost for open pit, $23.00/t processing cost, $5.17/t processed for G&A, and an 84% payability. Blocks outside the pit limit are considered not economic currently. 6. The accessory metals Ag and Zn shown in Table 11.24 are the quantities contained within the mineral resources using the cut-off grade established for the primary commodity (WO3). No independent cut-off grade has been applied to these accessory metals. Reported quantities of accessory metals are therefore considered by-products of the primary metal resource and their value is contingent upon the ability to economically extract the by-products along with the primary commodity. 7. The estimate of mineral resources may be materially affected by geology, environmental, permitting, legal, title, taxation, sociopolitical, marketing, or other relevant issues. 8. Rounding as required by reporting guidelines may result in apparent discrepancies between tonnes, grade, and contained metal content. 9. Mineral resources are reported inclusive of mineral reserves. Mineral reserves are a subset of the reported mineral resources and should not be added to the mineral resource estimates. 10. Mineral resources are not mineral reserves and do not have demonstrated economic viability. An inferred mineral resource has a lower level of confidence than an indicated mineral resource and must not be converted to a mineral reserve. RESPEC reasonably expects that continued exploration and delineation will upgrade most inferred mineral resources to indicated mineral resources. |
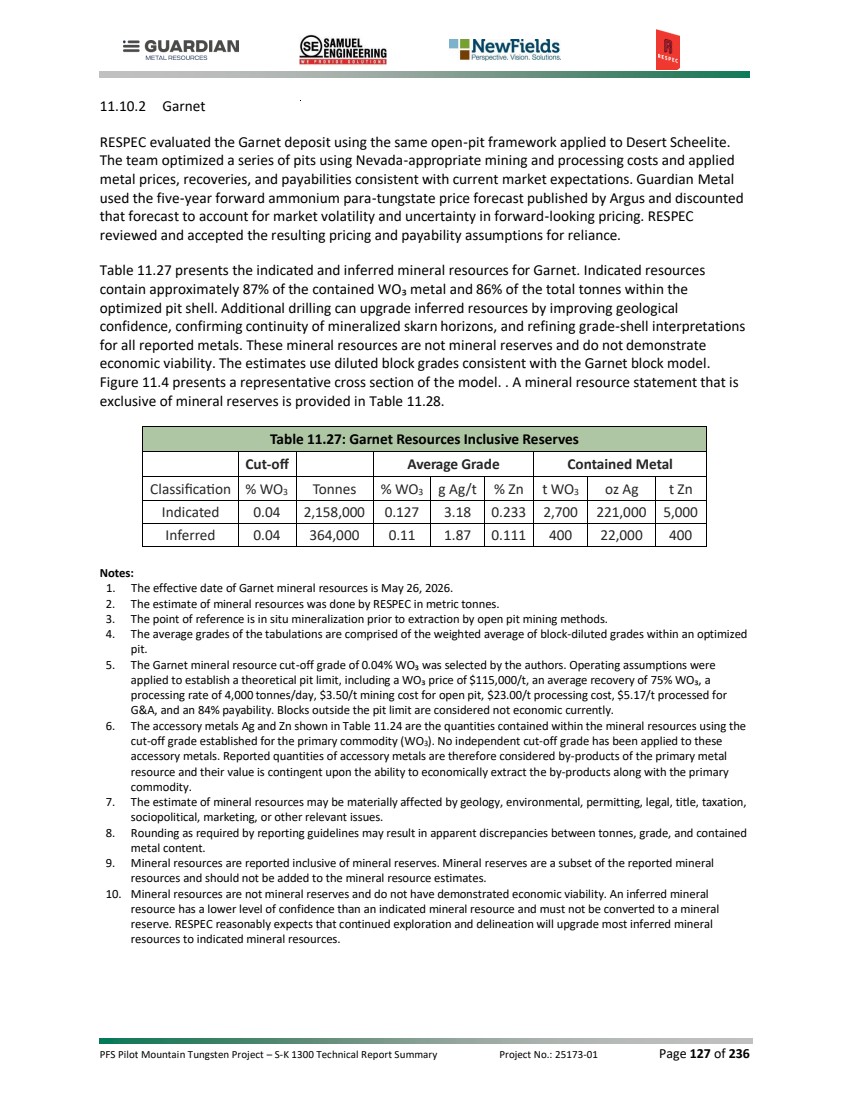
| PFS Pilot Mountain Tungsten Project – S-K 1300 Technical Report Summary Project No.: 25173-01 Page 128 of 236 Table 11.28: Garnet Resources Exclusive Reserves Cut-off Average Grade Contained Metal Classification % WO3 Tonnes % WO3 g Ag/t % Zn t WO3 oz Ag t Zn Indicated 0.04 98,000 0.144 3.65 0.173 140 11,000 170 Inferred 0.04 364,000 0.11 1.87 0.111 400 22,000 400 Notes: 1. The effective date of Garnet mineral resources is May 26, 2026. 2. The estimate of mineral resources was done by RESPEC in metric tonnes. 3. The point of reference is in situ mineralization prior to extraction by open pit mining methods. 4. The average grades of the tabulations are comprised of the weighted average of block-diluted grades within an optimized pit. 5. The Garnet mineral resource cut‑off grade of 0.04% WO₃ was selected by the authors. Operating assumptions were applied to establish a theoretical pit limit, including a WO₃ price of $115,000/t, an average recovery of 75% WO₃, a processing rate of 4,000 tonnes/day, $3.50/t mining cost for open pit, $23.00/t processing cost, $5.17/t processed for G&A, and an 84% payability. Blocks outside the pit limit are considered not economic currently. 6. The accessory metals Ag and Zn shown in Table 11.24 are the quantities contained within the mineral resources using the cut-off grade established for the primary commodity (WO3). No independent cut-off grade has been applied to these accessory metals. Reported quantities of accessory metals are therefore considered by-products of the primary metal resource and their value is contingent upon the ability to economically extract the by-products along with the primary commodity. 7. The estimate of mineral resources may be materially affected by geology, environmental, permitting, legal, title, taxation, sociopolitical, marketing, or other relevant issues. 8. Rounding as required by reporting guidelines may result in apparent discrepancies between tonnes, grade, and contained metal content. 9. Mineral resources are reported exclusive of mineral reserves. 10. Mineral resources are not mineral reserves and do not have demonstrated economic viability. An inferred mineral resource has a lower level of confidence than an indicated mineral resource and must not be converted to a mineral reserve. RESPEC reasonably expects that continued exploration and delineation will upgrade most inferred mineral resources to indicated mineral resources. |
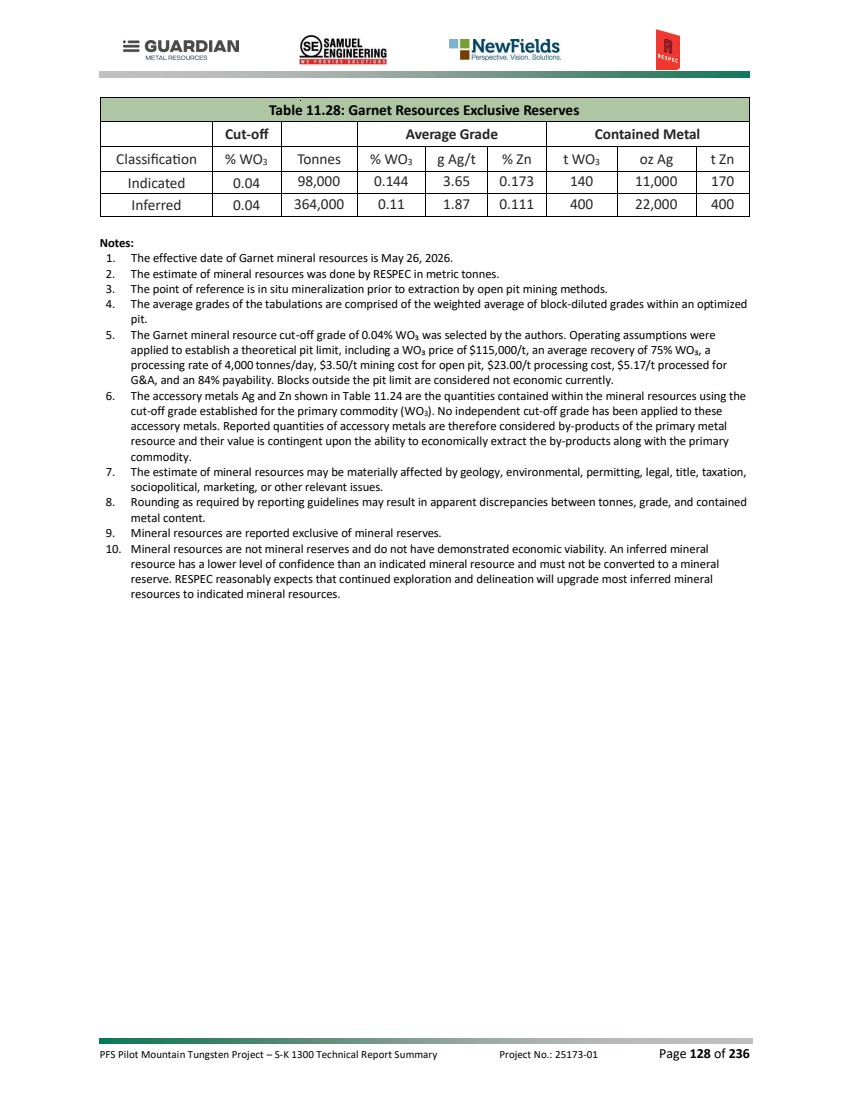
| PFS Pilot Mountain Tungsten Project – S-K 1300 Technical Report Summary Project No.: 25173-01 Page 129 of 236 Figure 11.4: East-West Cross-Section 4247980N Showing WO3 Grades in the Garnet Block Model |
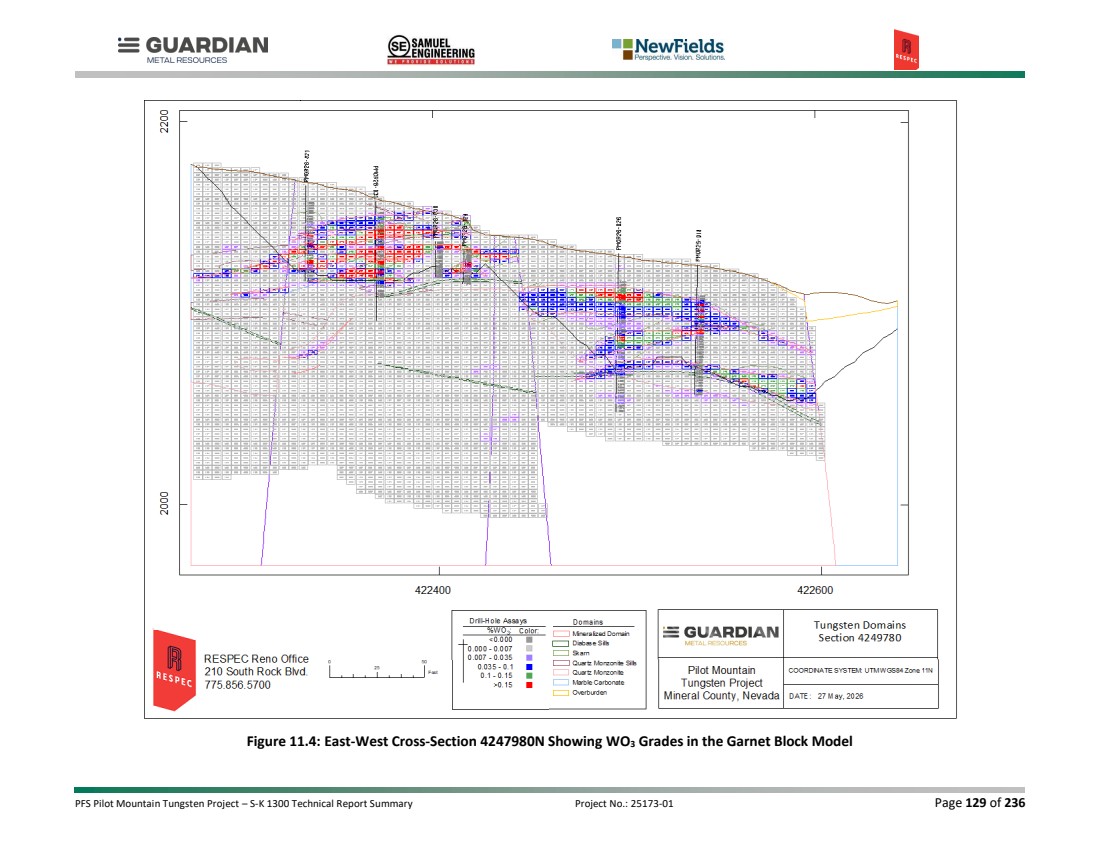
| PFS Pilot Mountain Tungsten Project – S-K 1300 Technical Report Summary Project No.: 25173-01 Page 130 of 236 11.11 MODEL VALIDATION 11.11.1 Desert Scheelite RESPEC systematically compared bench composite grades for WO₃, silver, copper, and zinc against coincident block estimated grades across the Desert Scheelite deposit. The results of this comparison are presented in Figure 11.5 for WO₃ only. The evaluation confirmed that block grades reproduce the distributional characteristics of the composited assay data at bench scale, with no evidence of material bias and revealed minor smoothing effects consistent with the applied interpolation methodologies. The smoothing of estimated block grades is within acceptable limits. The block model was also reviewed visually by comparing estimated block grades against the interpreted geology and the corresponding drill-hole assays, which confirmed that the block grades honor the geological framework and assay data at the deposit scale. This validation demonstrates that the models for all reported metals are reasonable and reliable, thereby meeting the requirements for disclosure under S‑K 1300 standards. Figure 11.5: Desert Scheelite WO3 Bench Composite Grades versus Coincident Block Grades Interpolated by OK, ID2, and NN. 11.11.2 Garnet RESPEC evaluated the relationship between bench composite grades for WO3, silver, copper, and zinc against corresponding estimated block grades across the Garnet deposit. The results of this comparison are presented in Figure 11.6, which illustrates the cumulative probability relationships between the composite data and the estimated block grades for WO3 only. |
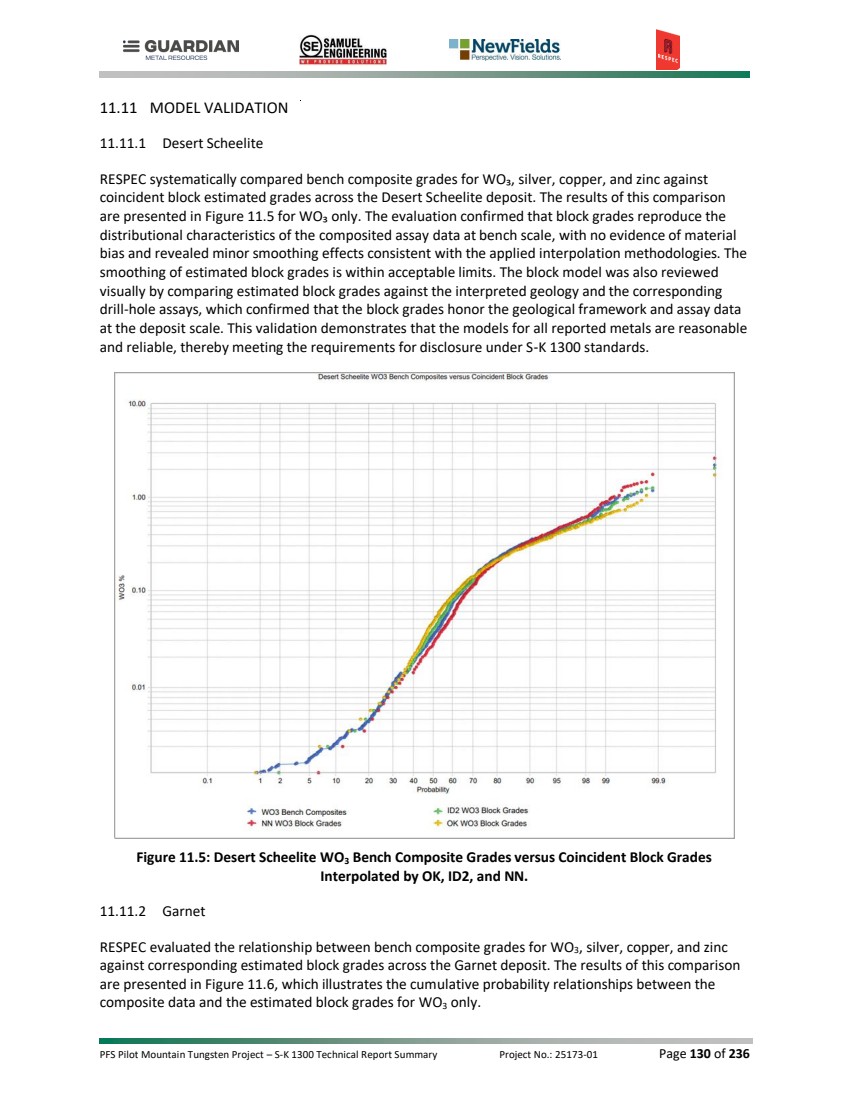
| PFS Pilot Mountain Tungsten Project – S-K 1300 Technical Report Summary Project No.: 25173-01 Page 131 of 236 The evaluation confirmed that the estimated block grades reproduce the distributional characteristics of the composited WO3 data at bench scale, with no evidence of material bias. Minor smoothing effects are present in the estimated grades, consistent with the applied interpolation methodologies and the block size used, and these effects are within acceptable limits. RESPEC also reviewed the block model visually by comparing estimated block grades against the interpreted geology and corresponding drill‑hole assays. This review confirmed that the block grades appropriately honor both the geological framework and the underlying sample data at the deposit scale. This validation demonstrates that the models for all reported metals are reasonable and reliable, thereby meeting the requirements for disclosure under S‑K 1300 standards. Figure 11.6:. Garnet WO3 Bench Composite Grades versus Coincident Block Grades Interpolated by OK, ID2, and NN. 11.12 DISCUSSION OF RESOURCES 11.12.1 Desert Scheelite The Desert Scheelite mineral resources are associated with a base‑metal enriched tungsten skarn developed within lower Luning Formation carbonates and interbedded biotite hornfels. The skarn zone extends for approximately 650 m along the contact of the Desert Scheelite quartz monzonite stock and persists for at least 300 m down‑dip. Mineralization is characterized by abundant scheelite accompanied by pyrite and base metal sulfides, principally chalcopyrite and sphalerite. Mineralization is oriented sub vertically and includes three higher grade tungsten zones within skarn or marble hosts, which may reflect favorable structural and lithological controls. |
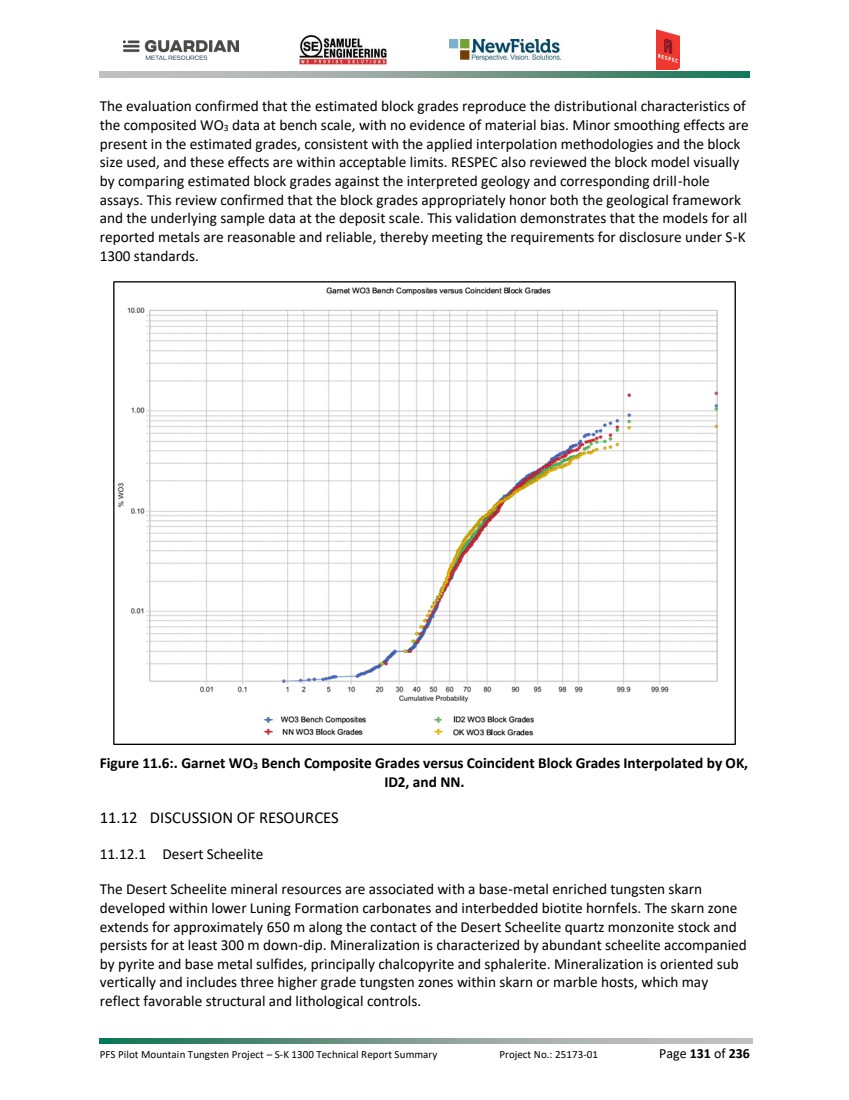
| PFS Pilot Mountain Tungsten Project – S-K 1300 Technical Report Summary Project No.: 25173-01 Page 132 of 236 A significant outcome of Guardian Metal’s work has been an improved understanding of the orientation and continuity of mineralization, leading to the development of a new geologic model. RESPEC’s tungsten domain modeling and resource estimation were based on this geologic model, which also provides a framework to guide future drilling at the Desert Scheelite deposit. The Desert Scheelite mineral resources have been estimated assuming potential open pit extraction and processing by standard milling and flotation techniques. RESPEC optimized a series of pits at variable WO₃ prices using fixed mining and processing costs reflective of Nevada operations to evaluate near surface mineralization that, under assumed and justifiable technical and economic conditions, is likely to be economically extractable. The mineral resources are reported at a cut-off grade of 0.04% WO3 within the optimized pit. Silver and zinc quantities within the mineral resources established using the WO3 cut-off grade are also reported, but their value is dependent on the ability to economically extract the by-products. No independent cut-off grades were applied to silver or zinc, and these metals were not incorporated into a tungsten-equivalent grade. Those metals are considered by-products contingent upon economic extraction of WO3. A majority (84%) of the Desert Scheelite mineral resources have been classified as indicated, reflecting the drilling density achieved by Guardian Metal, the supporting QA/QC data, and the improved geological understanding of the deposit. More than 97% of the indicated blocks incorporate the maximum number of composites used in grade estimation. Offsetting these positive attributes, uncertainties in the resource estimate relate primarily to the quality and reliability of historical data. These include analytical methodologies employed by historical operators that may not align with current industry standards and selective sampling in certain historical drill holes that could introduce bias in grade representation. Drill‑hole spacing, particularly along the down‑dip extent of the deposit where data density is lower, results in those areas remaining classified as inferred. Other limitations in the historical dataset include incomplete down‑hole survey records and inconsistent assay documentation. RESPEC audits confirmed that the Guardian Metal, Duval, and UCC datasets exhibit broadly consistent and comparable grade distributions, supporting comparability of grade populations despite differences in dataset size, detection limits, and selective sampling. Interpolation tests indicated that historical datasets returned WO₃ grades approximately 17% higher than Guardian Metal’s, a difference attributed to sampling population effects and drilling geometry rather than systematic analytical bias. Confidence in pre‑Guardian Metal data is therefore lower, and the apparent thickness of higher‑grade intervals may be exaggerated in areas influenced predominantly by historical data. Guardian Metal’s angled drilling in 2024-2026 reduced this geometric bias and provides a reliable foundation for the resource model. RESPEC acknowledges that some risk remains, which may be mitigated through additional infill drilling, twin‑hole grade comparisons, and petrological studies to better define the spatial association of high‑grade zones. Multiple grade populations were observed on the CPP of each metal. Although second, higher-grade populations were apparent on the charts and in drill assays during modeling, the geological characteristics of the higher grades were not understood and were therefore not used in the model. The higher-grade assay population was controlled by applying strong search restrictions to the estimate, however, there is a risk that some of the grades are smeared within the low-grade domain. The model is considered to provide a reasonable representation of the overall quantity of contained metal. Local |
| PFS Pilot Mountain Tungsten Project – S-K 1300 Technical Report Summary Project No.: 25173-01 Page 133 of 236 variations in grade distribution, however, may be less reliably captured and remain subject to uncertainty. 11.12.2 Garnet The Garnet mineral resources occur within stratabound skarn horizons developed where reactive limestone and marble beds of the Luning Formation underwent metasomatism. Drilling shows that WO3 grades concentrate within these skarns and marble units and decrease sharply into unaltered carbonate. Lithologic controls exert the strongest influence on grade distribution, while local fault offsets and the numerous dikes and sills mapped across the deposit may also contribute to the spatial localization of mineralization. Scheelite is the primary tungsten mineral and occurs with pyrite and variable amounts of chalcopyrite and sphalerite. Guardian Metal developed the geologic model that defines the distribution of skarn, marble, intrusive contacts, and structural features. Their drilling improved the definition and continuity of these units. RESPEC used this geologic model to construct the grade domains applied in the block model. These domains capture the distribution of WO3 and associated metals and form the basis of the resource estimation. RESPEC estimated the Garnet mineral resources assuming potential open‑pit extraction and processing by standard milling and flotation techniques. The team optimized a series of pits using Nevada‑appropriate mining and processing costs and applied metal prices, recoveries, and payabilities consistent with current market expectations. These assumptions support the demonstration of reasonable prospects for eventual economic extraction and constrain the reported resources to material that could be mined and processed under justifiable technical and economic conditions. The reported resources use a WO3 cut‑off grade consistent with the pit optimization. Silver and zinc quantities are reported using the WO3 cut‑off grade and remain byproducts contingent upon the economic extraction of tungsten. No independent cut‑off grades were applied to these metals, and they were not incorporated into a tungsten‑equivalent grade. Indicated resources account for approximately 87% of the contained WO3 metal and 86% of the total tonnes within the optimized pit shell. This classification reflects the drilling density in the central portion of the deposit, the consistency of assay results, and the continuity of the modeled skarn horizons. Inferred resources occur primarily along the lateral and downdip extents of the system where drill spacing increases. Additional drilling in these areas will improve geological confidence, confirm continuity of mineralization, and refine grade‑shell interpretations for WO3, Ag and Zn. Uncertainties in the Garnet resource estimate relate mainly to limited drilling coverage in peripheral areas and the reliance on fewer data points to define the extents of the mineralized skarn. These uncertainties influence the classification of material at depth and along the flanks of the deposit. The available data does not indicate geological complexities that would preclude upgrading inferred material, but additional drilling is required to validate continuity assumptions and reduce uncertainty in local grade distribution. RESPEC validated all assay datasets used in the Garnet resource estimate. The validation confirmed that Guardian Metal’s assays from MSALABS and ALS show no material analytical bias, with both laboratories producing very similar grade distributions. RESPEC also verified that the Thor dataset aligns with Guardian’s results and does not introduce systematic differences in WO3, Ag, Cu, or Zn grades. RESPEC identified a biased high‑grade population in the historical UCC assays, and inclusion of this population |
| PFS Pilot Mountain Tungsten Project – S-K 1300 Technical Report Summary Project No.: 25173-01 Page 134 of 236 would have produced an upward bias in the estimated WO3 grades. RESPEC used the UCC data only to assist in defining the grade domains and excluded it prior to interpolation to maintain internal consistency and avoid inflating WO3 grades. These validation outcomes support the reliability of the datasets used in the resulting block model. The grade distributions observed in the block model provide a reasonable representation of the composite data and reflect the continuity supported by the grade domains. Some smoothing of grades occurs within these domains due to the estimation method and the use of broad grade domains, which may locally understate higher estimated grades and overstate lower estimated grades. This smoothing may reduce the model’s ability to capture sharp local variations in WO3, Ag, Cu, or Zn grades, particularly in areas with limited drilling, but the model reproduces the broader distributional characteristics of the dataset and is appropriate for evaluating the Garnet deposit and the overall quantity of contained metal. |

| PFS Pilot Mountain Tungsten Project – S-K 1300 Technical Report Summary Project No.: 25173-01 Page 135 of 236 12.0 MINERAL RESERVE ESTIMATES 12.1 INTRODUCTION RESPEC has used Indicated resources as the basis to define reserves for both the Scheelite and Garnet deposits which together compose the Pilot Mountain project. Open pit mining was selected as the mining method. Mineral reserves have been defined by: • Defining economic and geometrical parameters; • Run pit optimizations to determine the ultimate pit limits and sequencing; • Define pit design parameters; • Create pit designs; • Identify waste-rock storage locations; • Producing mine and process production schedules; • Creating a Request for Quotation (RFQ) for mining contractors; and • Estimating mining capital and operating costs based on contractor quotations and mining general personnel and supply costs. Thomas L. Dyer, PE has authored this section as the QP for statement of reserves. 12.2 PIT OPTIMIZATION Pit optimizations have been estimated using input economics, and geometry. The cutoff grades are based on the economic parameters and inputs for processing recoveries. The pit optimizations provided guidance for the ultimate pit designs and pit phases. 12.2.1 Economic Parameters Economic parameters are estimated based on input assumptions for mining and process operating costs, recoveries, and metal prices. Economic parameters used for the pit optimizations are shown in Table 12.1 below. The mining costs represent an initial assessment of what contract mining costs would be for the project. Processing costs were provided to RESPEC by Samuel Engineering as well as the G&A costs. Processing is anticipated to produce 2 primary concentrates containing tungsten trioxide (WO3), Silver (Ag), and Zinc (Zn). Metal recoveries were also provided by Samuel Engineering as well as anticipated payable amounts representing the return that Guardian Metal would receive for the metal produced. Table 12.2 shows the recoveries and payable percentages used for pit optimizations. This table also shows the effective recovery which is the recovery times the payable percentages. |
| PFS Pilot Mountain Tungsten Project – S-K 1300 Technical Report Summary Project No.: 25173-01 Page 136 of 236 Table 12.1: Economic Parameters Table 12.2: Metal Recoveries and Payable Percentages Reserves were developed using a 75% recovery while the final cashflow that supports reserves uses a 78.5% recovery. RESPEC believe that the reserves are valid since the final recovery has increased and provides better revenues from the same material. Metal prices input for the pit optimizations are shown in Table 12.3. While these are the prices used for resources, pit optimizations, and ultimately cutoff grades (“COG”), they are lower than the final metal prices used for cashflow analysis. The lower metal prices enhance the economics by maintaining a higher COG than would be the case using the higher metal prices. The primary impact of the higher metal prices is immaterial to the size of the ultimate pit, though there could be additional low-grade material stockpiled and processed at the end of the mine life. The value of this low-grade material is considered to be non-material, and the exclusion of this material is reasonable based on the QP’s experience. Table 12.3: PFS Metal Prices for Pit Optimization and Design 12.2.2 Geometrical Parameters Geometrical parameters applied for Scheelite and Garnet pit optimizations include slope or geotechnical parameters. The slope parameters were provided by RESPEC Geotechnical Engineers (Napolo et al, 2026). Figure 12.1 shows the Scheelite sectors as provided by RESPEC Geotech Engineers. These sectors are applied by rock type and orientation within the pit optimization. the Scheelite ramp locations were anticipated to be on the northern portion of the pit. Accordingly, the overall ramp angles were reduced by 5° on the north side of the pit to reflect the resulting angle once ramps are included into the design. Table 12.4 shows the slope parameters that were applied to pit optimizations and designs. The pit Scheelite Garnet Units Mining $ 3.50 $ 3.50 $/t Mined Inc Mining Cost $ 0.25 $ 0.25 $/t Processed Milling $ 23.00 $ 23.00 $/t Processed G&A USD/Year $ 7.24 $ 7.24 M USD/year Throughput 1,400 1,400 k TPY G&A per tonne * $ 5.17 $ 5.17 $/t Processed * G&A costs were applied to total project throughput. WO3 Ag Zn Recovery 75.0% 60.0% 60.0% Payable 84.0% 75.0% 75.0% Effective Recovery 63.0% 45.0% 45.0% Metal Price Units WO3 $ 115,000 $/t WO3 Ag $ 38.00 $/oz Ag Zn $ 2,700 $/t Zn |
| PFS Pilot Mountain Tungsten Project – S-K 1300 Technical Report Summary Project No.: 25173-01 Page 137 of 236 optimizations use only the Inner Ramp Angles (“IRA”). The designs use the Bench Height (“BH”) as the height between catch benches, the Bench Face Angle (“BFA”) Garnet ramps are anticipated to encircle the pit a bit lower than the ultimate crest. Accordingly, the overall ramp angles were reduced by 4° to reflect the resulting angle once ramps are included into the design. Table 12.5 shows the slope parameters applied to the pit optimizations and designs for Garnet. Figure 12.1: Desert Scheelite Geotechnical Zones Table 12.4: Pit Optimization Slopes – Scheelite Zone 1 Zone 2 Zone 3 Zone 4 Desert Clastic Sedimentary Marble, Hornfels, Monzonite ALL ALL Monzonite Volcaniclastic Scheelite X2 A X2 A X2 A X2 A X2 A X2 A BH 10 10 10 10 10 10 10 10 10 10 10 10 IRA 45 45.15 42 41.35 44 44.04 45 45.15 38 41.35 44 44.04 BFA 72 72 65 65 70 70 72 72 65 65 70 70 Berm 6.75 6.70 6.44 6.70 6.72 6.70 6.75 6.70 8.14 6.70 6.72 6.70 Zone 5 Zone 6 Desert Monzonite, Volcaniclastic Marble Clastic Sedimentary Marble, Hornfels, Monzonite Volcaniclastic Scheelite X2 A X2 A X2 A X2 A X2 A BH 10 10 10 10 10 10 10 10 10 10 IRA 44 44.04 42 41.35 45 45.15 42 41.35 44 44.04 BFA 70 70 65 65 72 72 65 65 70 70 Berm 6.72 6.70 6.44 6.70 6.75 6.70 6.44 6.70 6.72 6.70 |
| PFS Pilot Mountain Tungsten Project – S-K 1300 Technical Report Summary Project No.: 25173-01 Page 138 of 236 Table 12.5: Pit Optimization Slopes – Garnet 12.2.3 Cutoff Grades Internal cutoff grades (“CogInt”) were estimated based on the economic parameters, process parameters, and metal prices previously discussed. These were estimated using Equation 12.1 and varying metal prices. Equation 12.1 𝐶𝑜𝑔𝐼𝑛𝑡 = 𝑀𝑖𝑙𝑙𝑖𝑛𝑔 𝐶𝑜𝑠𝑡 + 𝐺&𝐴 𝐶𝑜𝑠𝑡 + 𝐼𝑛𝑐𝑟𝑒𝑚𝑒𝑛𝑡𝑎𝑙 𝐶𝑜𝑠𝑡 𝑊𝑂3 𝑃𝑟𝑖𝑐𝑒 100 ∗ 𝑅𝑒𝑐𝑜𝑣𝑒𝑟𝑦 ∗ 𝑃𝑎𝑦𝑎𝑏𝑙𝑒 Where: Milling Cost, G&A Cost, and Incremental Cost is shown in Table 12.1 WO3 Price is given in $/t WO3 Recovery and Payable is shown in Table 12.2 Note that 1 does not include mining costs. This is intended to show the COG as an internal cutoff and assumes that the mining cost is a sunk cost and the determination of whether to process the material is made at the pit crest. The resulting internal COGs are shown in Table 12.6 with the design price of $115,000 per tonne of WO3. The cutoff used to define Mineral Reserves is 0.040 % WO3. Table 12.6: WO3 % Cutoff Grades by WO3 Price per Metric Ton Unit (MTU) Garnet Marble (Zn 1) Monzonite (Zn 2) Sills 1&2 (Zn 3) Skarn (Zn 4) Tklu (Zn 5) Alluvium (Zn 6) X2 A X2 A X2 A X2 A X2 A X2 A BH 10 10 10 10 10 10 10 10 10 10 10 10 IRA 46 45.73 42 41.85 42 41.85 46 45.73 46 45.73 35 34.08 BFA 72 72 65 65 65 65 72 72 72 72 35 35 Berm 6.41 6.50 6.44 6.50 6.44 6.50 6.41 6.50 6.41 6.50 - 0.50 $/MTU WO3 $/t WO3 % WO3 $ 500 $ 50,000 0.09 $ 600 $ 60,000 0.08 $ 700 $ 70,000 0.06 $ 800 $ 80,000 0.06 $ 900 $ 90,000 0.05 $ 1,000 $100,000 0.05 $ 1,100 $110,000 0.04 $ 1,150 $115,000 0.04 $ 1,200 $120,000 0.04 $ 1,300 $130,000 0.03 $ 1,400 $140,000 0.03 $ 1,500 $150,000 0.03 |
| PFS Pilot Mountain Tungsten Project – S-K 1300 Technical Report Summary Project No.: 25173-01 Page 139 of 236 12.2.4 Pit-Optimization Method and Results Pit optimizations were completed using Whittle software (version 2022) and the Pseudo flow algorithm. Ranges of pit shells were created using the economic and geometric parameters previously discussed. Revenue factors, which are factors used to multiply by the metal price and recoveries, were used to generate nested pit shells. These pit shells were summarized by metal price. The resulting pit optimization summaries are shown in Table 12.7 and Table 12.8 for Desert Scheelite and Garnet respectively. The highlighted pit shells show the $115,000 WO3 pits representing the base WO3 price used for design. Table 12.7: Desert Scheelite Pit Optimization Results Table 12.8: Garnet Pit Optimization Results Metal Prices Material Processed Waste Total Strip Pit WO3 Ag Zn kt % WO3 WO3 t oz Ag/t k ozs Ag % Zn Zn t kt kt Ratio 6 $ 25,000 $ 15 $ 1,031 744 0.33 2,466 16.65 398 0.56 4,203 1,405 2,149 1.89 8 $ 30,000 $ 17 $ 1,237 1,096 0.30 3,246 14.71 518 0.59 6,442 2,462 3,558 2.25 12 $ 40,000 $ 23 $ 1,649 2,691 0.26 7,073 14.51 1,255 0.55 14,797 15,056 17,747 5.59 16 $ 50,000 $ 29 $ 2,061 3,655 0.23 8,543 13.49 1,586 0.46 16,742 19,426 23,082 5.31 20 $ 60,000 $ 35 $ 2,473 4,760 0.21 10,191 12.24 1,873 0.39 18,352 26,232 30,991 5.51 24 $ 70,000 $ 41 $ 2,885 5,374 0.20 10,975 11.80 2,039 0.36 19,426 30,250 35,624 5.63 28 $ 80,000 $ 46 $ 3,298 7,219 0.20 14,201 11.33 2,629 0.33 23,800 60,919 68,137 8.44 32 $ 90,000 $ 52 $ 3,710 8,774 0.19 17,063 11.40 3,215 0.32 27,827 94,247 103,021 10.74 36 $ 100,000 $ 58 $ 4,122 9,219 0.19 17,602 11.25 3,333 0.31 28,408 100,084 109,302 10.86 40 $ 110,000 $ 64 $ 4,534 9,718 0.19 18,207 11.15 3,484 0.30 29,300 107,839 117,557 11.10 42 $ 115,000 $ 67 $ 4,740 9,952 0.19 18,535 11.17 3,574 0.30 29,789 112,860 122,812 11.34 44 $ 120,000 $ 70 $ 4,947 10,092 0.19 18,692 11.14 3,613 0.30 30,020 115,142 125,234 11.41 48 $ 130,000 $ 75 $ 5,359 10,266 0.18 18,837 11.07 3,653 0.29 30,227 117,163 127,428 11.41 52 $ 140,000 $ 81 $ 5,771 10,409 0.18 18,938 10.99 3,678 0.29 30,410 118,577 128,986 11.39 55 $ 150,000 $ 87 $ 6,183 10,522 0.18 19,008 10.93 3,698 0.29 30,522 119,552 130,074 11.36 58 $ 160,000 $ 93 $ 6,595 10,660 0.18 19,133 10.90 3,735 0.29 30,793 122,126 132,786 11.46 62 $ 170,000 $ 99 $ 7,008 10,758 0.18 19,200 10.86 3,755 0.29 30,926 123,416 134,174 11.47 65 $ 180,000 $ 104 $ 7,420 10,838 0.18 19,255 10.81 3,769 0.29 31,011 124,576 135,415 11.49 68 $ 190,000 $ 110 $ 7,832 10,892 0.18 19,272 10.78 3,774 0.28 31,039 124,697 135,589 11.45 71 $ 200,000 $ 116 $ 8,244 10,962 0.18 19,320 10.75 3,789 0.28 31,108 125,900 136,862 11.49 Metal Prices Material Processed Waste Total Strip Pit $/t WO3 $/oz Ag $/t Zn kt % WO3 WO3 t g Ag/t Ozs Ag % Zn t Zn kt kt Ratio 1 $ 25,000 $ 14.62 $1,038.46 2 0.25 4 0.78 0 0.41 6 3 5 2.22 3 $ 30,000 $ 17.54 $1,246.15 7 0.23 16 0.51 0 0.23 16 16 23 2.29 7 $ 40,000 $ 23.38 $1,661.54 193 0.19 356 2.00 12 0.42 808 898 1,090 4.66 11 $ 50,000 $ 29.23 $2,076.92 438 0.16 705 3.51 49 0.37 1,625 1,879 2,318 4.29 15 $ 60,000 $ 35.08 $2,492.31 596 0.15 889 3.17 61 0.34 2,020 2,484 3,080 4.17 19 $ 70,000 $ 40.92 $2,907.69 1,371 0.14 1,882 3.37 148 0.26 3,518 7,855 9,226 5.73 23 $ 80,000 $ 46.77 $3,323.08 1,593 0.13 2,090 3.18 163 0.24 3,895 8,955 10,547 5.62 27 $ 90,000 $ 52.62 $3,738.46 1,736 0.13 2,199 3.06 171 0.24 4,120 9,517 11,253 5.48 31 $100,000 $ 58.46 $4,153.85 1,966 0.13 2,461 2.99 189 0.23 4,475 12,358 14,323 6.29 35 $110,000 $ 64.31 $4,569.23 2,076 0.12 2,541 2.90 194 0.22 4,616 13,004 15,080 6.26 37 $115,000 $ 67.23 $4,776.92 2,114 0.12 2,576 2.87 195 0.22 4,655 13,419 15,533 6.35 39 $120,000 $ 70.15 $4,984.62 2,133 0.12 2,589 2.86 196 0.22 4,669 13,545 15,678 6.35 43 $130,000 $ 76.00 $5,400.00 2,224 0.12 2,662 2.78 199 0.21 4,709 14,406 16,631 6.48 47 $140,000 $ 81.85 $5,815.38 2,241 0.12 2,677 2.78 200 0.21 4,735 14,670 16,911 6.55 51 $150,000 $ 87.69 $6,230.77 2,287 0.12 2,720 2.75 202 0.21 4,788 15,459 17,745 6.76 55 $160,000 $ 93.54 $6,646.15 2,310 0.12 2,742 2.73 203 0.21 4,811 15,904 18,214 6.89 59 $170,000 $ 99.38 $7,061.54 2,324 0.12 2,754 2.72 204 0.21 4,832 16,160 18,484 6.95 63 $180,000 $105.23 $7,476.92 2,512 0.12 3,028 2.63 212 0.20 4,989 23,533 26,044 9.37 67 $190,000 $111.08 $7,892.31 2,515 0.12 3,031 2.63 213 0.20 4,993 23,612 26,127 9.39 71 $200,000 $116.92 $8,307.69 2,521 0.12 3,036 2.63 213 0.20 4,996 23,741 26,262 9.42 |
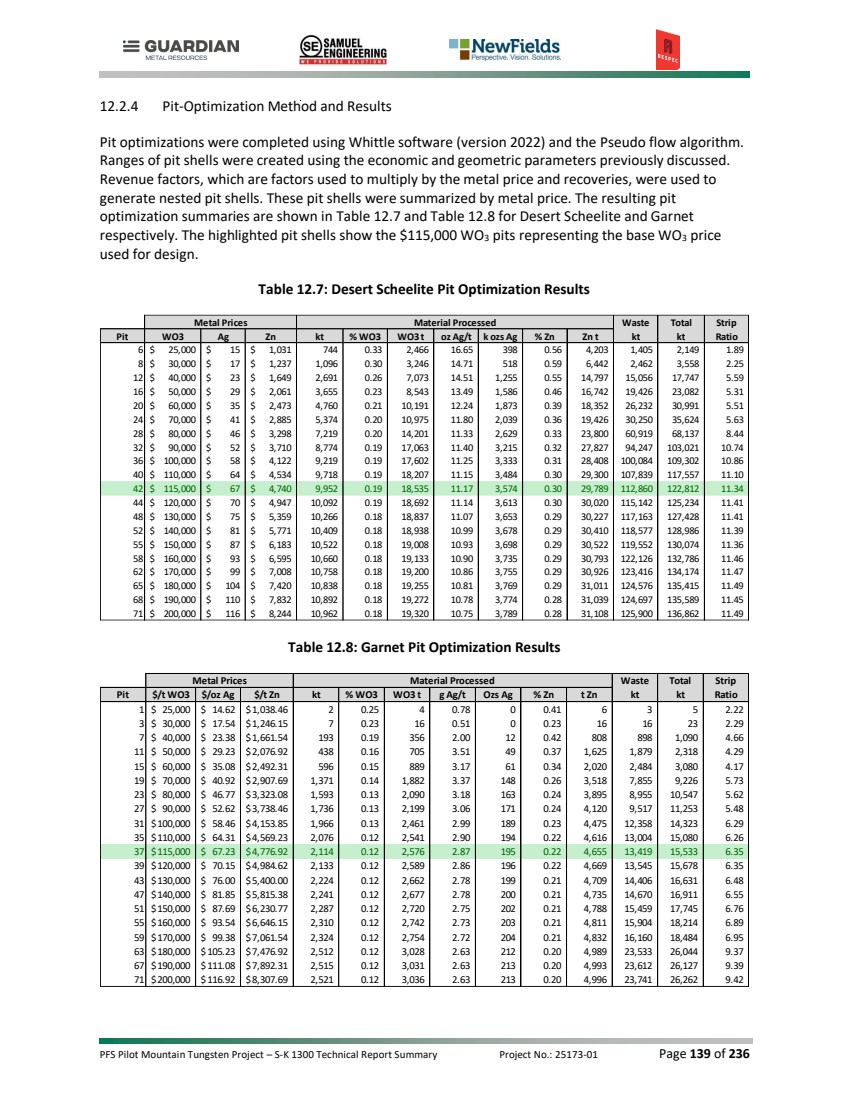
| PFS Pilot Mountain Tungsten Project – S-K 1300 Technical Report Summary Project No.: 25173-01 Page 140 of 236 Whittle’s Pit by Pit (“PbP”) analysis was used to determine ultimate pit limits based on plant limitations of 1.4M TPA and an 8% discount rate. Whittle produces 3 basic scenarios in the background to produce scenario operating cashflows for each pit shell. The 3 scenarios represent the “Best-”, “Worst-”, and “Specified-Case” operating cash flows. The Best-Case scenario represents the use of each previous pit as a pit phase. For example, the operating cash flow for pit 10 would be mined with 9 separate pit shells acting as mining phases before mining pit 10 as the ultimate pit. The analysis for pit 11 would use 10 pits before mining pit 11, etc. The results do not include capital; thus, the results are based on operating cost inputs only and are presented as discounted (8%) operating cashflows in the PbP output. Note that the Best Case is unrealistic as it would not allow the amount of mining width that would be required to use each pit phase individually, but it does represent the best discounted operating cashflow that might be generated for a given set of inputs. The worst case is produced in a similar manner; however, it evaluates each pit in the nested set of pits, assuming no pit phasing is done. This will provide a lower discounted operating cashflow than the Best Case. When compared to each other, this provides the potential for the ultimate pit limits that may be designed to. Note that the worst case does not allow for the use of initial pits to increase the value. If there is potential to mine smaller pits and accelerate higher-grade material generating higher revenues, then there are opportunities to define a set of pit shells that will enhance the value of the deposit. The Specified Case analysis allows the user to specify a set of pits that will act as pit phases. This allows the mining of higher-grade material sooner, which will increase the deposit value on a discounted operating cashflow basis. Note that while this is more realistic than the Best Case and more optimal than the worst case, the pits that are used for pit phasing will need refinement to include proper mining widths and ramp locations to ensure they are operational. Thus, these pits simply become suggestions of the pit phases needed to optimize the pit phases and ultimate pit designs. The Whittle PbP analysis was run for both the Desert Scheelite and Garnet deposits. The results are presented in Table 12.9 and Table 12.10 for Desert Scheelite and Garnet deposits respectively. Table 12.9: Desert Scheelite Pit by Pit Results Material Processed - Total Waste Total Strip Disc (8%) Op CF (M USD) LOM Pit kt % WO3 WO3 t oz Ag/t k ozs Ag % Zn Zn t kt kt Ratio Best Specified Worst Years 6 931 0.29 2,667 14.48 433 0.50 4,623 1,218 2,149 1.31 $ 162.08 $ 162.08 $ 162.08 0.85 8 1,319 0.26 3,454 13.00 551 0.52 6,891 2,239 3,558 1.70 $ 200.13 $ 200.13 $ 200.13 1.20 12 3,313 0.23 7,503 12.90 1,374 0.49 16,191 14,434 17,747 4.36 $ 372.97 $ 371.66 $ 370.41 3.03 16 4,426 0.20 8,999 12.01 1,709 0.40 17,848 18,656 23,082 4.21 $ 417.84 $ 416.52 $ 407.64 4.04 20 5,448 0.19 10,551 11.24 1,968 0.35 19,160 25,544 30,991 4.69 $ 460.89 $ 458.60 $ 441.74 4.98 24 5,892 0.19 11,220 11.12 2,105 0.34 19,982 29,733 35,624 5.05 $ 475.41 $ 472.76 $ 452.24 5.38 28 7,678 0.19 14,401 10.87 2,684 0.32 24,248 60,459 68,137 7.87 $ 524.71 $ 520.94 $ 484.69 7.01 32 9,118 0.19 17,203 11.10 3,253 0.31 28,130 93,903 103,021 10.30 $ 552.70 $ 548.07 $ 490.04 8.33 36 9,409 0.19 17,675 11.09 3,353 0.30 28,569 99,893 109,302 10.62 $ 555.54 $ 550.64 $ 487.62 8.59 40 9,779 0.19 18,230 11.10 3,490 0.30 29,352 107,778 117,557 11.02 $ 556.99 $ 551.76 $ 481.81 8.93 42 9,952 0.19 18,535 11.17 3,574 0.30 29,789 112,860 122,812 11.34 $ 557.04 $ 551.66 $ 476.77 9.09 44 10,027 0.19 18,669 11.19 3,607 0.30 29,970 115,207 125,234 11.49 $ 556.84 $ 551.39 $ 474.34 9.16 48 10,098 0.19 18,781 11.20 3,637 0.30 30,104 117,331 127,428 11.62 $ 556.23 $ 550.72 $ 471.54 9.22 52 10,146 0.19 18,853 11.20 3,654 0.30 30,224 118,840 128,986 11.71 $ 555.53 $ 549.98 $ 469.50 9.27 55 10,175 0.19 18,899 11.21 3,668 0.30 30,284 119,899 130,074 11.78 $ 554.97 $ 549.40 $ 467.88 9.29 58 10,244 0.19 19,006 11.23 3,699 0.30 30,516 122,542 132,786 11.96 $ 553.42 $ 547.80 $ 464.38 9.36 62 10,277 0.19 19,057 11.24 3,714 0.30 30,617 123,896 134,174 12.06 $ 552.52 $ 546.88 $ 462.54 9.39 65 10,303 0.19 19,099 11.24 3,725 0.30 30,675 125,112 135,415 12.14 $ 551.61 $ 545.93 $ 460.79 9.41 68 10,306 0.19 19,104 11.25 3,726 0.30 30,680 125,282 135,589 12.16 $ 551.48 $ 545.80 $ 460.48 9.41 71 10,335 0.19 19,144 11.25 3,738 0.30 30,731 126,527 136,862 12.24 $ 550.39 $ 544.67 $ 458.39 9.44 |
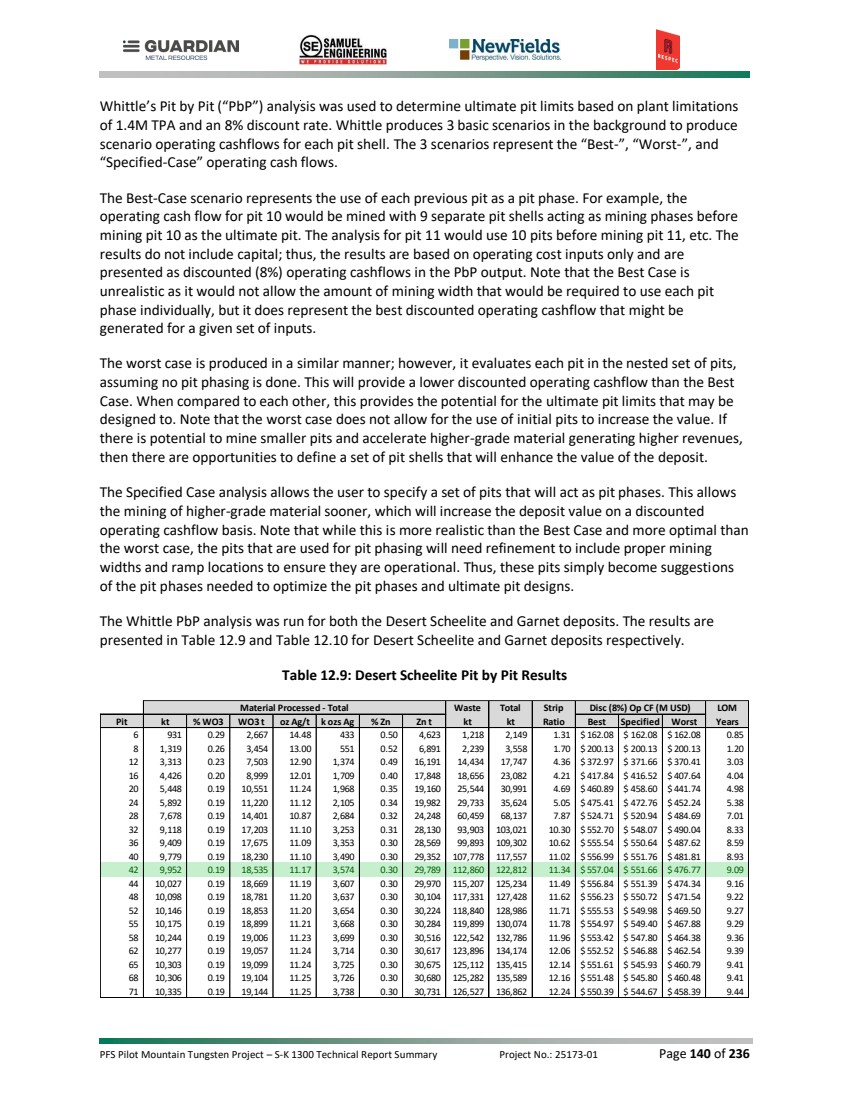
| PFS Pilot Mountain Tungsten Project – S-K 1300 Technical Report Summary Project No.: 25173-01 Page 141 of 236 Table 12.10: Garnet Pit by Pit Results 12.3 PIT DESIGNS Pit designs were completed using the highlighted pits from the PbP results previously presented. Pit design inputs included pit design slopes parameters ramps and haul roads parameters. 12.3.1 Pit Design Slopes Pit design slope parameters were previously discussed and are shown in Table 12.4 and Table 12.5 for Desert Scheelite and Garnet respectively (Section 12.2.2). 12.3.2 Ramps and Haul Roads Ramps and haul roads were designed based on the width of 92-tonne haul trucks with an assumed operating width of 6.10 m. Haul road design parameters for in-pit two-way traffic, in-pit one-way traffic, and ex-pit two-way traffic were estimated. The resulting estimates are shown in Table 12.11. Haul roads were designed to have a maximum gradient of 10%, with some exceptions up to 12% for short distances. Inside of the pit (In-Pit) designs assume one safety berm on the pit side that is maintained at or higher than the largest tire radius using the ramp. Inside of the pit the designs assume two-way traffic for most benches. For short distances where the bottom of the pit has reduced strip ratios, one-way traffic is assumed. Haul road berms have been based on the haul truck operating radius of 1.35 radius. To ensure that all berms will be tall enough, a 10% contingency was added to the radius of the haul trucks. Material Processed - M&I Waste Total Strip Disc (8%) Op CF (M USD) LOM Pit kt % WO3 WO3 t oz Ag/t k ozs Ag % Zn Zn t kt kt Ratio Best Specified Worst Years 1 2 0.21 4 0.72 0 0.35 7 3 5 1.61 $ 0.23 $ 0.23 $ 0.23 0.00 3 8 0.21 18 0.50 0 0.21 18 15 23 1.77 $ 0.98 $ 0.98 $ 0.98 0.01 7 300 0.15 439 1.68 16 0.30 895 790 1,090 2.64 $ 20.80 $ 20.80 $ 20.80 0.43 11 536 0.14 766 3.09 53 0.32 1,704 1,782 2,318 3.32 $ 35.20 $ 35.20 $ 35.20 0.77 15 686 0.14 939 2.87 63 0.30 2,087 2,394 3,080 3.49 $ 41.14 $ 41.14 $ 41.14 0.98 19 1,522 0.13 1,958 3.11 152 0.24 3,611 7,704 9,226 5.06 $ 70.85 $ 70.84 $ 70.84 2.17 23 1,693 0.13 2,136 3.03 165 0.23 3,945 8,855 10,547 5.23 $ 74.78 $ 74.72 $ 74.69 2.42 27 1,788 0.12 2,222 2.98 171 0.23 4,142 9,466 11,253 5.29 $ 76.11 $ 76.03 $ 75.94 2.55 31 1,988 0.12 2,470 2.96 189 0.23 4,482 12,335 14,323 6.21 $ 78.40 $ 78.28 $ 77.82 2.84 35 2,076 0.12 2,541 2.90 194 0.22 4,616 13,004 15,080 6.26 $ 78.62 $ 78.48 $ 77.85 2.97 37 2,114 0.12 2,576 2.87 195 0.22 4,655 13,419 15,533 6.35 $ 78.59 $ 78.44 $ 77.71 3.02 39 2,133 0.12 2,589 2.86 196 0.22 4,669 13,545 15,678 6.35 $ 78.53 $ 78.38 $ 77.61 3.05 43 2,224 0.12 2,662 2.78 199 0.21 4,709 14,406 16,631 6.48 $ 78.07 $ 77.90 $ 76.93 3.18 47 2,241 0.12 2,677 2.78 200 0.21 4,735 14,670 16,911 6.55 $ 77.83 $ 77.65 $ 76.63 3.20 51 2,287 0.12 2,720 2.75 202 0.21 4,788 15,459 17,745 6.76 $ 76.97 $ 76.78 $ 75.66 3.27 55 2,310 0.12 2,742 2.73 203 0.21 4,811 15,904 18,214 6.89 $ 76.38 $ 76.19 $ 74.97 3.30 59 2,324 0.12 2,754 2.72 204 0.21 4,832 16,160 18,484 6.95 $ 75.98 $ 75.79 $ 74.51 3.32 63 2,512 0.12 3,028 2.63 212 0.20 4,989 23,533 26,044 9.37 $ 65.93 $ 65.70 $ 62.87 3.59 67 2,515 0.12 3,031 2.63 213 0.20 4,993 23,612 26,127 9.39 $ 65.80 $ 65.57 $ 62.71 3.59 71 2,521 0.12 3,036 2.63 213 0.20 4,996 23,741 26,262 9.42 $ 65.57 $ 65.34 $ 62.44 3.60 |
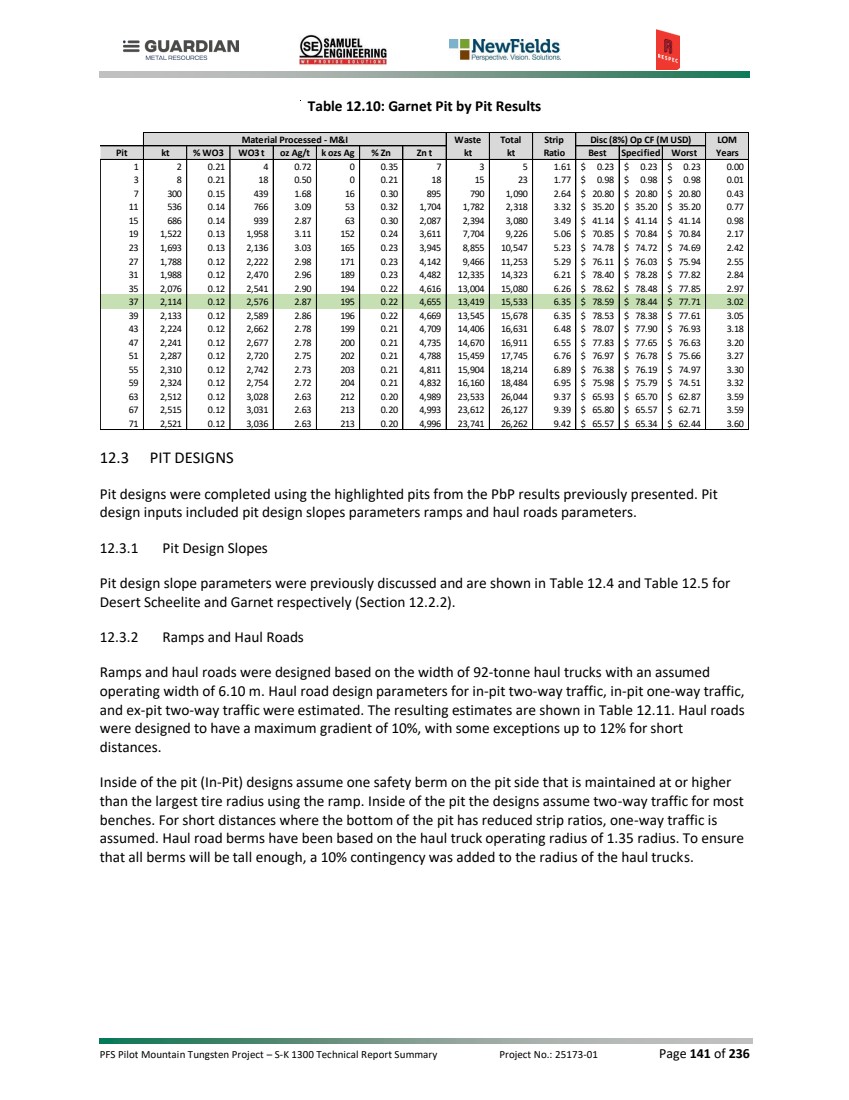
| PFS Pilot Mountain Tungsten Project – S-K 1300 Technical Report Summary Project No.: 25173-01 Page 142 of 236 Table 12.11: Haul Road Design Parameters 12.3.3 Dilution The Scheelite resource model assumes 2.5m X 5m X 5m blocks in the X, Y, Z directions. The 2.5 m in the X direction is perpendicular to the strike of the deposit. In the resource estimates, the blocks were domain diluted to the final block size and contain an inherent amount of dilution accordingly. The RESPEC believes that the block size represents a reasonable selective mining unit (“SMU”) and that the dilution implied is appropriate for the statement of reserves. The Garnet resource model assumes 5m X 5m X 2.5m in the X, Y, Z directions. The deposit ore has a distinct color difference from the surrounding gang which will allow selective mining to the SMU size. The Garnet resource has also been diluted to the SMU size and RESPEC believes that this is a reasonable SMU size for the mining of the deposit. For these reasons, no additional dilution has been added to the reserves. 12.4 ULTIMATE PIT DESIGNS AND PIT PHASING Desert Scheelite ultimate pit design is achieved by mining in 5 different pit phases with the first 2 pits named Phase 1a and Phase 1 followed by Phase 2, 3, and 4. The ultimate pit is shown as the Phase 4 in Figure 12.2. The ultimate pit depth from the highest crest to the lowest floor is 350 m with a strike length of 990 m and a width of 640 m. Desert Scheelite pit phases are shown in Figure 12.3, Figure 12.4, and Figure 12.5 for Phase 1a and Phase 1, Phase 2, and Phase 3 respectively. Garnet pit designs were completed using the same parameters as Desert Scheelite. Garnet is to be mined with the Phase 1 to the south of the Phase 2. The 2 pit phases merge to have a common ridge between them. The ultimate design is shown in Figure 12.6 with the south having an ultimate depth of 115 m and the northern portion having an ultimate depth of 110 m. The merged pits are about 380 m from north to south and the larger Phase 1 is about 330 m wide. In Pit In Pit Ex Pit Parameter Two-Way One-Way Two-Way Units Running/Truck Width Ratio 3.50 2.00 3.50 ratio Road Running Width 21.35 12.20 21.35 m Truck Tire Radius 1.35 1.35 1.35 m Berm Height 1.48 1.48 1.48 m Berm Top Width 0.25 0.25 0.25 m Berm Slope 1.50 1.50 1.50 Hz:Vert # of Berms 4.69 4.69 4.69 # Total Berm Width 1.00 1.00 2.00 m Design Width Used 26.00 17.00 31.00 m Running Width After Berms 21.31 12.31 21.62 m Running Width/Truck Width 3.49 2.02 3.54 Ratio |
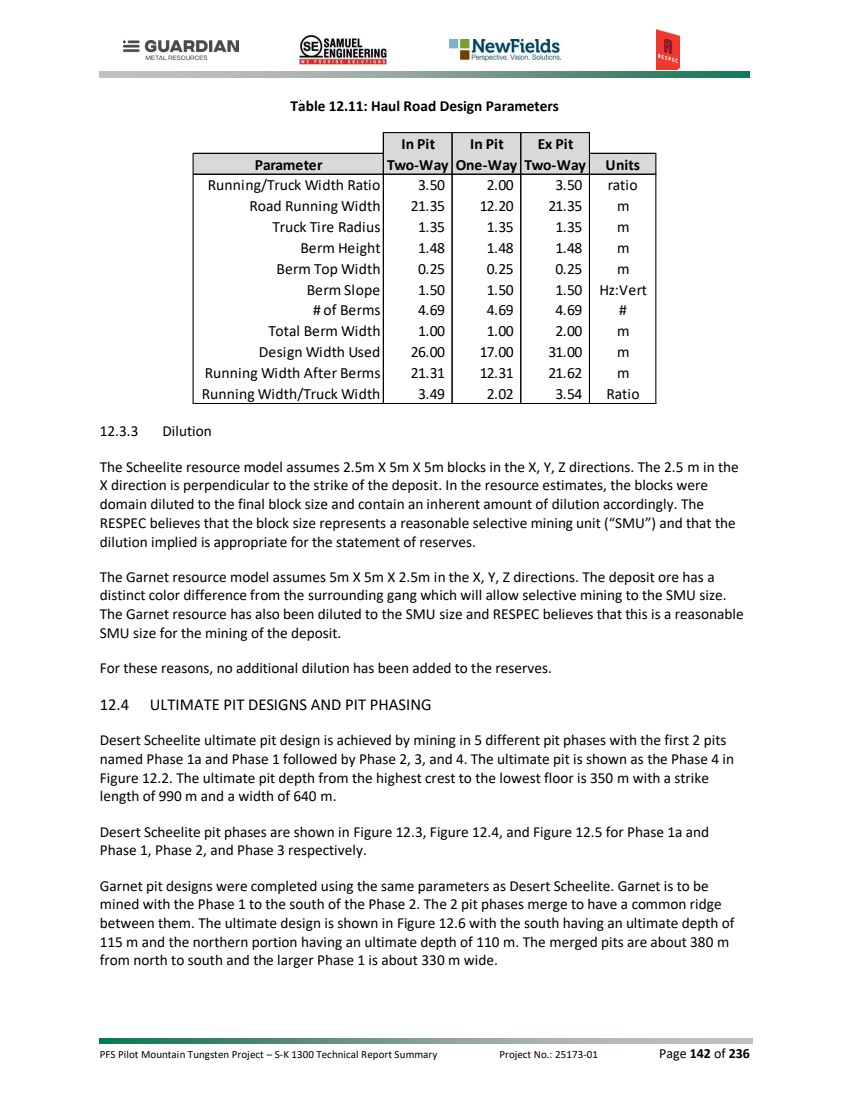
| PFS Pilot Mountain Tungsten Project – S-K 1300 Technical Report Summary Project No.: 25173-01 Page 143 of 236 Figure 12.2: Desert Scheelite Ultimate Pit Design |
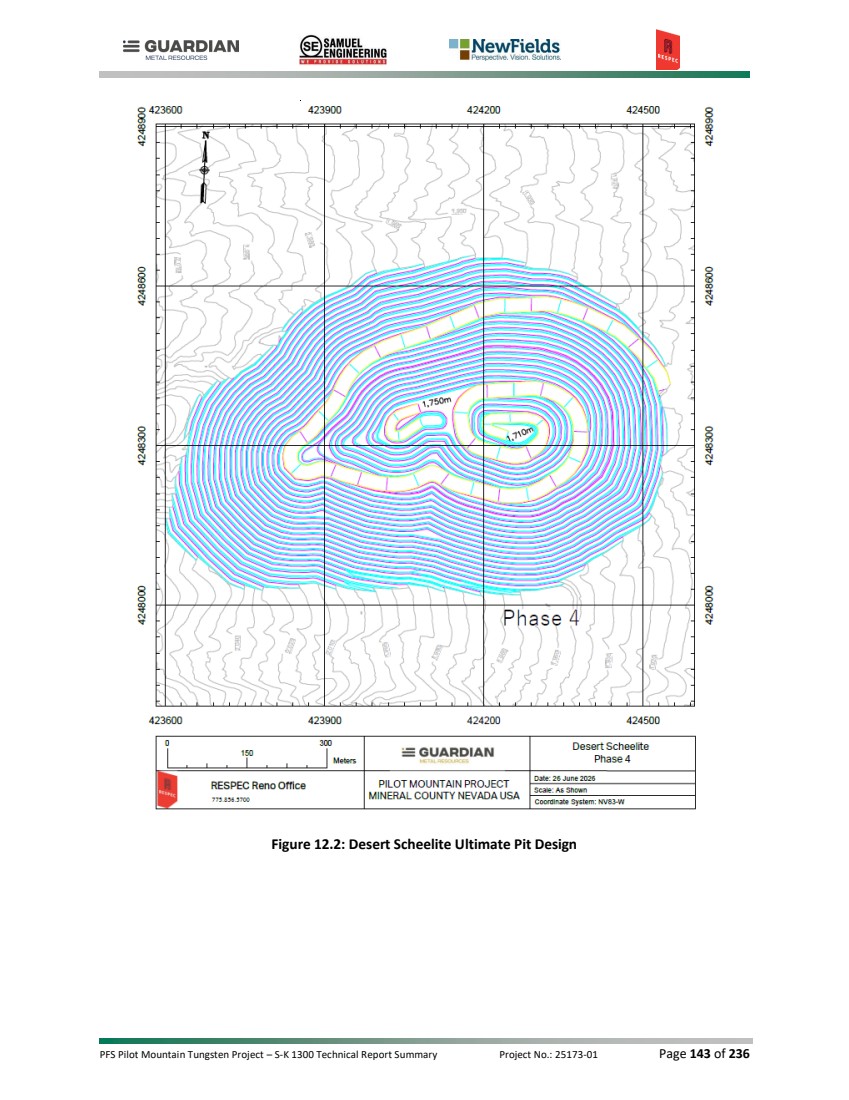
| PFS Pilot Mountain Tungsten Project – S-K 1300 Technical Report Summary Project No.: 25173-01 Page 144 of 236 Figure 12.3: Desert Scheelite Phase 1a & Phase 1 |
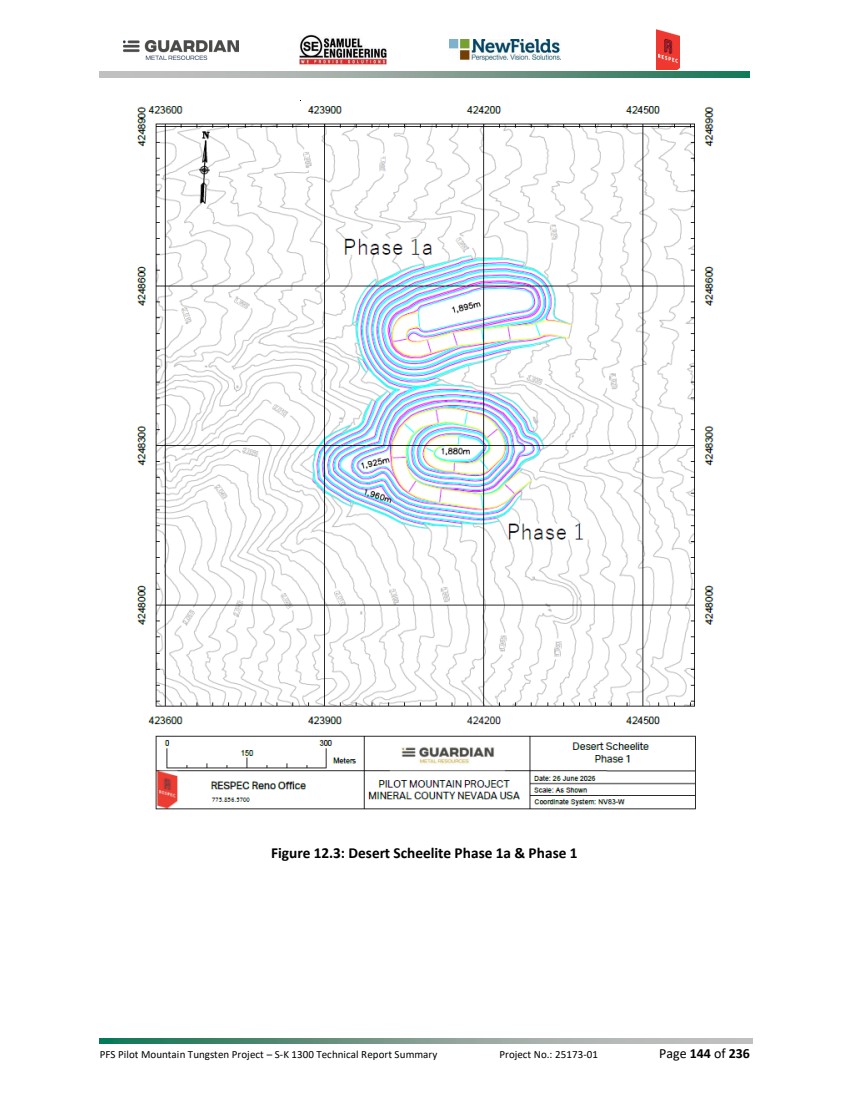
| PFS Pilot Mountain Tungsten Project – S-K 1300 Technical Report Summary Project No.: 25173-01 Page 145 of 236 Figure 12.4: Desert Scheelite Phase 2 |
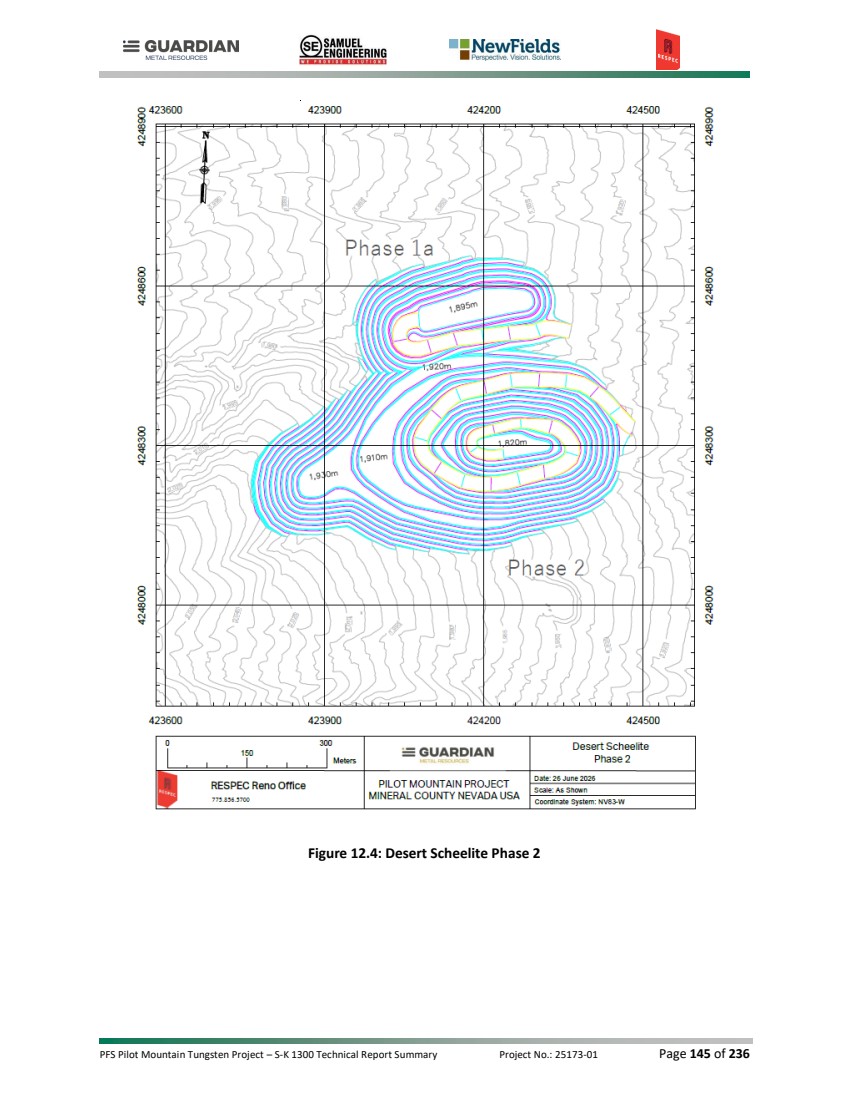
| PFS Pilot Mountain Tungsten Project – S-K 1300 Technical Report Summary Project No.: 25173-01 Page 146 of 236 Figure 12.5: Desert Scheelite Phase 3 |
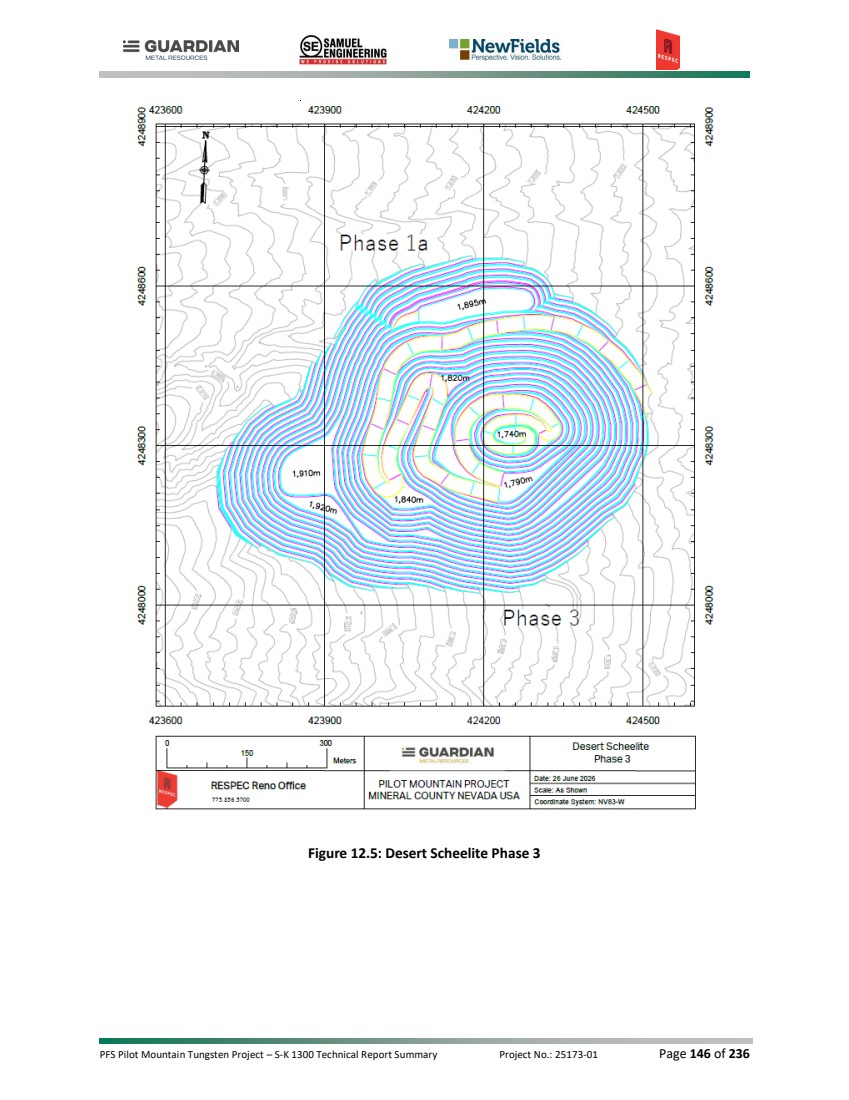
| PFS Pilot Mountain Tungsten Project – S-K 1300 Technical Report Summary Project No.: 25173-01 Page 147 of 236 Figure 12.6: Garnet Phase 1 & 2 |
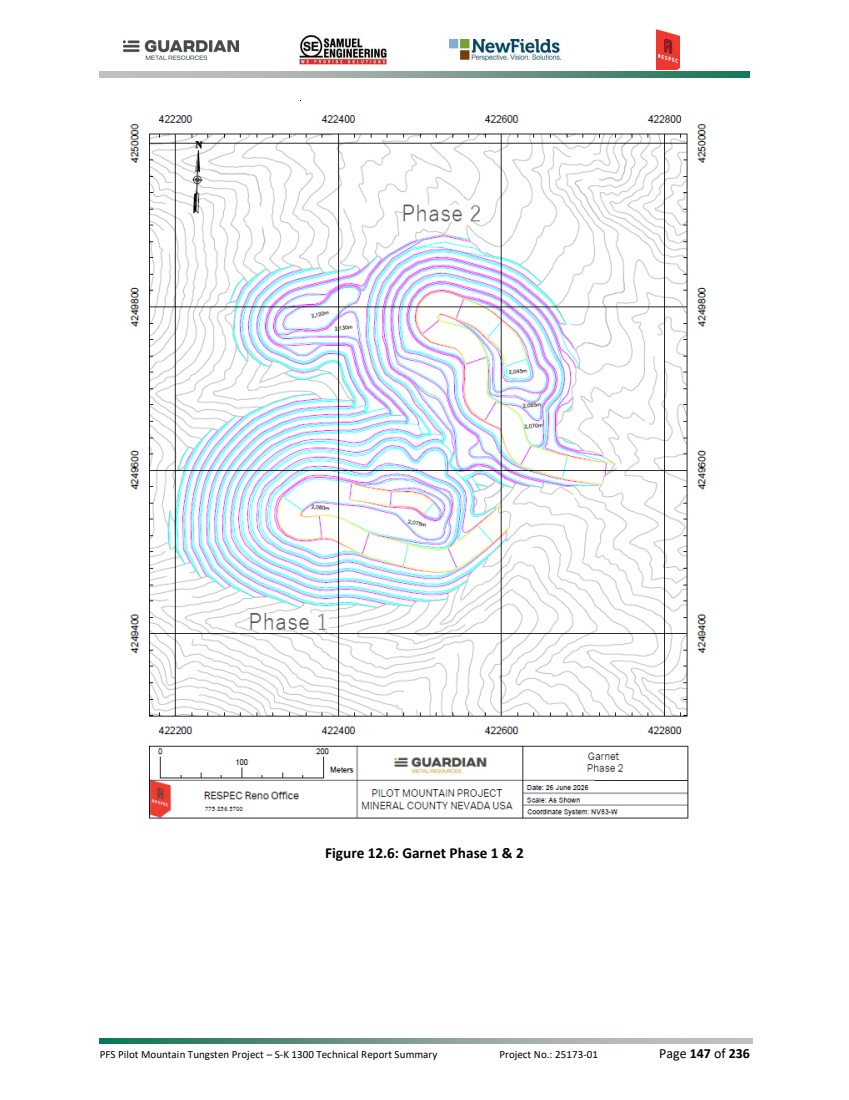
| PFS Pilot Mountain Tungsten Project – S-K 1300 Technical Report Summary Project No.: 25173-01 Page 148 of 236 12.5 PROBABLE RESERVES Mineral Reserves are defined by applying modifying factors to the Mineral Resources. The modifying factors include economic and geometrical factors to pit optimizations followed by pit designs as discussed above. In addition, production scheduling and mine costs were completed as described in Section 13 (Mining Methods). This information has been provided to Samuel Engineering who completed the financial modeling that supports the statement of Mineral Reserves. Of note, no Measured Resources were defined in the resource model. The QP used Indicated Resources within the pit designs and above the 0.040 cutoff grade as defined by the economic parameters to estimate Probable Reserves. Table 12.12 shows the Probable Reserves by phase along with waste, total tonnages, and strip ratio. Table 12.13 shows Probable Reserves for the project along with notes. Table 12.12: In-Pit Probable Reserves and Contained Waste by Phase Table 12.13: Mineral Reserves Statement Notes 1. The effective date of Desert Scheelite and Garnet Mineral Reserves is June 15,2026. 2. The point of reference for Mineral Reserves is the crusher. 3. Resource blocks were diluted to the selective mining unit (SMU), and now additional dilution was added for reporting of Reserves. The QP, RESPEC, responsible for the statement of reserves, believes that the blocks can be reasonably mined at the SMU size. Desert Scheelite SMU blocks were 5m by 2.5m by 5m in the X, Y, and Z directions, respectively. Garnet SMU blocks were 5m by 5m by 2.5m in the X, Y, and Z directions, respectively. 4. Reserves are reported based on a 0.040% WO3 cutoff grade. The cutoff grade was applied only to the WO3 grades. Silver, Tungsten, and Zinc are reported as the contained metals within the Probable material processed. 5. Rounding may result in apparent discrepancies between tonnages and contained metal totals. 6. Indicated material has been converted to Probable Reserves. The resources do not contain any Measured material, so no Proven Reserves are reported. All Inferred resources are considered as waste material. 7. Reserves are reported by RESPEC. 8. Reserves are reported based on $115,000/t WO3, $38.00/oz Ag, and $2,700/t Zn metal prices. Note that the final cashflow analysis uses a higher WO3 price. The lower price is reasonable with the reporting of reserves as RESPEC considers material below the reporting cutoff grade to be immaterial. Probable Reserves Waste Total Strip Pit Phase k Tonnes WO3% WO3 t g Ag/t K Ozs Ag Zn% Zn t k Tonnes k Tonnes Ratio Ds_Ph_1a - - - - - - - 6,250 6,250 N A Ds_Ph_1 1,935 0.233 4,508 13.09 814 0.55 10,555 6,849 6,849 3.54 Ds_Ph_2 2,535 0.173 4,383 10.72 874 0.29 7,342 18,821 18,821 7.43 Ds_Ph_3 2,806 0.159 4,457 9.14 824 0.19 5,222 43,124 43,125 15.37 Ds_Ph_4 2,462 0.180 4,420 10.49 830 0.23 5,694 37,309 37,309 15.15 Total Desert Sheelite 9,738 0.182 17,768 10.68 3,343 0.30 28,813 112,354 112,354 11.54 Gn_Ph_1 932 0.132 1,233 3.02 91 0.16 1,451 8,465 8,465 9.08 Gn_Ph_2 1,153 0.111 1,274 2.58 96 0.27 3,131 5,788 5,788 5.02 Total Garnet 2,085 0.120 2,507 2.78 186 0.22 4,583 14,252 14,253 6.84 Total Project 11,822 0.171 20,275 9.28 3,529 0.28 33,396 126,606 126,607 10.71 Probable Reserves Deposit k Tonnes WO3% WO3 t g Ag/t K Ozs Ag Zn% Zn t Desert Scheelite 9,738 0.182 17,768 10.68 3,343 0.30 28,813 Garnet 2,085 0.120 2,507 2.78 186 0.22 4,583 Total Probable 11,822 0.171 20,275 9.28 3,529 0.28 33,396 |
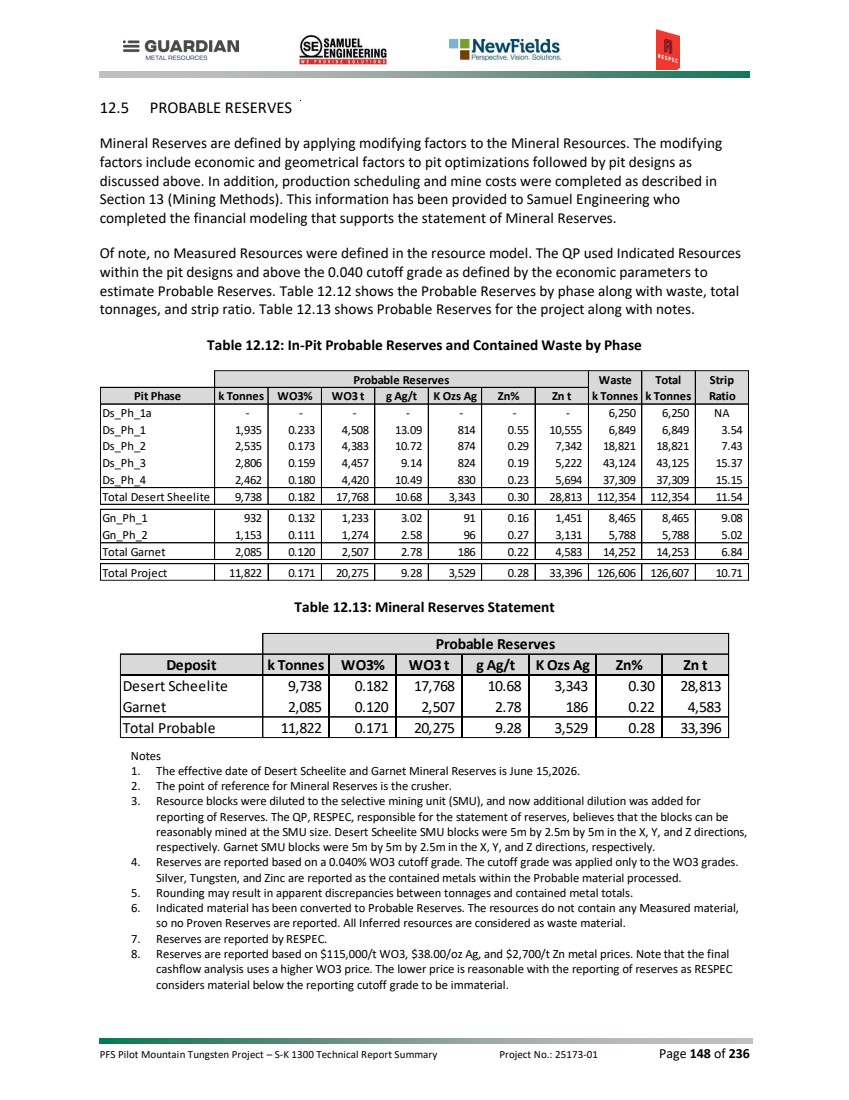
| PFS Pilot Mountain Tungsten Project – S-K 1300 Technical Report Summary Project No.: 25173-01 Page 149 of 236 13.0 MINING METHODS 13.1 INTRODUCTION The PFS presented in this report examines open-pit mining of the Pilot Mountain Tungsten project. This project consists of the Desert Scheelite and Garnet deposits, with waste material being sent to the tailings storage facility (“TSF”) to the east and a single waste rock storage facility (“WRSF”) to the north, as shown in Figure 13.1. The proposed open-pit mining method has been selected due to the near-surface nature of the deposit. Figure 13.2 to Figure 13.10 show pit development from end of year -2 through end of year 7. Figure 13.1: Pilot Mountain Project End of Mine Life |
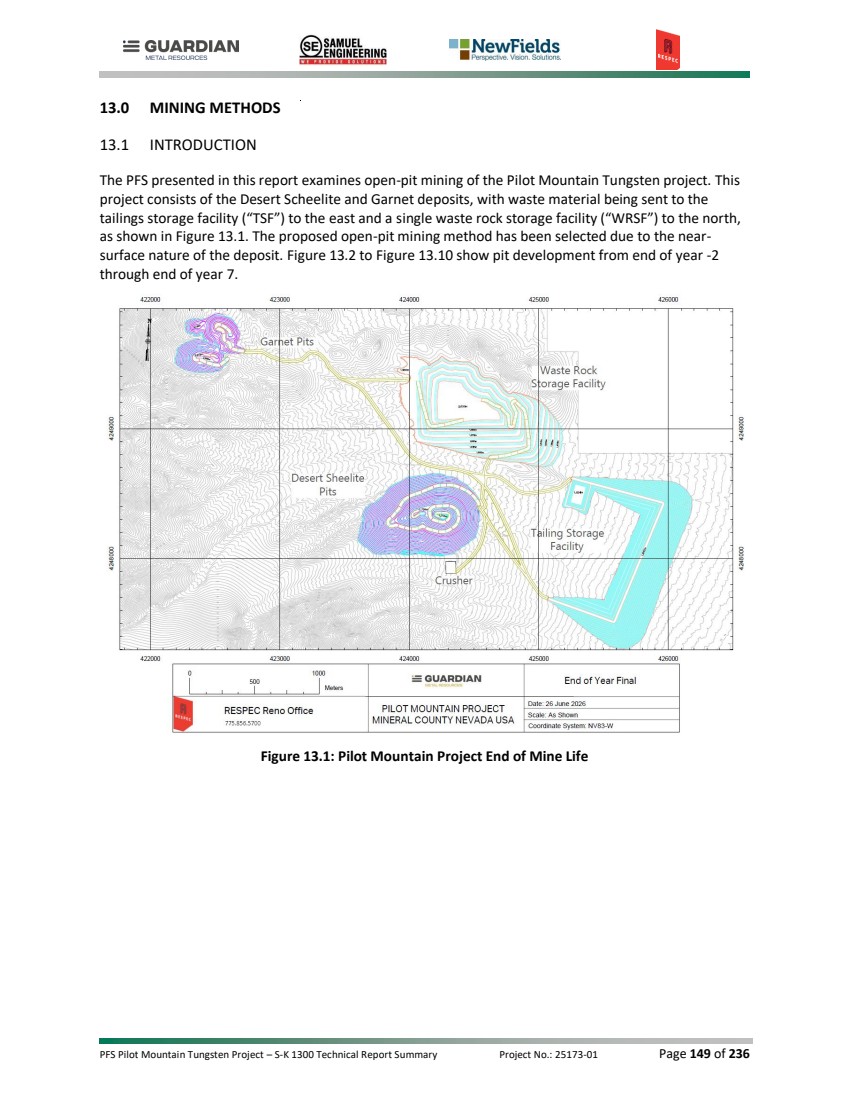
| PFS Pilot Mountain Tungsten Project – S-K 1300 Technical Report Summary Project No.: 25173-01 Page 150 of 236 Figure 13.2: Pilot Mountain Project End of Year -2 Figure 13.3: Pilot Mountain Project End of Year -1 |
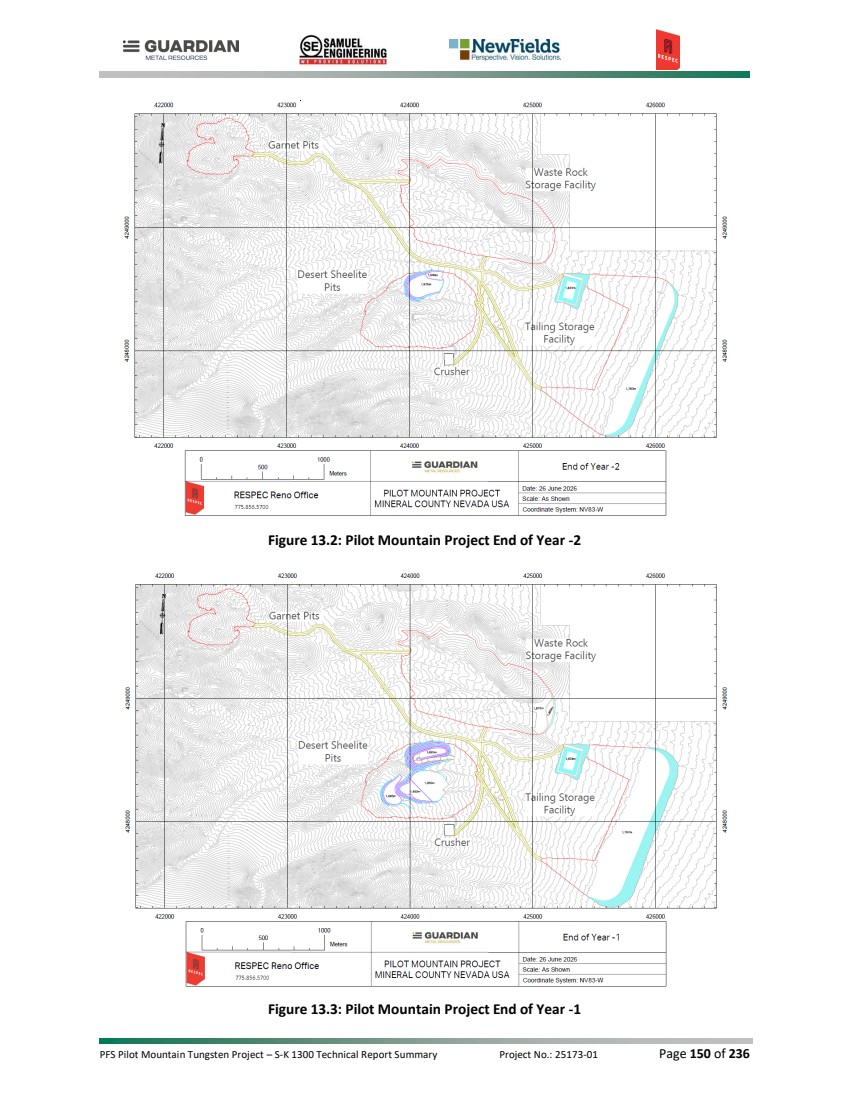
| PFS Pilot Mountain Tungsten Project – S-K 1300 Technical Report Summary Project No.: 25173-01 Page 151 of 236 Figure 13.4: Pilot Mountain Project End of Year 1 Figure 13.5: Pilot Mountain Project End of Year 2 |
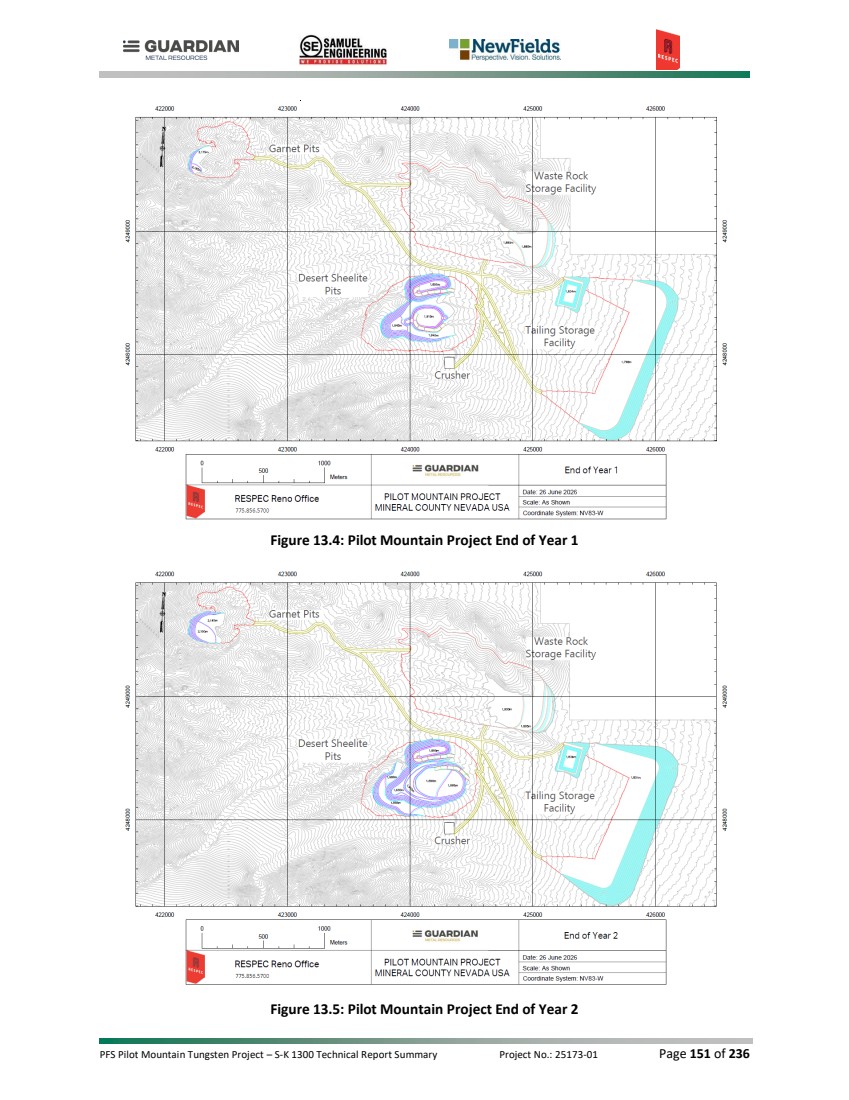
| PFS Pilot Mountain Tungsten Project – S-K 1300 Technical Report Summary Project No.: 25173-01 Page 152 of 236 Figure 13.6: Pilot Mountain Project End of Year 3 Figure 13.7: Pilot Mountain Project End of Year 4 |
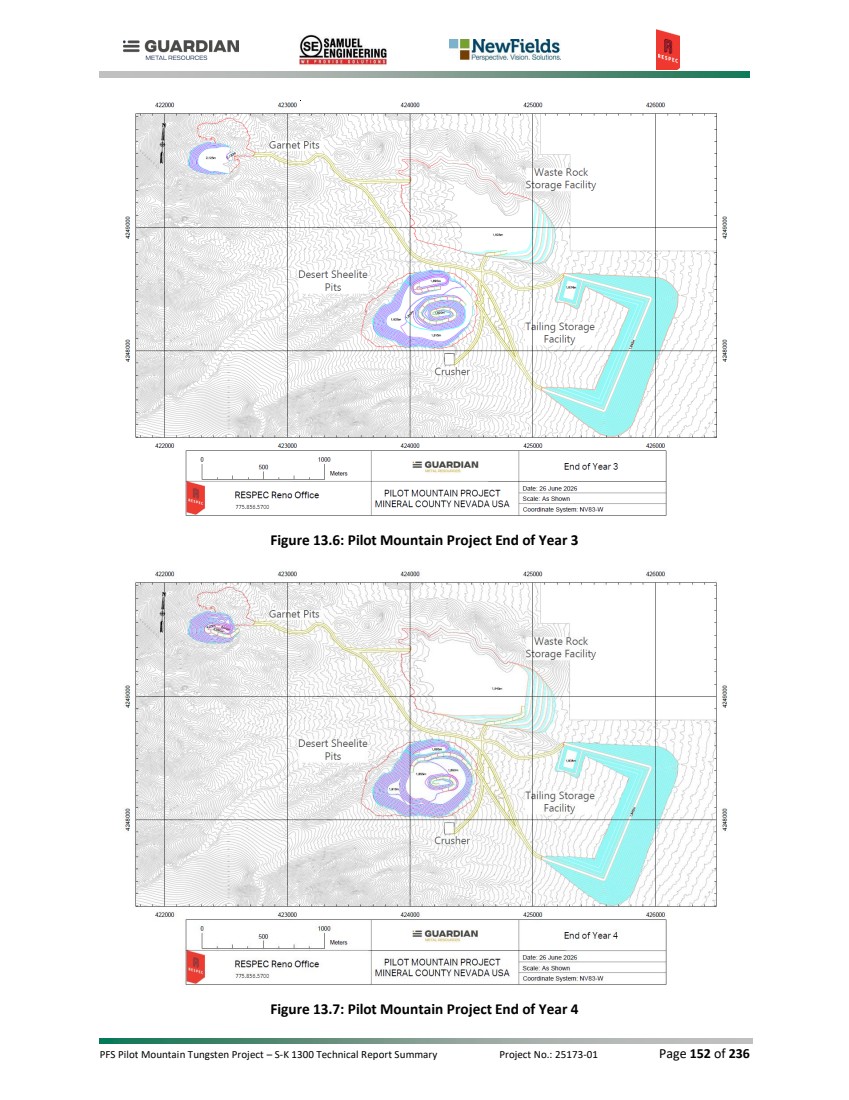
| PFS Pilot Mountain Tungsten Project – S-K 1300 Technical Report Summary Project No.: 25173-01 Page 153 of 236 Figure 13.8: Pilot Mountain Project End of Year 5 Figure 13.9: Pilot Mountain Project End of Year 6 |
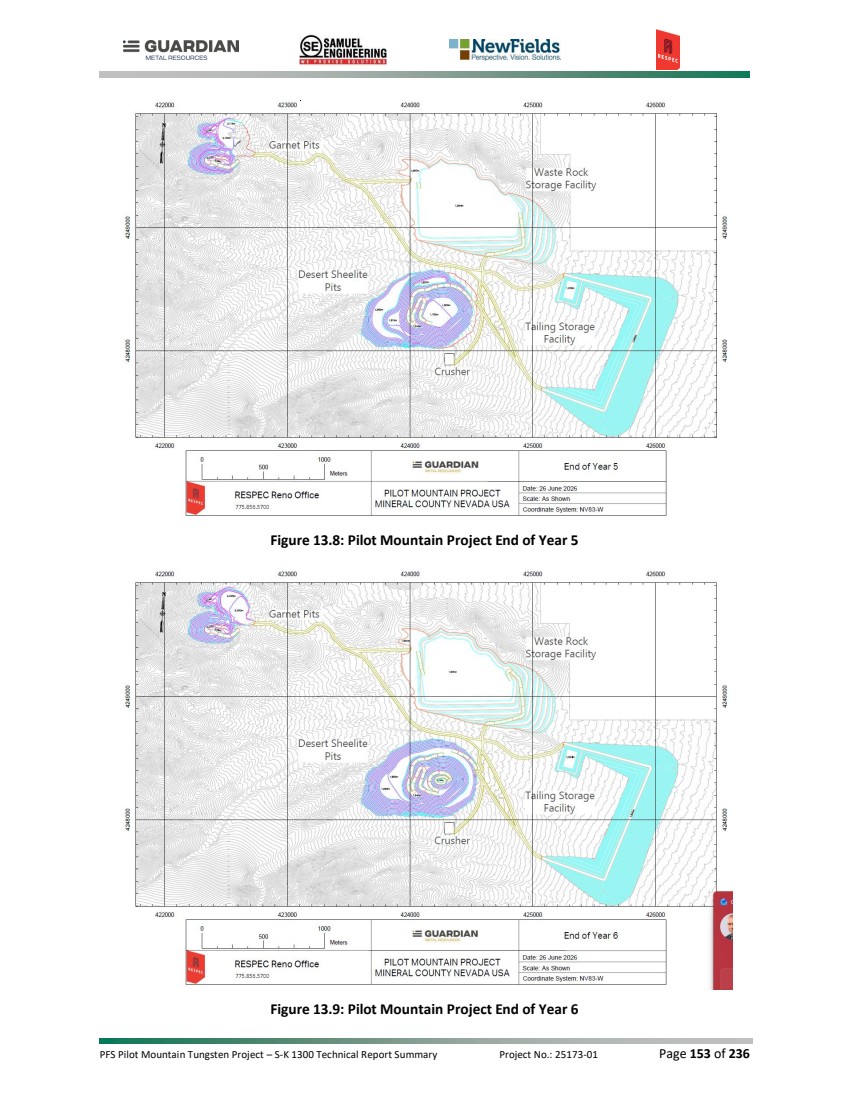
| PFS Pilot Mountain Tungsten Project – S-K 1300 Technical Report Summary Project No.: 25173-01 Page 154 of 236 Figure 13.10: Pilot Mountain Project End of Year 7 The methodology used to define the Pilot Mountain mine plan is: • Define economic and geometrical assumptions; • Run pit optimizations to determine ultimate pit limits and pit sequencing; • Define pit design parameters; • Create pit designs; • Identify waste-rock storage locations; • Create mine production schedules; and • Estimate mining costs. Details for the first 4 bullets above are described in Section 12 – Mineral Reserve Estimates. This section describes the remaining mine planning items except for mining costs, which are discussed in Section 18 – Capital and Operating Costs. 13.2 WASTE ROCK STORAGE Waste rock has been planned to be moved from the 2 deposits to either one waste rock storage facility (“WRSF”), as construction material to a tailings storage facility (“TSF”), or as backfill to one of the mined-out pits. The single WRSF located in the north (shown in Figure 13.1) has a designed capacity of 36M cubic meters of material. The design was completed to a height of 150 m. The WRSF was designed to have 3H:1V slopes to aid in final reclamation. The WRSF is planned to be constructed with 34° angle of repose dump faces and 20m catch benches installed at each 15 m lift height. |
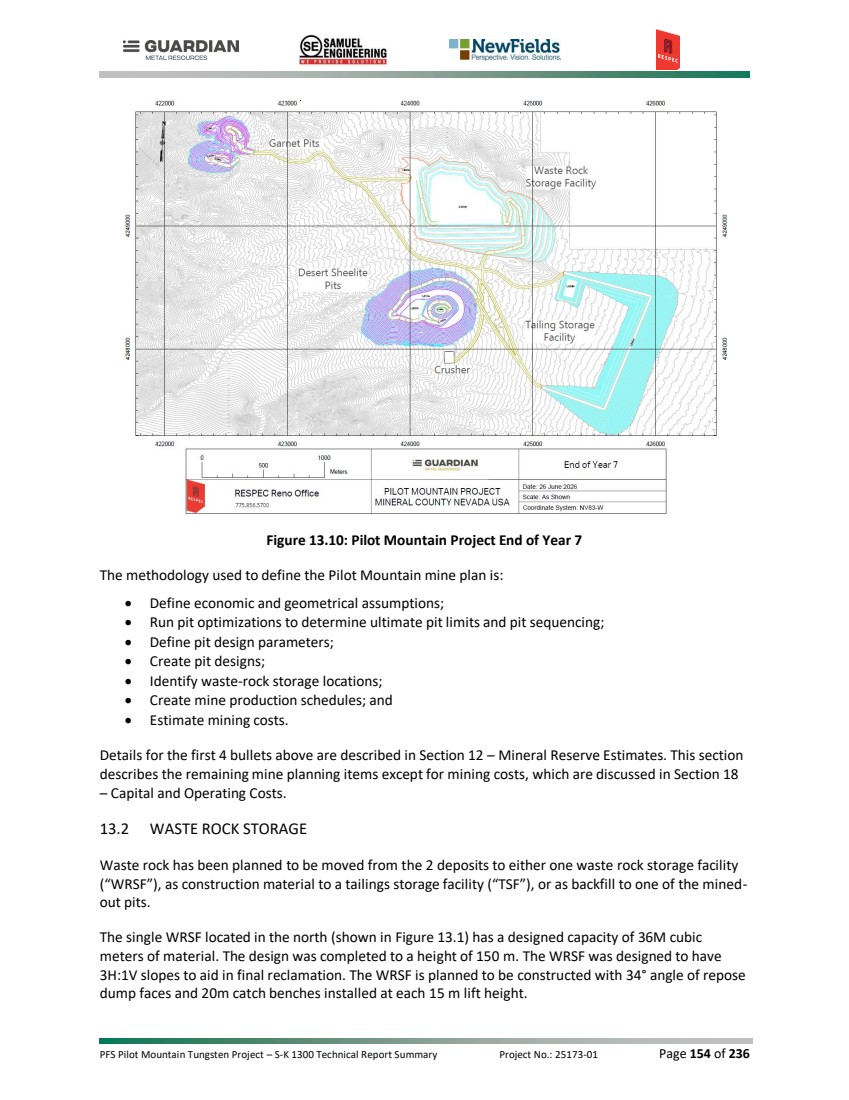
| PFS Pilot Mountain Tungsten Project – S-K 1300 Technical Report Summary Project No.: 25173-01 Page 155 of 236 The TSF is located to the east of the Scheelite ultimate pit. Initial construction is to take place with the mining of Phase 1a, which was designed specifically to create waste within the ultimate footprint for construction material needs. The TSF includes a built-in pond area, and the total material requirements are 17M cubic meters. 13.3 PRODUCTION SCHEDULE Production scheduling was completed using MineSched software (Version 2025). The production was completed by targeting ore and waste materials required for construction needs, and to maintain the process plant production capacity. Construction requirements include the material needed for roads and the TSF area (See Section 15.0). The total construction material requirement prior to plant operation totals 9.2M tonnes, which is delivered during years -2 and -1. Additional material for the TSF construction continues during years 1 through 3 for an additional 22.8M tonnes. The total TSF construction material delivered by the mine is 32.0M tonnes. The associated waste material will be hauled to either the northern WRSF or, as available, will be placed into backfill locations. The backfill locations will primarily be in the western portions of the Desert Scheelite pit and into the southern Garnet pit. The designs for the backfill will be further defined in a definitive feasibility study. The nameplate capacity for the process plant is assumed to be 4k tonnes per day or 1.46M tonnes per year. A ramp-up in production is assumed to be 10%, 30%, and 60% of the nameplate capacity in months -3, -2, and -1. The start of commercial production is assumed to be in month 1 at 90% of nameplate capacity, with full production achieved in month 2. The mining schedule assumes contract mining, and the contractor will be required to provide equipment and personnel to maintain the production schedule. Contractors were provided with the production schedule and mining costs based on contractor quotations. The mining production schedules are shown in Table 13.1 and Table 13.2 for Desert Scheelite and Garnet deposits, respectively. The combined production schedule is shown in Table 13.3. Material sent through the plant is dependent on the ore delivery schedule, as previously discussed. The process production schedule and grades of material is shown in Table 13.4. The metal production is defined by Samuel Engineering based on this material delivery schedule. Stockpiling of material will be done near the crusher. This will allow trucks to dump their loads into the stockpile when the crusher is not available to maintain efficient mining productivity. Stockpile material balances are shown in Table 13.5, with the material removed from stockpiles defining the required rehandle. |
| PFS Pilot Mountain Tungsten Project – S-K 1300 Technical Report Summary Project No.: 25173-01 Page 156 of 236 Table 13.1: Yearly Desert Scheelite Mine Production Table 13.2: Yearly Garnet Mine Production Table 13.3: Yearly Total Pilot Mountain Project Mine Production Units Yr -2 Yr -1 Yr 1 Yr 2 Yr 3 Yr 4 Yr 5 Yr 6 Yr 7 Yr 8 Yr 9 Total Total Mined K Tonnes - 454 1,576 1,125 1,692 576 1,099 1,149 850 1,218 - 9,738 Above COG WO3% - 0.265 0.186 0.160 0.196 0.153 0.162 0.177 0.166 0.198 - 0.182 WO3 t - 1,201 2,925 1,801 3,318 879 1,786 2,034 1,409 2,415 - 17,768 g Ag/t - 10.66 11.46 11.84 9.99 8.53 10.53 8.92 7.70 14.45 - 10.68 K Ozs Ag - 156 580 428 543 158 372 329 210 565 - 3,343 Zn% - 0.304 0.375 0.441 0.334 0.142 0.216 0.190 0.168 0.337 - 0.296 Zn t - 1,378 5,913 4,964 5,645 816 2,380 2,180 1,432 4,107 - 28,813 Pond K Tonnes 296 - - - - - - - - - - 296 TSF K Tonnes 2,297 6,570 5,645 11,781 5,369 - - - - - - 31,662 WRSF K Tonnes - 616 1,748 377 9,760 17,389 18,419 12,678 13,140 6,269 - 80,396 Required Backfill K Tonnes - - - - - - - 2,513 13,140 6,269 - 21,922 Total Waste K Tonnes 2,592 7,186 7,393 12,158 15,130 17,389 18,419 15,191 26,280 12,538 - 134,275 Total Mined K Tonnes 2,592 7,639 8,969 13,283 16,822 17,965 19,518 16,340 27,130 13,756 - 144,013 Strip Ratio O:W NA 15.84 4.69 10.81 8.94 30.20 16.75 13.22 30.90 10.30 13.79 Units Yr -2 Yr -1 Yr 1 Yr 2 Yr 3 Yr 4 Yr 5 Yr 6 Yr 7 Yr 8 Yr 9 Total Total Mined K Tonnes - - - 36 188 705 221 418 517 - - 2,085 Above COG WO3% - - - 0.149 0.118 0.136 0.119 0.113 0.105 - - 0.120 WO3 t - - - 53 221 957 263 471 542 - - 2,507 g Ag/t - - - 0.37 0.46 3.85 2.28 3.51 1.95 - - 2.78 K Ozs Ag - - - 0 3 87 16 47 32 - - 186 Zn% - - - 0.039 0.043 0.192 0.167 0.338 0.261 - - 0.220 Zn t - - - 14 81 1,355 370 1,414 1,349 - - 4,583 Pond K Tonnes - - - - - - - - - - - - TSF K Tonnes - - - - - - - - - - - - WRSF K Tonnes - - 636 2,222 2,311 3,291 1,850 1,640 - - - 11,950 Required Backfill K Tonnes - - - - - - - 540 1,762 - - 2,302 Total Waste K Tonnes - - 636 2,222 2,311 3,291 1,850 2,180 1,762 - - 14,252 Total Mined K Tonnes - - 636 2,257 2,498 3,995 2,072 2,598 2,280 - - 16,337 Strip Ratio O:W NA 62.21 12.32 4.67 8.37 5.21 3.41 6.84 Units Yr -2 Yr -1 Yr 1 Yr 2 Yr 3 Yr 4 Yr 5 Yr 6 Yr 7 Yr 8 Yr 9 Total Total Mined K Tonnes - 454 1,576 1,160 1,880 1,280 1,321 1,567 1,368 1,218 - 11,822 Above COG WO3% - 0.265 0.186 0.160 0.188 0.143 0.155 0.160 0.143 0.198 - 0.171 WO3 t - 1,201 2,925 1,854 3,539 1,836 2,049 2,505 1,951 2,415 - 20,275 g Ag/t - 10.66 11.46 11.48 9.04 5.96 9.15 7.48 5.52 14.45 - 9.28 K Ozs Ag - 156 580 428 546 245 388 377 243 565 - 3,529 Zn% - 0.304 0.375 0.429 0.305 0.170 0.208 0.229 0.203 0.337 - 0.282 Zn t - 1,378 5,913 4,978 5,726 2,171 2,749 3,594 2,781 4,107 - 33,396 Pond K Tonnes 296 - - - - - - - - - - 296 TSF K Tonnes 2,297 6,570 5,645 11,781 5,369 - - - - - - 31,662 WRSF K Tonnes - 616 2,384 2,599 12,071 20,680 20,269 14,318 13,140 6,269 - 92,346 Required Backfill K Tonnes - - - - - - - 3,053 14,902 6,269 - 24,224 Total Waste K Tonnes 2,592 7,186 8,029 14,380 17,440 20,680 20,269 17,371 28,042 12,538 - 148,528 Total Mined K Tonnes 2,592 7,639 9,605 15,540 19,320 21,960 21,590 18,938 29,410 13,756 - 160,350 Strip Ratio O:W NA 15.84 5.10 12.39 9.28 16.15 15.35 11.08 20.50 10.30 12.56 |
| PFS Pilot Mountain Tungsten Project – S-K 1300 Technical Report Summary Project No.: 25173-01 Page 157 of 236 Table 13.4: Process Material Delivery Summary Table 13.5: Stockpile Balance Summary 13.4 EQUIPMENT & PERSONNEL REQUIREMENTS Equipment and contractor personnel will be the responsibility of the mining contractor. Within the contractor quotations, they have specified the use of CAT 992 type loaders with 91-tonne (100-ton) type of rigid haul trucks. RESPEC has estimated the required yearly equipment and personnel based on the productivity estimated for the CAT 992 and 91t loader/truck match. This estimate assumes 24-hour per day operations with 21 operating hours per day and 50minutes of production time per 60-minute hour. Units Yr -2 Yr -1 Yr 1 Yr 2 Yr 3 Yr 4 Yr 5 Yr 6 Yr 7 Yr 8 Yr 9 Yr 10 Total Oxide K Tonnes - 123 1,448 1,283 492 109 47 37 11 1 0 - 3,551 WO3% - 0.414 0.227 0.139 0.141 0.094 0.097 0.105 0.091 0.083 0.083 - 0.182 WO3 t - 508 3,285 1,780 696 103 46 38 10 1 0 - 6,468 g Ag/t - 19.16 12.57 10.69 7.20 4.23 2.56 3.03 3.21 2.90 2.90 - 10.85 K Ozs Ag - 76 585 441 114 15 4 4 1 0 0 - 1,239 Zn% - 0.568 0.421 0.375 0.291 0.093 0.056 0.086 0.134 0.124 0.124 - 0.372 Zn t - 697 6,090 4,814 1,431 102 27 31 15 1 0 - 13,209 Transition K Tonnes - - - 31 77 357 240 296 524 112 2 - 1,639 WO3% - - - 0.161 0.134 0.139 0.115 0.124 0.102 0.079 0.079 - 0.117 WO3 t - - - 49 103 496 275 367 536 89 2 - 1,916 g Ag/t - - - 0.35 0.50 2.75 2.77 3.74 2.03 2.24 2.24 - 2.52 K Ozs Ag - - - 0 1 32 21 36 34 8 0 - 133 Zn% - - - 0.038 0.049 0.153 0.162 0.341 0.272 0.196 0.196 - 0.223 Zn t - - - 12 38 546 389 1,011 1,427 221 4 - 3,649 Sulfide K Tonnes - - - 147 891 998 1,173 1,127 924 1,350 22 - 6,633 WO3% - - - 0.164 0.255 0.151 0.157 0.178 0.160 0.186 0.076 - 0.179 WO3 t - - - 241 2,274 1,506 1,846 2,010 1,482 2,517 17 - 11,892 g Ag/t - - - 7.79 12.05 8.16 9.93 9.22 7.49 13.36 4.18 - 10.12 K Ozs Ag - - - 37 345 262 374 334 223 580 3 - 2,158 Zn% - - - 0.309 0.400 0.188 0.216 0.203 0.167 0.314 0.158 - 0.249 Zn t - - - 453 3,565 1,877 2,532 2,291 1,540 4,245 35 - 16,538 Total Project K Tonnes - 123 1,448 1,460 1,460 1,464 1,460 1,460 1,460 1,464 24 - 11,822 WO3% - 0.414 0.227 0.142 0.210 0.144 0.148 0.165 0.139 0.178 0.076 - 0.171 WO3 t - 508 3,285 2,070 3,073 2,104 2,167 2,415 2,028 2,607 18 - 20,275 g Ag/t - 19.16 12.57 10.18 9.80 6.55 8.51 7.95 5.50 12.50 4.01 - 9.28 K Ozs Ag - 76 585 478 460 308 400 373 258 588 3 - 3,529 Zn% - 0.568 0.421 0.362 0.345 0.172 0.202 0.228 0.204 0.305 0.161 - 0.282 Zn t - 697 6,090 5,278 5,034 2,525 2,948 3,334 2,983 4,467 39 - 33,396 Units Yr -2 Yr -1 Yr 1 Yr 2 Yr 3 Yr 4 Yr 5 Yr 6 Yr 7 Yr 8 Yr 9 Yr 10 Added K Tonnes - 403 379 195 526 319 130 198 60 0 - - WO3% - 0.259 0.076 0.100 0.104 0.080 0.080 0.082 0.079 0.076 - - WO3 t - 1,047 289 195 546 257 104 163 48 0 - - g Ag/t - 9.66 5.36 7.07 6.01 3.79 4.54 4.30 3.03 4.28 - - K Ozs Ag - 125 65 44 102 39 19 27 6 0 - - Zn% - 0.237 0.105 0.282 0.152 0.141 0.122 0.227 0.171 0.159 - - Zn t - 958 397 550 799 450 159 450 103 0 - - Removed K Tonnes - 73 251 495 107 503 270 91 152 246 24 - WO3% - 0.488 0.259 0.083 0.073 0.105 0.080 0.080 0.080 0.080 0.080 - WO3 t - 354 650 410 78 530 215 73 122 197 19 - g Ag/t - 19.47 9.36 5.53 5.07 5.93 4.29 4.28 4.21 4.05 4.05 - K Ozs Ag - 45 76 88 17 96 37 13 21 32 3 - Zn% - 0.383 0.250 0.161 0.128 0.151 0.142 0.166 0.174 0.174 0.174 - Zn t - 278 628 795 137 757 384 152 266 428 42 - Balance K Tonnes - 331 459 159 579 395 256 363 271 24 - - WO3% - 0.209 0.072 0.073 0.101 0.079 0.078 0.080 0.080 0.080 - - WO3 t - 692 331 116 585 312 201 291 217 19 - - g Ag/t - 7.51 4.72 5.07 5.93 4.20 4.28 4.29 4.05 4.05 - - K Ozs Ag - 80 70 26 110 53 35 50 35 3 - - Zn% - 0.206 0.098 0.128 0.150 0.142 0.131 0.174 0.174 0.174 - - Zn t - 680 450 204 866 559 335 633 470 42 - - |
| PFS Pilot Mountain Tungsten Project – S-K 1300 Technical Report Summary Project No.: 25173-01 Page 158 of 236 Drill requirements are based on 1.5 drills per loader, and haul truck requirements used are 4 trucks per loader. These are reasonable factors and correspond to the amount of equipment that the contractors have proposed in their quotations. Support and blasting equipment are assumed based on the same contractor quotations. Total equipment requirements are shown in Table 13.6. Note that the actual amount of equipment will be the responsibility of the mining contractor. This estimate has only been completed to show the general amount of equipment and personnel that will be required for the mine production. Table 13.6: Equipment Requirements Personnel requirements have been estimated based on the contractor's equipment and the mine general personnel required to operate the mine. The personnel requirements are shown in Table 13.7. This shows both the contractor and the owner mining personnel. The contractor personnel include operators, blasters, maintenance, and labor, along with foreman or management. Owner personnel include a mine superintendent along with surveying, engineering, and geological personnel. The peak contractor requirements are anticipated to be 153 people based on 4 shifts, with 2 shifts operating 24 hours per day and rotating on a 4-day on/4-day off rotation with the other 2 shifts. Owner personnel will work 4 days per week, with the surveyors working with an overlap day to provide 7-day per week coverage. In a similar manner, the ore control geologist will work with the sampler to ensure that blast hole samples are gathered, labeled, and submitted to labs in a timely manner. The Chief Mining Engineer will work opposite the Mine Superintendent as needed to provide 7-day per week coverage for management of mining activities. The Mining Engineer is expected to work with the surveyors to backfill surveying needs as well as assist the Chief Mining Engineer with mine planning responsibilities. Ore control functions are to be shared between the geology and engineering staff. Primary Equipment Units Yr -2 Yr -1 Yr 1 Yr 2 Yr 3 Yr 4 Yr 5 Yr 6 Yr 7 Yr 8 Yr 9 Yr 10 Max Production Drills # 2 2 2 2 3 3 3 3 3 2 - - 3 Loader # 2 2 2 3 4 4 4 4 4 3 1 - 4 Haul Trucks # 8 8 8 12 16 16 16 16 16 12 4 - 16 Support Equipment Water Truck # 2 2 2 2 2 2 2 2 2 2 1 - 2 D10 Dozer # 2 2 2 2 2 2 2 2 2 2 - - 2 D8 Dozer # 1 1 1 1 1 1 1 1 1 1 1 - 1 Motor Grader (16') # 2 2 2 2 2 2 2 2 2 2 1 - 2 Pit Pumps # 2 2 2 2 2 2 2 2 2 2 - - 2 Blasting Skid Loader # 1 1 1 1 1 1 1 1 1 1 - - 1 Explosives Truck # 1 1 1 1 1 1 1 1 1 1 - - 1 Mine Maintenance Lube/Fuel # 1 1 1 1 1 1 1 1 1 1 - - 1 Service Truck # 1 1 1 1 1 1 1 1 1 1 - - 1 Tire Truck # 1 1 1 1 1 1 1 1 1 1 - - 1 Other Equipment Light Plants # 4 4 4 4 4 4 4 4 4 4 - - 4 |
| PFS Pilot Mountain Tungsten Project – S-K 1300 Technical Report Summary Project No.: 25173-01 Page 159 of 236 Table 13.7: Personnel Requirements Contractor Personnel Units Yr -2 Yr -1 Yr 1 Yr 2 Yr 3 Yr 4 Yr 5 Yr 6 Yr 7 Yr 8 Yr 9 Yr 10 Max Drill Operators # 8 8 8 8 12 12 12 12 12 8 - - 12 Loader Operators # 8 8 8 12 16 16 16 16 16 12 4 - 16 Haul Truck Drivers # 32 32 32 48 64 64 64 64 64 48 16 - 64 Support Operators # 2 2 2 2 2 2 2 2 2 2 1 - 2 Blasting Crew # 4 4 4 4 4 4 4 4 4 4 - - 4 Maintenance # 25 25 25 35 47 47 47 47 47 35 11 - 47 Foremen # 4 4 4 4 4 4 4 4 4 4 4 - 4 Laborers # 4 4 4 4 4 4 4 4 4 4 4 - 4 Contractor Personnel # 87 87 87 117 153 153 153 153 153 117 40 - 153 Owner Mine Personnel Units Yr -2 Yr -1 Yr 1 Yr 2 Yr 3 Yr 4 Yr 5 Yr 6 Yr 7 Yr 8 Yr 9 Yr 10 Max Mine Superintendent # 1 1 1 1 1 1 1 1 1 1 1 - 1 Mine Clerk # 1 1 1 1 1 1 1 1 1 1 - - 1 Chief Mine Engineer # 1 1 1 1 1 1 1 1 1 1 1 - 1 Mine Engineer # 1 1 1 1 1 1 1 1 1 1 - - 1 Chief Surveyor # 1 1 1 1 1 1 1 1 1 1 1 - 1 Surveyor # 1 1 1 1 1 1 1 1 1 1 - - 1 Chief Geologist # 1 1 1 1 1 1 1 1 1 1 1 - 1 Ore Control Geologist # 1 1 1 1 1 1 1 1 1 1 1 - 1 Samplers # 1 1 1 1 1 1 1 1 1 1 - - 1 Total Owner Personnel # 9 9 9 9 9 9 9 9 9 9 5 - 9 Total Mine Personnel # 96 96 96 126 162 162 162 162 162 126 45 - 162 |
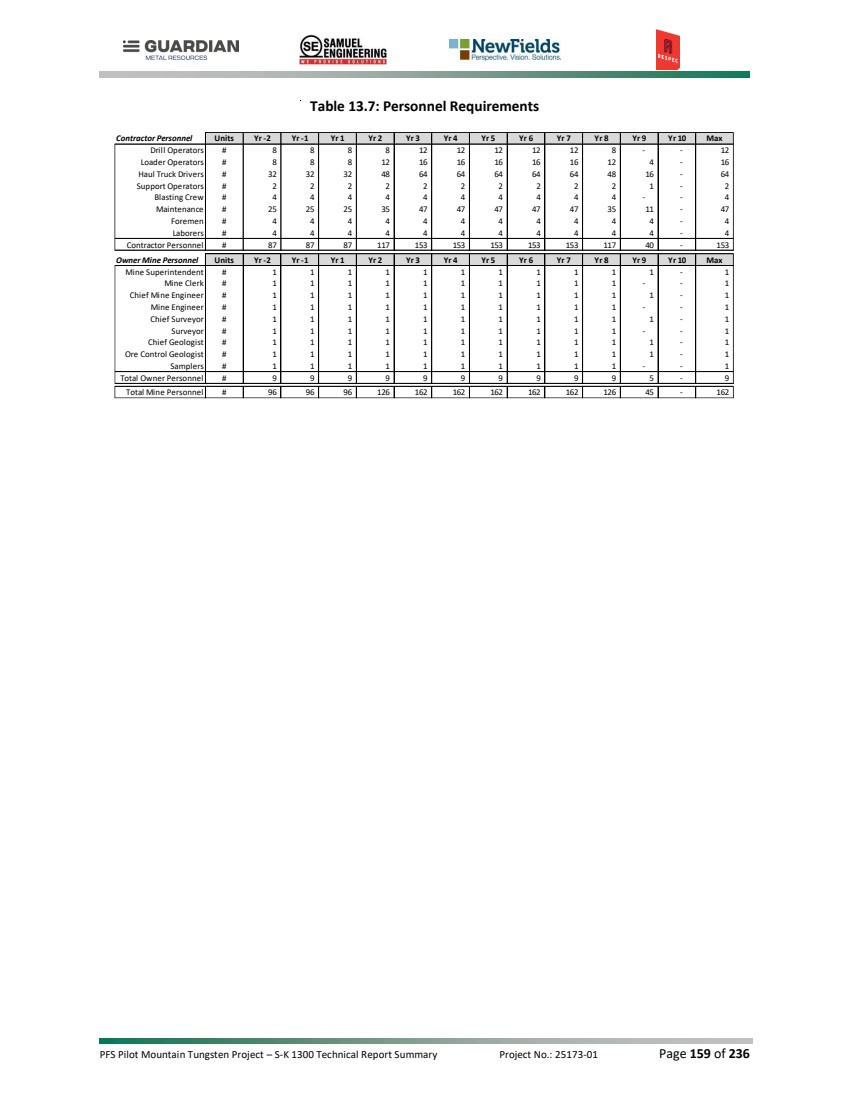
| PFS Pilot Mountain Tungsten Project – S-K 1300 Technical Report Summary Project No.: 25173-01 Page 160 of 236 14.0 PROCESSING AND RECOVERY METHODS 14.1 INTRODUCTION The Pilot Mountain processing plant is designed to process 4,000 mtpd of run-of-mine (ROM) ore from the open pit mine and concentrate it to create a tungsten concentrate. The processing facility and unit operations therein are designed to produce a 50% WO3 concentrate. The facility is also designed to produce a secondary sulfide concentrate to recover available zinc, copper, and silver. The process facilities will consist of a ROM crushing circuit, primary rod mill, secondary ball mill, sulfide flotation, rougher tungsten flotation, cleaner tungsten flotation; to liberate, recover, and upgrade the tungsten from the ROM ore. Flotation concentrate from both the sulfide and tungsten circuits will be thickened, filtered, and packaged in a concentrate loadout for shipping. Tailings from the process will be thickened and pumped to a geomembrane-lined tailings storage facility (TSF). The process plant will consist of the following unit operations: • Crushing circuit with primary jaw crusher and secondary cone crusher. • Grinding circuit with open circuit rod mill and ball mill in closed circuit with classification screens. • Sulfide flotation which includes rougher flotation, thickening, and three stages of cleaner flotation. • Tungsten flotation which includes rougher flotation, thickening, cleaner heating/conditioning, and a cleaner flotation column. • Sulfide concentrate handling, which includes thickening, filtration and concentrate packaging. • Tungsten concentrate handling which includes thickening, filtration and concentrate packaging. • Tailings handling which includes thickening, tails pumping, tailings storage facility, and water reclamation. • Utilities which includes fresh water, sulfide process water, oxide process water, air systems, and the hot oil system. • Reagent handling. 14.2 PROCESS PLANT DESIGN 14.2.1 Major Design Criteria The processing facilities are designed to process 4,000 mtpd, equivalent to 1,460,000 mtpy. The major design criteria used in the design are outlined in Table 14.1. Table 14.1: Major Design Criteria Criteria Unit Value Operating Days per Year day/y 365 Plant Availability (Crushing) % 75.0 Plant Availability (Concentrate) % 92.0 Mine Life Y 10 Daily Dry ROM Feed Stpd 4,000 Annual Dry ROM Feed Stpy 1,460,000 Tungsten Feed Assay % WO3 0.171 |
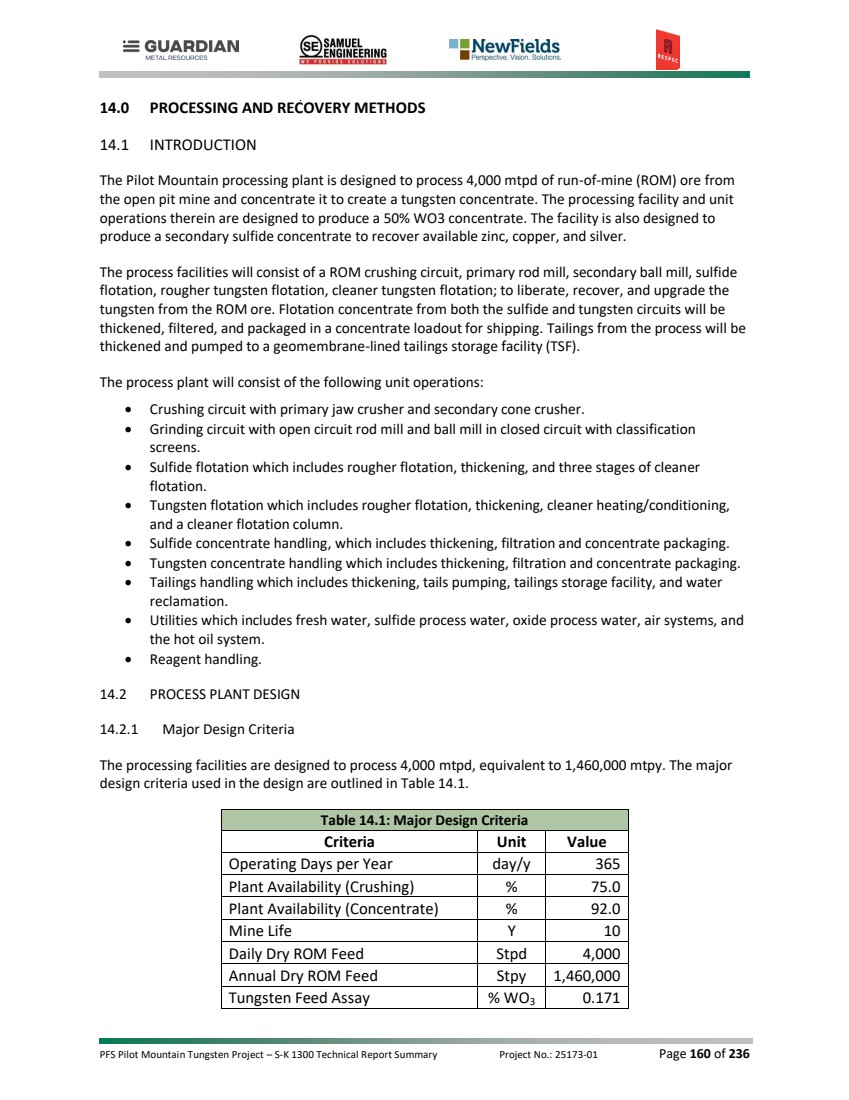
| PFS Pilot Mountain Tungsten Project – S-K 1300 Technical Report Summary Project No.: 25173-01 Page 161 of 236 Table 14.1: Major Design Criteria Criteria Unit Value Annual Dry Concentrate Production Stpy 61,063 Tungsten Concentrate % WO3 50.0 Tungsten Recovery % 78.5 The processing plant will be designed to operate based on two 12-hour shifts per day, 365 days per year. The crushing circuit availability is expected to be 75% throughout the life-of-mine (LOM). The comminution and flotation circuit availabilities are expected to be 92% throughout the LOM. This will allow sufficient downtime for scheduled and unscheduled maintenance of process plant equipment. Major scheduled maintenance commonly requires five consecutive days and occurs once per year. The remaining 24.2 operating days per year, allocated to maintenance, reflect a combination of minor scheduled maintenance and unscheduled maintenance. 14.3 PROCESS PLANT DESCRIPTION 14.3.1 Crushing Circuit Ore from the open pit will be delivered by haul trucks (or loader) to a dump hopper where an apron feeder will feed the ore across a vibrating grizzly where the fine material will fall through to a discharge conveyor and the oversize will report to the jaw crusher. Discharge from the jaw crusher will report to the same discharge conveyor to be conveyed to the secondary cone crusher. Ore from the primary crusher will be conveyed to the secondary crusher where the ore will be further crushed to a final crushed size of P80 30 mm. The secondary crusher will operate in open circuit with the discharge being conveyed to a crushed ore stockpile. The crushed ore stockpile will have a nominal live ore capacity of 2,000 mt (12 hours) and a total capacity of 10,000 mt (2-1/2 days). Ore from the crushed ore stockpile will be reclaimed under controlled feed rate conditions using apron feeders. These feeders will discharge the reclaimed ore onto a conveyor belt feeding the rod mill. A belt scale will control the feed to the rod mill by controlling the rate at which the apron feeders operate. The crushing circuit will include the following major equipment: • Apron feeder, 1.2 m x 8.8 m • Grizzly Feeder • Primary jaw crusher, 1,200 mm x 870 mm • Secondary crusher, 940-mm diameter • Transfer conveyors, 900 mm • Stockpile reclaim apron feeders, 600 mm x 1,500 mm 14.3.2 Grinding Circuit The grinding circuit will be a comminution circuit with a rod mill in series with a ball mill. It will be a two-stage operation with the rod mill in open circuit and the ball mill in closed circuit with the classification |
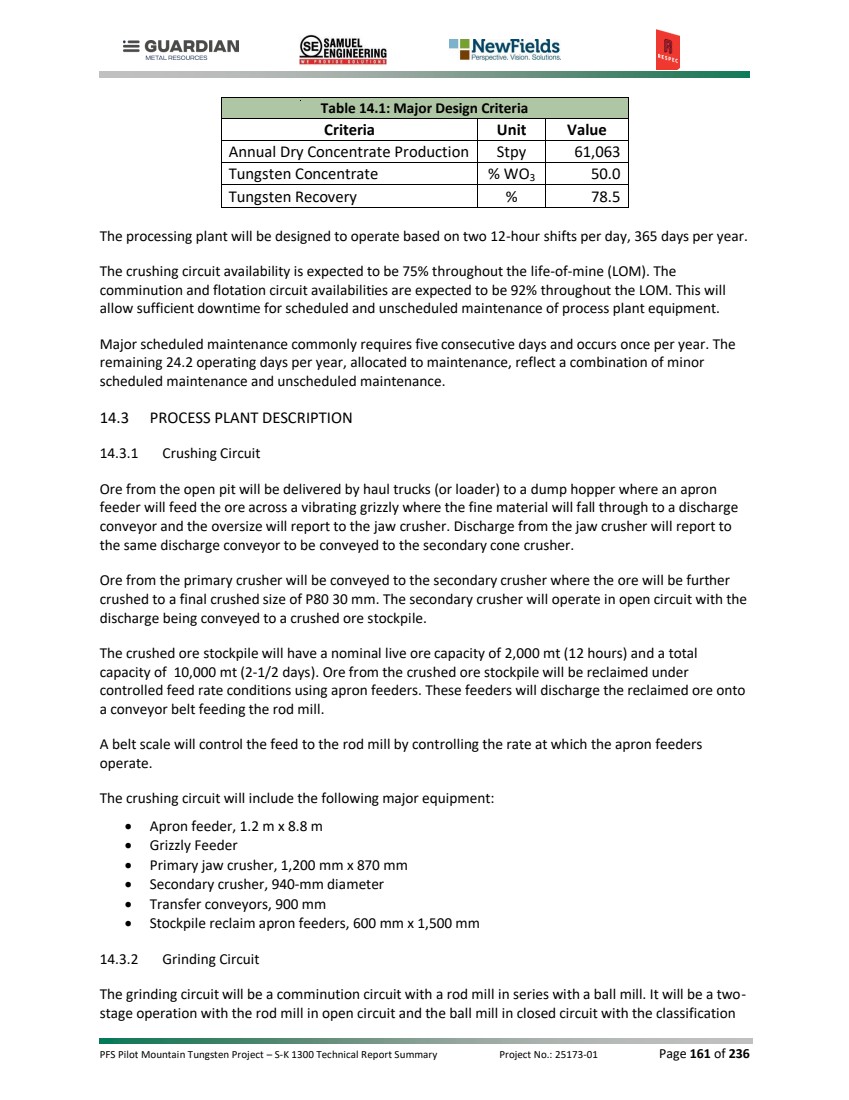
| PFS Pilot Mountain Tungsten Project – S-K 1300 Technical Report Summary Project No.: 25173-01 Page 162 of 236 screens. Grinding will be conducted as a wet process at a nominal rate of 181 mtph of material (dry basis). The grinding circuit is designed to produce a final grind size of P80 90 µm. The grinding circuit will include the following major equipment: • Rod mill feed conveyors, 900 mm • Rod mill, 4.6m dia x 6.1m EGL • Ball mill, 4.7m dia x 7.05m EGL • Ball mill classification screens, 3 x 10 deck fine ore screens Crushed ore reclaimed from the stockpiles will be fed at a controlled rate to the rod mill. Water will be added to the rod mill feed for wet grinding of the ore. The rod mill will generally operate at 68% of theoretical critical speed. The product from the discharge of the rod mill will report to the mill pump box where it will be combined with the ball mill discharge. The ball mill, subsequent to the rod mill, will operate in closed-circuit with classification screens. The product from the ball mills will be discharged into the mill sump pump box, combining with the rod mill discharge to become the mill screen feed. Classification size for the screens will be a P80 of 90 µm, and the circulating load to the ball mills will be targeted at 250% with the screen oversize returning to the ball mill as feed material. Dilution water will be added to the grinding circuit as required. Screen undersize from the classification screens will enter the feed of the sulfide rougher circuit. The pulp density of the screen undersize is estimated at 25% solids. Grinding media will regularly be added to the rod and ball mills to maintain charge level and grinding efficiency. Steel rods and balls will be added to each mill manually. 14.3.3 Sulfide Flotation Milled slurry from the grinding circuit will be processed by froth flotation to remove sulfide material from the main process stream. Sulfides are removed from the process stream for multiple reasons: to remove the sulfide as a potential diluent in the tungsten concentrate, to segregate sulfides in the tailings to eliminate the possibility of acid generation in the TSF, and to recover secondary metals, silver/zinc/copper, as a potential revenue stream. The sulfide flotation circuit will include the following major equipment: • Sulfide rougher feed tank, 180 m³ • Sulfide rougher flotation cells, 5 x 100 m³ • Sulfide 1st cleaner flotation cells, 2 x 1.5 m³ • Sulfide 2nd cleaner flotation cells, 2 x 0.5 m³ • Sulfide 3rd cleaner flotation cells, 2 x 0.5 m³ • Sulfide rougher thickener, 22-m diameter The undersize from the grinding circuit will feed the sulfide rougher flotation by gravity flow from the ball mill classification screens. The slurry will be monitored for P80 particle size, and flotation feed samples will be taken periodically for process control and metallurgical accounting. The sulfide rougher flotation is designed to operate at a nominal rate of 181 mtph. Flotation reagents will be added to the flotation circuit as defined through metallurgical testing. The flotation reagents added for the sulfide circuit will be copper sulfate to activate the sulfide minerals, potassium amyl |
| PFS Pilot Mountain Tungsten Project – S-K 1300 Technical Report Summary Project No.: 25173-01 Page 163 of 236 xanthate (PAX) as the collector, and methyl isobutyl carbinol as the frother. Provision will be made for supplementary reagent addition to the cleaner stages of the flotation circuit. The sulfide minerals will be selectively floated into a rougher concentrate away from the tungsten and other non-sulfide mineral components present in the ore slurry. The sulfide rougher concentrate will constitute approximately 2-10% of the mass of the plant feed. The sulfide rougher tailings will be thickened in the sulfide rougher flotation thickener to increase the slurry density for the tungsten flotation circuit. Upgrading of the sulfide rougher material via cleaner flotation will be incorporated to concentrate the sulfide minerals as the silver/zinc/copper grades dictate, to produce a secondary concentrate. The sulfide rougher concentrate becomes the feed to the sulfide cleaner circuit where it will undergo three stages of cleaner flotation to concentrate the sulfide material further. The cleaner circuit operates in a locked cycle, with the tailings from the 3rd cleaner recycling back to the 2nd cleaner and the 2nd cleaner tailings recycling back to the first cleaner. The 1st cleaner tailings are sent to the tailings thickener while the concentrate from the 3rd cleaner will be sent to the sulfide concentrate thickener. Sulfide material that is not economical as a concentrate will be deposited into a segregated section of the TSF where it can be managed for acid generation separate from the bulk of the process tailings. 14.3.4 Tungsten Flotation Underflow from the sulfide rougher thickener is sent to the tungsten rougher circuit where it will undergo froth flotation to recover the primary tungsten mineral (scheelite). The tungsten rougher flotation is designed to operate at a nominal rate of 177 mtph. The flotation reagents added for the tungsten flotation circuit will be sodium silicate as a flotation modifier, soda ash to maintain the proper pH, a fatty acid-based flotation collector, and MIBC as the frothing agent. The tungsten flotation circuit will include the following major equipment: • Tungsten rougher conditioning tanks, 60 m³ and 116 m³ • Tungsten rougher flotation cells, 4 x 50 m³ • Tungsten cleaner conditioning tanks, 26 m³ and 60 m³ • Tungsten cleaner heat exchanger, 1460 mm x 2000 mm • Tungsten cleaner flotation columns, 2 x 10 m³ • Tungsten rougher thickener, 6-m diameter The thickened slurry from the sulfide circuit is sent to a pair of conditioning tanks where flotation reagents will be added as defined through the metallurgical testing. The conditioned slurry will be floated in a train of rougher flotation cells that will recover the tungsten material into a concentrate for additional cleaning. The tungsten rougher concentrate mass pull ranges from 4-12% of the plant feed. The tungsten rougher concentrate will be thickened in the tungsten rougher flotation thickener to increase the density to 50-60% solids for the tungsten cleaner circuit. Tailings from the tungsten rougher cells are sent to the tailings thickener. The thickened rougher concentrate is pumped into the cleaner conditioning tank where the slurry is heated to 70-90° C for one hour. The heated slurry is treated with sodium silicate and sodium sulfide to deactivate and pacify the gangue material (primarily calcite), which allows for a more selective flotation process in the cleaner circuit. After conditioning, a fatty-acid flotation collector is added to the slurry, which is floated in a flotation column to increase the tungsten concentrate grade to saleable levels. The tailings from the cleaner circuits are sent to the tailings thickener. |
| PFS Pilot Mountain Tungsten Project – S-K 1300 Technical Report Summary Project No.: 25173-01 Page 164 of 236 14.3.5 Concentrate Handling Circuit Flotation concentrate from the sulfide and tungsten circuits will be thickened, filtered, and packaged before shipment. The concentrate handling circuit will have the following major equipment: • Sulfide concentrate thickener, 3-m diameter • Sulfide concentrate filter feed tank, 116 m³ • Sulfide concentrate filter • Sulfide concentrate silo, 13.4 m³ • Sulfide concentrate bagging station • Tungsten concentrate thickener, 3-m diameter • Tungsten concentrate filter feed tank, 20 m³ • Tungsten concentrate filter • Tungsten concentrate silo, 13.4 m³ • Tungsten concentrate bagging station Concentrate from the sulfide cleaner circuit is sent to the sulfide concentrate thickener, which increases the slurry density and acts as storage for the final sulfide concentrate. The underflow from the thickener is then pumped into a filter feed tank and then the filter press, where the slurry is dewatered into a filter cake. The filter cake is conveyed to a storage silo for storage before being filled into bulk storage bags. Concentrate from the tungsten cleaner circuit is sent to the tungsten concentrate thickener, which increases the slurry density and acts as storage for the final tungsten concentrate. The underflow from the thickener is then pumped into a filter feed tank and then the filter press, where the slurry is dewatered into a filter cake. The filter cake is conveyed to a storage silo for storage before being filled into bulk storage bags. 14.3.6 Tailings Handling Circuit Tailings from the sulfide and tungsten flotation circuits are pumped to a tailings thickener, where the slurries are combined and thickened to recover water and storage prior to being pumped to the TSF. The sulfide tailings has the ability to be diverted to an isolated section of the TSF to segregate the sulfide material. Underflow from the thickener is pumped to the TSF which acts as the final tailings storage for the process. The tailings handling circuit will have the following major equipment: • Tailings thickener, 22-m diameter • Tailings thickener underflow pumps • Tailings reclaim water pump 14.3.7 Utilities 14.3.7.1 Water Systems The process plant will have fresh water, and two separate process water distribution systems for the sulfide and tungsten flotation circuits. Fresh water supply is pumped to the plant freshwater system from pit dewatering and freshwater wells. The fresh water is sourced from wells in the adjacent Ione Valley and will be pumped to the process site |
| PFS Pilot Mountain Tungsten Project – S-K 1300 Technical Report Summary Project No.: 25173-01 Page 165 of 236 using a 28 km pipeline. The fresh water is stored as firewater for the site and is the main make-up for process water. The fresh/fire water tank will be equipped with a fresh-water standpipe to ensure that at least half of the 1,317 m³ tank is available for fire water supply. Process water in the plant is split into two systems. The sulfide process water is used and recycled at the front end of the plant in the comminution and sulfide flotation circuits. Excess sulfide process water will be used as make-up water to the oxide process water. The oxide process water is used in the back end of the plant in the tungsten flotation and tailings. The process water balance must be maintained to ensure a negative water balance in the oxide water circuit to ensure the fatty-acid flotation collector does not flow into the sulfide flotation circuit. 14.3.7.2 Air Systems Process air service system will supply air to the following areas: • Low pressure air for flotation cells • Drying air and pressing air for concentrate filter press operation • Air compressors are also supplied for general plant distribution • Instrument air will be prepared from the plant air compressors and will be dried and stored in a dedicated air receiver 14.3.8 Reagents Various chemical reagents will be added to the process slurry streams to facilitate the recovery of the sulfide and tungsten minerals during the flotation process. Preparation of the various reagents will require: • Bulk reagent handling systems • Mixing and holding tanks • Metering pumps • A flocculant mixing skids To ensure spill containment, the reagent preparation and storage facility will be located within a containment area designed to accommodate 110% of the content of the largest tank. In addition, each reagent will be prepared in its own bounded area to limit spillage and facilitate its return to its respective mixing tank. The storage tanks will be equipped with level indicators and instrumentation to ensure that spills do not occur during normal operation. Appropriate ventilation, fire, safety protection, emergency shower and eye wash stations, and Material Safety Data Sheet stations will be provided at the facility. Each reagent line and addition point will be labeled in accordance with Mine Safety and Health Administration standards. All operational personnel will receive Mine Safety and Health Administration training, along with additional training for the safe handling and use of the reagents. 14.3.8.1 Sodium Silicate Sodium silicate arrives in bulk form and is mixed on site with fresh water to a concentration of 40%, on site to be used in the tungsten flotation. |
| PFS Pilot Mountain Tungsten Project – S-K 1300 Technical Report Summary Project No.: 25173-01 Page 166 of 236 14.3.8.2 Soda Ash Soda ash arrives in bulk form and is mixed on site with fresh water, to a concentration of 10%, to be used in the tungsten flotation. 14.3.8.3 Sulfide Collector Potassium amyl xanthate (PAX) is used as the sulfide flotation collector and is delivered to site in bulk liquid form. PAX is metered into the sulfide flotation using chemical metering pumps. 14.3.8.4 Oxide Collector Aerophine 704 is used as the tungsten flotation collector and is delivered onto site in bulk liquid form and dosed into the system using chemical metering pumps. 14.3.8.5 Frother Methyl isobutyl carbinol (MIBC) is used as the frother in both the sulfide and tungsten cleaner circuits. MIBC is metered into the flotation circuits using chemical metering pumps. 14.3.8.6 Flocculant Flocculant is delivered in bulk solid form and mixed on site to be used in the flotation, concentrate, and tailings thickeners. 14.3.8.7 Grinding Media Grinding media will be added to the mills used throughout the process as required. The estimated consumption rate for grinding media is based on abrasion index of the deposit utilizing first principal calculations (Bond abrasion, Ai) and estimated equipment power consumption. 14.4 PROCESS PLANT MANPOWER Process plant salaried personnel estimates were developed to provide adequate supervision and technical support for the daily operation of the process facility. Required salaried personnel for the process facility are estimated at 16 persons as detailed in Table 14.2. Table 14.2: Pilot Mountain Salaried Personnel Area Position Count Management 3 Plant Manager 1 Maintenance Manager 1 General Supervisor 1 Technical 4 Chief Metallurgist 1 Senior Metallurgist 1 Metallurgical Technician 1 Laboratory Supervisor 1 |
| PFS Pilot Mountain Tungsten Project – S-K 1300 Technical Report Summary Project No.: 25173-01 Page 167 of 236 Table 14.2: Pilot Mountain Salaried Personnel Area Position Count Operations 4 Shift Supervisor 4 Maintenance 5 Maintenance Supervisor 4 Maintenance Planner 1 Total Salaried Manpower 16 Salaried personnel will supervise a total of 66 hourly employees as detailed in Table 14.3. Process positions, both salaried and hourly, that require 24-hour per day coverage will be staffed by rotating 12- hour shifts. Table 14.3: Pilot Mountain Hourly Personnel Area Position Count Technical 12 Sample Preparers 4 Analytical Technicians 8 Operations 28 Control Room Operator 4 Crusher/Conveying Area Operator 4 Shift Operators Grinding 4 Shift Operators Flotation 4 Shift Operators Concentrate/Tailings Handling 4 Shift Operators Roaming 4 Shift Operators Reagents/Laborer 4 Maintenance 26 Electrician 8 Mechanical Fitter 8 Instrument Technician 2 Trades Assistant 8 Total Hourly Manpower 66 |
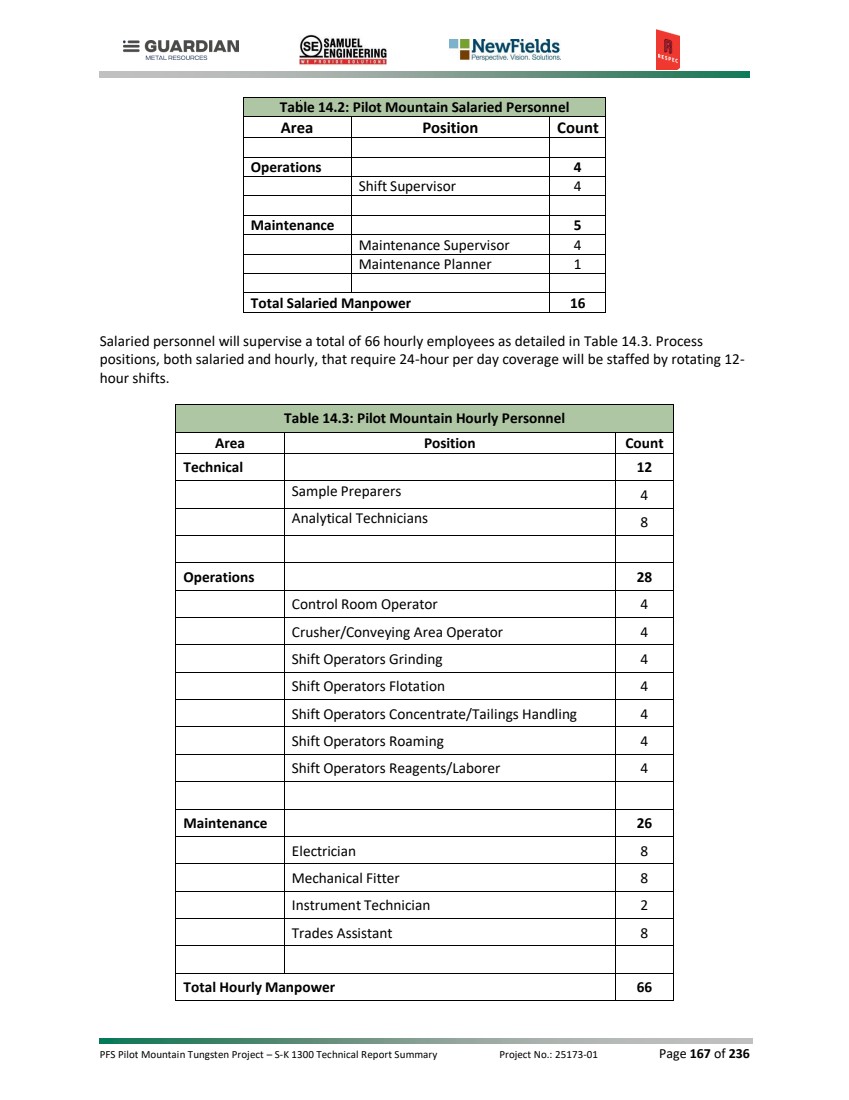
| PFS Pilot Mountain Tungsten Project – S-K 1300 Technical Report Summary Project No.: 25173-01 Page 168 of 236 15.0 INFRASTRUCTURE 15.1 INTRODUCTION The major operating and administrative infrastructure at the Pilot Mountain site include the following: • Site and access roads • Topsoil storage areas • Primary and secondary crusher, crushed ore stockpile conveyor systems • Water pipeline • Substation and overhead power lines • Process facility with concentrator building • Administration and laboratory buildings • Truck shop, warehouse, fuel depot, truck wash, and other mine facilities • Guard shack and scale • Explosive and detonator magazine and explosive ANFO/diesel storage • Water storage and distribution • Waste Rock Storage Facility (WRSF) • Tailings Storage Facility (TSF) Site infrastructure and facilities are depicted in the site plan (Figure 15.1) and described in the ensuing sections. |

| PFS Pilot Mountain Tungsten Project – S-K 1300 Technical Report Summary Project No.: 25173-01 Page 169 of 236 Figure 15.1: Site Plan (Samuel, 2026) |
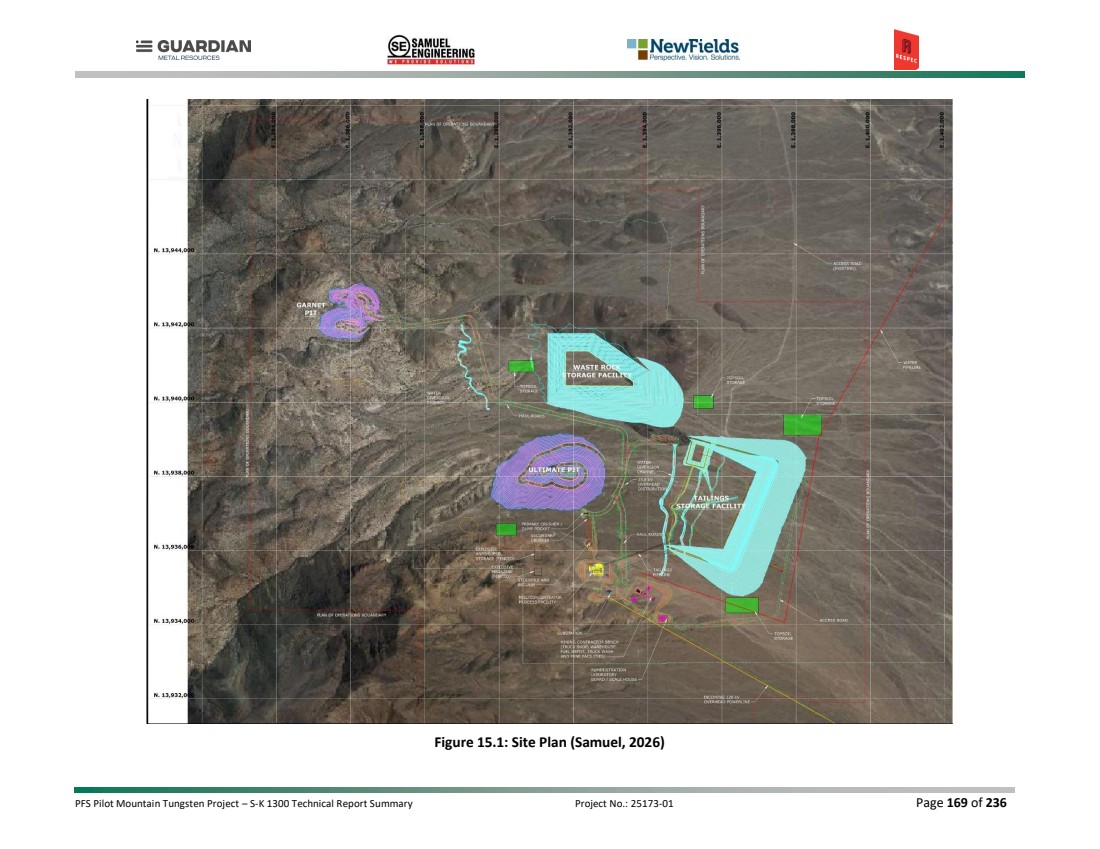
| PFS Pilot Mountain Tungsten Project – S-K 1300 Technical Report Summary Project No.: 25173-01 Page 170 of 236 15.2 SITE ACCESS ROADS The project site can be easily accessed via a well-maintained 39 km gravel road off U.S. Highway 95 near the town of Mina, Nevada (Figure 15.2). Figure 15.2: Site Access Route (RESPEC, 2026) 15.3 SITE ROADS Offshoots from the main access road will connect to the crusher, TSF, process facility, and mine pit. Ancillary roads from the site process bench connect to the truck shop, fuel depot and other mining facilities. 15.4 WATER SUPPLY Local groundwater is sufficient to support current exploration activities. However, to meet the plant’s process water needs, a 28 km water pipeline and pumping station originating from the Ione Valley to the north of the plant site will be constructed. An existing distribution power line which runs along Power Line Rd will be capable of servicing the water line pumping station at Ione Valley, with some minor infrastructure upgrades. |
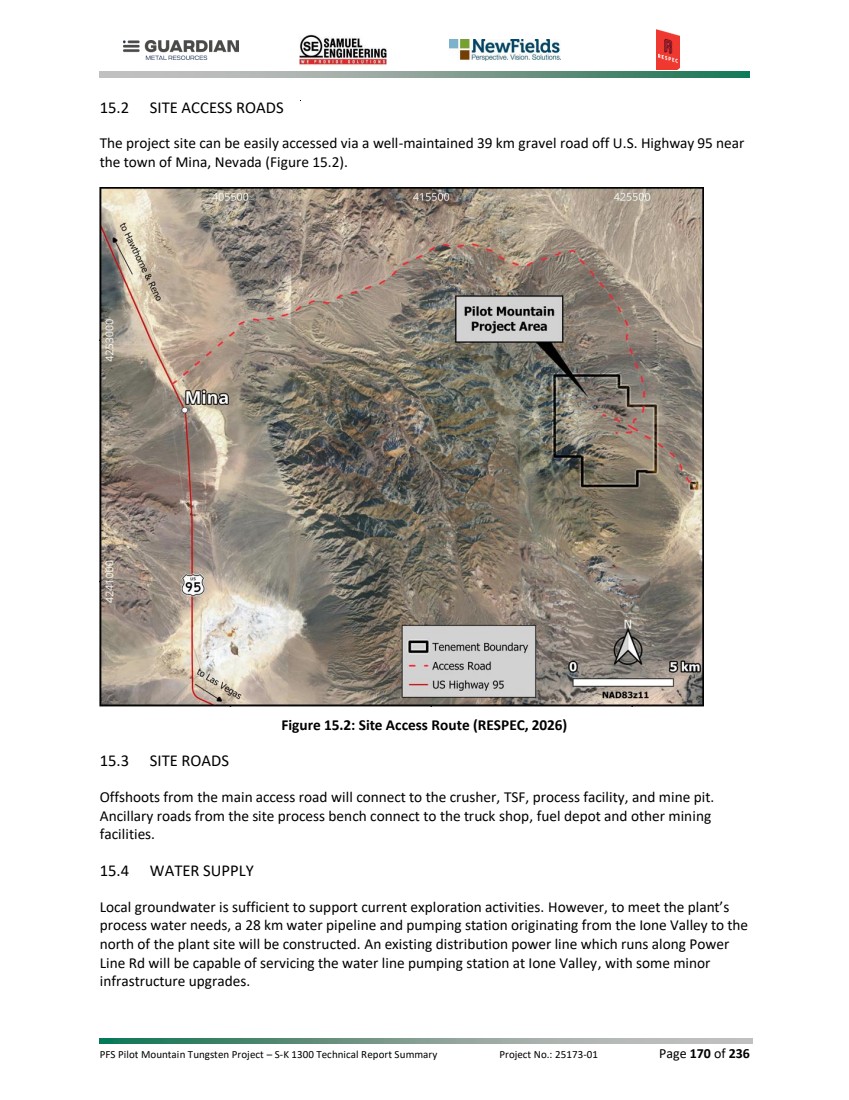
| PFS Pilot Mountain Tungsten Project – S-K 1300 Technical Report Summary Project No.: 25173-01 Page 171 of 236 15.5 POWER SUPPLY An existing 120 kV, Nevada Energy utility power line located south of the project’s property boundary will provide the Point of Interconnection (“POI”) for a new 16 km, 120 kV single-circuit, overhead transmission line to the project site. The 120 kV transmission line will supply a new 120 kV/13.8 kV substation, a 10/13 MVA power transformer and associated 13.8 kV medium-voltage switchgear. The substation, located within the mine facilities area, will serve as the primary distribution point for the site's 13.8 kV electrical distribution system. At the Pilot Mountain site, an overhead 13.8 kV distribution feeder will extend from the substation to the process facility area, where it will supply a dedicated 5/7 MVA, 13.8 kV/4.16 kV step-down pad-mounted transformer. This transformer will provide power to 4.16 kV process loads located within the process facility. The use of 4.16 kV distribution will be limited to the process area; all other major facilities and auxiliary loads throughout the site will continue to be served from the primary 13.8 kV distribution system. The substation will distribute 13.8 kV power via overhead distribution lines to all major project facilities, including the administration building, transformer/rectifier area, TSF and associated underdrain pond, crushing and conveying facilities, maintenance areas, and other auxiliary loads. Power Distribution Centers (“PDC”) and medium-voltage-to-low-voltage transformers will be strategically located throughout the site to provide power and control distribution to individual process areas while minimizing low-voltage cable lengths. In areas where there are only a few small loads such as remote pumping stations, remote buildings <~30 kVA, or similar, smaller 13.8kV to 480V pole-mounted or small pad-mounted transformers and skidded outdoor equipment will be used. Each PDC will be a prefabricated building housing the primary electrical equipment (switchgear, motor control centers, relay and control panels, battery systems, and associated auxiliary equipment) for its designated area. The PDCs will be factory assembled, wired, tested, and shipped as complete units to reduce field installation and commissioning requirements. An electrical load analysis was developed using motor efficiencies and power factors typical of North American manufacturers’ published data. Most motors assumed a maximum demand of 85% of the connected load. Availability factors used in the annual energy consumption calculation varied for different connected load types. A standby generator (500 kVA) will provide stand-by power to critical equipment during utility main power failure. A summary of the electrical load analysis is presented in Table 15.1. Table 15.1: Electrical Load Analysis Summary Connected hp 15,841 Connected kW 11,813 Max. kW Demand 9,343 kVAR Demand 3,615 Power Factor 97.6 Total kWh/y 75, 297,000 15.6 BUILDINGS AND ANCILLARY FACILITIES Site facilities will include an administration building, a laboratory building, truck shop, warehouse, fuel depot, truck wash, explosive magazine and a guard house and scale. |
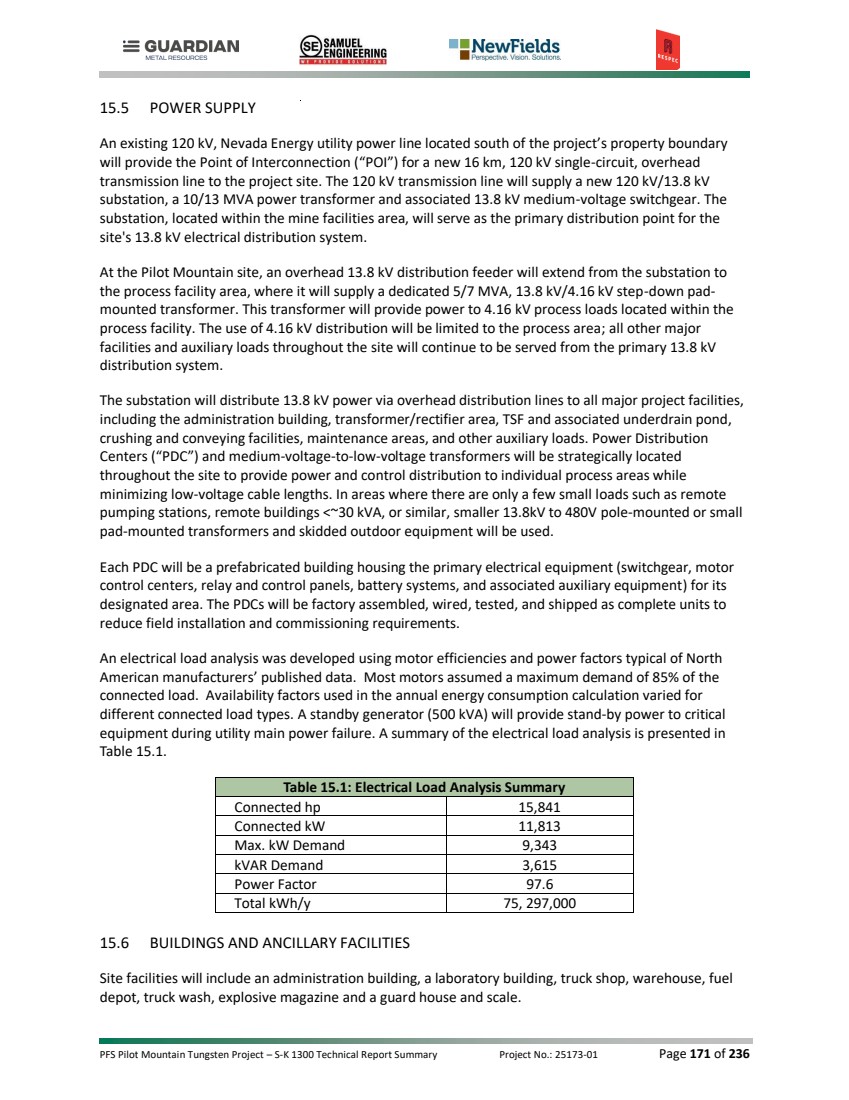
| PFS Pilot Mountain Tungsten Project – S-K 1300 Technical Report Summary Project No.: 25173-01 Page 172 of 236 The administration building will house space for site management, administration, mine management, engineering offices, conference rooms, building mechanical services, safety offices, break room and washrooms. The laboratory building will house an analytical lab, metallurgical lab, sample preparation area, office area, and a washroom. The laboratory building will be located adjacent to the administration building. The truck shop and warehouse buildings will house fleet repair facilities, wash bays, workshops, machine shop, offices, washrooms and warehousing space for both mining and process facilities equipment. A fuel storage depot and dispenser terminals will be located close to the truck shop. A storage shelter for a fire truck and mine rescue truck will be located adjacent to the truck shop. A guard shack and truck weigh scale will be located at the entrance to the facility. Explosives and detonator magazines and ANFO/diesel storage will be located some distance south of the mine pit. A wildlife fence is planned to encompass the entire plant site, and security fencing will be installed around the process facility, substation and explosive storage areas. 15.7 WASTE ROCK STORAGE FACILITY (WRSF) Waste rock has been planned to be moved from the 2 deposits to either one waste rock storage facility (“WRSF”), as construction material to a tailings storage facility (“TSF”), or as backfill to one of the mined-out pits. The single WRSF located in the north has a designed capacity of 36M cubic meters of material. The design was completed to a height of 150 m. The WRSF was designed to have 3H:1V slopes to aid in final reclamation. The WRSF is planned to be constructed with 34° angle of repose dump faces and 20m catch benches installed at each 15 m lift height. The WRSF meets a minimum recommended target static factor of safety of 1.3 at modeled 2.5H:1V slopes. The 3H:1V slopes used in the waste handling plan should result in a higher factor of safety than the more conservative 2.5H:1V slopes modeled. Pseudostatic analyses, used as a screening tool for impacts during earthquake loading, indicated additional evaluations were necessary. Subsequent deformation analyses estimate that total displacements under the operating earthquake loading condition are within acceptable and manageable limits. A 1-m wide, 0.5-m deep trapezoidal stormwater diversion channel was included around the WRSF to direct upland flows away from the waste rock. The diversion was sized to convey flows from the 500- year, 24-hour design storm, armored with riprap for erosion protection. 15.8 TAILINGS STORAGE FACILITY (TSF) The TSF design was advanced to an appropriate level of detail for a PFS, including geotechnical subsurface characterization, slope stability modeling, stormwater management, and drainage provisions. Additional engineering investigations, evaluations, and studies to advance the designs to Feasibility Study level are included in the recommendations section. 15.8.1 Geotechnical Investigation The PFS geotechnical investigation, consisting of geophysical surveys, test pits, and boreholes drilled with a hollow stem auger, was conducted in late 2025. The investigation included logging soils and collecting samples for laboratory testing. |
| PFS Pilot Mountain Tungsten Project – S-K 1300 Technical Report Summary Project No.: 25173-01 Page 173 of 236 The geotechnical investigation indicated the site is underlain by alluvium ranging from loose to very dense, with fine- to coarse-grained, subrounded to angular gravel and variable amounts of silt and clay. Bedrock depth varies across the site, with shallow bedrock and exposed outcrops to the west and more than 500 feet of alluvium to the east. A desktop review and preliminary field reconnaissance identified major faults within the Project site. As a result, the location of the TSF was sited to avoid these features, and the seismic design loading used in geotechnical slope stability evaluations accounted for the proximity of these faults. 15.8.2 TSF Design and Construction The TSF was designed as a fully geomembrane-lined impoundment created by a rockfill dam, with embankments on the north, east, and south sides. The native ground, sloping from west to east, forms the containment on the west side. The first phase of the embankment, or the Starter embankment, was designed with 2H:1V (horizontal:vertical) downstream slopes, with subsequent embankment raises constructed using downstream construction methods. The ultimate embankment was designed with 3H:1V downstream slopes to accommodate future closure and reclamation activities. Interim downstream slopes were not determined for the PFS but will be designed at subsequent design stages. Upstream slopes were designed at 2.5H:1V to facilitate installation and preparation of the 5-meter-wide finer-grained fill (common fill) that will be constructed directly over the rockfill as a transition to and bedding for the geomembrane liner. The rockfill will be sourced from the open pit mining operations and will likely be too coarse for geomembrane deployment without this finer-grained layer. The embankment crest will be 20 meters wide and have a maximum height of 82 meters, as measured from the dam crest to the dam toe. Slope stability analyses meet the minimum target factor of safety of 1.5, which is consistent with Nevada Administrative Code requirements and Canadian Dam Association guidelines for upstream and downstream static conditions at the starter and ultimate phases. Pseudostatic analyses, used as a screening tool for impacts during earthquake loading, indicated additional evaluations were necessary. Subsequent deformation analyses estimate that total displacements under the operating earthquake loading condition are within acceptable and manageable limits. The TSF will consist of two cells for the two separate tailings streams: the bulk tailings and the small portion of material that is not economical as a concentrate. The main impoundment will contain approximately 12 million dry tonnes of tailings from the tungsten milling and floatation process, using an assumed average in-place dry density of 1.4 tonnes per cubic meter (t/m3 ). The sulfide component will be stored in a separate cell, or the “Con Pond,” located in the northeast corner of the main impoundment. The Con Pond will contain approximately 0.3 million tonnes of sulfide concentrate, which is anticipated to be a filter cake product with an assumed average in-place dry density of 1.6 t/m3 . The Con Pond will be constructed in a total of two phases (Starter and Ultimate), while the main TSF, including the embankment, will likely be constructed in a total of four phases. Before construction, the area underlying the TSF will be stripped of vegetation, cleared and grubbed, and the subgrade will be scarified and recompacted to either form a suitable surface for geomembrane deployment or for fill placement. Most of the embankment rockfill placement and compaction will be completed using mine haulage equipment, sourced from the waste rock generated from open pit mining operations. The upstream face of the mine-sourced rockfill will be regraded and compacted by a contractor to form a firm surface for the finer-grained common fill placed in contact with the rockfill. PFS-level geotechnical investigations indicate suitable soils are available from within the basin and outside of the embankments can be used as the finer-grained common fill. The finer-grained zones of |
| PFS Pilot Mountain Tungsten Project – S-K 1300 Technical Report Summary Project No.: 25173-01 Page 174 of 236 the embankment fill will be constructed in controlled lifts and moisture conditioned using conventional construction equipment. The geomembrane liner has been assumed to be a 60-mil (1.5 mm) linear low-density polyethylene (LLDPE) liner. LLDPE geomembrane is preferred for this application over a high-density polyethylene (HDPE) geomembrane due to its superior strain capacity and flexibility. LLDPE exhibits significantly higher elongation at break and lower modulus, allowing it to accommodate differential settlement and subgrade deformation without developing localized tensile stresses that can lead to cracking or rupture. Future studies will evaluate the liner system and may result in modifications to the selected geomembrane. Between phases, a 4-meter-wide access bench has been included in the embankment designs for pipe relocation and liner connections. The geomembrane-lined impoundment will be covered by a gravel blanket drain and a network of perforated and corrugated polyethylene (CPe) pipes to promote tailings consolidation and drainage. A separate pipe and drainage system has been planned for the Con Pond. Immediately upstream of the embankment, the pipes will transition to a solid-wall HDPE pipe to exit the impoundment. Where pipes extend through the geomembrane-lined upstream embankment face, “pipe boots” will be constructed and pipes will be encased in concrete to protect the pipes beneath the embankment. To reduce the risk of internal erosion, or piping, at the penetration through the embankment fill, a graded filter diaphragm will be installed around the concrete. The HDPE pipes will convey flows to a double-lined underdrain pond with a leak detection system. The underdrain pond will be located outside the ultimate embankment toe. In the absence of tailings draindown data, pipe sizes have been estimated at 150-mm diameter for the Con Pond and 300-mm diameter CPe pipes transitioning to a single 250-mm solid-wall pipe underneath the embankment. 15.5.3 TSF Operation The sulfide filtered tailings will be trucked to the Con Pond and end-dumped, scarified, and compacted in-place. Due to the low water content of the filter cake, no supernatant pond is expected in this area. The remaining bulk tailings will be pumped as a slurry to the TSF in a 250-mm diameter HDPE pipe and deposited sub-aerially via 150-mm diameter tailings spigots located approximately every 10 meters along the embankment crest. Slurry tailings will primarily be deposited from the embankment in rotating zones to control the size and shape of the supernatant pond. The supernatant pond will be stored against native ground; no water will be stored against the embankments except in the rare case of an extreme storm. Water will be reclaimed from the supernatant pond via a shore-mounted pump with a floating intake located on a pump ramp constructed in the native basin portion of the impoundment. The ramp grading will be completed before geomembrane liner installation; after the geomembrane liner installation, the ramp will be protected with geotextile and a 150-mm thick layer of road base to form an adequate surface for the shore-mounted pump to be periodically retreated as the tailings and water levels rise throughout the TSF life. Water will be pumped approximately 1.5 km to the processing facilities via an assumed 250-mm diameter HDPE pipe, with a total elevation change of approximately 80 meters between the pump low point and the processing facilities. Perimeter roads will be constructed at each phase to allow continuous access around the TSF, with all phases connecting into the reclaim ramp. Tailings distribution pipes may also be located along this road to reduce pumping and piping lengths (by others). Perimeter roads will also aid in stormwater management, incorporating diversion channels sized to convey peak flows from the 25-year, 24-hour design storm event. A permanent diversion channel, sized for peak flows resulting from the 500-year, |

| PFS Pilot Mountain Tungsten Project – S-K 1300 Technical Report Summary Project No.: 25173-01 Page 175 of 236 24-hour design storm event, will be installed at the ultimate perimeter road to prevent run-on to the facility from the large upland contributory area. The diversion channel will have a 3-meter-wide bottom, 2.5H:1V side slopes, and a flow depth of 1.5 meters, with an additional 0.15 meters of freeboard. Where the tailings distribution and reclaim water pipes cross the diversion, a pipe bridge (designed by others) will be installed to elevate the pipes outside the maximum anticipated flow depth. The diversion channel was anticipated to be primarily excavated in soils, with approximately 15 percent of the total earthworks requiring drilling and blasting. Riprap with a median particle size of approximately 450 mm was assumed for erosion protection outside of areas requiring drilling and blasting. The first three phases of the TSF were designed to fully contain flows resulting from the 72-hour Probable Maximum Precipitation (PMP) event with 1 meter of freeboard, with no spillway included in the design. For the fourth and final phase, an operational spillway will be graded into the southwest embankment corner. The operational spillway will also function as the final closure spillway, safely passing the flows from the 72-hour PMP. The spillway will essentially function as a “low water crossing” constructed with shallow side slopes to allow continued access to the embankment crest during operations. The spillway and diversion channels will grade from the northeast to the southwest side of the site, discharging outside the downstream embankment footprint to prevent erosion or other negative impacts to the downstream embankment toe. 15.5.4 TSF Closure Toward the end of the facility life, the tailings beach and supernatant pond will be shaped, through careful tailings deposition, to direct the low point to the spillway to help facilitate closure. The conceptual closure plan includes placing cover fill over the embankment surface and revegetating. The ultimate downstream embankment slope will be constructed at 3H:1V slopes during operation to accommodate the future closure, and no additional grading on the downstream embankment face is anticipated for closure. The tailings surface will be allowed to drain down and consolidate before the tailings can be trafficked over to place cover fill material. An average 1-meter-thick layer of rockfill has been assumed as the base layer to bridge the tailings and to aid in grading the tailings toward the closure spillway. The rockfill will be covered by an assumed 600-mm thick layer of growth medium, which will be revegetated. Post-closure, water reporting to the TSF will drain to the closure spillway, designed with a 10-meter-wide bottom, 10 percent side slopes to allow vehicle traffic through the spillway, and a total depth of 3 meters. The surface of the closure spillway will be lined with reinforced concrete for erosion protection, and the outfall to the downstream termination point in the native drainage will be lined with riprap. 15.9 FIRE PROTECTION Process water will supply a combined filtered water and fire water tank. Firewater will be pumped from the fire water tank to a firewater distribution system. The pumping system will consist of an electric pump, a jockey pump and a diesel pump for use in the event of a power failure. The filtered water discharge connection will be at an elevation above the bottom of the water tank to ensure the remaining volume will be available for firewater purposes. Distribution will consist of a buried ring-main around major facility buildings with hydrants and standpipes connected to indoor hose stations. Portable cart-type and handheld extinguishers will be made available for localized fire protection. |
| PFS Pilot Mountain Tungsten Project – S-K 1300 Technical Report Summary Project No.: 25173-01 Page 176 of 236 15.10 LOGISTICS AND TRANSPORTATION Towns located near the project site do not have enough capacity to house and feed the operations and construction staff, hence, an offsite construction camp with an estimated 500-bed capacity at the peak construction will need to be built. Transportation to and from the site will be by contractor and company supplied buses and vans and personal vehicles. Deliveries of equipment, material and supplies to the Pilot Mountain site will be by truck. |

| PFS Pilot Mountain Tungsten Project – S-K 1300 Technical Report Summary Project No.: 25173-01 Page 177 of 236 16.0 MARKET STUDIES AND CONTRACTS 16.1 INTRODUCTION Argus is a leading provider of business information related to metals markets; we maintain extensive historical supply, demand, trade and pricing data. The Argus Tungsten Analytics service provides detailed market analysis and forecasts for supply, demand, prices and projects for tungsten out to 2040. The service supports strategic analysis, benchmarking exercises, and the assessment of individual assets, producers and opportunities. Argus’ consultants have performed numerous analytical studies covering a variety of metals, including tungsten, and have undertaken many marketing feasibility studies in support of M&A and investments in metals and mining, providing analysis to investors, banks and lenders groups. It is relied upon for project financing for many large corporate clients, who recognize Argus’ market expertise. Mark Seddon (Principal, Consulting & Analytics, Metals) is responsible for Argus’ tungsten analytics services and has been the lead consultant on numerous tungsten projects at Argus and has presented at several International Tungsten Industry Association (ITIA) AGMs. He has over 35 years’ experience in the tungsten industry as a researcher, consultant and company executive. 16.2 TUNGSTEN DEMAND AND FORECAST Global demand for primary tungsten dropped from 88,650t W in 2018 to 74,500t W amid the effects of Covid, but increased steadily to an estimated 89,285t W in 2025, driven by increasing demand in China. In Europe and the US, growth in primary demand was restricted by increasing recycling rates, leading to growing use of secondary material. Primary tungsten demand is forecast to grow at 2.6 %/yr between 2026-40 to 130,000t W in the base-case scenario; growth in the low-case scenario is just 0.7 %/yr to 95,000t W in 2040 and just under 4 %/yr to 152,500t W in the high case. Near-term demand faces headwinds from elevated prices and inventory drawdowns in traditional sectors (automotive, cutting tools), with Western markets delaying procurement, though China’s cemented carbide output remains resilient; defence, semiconductors, and new energy applications continue to strengthen. Long-term demand is expected to be supported by strong growth in the defence sector (up to 8 %/yr), making up for declining demand in the automotive sector (-1.5 %/yr) and becoming the largest end-use by mid-2030s. There should be sustained growth from semiconductors, the nuclear sector and photovoltaic sectors across China, as well as Europe, the US, and Japan pursuing supply-chain independence. |
| PFS Pilot Mountain Tungsten Project – S-K 1300 Technical Report Summary Project No.: 25173-01 Page 178 of 236 Figure 16.1: Forecast Primary Tungsten Demand Scenarios to 2035 In the industry sector-based scenario, tungsten demand is forecast to grow at just over 3 %/yr to 136,500t W in 2026-40 (slightly faster than in the base case GDP forecast); the share of tungsten demand represented by the automotive industry drops from 21% in 2026 to 11% in 2040, while defense uses increase their share from 11% to 20%. Figure 16.2: Forecast Primary Tungsten Demand Scenarios to 2035 16.3 TUNGSTEN PRICES & FORECAST Trade restrictions and tariffs (such as the export controls imposed by China in February 2025), combined with tight supply of concentrate in China due to reduced domestic output, and increased demand from the defense sector have pushed tungsten prices to record levels. The Argus European tungsten concentrate price was assessed at $2,400-2,650/mtu at the end of June 2026, with ammonium paratungstate (APT) assessed at $2,950-3,250/mtu. Chinese exports of controlled tungsten products such as APT and tungsten oxides continue to affect the market. China is also reportedly shifting toward strategic stockpiling, which may limit quantities of tungsten for export further. From the peaks of March, the situation in the Chinese domestic tungsten market has eased. Argus’ price assessment for 55% tungsten concentrate was assessed at CNY475,500/t at the end of June (over 50% 0 50,000 100,000 150,000 2025 2026 2027 2028 2029 2030 2031 2032 2033 2034 2035 Low case Base case High case — Argus Media - Consulting Services 0 40,000 80,000 120,000 2025 2026 2027 2028 2029 2030 2031 2032 2033 2034 2035 Automotive Mining Industrial Energy Construction Aerospace Consumer Defence Chemicals/other — Argus Media - Consulting Services |
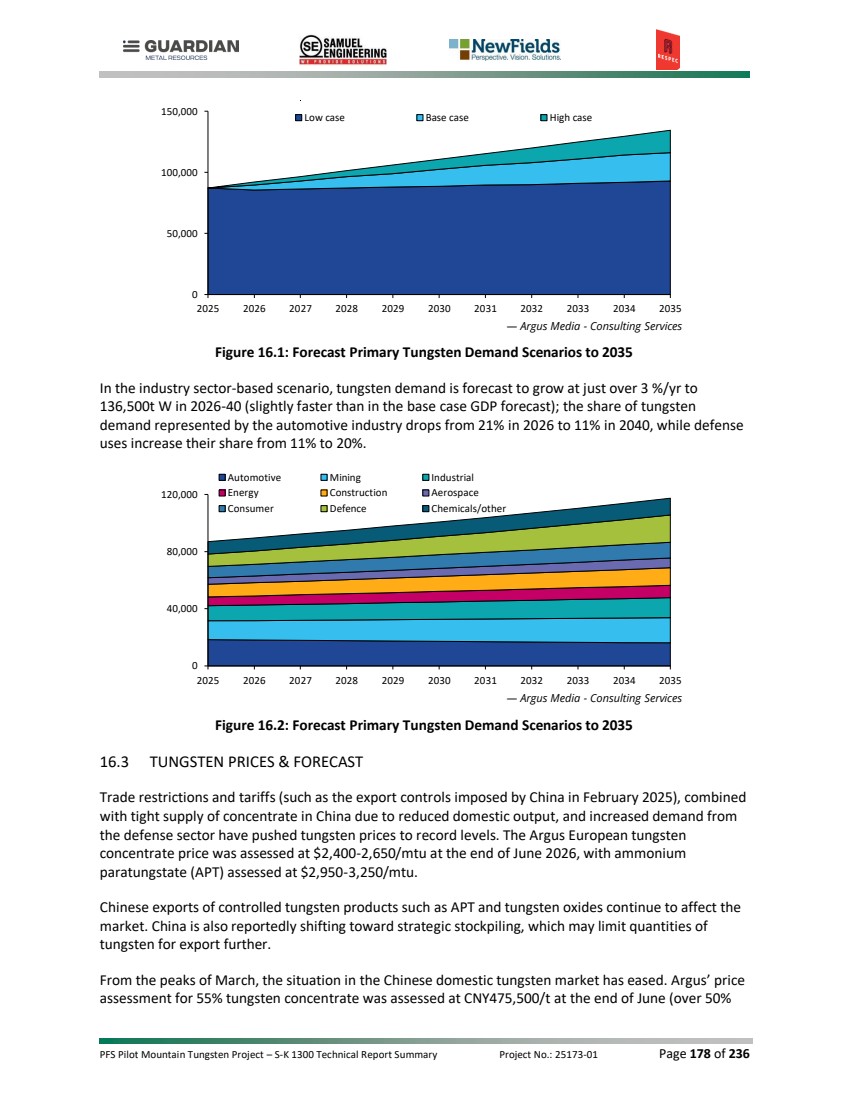
| PFS Pilot Mountain Tungsten Project – S-K 1300 Technical Report Summary Project No.: 25173-01 Page 179 of 236 lower than the March peak). Over the same period, European prices have maintained levels close to the peaks, which has created a significant bi-furcation in the tungsten market (European tungsten prices are now 3.5 to 4 times higher than domestic prices in China). Note: multiply by 100 to convert prices from $/mtu to $tonnes Figure 16.3: Historical Tungsten APT Prices, 2024 - 2026 The European tungsten market is expected to remain very tight in 2026 and 2027, with prices only easing from 2028 onwards. The market is forecast to show a surplus from 2029, growing to 2032 and then diminishing to 2035. The surpluses (in the base case) remain below 5% of demand, indicating a finely balanced market. This would suggest that most of the price risk over the forecast period would be on the upside (as evidenced by the significant divergence of the optimistic case from the base case, while the pessimistic case follows the base case much more closely). In general terms, the tungsten market looks to the APT price as the index for the tungsten market. However, due to the recent tightness in tungsten concentrate supply (especially in China), the upstream end of the industry was driving prices in late 2025 and into 2026. Argus’ base-case scenario forecasts an APT price of $2,555/mtu for 2026, reaching $2,870/mtu in 2028, before declining to $2,305/mtu in 2030, and $1,420/mtu in 2035. In the low-case scenario, prices average $2,350/mtu in 2026, $2,380/mtu in 2028, $1,910 in 2030, and $790/mtu in 2035. In the high-case scenario, prices average $2,815/mtu in 2026, $3,345/mtu in 2028, $4,060/mtu in 2030, and $4,820/mtu in 2035. 0 500,000 1,000,000 1,500,000 2,000,000 2,500,000 3,000,000 0 500 1,000 1,500 2,000 2,500 3,000 3,500 4,000 2024 2025 2026 $/mtu Tungsten APT du Rotterdam (per mtu WO3) Yn/t Tungsten APT fob China (per mtu WO3) Tungsten APT min 88.5% ex-works China (right axis) — Argus Media |
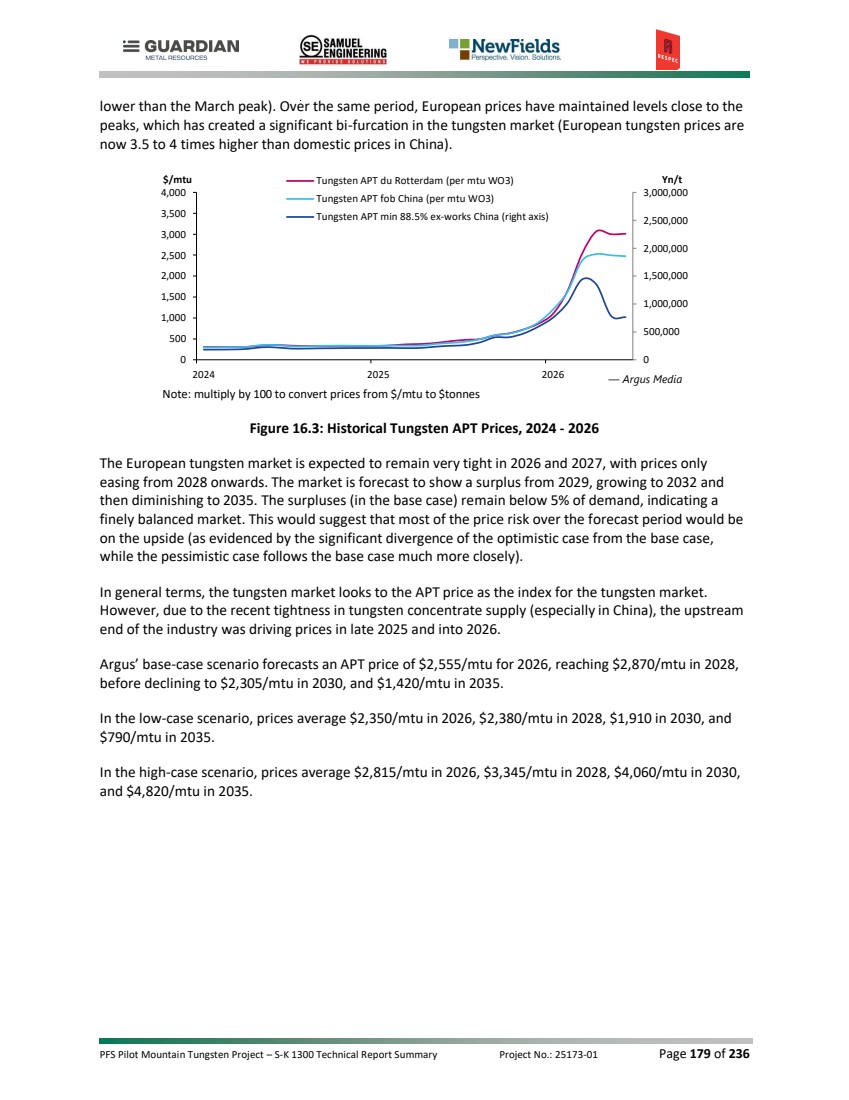
| PFS Pilot Mountain Tungsten Project – S-K 1300 Technical Report Summary Project No.: 25173-01 Page 180 of 236 Note: multiply by 100 to convert prices from $/mtu to $tonnes Tungsten APT price forecast to 2035 (Rotterdam) Year Pessimistic Base Optimistic 2025 500 500 500 2026 2,350 2,555 2,815 Average 2028-35 1,565 1,973 4,160 Note: multiply by 100 to convert prices from $/mtu to $tonnes Figures 16.4: Tungsten APT price forecast to 2040 (Rotterdam, $/mtu) The Guardian Base Case utilizes a tungsten price of US$1,973/mtu (US$197,300/t of WO3), which is the 2028-35 long-term average of the Argus Base Case APT forecast. All prices are for APT with the study assuming a payable factor of 82% for tungsten concentrate. The 82% payability for WO3 values in concentrate is reasonable for a good quality concentrate over 50% WO3. This type of concentrate is planned at the mine. 16.4 TUNGSTEN SUPPLY OUTLOOK Up to 60 kt/yr W of potential additional production capacity could be available to the tungsten market in the next decade, based on company/project announcements. The Argus base case forecast shows supply of primary tungsten increasing from 79,500t W in 2025 to 103,250t W in 2030, and 119,000t W in 2035. In the Argus base case, supply increases at a CAGR of 4% from 79,500t W in 2025 to 119,000t W in 2035. This case assumes a modest 1.35%/yr growth in Chinese output (with a new mining project due in 2026) and around 50% of potential additional capacity coming on stream to 2035. In the low case, supply increases from 79,500t W in 2025 to 103,500t W in 2035 at 2.7%/yr. Chinese output only increases at 0.5%/yr and 25% of new project capacity comes online. In the high case, Chinese output grows at 2 %/yr and 75% of new project capacity comes online. Supply increases from 79,500t W in 2025 to 136,000t W in 2035 at 5%/yr. 0 1,000 2,000 3,000 4,000 5,000 2025 2026 2027 2028 2029 2030 2031 2032 2033 2034 2035 APT (pessimistic) APT (base) APT (optimistic) — Argus Media - Consulting Services |
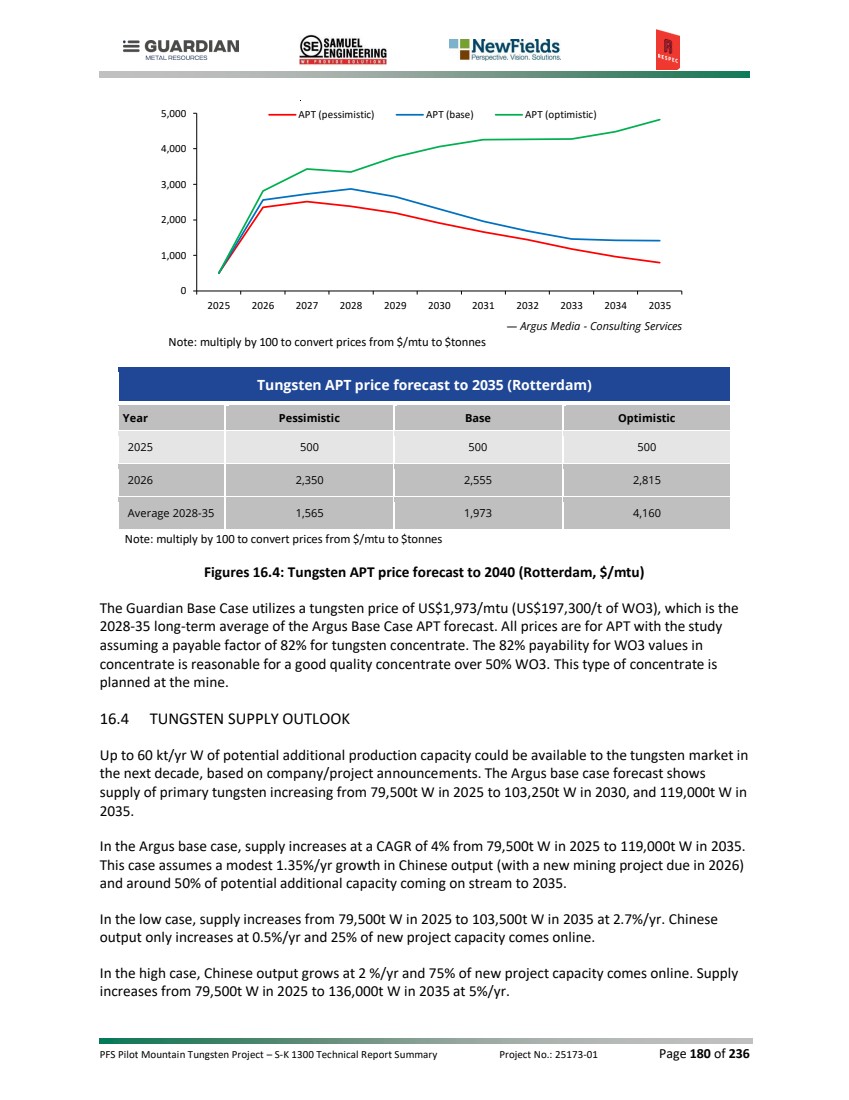
| PFS Pilot Mountain Tungsten Project – S-K 1300 Technical Report Summary Project No.: 25173-01 Page 181 of 236 Figure 16.5: Forecast Primary Tungsten Supply Scenarios to 2035 (t W) 16.5 PAYABLES, TREATMENT AND REFINING CHARGES Payabilities for 65% concentrate in Europe have averaged 80% historically but were averaging 83.5% in 1H 2026. In China, payabilities for the lower grade 55% concentrate have averaged 66% historically and were averaging 66.5% in in 1H 2026. The 82% average payability from the APT price forecast for concentrate used to go forward to 2035 is reasonable, in the context of the current market for high-quality concentrate of greater that 50% WO3. Impurity penalties are smelter specific, but in general: • For Product with WO3 content > 50% < 65% an additional discount of 2% - 4% payable across the payability table. • For Product with WO3 content > 45% and < 50% an additional discount of US$1.50/MTU WO3 for each 1% less than 50% pro rata. • For Product with As > 1% < 2% an additional discount of US$4.60 with a pro rata increment for each 0.1% above 1% As. • Mo < 1% • U+Th < 0.05% • Sn < 3% 16.6 ZINC AND SILVER PRICE AND PAYMENT The economic sensitivity of the project to silver and zinc prices is limited. This reflects the relatively low assumed recoveries and payabilities for silver and zinc, together with the limited silver inventory of approximately 2.1 million ounces. At the base-case metal prices, combined silver and zinc revenues account for approximately 4.7% of total project revenues and are therefore not considered a material driver of project value. Mineral reserves are reported using metal prices of US$38.00/oz Ag and US$2,700/t Zn. The final cash-flow model applies higher prices for WO3, silver, and zinc. The use of lower silver and zinc prices for reserve reporting is considered appropriate, as RESPEC has determined that material below the reserve reporting cut-off grade is not material to the estimate. The reserve-reporting prices were selected by RESPEC as conservative assumptions relative to prevailing spot prices at the time of the estimate. 0 50,000 100,000 150,000 2025 2026 2027 2028 2029 2030 2031 2032 2033 2034 2035 Low case Base case High case — Argus Media - Consulting Services |
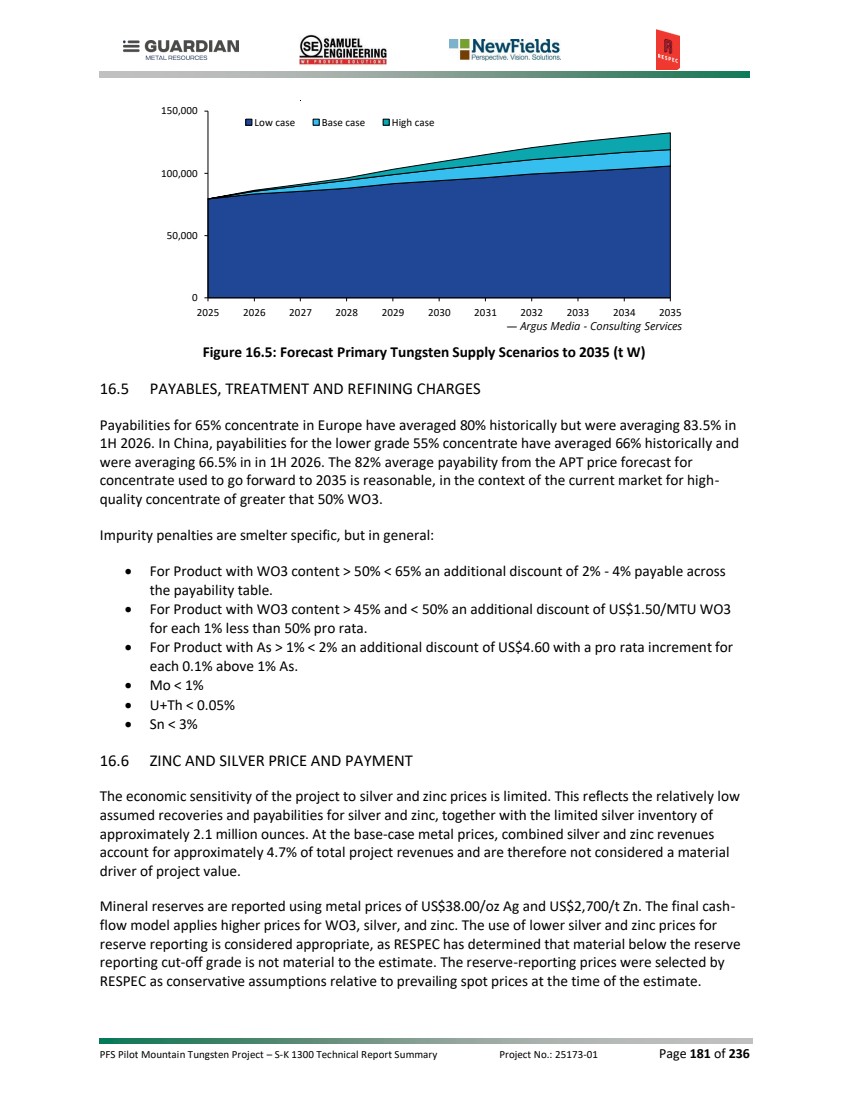
| PFS Pilot Mountain Tungsten Project – S-K 1300 Technical Report Summary Project No.: 25173-01 Page 182 of 236 For the overall project model and revenue assumptions, silver and zinc prices of US$64.00/oz Ag and US$3,300/t Zn were applied. These assumptions reflect spot prices observed in February 2026 and were selected in consideration of the broader project resource base. For comparison, COMEX spot prices on June 30, 2026, were US$59.92/oz Ag and US$3,558/t Zn. Silver and zinc payability assumptions were estimated based on publicly available information and correspondence with prospective sulfide concentrate offtake purchasers in 2026. 16.7 CONTRACTS To the authors knowledge, currently Guardian Metals has not entered into any contracts or arrangements that apply to mining, concentration, smelting, refining, transportation, handling, sales and hedging, and forward sales that apply specifically to the Pilot Mountain Tungsten Project. |

| PFS Pilot Mountain Tungsten Project – S-K 1300 Technical Report Summary Project No.: 25173-01 Page 183 of 236 |

| PFS Pilot Mountain Tungsten Project – S-K 1300 Technical Report Summary Project No.: 25173-01 Page 184 of 236 17.0 ENVIRONMENTAL STUDIES, PERMITTING AND PLANS, NEGOTIATIONS, OR AGREEMENTS WITH LOCAL INDIVIDUALS OR GROUPS For this section, the QP has relied on information provided by KTW Environmental Consultants LLC. The QP does not claim to be an expert regarding environmental, social, permitting or other matters described herein, and has no first-hand knowledge of contacts, negotiations or agreements with local individuals or groups. However, the QP has reviewed the information provided by KTW Environmental Consultants LLC, and has found it to be logical, reasonable and suitable for use in this TRS. 17.1 INTRODUCTION Exploration and mining activities on private land in Nevada are regulated by Nevada Division of Environmental Protection (NDEP) Bureau of Mining Regulation and Reclamation (BMRR; collectively the NDEP–BMMR), and by the BLM or USFS on public land. For exploration projects on public land creating less than five acres of disturbance, a Notice and reclamation bond is required by the BLM. For projects proposing disturbance of over five acres, a Plan of Operations (PoO) and National Environmental Policy Act (NEPA) compliance is required by the land management agency along with a reclamation permit issued by NDEP–BMRR. Regulatory authority for the reclamation permit requirement is set forth in Sections 519A.010 through 519A.290 of the Nevada Revised Statute (NRS) and Sections 519A.120 through 519A.345 of the Nevada Administrative Code (NAC). Additional regulation regarding surety, trust funds for fluid management and enforcement are provided in Sections 519A.350 through 519A.392. The Project is located on public lands with the public lands administered by the BLM through the Stillwater Field Office located in Carson City, Nevada. 17.2 BASELINE STUDIES Baseline studies have been completed for the current exploration permitting to support the Exploration Plan of Operations (EPO) and the Environmental Assessment (EA) that have been approved by the BLM (Appendix B). These studies included Biological Resources and Cultural Resources. The baseline studies needed to support mine operation permitting are currently being developed utilizing the drilling being done for the exploration program. Key environmental resources including geochemistry, surface and groundwater hydrology, geology and soils have been advanced based on the geologic models to ensure full characterization of each geologic unit. The data presented in the baseline reports will be used to inform the development of the Mine Plan of Operations (MPO). The Environmental Baseline Reports (EBR) will follow the current BLM pre-planning format that includes preliminary impact analyses for each resource area that is critical in identifying sensitive resources and guide mine planning to specifically avoid or minimize environmental impacts. A series of Environmental Protection Measures (EPMs) will be developed for each resource in the baseline reports that will be carried into the PoO for use in the BLM NEPA analysis. Table 17.1 summarizes the baseline studies to be completed for the project. 17.2.1 Biological Resources Westland Resources has completed the baseline biological studies for the project area. The baseline study included vegetation community and wildlife habitat mapping, noxious weed and invasive species surveys, BLM Special Status Species surveys, greater sage-grouse presence and absence surveys, pygmy rabbit presence and absence surveys, migratory bird and raptor surveys, acoustic bat surveys, golden |
| PFS Pilot Mountain Tungsten Project – S-K 1300 Technical Report Summary Project No.: 25173-01 Page 185 of 236 eagle habitat analysis, and an Ecological Site Inventory analyzing rangeland health indicators. No sage grouse leks were found within the Project boundary. Three golden eagle nests have been identified within the project area that have not been active for at least the last two years. Due to the proximity of these nests to the Desert Scheelite Pit, it was determined that there was potential for impacts to the golden eagles during nesting season. After consultation with the U.S. Fish and Wildlife Service, it was decided that a General Take Permit may be necessary. An application has been submitted to the U.S. Fish and Wildlife Service for a general take permit that will be issued this year. The Mine Plan of Operations (MPO) prepared by GMR will include environmental protection measures and project design features to avoid or minimize the potential for significant impact to biological resources. Additional protection measures and mitigation may be identified during the NEPA analysis. Table 17.1: Guardian Metal Resources Environmental Baseline Studies Study Resources Surveyed Status Cultural Resources Class III Cultural Resource Inventory completed for entire project area. Completed Results confidential. Biological Survey Report Pilot Mountain Biological Survey Report: Completed • Vegetation • Special Status Plant Species • Noxious Weeds • General Wildlife • Greater Sage Grouse and Habitat Assessment • Pygmy Rabbit and Habitat Assessment • Migratory Birds and Raptors • Bats • Threatened, Endangered and Candidate Wildlife Species Waste Rock and Ore Characterization A review of ore and waste rock to determine the long-term potential for metals leaching and acidic drainage. In Progress • Static Testing /Acid base accounting • Meteoric water mobility procedures • Humidity cell testing • Whole rock geochemistry • Mineralogy Hydrogeology Report Report on the site hydrogeologic conditions that control surface and groundwater flow. In Progress Groundwater Hydrologic Modeling Report Groundwater flow model generated from groundwater monitoring and pump tests to determine aquifer characteristics and flow rate. In Progress Visual Resources Survey Report Analysis of impacts on visual resources To be Completed Paleontology Survey A review of the potential for paleontological resources that could be impacted by site development in conformance with the BLM Paleontological Resources Preservation requirements. To be Completed |
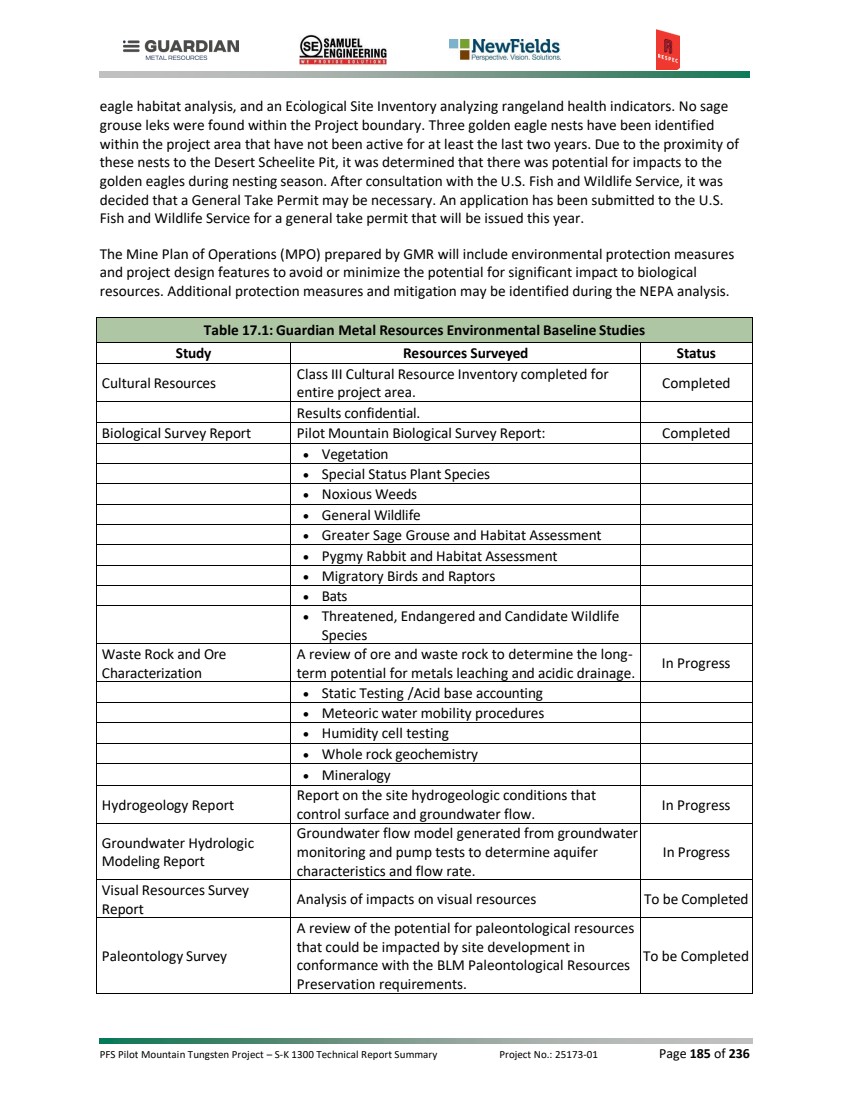
| PFS Pilot Mountain Tungsten Project – S-K 1300 Technical Report Summary Project No.: 25173-01 Page 186 of 236 Table 17.1: Guardian Metal Resources Environmental Baseline Studies Study Resources Surveyed Status Transportation Survey Report A review of transportation resources and potential impacts from the project activities incorporated directly into baseline report To be Completed Socioeconomics A review of socioeconomics for current project To be Completed Recreation and Wilderness Areas A review of recreation and wilderness baseline conditions and potential impacts incorporated directly into the baseline report. To be Completed Air Quality Survey Report Report on baseline air quality conditions and preliminary modeling of air quality impacts from mine plan that will inform equipment selection and location for PoO and Air Quality Permit. In Progress Wild Horses Review of baseline wild horse conditions and analysis of potential impacts. To be Completed Noise Review of baseline noise conditions and modeling of potential noise levels from proposed operations on nearest sensitive receptors. To be Completed Geology Review of baseline geologic conditions and assessment of potential impacts to geologic resources. Completed Soils Review of baseline soils conditions and analysis of available soil resources to reclaim the mine plan. Completed 17.2.2 Cultural Resources Westland Resources has compiled the full inventory of Class III Cultural Inventories, and the reports have been submitted and approved by the BLM and the Nevada State Historic Preservation Office (SHPO) in compliance with Section 106 of the National Historic Preservation Act of 1966 (NHPA). 17.2.3 Surface Water Resources Surface water features at the Site include ephemeral streams exhibiting surface flow only during significant precipitation or snowmelt events. Streamflow in these channels is typically ephemeral, short-lived and highly seasonal. Two minor springs are present near the Site that exhibit low or intermittent flow, contributing only minimally to the hydrologic budget. Spring discharge is generally confined to fractured rock zones. An analysis was performed as part of the supporting documentation for an Approved Jurisdictional Determination (AJD) request to the U.S. Army Corps of Engineers (USACE). Findings are based on a desktop review of publicly available geospatial and environmental datasets, including aerial imagery, USGS topographic maps, the U.S. Fish and Wildlife Service National Wetlands Inventory (NWI), and NRCS Web Soil Survey data. The evaluation found that all surface water features within or immediately adjacent to the project area did not meet federal definitions of jurisdictional waters under the Clean Water Act (CWA) and a Non-Jurisdictional Determination was issued by the USACE. |

| PFS Pilot Mountain Tungsten Project – S-K 1300 Technical Report Summary Project No.: 25173-01 Page 187 of 236 17.2.4 Ground Water Resources A water budget for Monte Cristo Valley has been developed for the project. The only identified component of groundwater recharge to the basin is from direct precipitation that is infiltrated near the mountain front. This is recognized as “mountain-front recharge” and has been estimated at approximately 400 acre-feet per year (afy). Monte Cristo valley is a closed basin, and therefore no surface water inflow or outflow exists. Additionally, historic estimates have not identified any groundwater underflow (inflow) from adjacent basins. Under heavy precipitation events, surface water (or shallow sub-flow) may reach the playa at the center of the valley where it is evaporated. Precipitation to the valley floor is erratic and is mostly evapotranspired. Infiltration to the aquifer from precipitation on the valley floor is negligible. Sources of imported water to the basin have not been identified. Sources of groundwater outflow have been identified as either evapotranspiration or direct extraction (e.g., production wells). It is estimated that evapotranspiration equals mountain front recharge under steady state conditions (i.e., prior to development or groundwater extraction). However, per the Nevada Division of Water Resources (NDWR) (2026), committed groundwater uses in the basin are estimated at 398.5 afy, which is dominated by mining water use (351 afy), and includes stockwater (43 afy) and wildlife (4.5 afy) uses. Although approximately 99.6% of the estimated groundwater recharge (i.e., 400 afy) is committed for productive use, accurate pumpage or extraction values are not known. Any excess recharge is assumed to be evapotranspired by native vegetation. 17.2.4.1 Well Installation Three monitoring wells (Well-1S, Well-1D, Well-2) and one piezometer (PZ-1) were installed and tested to assess aquifer properties and allow for groundwater characterization and the collection of baseline groundwater quality conditions. Prior to drilling, technical specifications were developed and a hydrogeologist was onsite to oversee the drilling, well construction, well development, and testing. Prior to drilling activities at each site, GMR submitted well permit applications, including requests for a waiver for observation or monitor well(s) with the Nevada Division of Water Resources (NDWR) for all wells. Upon completion of borehole drilling, downhole geophysical logging was conducted in MW-1D. Due to borehole stability issues, no other boreholes were logged for geophysics. Well casing and annular materials were installed following borehole drilling and geophysical logging. The monitoring wells and piezometer PZ-1 were developed via airlifting, followed by pump development (for monitoring wells only). Relatively short duration pumping tests were completed for each monitoring well, and slug tests were performed on the piezometer. Water quality samples were collected from each new monitoring well at the end of pump testing. Based on the test data, the aquifer formations have relatively low hydraulic conductivity and transmissivity. Hydraulic conductivity values range from 0.02 – 0.69 feet per day (ft/d) for the alluvium, and 0.001 – 0.01 ft/d for the bedrock aquifer. Furthermore, the alluvial aquifer and the bedrock aquifer at the MW-1S and MW-1D location appear to be hydraulically disconnected, as there was no observed influence on water levels in the adjacent wells during the respective development and pumping periods. These wells are located approximately 30 feet apart and have been completed at different depths, in different formations. Due to the relatively short duration of the pumping tests, a longer-duration pumping test at a lower flow rate (to sustain available drawdown) could provide better data to evaluate potential connection between the alluvial and bedrock aquifers. |
| PFS Pilot Mountain Tungsten Project – S-K 1300 Technical Report Summary Project No.: 25173-01 Page 188 of 236 17.2.4.2 Hydrologic Study Area (HSA) and Groundwater Flow Direction The Pilot Mountain Project is in the western part of Monte Cristo Valley groundwater basin, located in the central hydrographic region. The Monte Cristo Valley groundwater basin covers 276 square miles (157,440 acres) and is in a rural area between Tonopah and Mina. The hydrogeology at the project area includes Pleistocene to Quaternary basin fill sediments (e.g., alluvium and alluvial fan deposits) of variable thickness overlying moderately fractured bedrock consisting of a variety of formations. The alluvium, or the basin-fill deposits, comprise the primary aquifer reservoir of the valley. The perennial yield of the basin is estimated at 400 afy per the NDWR. Committed groundwater uses in the basin is estimated at 398.5 afy, which is dominated by mining water use (351 afy), and includes stockwater (43 afy) and wildlife (4.5 afy) uses. Monte Cristo Valley is a closed basin with no surface water inflow or outflow. Groundwater elevations basically follow surface topography and groundwater flows from west to east. The hydraulic gradient is steeper near the planned mine facilities at the toe of the mountain and gradually flattens into the valley to the east. 17.2.5 Geochemical Considerations Geochemical characterization activities are being conducted by GMR in support of the Pilot Mountain Project, focused on waste rock, ore-grade, and tailings materials to be generated through open pit mining of the Desert Scheelite and Garnet deposits. The primary purpose of the program is to evaluate the environmental behavior of these materials in terms of acid rock drainage (ARD) and metals leaching (ML) potential, to support mine design and planning, develop waste and process materials management strategies, and to inform water quality analyses and closure strategies. These deposits occur primarily within carbonate-rich skarn and altered marble of the Luning Formation. The area is underlain by Triassic and Jurassic sedimentary and volcanic rocks, locally intruded by Cretaceous granitic stocks and bordered by Tertiary volcanics. The characterization program is consistent with Nevada, US BLM, and industry guidance, utilizing static geochemical test methods, including Acid-Base Accounting (ABA), Net Acid Generation (NAG) pH, total inorganic carbon (TIC), paste pH, and Meteoric Water Mobility Procedure (MWMP) rinse testing, supplemented by existing assay bulk chemical composition, to establish baseline geochemical characteristics. Kinetic humidity cell testing (HCT) and mineralogical analyses are currently in progress to evaluate long-term environmental behavior. Based on current hydrogeologic information, a pit lake may form in the Desert Scheelite open pit during the post-closure period, and testing was conducted following Nevada guidance based on the assumption of ‘saturated conditions’ at closure. Further work at the DFS level will investigate mitigations that may result in a pit lake not being anticipated. A pit lake is not currently expected at Garnet due to its shallow depth above the water table. Static ABA testing of 187 waste rock samples indicated that the vast majority (97 percent) of materials were classified as non-potentially acid generating (NPAG) due to low sulfide content and strong neutralization capacity associated with carbonate-rich lithologies. Unoxidized intrusive material was the only grouped lithologic unit that included a limited number of individual samples classified as potentially acid generating (PAG). However, the consistently circumneutral to alkaline paste pH and NAG pH values in all waste rock samples supports the low likelihood of acid generation under both short-term and long-term oxidizing conditions. On average, the 29 samples of ore-grade materials contained somewhat higher average total sulfur content but also exhibited abundant neutralization potential as mineralization is hosted largely in carbonate-rich skarns and marbles. Ore samples were also classified overwhelmingly as NPAG. At Desert Scheelite, thin bands of sulfide-enriched materials were identified |

| PFS Pilot Mountain Tungsten Project – S-K 1300 Technical Report Summary Project No.: 25173-01 Page 189 of 236 within the ore-grade skarns (currently estimated at 3 percent of the ore-grade material) and were classified as PAG material. Special-handling the sulfide-enriched, ore-grade material is currently proposed by GMR as part of their materials management plan. MWMP rinse testing of waste and ore-grade samples provided an indication of short-term contact water quality and reflected low metals concentrations with most analytes below Nevada reference water quality standards. Some localized variability was identified including samples with elevated concentrations of arsenic, antimony, selenium, molybdenum, and uranium in isolated occurrences, particularly within specific lithologies (including intrusive, marbles, and hornfels units). A kinetic humidity cell testing (HCT) program with mineralogical analyses was initiated to evaluate the timing and magnitude of constituent release under controlled weathering conditions. Nineteen samples were selected for testing across ore and waste materials and the range of observed environmental behavior. Kinetic HCT testing has been completed through 16 weeks and further supports stable, neutral to alkaline geochemical conditions with limited evidence of sustained sulfide oxidation at this point in the testing. Trace element results indicate variable but generally low-level metal/metalloid release, with some materials releasing elevated arsenic and antimony, as well as selenium, molybdenum, and uranium in early rinsing. Overall, the results suggest neutral conditions with metal release driven largely by initial flushing rather than sustained oxidation. The HCTs will continue to operate until stable trends are observed and termination is approved by NDEP BMRR. Tailings characterization is ongoing in parallel with metallurgical testing. Composite samples of whole tailings, segregated (non-sulfide) tailings, and sulfide rougher concentrate have undergone static geochemical testing and HCTs have been initiated on whole tailings composite and the segregated (non-sulfide) composite. Both whole and segregated (non-sulfide) tailings contain low total sulfur and high neutralization capacity, classifying them as NPAG. However, some metals (e.g., arsenic, antimony, cadmium, iron, lead, manganese, molybdenum, and uranium) may be elevated in tailings supernatant, with implications for water management or process recycle. The sulfide concentrate tailings were classified as PAG and will require special handling in tailings management. Because tailings management options remain under evaluation for potential optimization in the DFS, the geochemical data will play an important role in determining whether sulfide separation, filtered tailings, or conventional impoundment is most appropriate. The completed and ongoing geochemical characterization program supports a targeted, risk-based materials management approach and provides a defensible foundation for mine design, closure planning, and permitting while ensuring that long-term environmental performance is appropriately evaluated. 17.3 ENVIRONMENTAL CONSIDERATIONS/MONITORING PROGRAMS Monitoring programs will be developed based on requirements of the regulatory agencies and the associated permits/approvals issued by those agencies. Some of the major permits required would include WPCP, Reclamation Permit, Air Quality Operating Permit, NEPA Record of Decision, and various other federal, state and local permits and approvals. A full list of required permits is provided in Table 17.2. Reclamation bonds associated with the reclamation permit must be posted prior to the transfer of the federal and state permits and will be reviewed and updated every three years to assess adequacy of the bond to cover current reclamation costs. |
| PFS Pilot Mountain Tungsten Project – S-K 1300 Technical Report Summary Project No.: 25173-01 Page 190 of 236 17.4 KEY ENVIRONMENTAL ISSUES Baseline studies have been focused on identifying potential environmental impacts and ensuring that the scope of the baseline studies have been expanded where needed to fully analyze the resource to ensure the data necessary for permitting will be completed. To date, no environmental issues that are an impediment to permits in the normal course with a modern mine design and consideration of standards have been identified. 17.5 SOCIAL OR COMMUNITY IMPACT A socioeconomic baseline report will be included in the EBRs completed for permitting. To date there has been no community concerns documented as evidenced by the Exploration Environmental Assessment public comment period receiving zero comments. Meetings with the Mineral County Commissioners have been held and the project was very well received. The project will operate with an open-door policy in a climate of mutual respect during the process of design, construction and operations. Local communities are considered key stakeholders and an important potential source of project labor and contracts. 17.6 PERMITTING Table 17.2 provides a complete list of the permits that may be required for mine construction and operations. Table 17.2: Required Permits and Regulatory Authorizations Permits and Authorizations Regulatory Agency Plan of Operations/Record of Decision Bureau of Land Management Explosives Permit U.S. Department of the Treasury, Bureau of Alcohol, Tobacco, and Firearms Surface Disturbance Permit and Class II Air Quality Operating Permit Nevada Department of Conservation and Natural Resources, Division of Environmental Protection, Bureau of Air Quality Water Pollution Control Permit Nevada Department of Conservation and Natural Resources, Division of Environmental Protection, Bureau of Mining Regulation and Reclamation Mining Reclamation Permit Nevada Department of Conservation and Natural Resources, Division of Environmental Protection, Bureau of Mining Regulation and Reclamation Industrial Artificial Pond Permit Nevada Department of Conservation and Natural Resources, Nevada Department of Wildlife (NDOW) Class III Waiver Landfill Permit Nevada Department of Conservation and Natural Resources, Division of Environmental Protection, Bureau of Solid Waste General Discharge Permit (Stormwater) Nevada Department of Conservation and Natural Resources, Division of Environmental Protection, Bureau of Water Pollution Control Hazardous Materials Storage Permit State of Nevada, Fire Marshall Division |
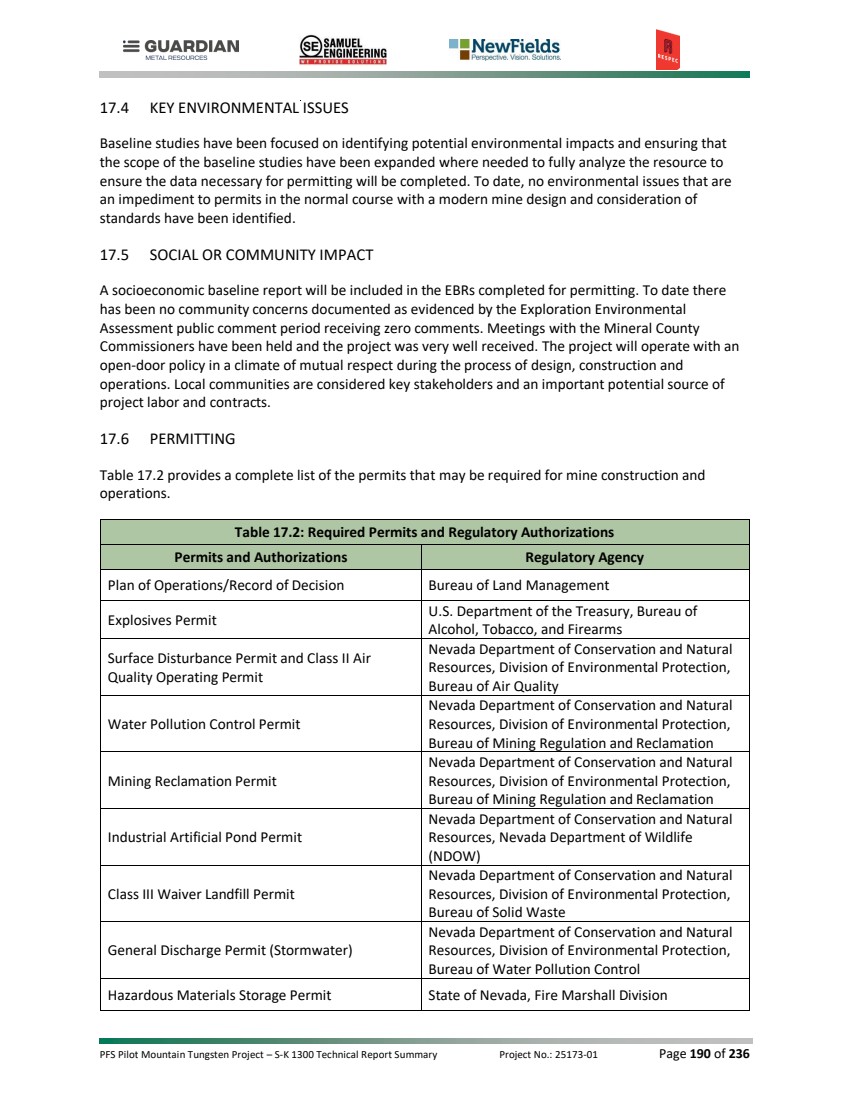
| PFS Pilot Mountain Tungsten Project – S-K 1300 Technical Report Summary Project No.: 25173-01 Page 191 of 236 Table 17.2: Required Permits and Regulatory Authorizations Permits and Authorizations Regulatory Agency Hazardous Waste Identification Number United States Environmental Protection Agency Septic Treatment Permit Sewage Disposal System Permit Nevada Department of Conservation and Natural Resources, Division of Environmental Protection, Bureau of Water Pollution Control Potable Water System Permit Nevada Department of Conservation and Natural Resources, Division of Environmental Protection, Bureau of Safe Drinking Water Dam Safety Permit State of Nevada Division of Water Resources Local Permits County Road Use and Maintenance Permit/Agreement Mineral County Building Planning Department |

| PFS Pilot Mountain Tungsten Project – S-K 1300 Technical Report Summary Project No.: 25173-01 Page 192 of 236 18.0 CAPITAL AND OPERATING COSTS 18.1 CAPITAL COST 18.1.1 Capital Cost Summary This section provides an overview of the capital costs associated with the Pilot Mountain tungsten project, with a mill feed capacity of 1.4 million tonnes per annum and designed to produce 2,000 tonnes of WO₃ in concentrate per annum. The capital cost estimate encompasses all direct and indirect expenditures, complete with appropriate contingencies for the various facilities required to commence production, as outlined in this study. It is important to note that all equipment and materials are assumed to be new, and the estimate does not incorporate allowances for potential scope changes, escalation, or fluctuations in exchange rates. The execution strategy is rooted in an engineering, procurement, and construction management (EPCM) implementation approach, with Guardian Metal overseeing construction management and the packaging of discipline-based construction contracts. This capital cost estimate for the Project has been developed to align with the requirements of a PFS, encompassing the costs associated with designing, constructing, and commissioning the necessary facilities. Table 18.1 outlines the total initial capital costs for the project, encompassing the mine, TSF, WRSF, process facilities, on-site infrastructure, construction camp and all associated project-related indirect expenditures and contingencies across major areas. The initial capital cost for the Project is estimated at $288.7 million in US currency. Table 18.1: Initial Capital Cost Summary Description Cost ($000s) DIRECT COSTS General Site Facilities & Mine 31,513 Crushing 11,928 Grinding 21,137 Sulfide Flotation 19,743 Oxide Flotation 9,256 Concentrate Handling 6,842 Tailings Handling 2,772 Tailings Facility 17,651 Reagents 17,322 Water Pipeline 11,649 Utilities 5,444 INDIRECT COSTS Contractor Indirects 6,393 Construction Equipment 2,877 Third Party Surveying/Testing – Process 630 Third Party Surveying & QA/QC – TSF 1,103 Construction Camp 12,500 EPCM - Process & Ancillary Facilities 15,156 EPCM - Tailings Facilities 662 |
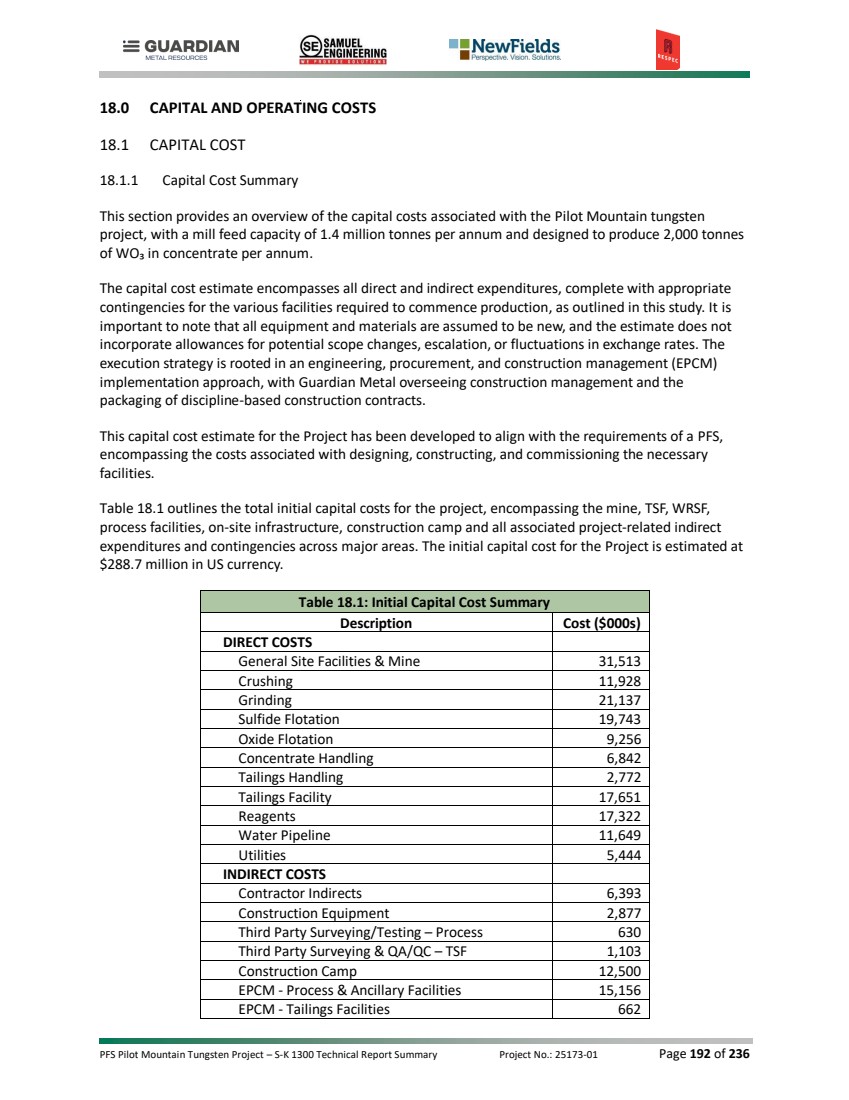
| PFS Pilot Mountain Tungsten Project – S-K 1300 Technical Report Summary Project No.: 25173-01 Page 193 of 236 Table 18.1: Initial Capital Cost Summary Description Cost ($000s) Pre-Operational Testing 400 Vendor Reps 327 Process Facilities Spare Parts 1,633 Initial Fills 1,169 Plant Mobile Equipment 2,053 Mine Equipment 1,705 Preproduction Mining 34,315 Freight 5,240 Owner's Cost 9,623 Contingency 37,657 TOTAL INITIAL CAPITAL 288,701 18.1.2 Exclusions Items not included in the initial capital cost estimate are: • Taxes • Sunk costs (costs prior to start of detailed design) • Disposal/clean-up of hazardous materials (none have been identified) • Allowance for special incentives (schedule, safety, etc.) • Interest and financing cost • Working capital and sustaining capital beyond the accommodation for delayed revenue payment and a regular sustaining capital allowance • Closure, reclamation, and salvage costs • Escalation beyond second-quarter 2026 • Risk due to political upheaval, government policy changes, labor disputes, permitting delays or any other force majeure occurrences 18.1.3 Currency The estimate is expressed in second-quarter 2026 United States dollars. No provision has been included to offset future escalation. The value of the US dollar against other world currencies could influence future project cost depending upon the location of equipment sourcing. No allowance has been made in the estimate to offset potential currency fluctuations. 18.1.4 Estimating Methodology The estimate is built up by cost centers as defined by the project’s WBS for Area designations as well as by prime commodity accounts, which include earthwork, concrete, structural steel, buildings, mechanical equipment, piping, electrical and instrumentation. Table 18.2 is the responsibility matrix for the Project. All major systems below are described in further detail in this document. |
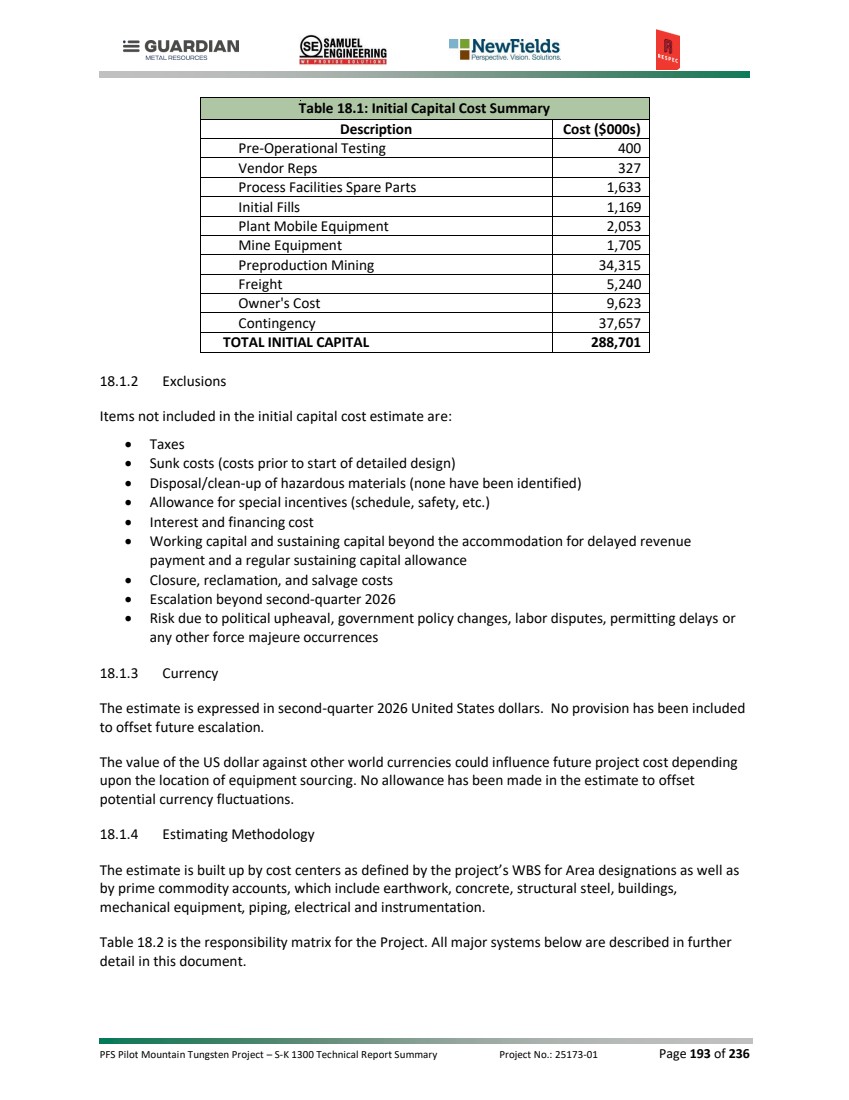
| PFS Pilot Mountain Tungsten Project – S-K 1300 Technical Report Summary Project No.: 25173-01 Page 194 of 236 Table 18.2: Capital Cost Estimate Responsibilities Scope/Responsibility Firm Site Infrastructure Samuel Engineering Mine RESPEC Tailings Facility NewFields Process Plant Samuel Engineering Substation Bodec Pipeline Samuel Engineering Metric units of measure have been used throughout the estimate. Costs were derived from various sources including equipment and material quotations, in-house historical data, published databases, factors and estimators’ judgment (allowances). The estimate assumes that equipment and materials will be purchased on a competitive basis, and installation contracts will be awarded in defined packages on a time and materials, unit price or lump sum basis. It is also assumed that any equipment listed on the Mechanical and Electrical Equipment Lists will be purchased by the Company, or Company’s Agent, without a markup and be provided (free issue) to the construction contractor(s) for installation. It is anticipated that the construction contractors will supply most of the bulk materials. The manufacturer’s standard designs and warranties on equipment and materials are assumed to be satisfactory. 18.1.5 Contingency Contingency is an allowance to cover unforeseeable costs that may arise during the project execution, which reside within the scope of work but cannot be explicitly defined or described at the time of the estimate due to lack of information. It is assumed that contingency will be spent; however, it does not cover scope changes or project exclusions. The contingency has been assessed by considering the quality of quantities, scope definition and pricing obtained for each commodity of the estimate. Each component is assigned a percentage rate based on the best judgment of the project team. 18.1.6 Accuracy The estimate has been developed to a level sufficient to assess/evaluate the project concept, various development options and the overall project viability. After inclusion of the recommended contingency and excluding any scope changes, the capital cost estimate is considered to have a level of accuracy in the range of -15% to +20%. Estimate accuracy ranges are projections based upon preliminary designs, assumptions and cost estimating methods and are not a guarantee of actual project cost. 18.1.7 Mine Capital Costs Mining capital costs have been minimized through contract mining. The capital costs required that are associated with the contractor include mobilization and demobilization, power supply and earthworks |
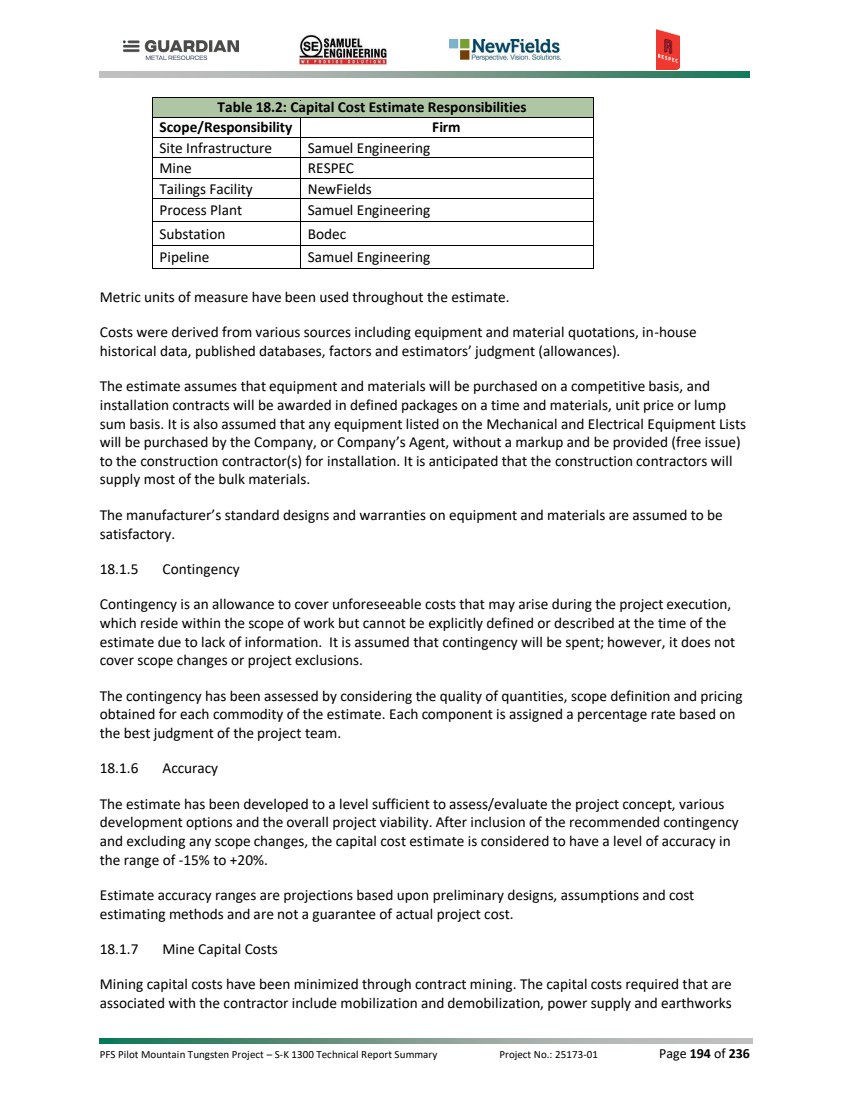
| PFS Pilot Mountain Tungsten Project – S-K 1300 Technical Report Summary Project No.: 25173-01 Page 195 of 236 for the contractor’s yard, and fuel storage areas. Contractors have provided the mobilization and demobilization cost of $1.0M as budgetary quotations. Power, earthworks (0.3M), and fuel storage capital costs ($0.1M) are provided based on previous work and estimation guides. The total contractor capital is estimated to be $1.4M for the life of mine. Owner’s portion of the mining capital totals $1.3M and includes mine planning software, surveying equipment, light vehicles, computers, and plotters. These have been estimated based on vendor quotations and public data. The larger portion of capital has been estimated for preproduction and initial mining services. The preproduction is based on contractor quotations for the mining of waste in years -2 and -1. Note that there is some ore material mined during year -1, which will be stockpiled for commissioning and startup. The bulk of this waste will be used as construction material for the TSF and some road construction. Table 18.3 shows the mining capital estimate for the contractor and owner capital along with the pre-stripping and mine general services during construction. The total mining capital is estimated to be $37.0 million. Table 18.3: Mine Capital Costs 18.1.8 TSF Capital Costs For the Tailings Storage Facility (TFS) capital costs, unit rates were developed using a combination of vendor quotations, contractor labor and equipment costs, and production-based estimating methodologies. Material pricing was based on current budgetary vendor quotes for major items such as piping and geosynthetics. Labor costs were developed using applicable 2026 Southern Nevada Prevailing Wage rates and adjusted to include estimated contractor overhead and profit, small tools, and applicable payroll taxes. Equipment costs were based on rates published in the Nevada Standardized Reclamation Cost Estimator (SRCE, 2025), using an off-road diesel cost of $3.32 per gallon. Production rates were developed from comparable project experience, contractor unit-rate benchmarks, and equipment performance data referenced from the Caterpillar Performance Handbook, Edition 49. No per diem allowance was included, as it was assumed that an owner-provided or project-supported camp would be available to accommodate the construction workforce. The capital cost estimate is quantity based and utilizes engineering derived Material Take-Off (MTO) quantities developed from the PFS-level design. Quantities were generated from AutoCAD Civil 3D surfaces, survey data, and project specific layouts, sections, and details prepared for the Project. The Contractor Capital Units Yr -2 Yr -1 Yr 1 Yr 2 Yr 3 Yr 4 Yr 5 Yr 6 Yr 7 Yr 8 Yr 9 Yr 10 Total Total Mobilization K USD $ 500 $ - $ - $ - $ - $ - $ - $ - $ - $ - $ - $ - $ 500 Demobilization K USD $ - $ - $ - $ - $ - $ - $ - $ - $ - $ - $ 500 $ - $ 500 Total Mob & Demob K USD $ 500 $ - $ - $ - $ - $ - $ - $ - $ - $ - $ 500 $ - $ 1,000 Facilites K USD $ 300 $ - $ - $ - $ - $ - $ - $ - $ - $ - $ - $ - $ 300 Fuel Storage K USD $ 100 $ - $ - $ - $ - $ - $ - $ - $ - $ - $ - $ - $ 100 Total Contractor Capital K USD $ 900 $ - $ - $ - $ - $ - $ - $ - $ - $ - $ 500 $ - $ 1,400 Owner Capital Mining Software K USD $ 80 $ - $ - $ - $ - $ - $ - $ - $ - $ - $ - $ - $ 80 Survey Equipment K USD $ 150 $ - $ - $ - $ - $ - $ - $ - $ - $ - $ - $ - $ 150 Light Vehicles K USD $ 495 $ - $ - $ - $ - $ 495 $ - $ - $ - $ - $ - $ - $ 990 Computers & Plotters K USD $ 80 $ - $ - $ - $ - $ - $ - $ - $ - $ - $ - $ - $ 80 Total Owners Capital K USD $ 805 $ - $ - $ - $ - $ 495 $ - $ - $ - $ - $ - $ - $ 1,300 Total Mining Capital Subtotal Mining Capital K USD $ 1,705 $ - $ - $ - $ - $ 495 $ - $ - $ - $ - $ 500 $ - $ 2,700 Pre-stripping - contractor K USD $ 9,438 $ 22,642 $ - $ - $ - $ - $ - $ - $ - $ - $ - $ - $ 32,080 Mining General Services K USD $ 727 $ 1,508 $ - $ - $ - $ - $ - $ - $ - $ - $ - $ - $ 2,235 Total Mining Capital K USD $ 11,870 $ 24,150 $ - $ - $ - $ 495 $ - $ - $ - $ - $ 500 $ - $ 37,016 |
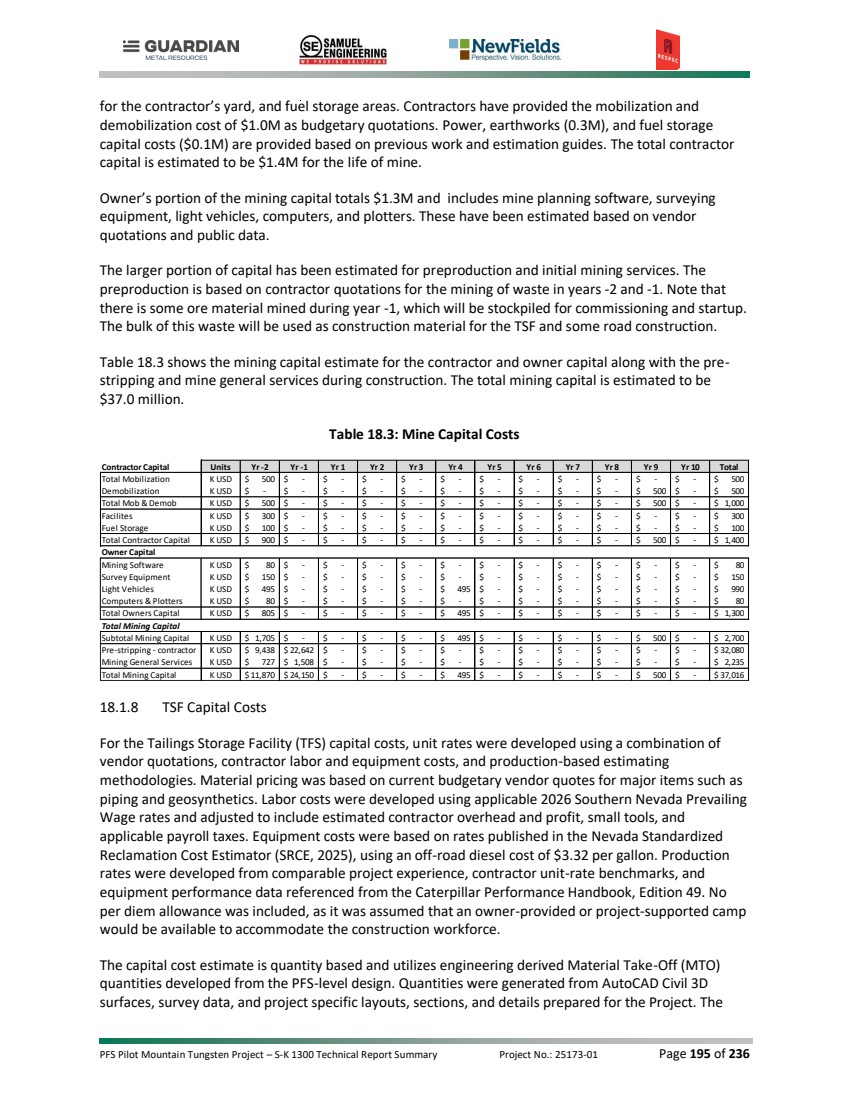
| PFS Pilot Mountain Tungsten Project – S-K 1300 Technical Report Summary Project No.: 25173-01 Page 196 of 236 estimate includes site preparation, earthworks, geosynthetics, piping systems, stormwater management infrastructure, diversion channels, culverts, erosion protection measures, and associated civil works. Allowances for indirect costs, including engineering support, construction management, QA/QC, surveying, contractor mobilization and demobilization, and temporary stormwater control construction, are included. Quantities and unit rates reflect the current level of engineering and are considered appropriate for a PFS-level estimate. 18.2 OPERATING COST 18.2.1 Process Operating Cost Assumptions The process operation is designed to process a nominal throughput of 4,000 tonnes of scheelite ore to produce a WO3 concentrate through a flotation process. The process features the following unit operations or facilities • Crushing • Grinding • Sulfide Flotation • Oxide Flotation • Concentrate Handling • Tailings Handling • Utilities • Reagents This operating cost is calculated on the basis of operations running 24 hours per day, 365 days per year. See Table 18.4 for a list of general operating cost assumptions. Table 18.4: General Operating Cost Assumptions Parameter Process Days/y 365 Hours/Shift 12 Shifts/day 2 Availability 92% Hours/y 8,059 Throughput (mtph) 181 Throughput (mtpd) 4,000 Throughput (mtpy) 1,460,000 18.2.2 Process Operating Cost Summary Table 18.5 is a summary of the process operating costs. Unit costs are calculated per tonne ore processed. Table 18.5: Process Operating Cost Summary Total Cost (US$/year) Unit Cost ($/tonne) Labor $10,873,710 $7.448 Electricity $4,600,653 $3.151 |
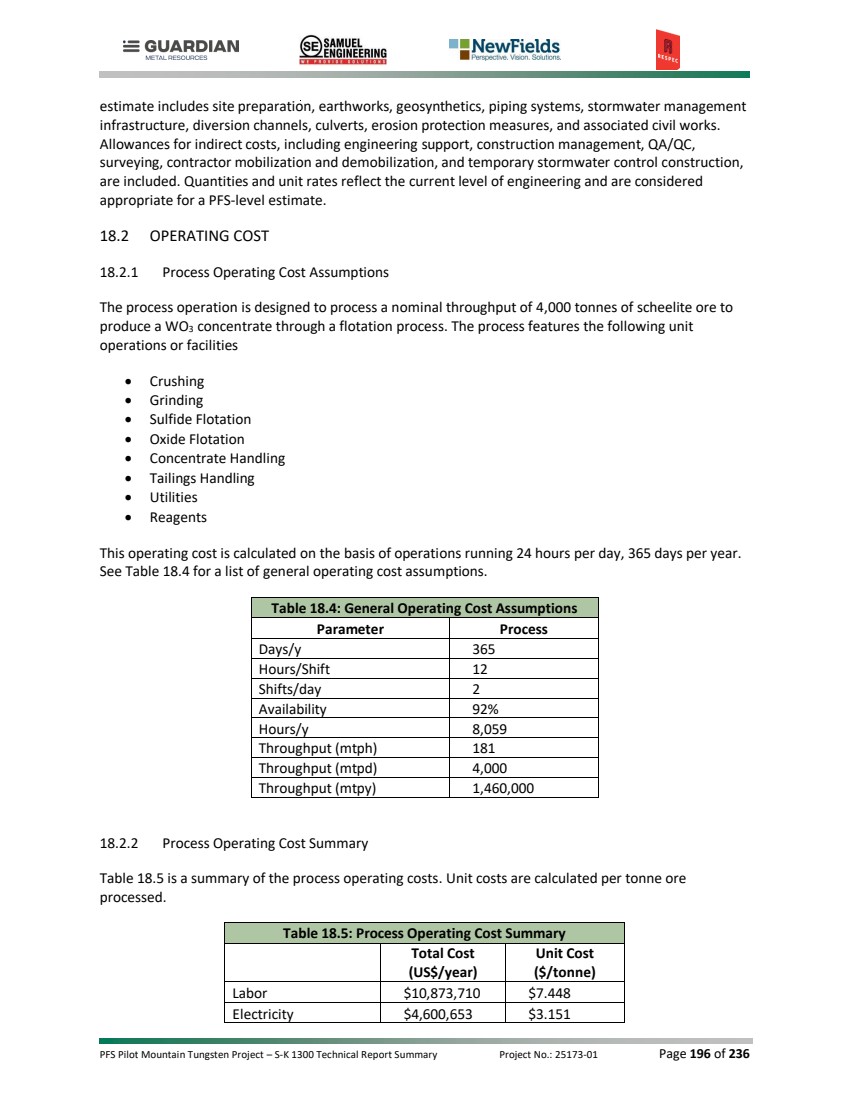
| PFS Pilot Mountain Tungsten Project – S-K 1300 Technical Report Summary Project No.: 25173-01 Page 197 of 236 Table 18.5: Process Operating Cost Summary Reagents $12,183,927 $8.345 Operating Supplies $2,642,091 $1.810 Miscellaneous $1,901,307 $1.302 Total $32,201,689 $22.056 18.2.2.1 Process Labor Cost Labor costs for the operating cost estimate (“OPEX”) were calculated utilizing a 12-hour shift schedule with 4 separate operating crews (2 dayshift, 2 nightshift). Labor costs are depicted in Table 18.6. Table 18.6: Labor Cost Job Classification Number Hours Wage ($/hr) Salary ($/yr) Burden / Bonus (%) Overtime Diff ($/hr) Annual Cost ($) Management Process Manager 1 $150,000 70.0% $ - $255,000 Maintenance Manager 1 $130,000 70.0% $ - $221,000 General Supervisor 1 $130,000 70.0% $ - $221,000 Technical Chief Metallurgist 1 $150,000 55.0% $ - $232,500 Senior Metallurgist 1 $130,000 55.0% $ - $201,500 Metallurgical Technician 1 $80,000 50.0% $ - $120,000 Laboratory Supervisor 1 $85,000 40.0% $ - $119,000 Sample Preparers 4 2190 $30.00 40.0% $ - $367,920 Analytical Technicians 8 2190 $30.00 40.0% $ - $735,840 Operations Shift Supervisor 4 $110,000 46.0% $ - $642,400 Control Room Operator 4 2190 $42.49 46.0% $ 3.54 $574,448 Crusher/Conveying Operator 4 2190 $37.20 46.0% $ 3.10 $502,956 Shift Operators Grinding 4 2190 $37.20 46.0% $ 3.10 $502,956 Shift Operators Flotation 4 2190 $37.20 46.0% $ 3.10 $502,956 Shift Operators Concentrate/Tailings Handling 4 2190 $37.20 46.0% $ 3.10 $502,956 Shift Operators Roaming 4 2190 $37.20 46.0% $ 3.10 $502,956 Shift Operators Reagents/Laborer 4 2190 $29.96 46.0% $ 2.50 $405,047 . Maintenance Maintenance Supervisor 4 $110,000 46.0% $ - $642,400 Maintenance Planner (day) 1 $110,000 46.0% $ - $160,600 Electrician (shift) 8 2190 $42.13 46.0% $ 3.51 $1,139,161 Mechanical Fitter (shift) 8 2190 $42.13 46.0% $ 3.51 $1,139,161 Instrument Technician (day) 2 2190 $42.13 46.0% $ 3.51 $284,790 |
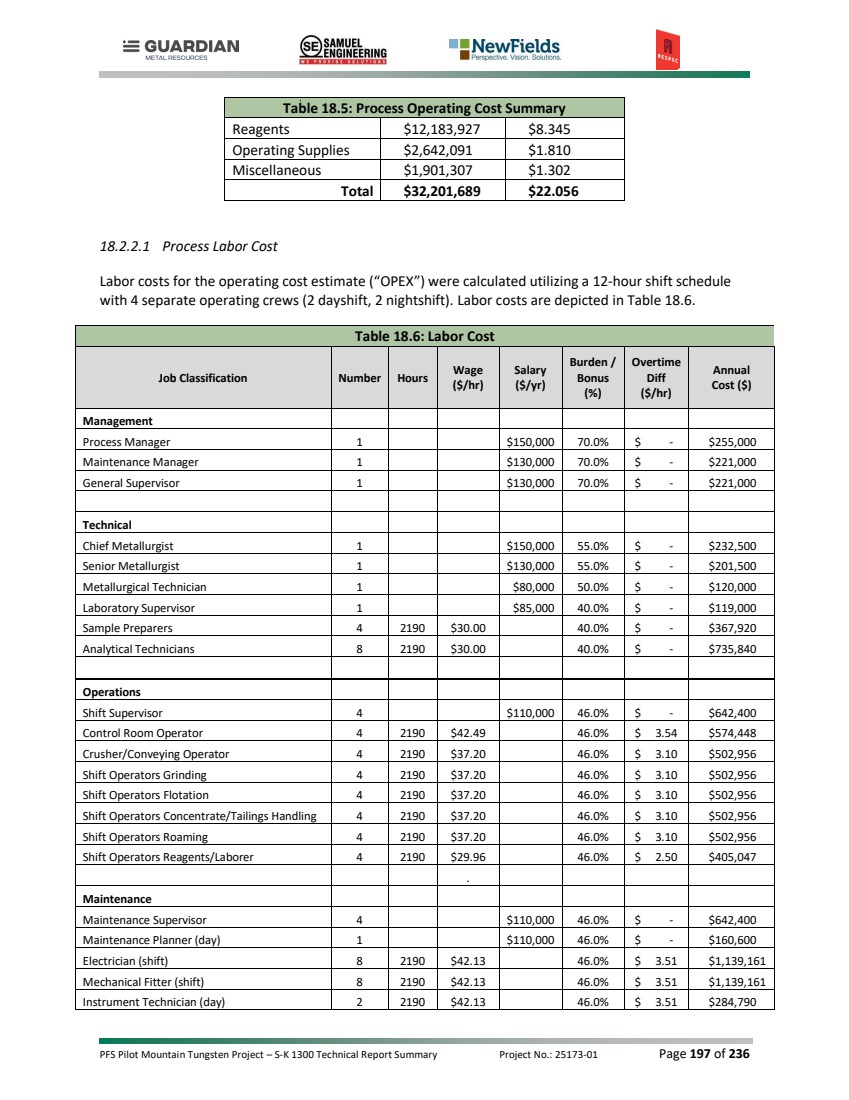
| PFS Pilot Mountain Tungsten Project – S-K 1300 Technical Report Summary Project No.: 25173-01 Page 198 of 236 Table 18.6: Labor Cost Trades Assistant 8 2190 $33.18 46.0% $ 2.77 $897,161 Staff 82 $10,873,710 18.2.2.2 Process Power Cost Power costs (Table 18.7) for the OPEX were estimated using estimated power draw from the electrical load list. Unit rates for the power costs were calculated using $0.0611 per kWh. Table 18.7: Process Power Cost Description Power Draw (kW) Energy (MWh/y) Consumption (kWh/tonne) Total Cost (US$/year) Unit Cost ($/tonne) Grinding Power 3,655 29,456 20.176 $1,799,785 $1.233 BOP Power 5,688 45,841 31.398 $2,800,869 $1.918 Total 9,343 75,297 51.573 $4,600,653 $3.151 18.2.2.3 Reagents Cost Reagent usages shown in Table 18.8 are based on laboratory testwork, and costs were provided by regional and national suppliers. An additional freight cost of 8% was added to costs for reagents quoted FOB. Table 18.8: Reagents Cost Consumption (unit/tonne) Unit Cost (US$/unit) Total Cost (US$/year) Unit Cost ($/tonne) Collector (kg) - PAX 0.06 $3.564 $320,011.56 $0.219 Collector (kg) - A704 0.42 $3.860 $2,338,774.00 $1.602 Frother (kg) - MIBC 0.05 $2.592 $185,431.68 $0.127 Sodium Silicate (kg) 4.60 $0.830 $5,574,280.00 $3.818 Sodium Sulfide (kg) 0.06 $0.842 $73,794.24 $0.051 Soda Ash (kg) 0.13 $0.540 $102,492.00 $0.070 Copper Sulfate (kg) 0.10 $5.076 $741,096.00 $0.508 Flocculant (kg) 0.07 $2.000 $189,800.00 $0.130 Grinding Media Rods (kg) 0.91 $0.980 $1,297,817.63 $0.889 Grinding Media (kg) 1.18 $0.792 $1,360,430.38 $0.932 Total - - $12,183,927.50 $8.345 18.2.2.4 Operating Supplies Cost Operating supplies costs shown in Table 18.9 are calculated based on a percentage of total installed equipment cost and includes filter cloths, concentrate packaging (supersacks), equipment liners, lubricants, oil, etc. The percentage used (8%) is based on historical data of similar operating processes. |
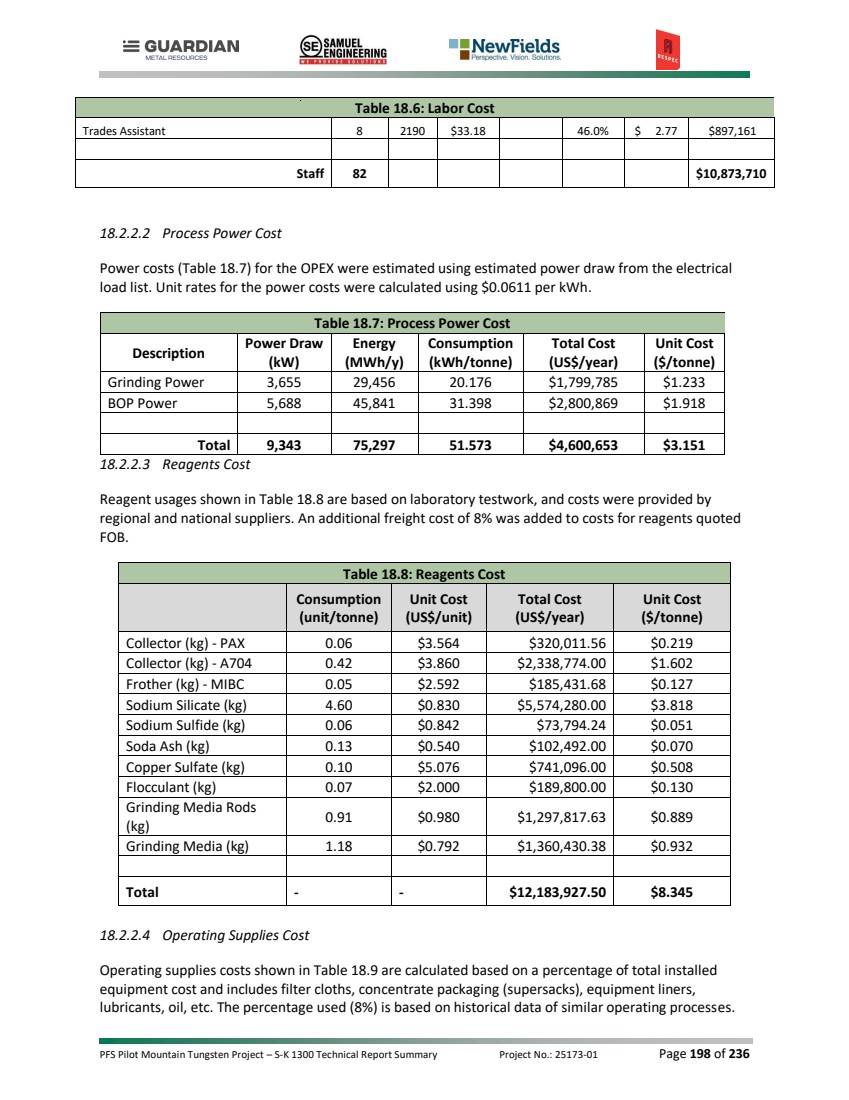
| PFS Pilot Mountain Tungsten Project – S-K 1300 Technical Report Summary Project No.: 25173-01 Page 199 of 236 Table 18.9: Operating Supplies Annual Cost ($) Unit Cost ($/tonne) Operating Supplies (liners, lubricant, oil, etc.) $2,642,091 $1.810 Total $2,642,091 $1.810 18.2.2.5 Miscellaneous Supplies Cost Laboratory operating costs are benchmarked on previous similar projects. Maintenance supplies for equipment repair (non-capital spares) are calculated based on a percentage of total installed equipment cost. The percentage used (5%) is based on historical data of similar operating processes. Seed Table 18.10 below for miscellaneous supplies costs. Table 18.10: Miscellaneous Supplies Cost Description Annual Cost ($) Unit Cost ($/tonne) Laboratory Supplies $250,000 $0.171 Maintenance Supplies/Equipment Repair $1,651,307 $1.131 Total $1,901,307 $1.302 18.2.3 Mine Operating Costs Operating costs have been estimated based on contractor quotations for the mining of ore and waste, assuming a long-term diesel cost of $0.877/liter ($3.32/gallon) as provided by Samuel Engineering. The contractor operating cost is shown in Table 18.11. Note that the costs for year -2 and the first three quarters are capitalized. However, they are presented here for transparency of the costs. The same is true for the owner’s operating costs shown in Table 18.13. Additional costs were assumed for “Forced Work,” which is additional work the contractor will be hired to complete with their equipment and is based on hourly costs provided by the contractor's hourly rates and equipment type, including labor. These costs are shown in Table 18.12. Assumptions were made to estimate the hours of equipment used for the Forced Work, including: • D8 type dozer pushing piles near the plant 4 hours per month. • Cat 988 to be used as a backup to the plant loader at 8 hours per month. • Water truck used to wet roads around buildings and the plant 8 hours per week. • Grader maintaining the 17-mile of access road and around buildings and facilities, 8 hours per week. |
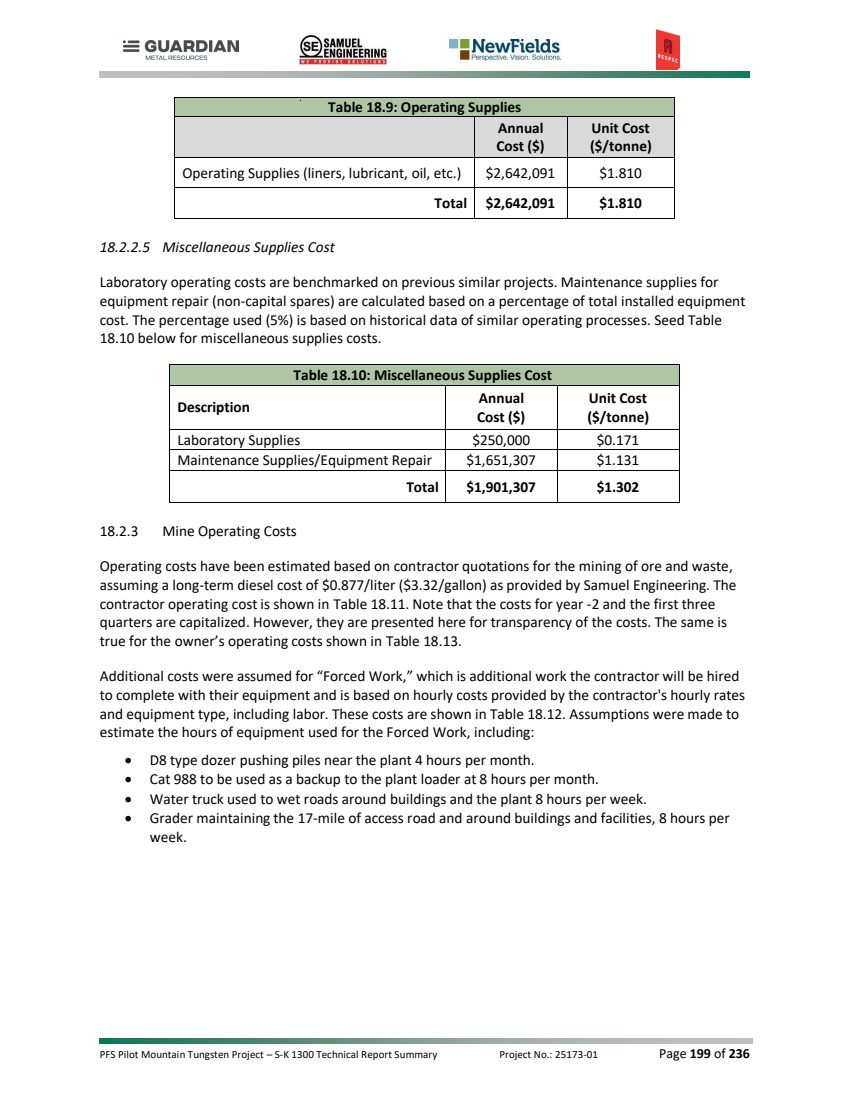
| PFS Pilot Mountain Tungsten Project – S-K 1300 Technical Report Summary Project No.: 25173-01 Page 200 of 236 Table 18.11: Mine Contractor Operating Costs Table 18.12: Forced Work Costs Mine general costs are shown in Table 18.13 and include personnel costs, supplies, and other costs. The personnel costs are based on wages and salaries plus 40% burden. Salaries also include 6% to 25% bonus assumptions, depending on position. Supplies and other costs have been based on previous studies. Cost - Ore Mined Units Yr -2 Yr -1 Yr 1 Yr 2 Yr 3 Yr 4 Yr 5 Yr 6 Yr 7 Yr 8 Yr 9 Yr 10 Total Blast & Haul - Total Cost k USD $ - $ 946 $ 3,309 $ 2,575 $ 4,290 $ 3,404 $ 3,273 $ 4,184 $ 3,803 $ 3,294 $ - $ - $ 29,078 Blast & Haul - Total Cost / t $/t $ - $ 2.08 $ 2.10 $ 2.22 $ 2.28 $ 2.66 $ 2.48 $ 2.67 $ 2.78 $ 2.71 $ - $ - $ 2.46 Cost - Waste Mined Blast & Haul - Total Cost k USD $ 6,248 $ 17,294 $ 19,121 $ 34,811 $ 41,554 $ 50,073 $ 51,040 $ 44,217 $ 65,010 $ 29,184 $ - $ - $358,552 Blast & Haul - Total Cost / t $/t $ 2.41 $ 2.41 $ 2.38 $ 2.42 $ 2.38 $ 2.42 $ 2.52 $ 2.55 $ 2.32 $ 2.33 $ - $ - $ 2.41 Cost - Total Mining Blast & Haul - Total Cost k USD $ 6,248 $ 18,240 $ 22,430 $ 37,386 $ 45,844 $ 53,477 $ 54,313 $ 48,401 $ 68,813 $ 32,478 $ - $ - $387,630 Blast & Haul - Total Cost / t $/t $ 2.41 $ 2.39 $ 2.34 $ 2.41 $ 2.37 $ 2.44 $ 2.52 $ 2.56 $ 2.34 $ 2.36 $ - $ - $ 2.42 Cost - Rehandle Blast & Haul - Total Cost k USD $ - $ 80 $ 276 $ 543 $ 117 $ 552 $ 296 $ 100 $ 167 $ 271 $ 26 $ - $ 2,429 Blast & Haul - Total Cost / t Rehandle $/t $ - $ 1.10 $ 1.10 $ 1.10 $ 1.10 $ 1.10 $ 1.10 $ 1.10 $ 1.10 $ 1.10 $ 1.10 $ - $ 1.10 Drill & Blast Ore Mining k USD $ - $ 544 $ 1,891 $ 1,393 $ 2,255 $ 1,536 $ 1,585 $ 1,880 $ 1,641 $ 1,461 $ - $ - $ 14,187 Waste Mining k USD $ 3,111 $ 8,623 $ 9,635 $ 17,255 $ 20,929 $ 24,816 $ 24,323 $ 20,845 $ 33,650 $ 15,046 $ - $ - $178,233 Total Mining k USD $ 3,111 $ 9,167 $ 11,526 $ 18,648 $ 23,184 $ 26,352 $ 25,908 $ 22,725 $ 35,292 $ 16,507 $ - $ - $192,420 Forced Work D8 Dozer Cost k USD $ 5 $ 15 $ 15 $ 15 $ 15 $ 15 $ 15 $ 15 $ 15 $ 15 $ 1 $ - $ 142 Cat 988 Cost k USD $ 12 $ 37 $ 37 $ 37 $ 37 $ 37 $ 37 $ 37 $ 37 $ 37 $ 3 $ - $ 344 Water Truck Cost k USD $ 21 $ 62 $ 62 $ 62 $ 62 $ 62 $ 62 $ 62 $ 62 $ 62 $ 5 $ - $ 584 Grader Cost k USD $ 41 $ 124 $ 124 $ 124 $ 124 $ 124 $ 124 $ 124 $ 124 $ 124 $ 11 $ - $ 1,168 Total Forced Work Cost k USD $ 79 $ 238 $ 237 $ 237 $ 237 $ 238 $ 237 $ 237 $ 237 $ 238 $ 20 $ - $ 2,238 Total Mine Contractor Cost Contractor - Mining Total Cost k USD $ 9,359 $ 27,487 $ 34,232 $ 56,578 $ 69,146 $ 80,381 $ 80,517 $ 71,227 $104,272 $ 49,255 $ 26 $ - $582,479 Contractor Forced Work k USD $ 79 $ 238 $ 237 $ 237 $ 237 $ 238 $ 237 $ 237 $ 237 $ 238 $ 20 $ - $ 2,238 Total Contractor Cost k USD $ 9,438 $ 27,725 $ 34,469 $ 56,815 $ 69,383 $ 80,619 $ 80,755 $ 71,464 $104,510 $ 49,493 $ 47 $ - $584,718 Contractor - Total Cost / t Mined $/t $ 3.64 $ 3.63 $ 3.59 $ 3.66 $ 3.59 $ 3.67 $ 3.74 $ 3.77 $ 3.55 $ 3.60 $ - $ - $ 3.63 Contractor - Total Cost / t Moved $/t $ 3.64 $ 3.60 $ 3.50 $ 3.54 $ 3.57 $ 3.59 $ 3.69 $ 3.76 $ 3.54 $ 3.53 $ 1.93 $ - $ 3.58 Forced Work Calculations Units Yr -2 Yr -1 Yr 1 Yr 2 Yr 3 Yr 4 Yr 5 Yr 6 Yr 7 Yr 8 Yr 9 Yr 10 Total Tonnage Mined k Tonnes 2,592 7,639 9,605 15,540 19,320 21,960 21,590 18,938 29,410 13,756 - - 160,350 Rehandle k Tonnes - 73 251 495 107 503 270 91 152 246 24 - 2,212 Tonnage Moved k Tonnes 2,592 7,712 9,856 16,035 19,427 22,463 21,860 19,029 29,562 14,002 24 - 162,562 Operation Days Days/Year 122 366 365 365 365 366 365 365 365 366 31 - 3,441 D8 Dozer Hours Op Hrs 16 48 48 48 48 48 48 48 48 48 4 - 452 Cat 988 Hours Op Hrs 32 96 96 96 96 96 96 96 96 96 8 - 904 Water Truck Hours Op Hrs 70 209 209 209 209 209 209 209 209 209 18 - 1,966 Grader Hours Op Hrs 139 418 417 417 417 418 417 417 417 418 35 - 3,933 D8 Dozer Cost k USD $ 5 $ 15 $ 15 $ 15 $ 15 $ 15 $ 15 $ 15 $ 15 $ 15 $ 1 $ - $ 142 Cat 988 Cost k USD $ 12 $ 37 $ 37 $ 37 $ 37 $ 37 $ 37 $ 37 $ 37 $ 37 $ 3 $ - $ 344 Water Truck Cost k USD $ 21 $ 62 $ 62 $ 62 $ 62 $ 62 $ 62 $ 62 $ 62 $ 62 $ 5 $ - $ 584 Grader Cost k USD $ 41 $ 124 $ 124 $ 124 $ 124 $ 124 $ 124 $ 124 $ 124 $ 124 $ 11 $ - $ 1,168 Total Forced Work Cost k USD $ 79 $ 238 $ 237 $ 237 $ 237 $ 238 $ 237 $ 237 $ 237 $ 238 $ 20 $ - $ 2,238 Total Forced Work Cost/t $/t Mined $ 0.03 $ 0.03 $ 0.02 $ 0.01 $ 0.01 $ 0.01 $ 0.01 $ 0.01 $ 0.01 $ 0.02 $ 0.83 $ - $ 0.01 |
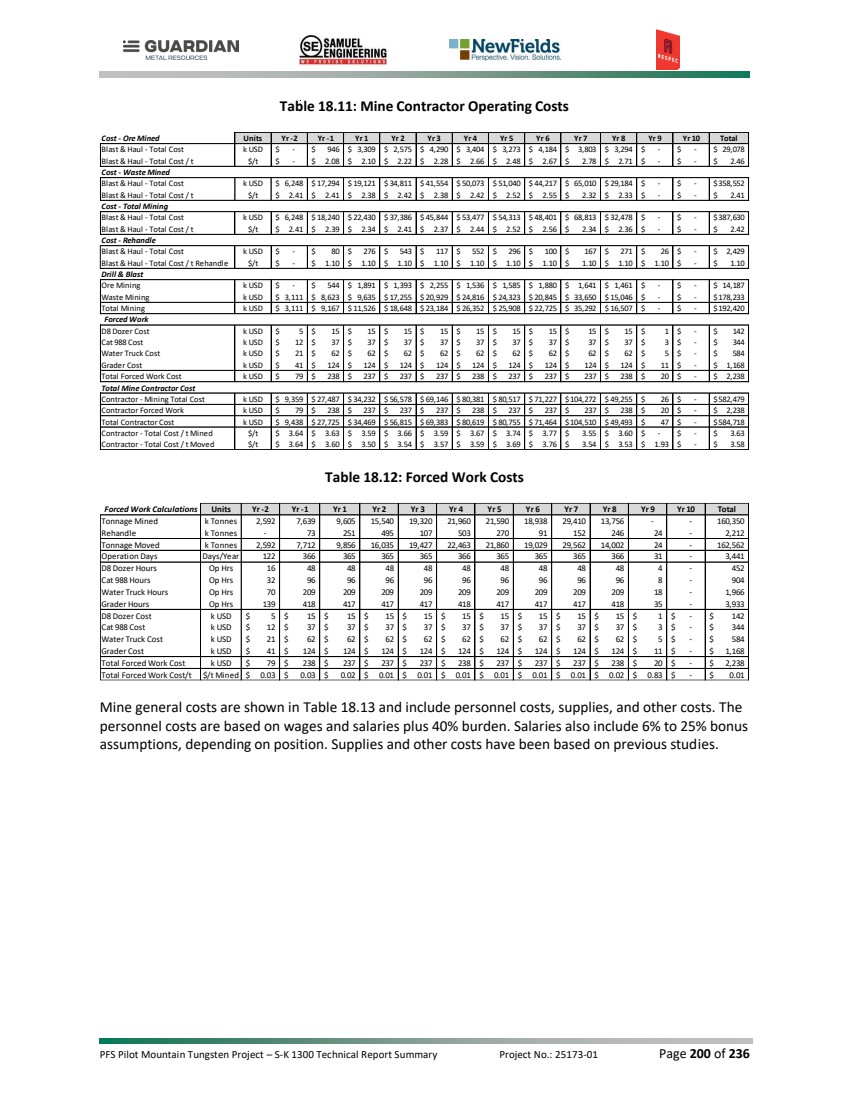
| PFS Pilot Mountain Tungsten Project – S-K 1300 Technical Report Summary Project No.: 25173-01 Page 201 of 236 Table 18.13: Mine General Costs Personnel Costs Units Yr -2 Yr -1 Yr 1 Yr 2 Yr 3 Yr 4 Yr 5 Yr 6 Yr 7 Yr 8 Yr 9 Yr 10 Total Mine Superintendent k USD $ 83 $ 248 $ 248 $ 248 $ 248 $ 248 $ 248 $ 248 $ 248 $ 248 $ 21 $ - $ 2,331 Mine Clerk k USD $ 32 $ 95 $ 95 $ 95 $ 95 $ 95 $ 95 $ 95 $ 95 $ 95 $ - $ - $ 886 Chief Mine Engineer k USD $ 83 $ 248 $ 248 $ 248 $ 248 $ 248 $ 248 $ 248 $ 248 $ 248 $ 21 $ - $ 2,331 Mine Engineer k USD $ 44 $ 132 $ 132 $ 132 $ 132 $ 132 $ 132 $ 132 $ 132 $ 132 $ - $ - $ 1,230 Chief Surveyor k USD $ 55 $ 165 $ 165 $ 165 $ 165 $ 165 $ 165 $ 165 $ 165 $ 165 $ 14 $ - $ 1,554 Surveyor k USD $ 39 $ 117 $ 117 $ 117 $ 117 $ 117 $ 117 $ 117 $ 117 $ 117 $ - $ - $ 1,090 Chief Geologist k USD $ 72 $ 215 $ 215 $ 215 $ 215 $ 215 $ 215 $ 215 $ 215 $ 215 $ 18 $ - $ 2,020 Ore Control Geologist k USD $ 41 $ 124 $ 124 $ 124 $ 124 $ 124 $ 124 $ 124 $ 124 $ 124 $ 10 $ - $ 1,168 Samplers k USD $ 32 $ 95 $ 95 $ 95 $ 95 $ 95 $ 95 $ 95 $ 95 $ 95 $ - $ - $ 886 Total Owner Personnel k USD $ 479 $ 1,437 $ 1,437 $ 1,437 $ 1,437 $ 1,437 $ 1,437 $ 1,437 $ 1,437 $ 1,437 $ 83 $ - $ 13,494 Supplies & Other Mine General Services Supplies k USD $ 16 $ 48 $ 48 $ 48 $ 48 $ 48 $ 48 $ 48 $ 48 $ 48 $ 2 $ - $ 450 Engineering Supplies k USD $ 8 $ 24 $ 24 $ 24 $ 24 $ 24 $ 24 $ 24 $ 24 $ 24 $ 1 $ - $ 225 Geology Supplies k USD $ 6 $ 18 $ 18 $ 18 $ 18 $ 18 $ 18 $ 18 $ 18 $ 18 $ 1 $ - $ 169 Software Maintenance & Support k USD $ 12 $ 36 $ 36 $ 36 $ 36 $ 36 $ 36 $ 36 $ 36 $ 36 $ 1 $ - $ 337 Outside Services k USD $ 12 $ 36 $ 36 $ 36 $ 36 $ 36 $ 36 $ 36 $ 36 $ 36 $ - $ - $ 336 Light Vehicles k USD $ 24 $ 72 $ 72 $ 72 $ 72 $ 72 $ 72 $ 72 $ 72 $ 72 $ 3 $ - $ 675 Mag Chloride Application (access) k USD $ 170 $ 340 $ 340 $ 340 $ 340 $ 340 $ 340 $ 340 $ 340 $ 340 $ - $ - $ 3,230 Total k USD $ 248 $ 574 $ 574 $ 574 $ 574 $ 574 $ 574 $ 574 $ 574 $ 574 $ 8 $ - $ 5,422 Total Mine General Services Mine General Services Personnel k USD $ 479 $ 1,437 $ 1,437 $ 1,437 $ 1,437 $ 1,437 $ 1,437 $ 1,437 $ 1,437 $ 1,437 $ 83 $ - $ 13,494 Supplies & Other k USD $ 248 $ 574 $ 574 $ 574 $ 574 $ 574 $ 574 $ 574 $ 574 $ 574 $ 8 $ - $ 5,422 Total Mine General Services k USD $ 727 $ 2,011 $ 2,011 $ 2,011 $ 2,011 $ 2,011 $ 2,011 $ 2,011 $ 2,011 $ 2,011 $ 91 $ - $ 18,915 Mine General Services - Personnel $/t Mined $ 0.18 $ 0.19 $ 0.15 $ 0.09 $ 0.07 $ 0.07 $ 0.07 $ 0.08 $ 0.05 $ 0.10 $ - $ - $ 0.08 $/t Mined $ 0.10 $ 0.08 $ 0.06 $ 0.04 $ 0.03 $ 0.03 $ 0.03 $ 0.03 $ 0.02 $ 0.04 $ - $ - $ 0.03 Total Mine General Services $/t Mined $ 0.28 $ 0.26 $ 0.21 $ 0.13 $ 0.10 $ 0.09 $ 0.09 $ 0.11 $ 0.07 $ 0.15 $ - $ - $ 0.12 |
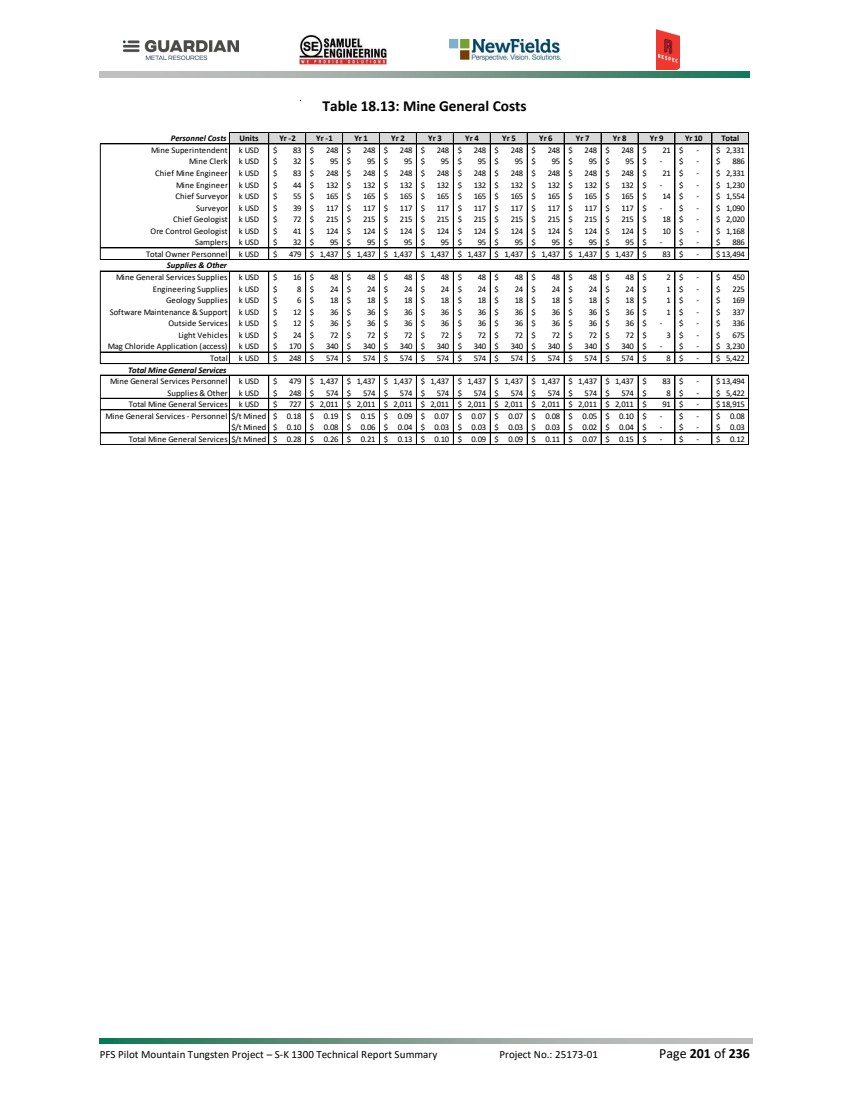
| PFS Pilot Mountain Tungsten Project – S-K 1300 Technical Report Summary Project No.: 25173-01 Page 202 of 236 19.0 ECONOMIC ANALYSIS 19.1 CAUTIONARY STATEMENT Certain information and statements contained in this section and in the Report are “forward looking” in nature. Forward-looking statements include, but are not limited to, statements with respect to the economic and study parameters of the Project; Mineral Resource estimates; the cost and timing of any development of the Project; the proposed mine plan and mining methods; dilution and extraction recoveries; processing method and rates and production rates; projected metallurgical recovery rates; infrastructure requirements; capital, operating and sustaining cost estimates; the projected life of mine and other expected attributes of the Project; the net present value (NPV) and internal rate of return (IRR after-tax) and payback period of capital; capital; future metal prices; the timing of the environmental assessment process; changes to the Project configuration that may be requested as a result of stakeholder or government input to the environmental assessment process; government regulations and permitting timelines; estimates of reclamation obligations; requirements for additional capital; environmental risks; and general business and economic conditions. All forward-looking statements in this Report are necessarily based on opinions and estimates made as of the date such statements are made and are subject to important risk factors and uncertainties, many of which cannot be controlled or predicted. Material assumptions regarding forward-looking statements are discussed in this Report, where applicable. In addition to, and subject to, such specific assumptions discussed in more detail elsewhere in this Report, the forward-looking statements in this Report are subject to the following assumptions: • There being no significant disruptions affecting the development and operation of the Project. • The availability of certain consumables and services and the prices for power and other key supplies being approximately consistent with assumptions in the Report. • Labor and materials costs being approximately consistent with the assumptions in the Report. • Permitting and arrangements with stakeholders being consistent with current expectations as outlined in the Report. • All environmental approvals, required permits, licenses and authorizations will be obtained from the relevant governments and other relevant stakeholders. • Certain tax rates, including the allocation of certain tax attributes, being applicable to the Project. • The availability of financing for the planned development activities. • The timelines for exploration and development activities on the Project. • Assumptions made in Mineral Resource estimate and the financial analysis based on that estimate, including, but not limited to, geological interpretation, grades, commodity price assumptions, extraction and mining recovery rates, hydrological and hydrogeological assumptions, capital and operating cost estimates, and general marketing, political, business, and economic conditions. The production schedules and financial analysis annualized cash flow table are presented with conceptual years shown. Years shown in these tables are for illustrative purposes only. This PFS supports a Mineral Reserve declaration, with the mine plan and financial analysis based on Probable Mineral Reserves as defined under S-K 1300 standards. The PFS provides a higher level of confidence than previous studies, but like all forward-looking information, there is no guarantee that results, estimates, or projections will be realized as anticipated. |
| PFS Pilot Mountain Tungsten Project – S-K 1300 Technical Report Summary Project No.: 25173-01 Page 203 of 236 19.2 METHODOLOGY USED Samuel Engineering conducted a discounted cash flow analysis for the Pilot Mountain Project. The economic analysis of the Project is reliant on the project schedule, mine schedule, capital, and operating costs discussed in the previous sections of this report. The technical and cost inputs were developed by Samuel Engineering, RESPEC and Newfields with specific data provided by Guardian Metal Resources. These inputs were reviewed in detail and deemed reasonable. The analysis was performed on a stand-alone project basis, using annual cash flows discounted at 8% on a mid-year basis. The economic evaluation was conducted as of the start of construction (Year -2), based on Q1 2026 US dollars. Sunk costs (expenditures incurred before construction) are excluded from the economic analysis. The accuracy of this evaluation aligns with the capital cost estimate, with an expected range of -15% to +20%. 19.3 FINANCIAL MODEL PARAMETERS Technical-economic parameters used in the model are summarized in the following sections. Table 19.1 presents the model inputs used in the economic analysis based on second-quarter, 2026 US dollars. Table 19.1: Economic Model Parameters Description Values Construction Period (years) 1.51 Mine Life (years) 8.00 Operating Life (years) 8.00 Discount Rate 8% Closure Duration 20 years (Starting in Year 9) Production Inputs Tungsten Recovery (%) 78.5% Zinc Recovery (%) 70% Silver Recovery (%) 60% Production Ore Processed (k tonnes) 11,822 Waste Mined (k tonnes) 148,528 Strip Ratio 12.56 Tungsten - LOM WO3 (MTU) 1,591,625 Zinc - LOM Zn (tonnes) 20,037 Silver - LOM Ag (k ozs) 2,117 Metal Pricing Tungsten Price ($/MTU) $1,973 Zinc Price ($/tonne) $3,300 Silver Price ($/oz) $64.00 Cost Criteria Estimate Basis Second Quarter 2026 Inflation None Leverage 100% Equity Royalties Platoro Royalty 2% |
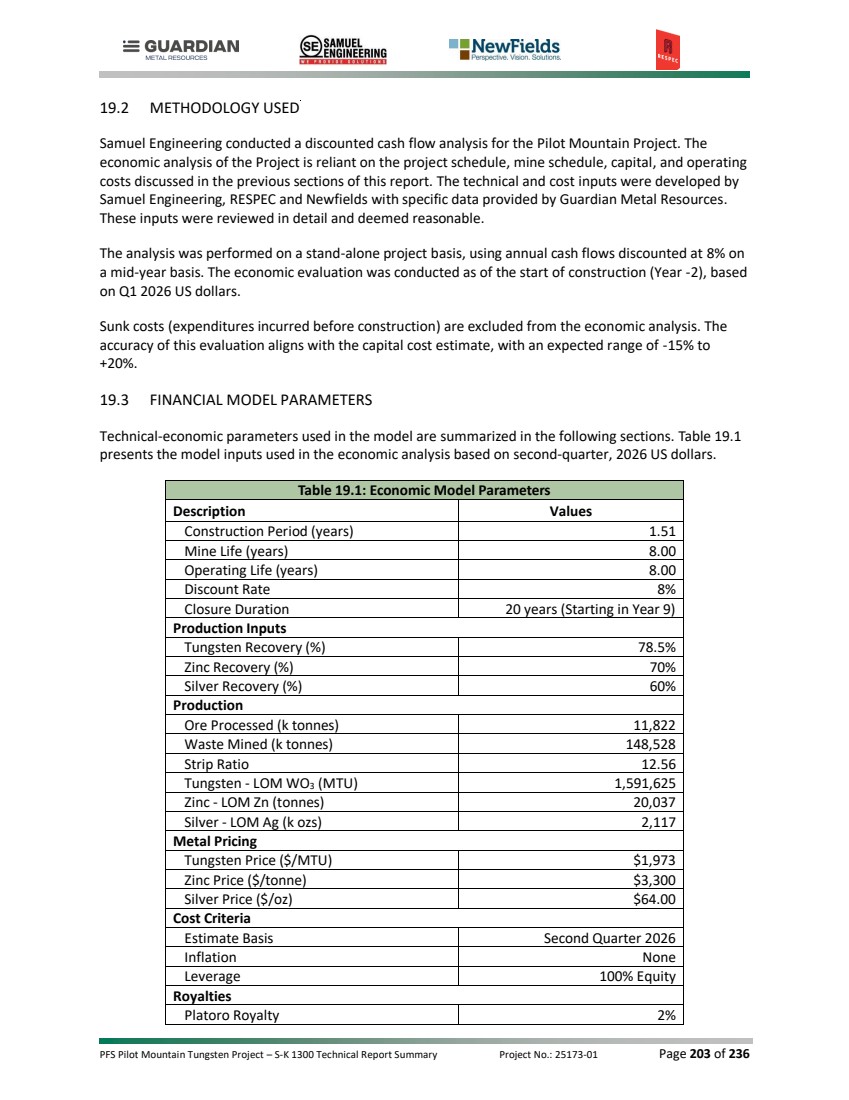
| PFS Pilot Mountain Tungsten Project – S-K 1300 Technical Report Summary Project No.: 25173-01 Page 204 of 236 Table 19.1: Economic Model Parameters Taxes Nevada State Tax 5.0% Federal Tax 21.0% 19.4 CAPITAL COSTS The total life-of-mine capital cost is estimated at $366.5 million, including $288.7 million during preproduction, $43.9 million for working capital, and $33.9 million in sustaining capital over the mine life. Table 19.2 summarizes the capital cost over the mine life. Table 19.2: Initial Capital Cost Summary Description Cost ($000s) DIRECT COSTS General Site Facilities & Mine 31,513 Crushing 11,928 Grinding 21,137 Sulfide Flotation 19,743 Oxide Flotation 9,256 Concentrate Handling 6,842 Tailings Handling 2,772 Tailings Facility 17,651 Reagents 17,322 Water Pipeline 11,649 Utilities 5,444 INDIRECT COSTS Contractor Indirects 6,393 Construction Equipment 2,877 Third Party Surveying/Testing – Process 630 Third Party Surveying & QA/QC – TSF 1,103 Construction Camp 12,500 EPCM - Process & Ancillary Facilities 15,156 EPCM - Tailings Facilities 662 Pre-Operational Testing 400 Vendor Reps 327 Process Facilities Spare Parts 1,633 Initial Fills 1,169 Plant Mobile Equipment 2,053 Mine Equipment 1,705 Preproduction Mining 34,315 Freight 5,240 Owner's Cost 9,623 Contingency 37,657 TOTAL INITIAL CAPITAL 288,701 |
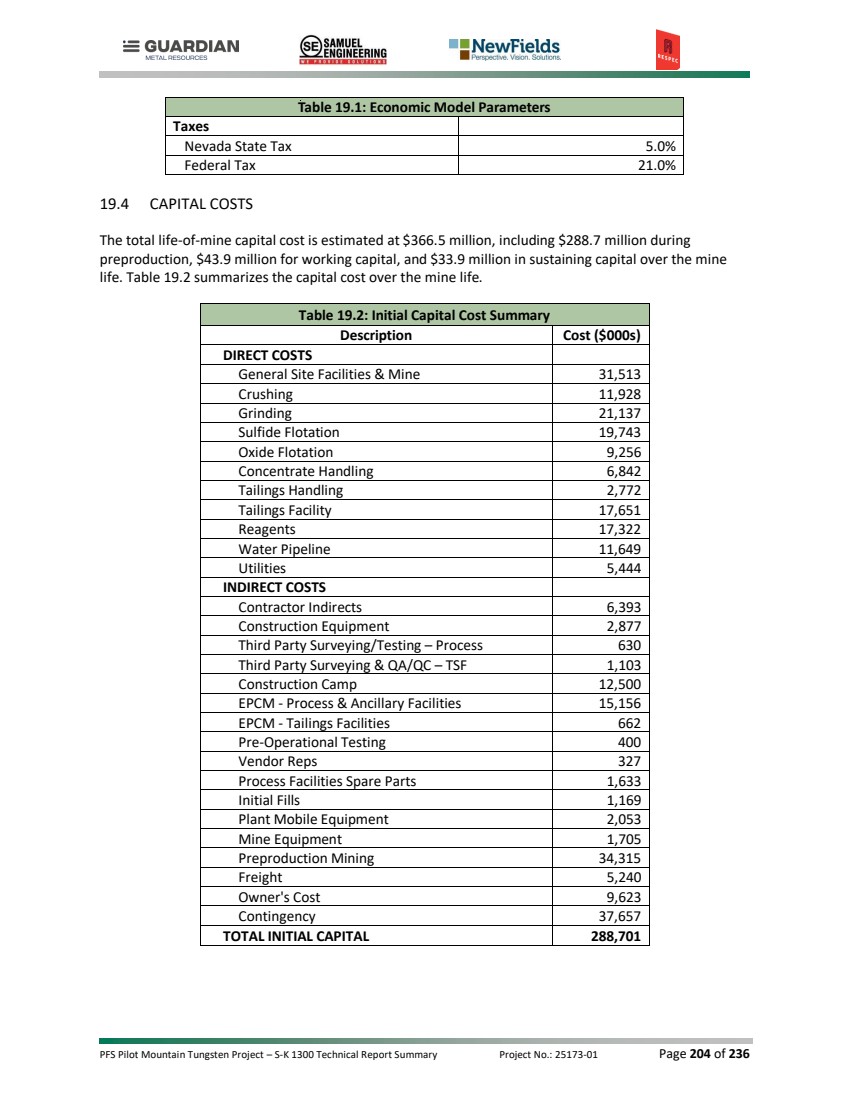
| PFS Pilot Mountain Tungsten Project – S-K 1300 Technical Report Summary Project No.: 25173-01 Page 205 of 236 Table 19.3: Sustaining and Working Capital Cost Summary Description Cost ($000s) Mining 995 Tailings Management Facility 29,460 Process Plant 3,474 Total Sustaining Capital 33,929 Working Capital 43,876 Total Working & Sustaining Capital 77,805 19.5 OPERATING COST Table 19.4 shows the total LOM operating cost is estimated at $936 million. Figure 19.1 shows the OPEX split between mining, processing and general and administrative costs. Table 19.4: Project Operating Cost Summary Description LOM Cost ($000s) LOM Cost/tonne Mineralized Material ($) LOM Cost/MTU WO3 ($) Mining 569,318 48.16 357.70 Processing 293,902 24.86 184.66 General & Administrative 73,682 6.23 46.29 LOM Operating Cost 936,902 79.25 588.64 Figure 19.1: OPEX Split 19.6 ROYALTIES The Pilot Mountain project is subject to a single royalty, Platoro royalty payments are based on 2.0% of the gross metal sales receipts due to Apex Royalties. The estimated royalty payments for life-of-mine totals $54.1 million. Mining 61% Process 31% G & A 8% Operating Cost Split |
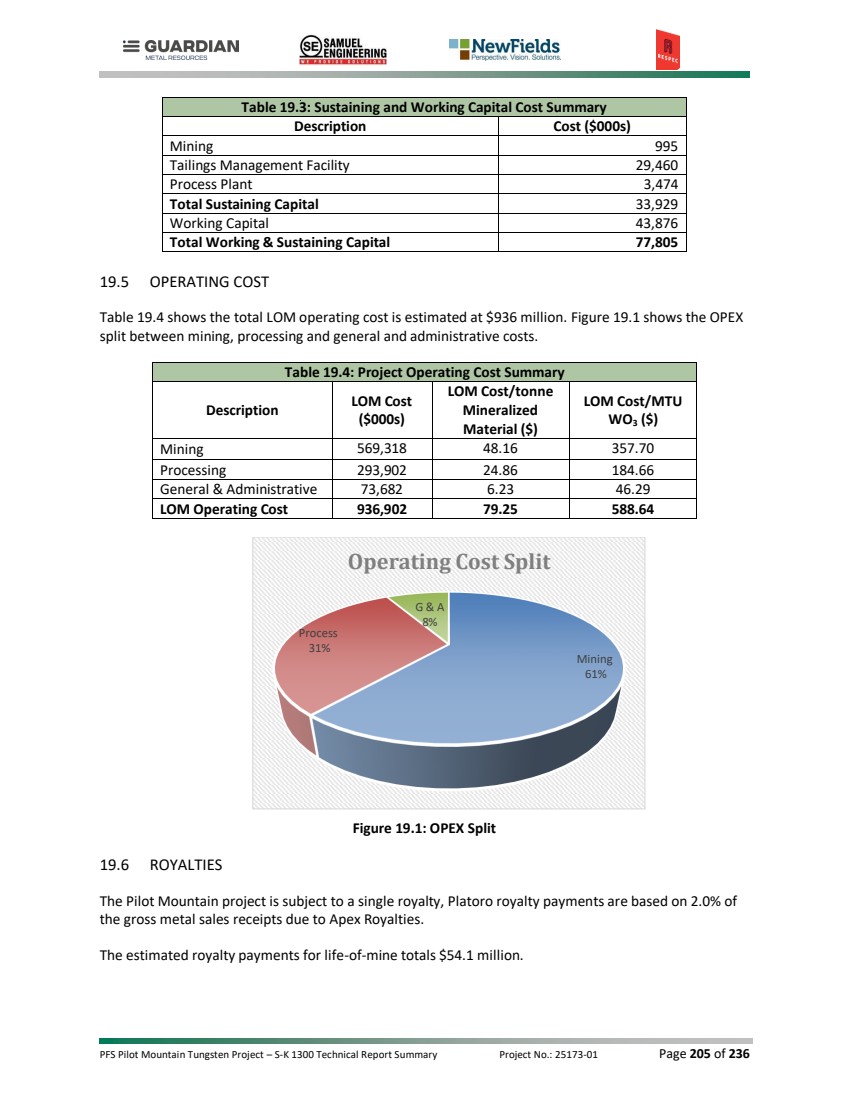
| PFS Pilot Mountain Tungsten Project – S-K 1300 Technical Report Summary Project No.: 25173-01 Page 206 of 236 19.7 TAXES The U.S. federal and state income tax computation was prepared based on the Internal Revenue Code of 1986, as amended, the relevant state and local statutes and the regulations thereunder as currently in effect. Any subsequent changes or modifications to U.S. federal or state tax statutes, regulations or to the judicial and administrative interpretations thereof may impact the federal and state income tax computations. Economic or operating assumptions of the PFS model are based on unaudited financials, but the taxation calculation process included queries to properly classify revenue, expenses and capital expenditures consistent with federal and state income tax statutes, regulations and case law. The following is a summary of tax elections incorporated into this tax computation: • The Pilot Mountain Project mineral-interest is a single property under Section 614. • All tax elections were made in order to maximize the net present value of the mine on an annual basis to the extent allowed. • The Pilot Mountain Project will elect to deduct exploration costs under Section 617(a) and deduct mine development under Section 616(a) subject to corporate preference adjustment under Section 291(b)(2) to the extent incurred. • The Pilot Mountain Project will not elect out of federal Section 168(k) bonus depreciation. • The Pilot Mountain Project will elect Section 468 to deduct reclamation under Section 468 over the life of the mine. • The Pilot Mountain Project will sell its tungsten concentrate at the mine site freight on board ("FOB"). • The Pilot Mountain Project will sell its zinc concentrate outside of the U.S. and therefore is eligible for the Section 250 FDII deduction available for exported goods. • No Section 382 ownership changes are expected to occur after the year ended June 30, 2026 which could limit the availability of tax attributes during the construction and/or subsequent years when the mine is in operation. • The Nevada Net Proceeds of Mines tax liability has been computed in accordance with the Nevada Revised Statute 362 and the administrative code thereunder. The tax rate applied is 5.0 percent based on the annual profitability of mine. U.S. federal and state income tax including Nevada Net Proceeds of Minerals Tax calculations have been incorporated for the Pilot Mountain Tungsten Project PFS. Other potential or possible taxes have not been included or reviewed including but not limited to foreign income, gross receipts, sales, use, transfer, franchise, registration, license, lease, service, service use, withholding, payroll, employment, unemployment, excise, environmental, stamp, occupation, customs, duties or other taxes, fees, assessments or charges of any kind whatsoever, nor any interest, additions or penalties with respect thereto and any interest in respect of such additions or penalties in the model. The PFS reflects cumulative life-time pre-tax cash flow of U.S. $1,360.8 million after $344.9 million for life of project capital expenditures. Based on this information and detailed discussions and representations concerning the Pilot Mountain Tungsten Project, the expected approximate amount of federal income taxes to be $219.6 million, and Nevada Net Proceeds Tax of $83.0 million. 19.8 ECONOMIC RESULTS The results of the economic analysis are provided in Table 19.5. Table 19.6 shows the cash flow summary. |

| PFS Pilot Mountain Tungsten Project – S-K 1300 Technical Report Summary Project No.: 25173-01 Page 207 of 236 Table 19.5: Economic Model Results - $197,300 W per tonne Key Project Indicators Value US$ (000's) Pre Tax Economics IRR 67.8% Cash Flow (Undiscounted) $1,360,773 NPV 8% Discount Rate $856,682 1st 3 Years Net Profit (Avg) $181,372 After Tax Results IRR 59.6% Cash Flow (Undiscounted) $1,058,090 NPV 8% Discount Rate $660,273 Payback (years) 1.0 |
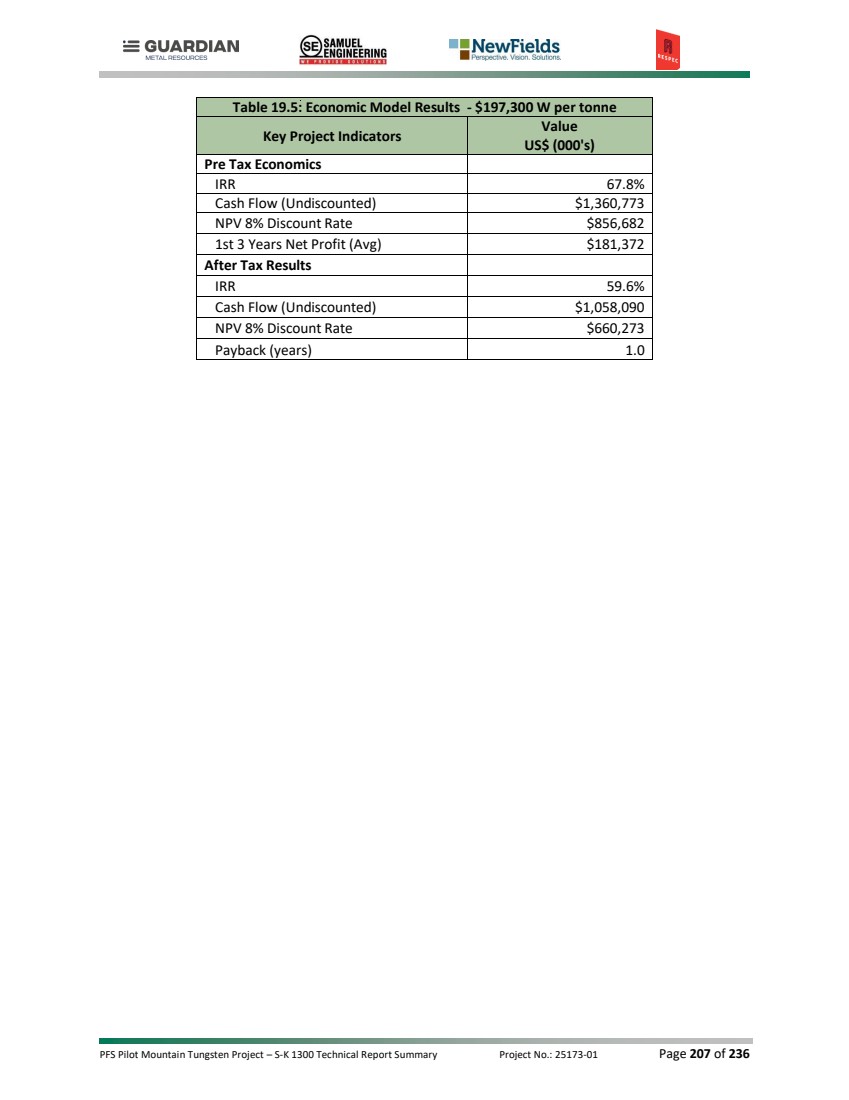
| PFS Pilot Mountain Tungsten Project – S-K 1300 Technical Report Summary Project No.: 25173-01 Page 208 of 236 Table 19.6: Cash Flow Projections $ Values in Millions Total Year -2 Year -1 Year 1 Year 2 Year 3 Year 4 Year 5 Year 6 Year 7 Year 8 Year 9 Year 10 Metal Produced WO3 (000 MTUs) 1,591.6 0.0 39.9 257.9 162.5 241.2 165.2 170.1 189.5 159.2 204.6 1.4 0.0 Zinc (Tonnes) 20,037 0 418 3,654 3,167 3,021 1,515 1,769 2,000 1,790 2,680 23 0 Silver (000 Ozs) 2,117.4 0.0 45.4 351.0 286.7 276.1 185.0 239.7 224.0 154.8 352.9 1.9 0.0 Revenue WO3 $2,575.0 $0.0 $64.6 $417.2 $262.9 $390.2 $267.3 $275.2 $306.7 $257.6 $331.0 $2.3 $0.0 Zinc (Tonnes) $33.1 $0.0 $0.7 $6.0 $5.2 $5.0 $2.5 $2.9 $3.3 $3.0 $4.4 $0.0 $0.0 Silver (Ozs) $94.9 $0.0 $2.0 $15.7 $12.8 $12.4 $8.3 $10.7 $10.0 $6.9 $15.8 $0.1 $0.0 Deductions Royalty $54.1 $0.0 $1.3 $8.8 $5.6 $8.2 $5.6 $5.8 $6.4 $5.3 $7.0 $0.0 $0.0 Sales Deductions $6.3 $0.0 $0.1 $1.1 $1.0 $1.0 $0.5 $0.6 $0.6 $0.6 $0.8 $0.0 $0.0 Net Income $2,642.6 $0.0 $65.8 $429.0 $274.4 $398.5 $272.0 $282.5 $312.9 $261.6 $343.4 $2.4 $0.0 Operating Costs Mining $569.3 $0.0 $5.6 $36.5 $58.8 $71.4 $82.6 $82.8 $73.5 $106.5 $51.5 $0.1 $0.0 Processing $293.9 $0.0 $3.1 $36.0 $36.3 $36.3 $36.4 $36.3 $36.3 $36.3 $36.4 $0.6 $0.0 General & Administrative $73.7 $0.0 $2.0 $8.6 $8.7 $8.9 $8.9 $8.9 $8.9 $8.9 $8.9 $0.6 $0.0 EBITA $1,705.7 $0.0 $55.1 $347.9 $170.6 $281.9 $144.0 $154.5 $194.2 $109.8 $246.6 $1.0 $0.0 Capital Costs $288.7 $120.6 $168.1 $0.0 $0.0 $0.0 $0.0 $0.0 $0.0 $0.0 $0.0 $0.0 $0.0 Sustaining Capital $33.9 $0.0 $0.0 $9.8 $0.4 $10.3 $0.9 $10.3 $0.4 $0.4 $0.4 $0.9 $0.0 Working Capital $0.0 $0.0 $43.9 $25.3 -$39.0 $67.3 -$52.1 -$25.5 $5.5 -$9.2 -$15.9 -$0.2 $0.0 Closure Bond & Closure Costs $22.3 $5.6 $1.4 $1.4 $1.4 $1.4 $0.0 $0.0 $0.0 $0.0 $0.0 $8.0 $3.2 Before Tax Cash Flow $1,360.8 -$126.1 -$158.2 $311.4 $207.8 $202.9 $195.2 $169.8 $188.3 $118.5 $262.0 -$7.6 -$3.2 Cumulative Before Tax Cash Flow $1,360.8 -$126.1 -$284.4 $27.1 $234.8 $437.7 $632.9 $802.7 $991.0 $1,109.5 $1,371.6 $1,363.9 $1,360.8 After Tax Cash Flow $1,058.1 -$126.1 -$159.2 $284.6 $186.2 $138.3 $164.6 $138.2 $144.0 $95.0 $203.3 -$7.7 -$3.2 Cumulative After Tax Cash Flow $1,058.1 -$126.1 -$285.4 -$0.8 $185.5 $323.8 $488.4 $626.6 $770.6 $865.6 $1,068.9 $1,061.3 $1,058.1 |
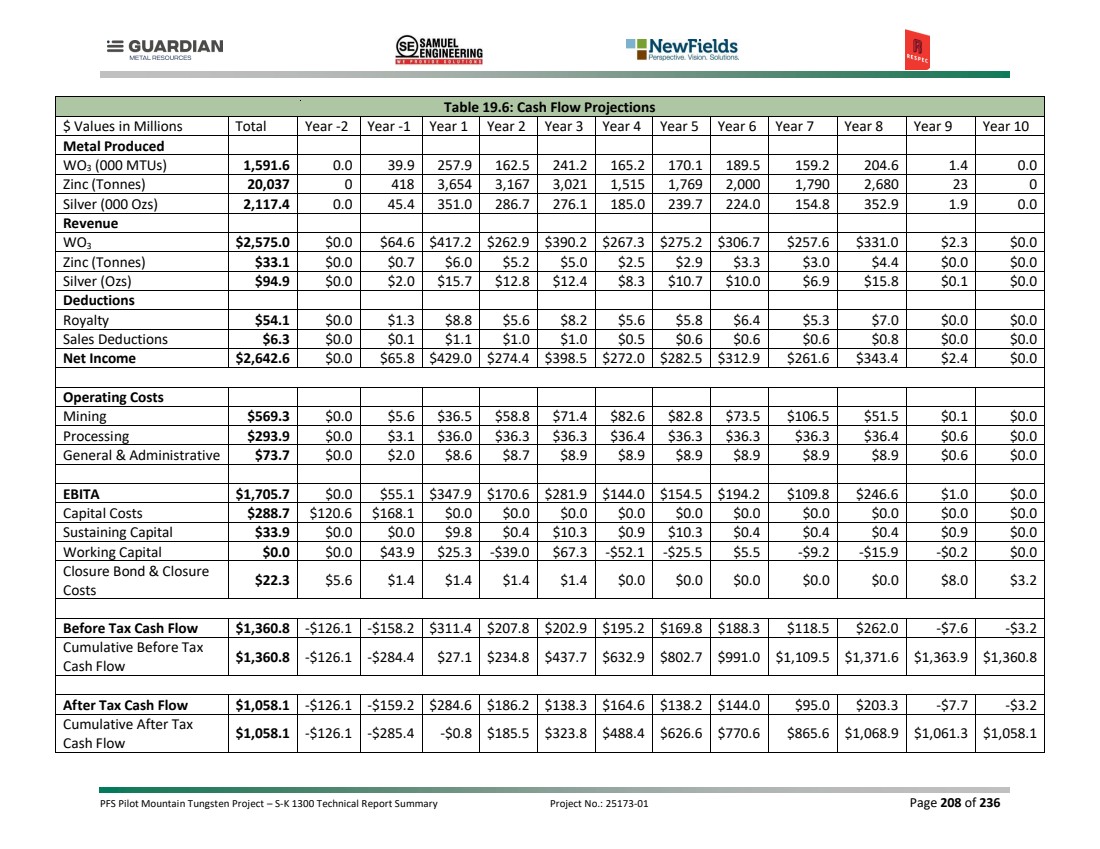
| PFS Pilot Mountain Tungsten Project – S-K 1300 Technical Report Summary Project No.: 25173-01 Page 209 of 236 19.9 SENSITIVITY ANALYSIS Table 19.7 through Table 19.9 and Figure 19.2 through Figure 19.5 show the relative sensitivity of NPV and IRR as tungsten price, capital and operating costs percentage change in the economic model. The sensitivity analysis shows that the Project is the most sensitive to tungsten price changes. Operating and capital cost changes have a lower impact on the Project NPV than the former variable. Table 19.7: Tungsten Price Sensitivity Sensitivity (%) / Item Tungsten Price Pre-Tax Post-Tax $/MTU NPV $M IRR % Payback Years NPV $M IRR % Payback Years -50% $987 ($2) 8% 5.51 ($30) 5% 7.23 -45% $1,085 $84 16% 3.38 $48 13% 3.95 -40% $1,184 $170 23% 2.81 $123 20% 3.05 -35% $1,282 $256 30% 2.43 $192 26% 2.64 -30% $1,381 $342 36% 1.50 $260 31% 1.73 -25% $1,480 $427 42% 1.34 $328 36% 1.44 -20% $1,578 $513 48% 1.22 $395 41% 1.31 -15% $1,677 $599 53% 1.13 $461 46% 1.21 -10% $1,776 $685 58% 1.05 $528 51% 1.13 -5% $1,874 $771 63% 0.98 $594 55% 1.06 0% $1,973 $857 68% 0.91 $660 60% 1.00 5% $2,072 $943 73% 0.85 $726 64% 0.91 10% $2,170 $1,028 77% 0.79 $791 68% 0.83 15% $2,269 $1,114 82% 0.75 $857 72% 0.75 20% $2,368 $1,200 86% 0.70 $922 76% 0.71 25% $2,466 $1,286 91% 0.67 $987 80% 0.67 30% $2,565 $1,372 95% 0.63 $1,052 84% 0.64 35% $2,664 $1,458 99% 0.60 $1,117 87% 0.61 40% $2,762 $1,543 104% 0.57 $1,182 91% 0.58 45% $2,861 $1,629 108% 0.55 $1,247 95% 0.55 50% $2,960 $1,715 112% 0.52 $1,312 99% 0.53 |
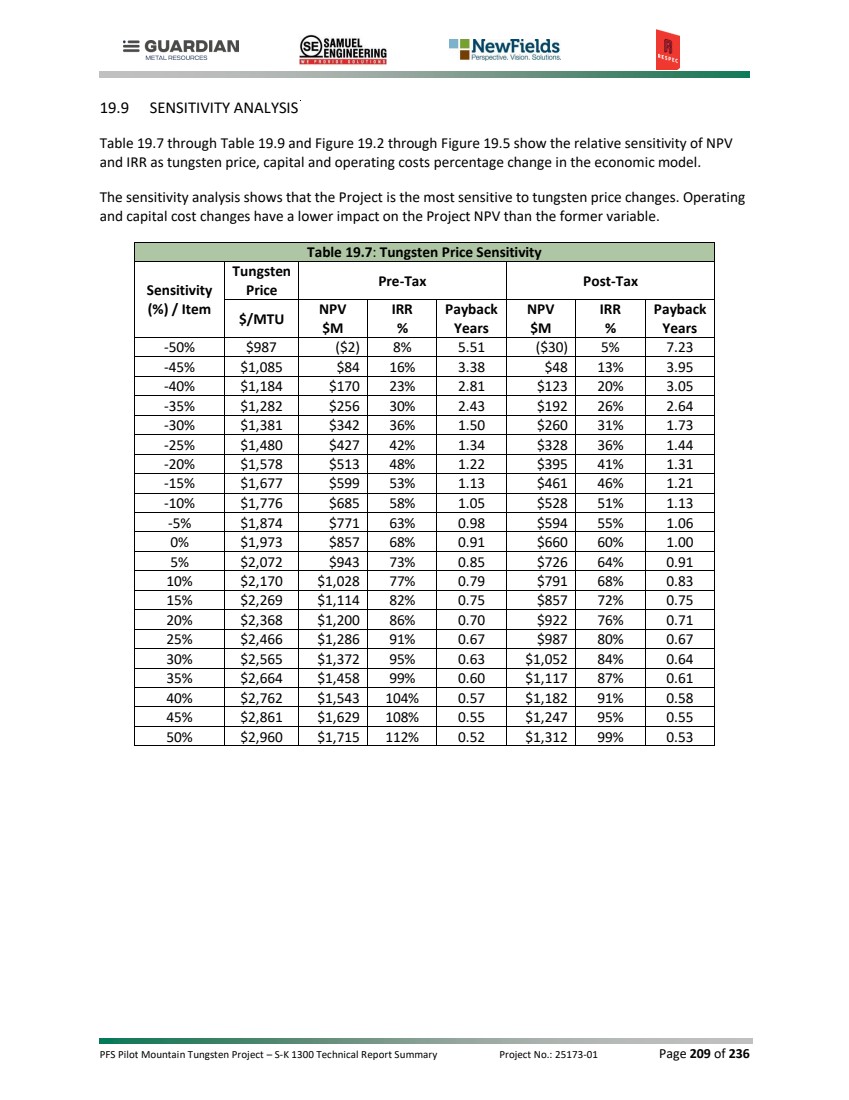
| PFS Pilot Mountain Tungsten Project – S-K 1300 Technical Report Summary Project No.: 25173-01 Page 210 of 236 Figure 19.2: Tungsten Price per MTU Sensitivity on NPV 8% Figure 19.3: Tungsten Price per MTU Sensitivity on IRR $0 $250 $500 $750 $1,000 $1,250 $1,500 $1,750 $2,000 $1,000 $1,250 $1,500 $1,750 $2,000 $2,250 $2,500 $2,750 $3,000 NPV ($ M) Tungsten Price ($) Tungsten Price Sensivity (NPV 8%) Pre-tax Post-tax 0% 25% 50% 75% 100% 125% 150% $1,000 $1,250 $1,500 $1,750 $2,000 $2,250 $2,500 $2,750 $3,000 IRR (%) Tungsten Price ($) Tungsten Price Sensivity (IRR) Pre-tax Post-tax |
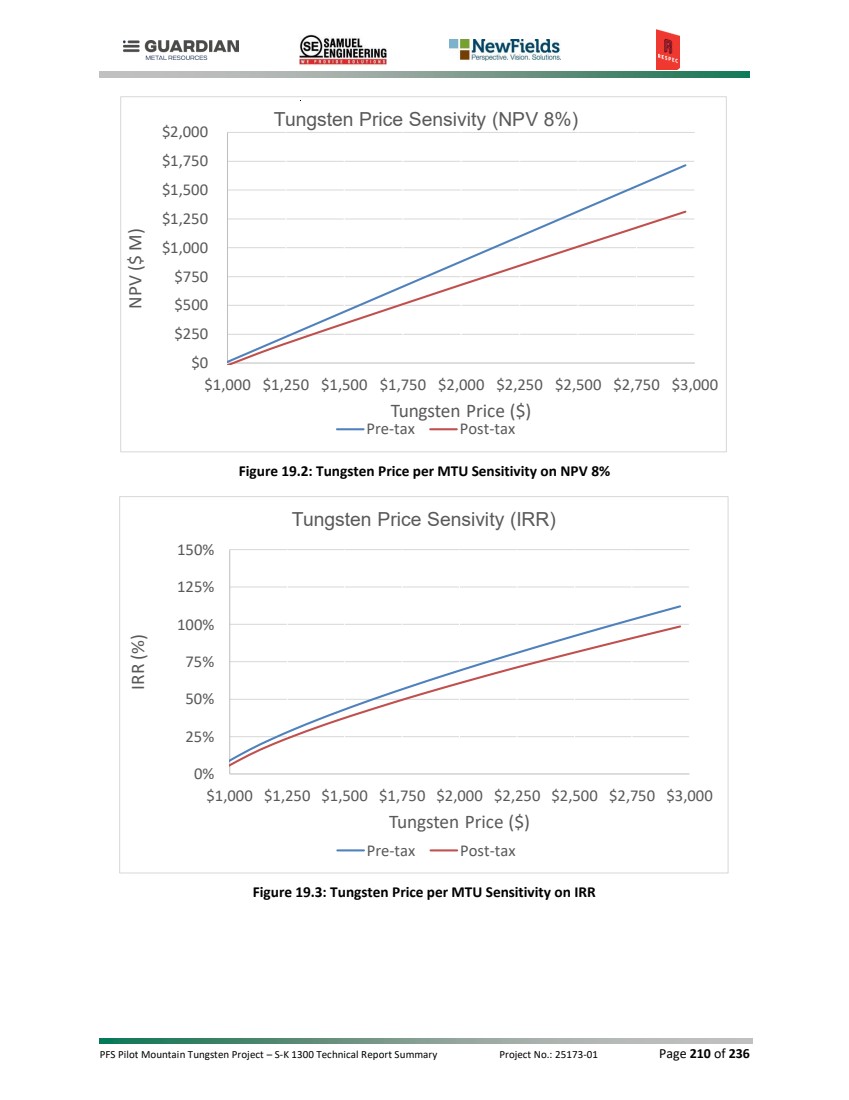
| PFS Pilot Mountain Tungsten Project – S-K 1300 Technical Report Summary Project No.: 25173-01 Page 211 of 236 Table 19.8: CAPEX Sensitivity (Initial + Sustaining) Sensitivity (%) / Item Pre-Tax Post-Tax NPV $M IRR % Payback Years NPV $M IRR % Payback Years -50% $1,008 130% 0.44 $782 115% 0.44 -40% $978 111% 0.51 $758 98% 0.52 -30% $948 96% 0.61 $734 85% 0.61 -20% $917 85% 0.71 $710 75% 0.71 -10% $887 75% 0.81 $685 66% 0.84 0 $857 68% 0.91 $660 60% 1.00 10% $826 61% 1.01 $635 54% 1.09 20% $796 56% 1.10 $610 49% 1.18 30% $766 51% 1.19 $585 45% 1.28 40% $736 47% 1.29 $560 41% 1.39 50% $705 44% 1.40 $535 38% 1.49 Table 19.9: OPEX Sensitivity Sensitivity (%) / Item Pre-Tax Post-Tax NPV $M IRR % Payback Years NPV $M IRR % Payback Years -50% $1,168 82% 0.78 $882 72% 0.81 -40% $1,106 79% 0.80 $838 69% 0.84 -30% $1,044 76% 0.83 $794 67% 0.88 -20% $981 74% 0.85 $750 65% 0.92 -10% $919 71% 0.88 $705 62% 0.96 0 $857 68% 0.91 $660 60% 1.00 10% $794 65% 0.94 $614 57% 1.03 20% $732 62% 0.97 $567 54% 1.06 30% $670 59% 1.00 $520 51% 1.09 40% $607 55% 1.03 $472 48% 1.12 50% $545 52% 1.07 $423 45% 1.15 |
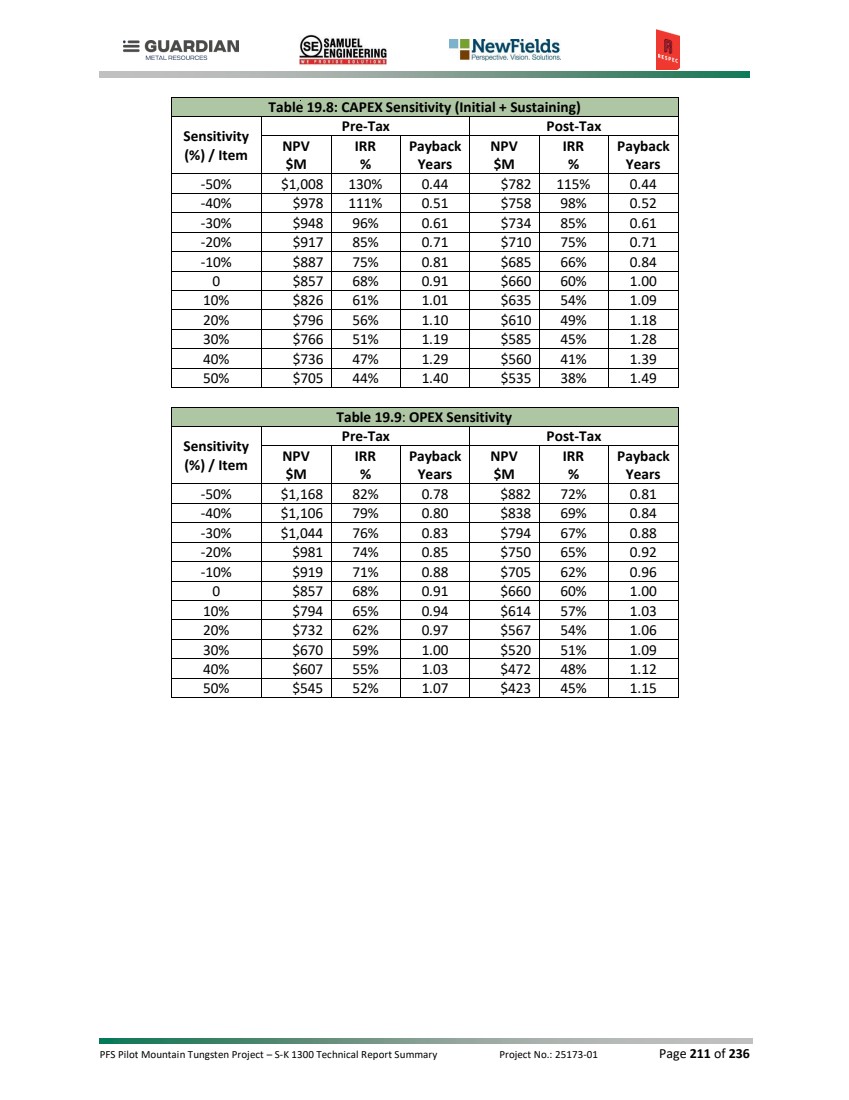
| PFS Pilot Mountain Tungsten Project – S-K 1300 Technical Report Summary Project No.: 25173-01 Page 212 of 236 Figure 19.4: Multiple % Sensitivity on NPV 8% Figure 19.5: Multiple % Sensitivity on IRR $200 $450 $700 $950 $1,200 $1,450 -50% -40% -30% -20% -10% 0% 10% 20% 30% 40% 50% NPV ($ M) Percentage Change (%) Capital and OPEX Sensivity (NPV 8%) Capital (Pre-tax) Capital (Post-tax) OPEX (Pre-tax) OPEX (Post-tax) 0% 25% 50% 75% 100% 125% 150% -50% -40% -30% -20% -10% 0% 10% 20% 30% 40% 50% IRR (%) Percentage Change (%) Capital and OPEX Sensivity (IRR) Capital (Pre-tax) Capital (Post-tax) OPEX (Pre-tax) OPEX (Post-tax) |
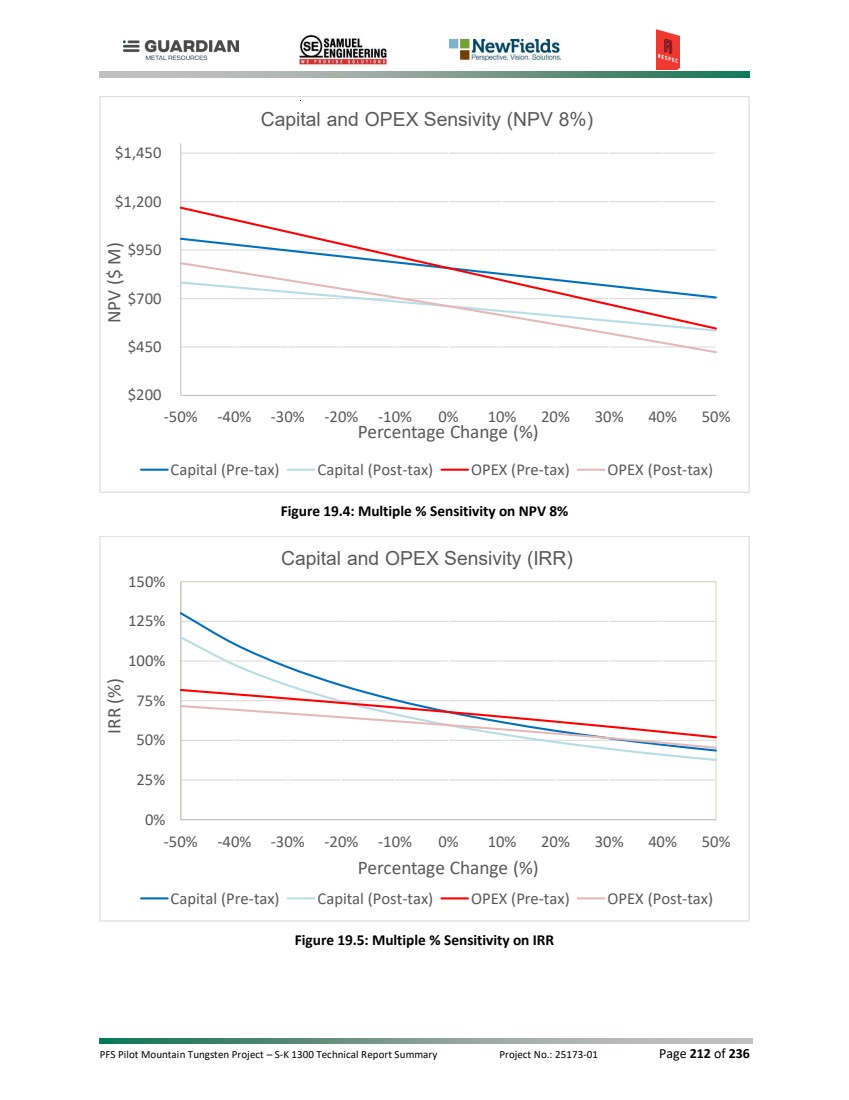
| PFS Pilot Mountain Tungsten Project – S-K 1300 Technical Report Summary Project No.: 25173-01 Page 213 of 236 20.0 ADJACENT PROPERTIES There are no disclosures of adjacent properties that are relevant to the resource and reserve estimates, or to the PFS discussed in this report. |

| PFS Pilot Mountain Tungsten Project – S-K 1300 Technical Report Summary Project No.: 25173-01 Page 214 of 236 21.0 OTHER RELEVANT DATA AND INFORMATION This section discusses additional environmental and stakeholder engagement activities related to the Pilot Mountain tungsten project. Guardian Metal commitment to Environmental/Social/Governance (ESG) and Sustainability means that the project development will take into account the environmental and social context in which it operates, striving to minimize its footprint and amplify the opportunities to achieve positive outcomes for the communities in the vicinity of the Project. This has been a central consideration for Guardian Metal since the project was envisioned, and it remains the foundation of the Company’s operating principles. 21.1 ENVIRONMENTAL FOOTPRINT AND BENCHMARKING Tungsten is a strategic metal critical to the United States (“U.S.”) defense, energy transition, technology, and industrial sectors. In the context of shifting geopolitical dynamics and tightening Chinese export restrictions, Guardian Metal is well positioned to play a leading role in re-establishing a secure, domestically mined U.S. supply chain for this vital defense metal. The completion of the Pilot Mountain PFS is a critical step in Guardian Metal’s path towards the potential development of the first new United States (“U.S.”) domestically mined tungsten operation in over 15 years. The PFS proposes the use of conventional mining and processing methods and the Project is expected to produce a high-quality concentrate capable of being processed entirely within the U.S. with all design either meeting or exceeding applicable State and Federal environmental standards. The Mine Plan of Operations calls for the construction of a conventional lined tailings storage facility which will meet the U.S. and international standards for tailings management, including the Nevada Administrative Code requirements and Canadian Dam Associates guidelines. Emphasis on a robust closure plan and an adequately funded reclamation bond will ensure safe closure of the mine at the end of operations. Guardian Metal is committed to advancing the Pilot Mountain project as rapidly as possible, progressing detailed engineering and permitting activities in parallel as it works towards a construction decision. The Company is actively engaged with relevant government agencies and participants across the tungsten value chain, reflecting its view that the United States is facing a material near- and medium-term tungsten supply shortage. In addition, the Company will consider the best value of the Project for all stakeholders including local, state and national communities through the permitting and final designs. 21.2 LOCAL PROSPERITY Guardian Metal believes this project has the potential to deliver economic benefits to surrounding communities in west-central Nevada in the form of direct and indirect employment opportunities, wider economic benefits for the region, and support for local aquifers and water resources. |
| PFS Pilot Mountain Tungsten Project – S-K 1300 Technical Report Summary Project No.: 25173-01 Page 215 of 236 22.0 INTERPRETATION AND CONCLUSIONS 22.1 PILOT MOUNTAIN TUNGSTEN PROJECT It is the opinion of RESPEC that the Guardian Metal tungsten project’s Mineral Resource presented in this report has been completed in accordance with all requirements of S-K 1300 and has the potential to be expanded with additional drilling. 22.2 OVERALL RISKS AND OPPORTUNITIES SUMMARY 22.2.1 Opportunities The PFS identified several opportunities that could enhance the Project’s value, reduce risk, or improve operational flexibility during the next phase of study. These opportunities are not required to support the current pre-feasibility case; however, further evaluation could provide upside through resource expansion, improved metallurgical performance, optimized mine design, and refinements to tailings management. The principal opportunities identified for follow-up are summarized below: • Continue exploration across the claim area to test for additional tungsten resources. • Evaluate the Tremor, Gun Metal, and Good Hope areas to determine whether additional mineral resources can be defined. • Assess the relationship between concentrate grade and recovery to identify opportunities to improve tungsten recovery while maintaining a commercially saleable concentrate. • Improve geotechnical understanding of the rock masses forming the pit walls to determine whether pit wall angles can be steepened. • Evaluate a co-mingled tailings storage approach as an alternative to placing sulfide concentrate in a discrete holding cell within the TSF, as this may improve containment, reduce environmental risk, lower costs, and simplify operations. 22.2.2 Risks Risk considerations are central to the pre-feasibility assessment, as they help determine whether the proposed project can advance with an acceptable level of uncertainty. This section identifies the key technical, financial, environmental, regulatory, operational, and stakeholder-related risks that could influence project viability, schedule, cost, and decision-making. The list is intended to highlight principle risks specific to this project: • Recovery of very low-grade material • Permitting delays • Staffing • Tungsten price volatility 22.3 UPSIDE POTENTIALS The principal upside potential for the project is to add mineral resources to the existing inventory. The Company has identified three zones, Tremor, Gun Metal and Good Hope that contain know skarn mineralization with anomalous tungsten grades. These zones require additional exploration and engineering studies to include them into the mineral resource inventory. Should these studies show that the zones are economic, they could add years to the operating life as each of these zones are less than a mile from the plant site and could be processed at the plant. |

| PFS Pilot Mountain Tungsten Project – S-K 1300 Technical Report Summary Project No.: 25173-01 Page 216 of 236 22.4 SAMPLE PREPARATION, ANALYSES, AND SECURITY RESPEC’s audit confirmed that overall, the available data are adequate for mineral resource estimation and disclosure under S-K 1300. Historical records have inconsistencies in assay documentation or missing down-hole survey documentation, which were addressed through comparative analysis. Confidence in pre Guardian drilling remains lower, but Guardian’s 2024–2026 drilling program provides a reliable foundation for the resource model. RESPEC integrated the historical information with appropriate caution, and while some risk persists in the estimated volume of higher grade material, the database is considered suitable for technical reporting, resource estimation, and regulatory compliance. Guardian conducted their 2024–2026 drilling programs to current industry standards. RESPEC judged Guardian’s core handling, sampling, and chain‑of‑custody procedures adequate to produce reliable samples for assay. ALS performed sample preparation and analysis using appropriate multi‑element and ore‑grade methods, and re‑assayed overlimit values. Guardian’s QA/QC program incorporated certified reference materials, blanks, and duplicates at appropriate frequencies. Statistical evaluation confirmed acceptable precision and minimal bias for tungsten, copper, and zinc. Evaluation of the silver assays showed slightly elevated variability at low concentrations but revealed no systematic errors. Overall, Guardian’s QA/QC results are adequate for resource estimation, although their follow‑up on isolated CRM and blank failures is not documented. Data collected by Black Fire and Thor between 2011 and 2017 were prepared and analyzed by ISO‑accredited laboratories, with documented procedures providing some confidence in quality. Drilling completed in the 1970s lacks documented sampling protocols and QA/QC records, which reduces confidence in those datasets. Even so, select historical assay results were incorporated into the resource estimate where comparative analysis against modern data supported their reliability. Assay population reviews show broadly consistent grade distributions across Guardian, Duval, and UCC datasets, which supports their comparability despite differences in dataset size and detection limits. Interpolation tests indicated that historical datasets returned WO₃ grades about 17% higher than Guardian’s, a difference attributed to sampling population effects and drilling geometry rather than systematic analytical bias. These findings reinforce the conjecture that estimation risk is primarily linked to the historical dataset, particularly in areas where vertical drilling and selective sampling may have biased grade representation. Guardian’s angled drilling reduced geometric bias, and the modern dataset provides confidence in the overall resource model. Assays generated by colorimetric methods during the 1970s campaigns are accepted for inclusion in the resource model. Although less precise than modern instrumental techniques, colorimetry was a recognized practice for tungsten analysis at the time. Partial assay certificates recovered by Guardian provides traceability. Despite the absence of QA/QC data from the original campaigns, corroborating evidence from comparative analyses supports the selective use of historical colorimetric results in the current estimate. 22.5 MINERAL RESOURCE ESTIMATES 22.5.1 Desert Scheelite Deposit The Desert Scheelite Mineral Resource is hosted within a base-metal-enriched tungsten skarn developed along the contact of the Desert Scheelite quartz monzonite stock and favorable carbonate units of the lower Luning Formation. The skarn extends approximately 650 m along strike and at least 300 m down dip. Mineralization is characterized by scheelite with associated pyrite, chalcopyrite, and sphalerite and |
| PFS Pilot Mountain Tungsten Project – S-K 1300 Technical Report Summary Project No.: 25173-01 Page 217 of 236 is oriented as a steeply dipping to subvertical body. Three higher-grade tungsten zones occur within the broader skarn system and are interpreted to reflect favorable lithologic and structural controls. Guardian Metal's drilling programs and geologic modeling significantly improved the understanding of the orientation, continuity, and controls on mineralization. This work provided the basis for the geologic and mineral-domain models used for resource estimation and increased confidence in the continuity of the principal mineralized zones. RESPEC estimated mineral resources assuming potential open-pit extraction and conventional milling and flotation processing methods. Resources are reported within optimized pit shells at a 0.04% WO₃ cut-off grade. Silver, zinc, and copper are reported as by-products, although their economic contribution depends on future recovery and market conditions. Approximately 84% of the contained WO₃ and total resource tonnes are classified as Indicated, reflecting drilling density, QA/QC results, and confidence in the geologic and resource models. The principal uncertainties affecting the estimate relate to portions of the historical drilling database, including selective sampling, incomplete survey records, inconsistent documentation, and the predominance of vertical drilling within steeply dipping mineralized zones. Comparison of historical and modern datasets indicates that historical drilling may overstate the apparent thickness of some higher-grade mineralization. Guardian Metal's angled drilling programs have improved the understanding of deposit geometry and reduced this source of uncertainty, although some risk remains in the estimated volume and distribution of higher-grade material. Multiple grade populations were identified during resource modeling. Although higher-grade populations are present within the drilling database, the geological controls on these grades are not yet sufficiently understood to support separate estimation domains. Accordingly, RESPEC applied estimation restrictions to control the influence of higher-grade samples. The authors consider the resulting model to provide a reasonable representation of the quantity and grade of mineralization currently defined by drilling, although local variations in grade distribution remain subject to uncertainty and may be refined through additional drilling and geological studies. 22.5.2 Garnet Deposit The Garnet Mineral Resource is hosted within stratabound skarn horizons developed where carbonate units of the upper Luning Formation were metasomatized adjacent to intrusive bodies. Mineralization occurs within multiple shallow-dipping to subhorizontal skarn horizons and is characterized by scheelite with associated pyrite, sphalerite, and lesser chalcopyrite. Lithologic controls exert the primary influence on mineralization, while local faulting and intrusive dikes and sills contribute to the distribution and continuity of mineralized zones. Guardian Metal's drilling programs improved the definition and continuity of the skarn horizons and provided the basis for an updated geologic model incorporating lithologic and structural controls. This geologic framework was used to construct the mineral domains applied in the resource estimate and supports the interpretation of continuity within the principal mineralized horizons. RESPEC estimated mineral resources assuming potential open-pit extraction and conventional milling and flotation processing methods. Resources are reported within optimized pit shells at a 0.04% WO₃ cut-off grade. Silver and zinc are reported as by-products, although their economic contribution depends on future recovery and market conditions. Approximately 87% of the contained WO₃ and 86% of the |
| PFS Pilot Mountain Tungsten Project – S-K 1300 Technical Report Summary Project No.: 25173-01 Page 218 of 236 resource tonnes are classified as Indicated, reflecting drill density, data quality, and confidence in the continuity of the modeled skarn horizons. The principal uncertainties affecting the Garnet estimate relate primarily to drill spacing along the lateral and down-dip margins of the deposit, where the continuity of mineralized skarn horizons is supported by fewer drill intersections. These areas have been classified as Inferred to reflect the lower level of confidence associated with geological continuity and grade distribution. Additional drilling in these areas would improve confidence and refine the extent of mineralization. RESPEC validated the assay datasets used in the estimate and confirmed that the Guardian Metal and Thor drilling data provide a consistent and reliable basis for resource estimation. Historical UCC assay data were determined to exhibit a high-grade bias relative to the modern drilling datasets and were excluded from grade interpolation to avoid inflating estimated grades. The resulting resource model reasonably reproduces the grade distribution and continuity supported by the drilling data. Although some smoothing of grades is inherent in the estimation process, the authors consider the model to provide a reasonable representation of the quantity and grade of mineralization currently defined within the Garnet deposit. 22.6 MINERAL RESERVE ESTIMATES RESPEC has stated Mineral Reserves based on applying modifying factors to the Mineral Resource. The reserve estimate was developed using industry standard evaluations. The reported Mineral Reserves are supported by the economic analysis in Section 19.0. While the economic analysis was based on a tungsten price of $197,300/t of WO3, the Mineral Reserve was defined based on a $115,000/t of WO3. This provides additional confidence that the Mineral Reserves can be realized. In addition, there may be the ability to provide additional production from lower-grade stockpiles, though this has not been included in the current mine plans. 22.7 MINE PLAN AND MINING METHODS The open pit mining of Scheelite and Garnet deposits has been planned as a truck/loader operation. This mining method is typical for near surface deposits in the state of Nevada. The mine has been planned to be operated by a contractor and contract mining quotations have been provided by several potential mining contractors that operate in the state of Nevada. Mine designs include toes, crests, and ramp strings and have been done using industry standards. The same is included for the WRSF designs. Production schedules were created to show the movement of ore and waste material based on contract mining equipment. RESPEC believes that the mine planning has been done to the standards required for the reporting of reserves at a level supporting a prefeasibility study. 22.8 METALLURGY AND MINERAL PROCESSING The process utilizes conventional and commercially available mineral processing operations consisting of crushing, grinding, and flotation can be used to produce commercially salable tungsten and silver concentrates. Metallurgical test work and the process plant design have been completed to a level suitable to support this study and a processing facility can be successfully constructed and operated at the planned nominal throughput of 4,000 tpd of ROM ore producing ~4,500 tonnes per year of tungsten concentrate, containing on average 1,890 tonnes of WO3. |
| PFS Pilot Mountain Tungsten Project – S-K 1300 Technical Report Summary Project No.: 25173-01 Page 219 of 236 Recovery of tungsten to final tungsten concentrate is projected to be 78.5%. The composition of the final tungsten concentrate produced is expected to be greater than 50% tungsten. 22.9 ENVIRONMENTAL STUDIES, PERMITTING AND SOCIAL OR COMMUNITY IMPACT There are no environmental risks or issues that would affect project permitting, operations or closure due to the favorable geologic setting (carbonate dominant), mineralization style (skarn in limestone), and the location of the project (arid rural central Nevada). A socioeconomic baseline report will be included in the EBRs completed for permitting. To date there has been no community concerns documented as evidenced by the BLM Environmental Assessment for the Exploration Plan of Operations public comment period receiving zero comments. 22.10 TAILINGS STORAGE FACILITY The TSF and associated structures have been designed to meet regulatory requirements and industry-accepted standards and practices, suitable for PFS-level designs. Additional investigations, evaluations, and analyses will be required during detailed design to confirm assumptions and reduce the risk of encountering unforeseen conditions during construction. During construction, a rigorous Construction Quality Assurance (CQA) program will be implemented to ensure the construction materials meet or exceed specified values that are key to the facility performance. Materials not meeting the specifications will either not be used in construction or approved after confirming the deviations will not negatively impact facility performance through modeling or other analyses, evaluations, and calculations. A robust OMS manual will be a key component to ensure operations and monitoring controls are in place for the lifecycle of the structure. The OMS manual will include instrumentation and monitoring to provide early warning for potentially unstable conditions. These early warning systems will allow operators to monitor conditions at the TSF and provide recommendations if values trend toward thresholds for potentially unsuitable levels. In addition, designs and significant design criteria or concept changes will be reviewed by a qualified third party at appropriate stages of the design process. |
| PFS Pilot Mountain Tungsten Project – S-K 1300 Technical Report Summary Project No.: 25173-01 Page 220 of 236 23.0 RECOMMENDATIONS 23.1 INTRODUCTION The Pilot Mountain project should advance to the next stages of design, engineering, and planning. Given its strong projected returns, the urgent need for tungsten, and its compact layout with well-understood environmental impacts, the PFS design should proceed to a Definitive Feasibility Study (DFS) and Front-End Engineering Design (FEED). The PFS design is intended to support the Plan of Operations filing with the BLM, which will describe the project for permitting purposes. Accordingly, the DFS is not expected to require significant additional options analysis or introduce new operating concepts. Instead, the DFS should add engineering detail and increase confidence in the elements defined in the PFS. Further drilling may increase resources and extend mine life, but reserves and the mine plan are expected to remain largely unchanged. During the DFS and before permit submission, the TSF location should be specifically evaluated for optimization. Recent exploration drilling has identified potential resource expansion near the PFS TSF design area, and a more efficient water-diversion design may be possible for the permit application and final designs. Further investigation of this alternative is recommended. The DFS should be completed to S-K 1300 standards by qualified specialists, with capital and operating costs estimated to an accuracy of ±15% and contingency of ≤10%. Consistent with S-K1300 guidelines, the study results may support a final decision by a proponent or financial institution to proceed with, or finance, project development. (1) A feasibility study is more comprehensive, and with a higher degree of accuracy, than a pre-feasibility study. It must contain mining, infrastructure, and process designs completed with sufficient rigor to serve as the basis for an investment decision or to support project financing. (2) The confidence level in the results of a feasibility study is higher than the confidence level in the results of a pre-feasibility study. Terms such as full, final, comprehensive, bankable, or definitive feasibility study are equivalent to a feasibility study. The DFS will have expanded disclosure around the details of the proposed mineral products and how they are to be sold and/or contracted. The FEED, recommended in addition to the DFS, will define critical-path activities in greater detail than the DFS and establish the technical and project-specific requirements needed to understand the full project scope. During FEED, initial concepts are developed into a comprehensive plan, including an updated risk and opportunities register. Given the project’s planned 15- to 18-month construction period, detailed planning will be essential. FEED should also define regulatory compliance requirements for construction and operation, incorporate stakeholder engagement, and ensure that engineering and design meet industry standards, regulatory requirements, and client specifications, thereby strengthening quality assurance for the completed project. |
| PFS Pilot Mountain Tungsten Project – S-K 1300 Technical Report Summary Project No.: 25173-01 Page 221 of 236 23.2 RECOMMENDATIONS BUDGET SUMMARY The following sections detail the scope of work and budgets of the specialists for the recommended DFS and FEED phases of work. Table 23.1 categorizes the next phase cost by area. The FEED costs seen in Table 23.1 are for tasks performed in the first half of 2027. Table 23.1: Recommended DFS and FEED Budgets Area of Study Approximate Cost ($000 USD) Geology $6,000 Mining $1,000 Metallurgy and Mineral Processing $1,000 Tailings Storage Facility $4,000 Environmental $7,000 DFS/FEED Engineering Design $6,000 ESTIMATED TOTAL $25,000 23.3 GEOLOGY 23.3.1 Drilling and Assay Programs RESPEC recommends that Guardian Metal complete approximately 1,500 m of core drilling at the Desert Scheelite deposit. The program should increase drill density, improve confidence in grade continuity, and support potential conversion of Inferred Mineral Resources to the Indicated category. In particular, RESPEC recommends infill drilling within both Indicated and Inferred areas of the optimized pit to further evaluate the continuity and geometry of the current tungsten mineral domains and to support future updates to the resource estimate. RESPEC further recommends drilling select twin holes to evaluate historical assay results and assess potential bias related to historical vertical drilling in steeply dipping mineralized zones. RESPEC recommends that Guardian Metal continue its current QA/QC practices, including insertion of certified reference materials, blanks, and duplicate samples. Follow-up investigations and documentation of any QA/QC failures should be maintained to support data quality and the defensibility of future resource estimates. In addition to Desert Scheelite, RESPEC recommends advancing drilling at the Garnet and Gunmetal deposits, with approximately 1,800 m of core drilling planned at each deposit. These programs should evaluate extensions of known mineralization, improve confidence in mineralized geometry and continuity, and provide information to support future resource estimation and classification. Exploration drilling totaling approximately 2,000 m is also recommended to evaluate additional targets across the Pilot Mountain Project. 23.3.2 Petrological and Ore Characterization Studies RESPEC recommends that Guardian Metal undertake additional petrological and ore characterization studies focused on the higher-grade tungsten populations identified during resource modeling. Although multiple grade populations were observed in the drilling database, the geological controls on the higher-grade populations are not presently understood sufficiently to support separate estimation domains. |
| PFS Pilot Mountain Tungsten Project – S-K 1300 Technical Report Summary Project No.: 25173-01 Page 222 of 236 Detailed petrographic, mineralogical, and structural studies should be completed to evaluate the controls on these higher-grade zones and their relationship to lithology, alteration, mineral assemblages, and structural features. Improved understanding of these controls may support refinement of the geologic and mineral domain models and reduce uncertainty associated with the local distribution of grades within the resource estimate. 23.3.3 Geologic and Metal Domain Modeling RESPEC recommends that Guardian Metal continue refinement of the geologic and mineral domain models through incorporation of additional drilling information, improved characterization of lithologic and alteration boundaries, and evaluation of structural controls on mineralization. Continued refinement of the geologic model is expected to improve confidence in mineral domain interpretation and future Mineral Resource estimates. Additional drilling and geological studies should be used to further constrain the geometry and continuity of mineralized domains at Desert Scheelite, Garnet, and other project targets. Any future Mineral Resource updates should incorporate revised geological interpretations, drilling results, and supporting technical studies as appropriate. Particular emphasis should be placed on evaluating the geological controls on the higher-grade tungsten populations identified during resource modeling. Improved understanding of the relationship between these higher-grade zones, lithology, alteration, mineral assemblages, and structural features may support refinement of mineral domains and reduce uncertainty associated with local grade distribution within the current resource models. 23.4 MINING RESPEC recommends that Guardian Metal move forward with a DFS-level study of +/- 10% contingency, which will require the following tasks to be completed or updated: • Update pit optimizations with any resource model and/or metallurgy updates. • Review Contractor costs versus Owner Mining costs. • Update pit designs concentrating on developing the shortest possible haulage routes. • Update WRSF designs and detail sequencing on how the dump is built. • Detail backfill potential. • Detail and refine haulage routes and roads. • Balance the use of equipment along with optimal grade throughput. • Owner mining operations vs Contract mining • Refine capital and operating costs for owner-operating case. • Obtain updated quotations for contractor costs. RESPEC also recommends Guardian Metal move forward with developing the “Plan of Operations”, which is the lead-up to the start of the construction of the project. This will include, but not limited to the following: • Finalize Pit optimizations • Finalize Pit Designs, Phase Designs, Waste Dumps, and Mine Plan for operations • Assisting in getting contracts in place with suppliers • Assisting with ordering equipment |

| PFS Pilot Mountain Tungsten Project – S-K 1300 Technical Report Summary Project No.: 25173-01 Page 223 of 236 • Finalizing drawings for construction • Assisting in getting personnel in place for construction and operation 23.5 METALLURGY AND MINERAL PROCESSING The following additional investigations, evaluations, and analyses are recommended to advance the metallurgy and mineral processing designs: • Perform additional testwork on variability samples selected from areas of the deposit not represented in previous testwork. Testwork should focus on proving recovery and concentrate grades of samples utilizing the current flowsheet • Perform additional flotation testwork on the Garnet deposit. • Further investigate low grade material utilizing the current flowsheet. • Further investigate the grade versus recovery relationship in the deposit. • Investigate metallurgical response of fine material to high energy froth flotation. • Perform equipment specific material testwork, i.e. thickening and filtration testwork for both tungsten and sulfide concentrates. • Continue testwork optimization on the recovery of silver bearing sulfide material. The cost to perform the testwork described in the above bulleted items is estimated at $750,000. • Compile all existing geological, mining, and metallurgical information into an integrated geo-metallurgical model – $25,000 The total estimated cost associated with additional work required to advance the metallurgy and mineral processing is $775,000. 23.6 TAILINGS STORAGE FACILITY (TSF) The following additional investigations, evaluations, and analyses are recommended to advance the TSF designs: • Geotechnical investigations – $1.2 million Drilling and installing casing for downhole geophysics Drilling within the TSF area to further define the subsurface conditions, collect samples for laboratory testing, and associated laboratory testing to determine in-situ properties for geotechnical evaluations and analyses Test pits, sample collection, and laboratory testing within the TSF and surrounding area to define earthworks material borrow sources • Geophysical investigations - $100,000 • Seismic hazard assessment (probabilistic and deterministic) - $200,000 • Tailings testing - $200,000 Characterize general tailings properties Strength parameters for stability modelling Draindown behavior and other parameters to be used in modelling Beach slope, pumping, and other operational tailings behavior • Geotechnical analyses and evaluations – $200,000 Slope stability modelling |

| PFS Pilot Mountain Tungsten Project – S-K 1300 Technical Report Summary Project No.: 25173-01 Page 224 of 236 Settlement evaluation Liquefaction assessment Tailings consolidation modelling • Dam breach modelling and run-out assessment - $150,000 • Civil design and engineering - $150,000 • Permitting support - $200,000 Final design, issued for construction level drawings, and reports will be required to support the Water Pollution Control Permit and Dam Safety Permit, required by the State of Nevada Dam hazard classification recommendation, including a formal risk assessment workshop with key stakeholders The total estimated fees associated with additional work required to advance the TSF designs is approximately $2.4 million, including drillers’ fees and engineering fees for all investigations, laboratory testing, evaluations, analyses, and reporting. 23.7 ENVIRONMENTAL AND PERMITTING The Project should continue to advance the environmental and permitting workstream in parallel with the DFS and FEED so that the regulatory pathway, baseline data requirements, and agency expectations are sufficiently defined to support timely progression toward mine development. The immediate focus should be on preparing the federal permitting package needed to advance toward National Environmental Policy Act compliance, while also progressing the key Nevada state permits required for project construction and operation. 23.7.1 NEPA Compliance and Plan of Operations The Project should prioritize development of a comprehensive Plan of Operations suitable for submittal to the Bureau of Land Management (BLM). The Plan of Operations should clearly describe the proposed mine plan, processing facilities, waste rock management, tailings storage facility, water management systems, access roads, utilities, ancillary infrastructure, reclamation approach, and monitoring commitments. This document will provide the basis for the federal agency review and will help determine whether the NEPA process proceeds through an Environmental Assessment or requires preparation of an Environmental Impact Statement. As design details are refined, the Project should engage early with the BLM and cooperating agencies to confirm the scope of the proposed action, identify connected and cumulative actions, establish data sufficiency requirements, and define the anticipated NEPA schedule. If the agency determines that potential impacts can be adequately analyzed and mitigated through an Environmental Assessment, the Project should support preparation of the EA to facilitate timely review and approval by the BLM. If the scope, scale, or potential impacts of the Project warrant a more detailed analysis, the Project should be prepared to support preparation of an Environmental Impact Statement in the same manner to obtain a Record of Decision from the BLM. 23.7.2 Nevada State Permitting In parallel with the federal process, the Project should advance the Nevada state permitting requirements that are likely to be schedule critical. These include, at a minimum, the Nevada Division of Environmental Protection (NDEP) Water Pollution Control Permit (WPCP) and the Nevada Dam Safety Permit (DSP) approval process for the tailings storage facility and any other regulated impoundments. |
| PFS Pilot Mountain Tungsten Project – S-K 1300 Technical Report Summary Project No.: 25173-01 Page 225 of 236 Permit work should be integrated with the DFS-FEED engineering program so that facility siting, liner systems, water balance, stormwater controls, seepage collection, monitoring systems, closure concepts, and design criteria are developed to the level needed for agency review and approval. The Water Pollution Control Permit application should be advanced early to reduce permitting risk associated with process water management, mine contact water, tailings seepage control, and groundwater protection. The Dam Safety Permit should be coordinated closely with the tailings storage facility design team so that geotechnical investigations, hydrologic analyses, stability evaluations, inundation considerations, and operating criteria are developed on a schedule consistent with the overall project execution plan. 23.7.3 Baseline Studies and TSF Repositioning Priority baseline work should include biological resources, wetlands and waters, cultural resources, visual resources, surface water and groundwater, geochemistry, air quality, noise, land use, recreation, and other resource areas identified through agency consultation. Starting this work immediately will reduce the risk that seasonal survey windows, data gaps, or agency data adequacy findings delay the NEPA process or state permit applications. Because the potential repositioning of the tailings storage facility may expand the project footprint or affect areas not previously characterized, the Project should immediately identify any new disturbance areas and initiate the required environmental baseline studies. It is recommended that the Project maintain a permitting register and integrated environmental schedule that tracks federal and state permit requirements, required technical studies, agency submittals, anticipated review periods, and key decision points. This schedule should be updated as the mine plan, TSF location, water management strategy, and infrastructure layout are refined during the DFS/FEED work. 23.8 DFS/FEED ENGINEERING DESIGN Given its strong projected returns, urgent need for tungsten, and compact layout and well understood environmental impacts, the Pilot Mountain PFS should proceed to the DFS and FEED stages of design, engineering and planning. The DFS should be completed to S-K 1300 standards, with capital and operating costs estimated to an accuracy of ±15% and contingency of ≤10%, and the FEED would advance engineering activities to a level that will define critical path activities and allow long lead equipment to be purchased. |

| PFS Pilot Mountain Tungsten Project – S-K 1300 Technical Report Summary Project No.: 25173-01 Page 226 of 236 24.0 REFERENCES RESPEC Company, LLC, 2025, S-K 1300 Technical Report Summary Pilot Mountain Tungsten Project, Mineral County, Nevada, USA (the “Pilot Mountain TRS”), with an effective date of December 15, 2025. Several technical resource reports have been prepared for Pilot Mountain resources areas, none that were S-K 1300 compliant. They are as follows: Golder Associates, 2012. Desert Scheelite Resource, with Final Report Number 127641013-002-R-Rev0, prepared by Golder Associates Pty Ltd. Kaiser Engineers, 1981. Feasibility Study for Mining and Concentrating of Pilot Mountain Tungsten Ore, Mineral County, Nevada, prepared by Kaiser Engineers for Union Carbide Corporation Metals Division. RES, 2018. Update of Golder Associates Desert Scheelite Resource, prepared by Resource Evaluation Services (RES) for Thor Mining PLC. Vidale, Andrew, 2018. Pilot Mountain Mining Scoping Study, prepared by Andrew Vidale Consulting Services on behalf of Thor Mining PLC. Other sources: American Eagle Research Institute, 2025. “Pilot Mountain Exploration Project: 2025 Golden Eagle Occupancy and Reproduction Assessment,” prepared for WestLand Engineering & Environmental Services. Carter, L.C., 2025. “Guardian Metal Resources: Porphyry-Skarn-Epithermal Exploration Updates from Nevada,”AEMA Conference Presentation, Reno, Nevada. Faulds, J. E. and C. D. Henry, 2008. “Tectonic Influences on The Spatial And Temporal Evolution of The Walker Lane: An Incipient Transform Fault Along The Evolving Pacific – North American Plate Boundary,” in Spencer, J. E. and S. R. Titley, editors, Ores and Orogenesis: Circum-Pacific Tectonics, Geologic Evolution, and Ore Deposits, Arizona Geological Society Digest, Vol. 22, pp. 437-470. Grabher, D. E., 1984. “Union Carbide's Pilot Mountain Project Geologic Setting and Field Trip Guide,” in Exploration for Ore in the American Cordillera, J. L. Johnson, ed., Association of Exploration Geochemists, pp. 5-24. Lederer, G. W., F. Solano, J. A. Coyan, K. M. Denton, K. E. Watts, C. N. Mercer, D. P. Bickerstaff, and M. Granitto, 2021. “Tungsten Skarn Mineral Resource Assessment of the Great Basin Region of Western Nevada and Eastern California,” Journal of Geochemical Exploration, Vol. 223, pp. 1-24. Nielsen, R. L., 1963. Geology of the Pilot Mountains and Vicinity, Mineral County, Nevada, PH.D. thesis, University of California, Berkeley. Oldow, J. S., 1981. “Structure and Stratigraphy of the Luning Allochthon and the Kinematics of Allochthon Emplacement, Pilot Mountains, West-Central Nevada,” Geological Society of America Bulletin, Part 1, v. 92, pp. 888-911. Samuel Engineering. 2025. “Metallurgical Test Work: Pilot Mountain PFS,” [Project memorandum]. Samuel Engineering, Greenwood Village, CO. |
| PFS Pilot Mountain Tungsten Project – S-K 1300 Technical Report Summary Project No.: 25173-01 Page 227 of 236 Speed, R. C. 1977. “Island arc and other paleogeographic terranes of Late Paleozoic age in the western Great Basin,” in Paleozoic Paleogeography of the Western United States, edited by Stewart, J.S., Stevens, C.H., and Fritsche, A. E., SEPM, Pacific Coast Section, Pacific Coast Paleogeography Symposium 1, pp. 349-362. U.S. Geological Survey, 2020. “Quaternary Fault and Fold Database for the Nation,” U.S. Geological Survey digital database. Western Regional Climate Center, 2013. Cooperative Climatological Data Summaries. Retrieved from http://wrcc.dri.edu/climatedata/climsum/ WestLand Engineering & Environmental Services, 2024. “Pilot Mountain Exploration Project: 2024 Pre-Field Habitat Assessment.” WestLand Engineering & Environmental Services, 2025a. “Pilot Mountain Exploration Project: 2024 Baseline Biological Survey Report.” WestLand Engineering & Environmental Services, 2025b. “2025 Cold Season Internal Bat Survey,” addendum to “Pilot Mountain Exploration Project: 2024 Baseline Biological Survey Report.” WestLand Engineering & Environmental Services, 2025c. “2025 Burrowing Owl Survey,” addendum to “Pilot Mountain Exploration Project: 2024 Baseline Biological Survey Report.” |

| PFS Pilot Mountain Tungsten Project – S-K 1300 Technical Report Summary Project No.: 25173-01 Page 228 of 236 25.0 RELIANCE ON INFORMATION PROVIDED BY THE REGISTRANT This report section has been prepared for Guardian Metal by the respective QPs referred to in Table 2.1. The information, conclusions, opinions, and estimates contained herein are based on: • Information available to the QPs at the time of preparation of this report. • Assumptions, conditions, and qualifications as set forth in this report. • Data, reports, and other information supplied by Guardian Metal. For this report, the QPs have relied on property ownership information provided by Guardian Metal. Samuel Engineering has not independently researched property title or mineral rights for the Pilot Mountain property and expresses no independent opinion as to the ownership status of the property. Metal pricing assumptions are derived from information provided by Argus. Mining Tax Plan LLC has provided the basis of the calculations for all associated taxes. |

| PFS Pilot Mountain Tungsten Project – S-K 1300 Technical Report Summary Project No.: 25173-01 Page 229 of 236 26.0 APPENDICES 26.1 APPENDIX A – UNITS OF MEASURE AND ABBREVIATIONS AND ACRONYMS 26.1.1 Units of Measure Figure 26.1: Units of Measure Above Mean Sea Level amsl Ampere A Amperes per Square Meter ASM Annum (Year) a Billion B British Thermal Unit BTU Centimeter cm Cubic Centimeter cm 3 Cubic Feet Per Minute cfm Cubic Feet Per Second ft3 /s Cubic Foot ft3 Cubic Inch in3 Cubic Meter m 3 Cubic Yard yd3 Coefficients Of Variation CVs Day d Days Per Week d/wk Days Per Year (Annum) d/a Dead Weight Tonnes DWT Decibel Adjusted dBa Decibel dB Degree ° Degrees Celsius °C Diameter ø Dollar (American) US$ Dollar (Canadian) CDN$ Dry Metric Ton dmt Foot ft Gallon (US) gal Gallons Per Minute (US) gpm Gigajoule GJ Gigapascal GPa Gigawatt GW Gram g Grams Per Litre g/L Grams Per Tonne g/t Greater Than > Hectare (10,000 M2) ha Hertz Hz |
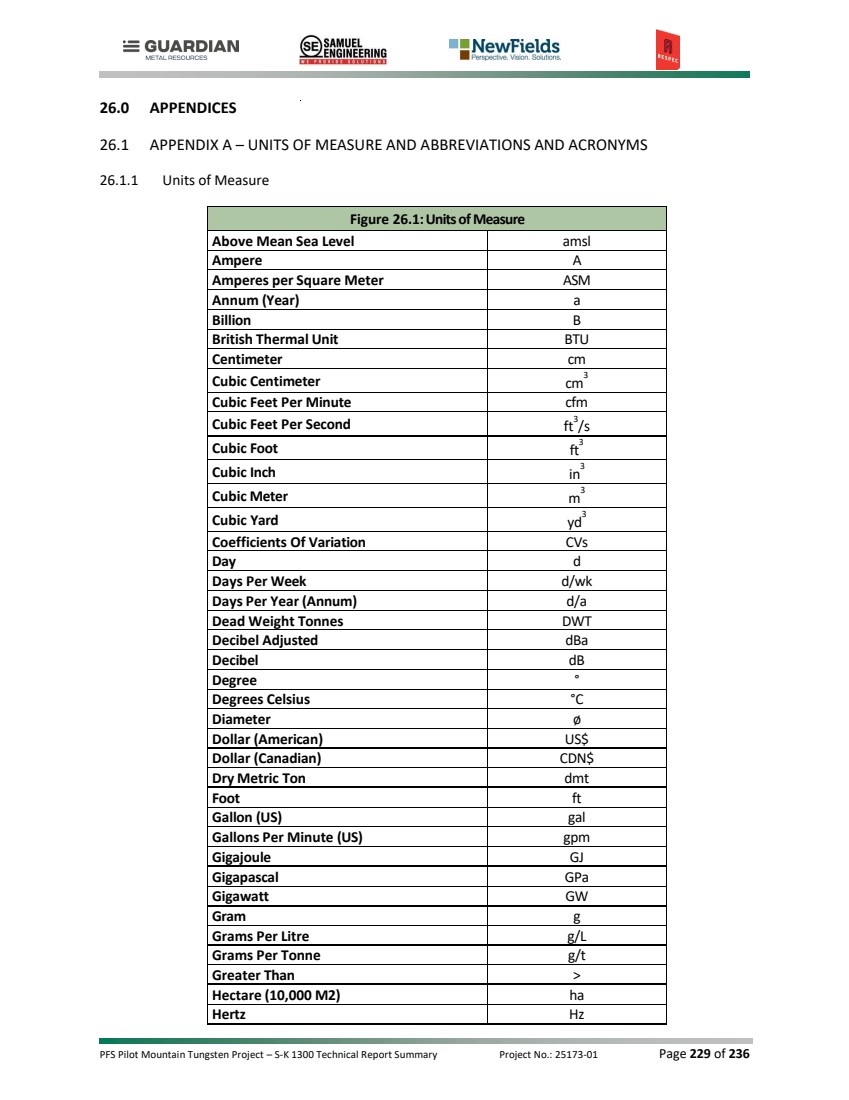
| PFS Pilot Mountain Tungsten Project – S-K 1300 Technical Report Summary Project No.: 25173-01 Page 230 of 236 Figure 26.1: Units of Measure Horsepower hp Hour h Hours Per Day h/d Hours Per Week h/wk Hours Per Year h/a Inch in Kilo (Thousand) k Kilogram kg Kilograms Per Cubic Meter kg/m3 Kilograms Per Hour kg/h Kilograms Per Square Meter kg/m2 Kilometer km Kilometers Per Hour km/h Kilopascal kPa Kiloton (1,000 Tonnes) kt Kilovolt kV Kilovolt-Ampere kVA Kilovolts kV Kilowatt kW Kilowatt Hour kWh Kilowatt Hours Per Tonne kWh/t Kilowatt Hours Per Year kWh/a Less Than < Liter L Liters Per Minute L/m Liters Per Second L/s Megabytes Per Second Mb/s Megapascal MPa Megavolt-Ampere MVA Megawatt MW Meter m Meters Above Sea Level masl Meters Per Minute m/min Meters Per Second m/s Micron μm Milligram mg Milligrams Per Liter mg/L Milliliter mL Millimeter mm Million M Million Bank Cubic Meters Mbm3 Million Bank Cubic Meters Per Annum Mbm3 /a Million Tonnes Mt Minute (Plane Angle) ' Minute (Time) min |
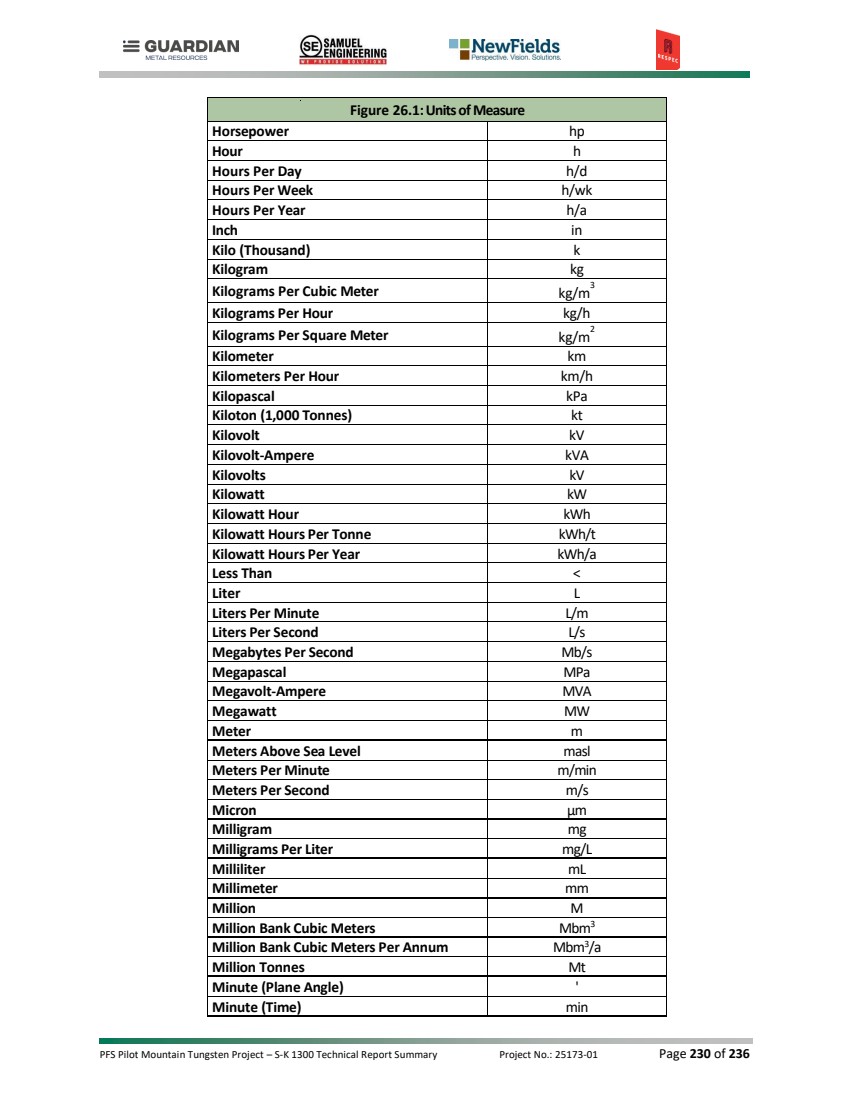
| PFS Pilot Mountain Tungsten Project – S-K 1300 Technical Report Summary Project No.: 25173-01 Page 231 of 236 Figure 26.1: Units of Measure Month mo Ounce oz Pascal Pa Centipoise (MPa·S) cP Parts Per Million ppm Parts Per Billion ppb Percent % Pound(S) lb Pounds Per Square Inch psi Revolutions Per Minute rpm Second (Plane Angle) " Second (Time) s Short Ton (2,000 Lb) st Short Tons Per Day st/d Short Tons Per Year st/y Specific Gravity SG Square Centimeter cm2 Square Foot ft2 Square Inch in2 Square Kilometer km2 Square Meter m2 Three-Dimensional 3D Tonne (1,000 Kg) (Metric Ton) t Tonnes Per Day t/d Tonnes Per Hour t/h Tonnes per annum t/a Tonnes Seconds Per Hour Meter Cubed ts/hm3 United States Dollar USD Volt V Week wk Weight/Weight w/w Wet Metric Ton wmt Year yr 26.1.2 Abbreviations and Acronyms Figure 26.2: Abbreviations and Acronyms Acid Generating AG Acid Generating Potential AGP Acid Rock Drainage ARD Alternating Current AC Ammonium Nitrate Fuel Oil ANFO Approved Jurisdictional Determination AJD Association for the Advancement of Cost Engineering AACE Andes Corporación Minera S.A. ACMSA |
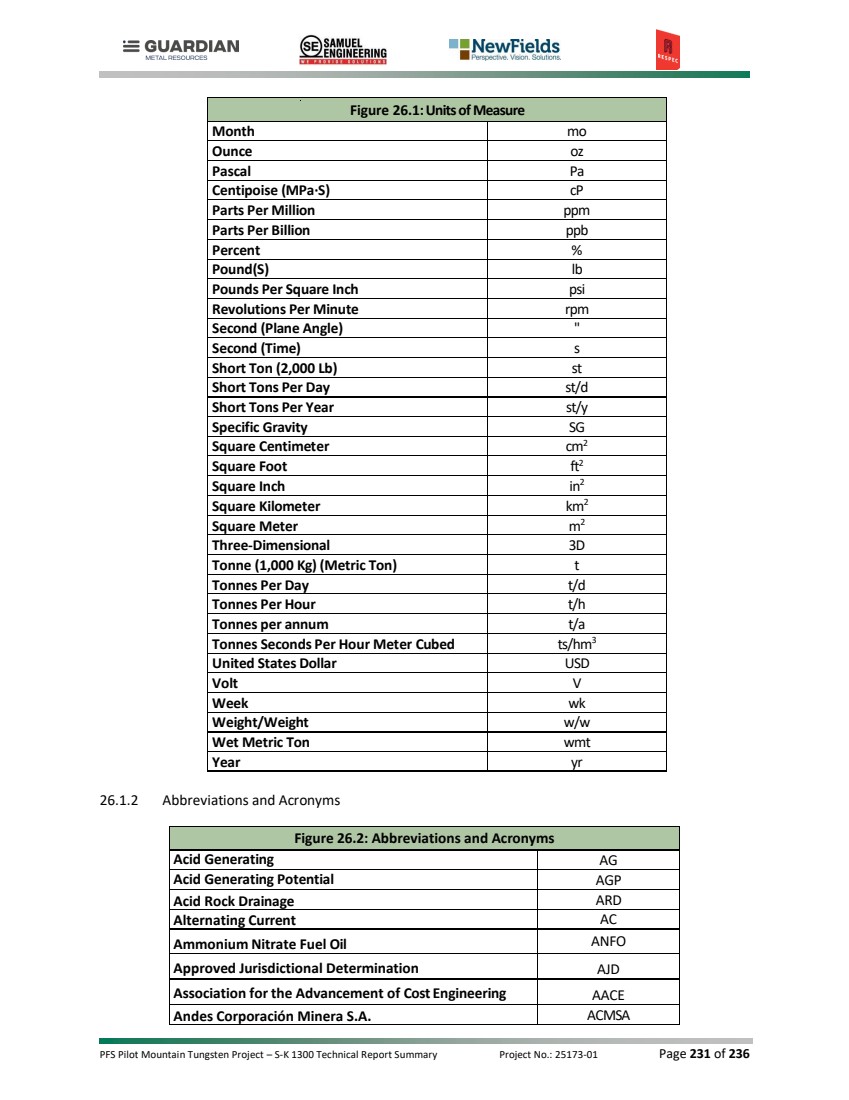
| PFS Pilot Mountain Tungsten Project – S-K 1300 Technical Report Summary Project No.: 25173-01 Page 232 of 236 Figure 26.2: Abbreviations and Acronyms Acid-Base Accounting ABA Autogenous/Ball Mill/Crushing ABC Bond Ball Mill Work Index BWi Bureau of Land Management BLM Bureau of Mining Regulation and Reclamation BMRR Canadian Institute of Mining, Metallurgy and Petroleum CIM Certificate Of Approval CofA Certified Reference Material CRM Clean Water Act CWA Clinopyroxene–Plagioclase–Plagioclase CCP Close-Circuit Fully Autogenous Grinding Milling FAC Conceptual Closure and Rehabilitation Plan CRP Construction Quality Assurance CQA Cutoff Grade COG Direct Current DC Diorite (Pre-Mineral Pluton) DIO / PMP Enrichment Ratio ER Environmental Assessment EA Environmental Baseline Report EBR Environmental Impact Assessment EIA Environmental Impact Review EIR Environmental Protection Measure EPM Environment, Social, and Governance ESG Exploration Plan of Operations EPO Exploratory Data Analysis EDA Early Mineral Porphyry EMP Ground Engaging Tools GET Heavy Medium Separation HMS High-Intensity Magnetic Separation HIMS Humidity Cell Testing HCT Hydrothermal Breccia HBX Hypogene (Primary Zone) HYP Induced Polarization IP Inductively Coupled Plasma ICP Internal Rate of Return IRR International Organization for Standardization ISO In-The-Hole ITH Inverse Distance-Weighted ID Inter Mineral Porphyry IMP Joint Ore Reserves Committee JORC |
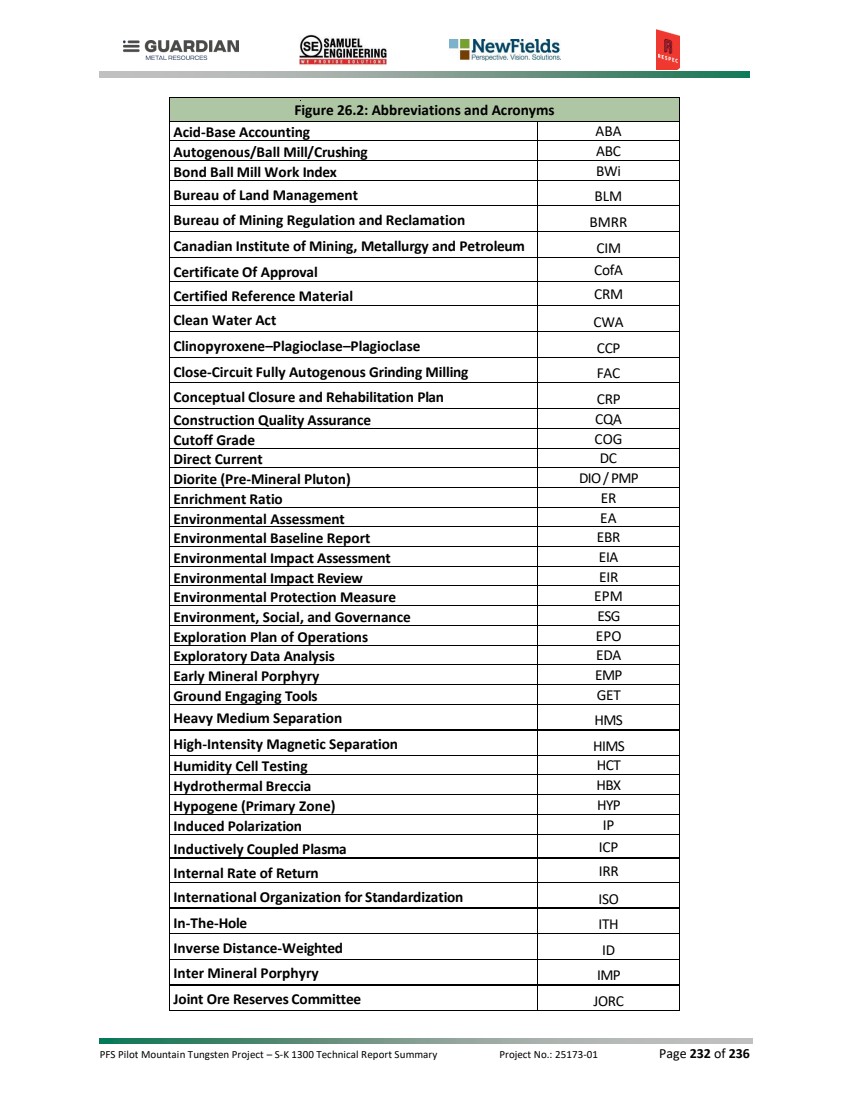
| PFS Pilot Mountain Tungsten Project – S-K 1300 Technical Report Summary Project No.: 25173-01 Page 233 of 236 Figure 26.2: Abbreviations and Acronyms Lerchs-Grossman LG Life-Of-Mine LOM Load-Haul-Dump LHD Magmatic Hydrothermal Breccia MAG HYD BX Magneto Telluric MT Meteoric Water Mobility Procedure MWMP Methyl Isobutyl Carbinol MIBC Million Years Ago Mya Mine Block Intrusion MBI Mine Plan of Operations MPO Minimum Environmental Protection Standard Laws MEPSL Nearest Neighbor NN National Environmental Policy Act NEPA National Historic Preservation Act NHPA National Wetlands Inventory NWI Net Acid Generating/Generation NAG Net Neutralization Potential NNP Net Present Value NPV Net Smelter Return NSR Nevada Administrative Code NAC Nevada Division of Environmental Protection NDEP Nevada Division of Water Resources NDWR Nevada Revised Statute NRS New York Stock Exchange NYSE Non-Potentially Acid Generating NPAG Ordinary Kriging OK Overburden Zone OVB Piezoluminescence PZL Plan of Operations PoO Point of Interconnection POI Portable Infrared Spectrometer Pima Potentially Acid Generating PAG Power Distribution Center PDC Preliminary Economic Assessment PEA Prefeasibility Study PFS |
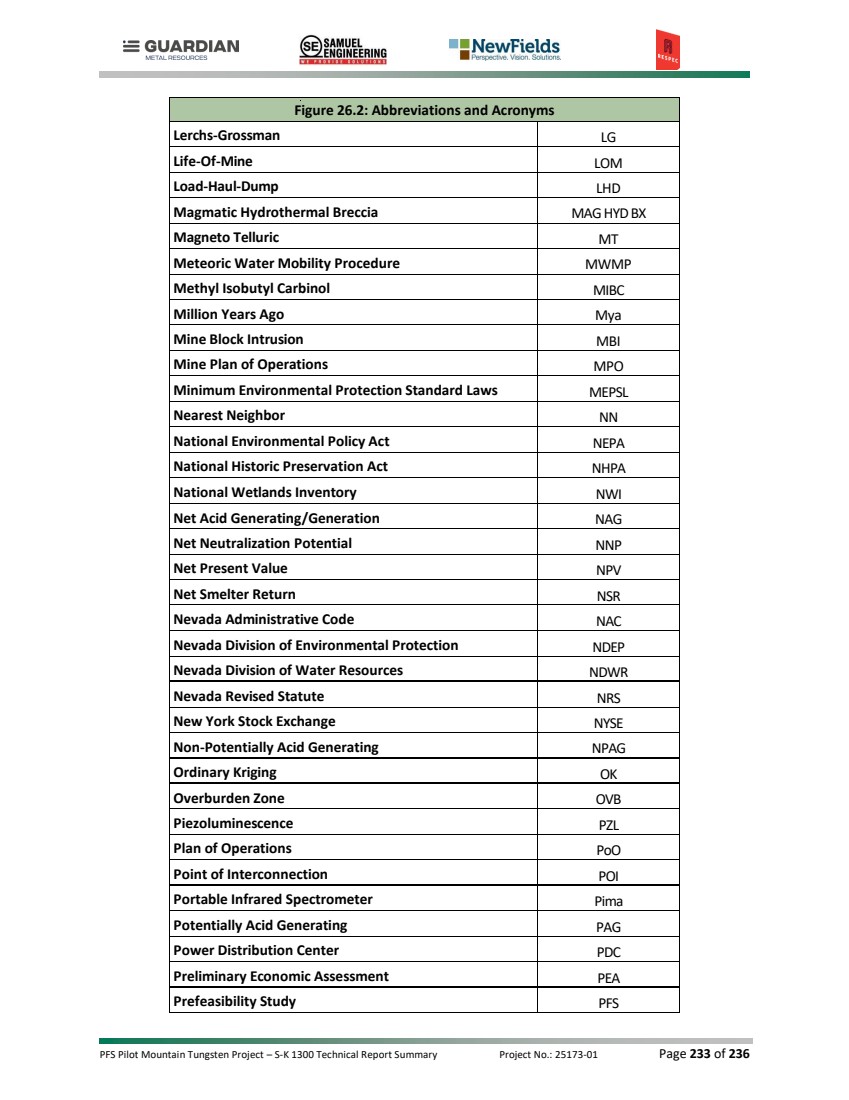
| PFS Pilot Mountain Tungsten Project – S-K 1300 Technical Report Summary Project No.: 25173-01 Page 234 of 236 Figure 26.2: Abbreviations and Acronyms Primary Zone PR Principal Component Analysis PCA Qualified Persons QP’s Quality Assurance QA Quality Control QC Quantitative Evaluation of Minerals by Scanning Electron Microscopy QEMSCAN Relative Bulk Strength RBS Relative Percentage Difference RPD Reverse Circulation RC Rock Quality Designation RQD Run-Of-Mine ROM SEC Subpart 1300 of Regulation S-K S-K 1300 Selective Mining Unit SMU Semi-Autogenous SAG Semi-Autogenous/Ball Mill/Crushing SABC SGS Lakefield Research Ltd. SGS Solitario Argentina S.A. SASA Specific Gravity SG Standard Reference Material SRM State Historic Preservation Office SHPO Supergene Zone SS Tailings Storage Facility TSF Toronto Stock Exchange TSX Total Inorganic Carbon TIC Unidirectional Solidification Texture UST United Nations Development Program UNDP United States Bureau of Land Management USBLM United States Geological Survey USGS U.S. Army Corps of Engineers USACE Volcanics VOLCS Waste Rock Storage Facility WRSF Wet High-Intensity Magnetic Separation WHIMS World Meteorological Organization WMO |

| PFS Pilot Mountain Tungsten Project – S-K 1300 Technical Report Summary Project No.: 25173-01 Page 235 of 236 26.2 APPENDIX B – MINERAL STATUS REPORT AND CLAIMS |