Exhibit 99.2
SAGTEC GLOBAL LIMITED
INDEX TO UNAUDITED INTERIM CONDENSED CONSOLIDATED
FINANCIAL STATEMENTS
SAGTEC GLOBAL LIMITED AND ITS SUBSIDIARIES
UNAUDITED INTERIM CONDENSED CONSOLIDATED STATEMENT OF FINANCIAL POSITION
AS OF DECEMBER 31, 2025 AND JUNE 30, 2026
| |
|
|
|
|
As of |
|
| |
|
Note |
|
|
December 31,
2025 |
|
|
June 30,
2026 |
|
|
June 30,
2026 |
|
| |
|
|
|
|
RM |
|
|
RM |
|
|
Convenience
Translation
USD |
|
| ASSETS |
|
|
|
|
|
|
|
|
|
|
|
|
| |
|
|
|
|
|
|
|
|
|
|
|
|
| Non-current assets |
|
|
|
|
|
|
|
|
|
|
|
|
| Plant and equipment | | | 5 | | | | 39,086,576 | | | | 40,655,721 | | | | 9,955,365 | |
| Right-of-use assets | | | 6 | | | | 1,410,228 | | | | 1,234,159 | | | | 302,208 | |
| Prepayments | | | 9 | | | | 51,058,607 | | | | 51,742,427 | | | | 12,670,167 | |
| Total non-current assets | | | | | | | 91,555,411 | | | | 93,632,307 | | | | 22,927,740 | |
| |
|
|
|
|
|
|
|
|
|
|
|
|
|
|
|
|
| Current assets |
|
|
|
|
|
|
|
|
|
|
|
|
|
|
|
|
| Trade receivables, net | | | 7 | | | | 9,975,198 | | | | 20,834,160 | | | | 5,101,660 | |
| Other receivables | | | 8 | | | | 508,958 | | | | 681,895 | | | | 166,976 | |
| Prepayments | | | 9 | | | | 3,761,758 | | | | 5,377,257 | | | | 1,316,729 | |
| Cash and short term deposits | | | 10 | | | | 10,861,937 | | | | 14,017,250 | | | | 3,432,403 | |
| Amount due from director | | | 14 | | | | - | | | | 6,134,656 | | | | 1,502,193 | |
| Total current assets | | | | | | | 25,107,851 | | | | 47,045,218 | | | | 11,519,961 | |
| Total assets | | | | | | | 116,663,262 | | | | 140,677,525 | | | | 34,447,701 | |
| |
|
|
|
|
|
|
|
|
|
|
|
|
|
|
|
|
| LIABILITIES AND EQUITY |
|
|
|
|
|
|
|
|
|
|
|
|
|
|
|
|
| |
|
|
|
|
|
|
|
|
|
|
|
|
|
|
|
|
| Current liabilities |
|
|
|
|
|
|
|
|
|
|
|
|
|
|
|
|
| Trade payables | | | 7 | | | | 335,070 | | | | 6,411,187 | | | | 1,569,906 | |
| Other payables | | | 8 | | | | 1,749,353 | | | | 1,955,754 | | | | 478,905 | |
| Provisions | | | 12 | | | | 25,296 | | | | 25,296 | | | | 6,194 | |
| Tax payable | | | 15 | | | | 5,143,639 | | | | 5,117,937 | | | | 1,253,229 | |
| Lease liabilities | | | 6 | | | | 323,500 | | | | 330,501 | | | | 80,930 | |
| Bank borrowings | | | 13 | | | | 1,173,088 | | | | 1,227,285 | | | | 300,525 | |
| Total current liabilities | | | | | | | 8,749,946 | | | | 15,067,960 | | | | 3,689,689 | |
| |
|
|
|
|
|
|
|
|
|
|
|
|
|
|
|
|
| Non-current liabilities |
|
|
|
|
|
|
|
|
|
|
|
|
|
|
|
|
| Lease liabilities | | | 6 | | | | 1,036,738 | | | | 870,887 | | | | 213,254 | |
| Bank borrowings | | | 13 | | | | 3,859,445 | | | | 3,239,408 | | | | 793,235 | |
| Deferred tax liabilities | | | 15 | | | | 1,005,135 | | | | 1,159,820 | | | | 284,005 | |
| Total non-current liabilities | | | | | | | 5,901,318 | | | | 5,270,115 | | | | 1,290,494 | |
| Total liabilities | | | | | | | 14,651,264 | | | | 20,338,075 | | | | 4,980,183 | |
| |
|
|
|
|
|
|
|
|
|
|
|
|
|
|
|
|
| Equity |
|
|
|
|
|
|
|
|
|
|
|
|
|
|
|
|
| Share capital, 10,800,000 common shares issued and outstanding with no par value, unlimited authorized share | | | 4 | | | | 1,145,780 | | | | 1,145,780 | | | | 280,567 | |
| Issuance of 8,850,000 ordinary shares with no par value | | | 4 | | | | 77,333,584 | | | | 77,333,584 | | | | 18,936,673 | |
| Issuance of 3,100,000 ordinary shares with no par value | | | 4 | | | | - | | | | 13,389,952 | | | | 3,278,797 | |
| Reserves | | | 16 | | | | 3,280,388 | | | | 3,280,388 | | | | 803,269 | |
| Retained earnings | | | | | | | 19,451,649 | | | | 24,296,019 | | | | 5,949,365 | |
| Shareholders’ equity | | | | | | | 101,211,401 | | | | 119,445,723 | | | | 29,248,671 | |
| Non-controlling interest | | | | | | | 800,597 | | | | 893,727 | | | | 218,847 | |
| Total equity | | | | | | | 102,011,998 | | | | 120,339,450 | | | | 29,467,518 | |
| Total liabilities and equity | | | | | | | 116,663,262 | | | | 140,677,525 | | | | 34,447,701 | |
The accompanying notes are an integral part of
these unaudited interim condensed consolidated financial statements.
SAGTEC GLOBAL LIMITED AND ITS SUBSIDIARIES
UNAUDITED INTERIM CONDENSED CONSOLIDATED STATEMENTS OF PROFIT OR LOSS AND OTHER COMPREHENSIVE INCOME
FOR THE SIX MONTHS ENDED JUNE 30, 2025 AND 2026
| |
|
|
|
|
For the six months ended June 30, |
|
| |
|
Note |
|
|
2025 |
|
|
2026 |
|
|
2026 |
|
| |
|
|
|
|
RM |
|
|
RM |
|
|
Convenience
Translation
USD |
|
| Revenue | | 17 | | | 47,867,433 | | | 48,544,240 | | | 11,887,026 | |
| Total revenue | | | | | 47,867,433 | | | 48,544,240 | | | 11,887,026 | |
| |
|
|
|
|
|
|
|
|
|
|
|
|
| Cost of sales | | | 18 | | | | (38,224,086 | ) | | | (34,470,647 | ) | | | (8,440,826 | ) |
| Total cost of sales | | | | | | | (38,224,086 | ) | | | (34,470,647 | ) | | | (8,440,826 | ) |
| |
|
|
|
|
|
|
|
|
|
|
|
|
|
|
|
|
| Gross profit | | | | | | | 9,643,347 | | | | 14,073,593 | | | | 3,446,200 | |
| |
|
|
|
|
|
|
|
|
|
|
|
|
|
|
|
|
| Selling and administrative expenses | | | 19 | | | | (3,250,981 | ) | | | (5,803,205 | ) | | | (1,421,031 | ) |
| Selling and administrative expenses from related parties | | | 19 | | | | (617,923 | ) | | | (1,839,221 | ) | | | (450,370 | ) |
| Income from operations before income tax | | | | | | | 5,774,443 | | | | 6,431,167 | | | | 1,574,799 | |
| |
|
|
|
|
|
|
|
|
|
|
|
|
|
|
|
|
| Other income | | | | | | | 822,043 | | | | 50,948 | | | | 12,477 | |
| Finance costs | | | | | | | (132,800 | ) | | | (173,080 | ) | | | (42,382 | ) |
| Profit before income tax | | | | | | | 6,463,686 | | | | 6,309,035 | | | | 1,544,894 | |
| |
|
|
|
|
|
|
|
|
|
|
|
|
|
|
|
|
| Income tax expense | | | 15 | | | | (981,662 | ) | | | (1,371,535 | ) | | | (335,849 | ) |
| |
|
|
|
|
|
|
|
|
|
|
|
|
|
|
|
|
| Net Profit for the period, representing total comprehensive income for the period | | | | | | | 5,482,024 | | | | 4,937,500 | | | | 1,209,045 | |
| |
|
|
|
|
|
|
|
|
|
|
|
|
|
|
|
|
| Profit attributable to: |
|
|
|
|
|
|
|
|
|
|
|
|
|
|
|
|
| Equity owners of the Company | | | | | | | 5,416,870 | | | | 4,844,370 | | | | 1,186,240 | |
| Non-controlling interests | | | | | | | 65,154 | | | | 93,130 | | | | 22,805 | |
| Total | | | | | | | 5,482,024 | | | | 4,937,500 | | | | 1,209,045 | |
| |
|
|
|
|
|
|
|
|
|
|
|
|
|
|
|
|
| Weighted Average Number of Common Shares Outstanding –Basic and Diluted | | | | | | | 11,931,215 | | | | 20,163,811 | | | | 20,163,811 | |
| Basic and Diluted Net Income per Share | | | | | | | 0.4540 | | | | 0.2403 | | | | 0.0588 | |
The accompanying notes are an integral part of
these unaudited interim condensed consolidated financial statements.
SAGTEC GLOBAL LIMITED AND ITS SUBSIDIARIES
UNAUDITED INTERIM CONDENSED CONSOLIDATED STATEMENTS OF CHANGES IN EQUITY
FOR THE SIX MONTHS ENDED JUNE 30, 2025 AND 2026
| |
|
Note |
|
|
Number of
outstanding
shares |
|
|
Share
capital |
|
|
Reserves |
|
|
Retained
earnings |
|
|
Shareholders’
equity |
|
|
Non-controlling
interest |
|
|
Total
equity |
|
| |
|
|
|
|
|
|
|
RM |
|
|
RM |
|
|
RM |
|
|
RM |
|
|
RM |
|
|
RM |
|
| Balance at January 1, 2025 | | | | | | | 10,800,000 | | | | 1,145,780 | | | | 3,280,388 | | | | 12,365,963 | | | | 16,792,131 | | | | 592,070 | | | | 17,384,201 | |
| Issuance of ordinary shares upon IPO, net | | | 4 | | | | 1,750,000 | | | | 20,039,124 | | | | - | | | | - | | | | 20,039,124 | | | | - | | | | 20,039,124 | |
| Net profit for the period | | | | | | | - | | | | - | | | | - | | | | 5,416,870 | | | | 5,416,870 | | | | 65,154 | | | | 5,482,024 | |
| Balance at June 30, 2025 | | | | | | | 12,550,000 | | | | 21,184,904 | | | | 3,280,388 | | | | 17,782,833 | | | | 42,248,125 | | | | 657,224 | | | | 42,905,349 | |
| Issuance of ordinary shares | | | 4 | | | | 7,100,000 | | | | 57,294,460 | | | | - | | | | - | | | | 57,294,460 | | | | - | | | | 57,294,460 | |
| Net profit for the period | | | | | | | - | | | | - | | | | - | | | | 1,668,816 | | | | 1,668,816 | | | | 143,373 | | | | 1,812,189 | |
| Balance at December 31, 2025 | | | | | | | 19,650,000 | | | | 78,479,364 | | | | 3,280,388 | | | | 19,451,649 | | | | 101,211,401 | | | | 800,597 | | | | 102,011,998 | |
| Issuance of ordinary shares | | | 4 | | | | 3,100,000 | | | | 13,389,952 | | | | - | | | | - | | | | 13,389,952 | | | | - | | | | 13,389,952 | |
| Net profit for the period | | | | | | | - | | | | - | | | | - | | | | 4,844,370 | | | | 4,844,370 | | | | 93,130 | | | | 4,937,500 | |
| Balance at June 30, 2026 | | | | | | | 22,750,000 | | | | 91,869,316 | | | | 3,280,388 | | | | 24,296,019 | | | | 119,445,723 | | | | 893,727 | | | | 120,339,450 | |
| |
|
Note |
|
|
Number of outstanding shares |
|
|
Share capital |
|
|
Reserves |
|
|
Retained earnings |
|
|
Shareholders’
equity |
|
|
Non-controlling interest |
|
|
Total equity |
|
| |
|
|
|
|
|
|
|
USD |
|
|
USD |
|
|
USD |
|
|
USD |
|
|
USD |
|
|
USD |
|
| Balance at June 30, 2025 | | | | | | | 12,550,000 | | | | 5,187,547 | | | | 803,269 | | | | 4,354,481 | | | | 10,345,297 | | | | 160,934 | | | | 10,506,231 | |
| Balance at June 30, 2026 | | | | | | | 22,750,000 | | | | 22,496,037 | | | | 803,269 | | | | 5,949,365 | | | | 29,248,671 | | | | 218,847 | | | | 29,467,518 | |
Equity transaction reflect changes in a parent’s ownership interest
in a subsidiary that do not result in the parent losing control of the subsidiary.
The accompanying notes are an integral part of
these unaudited interim condensed consolidated financial statements.
SAGTEC GLOBAL LIMITED AND ITS SUBSIDIARIES
UNAUDITED INTERIM CONDENSED CONSOLIDATED STATEMENTS OF CASH FLOWS
FOR THE SIX MONTHS ENDED JUNE 30, 2025 AND 2026
| |
|
|
|
|
For the six months ended June 30, |
|
| |
|
|
|
|
2025 |
|
|
2026 |
|
|
2026 |
|
| |
|
|
|
|
RM |
|
|
RM |
|
|
Convenience
Translation
USD |
|
| CASH FLOWS FROM OPERATING ACTIVITIES: |
|
|
|
|
|
|
|
|
|
|
|
|
|
|
|
|
| Net Profit for the period | | | | | | | 5,482,024 | | | | 4,937,500 | | | | 1,209,045 | |
| |
|
|
|
|
|
|
|
|
|
|
|
|
|
|
|
|
| Adjustments to reconcile net profit to net cash used in operating activities: |
|
|
|
|
|
|
|
|
|
|
|
|
|
|
|
|
| Provisions | | | | | | | 25,296 | | | | - | | | | - | |
| Depreciation | | | | | | | 1,416,746 | | | | 2,375,429 | | | | 581,671 | |
| Amortization | | | | | | | 47,565 | | | | 177,083 | | | | 43,362 | |
| Imputed interest of lease liability | | | | | | | 8,166 | | | | 31,444 | | | | 7,700 | |
| Finance costs | | | | | | | 132,800 | | | | 173,080 | | | | 42,382 | |
| Overdraft charges | | | | | | | 54,231 | | | | 51,365 | | | | 12,578 | |
| Income tax expenses | | | | | | | 981,662 | | | | 1,371,535 | | | | 335,849 | |
| Gain on disposal of plant & equipment | | | | | | | (460 | ) | | | - | | | | - | |
| Gain on lease termination | | | | | | | (4,790 | ) | | | - | | | | - | |
| Share-based payment expense | | | | | | | - | | | | 4,748,609 | | | | 1,162,792 | |
| Expected credit loss (ECL), net | | | | | | | 1,779,458 | | | | 2,235,888 | | | | 547,502 | |
| Operating cash flows before movements in working capital | | | | | | | 9,922,698 | | | | 16,101,933 | | | | 3,942,881 | |
| |
|
|
|
|
|
|
|
|
|
|
|
|
|
|
|
|
| Trade receivables | | | | | | | (4,180,063 | ) | | | (13,094,850 | ) | | | (3,206,535 | ) |
| Other receivables and prepayment (cash related) | | | | | | | (8,934,588 | ) | | | (172,936 | ) | | | (42,347 | ) |
| Other payables and accrued liabilities | | | | | | | 810,702 | | | | 206,401 | | | | 50,541 | |
| Trade payables | | | | | | | 1,336,293 | | | | 6,076,117 | | | | 1,487,859 | |
| Cash (used in)/generated from operations | | | | | | | (1,044,958 | ) | | | 9,116,665 | | | | 2,232,399 | |
| |
|
|
|
|
|
|
|
|
|
|
|
|
|
|
|
|
| Income tax paid | | | | | | | (1,013,294 | ) | | | (1,242,552 | ) | | | (304,264 | ) |
| Net cash (used in)/provided by operating activities | | | | | | | (2,058,252 | ) | | | 7,874,113 | | | | 1,928,135 | |
| |
|
|
|
|
|
|
|
|
|
|
|
|
|
|
|
|
| Investing activities |
|
|
|
|
|
|
|
|
|
|
|
|
|
|
|
|
| Purchase of plant and equipment | | | | | | | (16,678,670 | ) | | | (3,944,574 | ) | | | (965,908 | ) |
| Proceeds from disposal of plant and equipment | | | | | | | 833,172 | | | | - | | | | - | |
| Net cash used in investing activities | | | | | | | (15,845,498 | ) | | | (3,944,574 | ) | | | (965,908 | ) |
| |
|
|
|
|
|
|
|
|
|
|
|
|
|
|
|
|
| Financing activities |
|
|
|
|
|
|
|
|
|
|
|
|
|
|
|
|
| Issuance of ordinary shares | | | | | | | 20,039,124 | | | | 207,368 | | | | 50,777 | |
| Repayment of lease liabilities | | | | | | | (52,438 | ) | | | (191,308 | ) | | | (46,846 | ) |
| Increase in fixed deposits | | | | | | | (10,215 | ) | | | (7,976 | ) | | | (1,953 | ) |
| Overdraft charges paid | | | | | | | (54,231 | ) | | | (51,365 | ) | | | (12,578 | ) |
| Repayment of bank loans | | | | | | | (355,386 | ) | | | (565,841 | ) | | | (138,557 | ) |
| Loan interest paid | | | | | | | (132,800 | ) | | | (173,080 | ) | | | (42,382 | ) |
| Proceeds from amount due from/(to) directors | | | | | | | 13,792 | | | | - | | | | - | |
| Net cash provided by/(used in) financing activities | | | | | | | 19,447,846 | | | | (782,202 | ) | | | (191,539 | ) |
| |
|
|
|
|
|
|
|
|
|
|
|
|
|
|
|
|
| Net increase in cash and cash equivalents | | | | | | | 1,544,096 | | | | 3,147,337 | | | | 770,688 | |
| Cash and cash equivalents at beginning of period | | | 10 | | | | 370,129 | | | | 9,161,045 | | | | 2,243,265 | |
| Cash and cash equivalents at end of period | | | 10 | | | | 1,914,225 | | | | 12,308,382 | | | | 3,013,953 | |
| |
|
|
|
|
|
|
|
|
|
|
|
|
|
|
|
|
| Supplement disclosures of non-cash activities These transactions did not involve cash flows and are therefore excluded from the statement of cash flows in accordance with IAS 7 Statement of Cash Flows |
|
|
|
|
|
|
|
|
|
|
|
|
|
|
|
|
| Issuance of Class A ordinary shares for consultant services | | | | | | | - | | | | 55,356 | | | | 13,555 | |
| Issuance of Class A ordinary shares for employee share option scheme | | | | | | | - | | | | 2,527,939 | | | | 619,016 | |
| Issuance of Class A ordinary shares for consultant services (recognised as prepayments) | | | | | | | - | | | | 3,700,905 | | | | 906,241 | |
| Issuance of Class A ordinary shares for advertisement services (recognised as prepayments) | | | | | | | - | | | | 763,728 | | | | 187,014 | |
The accompanying notes are an integral part of
these unaudited interim condensed consolidated financial statements.
SAGTEC GLOBAL LIMITED AND ITS SUBSIDIARIES
NOTES TO UNAUDITED INTERIM CONDENSED CONSOLIDATED FINANCIAL STATEMENTS
| 1 | ORGANIZATION AND PRINCIPAL ACTIVITIES |
Sagtec Global Limited (the “Company”) was incorporated in the British Virgin Islands on October 31, 2023 with registered office at Vistra Corporate Services Centre, Wickhams Cay II, Road Town, Tortola, VG1110, British Virgin Islands while principal place of business of the Company at No. 43-2, Jalan Besar Kepong, Pekan Kepong, 52100 Kuala Lumpur, Malaysia.
The group structure which represents the operating subsidiaries and dormant companies as of the reporting date is as follow:
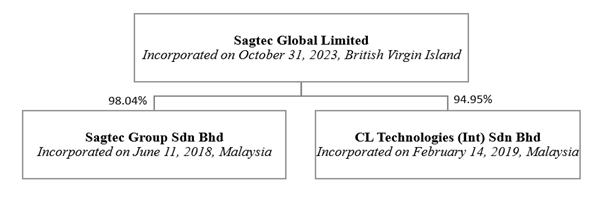
Details of the Company and its subsidiaries (collectively, the “Group”) are shown in the table below:
| | | Percentage of effective ownership |
| | | June 30, |
| Name | | Date of
incorporation | | 2026 | | 2025 | | Place of
incorporation | | Principal
activities |
| | | | | % | | % | | | | |
| Sagtec Global Limited | | October 31, 2023 | | — | | — | | British Virgin Islands | | Holding company |
| Sagtec Group Sdn Bhd | | June 11, 2018 | | 98.04 | | 98.04 | | Malaysia | | Food & beverage SAAS |
| CL Technologies (International) Sdn Bhd | | February 14, 2019 | | 94.95 | | 94.95 | | Malaysia | | Food & beverage software & server hosting |
The Group develops IT products, services, and solutions using the subscription as a service model, generating stable and sustainable revenue from our SaaS offerings.
As described above, the Company, through a series of transactions which is accounted for as a reorganization of entities under a common control (the “Reorganization”), will become the ultimate parent of its subsidiaries.
Through the reorganization, the Company will be the holding company of its subsidiaries. Accordingly, the consolidated financial statements will be prepared on a consolidated basis by applying the principle of common control as if the reorganization has been completed at the beginning of the first reporting period.
Based on the above, the Group concluded that the Company and its subsidiaries are effectively controlled by the shareholder before and after the Reorganization and the Reorganization is considered under common control. The transactions above were accounted for as a recapitalization. The consolidation of the Company and its subsidiaries has been accounted for at carrying value and prepared on the basis as if the aforementioned transactions had become effective as of the beginning of the first period presented in the accompanying consolidated financial statements.
SAGTEC GLOBAL LIMITED AND ITS SUBSIDIARIES
NOTES TO UNAUDITED INTERIM CONDENSED CONSOLIDATED FINANCIAL STATEMENTS
| 2 | MATERIAL ACCOUNTING POLICIES |
BASIS OF PREPARATION
The unaudited interim condensed consolidated financial statements have been prepared in accordance with the historical cost basis, except as disclosed in the accounting policies below, and are drawn up in accordance with the provisions of the International Financial Reporting Standards (“IFRSs”) as issued by the International Accounting Standards Board (“IASB”) for the six months ended June 30, 2026 and 2025.
These unaudited interim condensed consolidated financial statements for the six months ended June 30, 2026 and 2025 should be read in conjunction with the Group’s last audited annual consolidated financial statements for the years ended December 31, 2025 and 2024. They do not include all the information and disclosures required for a complete set of financial statements prepared in accordance with IFRS Accounting Standard. However, selected explanatory notes are included to explain events and transactions that are significant to an understanding of the changes in the Group’s financial position and performance since last annual consolidated financial statements.
Historical cost is generally based on the fair value of the consideration given in exchange for goods and services.
These unaudited interim condensed consolidated financial statements were approved by the board of directors of the Company on September 16, 2026.
ADOPTION OF NEW AND REVISED STANDARDS
On January 1, 2025 the Group has adopted the new or amended IFRS and interpretations issued by the IFRS interpretations Committee (IFRS IC) that are mandatory for application for the fiscal year. Changes to the Group’s accounting policies have been made as required, in accordance with the transitional provisions in the respective IFRS and IFRS IC.
The adoption of these new or amended IFRS and IFRS IC did not result in substantial changes to the Group’s accounting policies and had no material effect on the amounts reported for the current or prior financial years.
SAGTEC GLOBAL LIMITED AND ITS SUBSIDIARIES
NOTES TO UNAUDITED INTERIM CONDENSED CONSOLIDATED FINANCIAL STATEMENTS
| 2 | MATERIAL ACCOUNTING POLICIES (cont.) |
COMMON CONTROL & MERGER ACCOUNTING
The acquisition of entities, businesses or assets under common control are accounted for in accordance with merger accounting.
The unaudited interim condensed consolidated financial statements incorporate the financial statements of the consolidated entities or businesses in which the common control consolidation occurs as if they had been consolidated from the date when the consolidation entities or businesses first came under the control of the controlling party.
The unaudited interim condensed consolidated financial statements have prepared using uniform accounting policies for like transactions and other events in similar circumstances.
All intra-group balances, transactions, income and expenses are eliminated in full on consolidation and the consolidated financial statements reflect external transactions only.
The net assets of the consolidated entities or businesses are consolidated using the existing carrying amounts from the controlling party’s perspective. No amount is recognized in respect of goodwill or excess of the acquirer’s interest in the net fair value of acquiree’s identifiable assets, liabilities and contingent liabilities over the acquisition cost at the time of common control consolidation. All differences between the cost of acquisition (fair value of consideration paid) and the amounts at which the assets and liabilities are recorded, arising from common control consolidation, have been recognized directly in equity as part of the capital reserve.
The unaudited interim condensed consolidated statements of profit or loss and other comprehensive income include the results of each of the consolidation entities or businesses from the earliest date presented or since the date when the consolidated entities or businesses first came under the common control, where this is a shorter period, regardless of the date of the common control consolidation.
Subsidiaries
Subsidiaries are entities controlled by the Group. The Group controls and entity when it is exposed to, or has rights to, variable returns from its involvement with the entity and has the ability to affect those returns through its power over the entity. The financial statements of subsidiaries are included in the unaudited interim condensed consolidated financial statements from the date that control commences until the date that control ceases.
Loss of control
Upon the loss of control, the Group derecognizes the assets and liabilities of the subsidiary, any NCI, and the other components of equity related to the subsidiary. Any surplus or deficit arising on the loss of control is recognized in profit or loss. If the Group retains any interest in the former subsidiary, then such interest is measured at fair value at the date that control is lost.
CONVENIENCE TRANSLATION
Translations of amounts in the unaudited interim condensed consolidated statement of financial position, unaudited interim condensed consolidated statements of profit or loss and other comprehensive income, and unaudited interim condensed consolidated statement of cash flows from RM into USD as of and for the period ended June 30, 2026 are solely for the convenience of the reader. Unless otherwise noted, all translations from RM into USD for the fiscal period ended June 30, 2026 were calculated at of USD1 = RM4.0838 or an average rate of USD1 = RM3.9839.
SAGTEC GLOBAL LIMITED AND ITS SUBSIDIARIES
NOTES TO UNAUDITED INTERIM CONDENSED CONSOLIDATED FINANCIAL STATEMENTS
| 2 | MATERIAL ACCOUNTING POLICIES (cont.) |
FINANCIAL ASSETS
Classification and measurement
Financial assets are recognized when a Group entity becomes a party to the contractual provisions of the instrument. All regular way purchases or sales of financial assets are recognized and derecognized on a trade date basis. Regular way purchases or sales are purchases or sales of financial assets that require delivery of assets within the time frame established by regulation or convention in the market place.
Financial assets are initially measured at fair value except for trade receivables arising from contracts with customers which are initially measured in accordance with IFRS 15 Revenue from Contracts with Customers (“IFRS 15”). Transaction costs that are directly attributable to the acquisition of financial assets (other than financial assets at fair value through profit or loss (“FVTPL”)) are added to the fair value of the financial assets, as appropriate, on initial recognition. Transaction costs directly attributable to the acquisition of financial assets at fair value through profit or loss are recognized immediately in consolidated statement of profit or loss. The Group classifies its financial assets at fair value through other comprehensive income, fair value through profit and loss and amortized cost.
The classification depends on the Group’s business model for managing the financial assets as well as the contractual terms of the cash flows of the financial assets.
| 1. | Financial assets at Fair Value through Profit or Loss (FVTPL) are initially recorded at fair value and transaction costs are expensed in the statements of income and comprehensive income. Realized and unrealized gains and income arising from changes in the fair value of the financial asset held at FVTPL are included in the statements of income and comprehensive income in the period in which they arise. There are no financial assets classified as FVTPL |
| 2. | Financial assets at Fair Value through Other Comprehensive Income (FVTOCI) are initially recognized at fair value plus transaction costs. Subsequently they are measured at fair value, with gains and losses arising from changes in fair value recognized in other comprehensive income. There is no subsequent reclassification of fair value gains and losses to profit or loss following the derecognition of the investment. There are no financial assets classified as FVTOCI. |
| 3. | Financial assets at amortized cost are initially recognized at fair value, net of transaction costs, and subsequently carried at amortized cost less any impairment. They are classified as current assets or non- current assets based on their maturity date. The Company has classified trade receivables, other receivables and amounts due from related parties at amortized cost. |
Impairment
The Group assesses at end of each reporting period whether there is objective evidence that a financial asset or group of financial assets is impaired.
The Group recognizes expected credit losses (“ECL”) for accounts receivable based on the simplified approach. The simplified approach to the recognition of expected losses does not require the Company to track the changes in credit risk; rather, the Company recognizes a loss allowance based on lifetime expected credit losses at each reporting date from the date of the accounts receivable.
The Group assesses expected credit losses for other receivables, including amounts due from directors, shareholders and related parties, based on a 12-month expected credit loss model at each reporting date. As at the reporting date, no loss allowance has been recognised as the expected credit losses are not material and there has been no significant increase in credit risk.
The Group measures expected credit loss by considering the risk of default over the contract period and incorporates forward-looking information into its measurement. ECLs are a probability-weighted estimate of credit losses.
ECLs are measured as the difference in the present value of the contractual cash flows that are due to the Company under the contract, and the cash flows that the Company expects to receive. The Company assesses all information available, including past due status, and forward looking macro- economic factors in the measurement of the ECLs associated with its assets carried at amortized cost.
The maximum period considered when estimating ECLs is the maximum contractual period over which the Company is exposed to credit risk.
Derecognition of financial assets
The Group derecognizes a financial asset only when the contractual rights to the cash flow from the asset expire, or when it transfers the financial asset and substantially all the risks and rewards of ownership of asset to another entity.
On derecognition of a financial asset measured at amortized cost, the difference between the asset’s carrying amount and the sum of the consideration received and receivable is recognized in profit or loss.
SAGTEC GLOBAL LIMITED AND ITS SUBSIDIARIES
NOTES TO UNAUDITED INTERIM CONDENSED CONSOLIDATED FINANCIAL STATEMENTS
| 2 | MATERIAL ACCOUNTING POLICIES (cont.) |
FINANCIAL LIABILITIES
Financial liabilities are classified as either financial liabilities at FVTPL or at amortized cost. The Group determines the classification of its financial liabilities at initial recognition.
Financial liabilities are classified as measured at amortized cost, net of transaction costs unless classified as FVTPL. The Group trade payables, other payables and accrued liabilities, amounts due to related parties, lease liabilities and bank loans are classified as measured at amortized cost.
Derecognition of financial liabilities
The Group derecognizes financial liabilities when, and only when, the Group’s obligation are discharged, cancelled or expired. The difference between the carrying amount of the financial liability derecognized and the consideration paid and payable is recognized in profit or loss.
PLANT AND EQUIPMENT
Plant and equipment is recognized and subsequently measured at cost less accumulated depreciation and any accumulated impairment losses, if any. When components of property and equipment have different useful lives they are accounted for separately. Depreciation is provided at rates which are calculated to write off the assets over their estimated useful lives as follows:
| Computer and handphone | | 5 years straight line |
| Equipment and machine | | 10 years straight line |
| License | | 10 years straight line |
| Right-of-use assets | | Over term of lease |
| Renovation | | Over term of lease |
Plant and equipment is derecognized upon disposal or when no future economic benefits are expected from its use. Any gain or loss arising from derecognition of the asset, being the difference between the net disposal proceeds and the carrying amount, is recognized in profit or loss.
IMPAIRMENT OF NON-FINANCIAL ASSETS
Impairment of assets are reviewed at the end of each reporting period for impairment when there is an indication that the assets might be impaired. Impairment is measured by comparing the carrying values of the assets with their recoverable amounts. When the carrying amount of an asset exceeds its recoverable amount, the asset is written down to its recoverable amount and an impairment loss shall be recognized. The recoverable amount of an asset is the higher of the asset’s fair value less costs to sell and its value in use, which is measured by reference to discounted future cash flows using a pre-tax discount rate that reflects current market assessments of the time value of money and the risks specific to the asset. An impairment loss is recognized in profit or loss.
When there is a change in the estimates used to determine the recoverable amount, a subsequent increase in the recoverable amount of an asset is treated as a reversal of the previous impairment loss and is recognized to the extent of the carrying amount of the asset that would have been determined (net of amortization and depreciation) had no impairment loss been recognized. The reversal is recognized in profit or loss immediately.
SAGTEC GLOBAL LIMITED AND ITS SUBSIDIARIES
NOTES TO UNAUDITED INTERIM CONDENSED CONSOLIDATED FINANCIAL STATEMENTS
| 2 | MATERIAL ACCOUNTING POLICIES (cont.) |
LEASES
The Group as lessee
The Group assesses whether a contract is or contains a lease, at inception of the contract. The Group recognizes a right-of-use asset and corresponding lease liability with respect to all lease arrangements in which it is the lessee, except for low-value assets and short-term leases with 12 months or less. For these leases, the Group recognizes the lease payments as an operating expense on a straight-line method over the term of the lease unless another systematic basis is more representative of the time pattern in which economic benefits from the leased assets are consumed.
The Group recognizes a right-of-use asset and a lease liability at the lease commencement date. The right-of-use assets and the associated lease liabilities are presented as a separate line item in the statements of financial position.
Right-of-use asset
The right-of-use asset is initially measured at cost. Cost includes the initial amount of the corresponding lease liability adjusted for any lease payments made at or before the commencement date, plus any initial direct costs incurred, less any incentives received.
The right-of-use asset is subsequently measured at cost less accumulated depreciation and any impairment losses, and adjustment for any remeasurement of the lease liability. The depreciation starts from the commencement date of the lease. If the lease transfers ownership of the underlying asset to the Group or the cost of the right-of-use asset reflects that the Group expects to exercise a purchase option, the related right-of-use asset is depreciated over the useful life of the underlying asset. Otherwise, the Group depreciates the right-of-use asset to the earlier of the end of the useful life of the right-of-use asset or the end of the lease term. The estimated useful lives of the right-of-use assets are determined on the same basis as those plant and equipment.
Lease liability
The lease liability is initially measured at the present value of the lease payments that are not paid at the commencement date, discounted by using the rate implicit in the lease. If this rate cannot be readily determined, the Group uses its incremental borrowing rate.
The lease liability is subsequently measured at amortized cost using the effective interest method. It is remeasured when there is a change in the future lease payments (other than lease modification that is not accounted for as a separate lease) with the corresponding adjustment is made to the carrying amount of the right-of-use asset, or is recognized in profit or loss if the carrying amount has been reduced to zero.
PROVISIONS
Provisions are recognized when the Group has a present obligation (legal or constructive) as a result of past events, when it is probable that an outflow of resources embodying economic benefits will be required to settle the obligation, and when a reliable estimate of the amount can be made. Provisions are reviewed at the end of each reporting period and adjusted to reflect the current best estimate. Where the effect of the time value of money is material, the provision is the present value of the estimated expenditure required to settle the obligation. The discount rate shall be a pre-tax rate that reflects current market assessments of the time value of money and the risks specific to the liability. The unwinding of the discount is recognized as interest expense in profit or loss.
Provision for warranties
The Group provides warranties for general repairs of defects. Provisions related to these assurance-type warranties are recognized when the product is sold. Initial recognition is based on historical experience. The estimate of warranty-related costs is revised annually.
SAGTEC GLOBAL LIMITED AND ITS SUBSIDIARIES
NOTES TO UNAUDITED INTERIM CONDENSED CONSOLIDATED FINANCIAL STATEMENTS
| 2 | MATERIAL ACCOUNTING POLICIES (cont.) |
REVENUE RECOGNITION
Revenue is derived principally from services, tangible products, rental and others.
Revenue from services
Revenue from services is recognized over time in the year in which the services rendered.
A receivable is recognized when the services are rendered as this is the point in time that the consideration is unconditional because only the passage of time is required before the payment is due.
| 1. | Subscription services from Speed + Pos software and QR ordering system, which allow our subscribers to gain access to our software. Performance obligation includes to ensure subscribers accessibility, bundled with training, maintenance and support on recurring basis, measured on time elapsed, renewed on monthly basis. |
| 2. | Software consultant and development services cater for customers seeks to customized point of sales system. Performance obligation includes the design and build of software-based systems, integration of hardware and software solutions, running and maintaining of IT infrastructure and procurement services. In all cases, the Company assesses if the multiple obligations should be accounted for as separate performance obligations or combined into a single performance obligation. The Company generally separates multiple obligations in a contract as separate performance obligations if those obligations are distinct, both individually and in the context of the contract. If multiple obligations in a contract are highly interrelated or require significant integration or customization within a group, they are combined and accounted for as a single performance obligation, measured on contract milestone. Contract duration range from two weeks to two months. |
| 3. | Social media management services, involves content creation, engagement, and advertising management. These services are considered as single performance obligation contracted to be delivered over a period of time, measured on time elapsed, renewed on monthly basis. |
| 4. | Data management and analysis services, involves handling and processing data to extract valuable insights that can inform decision-making and improve business operations. These services are considered as single performance obligation, measured on time elapsed contracted to be deliver over a period of time, measured on time elapsed, renewed on monthly basis. |
Revenue from tangible products
Revenue from tangible products is recognized at a point in time when the goods have been delivered to the customer and upon its acceptance, and it is probable that the Group will collect the considerations to which it would be entitled to in exchange for the goods sold.
Revenue from rental of machinery
Revenue from rental is recognized at a point in time, measured through time lapsed results in entitlement to collection of revenue.
SAGTEC GLOBAL LIMITED AND ITS SUBSIDIARIES
NOTES TO UNAUDITED INTERIM CONDENSED CONSOLIDATED FINANCIAL STATEMENTS
| 2 | MATERIAL ACCOUNTING POLICIES (cont.) |
CASH AND CASH EQUIVALENTS
Cash and cash equivalents comprise cash in hand, bank balances, demand deposits, and short-term, highly liquid investments that are readily convertible to known amounts of cash and which are subject to an insignificant risk of changes in value with original maturity periods of three months or less.
Bank overdrafts are presented as current borrowings in the statements of financial position.
SHARE CAPITAL
Class A Ordinary Shares and Class B Ordinary Shares are classified as equity. Incremental costs directly attributable to the issuance of new shares are deducted against the share capital account.
Class A Ordinary Shares carry one vote per share, while Class B Ordinary Shares carry twenty votes per share. Both classes rank equally in respect of dividends and distributions upon liquidation. Class B Ordinary Shares may be converted into Class A Ordinary Shares in accordance with the Company’s Memorandum and Articles of Association.
SHARE BASED PAYMENTS
The Company accounts for equity-settled share-based payment transactions in accordance with IFRS 2 Share-based Payment.
Where equity instruments are granted to employees, the fair value of the equity instruments granted is measured at the grant date and recognised as an employee expense over the vesting period, with a corresponding increase in equity. The amount recognised as an expense is adjusted at each reporting date to reflect the Company’s current estimate of the number of equity instruments expected to vest, except where the vesting condition is a market condition or other non-vesting condition. Market and other non-vesting conditions are taken into account in determining the grant-date fair value of the equity instruments and are not subsequently adjusted.
Where equity instruments are granted in exchange for goods or services received from non-employees, the transactions are measured at the fair value of the goods or services received, unless that fair value cannot be reliably measured, in which case the fair value of the equity instruments granted is used.
Where the goods or services are received immediately, the corresponding expense is recognised in profit or loss. Where the goods or services relate to future periods, the amounts are recognised as prepayments and subsequently expensed or capitalised as the related services are received or assets are recognised.
Equity-settled share-based payments are recognised as an increase in equity.
INCOME TAX
Current tax assets and liabilities are the expected amount of income tax recoverable or payable to the taxation authorities, measured using tax rates and tax laws that have been enacted or substantively enacted at the end of the reporting period and are recognized in profit or loss except to the extent that the tax relates to items recognized outside profit or loss (either in other comprehensive income or directly in equity).
Deferred taxes are recognized using the liability method for temporary differences other than those that arise from the initial recognition of an asset or liability in a transaction which is not a business combination and at the time of the transaction, affects neither accounting profit nor taxable profit.
Deferred tax assets and liabilities are measured at the tax rates that are expected to apply in the period when the asset is realized or the liability is settled, based on the period.
Deferred tax assets are recognized for all deductible temporary differences, unused tax losses and unused tax credits to the extent that it is probable that future taxable profits will be available against which the deductible temporary differences, unused tax losses and unused tax credits can be utilized. The carrying amounts of deferred tax assets are reviewed at the end of each reporting period and reduced to the extent that it is no longer probable that the related tax benefits will be realized.
SAGTEC GLOBAL LIMITED AND ITS SUBSIDIARIES
NOTES TO UNAUDITED INTERIM CONDENSED CONSOLIDATED FINANCIAL STATEMENTS
| 2 | MATERIAL ACCOUNTING POLICIES (cont.) |
INCOME TAX (cont.)
Current and deferred tax items are recognized in correlation to the underlying transactions either in profit or loss, other comprehensive income or directly in equity.
Current tax assets and liabilities or deferred tax assets and liabilities are offset when there is a legally enforceable right to set off current tax assets against current tax liabilities and when the deferred taxes relate to the same taxable entity (or on different tax entities but they intend to settle current tax assets and liabilities on a net basis) and the same taxation authority.
EMPLOYEE BENEFITS
Defined contribution plan
The Company participates in Employees Provident Fund (EPF), Malaysia’s national defined contribution plan, employees are required to contribute a specified percentage of their monthly salary to the EPF, which is deducted from their salaries each month. The company also contributes a specified percentage based on the employees’ monthly salaries, as mandated by the EPF regulations. The Company’s contributions are recognized as an expense in the period when employees render related services, and this expense is recorded in the profit or loss statement under employee benefits expense. A liability is recognized for unpaid contributions at the end of each reporting period, representing amounts due to the EPF but not yet paid. Contributions are measured at the statutory rates applicable during the period. In the financial statements, the total amount of contributions made to the EPF during the reporting period is disclosed in the notes under employee benefits.
Actuarial risk (that benefits will be less than expected) and investment risk (that assets invested will be insufficient to meet expected benefits) fall, in substance, on the employee.
DEFERRED OFFERING COSTS
Deferred offering costs are specific expenses incurred during the process of preparing for an offering of securities, including legal, accounting, underwriting, and other fees directly associated with the offering. These costs are initially recorded as an asset when incurred, provided it is probable that the offering will be successfully completed, and are capitalized as “Deferred Offering Costs” on the statement of financial position. Only direct and incremental costs clearly attributable to the offering are capitalized, while general and administrative expenses not directly related to the offering process are expensed as incurred. Upon successful completion of the offering, deferred offering costs are reclassified from the statement of financial position to the statement of comprehensive income and recognized as a reduction of the proceeds from the offering within equity. If it becomes probable that the offering will not be completed, all deferred offering costs are expensed immediately in the period this determination is made.
FOREIGN CURRENCY TRANSACTIONS
The functional currency used by the Company is Malaysia Ringgit. Consequently, operations in currencies other than the Malaysian Ringgit are considered to be denominated in foreign currency and are recorded at the exchange rates in force on the dates of the operations.
At year-end, monetary assets and liabilities denominated in foreign currency are converted by applying the exchange rate on the statement of financial position date. The profits or losses revealed are charged directly to the profit and loss account for the year in which they occur. Non-monetary items in foreign currency measured in terms of historical cost are converted at the exchange rate on the date of the transaction.
The exchange differences of the monetary items that arise both when liquidating them and when converting them at the closing exchange rate, are recognized in the results of the year, except those that are part of the investment of a business abroad, which are recognized directly in equity net of taxes until the time of its disposal.
SAGTEC GLOBAL LIMITED AND ITS SUBSIDIARIES
NOTES TO UNAUDITED INTERIM CONDENSED CONSOLIDATED FINANCIAL STATEMENTS
| 2 | MATERIAL ACCOUNTING POLICIES (cont.) |
EARNINGS PER SHARE
Basic income per share is calculated by dividing the income attributable to ordinary shareholders by the weighted average number of ordinary shares outstanding in the period. For all periods presented, the income attributable to ordinary shareholders equals the reported income attributable to owners of the Company.
Diluted income per share is calculated by the treasury stock method. Under the treasury stock method, the weighted average number of ordinary shares outstanding for the calculation of diluted income per share assumes that the proceeds to be received on the exercise of dilutive share options and warrants are used to repurchase ordinary shares at the average market price during the period.
The Company has no potentially dilutive securities, such as options or warrants, currently issued and outstanding, as of June 30, 2026 and December 31, 2025.
SEGMENT REPORTING
Operating segments are reported in a manner consistent with the internal reporting provided for decision maker, whose members are responsible for allocating resources and assessing the performance of the operating segments.
BORROWING AND BORROWING COSTS
Borrowings are classified as current liabilities unless the Group has the unconditional right to postpone settlement for at least 12 months after the statement of financial position date, in which case they are classified as non-current liabilities.
Borrowings are initially recorded at fair value, net of any transaction costs. They are then measured at amortized cost. The difference between the initial proceeds (after deducting transaction costs) and the repayment amount is recognized in profit or loss over the term of the borrowings using the effective interest rate method.
Borrowing costs are recognized in profit or loss using the effective interest method except for borrowing costs that are directly attributable to the acquisition, construction or production of a qualifying asset form part of the cost of that asset
| 3 | CRITICAL ACCOUNTING JUDGEMENTS AND KEY SOURCES OF ESTIMATION UNCERTAINTY |
The preparation of these unaudited interim condensed consolidated financial statements in conformity with IFRS require the directors of the Company to make judgements, estimates and assumptions that affect the application of policies and reported amounts of assets, liabilities, income and expenses. The estimates and associated assumptions are based on historical experience and various other factors that are believed to be reasonable under the circumstances, the results of which form the basis of making the judgements about carrying values of assets and liabilities that are not readily apparent from other sources. Actual results may differ from these estimates.
The estimates and underlying assumptions are reviewed on an ongoing basis. Revisions to accounting estimates are recognized in the period in which the estimate is revised if the revision affects only that period, or in the period of the revision and future periods if the revision affects both current and future periods.
The directors have considered the development, selection and disclosure of the Group’s critical accounting judgements and estimates. The key assumptions concerning the future and other key sources of estimation uncertainty at the end of the reporting period, that have a significant risk of causing a material adjustment to the carrying amounts of assets and liabilities within the next financial year are described below:-
Useful lives of plant and equipment
The Group’s management determines the estimated useful lives and the related depreciation charge for the Group’s plant and equipment. This estimate is based on the historical experience of the actual useful lives of plant and equipment of similar nature and functions. Management will increase the depreciation charge where useful lives are less than previously estimated lives, or will write off or write down technically obsolete or non-strategic assets that have been abandoned or sold. Actual economic lives may differ from estimated useful lives. Periodic review could result in a change in depreciable lives and therefore depreciation charge in the future periods.
Impairment of Trade Receivables
The Group uses the simplified approach to estimate a lifetime expected credit loss allowance for all trade receivables. The Group develops the expected loss rates based on the payment profiles of past sales and the corresponding historical credit losses, and adjusts for qualitative and quantitative reasonable and supportable forward-looking information. If the expectation is different from the estimation, such difference will impact the carrying value of trade receivables. The information about the expected credit loss on the Group’s trade receivables is disclosed in Note 7.
SAGTEC GLOBAL LIMITED AND ITS SUBSIDIARIES
NOTES TO UNAUDITED INTERIM CONDENSED CONSOLIDATED FINANCIAL STATEMENTS
| | | Ordinary Shares# | |
| | | Class A Ordinary Shares | | | Class B Ordinary Shares | |
| | | Shares | | | Amount
(RM) | | | Shares | | | Amount
(RM) | |
| Balance as at December 31, 2025 | | | 17,650,000 | | | | 78,266,826 | | | | 2,000,000 | | | | 212,538 | |
| Issuance of ordinary shares | | | 3,100,000 | | | | 13,389,952 | | | | - | | | | - | |
| Balance as at June 30, 2026 | | | 20,750,000 | | | | 91,656,778 | | | | 2,000,000 | | | | 212,538 | |
During the six months ended 30 June 2026, the Company entered into several arrangements involving the issuance of ordinary shares in consideration for consultancy, advertising and marketing services, employee compensation and other transactions.
On 26 March 2026, the Company entered into a consulting agreement with Riviera Springs Holdings for the consultancy services. In consideration for the services to be rendered, the Company issued 200,000 restricted ordinary shares as non-cash consideration. The transaction is accounted for as an equity-settled share-based payment in accordance with IFRS 2 Share-based Payment. The fair value of the equity instruments granted, amounting to RM1,797,705, was recognised as a prepayment within non-current assets, with a corresponding increase in equity, as the services are to be provided over the agreed service period.
The services are expected to be provided over a period of 3 years. As the services are expected to be received on a continuous basis, the prepayment will be recognised in profit or loss on a straight-line basis over the service period as the services are rendered.
On 15 May 2026, the Company entered into a consulting arrangement with So Kui Kuen Peter for the provision of consultancy services. In consideration for the services to be rendered, the Company issued 15,000 restricted ordinary shares as non-cash consideration. The transaction is accounted for as an equity-settled share-based payment in accordance with IFRS 2 Share-based Payment. As the services had been fully rendered at the grant date and no further service obligations exist, the fair value of the equity instruments granted amounting to RM55,356 was recognised immediately in profit or loss, with a corresponding increase in equity. The shares were issued for nil cash consideration as part of a non-cash transaction.
On 15 May 2026, the Company issued 685,000 ordinary shares pursuant to its Employee Share Option Scheme. The shares were granted to eligible participants as part of the Company’s equity-settled share-based compensation arrangement. The fair value of the equity instruments granted, amounting to RM2,527,939, is recognised as an employee expense over the applicable vesting period, with a corresponding increase in equity, in accordance with IFRS 2 Share-based Payment.
On 2 June 2026, the Company entered into a consulting arrangement with Walsh Capital Industries for the provision of consultancy services. In consideration for the services to be rendered, the Company issued 500,000 restricted ordinary shares as non-cash consideration. The transaction is accounted for as an equity-settled share-based payment in accordance with IFRS 2 Share-based Payment. The fair value of the equity instruments granted, amounting to RM1,903,200, was recognised as a prepayment within non-current assets, with a corresponding increase in equity.
The services are expected to be provided over a period of 3 years. The prepayment will be recognised in profit or loss on a straight-line basis over the service period as the services are rendered, as the services are expected to be received on a continuous basis.
On 5 June 2026, the Company entered into an arrangement with FMW Media Works LLC for the provision of advertising and marketing services. In consideration for the services to be rendered, the Company issued 200,000 restricted ordinary shares as non-cash consideration. The transaction is accounted for as an equity-settled share-based payment in accordance with IFRS 2 Share-based Payment. The fair value of the equity instruments granted, amounting to RM763,728, was recognised as a prepayment within non-current assets, with a corresponding increase in equity.
SAGTEC GLOBAL LIMITED AND ITS SUBSIDIARIES
NOTES TO UNAUDITED INTERIM CONDENSED CONSOLIDATED FINANCIAL STATEMENTS
| 4 | ISSUANCE OF SHARES (cont.) |
The advertising and marketing services are expected to be provided over a period of 2 years. The prepayment will be recognised in profit or loss as the related services are rendered.
On 17 June 2026, the Company issued 1,500,000 ordinary shares to Ng Chen Lok for cash consideration of RM6,342,024. The transaction was accounted for as an equity transaction, with the consideration recognised in equity.
Differences Between Class A and Class B Ordinary Shares
The rights attached to Class A and Class B ordinary shares are set out in the Company’s Memorandum and Articles of Association (MAA).
The principal difference between the two classes is voting rights, as summarised below:
| ○ | Class A ordinary shares: Each Class A Share confers one vote at any meeting of shareholders or on any shareholders’ resolution. |
| ○ | Class B ordinary shares: Each Class B Share confers twenty votes at any meeting of shareholders or on any shareholders’ resolution. |
| ○ | Both Class A and Class B Shares carry an equal entitlement to any distribution declared by the Company in accordance with the Act and the MAA. |
| ○ | Class A and Class B Shares rank pari passu, each conferring an equal share in the distribution of any surplus assets of the Company upon liquidation. |
| ○ | In accordance with clause 6.4 of the MAA, each Class B Share may be voluntarily converted into a Class A Share at the option of the holder, subject to the terms set out in the MAA. |
| | | As of
January 1,
2025 | | | Addition | | | Disposal | | | As of
December 31,
2025 | | | Addition | | | As of
June 30, 2026 | | | As of
June 30, 2026 | |
| | | RM | | | RM | | | RM | | | RM | | | RM | | | RM | | | Convenience
Translation
USD | |
| Plant and equipment, at cost | | | | | | | | | | | | | | | | | | | | | |
| Equipment & Machine | | | 17,363,293 | | | | 22,096,293 | | | | (1,558,323 | ) | | | 37,901,263 | | | | 3,944,574 | | | | 41,846,837 | | | | 10,246,788 | |
| Computer & Handphone | | | 114,419 | | | | - | | | | - | | | | 114,419 | | | | - | | | | 114,419 | | | | 28,018 | |
| License | | | 775,901 | | | | 7,031,639 | | | | - | | | | 7,807,540 | | | | - | | | | 7,807,540 | | | | 1,911,832 | |
| Renovation | | | 43,892 | | | | 113,387 | | | | - | | | | 157,279 | | | | - | | | | 157,279 | | | | 38,513 | |
| Total cost | | | 18,297,505 | | | | 29,241,319 | | | | (1,558,323 | ) | | | 45,980,501 | | | | 3,944,574 | | | | 49,925,075 | | | | 12,225,151 | |
SAGTEC GLOBAL LIMITED AND ITS SUBSIDIARIES
NOTES TO UNAUDITED INTERIM CONDENSED CONSOLIDATED FINANCIAL STATEMENTS
| 5 | PLANT AND EQUIPMENT (cont.) |
| | | As of
January 1,
2025 | | | Depreciation
for the year | | | Disposal | | | As of
December 31,
2025 | | | Depreciation for the
period | | | As of
June 30,
2026 | | | As of
June 30,
2026 | |
| | | RM | | | RM | | | RM | | | RM | | | RM | | | RM | | | Convenience
Translation
USD | |
| Plant and equipment, at cost | | | | | | | | | | | | | | | | | | | | | |
| Equipment & Machine | | | 3,807,496 | | | | 2,869,717 | | | | (725,611 | ) | | | 5,951,602 | | | | 1,960,282 | | | | 7,911,884 | | | | 1,937,383 | |
| Computer & Handphone | | | 78,999 | | | | 19,497 | | | | - | | | | 98,496 | | | | 5,110 | | | | 103,606 | | | | 25,370 | |
| License | | | 142,426 | | | | 663,560 | | | | - | | | | 805,986 | | | | 390,377 | | | | 1,196,363 | | | | 292,953 | |
| Renovation | | | 14,766 | | | | 23,075 | | | | - | | | | 37,841 | | | | 19,660 | | | | 57,501 | | | | 14,080 | |
| Total cost | | | 4,043,687 | | | | 3,575,849 | | | | (725,611 | ) | | | 6,893,925 | | | | 2,375,429 | | | | 9,269,354 | | | | 2,269,786 | |
| | | As of
December 31,
2025 | | | As of
June 30,
2026 | | | As of
June 30,
2026 | |
| | | RM | | | RM | | | Convenience
Translation
USD | |
| Carrying Amount | | | | | | | | | |
| Equipment & Machine | | | 31,949,661 | | | | 33,933,953 | | | | 8,309,405 | |
| Computer & Handphone | | | 15,923 | | | | 10,813 | | | | 2,648 | |
| License | | | 7,001,554 | | | | 6,611,177 | | | | 1,618,879 | |
| Renovation | | | 119,438 | | | | 99,778 | | | | 24,433 | |
| Total carrying amount | | | 39,086,576 | | | | 40,655,721 | | | | 9,955,365 | |
| | | As of | |
| | | December 31,
2025 | | | June 30,
2026 | | | June 30,
2026 | |
| | | RM | | | RM | | | Convenience
Translation USD | |
| Right-Of-Use Assets, cost | | | | | | | | | |
| As at beginning of the year/period | | | 307,323 | | | | 1,688,860 | | | | 413,551 | |
| Add: New right-of-use asset recognized | | | 1,487,466 | | | | - | | | | - | |
| Less: Termination | | | (105,860 | ) | | | - | | | | - | |
| Less: Modification | | | (69 | ) | | | 1,014 | | | | 248 | |
| As at end of the year/period | | | 1,688,860 | | | | 1,689,874 | | | | 413,799 | |
| | | | | | | | | | | | | |
| Right-Of-Use Assets, accumulated amortization | | | | | | | | | | | | |
| As at beginning of the year/period | | | 137,297 | | | | 278,632 | | | | 68,229 | |
| Amortization of the year/period | | | 214,646 | | | | 177,083 | | | | 43,362 | |
| Less: Termination | | | (73,311 | ) | | | - | | | | - | |
| As at end of the year/period | | | 278,632 | | | | 455,715 | | | | 111,591 | |
| | | | | | | | | | | | | |
| Right-Of-Use Assets, carrying amount | | | | | | | | | | | | |
| As at beginning of the year/period | | | 170,026 | | | | 1,410,228 | | | | 345,322 | |
| As at end of the year/period | | | 1,410,228 | | | | 1,234,159 | | | | 302,208 | |
SAGTEC GLOBAL LIMITED AND ITS SUBSIDIARIES
NOTES TO UNAUDITED INTERIM CONDENSED CONSOLIDATED FINANCIAL STATEMENTS
| 6 | RIGHT OF USE ASSETS (cont.) |
| | | As of | |
| | | December 31,
2025 | | | June 30,
2026 | | | June 30,
2026 | |
| | | RM | | | RM | | | Convenience
Translation
USD | |
| Lease Liability | | | | | | | | | |
| As at beginning of the year/period | | | 162,577 | | | | 1,360,238 | | | | 333,082 | |
| Add: New lease recognized | | | 1,355,647 | | | | - | | | | - | |
| Add: Imputed interest | | | 40,750 | | | | 31,444 | | | | 7,700 | |
| Less: Modification | | | (69 | ) | | | 1,014 | | | | 248 | |
| Less: Principal repayment | | | (161,328 | ) | | | (191,308 | ) | | | (46,846 | ) |
| Termination | | | (37,339 | ) | | | - | | | | - | |
| As at end of the year/period | | | 1,360,238 | | | | 1,201,388 | | | | 294,184 | |
| | | | | | | | | | | | | |
| Lease liability current portion | | | 323,500 | | | | 330,501 | | | | 80,930 | |
| Lease liability non-current portion | | | 1,036,738 | | | | 870,887 | | | | 213,254 | |
| | | | 1,360,238 | | | | 1,201,388 | | | | 294,184 | |
| | | | | | | | | | | | | |
| Maturities of Lease | | | | | | | | | | | | |
| Year ending December 31, 2026 | | | 323,500 | | | | - | | | | - | |
| Year ending December 31, 2027 | | | 321,983 | | | | - | | | | - | |
| Year ending December 31, 2028 | | | 336,260 | | | | - | | | | - | |
| Year ending December 31, 2029 | | | 236,467 | | | | - | | | | - | |
| Year ending December 31, 2030 | | | 55,810 | | | | - | | | | - | |
| After December 31, 2030 | | | 86,218 | | | | - | | | | - | |
| | | | 1,360,238 | | | | - | | | | - | |
| | | | | | | | | | | | | |
| Maturities of Lease | | | | | | | | | | | | |
| Period ending June 30, 2027 | | | - | | | | 330,501 | | | | 80,930 | |
| Period ending June 30, 2028 | | | - | | | | 316,163 | | | | 77,419 | |
| Period ending June 30, 2029 | | | - | | | | 385,859 | | | | 94,485 | |
| Period ending June 30, 2030 | | | - | | | | 54,382 | | | | 13,317 | |
| Period ending June 30, 2031 | | | - | | | | 54,981 | | | | 13,463 | |
| After June 30, 2031 | | | - | | | | 59,502 | | | | 14,570 | |
| | | | - | | | | 1,201,388 | | | | 294,184 | |
SAGTEC GLOBAL LIMITED AND ITS SUBSIDIARIES
NOTES TO UNAUDITED INTERIM CONDENSED CONSOLIDATED FINANCIAL STATEMENTS
| 7 | TRADE RECEIVABLES AND TRADE PAYABLES |
| | | As of | |
| | | December 31,
2025 | | | June 30,
2026 | | | June 30,
2026 | |
| | | RM | | | RM | | | Convenience
Translation
USD | |
| Trade receivables, gross | | | | | | | | | |
| Third parties | | | 11,204,601 | | | | 24,299,451 | | | | 5,950,206 | |
| Less: Provision for expected credit losses | | | (1,229,403 | ) | | | (3,465,291 | ) | | | (848,546 | ) |
| Trade receivables, net | | | 9,975,198 | | | | 20,834,160 | | | | 5,101,660 | |
Provision for expected credit losses movement schedule
| | | As of | |
| | | December 31,
2025 | | | June 30,
2026 | | | June 30,
2026 | |
| | | RM | | | RM | | | Convenience
Translation
USD | |
| As at beginning of the year/period | | | - | | | | 1,229,403 | | | | 301,044 | |
| Add: Charge for the year/period | | | 1,229,403 | | | | 3,465,291 | | | | 848,546 | |
| Less: Reversal during the year/period | | | - | | | | (1,229,403 | ) | | | (301,044 | ) |
| As at end of the year/period | | | 1,229,403 | | | | 3,465,291 | | | | 848,546 | |
Trade receivables are non-interest bearing, generally on 30 to 90 days credit term. They are recognized at their original invoice amounts which represent their fair values on initial recognition.
| | | As of | |
| | | December 31,
2025 | | | June 30,
2026 | | | June 30,
2026 | |
| | | RM | | | RM | | | Convenience
Translation
USD | |
| Trade payables, gross | | | | | | | | | |
| Third parties | | | 335,070 | | | | 6,411,187 | | | | 1,569,906 | |
| Trade payables, net | | | 335,070 | | | | 6,411,187 | | | | 1,569,906 | |
Trade payables are non-interest bearing, generally on 30 to 90 days credit term. They are recognized at their original invoice amounts which represent their fair values on initial recognition.
SAGTEC GLOBAL LIMITED AND ITS SUBSIDIARIES
NOTES TO UNAUDITED INTERIM CONDENSED CONSOLIDATED FINANCIAL STATEMENTS
| 8 | OTHER RECEIVABLES AND OTHER PAYABLES |
| | | As of | |
| | | December 31,
2025 | | | June 30,
2026 | | | June 30,
2026 | |
| | | RM | | | RM | | | Convenience
Translation
USD | |
| Prepayments, deposits & other receivables | | | | | | | | | |
| Rental deposit | | | 101,680 | | | | 101,880 | | | | 24,947 | |
| Utility deposit | | | 15,060 | | | | 15,060 | | | | 3,688 | |
| Other deposits | | | 25,990 | | | | 27,990 | | | | 6,854 | |
| Other receivables | | | - | | | | 536,965 | | | | 131,487 | |
| Deferred offering costs | | | 366,228 | | | | - | | | | - | |
| | | | 508,958 | | | | 681,895 | | | | 166,976 | |
| | | As of | |
| | | December 31,
2025 | | | June 30,
2026 | | | June 30,
2026 | |
| | | RM | | | RM | | | Convenience
Translation
USD | |
| Accrued liabilities & other payables | | | | | | | | | |
| Employee benefits payable | | | 592,860 | | | | 729,469 | | | | 178,625 | |
| Lease payable | | | 1,514 | | | | 65,821 | | | | 16,118 | |
| Accrued operating expenses | | | 1,038,668 | | | | 1,159,322 | | | | 283,883 | |
| Utilities payable | | | 116,311 | | | | 1,142 | | | | 279 | |
| | | | 1,749,353 | | | | 1,955,754 | | | | 478,905 | |
| | | As of | |
| | | December 31,
2025 | | | June 30,
2026 | | | June 30,
2026 | |
| | | RM | | | RM | | | Convenience
Translation
USD | |
| Non-current prepayments | | | | | | | | | |
| Consultant services | | | 9,459,196 | | | | 10,412,627 | | | | 2,549,740 | |
| Licensing | | | 8,262,047 | | | | 8,262,047 | | | | 2,023,127 | |
| Server infrastructure | | | 28,483,410 | | | | 28,483,410 | | | | 6,974,732 | |
| Project management services | | | 4,853,954 | | | | 4,234,301 | | | | 1,036,853 | |
| Advertisement services | | | - | | | | 350,042 | | | | 85,715 | |
| | | | 51,058,607 | | | | 51,742,427 | | | | 12,670,167 | |
SAGTEC GLOBAL LIMITED AND ITS SUBSIDIARIES
NOTES TO UNAUDITED INTERIM CONDENSED CONSOLIDATED FINANCIAL STATEMENTS
| | | As of | |
| | | December 31,
2025 | | | June 30,
2026 | | | June 30,
2026 | |
| | | RM | | | RM | | | Convenience
Translation
USD | |
| Current prepayments | | | | | | | | | |
| Consultant services | | | 2,522,452 | | | | 3,756,088 | | | | 919,753 | |
| Project management services | | | 1,239,306 | | | | 1,239,306 | | | | 303,469 | |
| Advertisement services | | | - | | | | 381,863 | | | | 93,507 | |
| | | | 3,761,758 | | | | 5,377,257 | | | | 1,316,729 | |
For the period ended June 30, 2026, the above prepayments include amounts arising from equity-settled share-based payment arrangements, whereby the Company issued ordinary shares as consideration for future services and assets in accordance with IFRS 2 Share-based Payment. The prepayments are classified as current or non-current based on the expected timing of receipt of the underlying services and delivery of assets.
The prepayments relating to Tan Yee How and Kinetic Seas Incorporated arose from ordinary shares issued by the Company during the year ended December 31, 2025. As at June 30, 2026, RM10,720,422 relates to the 1,400,000 ordinary shares issued to Tan Yee How and RM42,219,064 relates to the 5,500,000 ordinary shares issued to Kinetic Seas Incorporated.
During the period ended June 30, 2026, the Company issued additional ordinary shares as consideration for future consultancy, advertising and marketing services. Accordingly, RM1,597,960 relates to the issuance of 200,000 ordinary shares to Riviera Springs Holdings, RM1,850,333 relates to the issuance of 500,000 ordinary shares to Walsh Capital Industries Corp and RM731,906 relates to the issuance of 200,000 ordinary shares to FMW Media Works LLC, as disclosed in Note 4 – Issuance of Shares.
The current portion primarily relates to consultant services, advertising services and project management services expected to be rendered within twelve months from the reporting date, amounting to RM2,522,452 (Tan Yee How), RM1,239,306 (Kinetic Seas Incorporated), RM599,236 (Riviera Springs Holdings), RM634,400 (Walsh Capital Industries Corp) and RM381,863 (FMW Media Works LLC).
The non-current portion comprises (i) licensing rights and server infrastructure of RM36,745,457, which have not yet been delivered as at the reporting date and will be reclassified to intangible assets and property, plant and equipment, respectively, upon delivery, and (ii) the remaining portion of consultant services, advertising services and project management services to be rendered after twelve months.
SAGTEC GLOBAL LIMITED AND ITS SUBSIDIARIES
NOTES TO UNAUDITED INTERIM CONDENSED CONSOLIDATED FINANCIAL STATEMENTS
| 10 | CASH AND SHORT-TERM DEPOSITS |
| | | As of | |
| | | December 31,
2025 | | | June 30,
2026 | | | June 30,
2026 | |
| | | RM | | | RM | | | Convenience
Translation
USD | |
| Cash | | | 9,161,045 | | | | 12,308,382 | | | | 3,013,953 | |
| Pledged Deposits | | | 1,700,892 | | | | 1,708,868 | | | | 418,450 | |
| Total | | | 10,861,937 | | | | 14,017,250 | | | | 3,432,403 | |
Pledged deposits are fixed deposit pledged to banks with maturity less than one year to secure overdraft facilities.
For the purpose of presenting the consolidated statement of cash flows, cash and cash equivalents comprise the following at the end of the financial year
| | | As of | |
| | | December 31,
2025 | | | June 30,
2026 | | | June 30,
2026 | |
| | | RM | | | RM | | | Convenience
Translation
USD | |
| Cash and short-term deposits | | | 10,861,937 | | | | 14,017,250 | | | | 3,432,403 | |
| Pledged Deposits | | | (1,700,892 | ) | | | (1,708,868 | ) | | | (418,450 | ) |
| Total | | | 9,161,045 | | | | 12,308,382 | | | | 3,013,953 | |
| 11 | RELATED PARTIES DISCLOSURES |
| a. | Related party transactions |
| | | For the six months ended June 30, | |
| | | 2025 | | | 2026 | | | 2026 | |
| | | RM | | | RM | | | Convenience
Translation
USD | |
| Payments made on behalf by director | | | 9,858 | | | | 271,361 | | | | 66,477 | |
| Selling and administrative expenses charged from related parties | | | - | | | | 10,368 | | | | 2,538 | |
Related parties comprise mainly shareholders or companies controlled by director or shareholders.
SAGTEC GLOBAL LIMITED AND ITS SUBSIDIARIES
NOTES TO UNAUDITED INTERIM CONDENSED CONSOLIDATED FINANCIAL STATEMENTS
| 11 | RELATED PARTIES DISCLOSURES (cont.) |
| b. | Remuneration of key management personnel |
| | | For the six months ended June 30, | |
| | | 2025 | | | 2026 | | | 2026 | |
| | | RM | | | RM | | | Convenience
Translation
USD | |
| Ng Chen Lok, Chairman, CEO & Director | | | | | | | | | | | | |
| - Director fee | | | 540,435 | | | | 1,665,927 | | | | 407,936 | |
| Robert Michael Harrison Jr, Independent Director | | | | | | | | | | | | |
| - Director fee | | | 25,829 | | | | 11,750 | | | | 2,877 | |
| Lai Fuu Sing, Independent Director | | | | | | | | | | | | |
| - Director fee | | | 13,125 | | | | - | | | | - | |
| Pan Seng Wee, Independent Director | | | | | | | | | | | | |
| - Director fee | | | 13,125 | | | | - | | | | - | |
| Ng Aik Soon, Independent Director | | | | | | | | | | | | |
| - Director fee | | | - | | | | 24,106 | | | | 5,903 | |
| Chen Xiang Foong, Independent Director | | | | | | | | | | | | |
| - Director fee | | | - | | | | 35,857 | | | | 8,780 | |
| Elain Binti Lockman, Independent Director | | | | | | | | | | | | |
| - Director fee | | | 12,704 | | | | 35,857 | | | | 8,780 | |
| Zuria Hajar Bt Mohd Adnan, CFO & Director | | | | | | | | | | | | |
| - Salary | | | 67,000 | | | | 153,756 | | | | 37,650 | |
| - Employer Contribution to Defined Contribution Plan | | | 8,040 | | | | 11,808 | | | | 2,891 | |
| - Employer Contribution to Insurance Scheme | | | 696 | | | | 696 | | | | 171 | |
| Loong Xin Yee, COO | | | 60,000 | | | | 60,000 | | | | 14,692 | |
| Tan Kim Chuan, CTO | | | | | | | | | | | | |
| - Salary | | | 98,900 | | | | 260,521 | | | | 63,794 | |
| - Employer Contribution to Defined Contribution Plan | | | 4,416 | | | | 4,320 | | | | 1,058 | |
| - Employer Contribution to Insurance Scheme | | | 618 | | | | 579 | | | | 142 | |
| | | As of | |
| | | December 31,
2025 | | | June 30,
2026 | | | June 30,
2026 | |
| | | RM | | | RM | | | Convenience
Translation
USD | |
| As at beginning of the year/period | | | 441,353 | | | | 25,296 | | | | 6,194 | |
| Add: Provision for reinstatement cost during the year/period | | | 25,296 | | | | - | | | | - | |
| Less: Unclaimed warranty during the year/period | | | (441,353 | ) | | | - | | | | - | |
| As at end of the year/period | | | 25,296 | | | | 25,296 | | | | 6,194 | |
The Group provides a one-year warranty on all food kiosk ordering machines and power bank charging stations sold, covering defects in materials and workmanship. The warranty provision is assessed at each reporting date based on historical claims experience, product defect trends, customer complaints and service reports, supplier warranty coverage arrangements, and post-year-end events up to the date of approval of the financial statements.
SAGTEC GLOBAL LIMITED AND ITS SUBSIDIARIES
NOTES TO UNAUDITED INTERIM CONDENSED CONSOLIDATED FINANCIAL STATEMENTS
For the financial year ended 31 December 2025, no warranty provision has been recognized as management assessed that no present obligation exists and the expected warranty claims are not probable or can be recovered from suppliers. Accordingly, the estimated outflow of economic resources is not material.
During the financial year ended 31 December 2025, the Group entered into a new lease arrangement which includes reinstatement obligations. Accordingly, a provision for reinstatement costs has been recognized, with a corresponding adjustment to the right-of-use asset.
| 13 | BANK BORROWINGS AND BANK OVERDRAFT |
| | | As of | |
| | | December 31,
2025 | | | June 30,
2026 | | | June 30,
2026 | |
| | | RM | | | RM | | | Convenience
Translation
USD | |
| Current | | | | | | | | | |
| Bank borrowings | | | 1,173,088 | | | | 1,227,285 | | | | 300,525 | |
| | | | 1,173,088 | | | | 1,227,285 | | | | 300,525 | |
| Non-current | | | | | | | | | | | | |
| Bank borrowings | | | 3,859,445 | | | | 3,239,408 | | | | 793,235 | |
| | | | 5,032,533 | | | | 4,466,693 | | | | 1,093,760 | |
Bank borrowing
| Maturities of Bank Borrowing | | | | | | | | | |
| Year ending December 31, 2026 | | | 1,173,088 | | | | - | | | | - | |
| Year ending December 31, 2027 | | | 1,252,768 | | | | - | | | | - | |
| Year ending December 31, 2028 | | | 996,901 | | | | - | | | | - | |
| Year ending December 31, 2029 | | | 716,991 | | | | - | | | | - | |
| Year ending December 31, 2030 | | | 768,277 | | | | - | | | | - | |
| After December 31, 2030 | | | 124,508 | | | | - | | | | - | |
| | | | 5,032,533 | | | | - | | | | - | |
| Maturities of Bank Borrowing | | | | | | | | | |
| Period ending June 30, 2027 | | | - | | | | 1,227,285 | | | | 300,525 | |
| Period ending June 30, 2028 | | | - | | | | 1,201,004 | | | | 294,090 | |
| Period ending June 30, 2029 | | | - | | | | 785,891 | | | | 192,441 | |
| Period ending June 30, 2030 | | | - | | | | 737,527 | | | | 180,598 | |
| Period ending June 30, 2031 | | | - | | | | 509,570 | | | | 124,779 | |
| After June 30, 2031 | | | - | | | | 5,416 | | | | 1,327 | |
| | | | - | | | | 4,466,693 | | | | 1,093,760 | |
SAGTEC GLOBAL LIMITED AND ITS SUBSIDIARIES
NOTES TO UNAUDITED INTERIM CONDENSED CONSOLIDATED FINANCIAL STATEMENTS
| 13 | BANK BORROWINGS AND BANK OVERDRAFT (cont.) |
| | | As of | |
| | | December 31,
2025 | | | June 30,
2026 | | | June 30,
2026 | |
| | | RM | | | RM | | | Convenience
Translation
USD | |
| Fair value of non-current borrowing | | | 3,323,249 | | | | 2,811,259 | | | | 688,393 | |
| Undrawn borrowing facility | | | 2,250,000 | | | | 2,250,000 | | | | 550,957 | |
| Weighted average interest rate | | | 4.60 | % | | | 7.90 | % | | | 7.90 | % |
All borrowings by the company are personally guaranteed by the director. In the event the company is unable to meet its loan obligations, the director will be held accountable and responsible for repaying the loans.
Reconciliation of liabilities arising from financing activities
| | | As of | |
| | | December 31,
2025 | | | June 30,
2026 | | | June 30,
2026 | |
| | | RM | | | RM | | | Convenience
Translation
USD | |
| Bank borrowing | | | | | | | | | | | | |
| As at beginning of the year/period | | | 3,262,715 | | | | 5,032,533 | | | | 1,232,317 | |
| Proceeds from borrowing | | | 2,500,000 | | | | - | | | | - | |
| Scheduled repayment | | | (976,305 | ) | | | (738,921 | ) | | | (180,939 | ) |
| Non-cash changes | | | | | | | | | | | | |
| Finance cost | | | 246,123 | | | | 173,080 | | | | 42,382 | |
| As at end of the year/period | | | 5,032,533 | | | | 4,466,693 | | | | 1,093,760 | |
| | | | | | | | | | | | | |
| Lease liability | | | | | | | | | | | | |
| As at beginning of the year/period | | | 162,577 | | | | 1,360,238 | | | | 333,082 | |
| Scheduled repayment | | | (161,328 | ) | | | (191,308 | ) | | | (46,846 | ) |
| Non-cash changes | | | | | | | | | | | | |
| Addition during the year | | | 1,355,647 | | | | - | | | | - | |
| Modification | | | (69 | ) | | | 1,014 | | | | 248 | |
| Imputed interest | | | 40,750 | | | | 31,444 | | | | 7,700 | |
| Termination | | | (37,339 | ) | | | - | | | | - | |
| As at end of the year/period | | | 1,360,238 | | | | 1,201,388 | | | | 294,184 | |
SAGTEC GLOBAL LIMITED AND ITS SUBSIDIARIES
NOTES TO UNAUDITED INTERIM CONDENSED CONSOLIDATED FINANCIAL STATEMENTS
| 14 | AMOUNT DUE FROM DIRECTOR |
| | | As of | |
| | | December 31,
2025 | | | June 30,
2026 | | | June 30,
2026 | |
| | | RM | | | RM | | | Convenience
Translation
USD | |
| Amount due from director | | | | | | | | | |
| As at beginning of the year/period | | | - | | | | - | | | | - | |
| Advances | | | - | | | | (207,368 | ) | | | (50,777 | ) |
| Share subscription receivable | | | - | | | | 6,342,024 | | | | 1,552,970 | |
| As at end of the year/period | | | - | | | | 6,134,656 | | | | 1,502,193 | |
The share subscription receivable represents consideration receivable from a director pursuant to the subscription of the Company’s Class A ordinary shares. The amount is unsecured, non-interest bearing and repayable on demand.
| | | As of | |
| | | June 30,
2025 | | | December 31,
2025 | | | June 30,
2026 | | | June 30,
2026 | |
| | | RM | | | RM | | | RM | | | Convenience
Translation
USD | |
| Tax payable | | | | | | | | | | | | |
| As at beginning of the year/period | | | 3,918,926 | | | | 3,918,926 | | | | 5,143,639 | | | | 1,259,522 | |
| Tax expenses | | | 980,180 | | | | 2,268,365 | | | | 1,216,850 | | | | 297,971 | |
| Tax payment | | | (1,013,294 | ) | | | (1,043,652 | ) | | | (1,242,552 | ) | | | (304,264 | ) |
| As at end of the year/period | | | 3,885,812 | | | | 5,143,639 | | | | 5,117,937 | | | | 1,253,229 | |
| | | | | | | | | | | | | | | | | |
Deferred tax liabilities | | | | | | | | | | | | | | | | |
| Accelerated tax depreciation | | | | | | | | | | | | | | | | |
| As at beginning of the year/period | | | 907,405 | | | | 907,405 | | | | 1,005,135 | | | | 246,127 | |
| Tax expenses | | | 1,482 | | | | 97,730 | | | | 154,685 | | | | 37,878 | |
| As at end of the year/period | | | 908,887 | | | | 1,005,135 | | | | 1,159,820 | | | | 284,005 | |
| | | | | | | | | | | | | | | | | |
| Income tax expenses | | | | | | | | | | | | | | | | |
| - Current year/period | | | 980,180 | | | | 2,268,365 | | | | 1,216,850 | | | | 297,971 | |
| - Origination of temporary differences | | | 1,482 | | | | 97,730 | | | | 154,685 | | | | 37,878 | |
| Total income tax expenses | | | 981,662 | | | | 2,366,095 | | | | 1,371,535 | | | | 335,849 | |
SAGTEC GLOBAL LIMITED AND ITS SUBSIDIARIES
NOTES TO UNAUDITED INTERIM CONDENSED CONSOLIDATED FINANCIAL STATEMENTS
A reconciliation between tax expense and the product of accounting profit multiplied by applicable corporate tax rate for the financial years ended June 30, 2025, December 31, 2025 and June 30, 2026 were as follows:
| | | As of | |
| | | June 30,
2025 | | | December 31,
2025 | | | June 30,
2026 | | | June 30,
2026 | |
| | |
RM | | | RM | | | RM | | | Convenience
Translation
USD | |
| Tax reconciliation | | | | | | | | | | | | |
| Profit before tax | | | 6,463,686 | | | | 9,660,308 | | | | 6,309,035 | | | | 1,544,894 | |
| Tax calculated at tax rate of 24% | | | 1,551,284 | | | | 2,318,473 | | | | 1,514,169 | | | | 370,774 | |
| Effects of: | | | | | | | | | | | | | | | | |
| - Lower domestic tax rate applicable to respective profits** | | | (45,000 | ) | | | (46,260 | ) | | | (45,000 | ) | | | (11,019 | ) |
| - Different tax rates in jurisdiction* | | | (728,453 | ) | | | 63,713 | | | | (422,940 | ) | | | (103,565 | ) |
| - Non-allowable expenditure | | | 449,996 | | | | 625,162 | | | | 667,397 | | | | 163,426 | |
| - Income not subject to tax | | | (1,260 | ) | | | (105,925 | ) | | | - | | | | - | |
| - Utilization of capital allowance | | | (244,905 | ) | | | (489,068 | ) | | | (342,091 | ) | | | (83,767 | ) |
| Tax expenses | | | 981,662 | | | | 2,366,095 | | | | 1,371,535 | | | | 335,849 | |
| * | The Company’s is formed in British Virgin Islands and is not subject to tax on its income or capital gains. In addition, upon payments of dividends by the Company to its shareholders, no British Virgin Islands withholding tax is imposed. |
| ** | The Company’s subsidiaries formed in Malaysia and is subject to the corporate tax on taxable income derived from its activities conducted in Malaysia. Malaysia companies with a paid-up capital of not more than RM2.5 million and a gross business income of not more than RM50 million are taxed at different rates based on their taxable profit. The first RM150,000 is taxed at 15%, the next RM450,000 (up to RM600,000) at 17%, and any amount exceeding RM600,000 is taxed at 24%. Companies that do not fall into this category are taxed at a standard rate of 24%. |
| | | As of | |
| | | December 31,
2025 | | | June 30,
2026 | | | June 30,
2026 | |
| | | RM | | | RM | | | Convenience
Translation
USD | |
| Bargain purchase accounted as merger reserve in equity from acquisition of CL Technologies (International) Sdn Bhd | | | 2,263,143 | | | | 2,263,143 | | | | 554,176 | |
| Bargain purchase accounted as merger reserve in equity from acquisition of Sagtec Group Sdn Bhd | | | 1,017,245 | | | | 1,017,245 | | | | 249,093 | |
| | | | 3,280,388 | | | | 3,280,388 | | | | 803,269 | |
SAGTEC GLOBAL LIMITED AND ITS SUBSIDIARIES
NOTES TO UNAUDITED INTERIM CONDENSED CONSOLIDATED FINANCIAL STATEMENTS
| | | For the six months ended June 30, | |
| | | 2025 | | | 2026 | | | 2026 | |
| | | RM | | | RM | | | Convenience
Translation
USD | |
| Revenue from services | | | 29,121,218 | | | | 30,778,630 | | | | 7,536,762 | |
| Revenue from tangible products | | | 18,746,215 | | | | 16,466,010 | | | | 4,032,031 | |
| Revenue from rental | | | - | | | | 1,299,600 | | | | 318,233 | |
| Revenue from non-related parties | | | 47,867,433 | | | | 48,544,240 | | | | 11,887,026 | |
| | | | | | | | | | | | | |
| Total revenue | | | 47,867,433 | | | | 48,544,240 | | | | 11,887,026 | |
| | | | | | | | | | | | | |
| Revenue from services | | | | | | | | | | | | |
| Performance obligation satisfied over time | | | | | | | | | | | | |
| Subscription services | | | 13,465,340 | | | | 13,503,358 | | | | 3,306,566 | |
| Software consultation and development services | | | 6,161,113 | | | | 5,919,573 | | | | 1,449,526 | |
| Social media management services | | | 3,501,177 | | | | 5,317,304 | | | | 1,302,048 | |
| Data management & analysis services | | | 5,993,588 | | | | 6,038,395 | | | | 1,478,622 | |
| | | | 29,121,218 | | | | 30,778,630 | | | | 7,536,762 | |
| | | | | | | | | | | | | |
| Revenue from tangible products | | | | | | | | | | | | |
| Performance obligation satisfied at point in time | | | | | | | | | | | | |
| Food ordering kiosk with screen | | | 10,575,550 | | | | 8,616,350 | | | | 2,109,885 | |
| Power bank charging station | | | 8,170,665 | | | | 7,849,660 | | | | 1,922,146 | |
| | | | 18,746,215 | | | | 16,466,010 | | | | 4,032,031 | |
| | | | | | | | | | | | | |
| Revenue from rental | | | | | | | | | | | | |
| Performance obligation satisfied at point in time | | | | | | | | | | | | |
| Coffee Machine Kiosk Rental | | | - | | | | 1,299,600 | | | | 318,233 | |
| | | | | | | | | | | | | |
| Total revenue | | | 47,867,433 | | | | 48,544,240 | | | | 11,887,026 | |
| | | For the six months ended June 30, | |
| | | 2025 | | | 2026 | | | 2026 | |
| | | RM | | | RM | | | Convenience
Translation
USD | |
| Purchases | | | 11,684,616 | | | | 10,877,470 | | | | 2,663,568 | |
| Marketing | | | 2,492,536 | | | | 362,482 | | | | 88,761 | |
| Depreciation of plant and equipment | | | 1,385,801 | | | | 2,321,680 | | | | 568,510 | |
| Software development | | | 618,000 | | | | 2,205,200 | | | | 539,987 | |
| Server maintenance | | | 20,607,243 | | | | 16,635,889 | | | | 4,073,629 | |
| Employee benefit expenses | | | 1,435,890 | | | | 2,067,926 | | | | 506,372 | |
| Total | | | 38,224,086 | | | | 34,470,647 | | | | 8,440,826 | |
SAGTEC GLOBAL LIMITED AND ITS SUBSIDIARIES
NOTES TO UNAUDITED INTERIM CONDENSED CONSOLIDATED FINANCIAL STATEMENTS
Cost of sales from services consists of purchases and maintenance of power servers, purchases of API software, marketing and advertising expenses incurred on behalf of customers, server maintenance, source code, software development, and depreciation.
Cost of sales from tangible products consists of purchases of food ordering kiosks, and power bank charging machines.
Cost of sales from rental consists of depreciation.
Total depreciation included in cost of sales amounted to RM1,385,801 and RM2,321,680 for the period ended June 30, 2025 and 2026, respectively.
| | | For the six months ended June 30, | |
| | | 2025 | | | 2026 | | | 2026 | |
| | | RM | | | RM | | | Convenience
Translation
USD | |
| Employee benefit expenses | | | | | | | | | | | | |
| - Director emoluments | | | 617,923 | | | | 1,828,853 | | | | 447,831 | |
| - Staff costs | | | 1,341,855 | | | | 2,411,844 | | | | 590,588 | |
| - Employer Contribution to Defined Contribution Plan | | | 145,676 | | | | 120,022 | | | | 29,390 | |
| - Employer Contribution to Insurance Scheme | | | 10,471 | | | | 9,276 | | | | 2,271 | |
| Depreciation of plant and equipment | | | 1,416,746 | | | | 2,375,429 | | | | 581,671 | |
| Amortization of ROU | | | 47,565 | | | | 177,083 | | | | 43,362 | |
| Provision for expected credit loss | | | 1,779,458 | | | | 2,235,888 | | | | 547,502 | |
| Provision for reinstatement cost | | | 25,296 | | | | - | | | | - | |
| 20 | FAIR VALUE OF ASSETS & LIABILITIES |
Asset and liabilities not measured at fair value.
Cash and bank balance, other receivables and payables carrying amounts of these balances approximate their fair values due to the short-term nature of these balances.
Trade receivables and trade payables carrying amounts (including trade balances due from/to related parties) approximate their fair values as they are subject to normal trade credit terms.
Bank borrowings carrying amounts approximate their fair values as they are subject to interest rates close to market rate of interests for similar arrangements with financial institutions.
Non-financial assets, including prepayments arising from share-based payment arrangements, are not within the scope of fair value disclosure under financial instruments standards and are therefore excluded from this disclosure.
SAGTEC GLOBAL LIMITED AND ITS SUBSIDIARIES
NOTES TO UNAUDITED INTERIM CONDENSED CONSOLIDATED FINANCIAL STATEMENTS
| 21 | FINANCIAL INSTRUMENTS AND RISK MANAGEMENT |
The Company activities expose it to various risks, including market risk (comprising currency risk and interest rate risk), credit risk, and liquidity risk. The Company overall risk management strategy aims to minimize any adverse effects from the unpredictability of financial markets on its financial performance.
| | | As of | |
| | | December 31,
2025 | | | June 30,
2026 | | | June 30,
2026 | |
| | | RM | | | RM | | | Convenience
Translation
USD | |
| Financial assets at amortized cost | | | | | | | | | | | | |
| Cash | | | 9,161,045 | | | | 12,308,656 | | | | 3,013,956 | |
| Trade receivables, net | | | 9,975,198 | | | | 20,834,160 | | | | 5,101,660 | |
| Other receivables | | | 142,730 | | | | 144,930 | | | | 35,489 | |
| Fixed deposits | | | 1,700,892 | | | | 1,708,868 | | | | 418,450 | |
| | | | | | | | | | | | | |
| Financial liabilities at amortized cost | | | | | | | | | | | | |
| Trade payables | | | 335,070 | | | | 6,411,187 | | | | 1,569,906 | |
| Other payables & accrued liabilities | | | 1,463,610 | | | | 1,894,666 | | | | 463,946 | |
| Bank and other borrowings | | | 5,032,533 | | | | 4,466,693 | | | | 1,093,760 | |
| Lease liabilities | | | 1,360,238 | | | | 1,201,388 | | | | 294,184 | |
Foreign Currency Risk
The Group expose to foreign currency risk due to transactions and balances denominated in currencies other than the functional currency of the respective entities of the Group, with the primary risk arising from the Chinese Renminbi (“RMB”). The Group closely monitor foreign currency risk on an ongoing basis to ensure that our net exposure remains at an acceptable level.
The company is subject to minimal foreign currency risk due to its foreign supplier policy of making prepayments in advance of delivery, thus eliminating the need for credit terms.
Interest Rate Risk
The Group exposed to interest rate risk arise mainly from interest-bearing bank loans. The interest rates and repayment terms of these loans are disclosed in Note 13 of the financial statements. Currently, The Group does not have an interest rate hedging policy. The sensitivity analysis below is based on our exposure to interest rates for non-derivative instruments at the end of the reporting period.
We use a 50-basis point increase or decrease to report interest rate risk internally to key management personnel, as this represents management’s assessment of a reasonably possible change in interest rates. If interest rates on loans had been 50 basis points higher or lower, with all other variables held constant, our profit would decrease or increase by approximately RM10,890 for the period ended June 30, 2026 and RM15,098 for the year ended December 31, 2025.
Liquidity Risk
Liquidity risk arises mainly due to general funding and business activities. The Group practices prudent risk management by maintaining sufficient cash balances and the availability of funding through certain committed credit facilities. The table below analyses non-derivative financial liabilities of the Group into relevant maturity groupings based on the remaining period from the statement of financial position date to the contractual maturity date. The amounts disclosed in the table are the contractual undiscounted cash flows, which includes both principal and interest. Balances due within 12 months equal their carrying amounts as the impact of discounting is not significant.
SAGTEC GLOBAL LIMITED AND ITS SUBSIDIARIES
NOTES TO UNAUDITED INTERIM CONDENSED CONSOLIDATED FINANCIAL STATEMENTS
| 21 | FINANCIAL INSTRUMENTS AND RISK MANAGEMENT (cont.) |
| | | As of | |
| | | December 31,
2025 | | | June 30,
2026 | | | June 30,
2026 | |
| | | RM | | | RM | | | Convenience
Translation
USD | |
| Bank borrowings | | | | | | | | | |
| Repayment within: | | | | | | | | | |
| Less than 1 year | | | 1,515,098 | | | | 1,538,032 | | | | 376,618 | |
| Between 1 and 2 years | | | 1,515,681 | | | | 1,415,001 | | | | 346,491 | |
| Between 2 and 5 years | | | 2,805,652 | | | | 2,263,088 | | | | 554,162 | |
| Over 5 years | | | 126,513 | | | | 5,479 | | | | 1,342 | |
| | | | | | | | | | | | | |
| Lease liabilities | | | | | | | | | | | | |
| Repayment within: | | | | | | | | | | | | |
| Less than 1 year | | | 382,416 | | | | 351,216 | | | | 86,002 | |
| Between 1 and 2 years | | | 364,216 | | | | 351,216 | | | | 86,002 | |
| Between 2 and 5 years | | | 672,552 | | | | 521,157 | | | | 127,616 | |
| Over 5 years | | | 92,312 | | | | 35,128 | | | | 8,602 | |
| | | | | | | | | | | | | |
| Trade payable | | | | | | | | | | | | |
| Repayment within less than 1 year | | | 335,070 | | | | 6,411,187 | | | | 1,569,906 | |
| | | | | | | | | | | | | |
| Other payable | | | | | | | | | | | | |
| Repayment within less than 1 year | | | 1,749,353 | | | | 1,955,754 | | | | 478,905 | |
Credit Risk
Credit risk primarily arises from the possibility of customers failing to fulfill their payment obligations for the services provided. The Group addresses this risk by conducting thorough customer screening and segmentation based on creditworthiness, setting appropriate credit limits, and enforcing stringent payment terms such as upfront payments and short billing cycles.
Expected credit losses are measured as the difference in the present value of the contractual cash flows that are due to the Company under the contract, and the cash flows that the Company expects to receive. The Company assesses all information available, including past due status, and forward looking macro- economic factors in the measurement of the expected credit losses associated with its assets carried at amortized cost.
SAGTEC GLOBAL LIMITED AND ITS SUBSIDIARIES
NOTES TO UNAUDITED INTERIM CONDENSED CONSOLIDATED FINANCIAL STATEMENTS
| 21 | FINANCIAL INSTRUMENTS AND RISK MANAGEMENT (cont.) |
| | | As of | |
| | | December 31,
2025 | | | June 30,
2026 | | | June 30,
2026 | |
| | | RM | | | RM | | | Convenience
Translation
USD | |
| Trade receivable | | | | | | | | | | | | |
| Collection within less than 1 year | | | 11,204,601 | | | | 24,299,451 | | | | 5,950,206 | |
| | | | | | | | | | | | | |
| Other receivables | | | | | | | | | | | | |
| Collection within less than 1 year | | | 142,730 | | | | 681,895 | | | | 166,976 | |
| | | As of | |
| | | December 31, 2025 | | | June 30,
2026 | | | June 30,
2026 | |
| | | RM | | | RM | | | Convenience
Translation
USD | |
| Lifetime expected credit loss | | | | | | | | | |
| As at beginning of the year/period | | | - | | | | 1,229,403 | | | | 301,044 | |
| Add: Charge for the year/period | | | 1,229,403 | | | | 3,465,291 | | | | 848,546 | |
| Less: Reversal during the year/period | | | - | | | | (1,229,403 | ) | | | (301,044 | ) |
| As at end of the year/period | | | 1,229,403 | | | | 3,465,291 | | | | 848,546 | |
For the six-month period ended June 30, 2026 and the year ended December 31, 2025, the company recognises impairment losses based on the expected credit loss (ECL) model in accordance with IFRS 9 Financial Instruments. The ECL is measured using a lifetime expected credit loss approach for trade receivables, which reflects historical credit loss experience, current conditions, and forward-looking information.
Capital Risk Management
The Group manages its capital to ensure that entities within our Company will be able to maintain an optimal capital structure so as to support our businesses and maximize shareholders value. To achieve this objective, we may make adjustments to the capital structure in view of changes in economic conditions, such as adjusting the amount of dividend payment, returning of capital to shareholders or issuing new shares.
The Group manage its capital based on debt-to-equity ratio that complies with debt covenants and regulatory, if any. The debt-to-equity ratio is calculated as net debt divided by total equity. Net debt is calculated as lease liability, borrowings and bank overdraft plus trade and other payables less cash and bank balances. Total capital is calculated as total equity plus net debts. Capital includes equity attributable to the owners of the parent and non-controlling interest.
| | | As of | |
| | | December 31,
2025 | | | June 30,
2026 | | | June 30,
2026 | |
| | | RM | | | RM | | | Convenience
Translation
USD | |
| Net debt | | | (2,670,486 | ) | | | (43,316 | ) | | | (10,607 | ) |
| Total equity | | | 102,011,998 | | | | 120,339,450 | | | | 29,467,518 | |
| Total capital | | | 99,341,512 | | | | 120,296,134 | | | | 29,456,911 | |
| | | | | | | | | | | | | |
| Gearing ratio | | | (2.69 | )% | | | (0.04 | )% | | | (0.04 | )% |
SAGTEC GLOBAL LIMITED AND ITS SUBSIDIARIES
NOTES TO UNAUDITED INTERIM CONDENSED CONSOLIDATED FINANCIAL STATEMENTS
| 22 | CONCENTRATIONS OF RISK |
Customer Concentration
For the period ended June 30, 2025, the Company generated total revenue of RM47,867,433, of which three customers accounted for more than 56% of the Company’s total revenue.
For the period ended June 30, 2026, the Company generated total revenue of RM48,544,240, of which three customers accounted for more than 29% of the Company’s total revenue.
| | | For the six months ended June 30, | |
| | | 2026 | | | 2025 | | | 2026 | | | 2025 | | | 2026 | | | 2025 | |
| | | Revenues | | | Percentage of
revenues | | | Trade receivables | |
| | | RM | | | RM | | | % | | | % | | | RM | | | RM | |
| SM Prominent Sdn Bhd | | | 10,349,461 | | | | 10,558,412 | | | | 13.35 | | | | 22.06 | | | | 5,770,036 | | | | 2,827,798 | |
| KLC Ventures Sdn Bhd | | | 7,716,025 | | | | 6,976,853 | | | | 9.95 | | | | 14.58 | | | | 4,807,160 | | | | 880,025 | |
| SMD Tech - FZCO | | | 4,716,000 | | | | 5,798,000 | | | | 6.08 | | | | 12.11 | | | | 4,716,000 | | | | 5,218,001 | |
| Rams Solutions Sdn Bhd | | | - | | | | 9,426,101 | | | | - | | | | 19.69 | | | | - | | | | - | |
| Total | | | 22,781,486 | | | | 32,759,366 | | | | 29.38 | | | | 68.44 | | | | 15,293,196 | | | | 8,925,824 | |
Vendor Concentration
For the period ended June 30, 2025, the Company incurred cost of sale of RM38,224,086, of which two vendor accounted for more than 67% of the Company’s total cost of sale.
For the period ended June 30, 2026, the Company incurred cost of sale of RM34,470,647, of which two vendors accounted for more than 40% of the Company’s total cost of sale.
| | | For the six months ended June 30, | |
| | | 2026 | | | 2025 | | | 2026 | | | 2025 | | | 2026 | | | 2025 | |
| | | Cost of sale | | | Percentage of
cost of sales | | | Accounts
payable, trade | |
| | | RM | | | RM | | | % | | | % | | | RM | | | RM | |
| Vendor A | | | 9,206,175 | | | | 15,345,772 | | | | 26.71 | | | | 40.15 | | | | 2,209,580 | | | | - | |
| Vendor B | | | 4,670,280 | | | | 10,282,944 | | | | 13.55 | | | | 26.90 | | | | 1,420,974 | | | | 316,000 | |
| Total | | | 13,876,455 | | | | 25,628,716 | | | | 40.26 | | | | 67.05 | | | | 3,630,554 | | | | 316,000 | |
SAGTEC GLOBAL LIMITED
AND ITS SUBSIDIARIES
NOTES TO UNAUDITED INTERIM CONDENSED CONSOLIDATED FINANCIAL STATEMENTS
Directors determine the basis of operating segments by analyzing the Group’s various revenue streams. They consider the nature of these revenues, the markets served, and the internal reporting structure. By segmenting the Group into distinct operating units, each with unique financial metrics and strategic goals, directors gain clearer insights into performance. This segmentation informs business decisions and resource allocation, allowing directors to target investments, manage costs, and optimize operations effectively for each segment.
The Group’s operations are located in Malaysia. All of the Group’s revenue from external customers based on the location of the Group’s operations is from Malaysia. The geographical locations of the Group’s non-current assets are mostly situated in Malaysia based on physical location of assets.
| | | For the six months ended June 30, 2025 | |
| | | SAAS Business | | | Software Customization | | | Data Analysis & Hosting Services | | | Outright Purchase | | | Others | | | Total | |
| | | RM | | | RM | | | RM | | | RM | | | RM | | | RM | |
| Revenue | | | 13,465,340 | | | | 6,161,113 | | | | 9,494,765 | | | | 18,746,215 | | | | - | | | | 47,867,433 | |
| Cost of Revenue | | | (11,450,803 | ) | | | (5,823,110 | ) | | | (8,802,400 | ) | | | (11,983,053 | ) | | | (164,720 | ) | | | (38,224,086 | ) |
| Gross Profit/(Loss) | | | 2,014,537 | | | | 338,003 | | | | 692,365 | | | | 6,763,162 | | | | (164,720 | ) | | | 9,643,347 | |
| Selling & Administrative Expenses | | | (967,226 | ) | | | (967,226 | ) | | | (967,226 | ) | | | (967,226 | ) | | | - | | | | (3,868,904 | ) |
| Income/(Loss) from operations | | | 1,047,311 | | | | (629,223 | ) | | | (274,860 | ) | | | 5,795,937 | | | | (164,720 | ) | | | 5,774,443 | |
| | | | | | | | | | | | | | | | | | | | | | | | | |
| Segment depreciation | | | 850,048 | | | | 141,675 | | | | 283,349 | | | | 70,837 | | | | 70,837 | | | | 1,416,746 | |
| Segment amortization | | | 28,539 | | | | 4,756 | | | | 9,514 | | | | 2,378 | | | | 2,378 | | | | 47,565 | |
| | | | | | | | | | | | | | | | | | | | | | | | | |
| Segment Assets | | | 33,536,886 | | | | 5,589,481 | | | | 11,178,963 | | | | 2,794,740 | | | | 2,794,740 | | | | 55,894,810 | |
| Segment Liabilities | | | 7,793,676 | | | | 1,298,946 | | | | 2,597,892 | | | | 649,473 | | | | 649,473 | | | | 12,989,460 | |
| | | For the year ended December 31, 2025 | |
| | | SAAS Business | | | Software Customization | | | Data Analysis & Hosting Services | | | Outright Purchase | | | Others | | | Total | |
| | | RM | | | RM | | | RM | | | RM | | | RM | | | RM | |
| Revenue | | | 23,393,531 | | | | 8,593,264 | | | | 17,581,904 | | | | 26,915,775 | | | | 1,026,000 | | | | 77,510,474 | |
| Cost of Revenue | | | (20,139,923 | ) | | | (7,938,897 | ) | | | (13,036,003 | ) | | | (18,122,877 | ) | | | (647,761 | ) | | | (59,885,461 | ) |
| Gross Profit | | | 3,253,608 | | | | 654,367 | | | | 4,545,901 | | | | 8,792,898 | | | | 378,239 | | | | 17,625,013 | |
| Selling & Administrative Expenses | | | (1,793,342 | ) | | | (1,793,342 | ) | | | (1,793,342 | ) | | | (1,793,342 | ) | | | (1,793,341 | ) | | | (8,966,709 | ) |
| Income/(Loss) from operations | | | 1,460,266 | | | | (1,138,975 | ) | | | 2,752,559 | | | | 6,999,556 | | | | (1,415,102 | ) | | | 9,392,193 | |
| | | | | | | | | | | | | | | | | | | | | | | | | |
| Segment depreciation | | | 2,145,509 | | | | 357,585 | | | | 715,171 | | | | 178,792 | | | | 178,792 | | | | 3,575,849 | |
| Segment amortization | | | 128,788 | | | | 21,465 | | | | 42,929 | | | | 10,732 | | | | 10,732 | | | | 214,646 | |
| | | | | | | | | | | | | | | | | | | | | | | | | |
| Segment Assets | | | 69,997,957 | | | | 11,666,326 | | | | 23,332,653 | | | | 5,833,163 | | | | 5,833,163 | | | | 116,663,262 | |
| Segment Liabilities | | | 8,790,758 | | | | 1,465,126 | | | | 2,930,254 | | | | 732,563 | | | | 732,563 | | | | 14,651,264 | |
SAGTEC GLOBAL LIMITED AND ITS SUBSIDIARIES
NOTES TO UNAUDITED INTERIM CONDENSED CONSOLIDATED FINANCIAL STATEMENTS
| 23 | OPERATING SEGMENTS (cont.) |
| | | For the six months ended June 30, 2026 | |
| | | SAAS Business | | | Software Customization | | | Data Analysis & Hosting Services | | | Outright Purchase | | | Others | | | Total | |
| | | RM | | | RM | | | RM | | | RM | | | RM | | | RM | |
| Revenue | | | 13,503,358 | | | | 5,919,573 | | | | 11,355,699 | | | | 16,466,010 | | | | 1,299,600 | | | | 48,544,240 | |
| Cost of Revenue | | | (10,185,794 | ) | | | (5,405,781 | ) | | | (6,962,367 | ) | | | (11,511,846 | ) | | | (404,859 | ) | | | (34,470,647 | ) |
| Gross Profit | | | 3,317,564 | | | | 513,792 | | | | 4,393,332 | | | | 4,954,164 | | | | 894,741 | | | | 14,073,593 | |
| Selling & Administrative Expenses | | | (1,528,485 | ) | | | (1,528,485 | ) | | | (1,528,485 | ) | | | (1,528,485 | ) | | | (1,528,486 | ) | | | (7,642,426 | ) |
| Income/(Loss) from operations | | | 1,789,079 | | | | (1,014,693 | ) | | | 2,864,847 | | | | 3,425,679 | | | | (633,745 | ) | | | 6,431,167 | |
| | | | | | | | | | | | | | | | | | | | | | | | | |
| Segment depreciation | | | 1,425,258 | | | | 237,543 | | | | 475,086 | | | | 118,771 | | | | 118,771 | | | | 2,375,429 | |
| Segment amortization | | | 106,250 | | | | 17,708 | | | | 35,417 | | | | 8,854 | | | | 8,854 | | | | 177,083 | |
| | | | | | | | | | | | | | | | | | | | | | | | | |
| Segment Assets | | | 84,406,515 | | | | 14,067,753 | | | | 28,135,505 | | | | 7,033,876 | | | | 7,033,876 | | | | 140,677,525 | |
| Segment Liabilities | | | 12,202,845 | | | | 2,033,808 | | | | 4,067,615 | | | | 1,016,903 | | | | 1,016,903 | | | | 20,338,075 | |
On 2 July 2026, the Company issued 200,000 Class A Ordinary Shares to Riviera Springs Holdings as consideration for consultancy services. The transaction was accounted for as an equity-settled share-based payment in accordance with IFRS 2 Share-based Payment.
On August 18, 2026, the Company received a notification from the Nasdaq Listing Qualifications Department stating that the Company was not in compliance with the minimum bid price requirement under Nasdaq Listing Rule 5550(a)(2), as the closing bid price of the Company’s Class A Ordinary Shares had remained below US$1.00 per share for 30 consecutive business days.
The notification has no immediate effect on the listing or trading of the Company’s Class A Ordinary Shares on the Nasdaq Capital Market. The Company has been granted a compliance period of 180 calendar days, until February 16, 2027, to regain compliance with the minimum bid price requirement.
The Company intends to monitor the closing bid price of its Class A Ordinary Shares and evaluate appropriate measures to regain compliance within the prescribed compliance period. As at the date these interim financial statements were authorized for issuance, the notification had no impact on the amounts recognised in the consolidated financial statements as at June 30, 2026.
Other than the above, the Company has evaluated subsequent events through the date the financial statements were available to be issued and determined that there were no other subsequent events that require disclosure or adjustment to the financial statements.
| 25 | CONTINGENCIES AND COMMITMENTS |
As of 30 June 2026, the Company has assessed a potential tax exposure arising from the recognition of revenue generated by Sagtec Global.
The potential exposure relates to the risk that Sagtec Global may be regarded as having a taxable presence in Malaysia, based on factors including: (i) key commercial and strategic decision-making functions being conducted in Malaysia; (ii) a significant portion of revenue being derived from customers based in Malaysia; and (iii) employees involved in operations being primarily located in Malaysia.
Notwithstanding the above, management is of the view that Sagtec Global does not have a taxable presence in Malaysia based on its current structure and governance framework. Nevertheless, as tax treatment may be subject to interpretation by the relevant authorities, there remains a potential exposure that Sagtec Global could be assessed to tax in Malaysia, which may result in additional tax liabilities, together with potential penalties and interest.
As at the reporting date, no provision has been recognized as management considers the likelihood of a material outflow of economic resources to be low. Accordingly, the matter is disclosed as a contingent liability in accordance with IAS 37 Provisions, Contingent Liabilities and Contingent Assets.