Pay Versus Performance
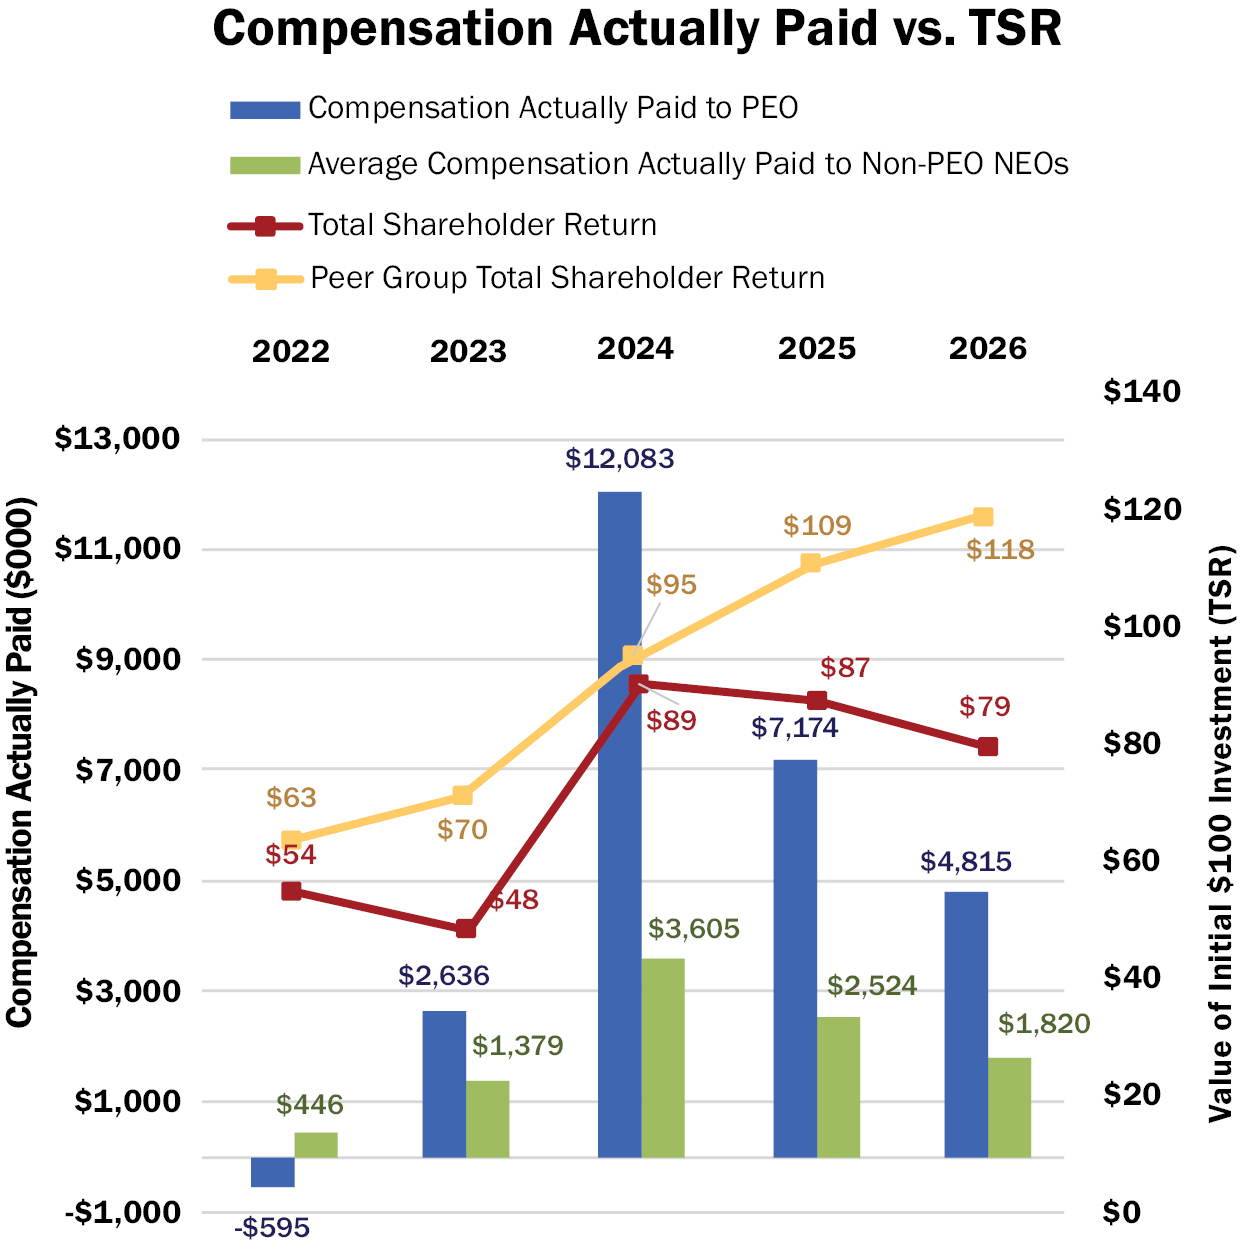
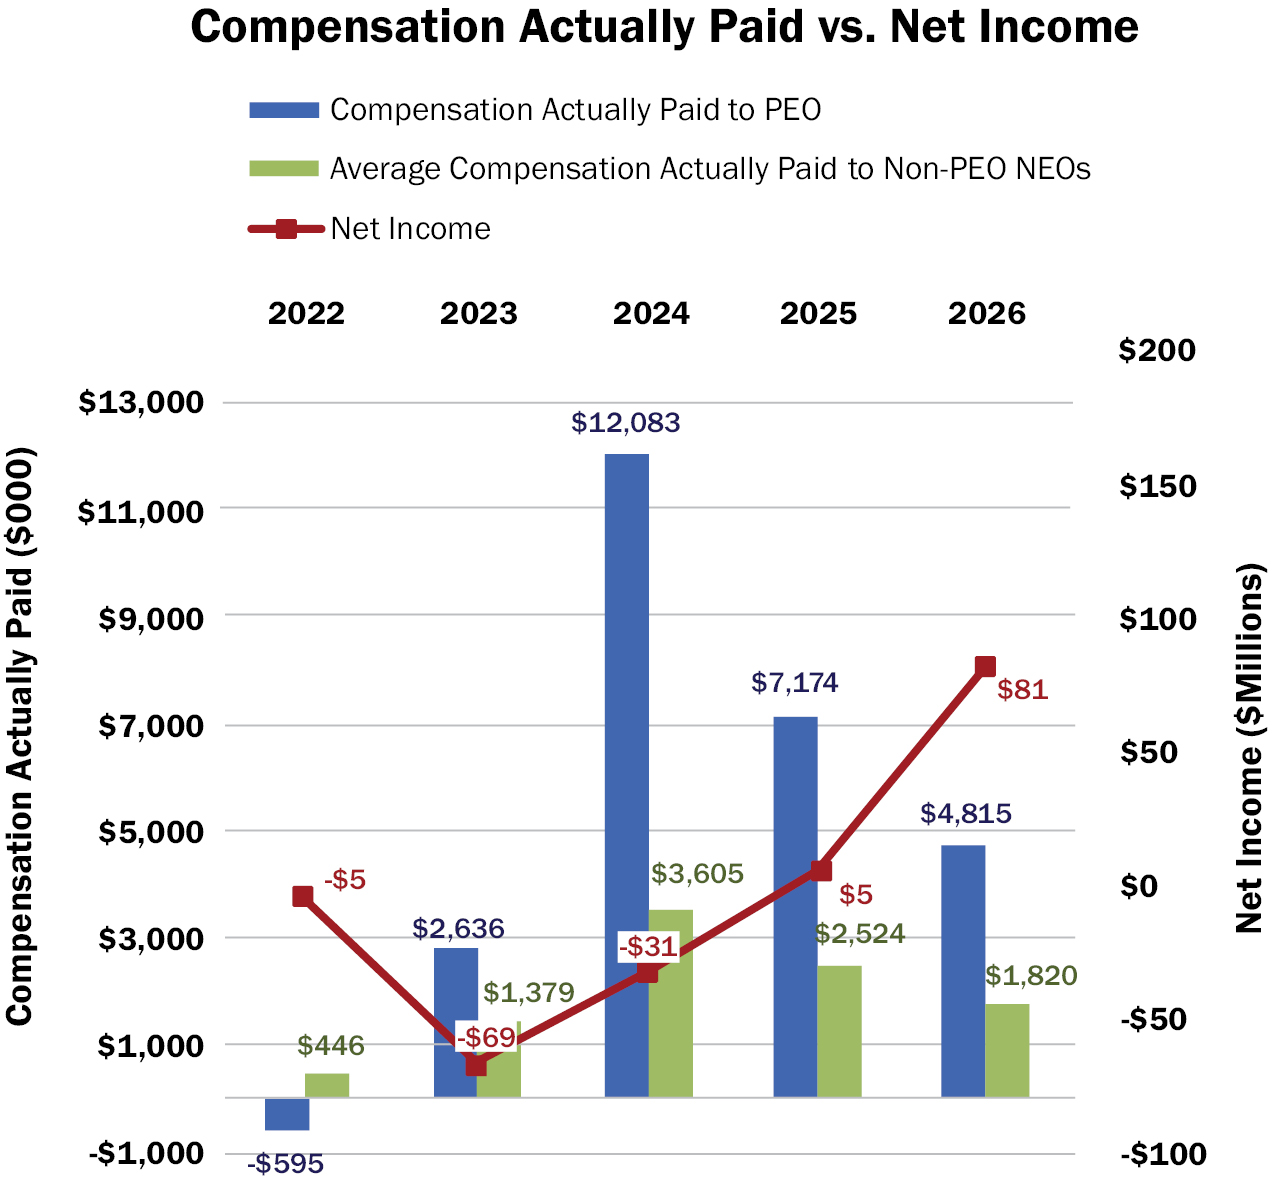
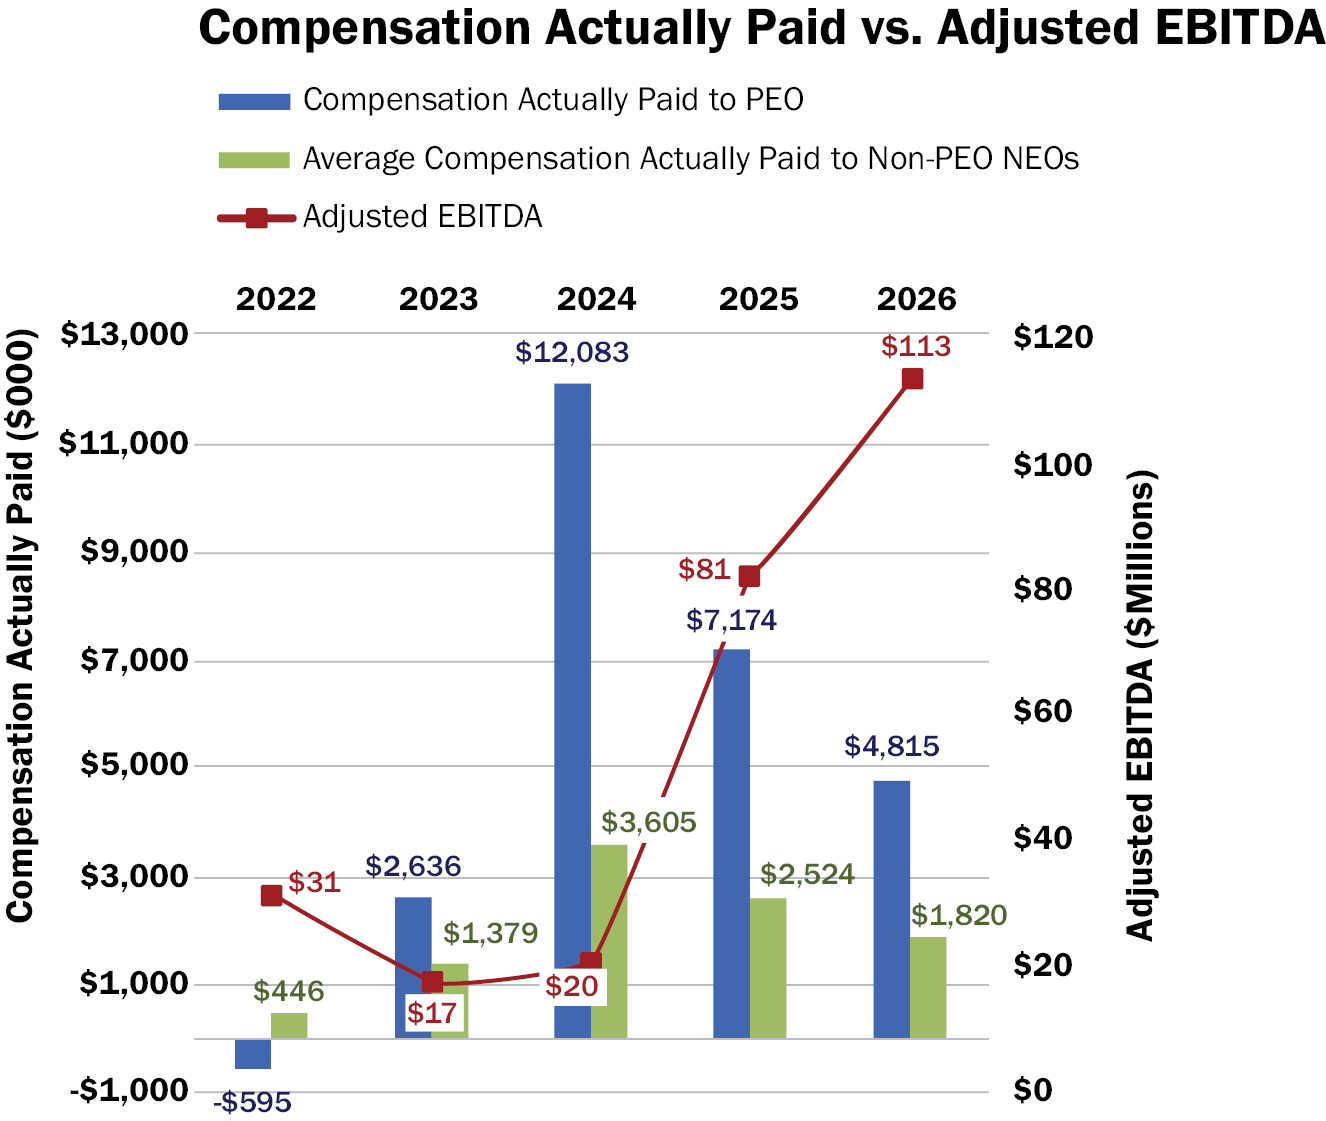
As required by Item 402(v) of Regulation S-K (the “PvP Rules”), we are providing the following: (1) tabular compensation and performance disclosure for our fiscal years 2022, 2023, 2024, 2025, and 2026; (2) a list of the three performance measures that the Company considers to be its most important measures used to align compensation actually paid to the Named Executive Officers for fiscal year 2026 to Company performance; and (3) additional disclosure relative to the relationship between the “Compensation Actually Paid” (“CAP”) set forth in the Pay versus Performance Table and each of the performance measures set forth in the Pay versus Performance Table and between the Company’s and a peer group’s total shareholder return (“TSR”), in each case over fiscal years 2022 through 2026. For further information concerning our pay-for-performance philosophy and how we align executive compensation with our performance, see the “Compensation Discussion and Analysis” in this proxy statement and in our proxy statements filed for fiscal years 2022, 2023, 2024, and 2025.
In the below Pay versus Performance Table, we provide information about compensation of our Named Executive Officers for each of the last five fiscal years (the “Covered Years”). Additionally, we provide information about the results for certain financial performance measures during the Covered Years. Although the PvP Rules
require us to disclose “compensation actually paid,” these amounts do not necessarily reflect compensation that our Named Executive Officers actually earned in the Covered Years. Instead, “compensation actually paid” reflects a calculation computed in accordance with the PvP Rules, including adjusted values to unvested and vested equity awards during the Covered Years based on either year-end or vesting date stock prices and various accounting valuation assumptions. “Compensation actually paid” generally fluctuates due to stock price performance.
| Pay Versus Performance | ||||||||||||||||||||||||||
| Year(1) | Summary | Compensation | Average | Average | Value of Initial Fixed $100 | Net | Company- | |||||||||||||||||||
| Total | Peer Group | |||||||||||||||||||||||||
| 2026 | $ | 6,760,750 | $ | 4,814,631 |
| $ | 2,386,325 | $ | 1,819,579 | $ | 79 | $ | 118 | $ | 81,235,000 |
| $ | 112,500,000 | ||||||||
| 2025 | $ | 7,692,200 | $ | 7,174,402 |
| $ | 2,664,967 | $ | 2,524,421 | $ | 87 | $ | 109 | $ | 4,707,000 |
| $ | 81,263,000 | ||||||||
| 2024 | $ | 5,947,270 | $ | 12,082,852 |
| $ | 1,758,805 | $ | 3,604,752 | $ | 89 | $ | 95 | $ | (31,331,000 | ) | $ | 20,365,000 | ||||||||
| 2023 | $ | 4,785,890 | $ | 2,636,126 |
| $ | 1,708,675 | $ | 1,379,352 | $ | 48 | $ | 70 | $ | (68,866,000 | ) | $ | 16,690,000 | ||||||||
| 2022 | $ | 4,319,500 | $ | (594,710 | ) | $ | 1,891,157 | $ | 445,951 | $ | 54 | $ | 63 | $ | (5,248,000 | ) | $ | 31,030,000 | ||||||||
____________
(1) The Principal Executive Officer (“PEO”) and the other Named Executive Officers (“Non-PEO NEOs”) included in the above columns are as follows:
| Fiscal Year | PEO (CEO) | Non-PEO NEOs | ||
| 2026 | Doug Valenti | Gregory Wong, Nina Bhanap, Timothy Stevens, and Martin Collins | ||
| 2025 | Doug Valenti | Gregory Wong, Nina Bhanap, Timothy Stevens, and Martin Collins | ||
| 2024 | Doug Valenti | Gregory Wong, Nina Bhanap, Timothy Stevens, and Martin Collins | ||
| 2023 | Doug Valenti | Gregory Wong, Nina Bhanap, Timothy Stevens, and Martin Collins | ||
| 2022 | Doug Valenti | Gregory Wong, Nina Bhanap, Timothy Stevens, and Stephen Chen |
(2) Amounts reported in this column represent the total compensation reported in the Summary Compensation Table for the indicated fiscal year for our PEO. For all years reported, our PEO was Doug Valenti.
(3) Amounts reported in this column represent the “compensation actually paid” to our PEO (as defined in the PvP Rules), based on his total compensation reported in the Summary Compensation Table for each of the indicated fiscal years and adjusted as shown in the table below:
| PEO (D. Valenti) | |||||||||||||||||||||
| 2022 | 2023 | 2024 | 2025 | 2026 | |||||||||||||||||
| Summary Compensation Table – Total Compensation | $ | 4,319,500 |
| $ | 4,785,890 |
| $ | 5,947,270 | $ | 7,692,200 |
| $ | 6,760,750 |
| |||||||
| - | Grant Date Fair Value of Stock Awards and Option Awards Granted in Fiscal Year | $ | 3,664,000 |
| $ | 4,047,000 |
| $ | 5,152,800 | $ | 7,102,200 |
| $ | 6,156,000 |
| ||||||
| + | Fair Value at Fiscal Year End of Outstanding and Unvested Stock Awards and Option Awards Granted in Fiscal Year | $ | 1,016,060 |
| $ | 1,677,700 |
| $ | 9,456,300 | $ | 6,118,000 |
| $ | 5,567,000 |
| ||||||
| + | Change in Fair Value of Outstanding and Unvested Stock Awards and Option Awards Granted in Prior Fiscal Years | $ | (1,565,550 | ) | $ | (161,207 | ) | $ | 1,171,275 | $ | (189,293 | ) | $ | (585,438 | ) | ||||||
| + | Fair Value at Vesting of Stock Awards and Option Awards Granted in Fiscal Year That Vested During Fiscal Year | $ | 0 |
| $ | 0 |
| $ | 0 | $ | 0 |
| $ | 0 |
| ||||||
| + | Change in Fair Value as of Vesting Date of Stock Awards and Option Awards Granted in Prior Fiscal Years For Which Applicable Vesting Conditions Were Satisfied During Fiscal Year | $ | (700,720) |
| $ | 380,743 |
| $ | 660,807 | $ | 655,695 |
| $ | (771,682 | ) | ||||||
| - | Fair Value as of Prior Fiscal Year End of Stock Awards and Option Awards Granted in Prior Fiscal Years That Failed to Meet Applicable Vesting Conditions During Fiscal Year | $ | 0 |
| $ | 0 |
| $ | 0 | $ | 0 |
| $ | 0 |
| ||||||
| = | Compensation Actually Paid | $ | (594,710 | ) | $ | 2,636,126 |
| $ | 12,082,852 | $ | 7,174,402 |
| $ | 4,814,631 |
| ||||||
(4) Amounts reported in this column represent the average of the total compensation reported in the Summary Compensation Table for the indicated fiscal year for our Non-PEO NEOs. Please see footnote 1 for the names of our Non-PEO NEOs included in the average for each indicated fiscal year.
(5) Amounts reported in this column represent the compensation actually paid to the Non-PEO NEOs in the indicated fiscal year, as calculated under Item 402(v) of Regulation S-K based on the average total compensation for such Non-PEO NEOs reported in the Summary Compensation Table for the indicated fiscal year and adjusted as shown in the table below:
| NEO Average | |||||||||||||||||||||
| 2022 | 2023 | 2024 | 2025 | 2026 | |||||||||||||||||
| Summary Compensation Table – Total Compensation | $ | 1,891,157 |
| $ | 1,708,675 |
| $ | 1,758,805 | $ | 2,664,967 |
| $ | 2,386,325 |
| |||||||
| - | Grant Date Fair Value of Stock Awards and Option Awards Granted in Fiscal Year | $ | 1,417,295 |
| $ | 1,123,575 |
| $ | 1,192,150 | $ | 2,140,940 |
| $ | 1,911,600 |
| ||||||
| + | Fair Value at Fiscal Year End of Outstanding and Unvested Stock Awards and Option Awards Granted in Fiscal Year | $ | 760,159 |
| $ | 698,674 |
| $ | 2,187,806 | $ | 1,844,255 |
| $ | 1,728,700 |
| ||||||
| + | Change in Fair Value of Outstanding and Unvested Stock Awards and Option Awards Granted in Prior Fiscal Years | $ | (556,828 | ) | $ | (83,847 | ) | $ | 544,778 | $ | (50,474 | ) | $ | (160,328 | ) | ||||||
| + | Fair Value at Vesting of Stock Awards and Option Awards Granted in Fiscal Year That Vested During Fiscal Year | $ | 0 |
| $ | 0 |
| $ | 0 | $ | 0 |
| $ | 0 |
| ||||||
| + | Change in Fair Value as of Vesting Date of Stock Awards and Option Awards Granted in Prior Fiscal Years For Which Applicable Vesting Conditions Were Satisfied During Fiscal Year | $ | (231,447 | ) | $ | 179,426 |
| $ | 305,513 | $ | 206,613 |
| $ | (223,487 | ) | ||||||
| - | Fair Value as of Prior Fiscal Year End of Stock Awards and Option Awards Granted in Prior Fiscal Years That Failed to Meet Applicable Vesting Conditions During Fiscal Year | $ | 0 |
| $ | 0 |
| $ | 0 | $ | 0 |
| $ | 0 |
| ||||||
| = | Compensation Actually Paid | $ | 445,951 |
| $ | 1,379,352 |
| $ | 3,604,752 | $ | 2,524,421 |
| $ | 1,819,579 |
| ||||||
Equity Award Valuations: Equity values are calculated in accordance with FASB ASC Topic 718, and the valuation assumptions used to calculate fair values did not materially differ from those disclosed at the time of grant.
(6) Pursuant to Item 402(v) of Regulation S-K, the comparison assumes $100 was invested in our common stock on June 30, 2021, using the closing stock price on that date. Historic stock price performance is not necessarily indicative of future stock price performance.
(7) The peer group for the purposes of the TSR analysis consists of the RDG Internet Composite Index (“TSR Peer Group”). This calculation assumes that $100 was invested in this index on June 30, 2021 (aligned with the period used in footnote 6 above).
(8) We selected Adjusted EBITDA as the Company-Selected Measure because it is a core driver of our performance and stockholder value creation and, accordingly, was utilized as a metric for the PSUs granted in fiscal year 2026 and the annual bonus opportunities for our Named Executive Officers in fiscal year 2026.
| Fiscal Year | PEO (CEO) | Non-PEO NEOs | ||
| 2026 | Doug Valenti | Gregory Wong, Nina Bhanap, Timothy Stevens, and Martin Collins | ||
| 2025 | Doug Valenti | Gregory Wong, Nina Bhanap, Timothy Stevens, and Martin Collins | ||
| 2024 | Doug Valenti | Gregory Wong, Nina Bhanap, Timothy Stevens, and Martin Collins | ||
| 2023 | Doug Valenti | Gregory Wong, Nina Bhanap, Timothy Stevens, and Martin Collins | ||
| 2022 | Doug Valenti | Gregory Wong, Nina Bhanap, Timothy Stevens, and Stephen Chen |
| PEO (D. Valenti) | |||||||||||||||||||||
| 2022 | 2023 | 2024 | 2025 | 2026 | |||||||||||||||||
| Summary Compensation Table – Total Compensation | $ | 4,319,500 |
| $ | 4,785,890 |
| $ | 5,947,270 | $ | 7,692,200 |
| $ | 6,760,750 |
| |||||||
| - | Grant Date Fair Value of Stock Awards and Option Awards Granted in Fiscal Year | $ | 3,664,000 |
| $ | 4,047,000 |
| $ | 5,152,800 | $ | 7,102,200 |
| $ | 6,156,000 |
| ||||||
| + | Fair Value at Fiscal Year End of Outstanding and Unvested Stock Awards and Option Awards Granted in Fiscal Year | $ | 1,016,060 |
| $ | 1,677,700 |
| $ | 9,456,300 | $ | 6,118,000 |
| $ | 5,567,000 |
| ||||||
| + | Change in Fair Value of Outstanding and Unvested Stock Awards and Option Awards Granted in Prior Fiscal Years | $ | (1,565,550 | ) | $ | (161,207 | ) | $ | 1,171,275 | $ | (189,293 | ) | $ | (585,438 | ) | ||||||
| + | Fair Value at Vesting of Stock Awards and Option Awards Granted in Fiscal Year That Vested During Fiscal Year | $ | 0 |
| $ | 0 |
| $ | 0 | $ | 0 |
| $ | 0 |
| ||||||
| + | Change in Fair Value as of Vesting Date of Stock Awards and Option Awards Granted in Prior Fiscal Years For Which Applicable Vesting Conditions Were Satisfied During Fiscal Year | $ | (700,720) |
| $ | 380,743 |
| $ | 660,807 | $ | 655,695 |
| $ | (771,682 | ) | ||||||
| - | Fair Value as of Prior Fiscal Year End of Stock Awards and Option Awards Granted in Prior Fiscal Years That Failed to Meet Applicable Vesting Conditions During Fiscal Year | $ | 0 |
| $ | 0 |
| $ | 0 | $ | 0 |
| $ | 0 |
| ||||||
| = | Compensation Actually Paid | $ | (594,710 | ) | $ | 2,636,126 |
| $ | 12,082,852 | $ | 7,174,402 |
| $ | 4,814,631 |
| ||||||
| NEO Average | |||||||||||||||||||||
| 2022 | 2023 | 2024 | 2025 | 2026 | |||||||||||||||||
| Summary Compensation Table – Total Compensation | $ | 1,891,157 |
| $ | 1,708,675 |
| $ | 1,758,805 | $ | 2,664,967 |
| $ | 2,386,325 |
| |||||||
| - | Grant Date Fair Value of Stock Awards and Option Awards Granted in Fiscal Year | $ | 1,417,295 |
| $ | 1,123,575 |
| $ | 1,192,150 | $ | 2,140,940 |
| $ | 1,911,600 |
| ||||||
| + | Fair Value at Fiscal Year End of Outstanding and Unvested Stock Awards and Option Awards Granted in Fiscal Year | $ | 760,159 |
| $ | 698,674 |
| $ | 2,187,806 | $ | 1,844,255 |
| $ | 1,728,700 |
| ||||||
| + | Change in Fair Value of Outstanding and Unvested Stock Awards and Option Awards Granted in Prior Fiscal Years | $ | (556,828 | ) | $ | (83,847 | ) | $ | 544,778 | $ | (50,474 | ) | $ | (160,328 | ) | ||||||
| + | Fair Value at Vesting of Stock Awards and Option Awards Granted in Fiscal Year That Vested During Fiscal Year | $ | 0 |
| $ | 0 |
| $ | 0 | $ | 0 |
| $ | 0 |
| ||||||
| + | Change in Fair Value as of Vesting Date of Stock Awards and Option Awards Granted in Prior Fiscal Years For Which Applicable Vesting Conditions Were Satisfied During Fiscal Year | $ | (231,447 | ) | $ | 179,426 |
| $ | 305,513 | $ | 206,613 |
| $ | (223,487 | ) | ||||||
| - | Fair Value as of Prior Fiscal Year End of Stock Awards and Option Awards Granted in Prior Fiscal Years That Failed to Meet Applicable Vesting Conditions During Fiscal Year | $ | 0 |
| $ | 0 |
| $ | 0 | $ | 0 |
| $ | 0 |
| ||||||
| = | Compensation Actually Paid | $ | 445,951 |
| $ | 1,379,352 |
| $ | 3,604,752 | $ | 2,524,421 |
| $ | 1,819,579 |
| ||||||
Tabular List of Financial Performance Measures
The following is a list of financial performance measures, which, in the Company’s assessment, represent the most important financial performance measures used by the Company to link compensation actually paid to the Named Executive Officers for fiscal year 2026. These measures were either used to determine the performance conditions for the PSUs granted in fiscal year 2026 or to determine bonus payouts to the Named Executive Officers for fiscal year 2026:
• Adjusted EBITDA; and
• media margin dollars.
| [1] | Amounts reported in this column represent the total compensation reported in the Summary Compensation Table for the indicated fiscal year for our PEO. For all years reported, our PEO was Doug Valenti. | ||||||||||||||||||||||||||||||||||||||||||||||||||||||||||||||||||||||||||||||||||||||||||||||||||||||||||||||||||||||||||||||||||||||||||||||||||||||||||||||||||||||||||||||||||||||||||||||||||||||||||||||||||
| [2] | The Principal Executive Officer (“PEO”) and the other Named Executive Officers (“Non-PEO NEOs”) included in the above columns are as follows:
|
||||||||||||||||||||||||||||||||||||||||||||||||||||||||||||||||||||||||||||||||||||||||||||||||||||||||||||||||||||||||||||||||||||||||||||||||||||||||||||||||||||||||||||||||||||||||||||||||||||||||||||||||||
| [3] | Amounts reported in this column represent the “compensation actually paid” to our PEO (as defined in the PvP Rules), based on his total compensation reported in the Summary Compensation Table for each of the indicated fiscal years and adjusted as shown in the table below:
|
||||||||||||||||||||||||||||||||||||||||||||||||||||||||||||||||||||||||||||||||||||||||||||||||||||||||||||||||||||||||||||||||||||||||||||||||||||||||||||||||||||||||||||||||||||||||||||||||||||||||||||||||||
| [4] | Amounts reported in this column represent the average of the total compensation reported in the Summary Compensation Table for the indicated fiscal year for our Non-PEO NEOs. Please see footnote 1 for the names of our Non-PEO NEOs included in the average for each indicated fiscal year. | ||||||||||||||||||||||||||||||||||||||||||||||||||||||||||||||||||||||||||||||||||||||||||||||||||||||||||||||||||||||||||||||||||||||||||||||||||||||||||||||||||||||||||||||||||||||||||||||||||||||||||||||||||
| [5] | Amounts reported in this column represent the compensation actually paid to the Non-PEO NEOs in the indicated fiscal year, as calculated under Item 402(v) of Regulation S-K based on the average total compensation for such Non-PEO NEOs reported in the Summary Compensation Table for the indicated fiscal year and adjusted as shown in the table below:
Equity Award Valuations: Equity values are calculated in accordance with FASB ASC Topic 718, and the valuation assumptions used to calculate fair values did not materially differ from those disclosed at the time of grant. |
||||||||||||||||||||||||||||||||||||||||||||||||||||||||||||||||||||||||||||||||||||||||||||||||||||||||||||||||||||||||||||||||||||||||||||||||||||||||||||||||||||||||||||||||||||||||||||||||||||||||||||||||||
| [6] | Pursuant to Item 402(v) of Regulation S-K, the comparison assumes $100 was invested in our common stock on June 30, 2021, using the closing stock price on that date. Historic stock price performance is not necessarily indicative of future stock price performance. | ||||||||||||||||||||||||||||||||||||||||||||||||||||||||||||||||||||||||||||||||||||||||||||||||||||||||||||||||||||||||||||||||||||||||||||||||||||||||||||||||||||||||||||||||||||||||||||||||||||||||||||||||||
| [7] | The peer group for the purposes of the TSR analysis consists of the RDG Internet Composite Index (“TSR Peer Group”). This calculation assumes that $100 was invested in this index on June 30, 2021 (aligned with the period used in footnote 6 above). | ||||||||||||||||||||||||||||||||||||||||||||||||||||||||||||||||||||||||||||||||||||||||||||||||||||||||||||||||||||||||||||||||||||||||||||||||||||||||||||||||||||||||||||||||||||||||||||||||||||||||||||||||||
| [8] | We selected Adjusted EBITDA as the Company-Selected Measure because it is a core driver of our performance and stockholder value creation and, accordingly, was utilized as a metric for the PSUs granted in fiscal year 2026 and the annual bonus opportunities for our Named Executive Officers in fiscal year 2026. | ||||||||||||||||||||||||||||||||||||||||||||||||||||||||||||||||||||||||||||||||||||||||||||||||||||||||||||||||||||||||||||||||||||||||||||||||||||||||||||||||||||||||||||||||||||||||||||||||||||||||||||||||||