Pay Versus Performance Disclosure
In accordance with rules adopted by the Securities and Exchange Commission pursuant to the Dodd-Frank Wall Street Reform and Consumer Protection Act of 2010, we provide the following disclosure regarding executive compensation for our principal executive officers (“PEOs”) and Non-PEO named executive officers (“Non-PEO NEOs”) and Company performance for the fiscal years listed below. The Compensation Committee did not consider the pay versus performance disclosure below in making its pay decisions for any of the years shown. For further information concerning the Company’s variable pay-for-performance philosophy and how the Company aligns executive compensation with the Company’s performance, please see the section entitled “Executive Compensation—Narrative Disclosure to the 2025 Summary Compensation Table—2025 Bonuses” and “—Equity Compensation.”
| Year | Summary Compensation Table Total for First PEO¹ ($) |
Summary Compensation Table Total for Second PEO¹ ($) |
Compensation Actually Paid to First PEO1,2,3 ($) |
Compensation Actually Paid to Second PEO1,2,3 |
Average Summary
Compensation Table Total for Non-PEO NEOs1 ($) |
Average Compensation
Actually Paid to Non-PEO NEOs1,2,3 ($) |
Value of Initial Fixed $100 Investment based on TSR ($)4 | Net
Loss ($ Millions) |
|||||||||||||||||||||||||
| 2025 | 798,201 | 834,866 | 755,034 | 620,781 | 437,858 | 393,145 | 10.84 | (19.9 | ) | ||||||||||||||||||||||||
| 2024 | 473,274 | — | 278,821 | — | 367,002 | 254,094 | 32.51 | (28.9 | ) | ||||||||||||||||||||||||
| 2023 | 888,683 | — | 860,554 | 532,038 | 561,010 | 63.23 | (22.1 | ) | |||||||||||||||||||||||||
1. Larry Jasinski served as our PEO until June 30, 2025, serving as Chief Executive Officer through June 1, 2025 and as co-Chief Executive Officer from June 2, 2025 through June 30, 2025 (“First PEO”). Mark Grant has served as our PEO since June 2, 2025, serving as co-Chief Executive Officer through June 30, 2025 and as Chief Executive Officer since July 1, 2025 (“Second PEO”). The individuals comprising the Non-PEO NEOs for each year presented are listed below.
| 2023 | 2024 | 2025 | ||
| Mike Lawless | Charles Remsberg | Almog Adar | ||
| Jeannine Lynch | Jeannine Lynch | Jeannine Lynch |
2. The amounts shown for “Compensation Actually Paid” have been calculated in accordance with Item 402(v) of Regulation S-K and do not reflect compensation actually earned, realized, or received by the PEOs or the Non-PEO NEOs. The dollar amounts reported are the amounts of total compensation reported for our PEOs and Non-PEO NEOs for each corresponding year in the “Total” column of the Summary Compensation Table, with certain adjustments as described in footnote 3 below.
3. Compensation Actually Paid reflects the exclusions and inclusions of certain amounts for the PEOs and the Non-PEO NEOs as set forth below. Equity values are calculated in accordance with FASB ASC Topic 718. Amounts in the Exclusion of Stock Awards and Option Awards column are the totals from the Stock Awards and Option Awards columns set forth in the Summary Compensation Table.
| Year |
Summary Compensation Table Total for First PEO ($) |
Exclusion of Stock Awards for First PEO ($)(a) |
Inclusion of Equity Values for First PEO ($)(b) |
Compensation Actually Paid to First PEO ($) |
|||||||||||||
| 2025 | 798,201 | 0 | (43,167 | ) | 755,034 | ||||||||||||
| 2024 | 473,274 | 0 | (194,453 | ) | 278,821 | ||||||||||||
| 2023 | 888,683 | (167,714 | ) | 139,585 | 860,554 | ||||||||||||
| Year |
Summary Compensation Table Total for Second PEO ($) |
Exclusion of Stock Awards for Second PEO ($)(a) |
Inclusion of Equity Values for Second PEO ($)(b)
|
Compensation Actually Paid to Second PEO ($) |
|||||||||||||
| 2025 | 834,866 | (403,491 | ) | 189,406 | 620,781 | ||||||||||||
| Year |
Average Summary Compensation Table Total for Non-PEO NEOs ($) |
Average Exclusion of Stock Awards and Option Awards for Non-PEO NEOs ($)(a) |
Average Inclusion for Non-PEO NEOs ($)(b) |
Average Compensation Actually Paid to Non-PEO NEOs ($) |
|||||||||||||
| 2025 | 437,858 | (84,309 | ) | 39,595 | 393,145 | ||||||||||||
| 2024 | 367,002 | 0 | (112,908 | ) | 254,094 | ||||||||||||
| 2023 | 532,038 | (90,750 | ) | 119,722 | 561,010 | ||||||||||||
(a) The amounts reported in this column represent the total of the amounts reported in the “Stock Awards” and “Option Awards” columns in the Summary Compensation Table for the applicable year.
(b) The amounts reported in this column include the addition (or subtraction, as applicable) of the following: (i) the year-end fair value of any equity awards granted in the applicable year that are outstanding and unvested as of the end of the year; (ii) the amount of change as of the end of the applicable year (from the end of the prior fiscal year) in fair value of any awards granted in prior years that are outstanding and unvested as of the end of the applicable year; (iii) for awards that are granted and vest in same applicable year, the fair value as of the vesting date; (iv) for awards granted in prior years that vest in the applicable year, the amount equal to the change as of the vesting date (from the end of the prior fiscal year) in fair value; (v) for awards granted in prior years that are determined to fail to meet the applicable vesting conditions during the applicable year, a deduction for the amount equal to the fair value at the end of the prior fiscal year; and (vi) the dollar value of any dividends or other earnings paid on stock or option awards in the applicable year prior to the vesting date that are not otherwise reflected in the fair value of such award or included in any other component of total compensation for the applicable year. The valuation assumptions used to calculate fair values did not materially differ from those disclosed at the time of grant. The amounts deducted or added in calculating the equity award adjustments are as follows:
| Year | Year-End Fair Value of Equity Awards Granted During
Year That Remained Unvested as of Last Day of Year for First PEO ($) |
Change in Fair Value from Last Day of Prior Year
to Last Day of Year of Unvested Equity Awards for First PEO ($) |
Vesting-Date Fair Value of Equity Awards Granted
During Year that Vested During Year for First PEO ($) |
Change in Fair Value from Last Day of Prior Year
to Vesting Date of Unvested Equity Awards that Vested During Year for First PEO ($) |
Fair Value at Last Day of Prior Year of Equity Awards
Forfeited During Year for First PEO ($) |
Total - Inclusion of Equity Values for First PEO ($) |
|||||||||||||||||||
| 2025 | 0 | (24,714 | ) | 0 | (18,453 | ) | 0 | (43,167 | ) | ||||||||||||||||
| 2024 | 0 | (152,530 | ) |
— |
(41,923 | ) |
— |
(194,453 | ) | ||||||||||||||||
| 2023 | 155,540 | 5,280 |
— |
(21,235 | ) |
— |
139,585 | ||||||||||||||||||
| Year | Year-End Fair Value of Equity Awards Granted During
Year That Remained Unvested as of Last Day of Year for Second PEO ($) |
Change in Fair Value from Last Day of Prior Year
to Last Day of Year of Unvested Equity Awards for Second PEO ($) |
Vesting-Date Fair Value of Equity Awards Granted
During Year that Vested During Year for Second PEO ($) |
Change in Fair Value from Last Day of Prior Year
to Vesting Date of Unvested Equity Awards that Vested During Year for Second PEO ($) |
Fair Value at Last Day of Prior Year of Equity Awards
Forfeited During Year for Second PEO ($) |
Total - Inclusion of Equity Values for Second PEO ($) |
|||||||||||||||||||
| 2025 | 189,406 | 0 | 0 | 0 | 0 | 189,406 | |||||||||||||||||||
| Year | Average Year-End Fair Value of Equity Awards Granted
During Year That Remained Unvested as of Last Day of Year for Non-PEO NEOs ($) |
Average Change in Fair Value from Last Day of Prior
Year to Last Day of Year of Unvested Equity Awards for Non-PEO NEOs ($) |
Average Vesting-Date Fair Value of Equity Awards
Granted During Year that Vested During Year for Non-PEO NEOs ($) |
Average Change in Fair Value from Last Day of Prior
Year to Vesting Date of Unvested Equity Awards that Vested During Year for Non-PEO NEOs ($) |
Average Fair Value at Last Day of Prior Year of Equity
Awards Forfeited During Year for Non-PEO NEOs ($) |
Total - Average Inclusion of Equity Values for Non-PEO NEOs ($) |
|||||||||||||||||||
| 2025 | 67,457 | (15,705 | ) | 0 | (12,157 | ) | 0 | 39,595 | |||||||||||||||||
| 2024 | 0 | (93,675 | ) |
— |
(19,233 | ) |
— |
(112,908 | ) | ||||||||||||||||
| 2023 | 117,627 | 2,942 |
— |
(847 | ) |
— |
119,722 | ||||||||||||||||||
4. Assumes $100 was invested in the Company at market close on December 30, 2022 (the last trading day before the beginning of fiscal year 2023) through the end of the listed year. Historical stock performance is not necessarily indicative of future stock performance.
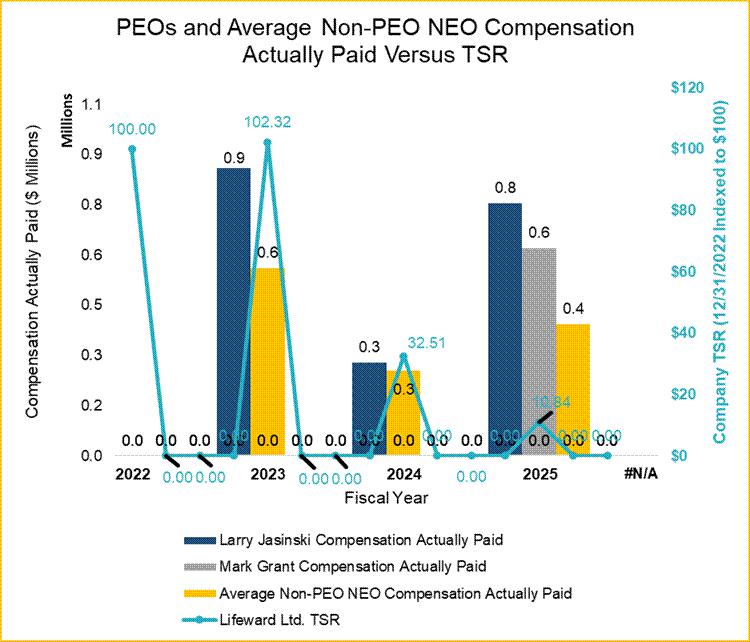
Relationship Between PEOs and Non-PEO NEO Compensation Actually Paid and Company Total Shareholder Return (“TSR”)
The following chart sets forth the relationship between Compensation Actually Paid to our PEOs, the average of Compensation Actually Paid to our Non-PEO NEOs, and the Company’s cumulative TSR over the three most recently completed fiscal years.
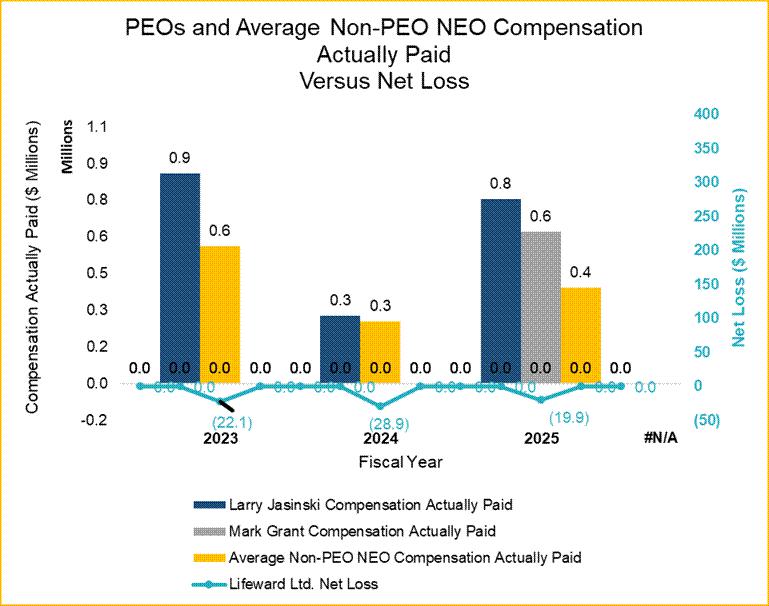
Relationship Between PEOs and Non-PEO NEO Compensation Actually Paid and Net Income
The following chart sets forth the relationship between Compensation Actually Paid to our PEOs, the average of Compensation Actually Paid to our Non-PEO NEOs, and our Net Income during the three most recently completed fiscal years.
| 2023 | 2024 | 2025 | ||
| Mike Lawless | Charles Remsberg | Almog Adar | ||
| Jeannine Lynch | Jeannine Lynch | Jeannine Lynch |
| Year |
Summary Compensation Table Total for First PEO ($) |
Exclusion of Stock Awards for First PEO ($)(a) |
Inclusion of Equity Values for First PEO ($)(b) |
Compensation Actually Paid to First PEO ($) |
|||||||||||||
| 2025 | 798,201 | 0 | (43,167 | ) | 755,034 | ||||||||||||
| 2024 | 473,274 | 0 | (194,453 | ) | 278,821 | ||||||||||||
| 2023 | 888,683 | (167,714 | ) | 139,585 | 860,554 | ||||||||||||
| Year |
Summary Compensation Table Total for Second PEO ($) |
Exclusion of Stock Awards for Second PEO ($)(a) |
Inclusion of Equity Values for Second PEO ($)(b)
|
Compensation Actually Paid to Second PEO ($) |
|||||||||||||
| 2025 | 834,866 | (403,491 | ) | 189,406 | 620,781 | ||||||||||||
| Year |
Average Summary Compensation Table Total for Non-PEO NEOs ($) |
Average Exclusion of Stock Awards and Option Awards for Non-PEO NEOs ($)(a) |
Average Inclusion for Non-PEO NEOs ($)(b) |
Average Compensation Actually Paid to Non-PEO NEOs ($) |
|||||||||||||
| 2025 | 437,858 | (84,309 | ) | 39,595 | 393,145 | ||||||||||||
| 2024 | 367,002 | 0 | (112,908 | ) | 254,094 | ||||||||||||
| 2023 | 532,038 | (90,750 | ) | 119,722 | 561,010 | ||||||||||||
(b) The amounts reported in this column include the addition (or subtraction, as applicable) of the following: (i) the year-end fair value of any equity awards granted in the applicable year that are outstanding and unvested as of the end of the year; (ii) the amount of change as of the end of the applicable year (from the end of the prior fiscal year) in fair value of any awards granted in prior years that are outstanding and unvested as of the end of the applicable year; (iii) for awards that are granted and vest in same applicable year, the fair value as of the vesting date; (iv) for awards granted in prior years that vest in the applicable year, the amount equal to the change as of the vesting date (from the end of the prior fiscal year) in fair value; (v) for awards granted in prior years that are determined to fail to meet the applicable vesting conditions during the applicable year, a deduction for the amount equal to the fair value at the end of the prior fiscal year; and (vi) the dollar value of any dividends or other earnings paid on stock or option awards in the applicable year prior to the vesting date that are not otherwise reflected in the fair value of such award or included in any other component of total compensation for the applicable year. The valuation assumptions used to calculate fair values did not materially differ from those disclosed at the time of grant. The amounts deducted or added in calculating the equity award adjustments are as follows:
| Year | Year-End Fair Value of Equity Awards Granted During
Year That Remained Unvested as of Last Day of Year for First PEO ($) |
Change in Fair Value from Last Day of Prior Year
to Last Day of Year of Unvested Equity Awards for First PEO ($) |
Vesting-Date Fair Value of Equity Awards Granted
During Year that Vested During Year for First PEO ($) |
Change in Fair Value from Last Day of Prior Year
to Vesting Date of Unvested Equity Awards that Vested During Year for First PEO ($) |
Fair Value at Last Day of Prior Year of Equity Awards
Forfeited During Year for First PEO ($) |
Total - Inclusion of Equity Values for First PEO ($) |
|||||||||||||||||||
| 2025 | 0 | (24,714 | ) | 0 | (18,453 | ) | 0 | (43,167 | ) | ||||||||||||||||
| 2024 | 0 | (152,530 | ) |
— |
(41,923 | ) |
— |
(194,453 | ) | ||||||||||||||||
| 2023 | 155,540 | 5,280 |
— |
(21,235 | ) |
— |
139,585 | ||||||||||||||||||
| Year | Year-End Fair Value of Equity Awards Granted During
Year That Remained Unvested as of Last Day of Year for Second PEO ($) |
Change in Fair Value from Last Day of Prior Year
to Last Day of Year of Unvested Equity Awards for Second PEO ($) |
Vesting-Date Fair Value of Equity Awards Granted
During Year that Vested During Year for Second PEO ($) |
Change in Fair Value from Last Day of Prior Year
to Vesting Date of Unvested Equity Awards that Vested During Year for Second PEO ($) |
Fair Value at Last Day of Prior Year of Equity Awards
Forfeited During Year for Second PEO ($) |
Total - Inclusion of Equity Values for Second PEO ($) |
|||||||||||||||||||
| 2025 | 189,406 | 0 | 0 | 0 | 0 | 189,406 | |||||||||||||||||||
| Year | Average Year-End Fair Value of Equity Awards Granted
During Year That Remained Unvested as of Last Day of Year for Non-PEO NEOs ($) |
Average Change in Fair Value from Last Day of Prior
Year to Last Day of Year of Unvested Equity Awards for Non-PEO NEOs ($) |
Average Vesting-Date Fair Value of Equity Awards
Granted During Year that Vested During Year for Non-PEO NEOs ($) |
Average Change in Fair Value from Last Day of Prior
Year to Vesting Date of Unvested Equity Awards that Vested During Year for Non-PEO NEOs ($) |
Average Fair Value at Last Day of Prior Year of Equity
Awards Forfeited During Year for Non-PEO NEOs ($) |
Total - Average Inclusion of Equity Values for Non-PEO NEOs ($) |
|||||||||||||||||||
| 2025 | 67,457 | (15,705 | ) | 0 | (12,157 | ) | 0 | 39,595 | |||||||||||||||||
| 2024 | 0 | (93,675 | ) |
— |
(19,233 | ) |
— |
(112,908 | ) | ||||||||||||||||
| 2023 | 117,627 | 2,942 |
— |
(847 | ) |
— |
119,722 | ||||||||||||||||||
Relationship Between PEOs and Non-PEO NEO Compensation Actually Paid and Company Total Shareholder Return (“TSR”)
The following chart sets forth the relationship between Compensation Actually Paid to our PEOs, the average of Compensation Actually Paid to our Non-PEO NEOs, and the Company’s cumulative TSR over the three most recently completed fiscal years.
Relationship Between PEOs and Non-PEO NEO Compensation Actually Paid and Net Income
The following chart sets forth the relationship between Compensation Actually Paid to our PEOs, the average of Compensation Actually Paid to our Non-PEO NEOs, and our Net Income during the three most recently completed fiscal years.
Employee Benefits and Perquisites
We currently maintain the Lifeward, Inc. 401(k) Plan, a defined contribution plan (the “401(k) Plan”), for the benefit of our employees, including our Named Executive Officers, who satisfy certain eligibility requirements. Our Named Executive Officers were eligible to participate in the 401(k) Plan on the same terms as our other full-time employees. We believe that providing a vehicle for retirement savings though our 401(k) Plan adds to the overall desirability of our executive compensation package and further incentivizes our employees, including our Named Executive Officers.
Currently, we do not view perquisites or other personal benefits as a significant component of our Previous Compensation Policy or Proposed Compensation Policy, as applicable.
Outstanding Equity Awards at 2025 Fiscal Year-End
The following table sets forth information concerning outstanding equity awards as of December 31, 2025, for each Named Executive Officer. This information reflects the number of ordinary shares of the Company after the 1-for-12 reverse share split of the ordinary shares effected by the Company on February 24, 2026.
| Option Awards | Stock Awards | |||||||||||||||||||||||||
| Name | Grant Date (1) | Number of Securities Underlying Unexercised Options Exercisable (#) | Number of Securities Underlying Unexercised Options Unexercisable (#) | Option Exercise Price ($) | Option Expiration Date | Number of Shares or Units of Stock that Have Not Vested (#) | Market Value of Shares or Units of Stock that Have Not Vested(2) ($) | |||||||||||||||||||
| Mark Grant | 6/2/2025 (3) | — | 33,333 | 14.70 | 6/2/2035 | — | — | |||||||||||||||||||
| Larry Jasinski | 6/27/2017 (4) | 59 | — | 4,410.00 | 3/31/2026 | — | — | |||||||||||||||||||
| 5/3/2018 (5) | 104 | — | 2,257.50 | 3/31/2026 | — | — | ||||||||||||||||||||
| 3/27/2019 (6) | 147 | — | 450.66 | 3/31/2026 | — | — | ||||||||||||||||||||
| Almog Adar | 8/2/2022 (7) | — | — | — | — | 297 | 2,055 | |||||||||||||||||||
| 6/30/2023 (8) | — | — | — | — | 744 | 5,148 | ||||||||||||||||||||
| 8/13/2025 (9) | — | 18,750 | 8.60 | 8/13/2035 | — | — | ||||||||||||||||||||
| Jeannine Lynch | 8/2/2022 (10) | — | — | — | — | 409 | 2,830 | |||||||||||||||||||
| 6/30/2023 (11) | — | — | — | — | 818 | 5,661 | ||||||||||||||||||||
| 11/11/2025 (12) | — | — | — | — | 4,166 | 28,829 | ||||||||||||||||||||
| (1) | Awards granted prior to 2025 were granted under the Company’s 2014 Equity Incentive Plan, as amended from time to time, and awards granted in 2025 were granted under the 2025 Plan. |
| (2) | The amount listed in this column represents the product of $6.92, which was the closing market price of the Company’s Ordinary Shares as of December 31, 2025, multiplied by the number of shares subject to the award. |
| (3) | Option awards vest with respect to 1/4th of the original number of Ordinary Shares subject thereto on each annual anniversary of June 2, commencing on June 2, 2026 and ending on June 2, 2029. |
| (4) | This award is fully vested. |
| (5) | This award is fully vested. |
| (6) | This award is fully vested. |
| (7) | 1/4th of the RSU award vests on an annual basis commencing on August 2, 2023, and ending on August 2, 2026. |
| (8) | 1/4th of the RSU award vests on an annual basis commencing on June 30, 2025, and ending on June 30, 2027. |
| (9) | Option awards vest with respect to 1/4th of the original number of Ordinary Shares subject thereto on each annual anniversary of August 13, commencing on August 13, 2026 and ending on August 13, 2029. |
| (10) | 1/4th of the RSU award vests on an annual basis commencing on August 2, 2023, and ending on August 2, 2026. |
| (11) | 1/4th of the RSU award vests on an annual basis commencing on June 30, 2025, and ending on June 30, 2027. |
| (12) | 1/4th of the RSU award vests on an annual basis commencing on December 11, 2026, and ending on December 11, 2029. |
| [1] | Assumes $100 was invested in the Company at market close on December 30, 2022 (the last trading day before the beginning of fiscal year 2023) through the end of the listed year. Historical stock performance is not necessarily indicative of future stock performance. |
| [2] | Larry Jasinski served as our PEO until June 30, 2025, serving as Chief Executive Officer through June 1, 2025 and as co-Chief Executive Officer from June 2, 2025 through June 30, 2025 (“First PEO”). Mark Grant has served as our PEO since June 2, 2025, serving as co-Chief Executive Officer through June 30, 2025 and as Chief Executive Officer since July 1, 2025 (“Second PEO”). The individuals comprising the Non-PEO NEOs for each year presented are listed below. |
| [3] | Compensation Actually Paid reflects the exclusions and inclusions of certain amounts for the PEOs and the Non-PEO NEOs as set forth below. Equity values are calculated in accordance with FASB ASC Topic 718. Amounts in the Exclusion of Stock Awards and Option Awards column are the totals from the Stock Awards and Option Awards columns set forth in the Summary Compensation Table. |
| [4] | The amounts shown for “Compensation Actually Paid” have been calculated in accordance with Item 402(v) of Regulation S-K and do not reflect compensation actually earned, realized, or received by the PEOs or the Non-PEO NEOs. The dollar amounts reported are the amounts of total compensation reported for our PEOs and Non-PEO NEOs for each corresponding year in the “Total” column of the Summary Compensation Table, with certain adjustments as described in footnote 3 below. |
| [5] | The amounts reported in this column represent the total of the amounts reported in the “Stock Awards” and “Option Awards” columns in the Summary Compensation Table for the applicable year. |
| [6] | The amounts reported in this column include the addition (or subtraction, as applicable) of the following: (i) the year-end fair value of any equity awards granted in the applicable year that are outstanding and unvested as of the end of the year; (ii) the amount of change as of the end of the applicable year (from the end of the prior fiscal year) in fair value of any awards granted in prior years that are outstanding and unvested as of the end of the applicable year; (iii) for awards that are granted and vest in same applicable year, the fair value as of the vesting date; (iv) for awards granted in prior years that vest in the applicable year, the amount equal to the change as of the vesting date (from the end of the prior fiscal year) in fair value; (v) for awards granted in prior years that are determined to fail to meet the applicable vesting conditions during the applicable year, a deduction for the amount equal to the fair value at the end of the prior fiscal year; and (vi) the dollar value of any dividends or other earnings paid on stock or option awards in the applicable year prior to the vesting date that are not otherwise reflected in the fair value of such award or included in any other component of total compensation for the applicable year. The valuation assumptions used to calculate fair values did not materially differ from those disclosed at the time of grant. |
| [7] | Larry Jasinski was our PEO for each year presented. The individuals comprising the Non-PEO NEOs for each year presented are listed below. |