Exhibit 99.1
THE AI INFRASTRUCTURE COMPANY 1 Data Center and Cloud Solutions for AI Workloads Investor Overview September 2026
2 This presentation by WhiteFiber, Inc. (“WhiteFiber,” the “Company,” “we,” “our,” and “us”) is provided for informational purposes only so that you can familiarize yourself with the Company. Although the Company believes the information contained herein is accurate in all material respects, the Company does not make any representation or warranty, either express or implied, as to the accuracy, completeness or reliability of the information contained in this presentation. You should not construe the contents of this presentation or other information we may provide as accounting, legal or tax advice or investment recommendations. Forward - Looking Statements This presentation may include express or implied forward - looking statements about us and our industry that involve substantial risks and uncertainties. All statements other than statements of historical facts contained in this presentation, including statements regarding our strategy, future financial condition, future operations, projected costs, prospects, plans, objectives of management, and expected market growth, are forward - looking statements. In some cases, you can identify forward - looking statements by words such as “may,” “will,” “shall,” “should,” “expects,” “plans,” “anticipates,” “could,” “intends,” “target,” “projects,” “contemplates,” “believes,” “estimates,” “predicts,” “potential,” “goal,” “objective,” “seeks,” or “continue” or the negative of these words or other similar terms or expressions that concern our expectations, strategy, plans, or intentions. Forward - looking statements contained in this presentation include, but are not limited to, statements about our ability to scale our business and acquire new data centers; the implementation of our business model and strategic plans; our ability to commercialize, manage and grow our business by acquiring new customers; our ability to compete with other companies engaged in our industry; our expectation about market trends; estimates of our expenses, future revenue, capital requirements, needs for additional financing and our ability to obtain additional capital; general economic, industry, and market conditions; and our future financial performance. You should not rely on forward - looking statements as predictions of future events. We have based the forward - looking statements contained in this presentation primarily on our current expectations, estimates, forecasts, and projections about future events and trends that we believe may affect our business, financial condition, results of operations, and prospects. Although we believe that we have a reasonable basis for each forward - looking statement contained in this presentation, we cannot guarantee that the future results, levels of activity, performance, or events and circumstances reflected in the forward - looking statements will be achieved or occur at all. The outcome of the events described in these forward - looking statements is subject to risks, uncertainties, and other factors. Moreover, we operate in a very competitive and rapidly changing environment. New risks and uncertainties emerge from time to time, and it is not possible for us to predict all risks and uncertainties that could have an impact on the forward - looking statements contained in this presentation. These forward - looking statements are subject to a number of risks and uncertainties, as set forth in the section entitled “Risk Factors” and “Cautionary Statement Regarding Forward - Looking Statements and Risk Factors Summary” in our Annual Report on Form 10 - K for the year ended December 31, 2025, filed with the U.S. Securities and Exchange Commission (the “SEC”) on March 26, 2026, our Quarterly Report on Form 10 - Q for the quarter ended June 30, 2026 filed with the SEC on August 12, 2026 and other factors identified in the documents that we have filed, or will file, with the SEC. If any of these risks materialize or our assumptions prove incorrect, actual results could differ materially from the results implied by these forward - looking statements. The risks and uncertainties above are not exhaustive, and there may be additional risks that we do not presently know or that we currently believe are immaterial that could also cause actual results to differ from those contained in the forward - looking statements. The forward - looking statements made in this presentation relate only to events as of the date on which the statements are made. We undertake no obligation to update any forward - looking statements made in this presentation to reflect events or circumstances after the date of this presentation or to reflect new information or the occurrence of unanticipated events, except as required by law. We may not actually achieve the plans, intentions, or expectations disclosed in our forward - looking statements, and you should not place undue reliance on our forward - looking statements. Use of Projections This presentation contains projected financial information with respect to WhiteFiber, including the results of our investments and build - out costs, and the financial information included in WhiteFiber's long - term target operating model and illustrative unit economics. Such projected financial information constitutes forward - looking information and is for illustrative purposes only and should not be relied upon as necessarily being indicative of future results. The assumptions and estimates underlying such projected financial information are inherently uncertain and are subject to a wide variety of significant business, economic, competitive and other risks and uncertainties that could cause actual results to differ materially from those contained in the projected financial information. See “Forward - Looking Statements” above. Actual results may differ materially from the results contemplated by the projected financial information contained in this presentation, and the inclusion of such information in this presentation should not be regarded as a representation by any person that the results reflected in such projections will be achieved. The independent registered public accounting firm of WhiteFiber has not audited, reviewed, compiled, or performed any procedures with respect to the projections for the purpose of their inclusion in this presentation, and accordingly, it has not expressed an opinion or provided any other form of assurance with respect thereto for the purpose of this presentation. Since the financial projections cover multiple years, such information by its nature becomes less reliable with each successive year. Financial Information; Non - GAAP Measures Some of the historical financial information contained in this presentation is unaudited and does not conform to Regulation S - X. Accordingly, such information and data may not be included in, may be adjusted in or may be presented differently in any future filing with the SEC. In addition, this presentation also includes financial information, such as EBITDA and Adjusted EBITDA, that has not been prepared in accordance with the accounting principles generally accepted in the United States (“GAAP”). WhiteFiber believes these non - GAAP financial measures, in addition to corresponding GAAP measures, are useful to investors by providing meaningful information about operational efficiency compared to its peers by excluding the impacts of differences in tax jurisdictions and structures, debt levels and capital investment. Management believes Adjusted EBITDA is a useful performance measure because it allows for an effective evaluation of the Company’s operating performance by adjusting EBITDA for certain non - cash and/or non - recurring items that do not reflect ongoing strategic business operations, as reflected in the reconciliation included in the Appendix. Rating agencies and investors will also use EBITDA and Adjusted EBITDA to calculate WhiteFiber’s leverage as a multiple of EBITDA and Adjusted EBITDA. WhiteFiber’s management uses these non - GAAP financial measures in conjunction with GAAP results when evaluating its operating results internally and determining the appropriate method of funding operations of the Company. EBITDA is calculated by adding back income taxes, interest expense and depreciation and amortization expense to net income. For the periods presented, Adjusted EBITDA is calculated as EBITDA adjusted for net gain or loss from disposal of property, plant and equipment, impairment of capitalized software assets, and share - based compensation expense, as reflected in the reconciliation included in the Appendix. These non - GAAP financial measures should not be considered as alternatives to, or more meaningful than, GAAP financial measures such as net income and are intended to be helpful supplemental financial measures for investors’ understanding of WhiteFiber’s operating performance. WhiteFiber’s non - GAAP financial measures are not standardized; therefore, it may not be possible to compare these financial measures with other companies’ EBITDA and Adjusted EBITDA measures having the same or similar names. For reconciliations of our non - GAAP financial measures to the most directly comparable GAAP measure, see the Appendix. Industry and Market Data This presentation also contains market data and industry forecasts from certain third - party sources of information, including publicly available industry publications and subscription - based publications. None of such data and forecasts was prepared specifically for us. No third - party source that has prepared such information has reviewed or passed upon our use of the information in this presentation, and no third - party source is quoted or summarized in this presentation as an expert. We believe these data are reliable, but we have not independently verified the accuracy of this information and make no representation or warranty, either express or implied, as to the accuracy, completeness or reliability of the information contained in this presentation. DISCLAIMER
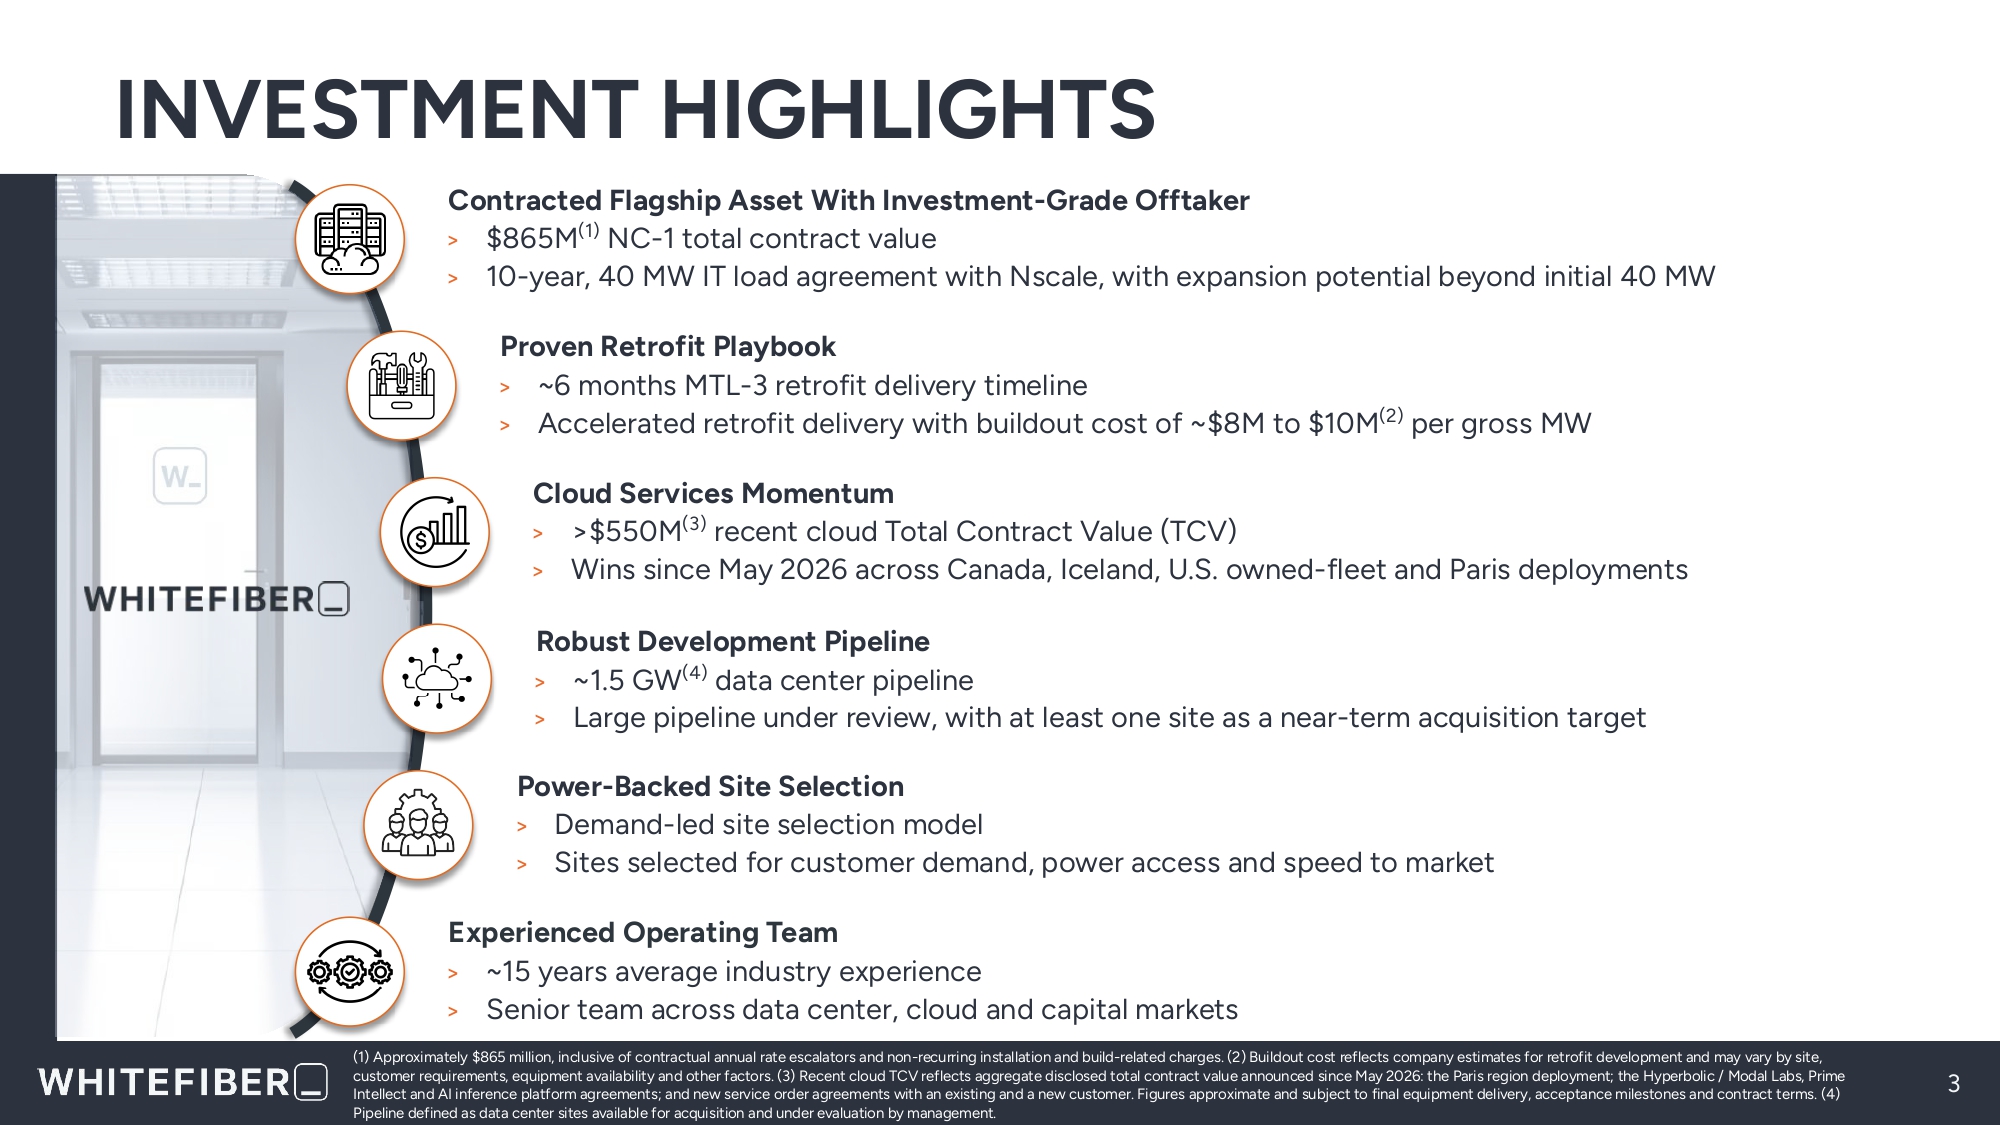
INVESTMENT HIGHLIGHTS 3 (1) Approximately $865 million, inclusive of contractual annual rate escalators and non - recurring installation and build - related charges. (2) Buildout cost reflects company estimates for retrofit development and may vary by site, customer requirements, equipment availability and other factors. (3) Recent cloud TCV reflects aggregate disclosed total contract value announced since May 2026: the Paris region deployment; the Hyperbolic / Modal Labs, Prime Intellect and AI inference platform agreements; and new service order agreements with an existing and a new customer. Figures approximate and subject to final equipment delivery, acceptance milestones and contract terms. (4) Pipeline defined as data center sites available for acquisition and under evaluation by management. Contracted Flagship Asset With Investment - Grade Offtaker > $865M (1) NC - 1 total contract value > 10 - year, 40 MW IT load agreement with Nscale, with expansion potential beyond initial 40 MW Proven Retrofit Playbook > ~6 months MTL - 3 retrofit delivery timeline > Accelerated retrofit delivery with buildout cost of ~$8M to $10M (2) per gross MW Cloud Services Momentum > >$550M (3) recent cloud Total Contract Value (TCV) > Wins since May 2026 across Canada, Iceland, U.S. owned - fleet and Paris deployments Robust Development Pipeline > ~1.5 GW (4) data center pipeline > Large pipeline under review, with at least one site as a near - term acquisition target Power - Backed Site Selection > Demand - led site selection model > Sites selected for customer demand, power access and speed to market Experienced Operating Team > ~15 years average industry experience > Senior team across data center, cloud and capital markets
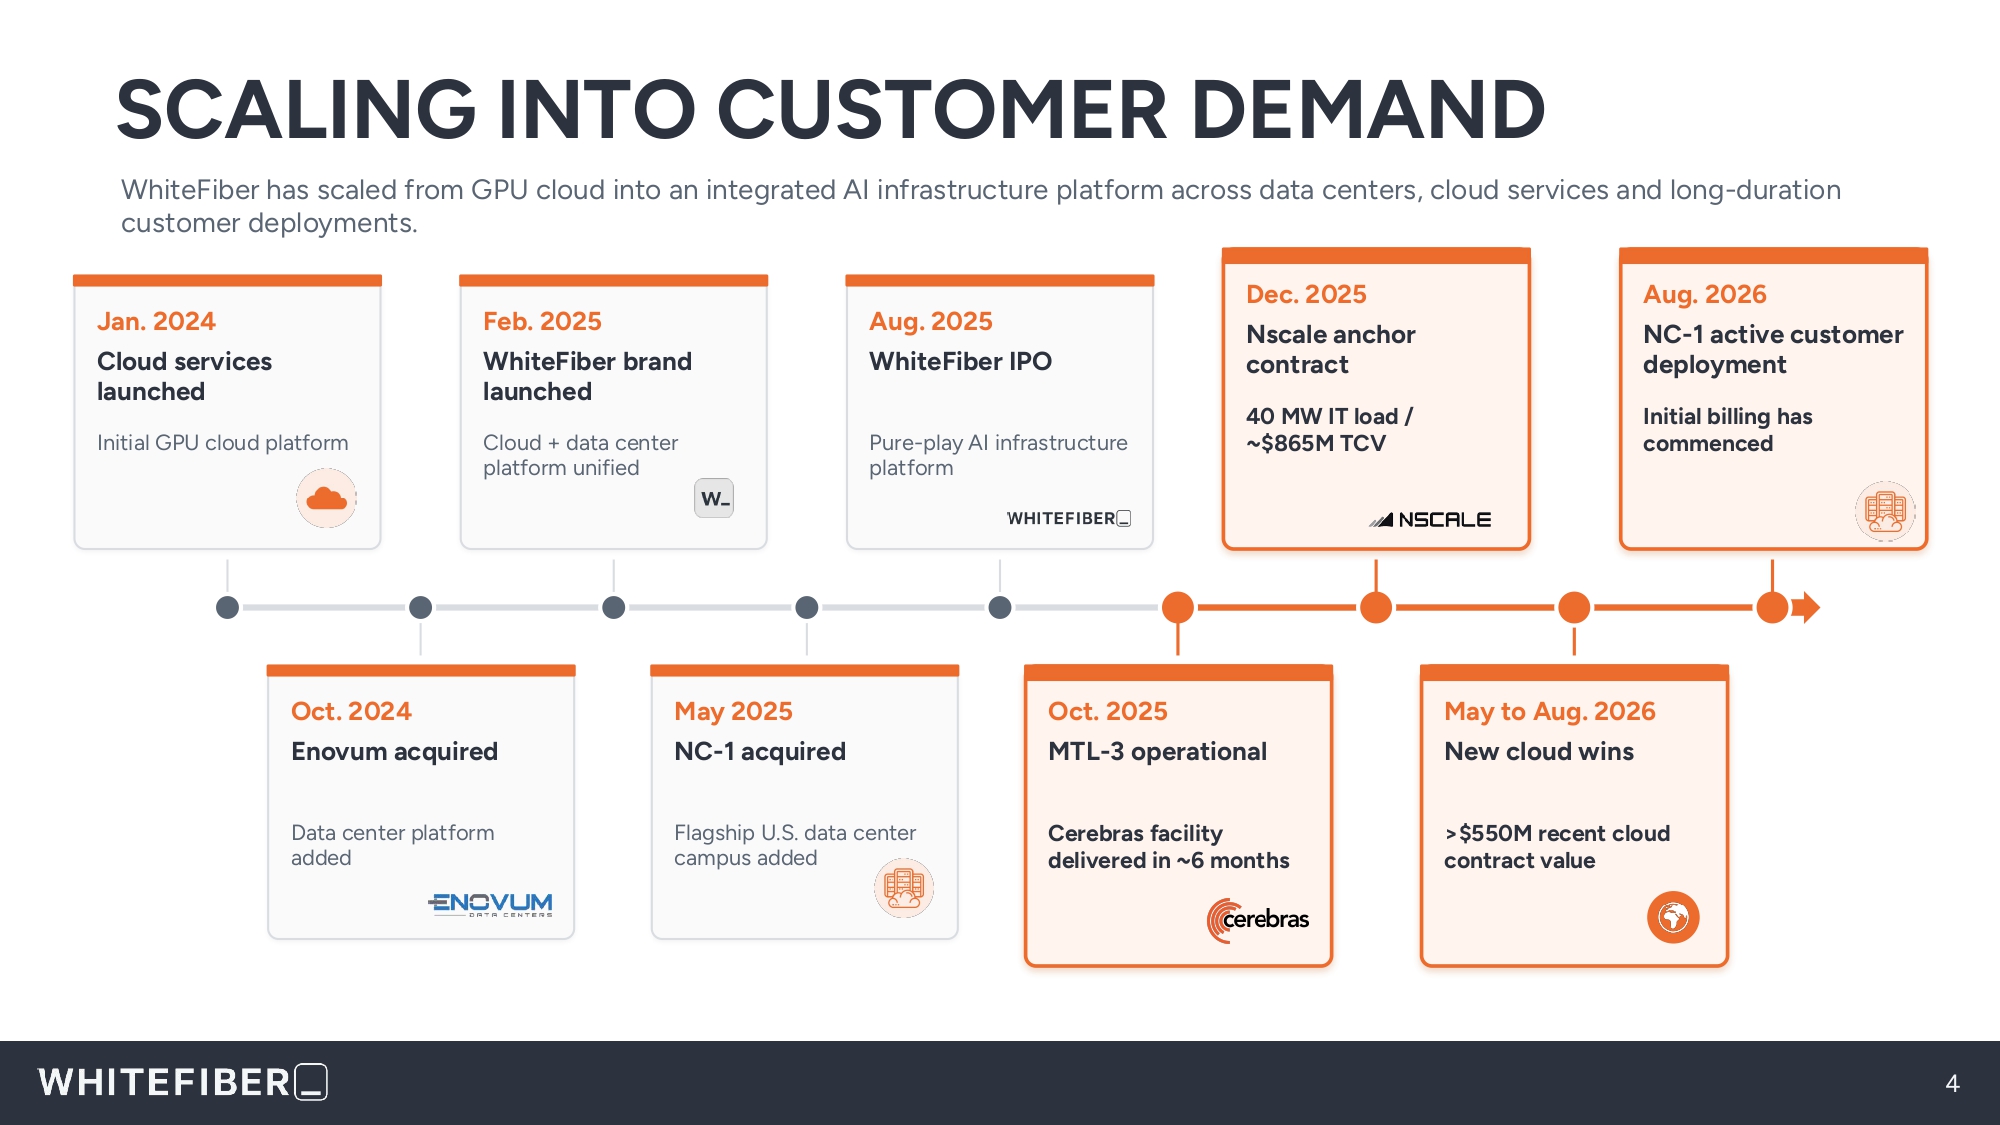
SCALING INTO CUSTOMER DEMAND WhiteFiber has scaled from GPU cloud into an integrated AI infrastructure platform across data centers, cloud services and long - duration customer deployments. Jan. 2024 Cloud services launched Initial GPU cloud platform Oct. 2024 Enovum acquired Data center platform added Feb. 2025 WhiteFiber brand launched Cloud + data center platform unified May 2025 NC - 1 acquired Flagship U.S. data center campus added Aug. 2025 WhiteFiber IPO Pure - play AI infrastructure platform Oct. 2025 MTL - 3 operational Cerebras facility delivered in ~6 months Dec. 2025 Nscale anchor contract 40 MW IT load / ~$865M TCV May to Aug. 2026 New cloud wins >$550M recent cloud contract value Aug. 2026 NC - 1 active customer deployment Initial billing has commenced 4
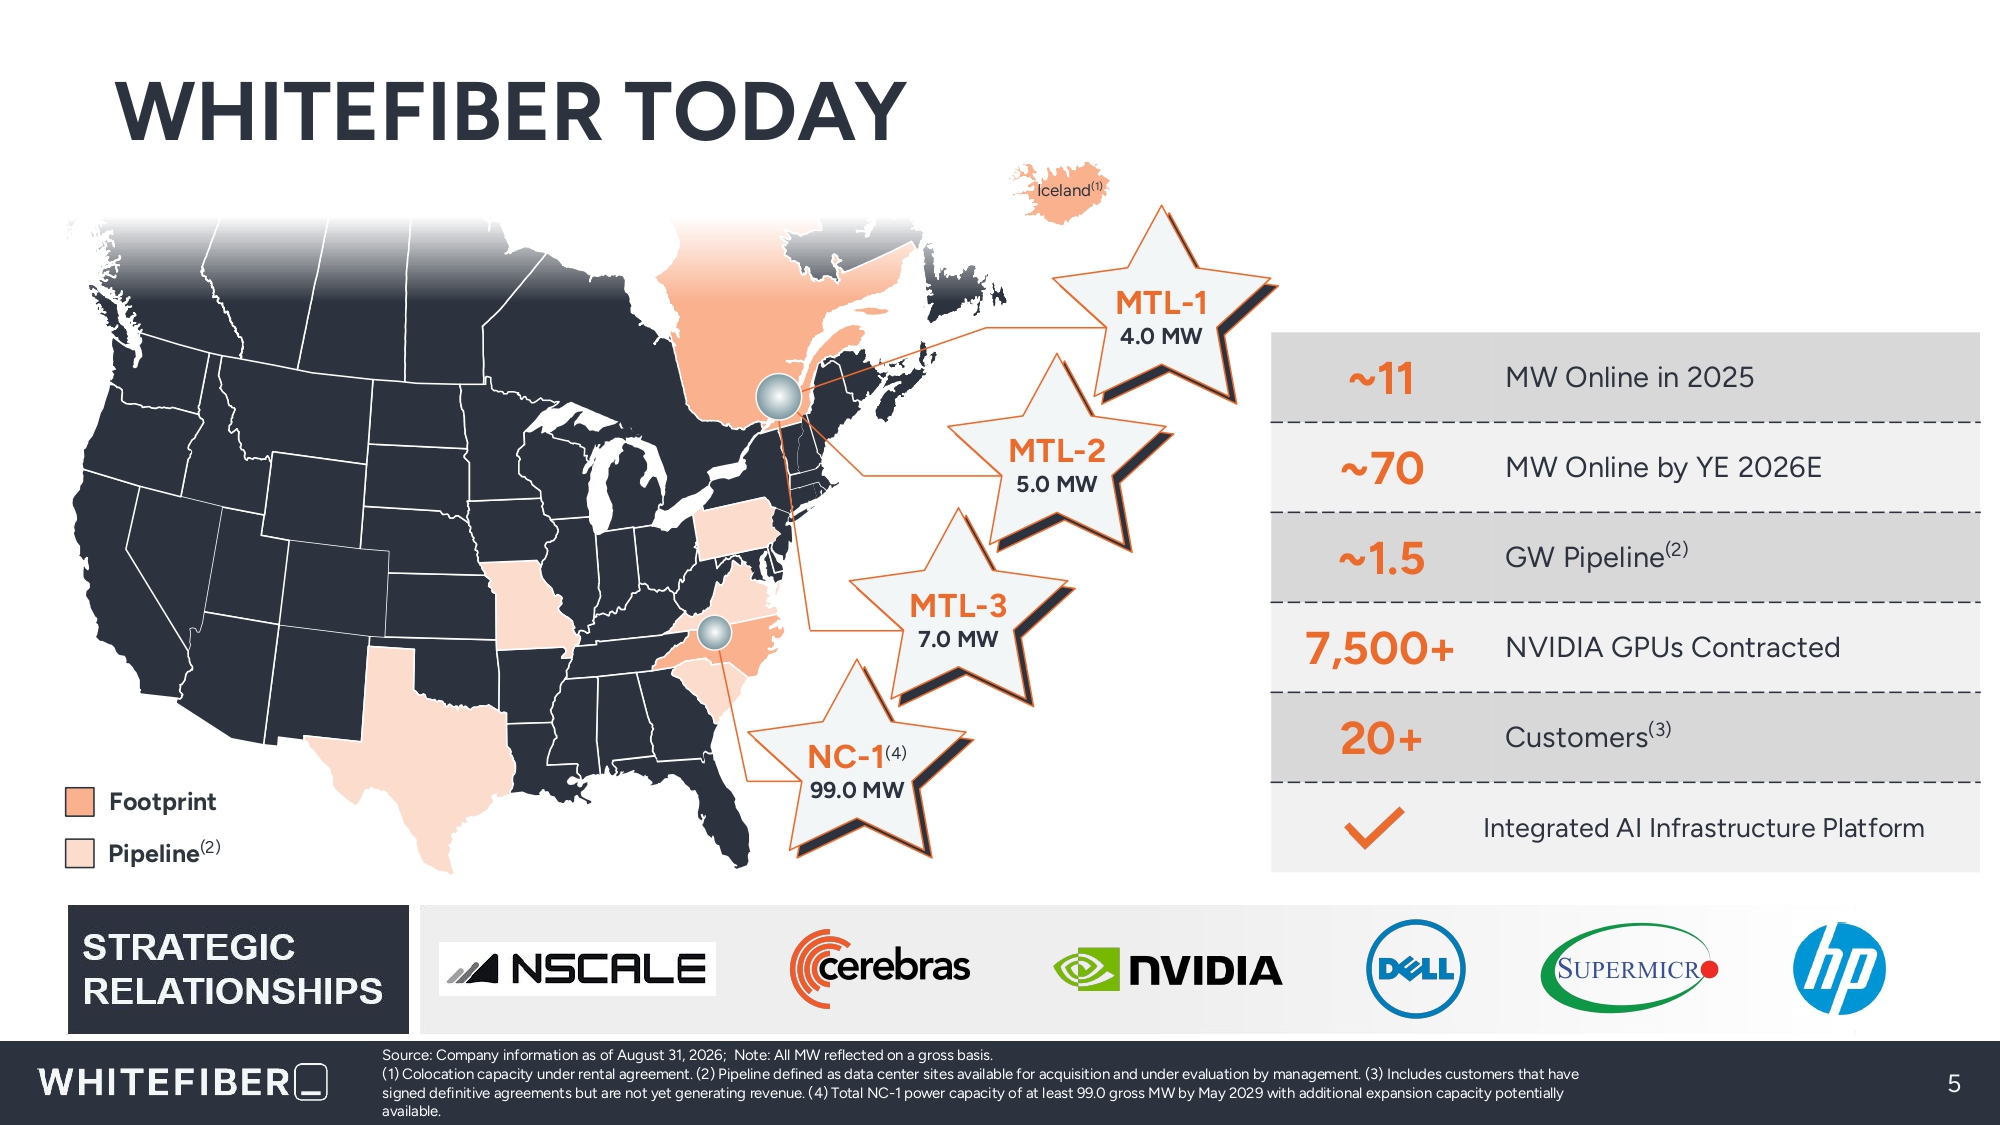
5 Source: Company information as of August 31, 2026; Note: All MW reflected on a gross basis. (1) Colocation capacity under rental agreement. (2) Pipeline defined as data center sites available for acquisition and under evaluation by management. (3) Includes customers that have signed definitive agreements but are not yet generating revenue. (4) Total NC - 1 power capacity of at least 99.0 gross MW by May 2029 with additional expansion capacity potentially available. MTL - 1 4.0 MW MTL - 3 7.0 MW NC - 1 (4) 99.0 MW Footprint Pipeline (2) MTL - 2 5.0 MW Iceland (1) WHITEFIBER TODAY MW Online in 2025 ~11 MW Online by YE 2026E ~70 GW Pipeline (2) ~1.5 NVIDIA GPUs Contracted 7,500+ Customers (3) 20+ Integrated AI Infrastructure Platform
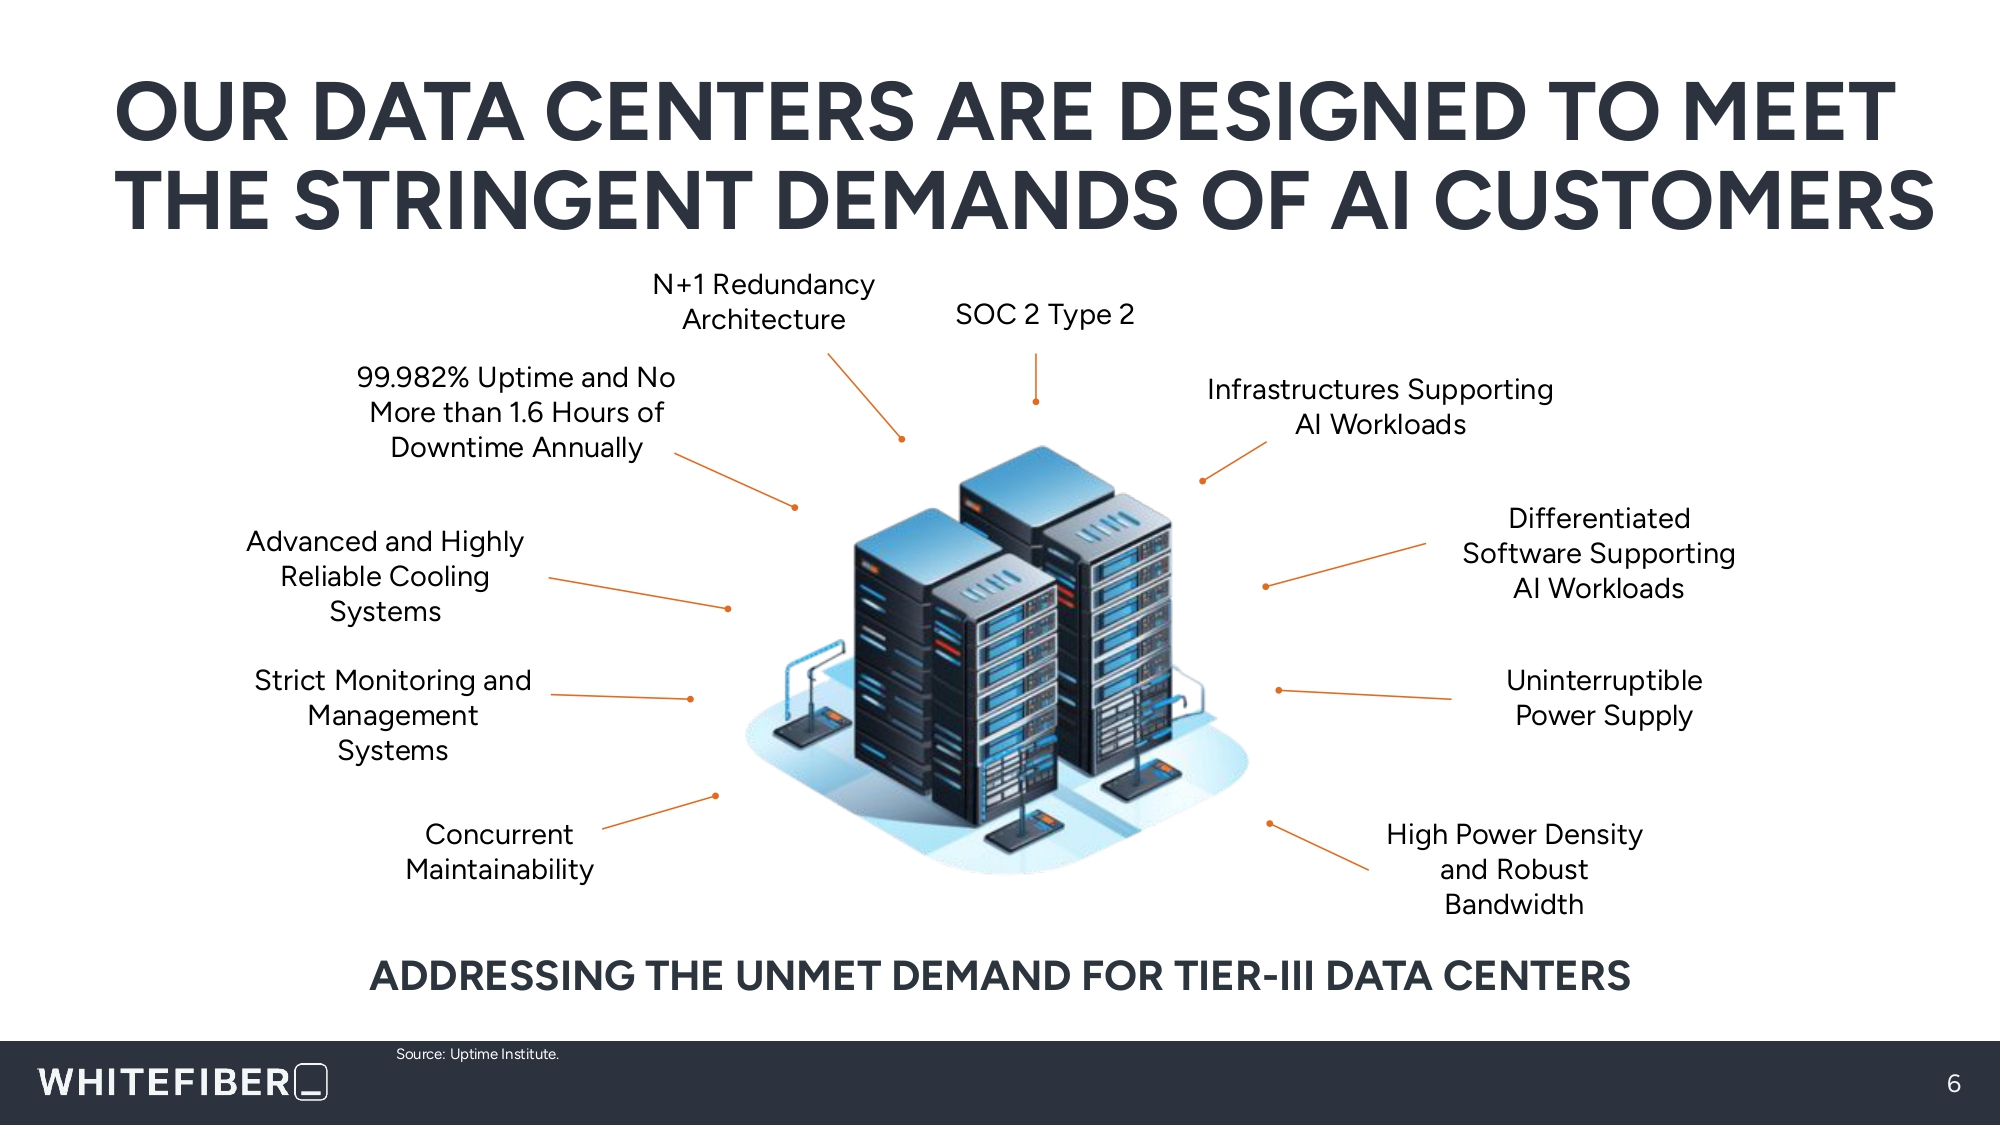
OUR DATA CENTERS ARE DESIGNED TO MEET THE STRINGENT DEMANDS OF AI CUSTOMERS 6 Source: Uptime Institute. High Power Density and Robust Bandwidth Concurrent Maintainability 99.982% Uptime and No More than 1.6 Hours of Downtime Annually Infrastructures Supporting AI Workloads Differentiated Software Supporting AI Workloads Advanced and Highly Reliable Cooling Systems Uninterruptible Power Supply Strict Monitoring and Management Systems N+1 Redundancy Architecture ADDRESSING THE UNMET DEMAND FOR TIER - III DATA CENTERS SOC 2 Type 2
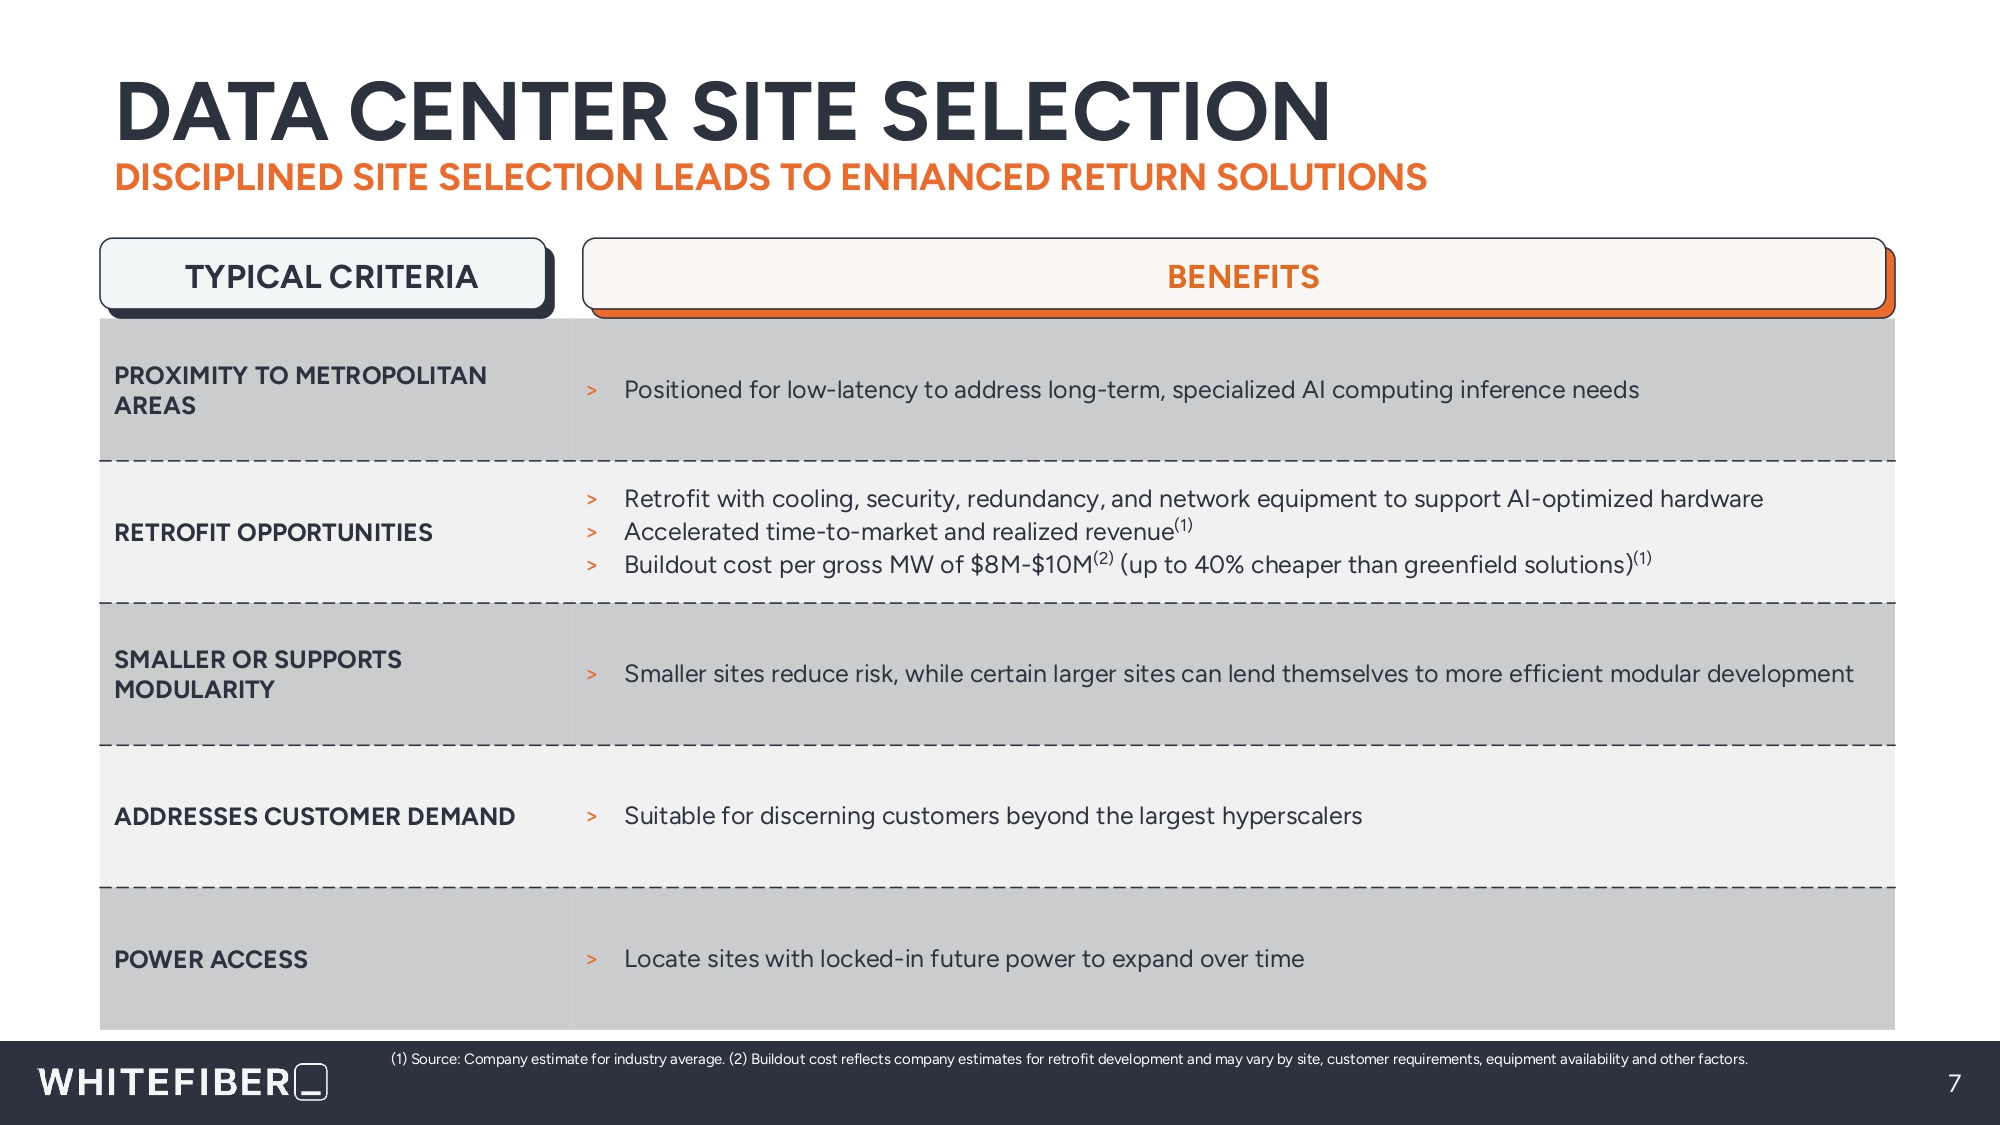
DATA CENTER SITE SELECTION DISCIPLINED SITE SELECTION LEADS TO ENHANCED RETURN SOLUTIONS 7 > Positioned for low - latency to address long - term, specialized AI computing inference needs PROXIMITY TO METROPOLITAN AREAS > Retrofit with cooling, security, redundancy, and network equipment to support AI - optimized hardware > Accelerated time - to - market and realized revenue (1) > Buildout cost per gross MW of $8M - $10M (2) (up to 40% cheaper than greenfield solutions) (1) RETROFIT OPPORTUNITIES > Smaller sites reduce risk, while certain larger sites can lend themselves to more efficient modular development SMALLER OR SUPPORTS MODULARITY > Suitable for discerning customers beyond the largest hyperscalers ADDRESSES CUSTOMER DEMAND > Locate sites with locked - in future power to expand over time POWER ACCESS TYPICAL CRITERIA BENEFITS (1) Source: Company estimate for industry average. (2) Buildout cost reflects company estimates for retrofit development and may vary by site, customer requirements, equipment availability and other factors.
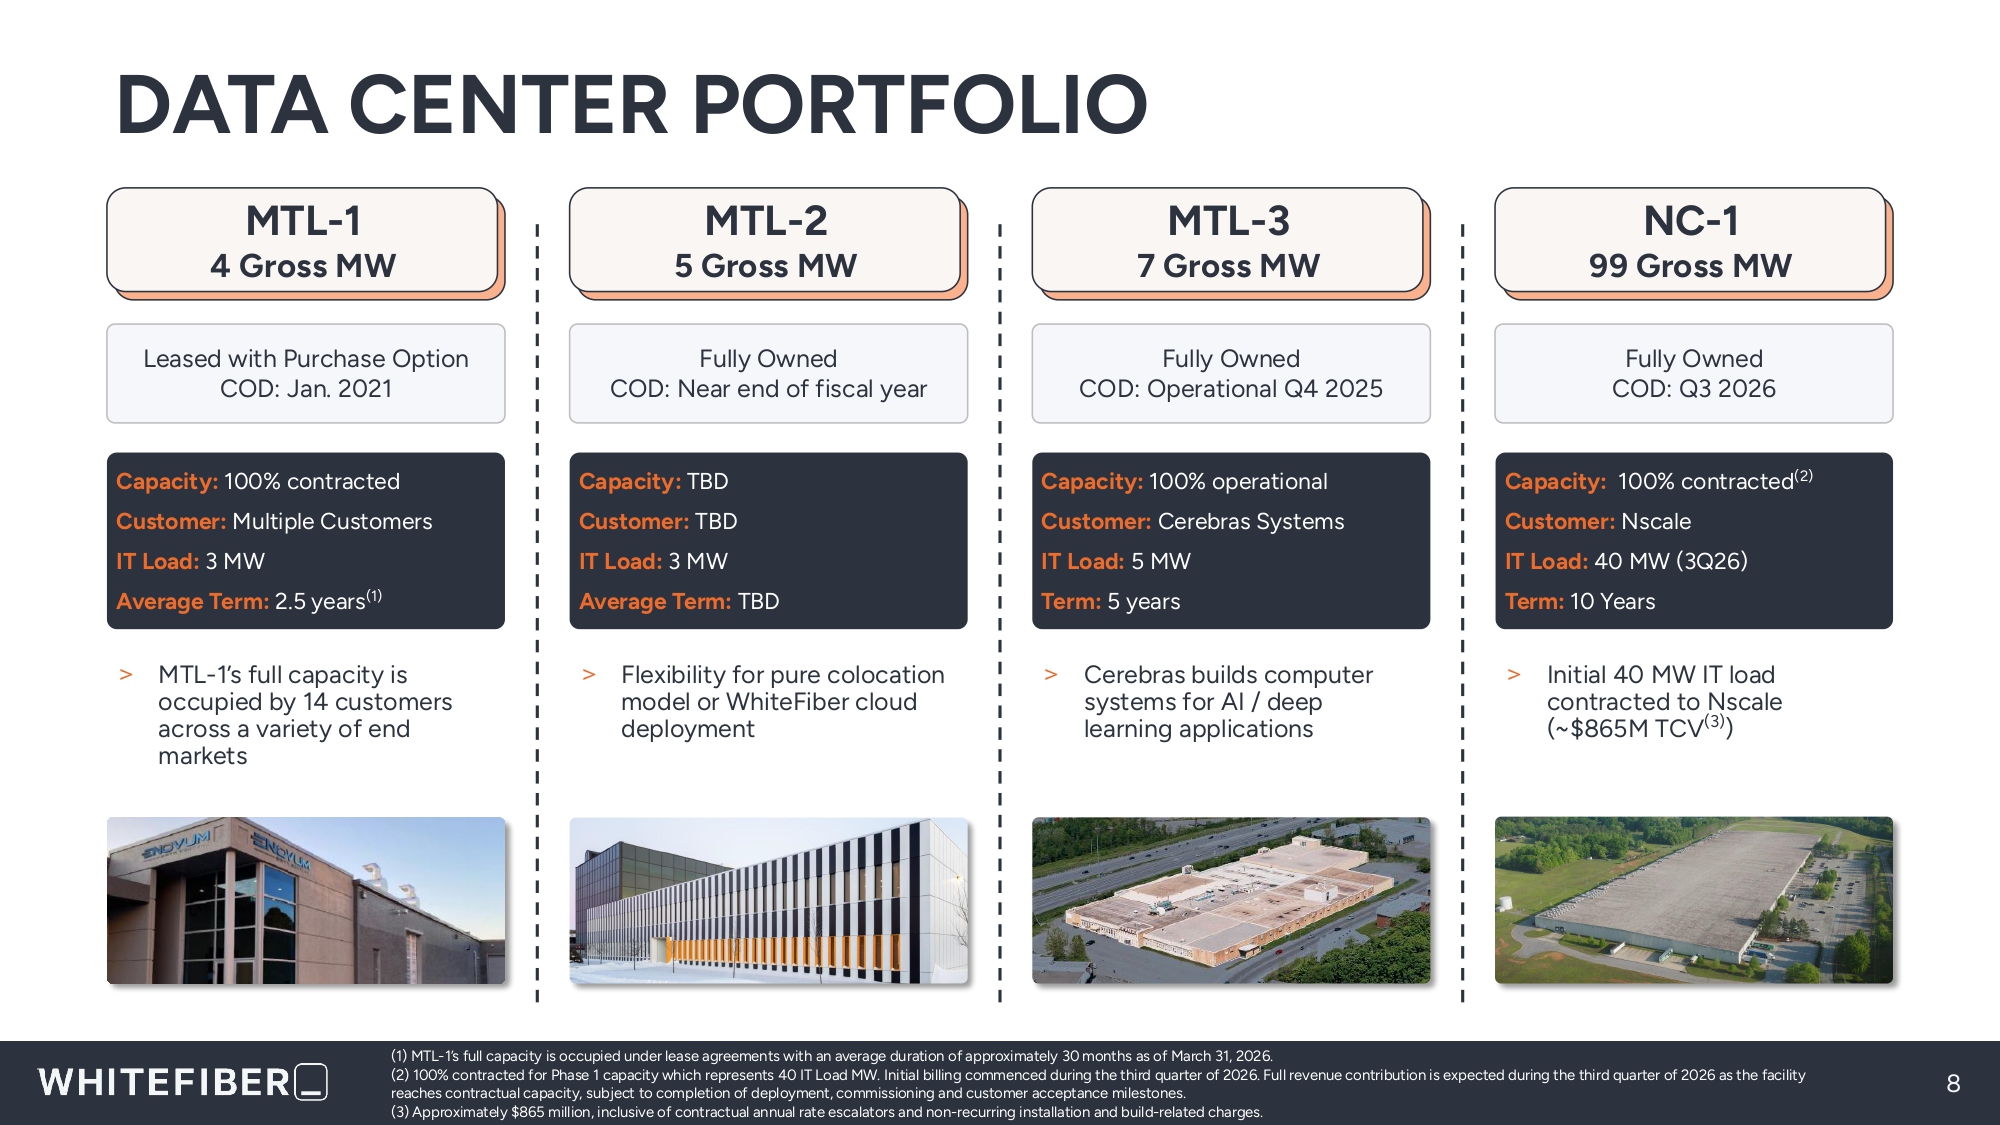
8 (1) MTL - 1’s full capacity is occupied under lease agreements with an average duration of approximately 30 months as of March 31, 2026. (2) 100% contracted for Phase 1 capacity which represents 40 IT Load MW. Initial billing commenced during the third quarter of 2026. Full revenue contribution is expected during the third quarter of 2026 as the facility reaches contractual capacity, subject to completion of deployment, commissioning and customer acceptance milestones. (3) Approximately $865 million, inclusive of contractual annual rate escalators and non - recurring installation and build - related charges. DATA CENTER PORTFOLIO MTL - 2 5 Gross MW Capacity: TBD Customer: TBD IT Load: 3 MW Average Term: TBD > Flexibility for pure colocation model or WhiteFiber cloud deployment MTL - 3 7 Gross MW Capacity: 100% operational Customer: Cerebras Systems IT Load: 5 MW Term: 5 years > Cerebras builds computer systems for AI / deep learning applications NC - 1 99 Gross MW Capacity: 100% contracted (2) Customer: Nscale IT Load: 40 MW (3Q26) Term: 10 Years > Initial 40 MW IT load contracted to Nscale (~ $ 865 M TCV ( 3 ) ) MTL - 1 4 Gross MW Fully Owned COD: Near end of fiscal year Fully Owned COD: Operational Q4 2025 Fully Owned COD: Q3 2026 Leased with Purchase Option COD: Jan. 2021 Capacity: 100% contracted Customer: Multiple Customers IT Load: 3 MW Average Term: 2.5 years (1) > MTL - 1’s full capacity is occupied by 14 customers across a variety of end markets
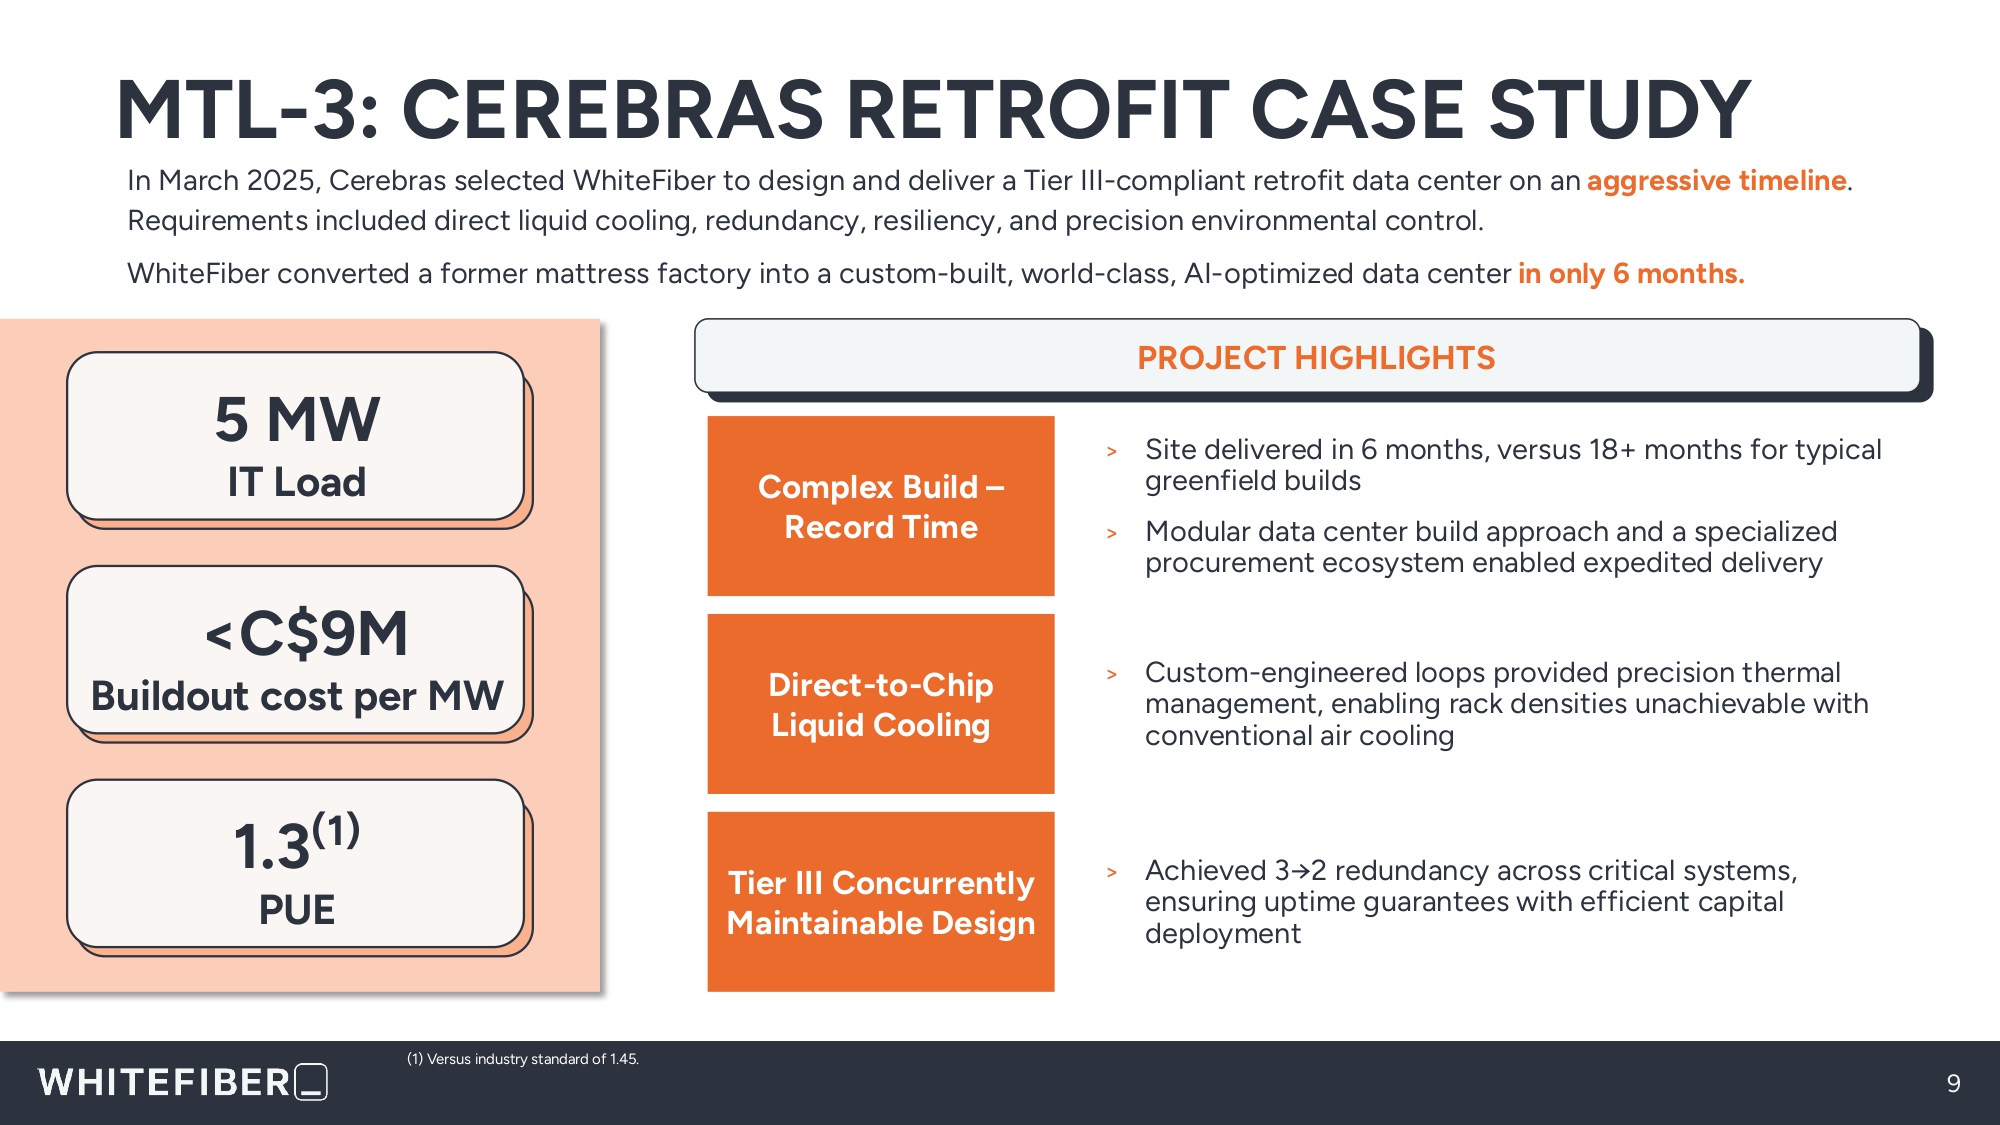
MTL - 3: CEREBRAS RETROFIT CASE STUDY 9 (1) Versus industry standard of 1.45. 5 MW IT Load <C$9M Buildout cost per MW 1.3 (1) PUE PROJECT HIGHLIGHTS > Site delivered in 6 months, versus 18+ months for typical greenfield builds > Modular data center build approach and a specialized procurement ecosystem enabled expedited delivery Complex Build – Record Time Direct - to - Chip Liquid Cooling > Custom - engineered loops provided precision thermal management, enabling rack densities unachievable with conventional air cooling Tier III Concurrently Maintainable Design > Achieved 3→2 redundancy across critical systems, ensuring uptime guarantees with efficient capital deployment In March 2025, Cerebras selected WhiteFiber to design and deliver a Tier III - compliant retrofit data center on an aggressive timeline . Requirements included direct liquid cooling, redundancy, resiliency, and precision environmental control. WhiteFiber converted a former mattress factory into a custom - built, world - class, AI - optimized data center in only 6 months.
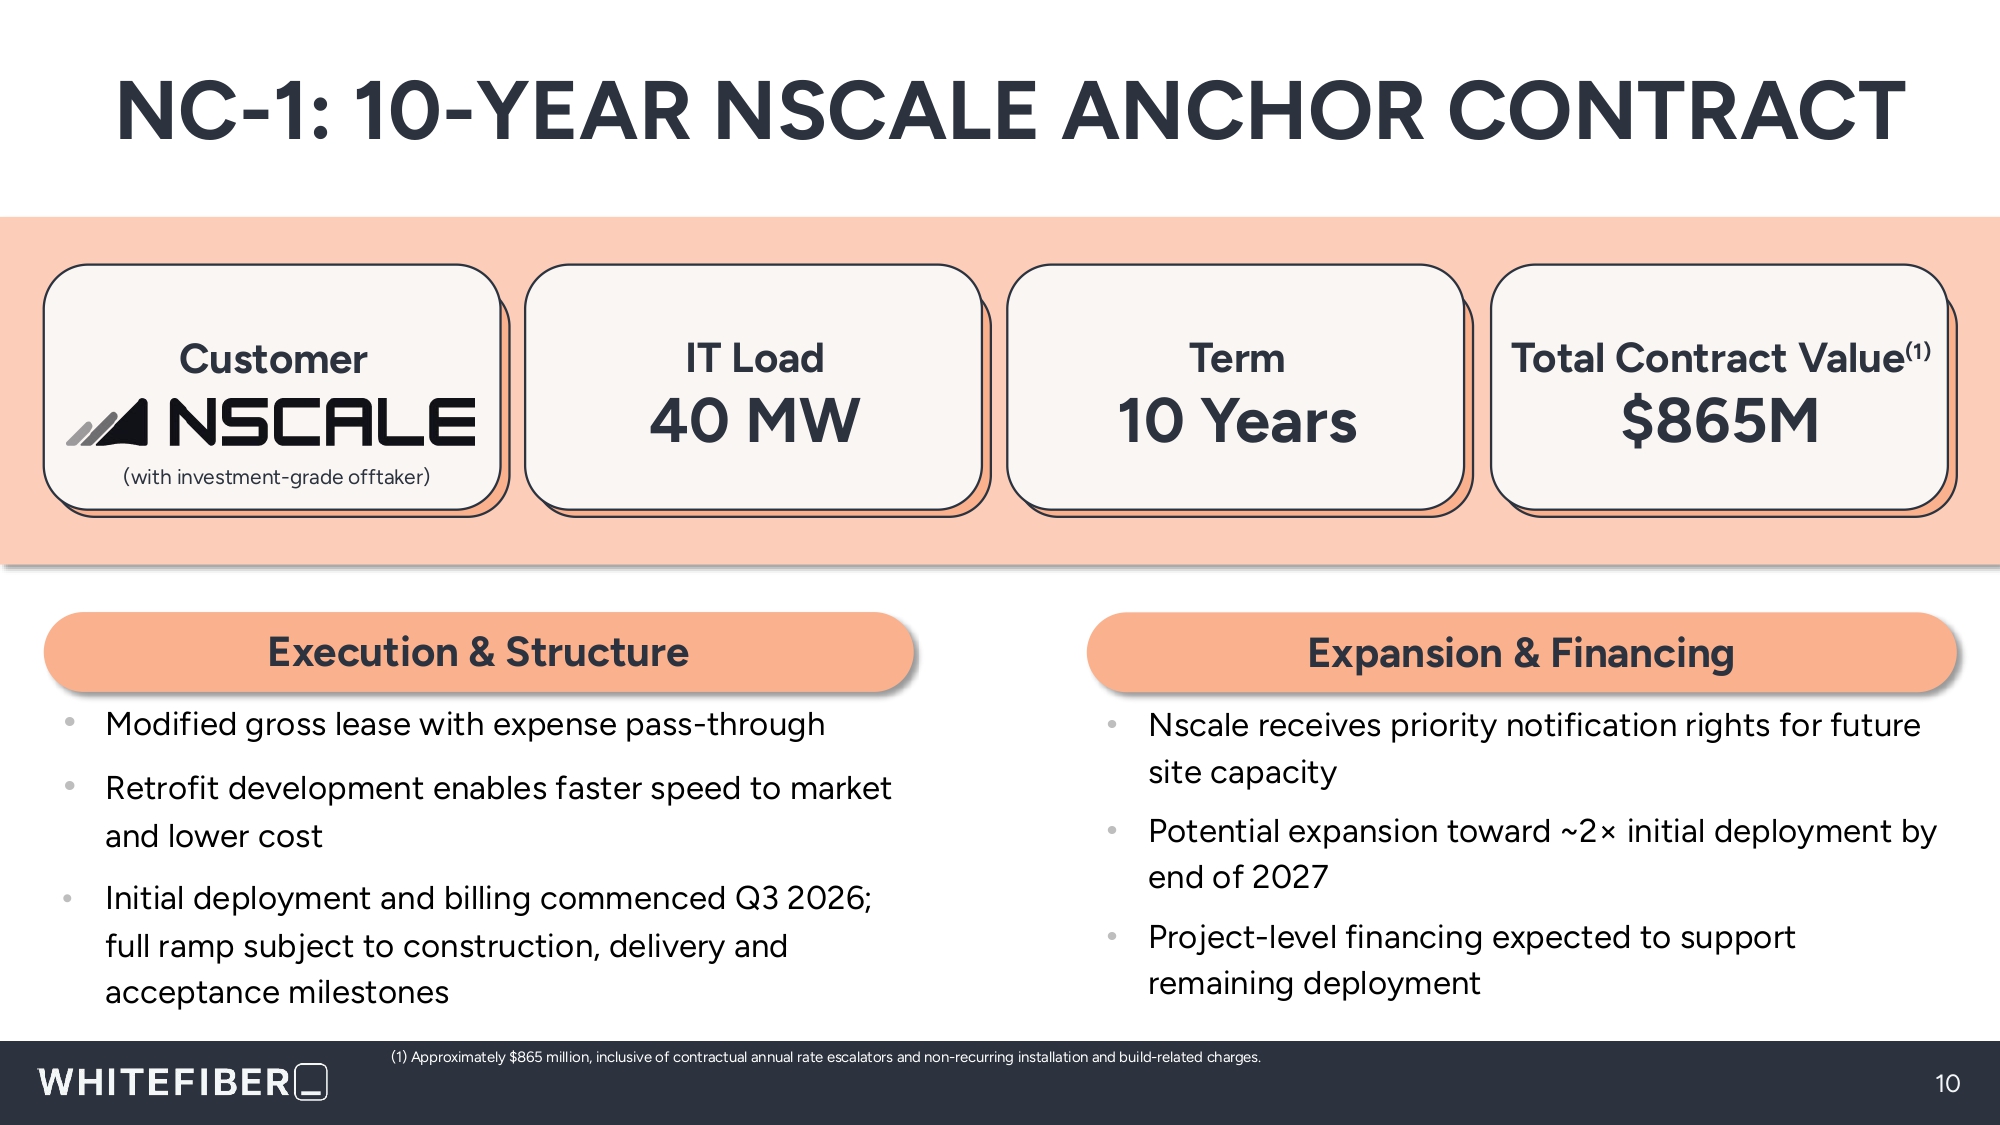
NC - 1: 10 - YEAR NSCALE ANCHOR CONTRACT 10 (1) Approximately $865 million, inclusive of contractual annual rate escalators and non - recurring installation and build - related charges. Customer IT Load 40 MW Term 10 Years Total Contract Value (1) $865M Execution & Structure • Modified gross lease with expense pass - through • Retrofit development enables faster speed to market and lower cost • Initial deployment and billing commenced Q3 2026; full ramp subject to construction, delivery and acceptance milestones Expansion & Financing • Nscale receives priority notification rights for future site capacity • Potential expansion toward ~2 î initial deployment by end of 2027 • Project - level financing expected to support remaining deployment (with investment - grade offtaker)
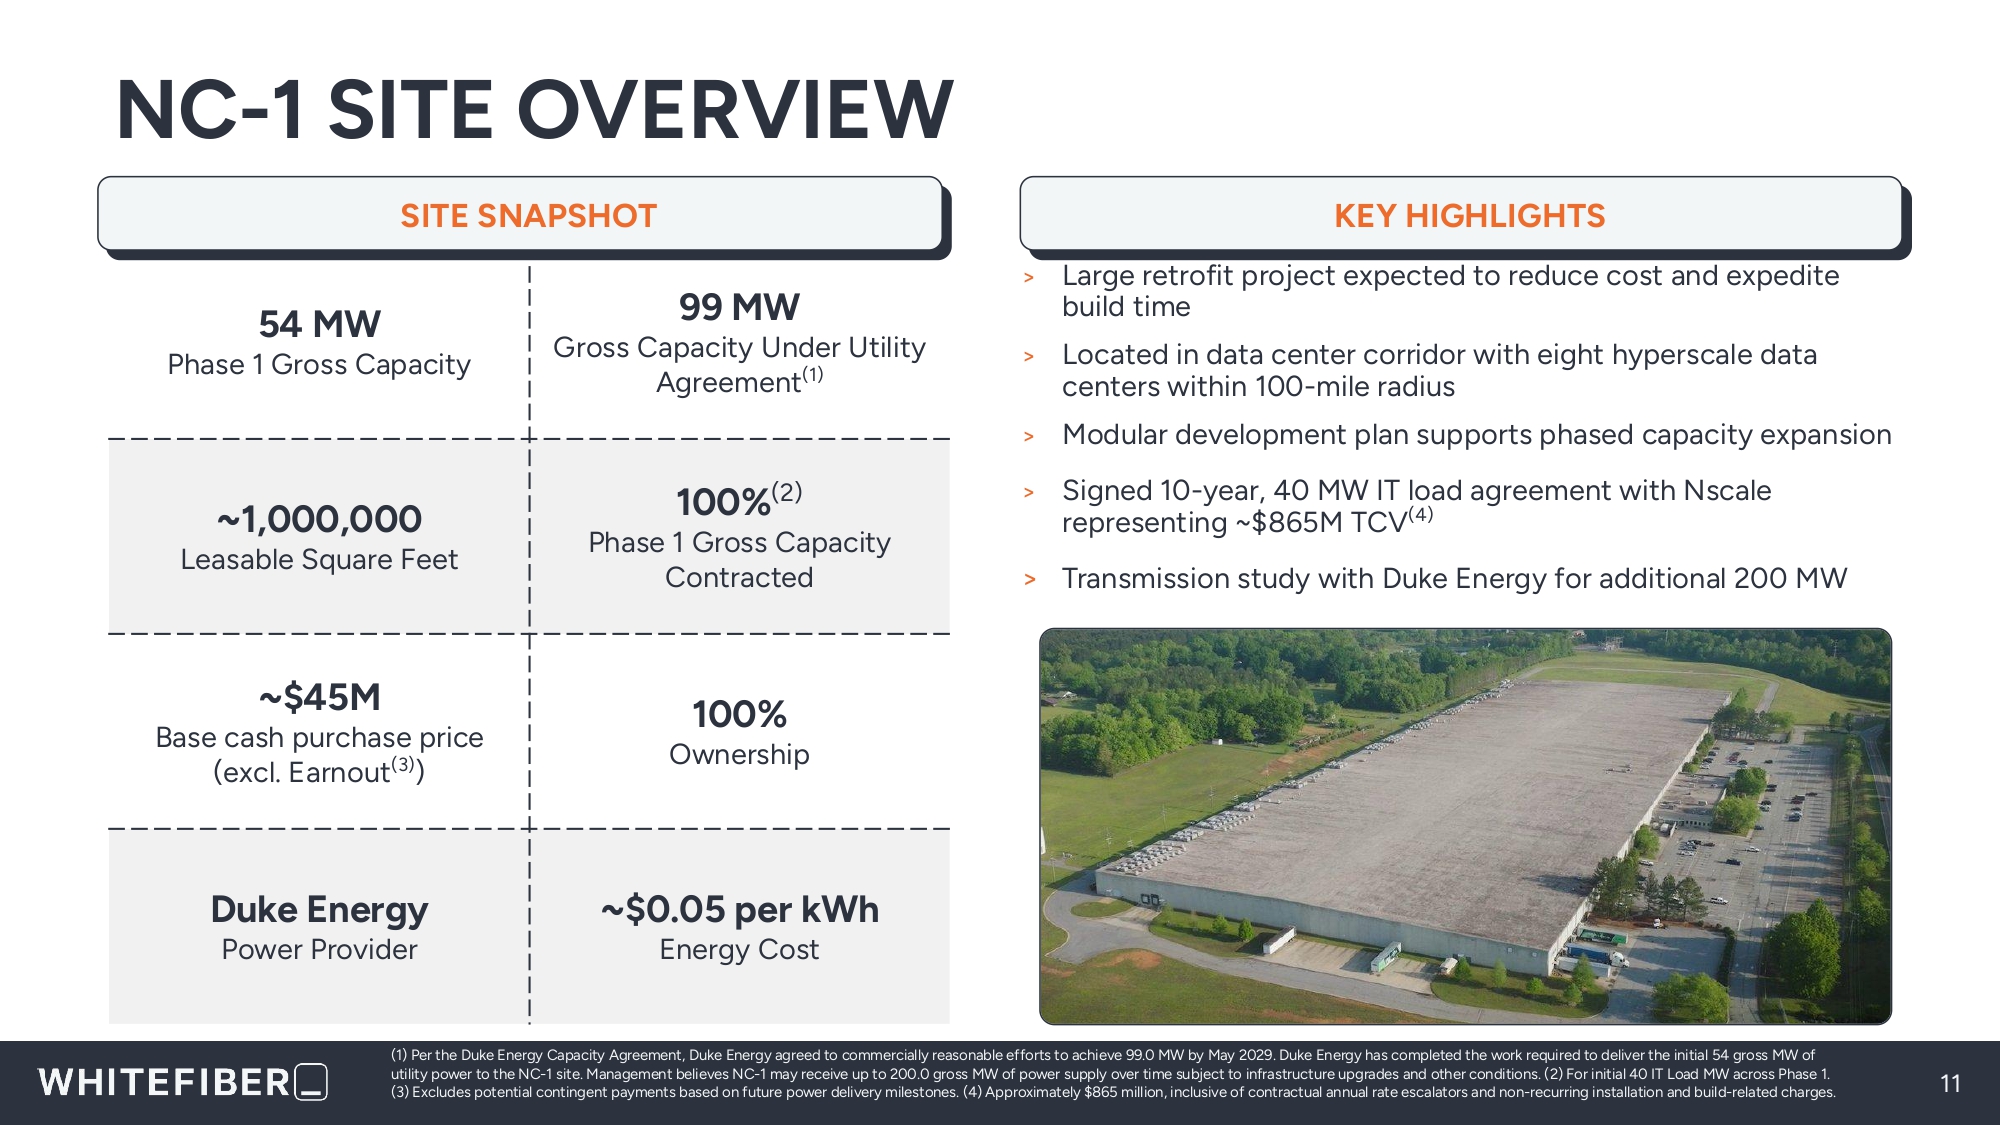
NC - 1 SITE OVERVIEW 11 (1) Per the Duke Energy Capacity Agreement, Duke Energy agreed to commercially reasonable efforts to achieve 99.0 MW by May 2029. Duke Energy has completed the work required to deliver the initial 54 gross MW of utility power to the NC - 1 site. Management believes NC - 1 may receive up to 200.0 gross MW of power supply over time subject to infrastructure upgrades and other conditions. (2) For initial 40 IT Load MW across Phase 1. (3) Excludes potential contingent payments based on future power delivery milestones. (4) Approximately $865 million, inclusive of contractual annual rate escalators and non - recurring installation and build - related charges. 54 MW Phase 1 Gross Capacity 99 MW Gross Capacity Under Utility Agreement (1) ~1,000,000 Leasable Square Feet 100% (2) Phase 1 Gross Capacity Contracted ~$45M Base cash purchase price (excl. Earnout (3) ) 100% Ownership Duke Energy Power Provider ~$0.05 per kWh Energy Cost SITE SNAPSHOT KEY HIGHLIGHTS > Large retrofit project expected to reduce cost and expedite build time > Located in data center corridor with eight hyperscale data centers within 100 - mile radius > Modular development plan supports phased capacity expansion > Signed 10 - year, 40 MW IT load agreement with Nscale representing ~$865M TCV (4) > Transmission study with Duke Energy for additional 200 MW
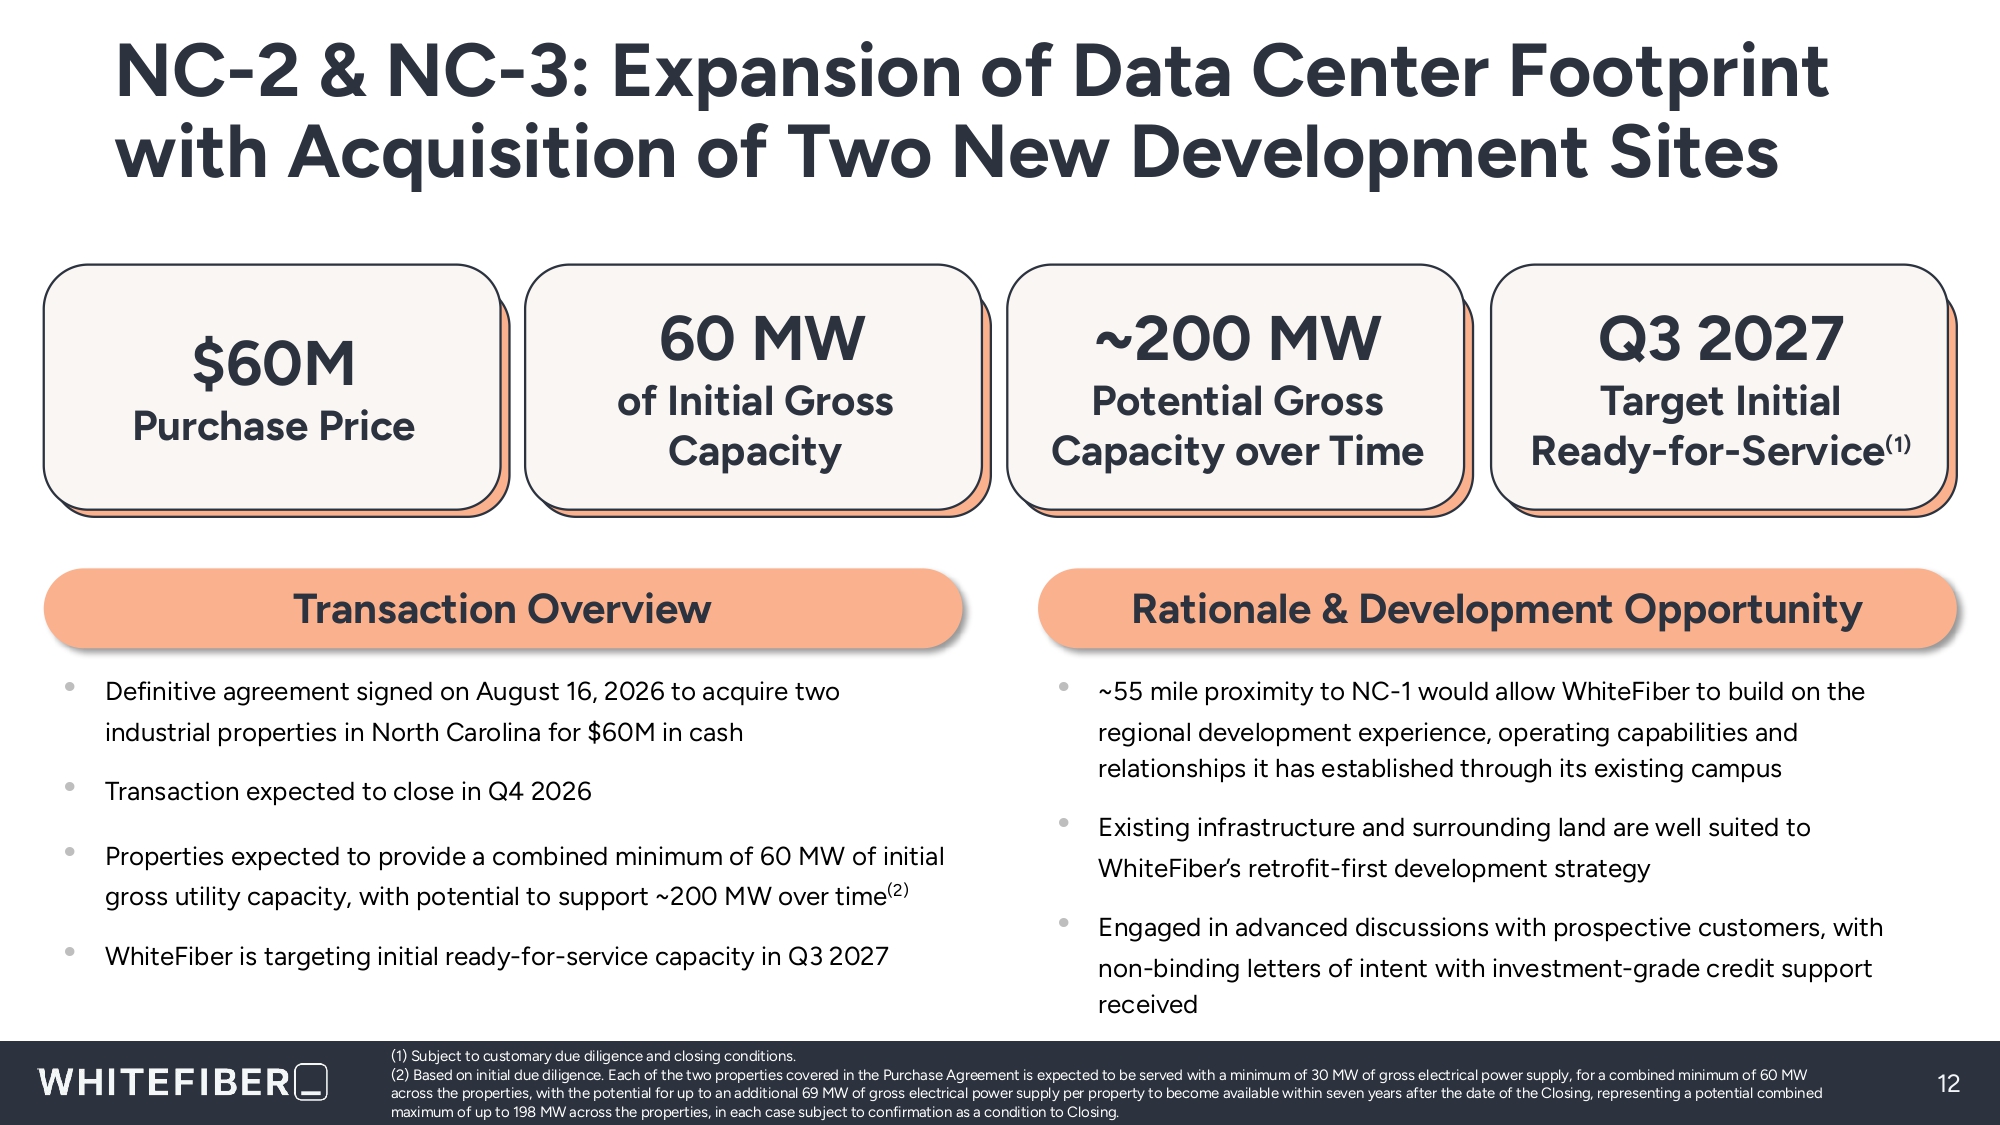
NC - 2 & NC - 3: Expansion of Data Center Footprint with Acquisition of Two New Development Sites 12 (1) Subject to customary due diligence and closing conditions. (2) Based on initial due diligence. Each of the two properties covered in the Purchase Agreement is expected to be served with a minimum of 30 MW of gross electrical power supply, for a combined minimum of 60 MW across the properties, with the potential for up to an additional 69 MW of gross electrical power supply per property to become available within seven years after the date of the Closing, representing a potential combined maximum of up to 198 MW across the properties, in each case subject to confirmation as a condition to Closing. $60M Purchase Price 60 MW of Initial Gross Capacity ~200 MW Potential Gross Capacity over Time Q3 2027 Target Initial Ready - for - Service (1) Transaction Overview • Definitive agreement signed on August 16, 2026 to acquire two industrial properties in North Carolina for $60M in cash Rationale & Development Opportunity • ~55 mile proximity to NC - 1 would allow WhiteFiber to build on the regional development experience, operating capabilities and relationships it has established through its existing campus • Transaction expected to close in Q4 2026 • Properties expected to provide a combined minimum of 60 MW of initial gross utility capacity, with potential to support ~200 MW over time (2) • WhiteFiber is targeting initial ready - for - service capacity in Q3 2027 • Existing infrastructure and surrounding land are well suited to WhiteFiber’s retrofit - first development strategy • Engaged in advanced discussions with prospective customers, with non - binding letters of intent with investment - grade credit support received
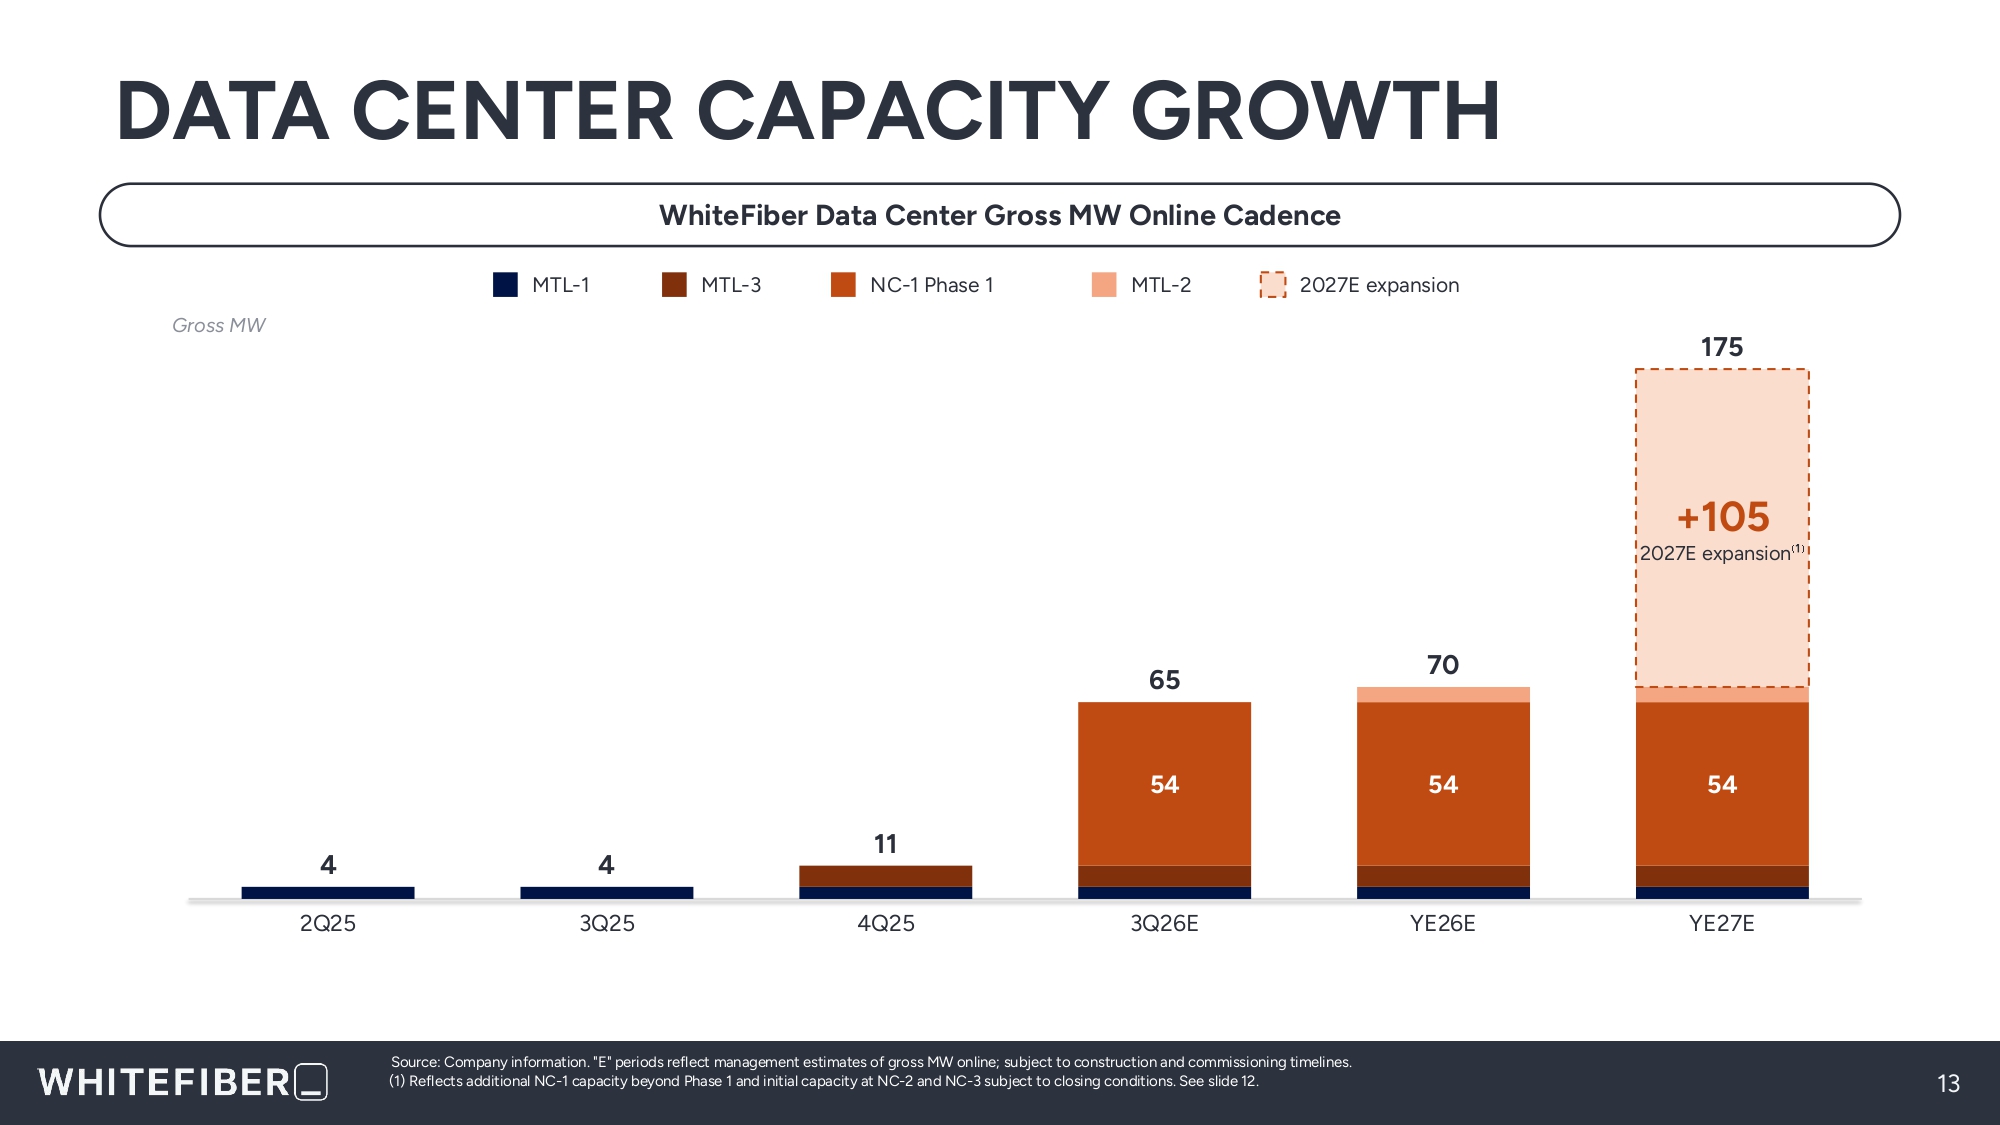
DATA CENTER CAPACITY GROWTH 13 Source: Company information. "E" periods reflect management estimates of gross MW online; subject to construction and commissioning timelines. (1) Reflects additional NC - 1 capacity beyond Phase 1 and initial capacity at NC - 2 and NC - 3 subject to closing conditions. See slide 12. WhiteFiber Data Center Gross MW Online Cadence 4 2Q25 4 3Q25 11 4Q25 54 65 3Q26E 54 70 YE26E +105 2027E expansion ⁽ ¹ ⁾ 54 175 YE27E Gross MW MTL - 1 MTL - 3 NC - 1 Phase 1 MTL - 2 2027E expansion
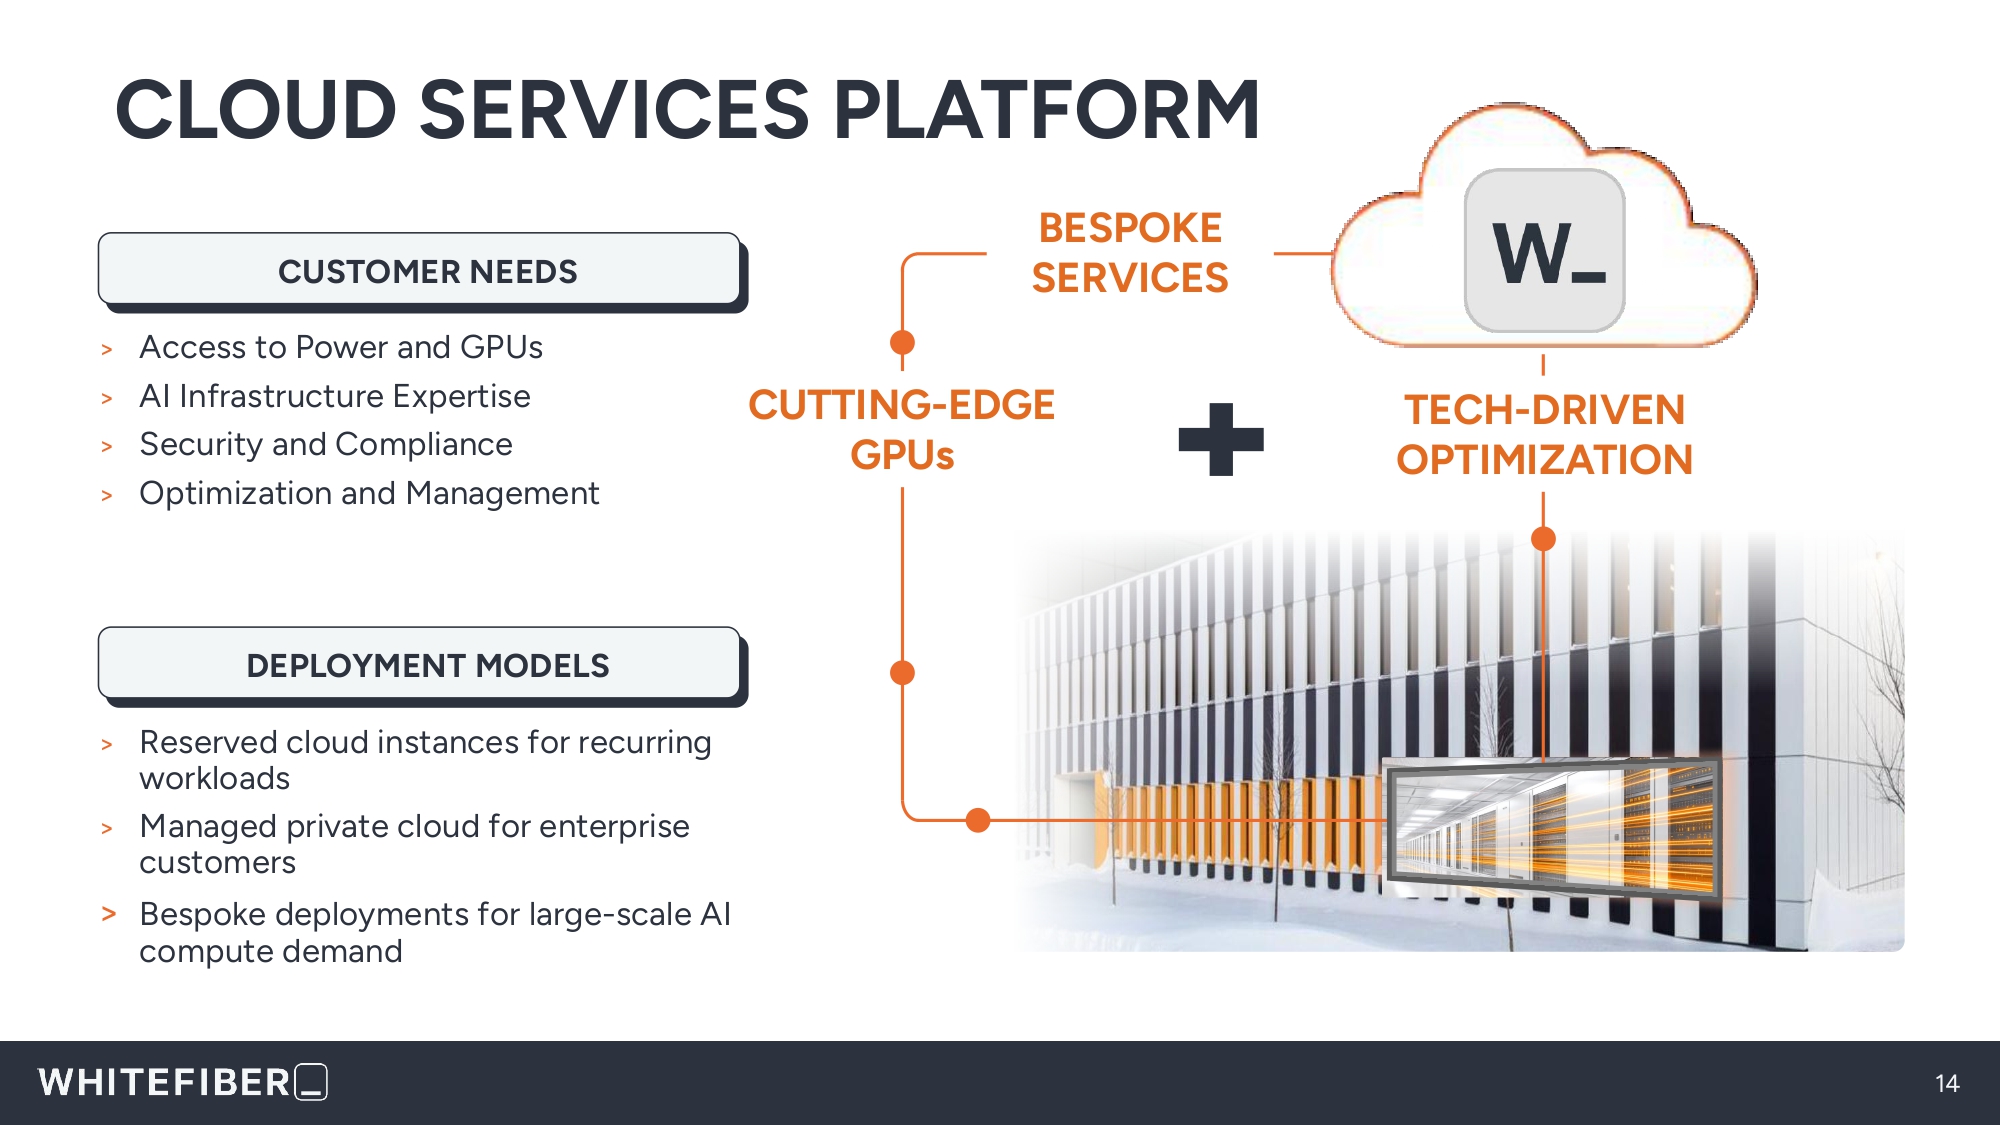
CLOUD SERVICES PLATFORM 14 > Access to Power and GPUs > AI Infrastructure Expertise > Security and Compliance > Optimization and Management CUTTING - EDGE GPUs TECH - DRIVEN OPTIMIZATION CUSTOMER NEEDS DEPLOYMENT MODELS > Reserved cloud instances for recurring workloads > Managed private cloud for enterprise customers > Bespoke deployments for large - scale AI compute demand BESPOKE SERVICES
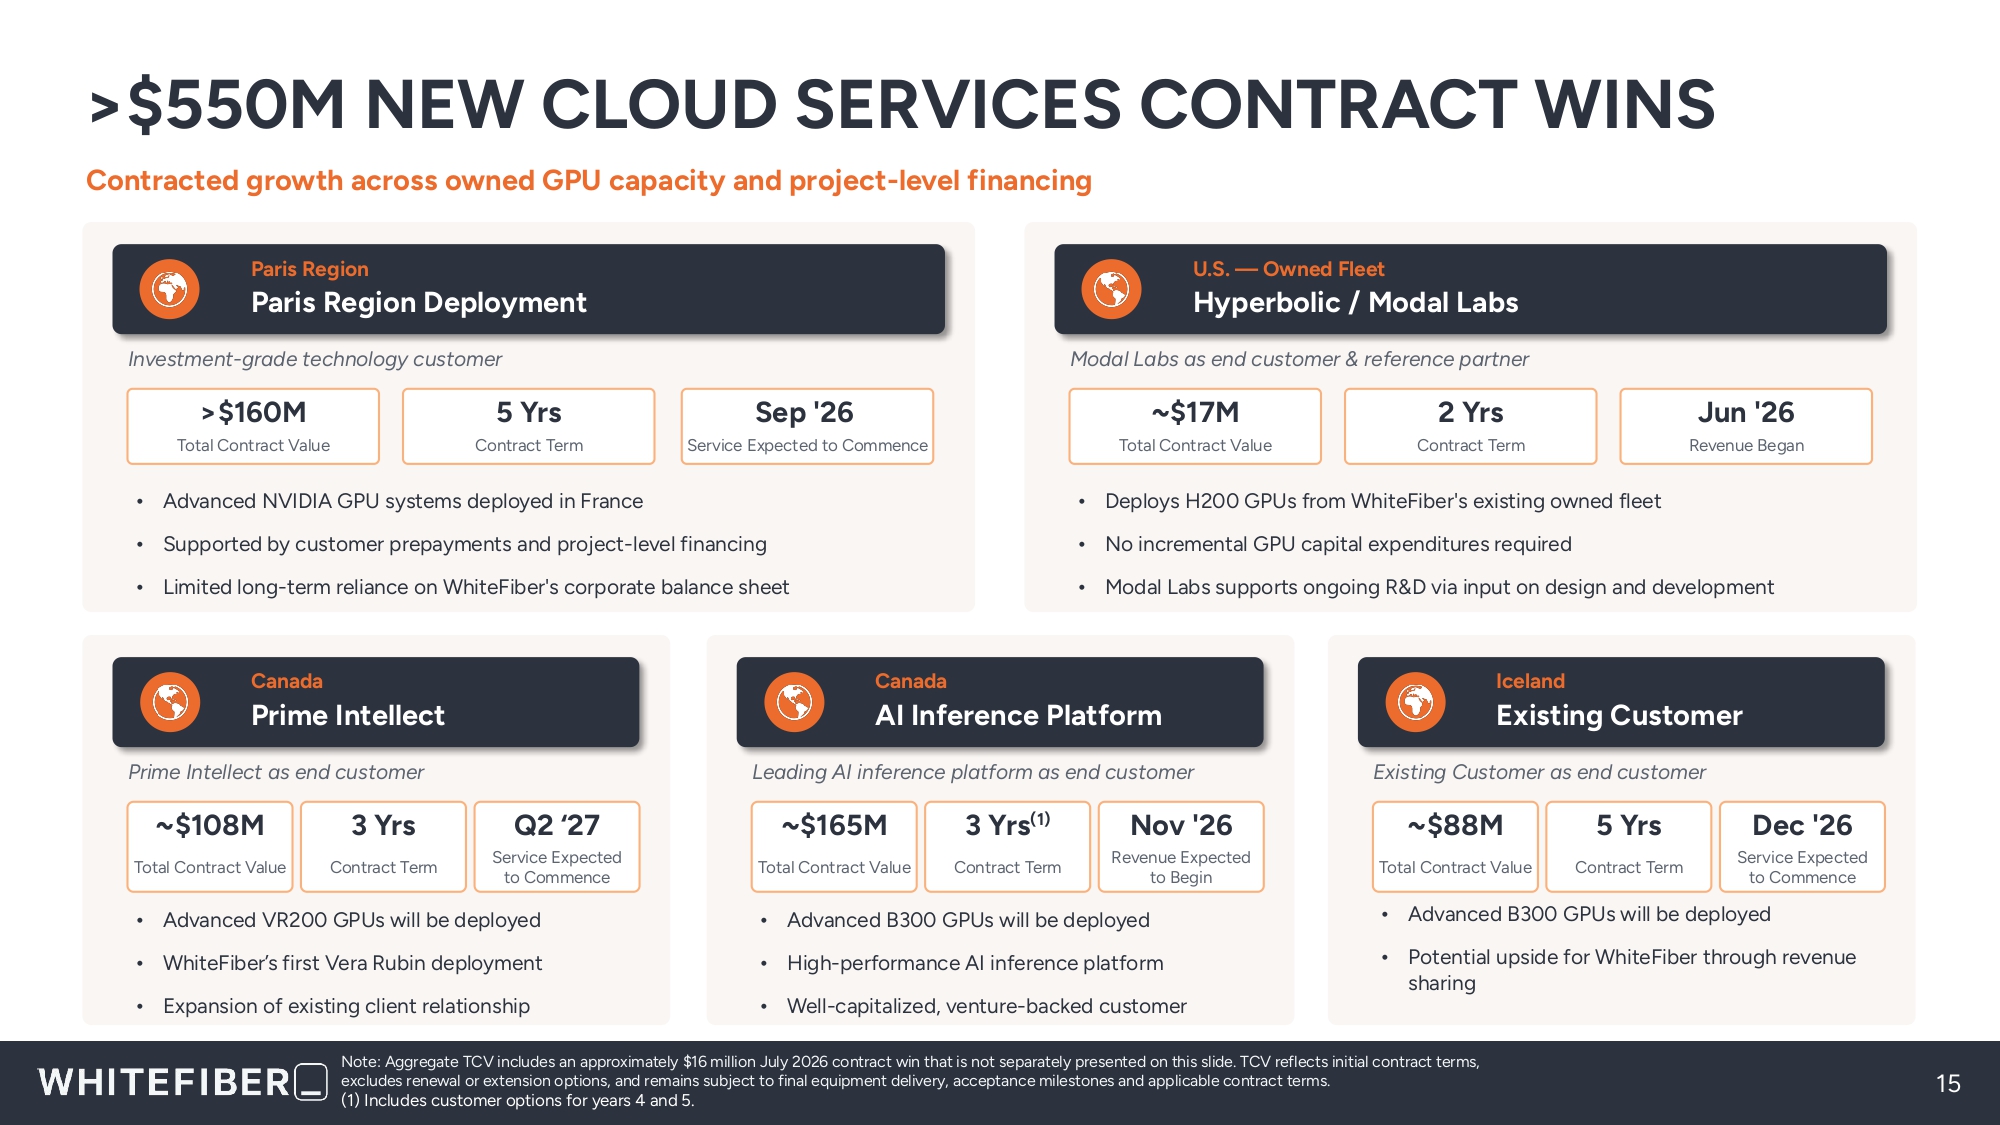
>$550M NEW CLOUD SERVICES CONTRACT WINS Contracted growth across owned GPU capacity and project - level financing Note: Aggregate TCV includes an approximately $16 million July 2026 contract win that is not separately presented on this slide. TCV reflects initial contract terms, excludes renewal or extension options, and remains subject to final equipment delivery, acceptance milestones and applicable contract terms. (1) Includes customer options for years 4 and 5. 15 Paris Region Paris Region Deployment Investment - grade technology customer >$160M Total Contract Value 5 Yrs Contract Term Sep '26 Service Expected to Commence • Advanced NVIDIA GPU systems deployed in France • Supported by customer prepayments and project - level financing • Limited long - term reliance on WhiteFiber's corporate balance sheet U.S. — Owned Fleet Hyperbolic / Modal Labs Modal Labs as end customer & reference partner ~$17M Total Contract Value 2 Yrs Contract Term Jun '26 Revenue Began • Deploys H200 GPUs from WhiteFiber's existing owned fleet • No incremental GPU capital expenditures required • Modal Labs supports ongoing R&D via input on design and development ~$108M Total Contract Value 3 Yrs Contract Term Q2 ‘27 Service Expected to Commence • Advanced VR200 GPUs will be deployed • WhiteFiber’s first Vera Rubin deployment • Expansion of existing client relationship Canada Prime Intellect Prime Intellect as end customer ~$165M Total Contract Value 3 Yrs (1) Contract Term Nov '26 Revenue Expected to Begin • Advanced B300 GPUs will be deployed • High - performance AI inference platform • Well - capitalized, venture - backed customer Canada AI Inference Platform Leading AI inference platform as end customer ~$88M Total Contract Value 5 Yrs Contract Term Dec '26 Service Expected to Commence • Advanced B300 GPUs will be deployed • Potential upside for WhiteFiber through revenue sharing Iceland Existing Customer Existing Customer as end customer
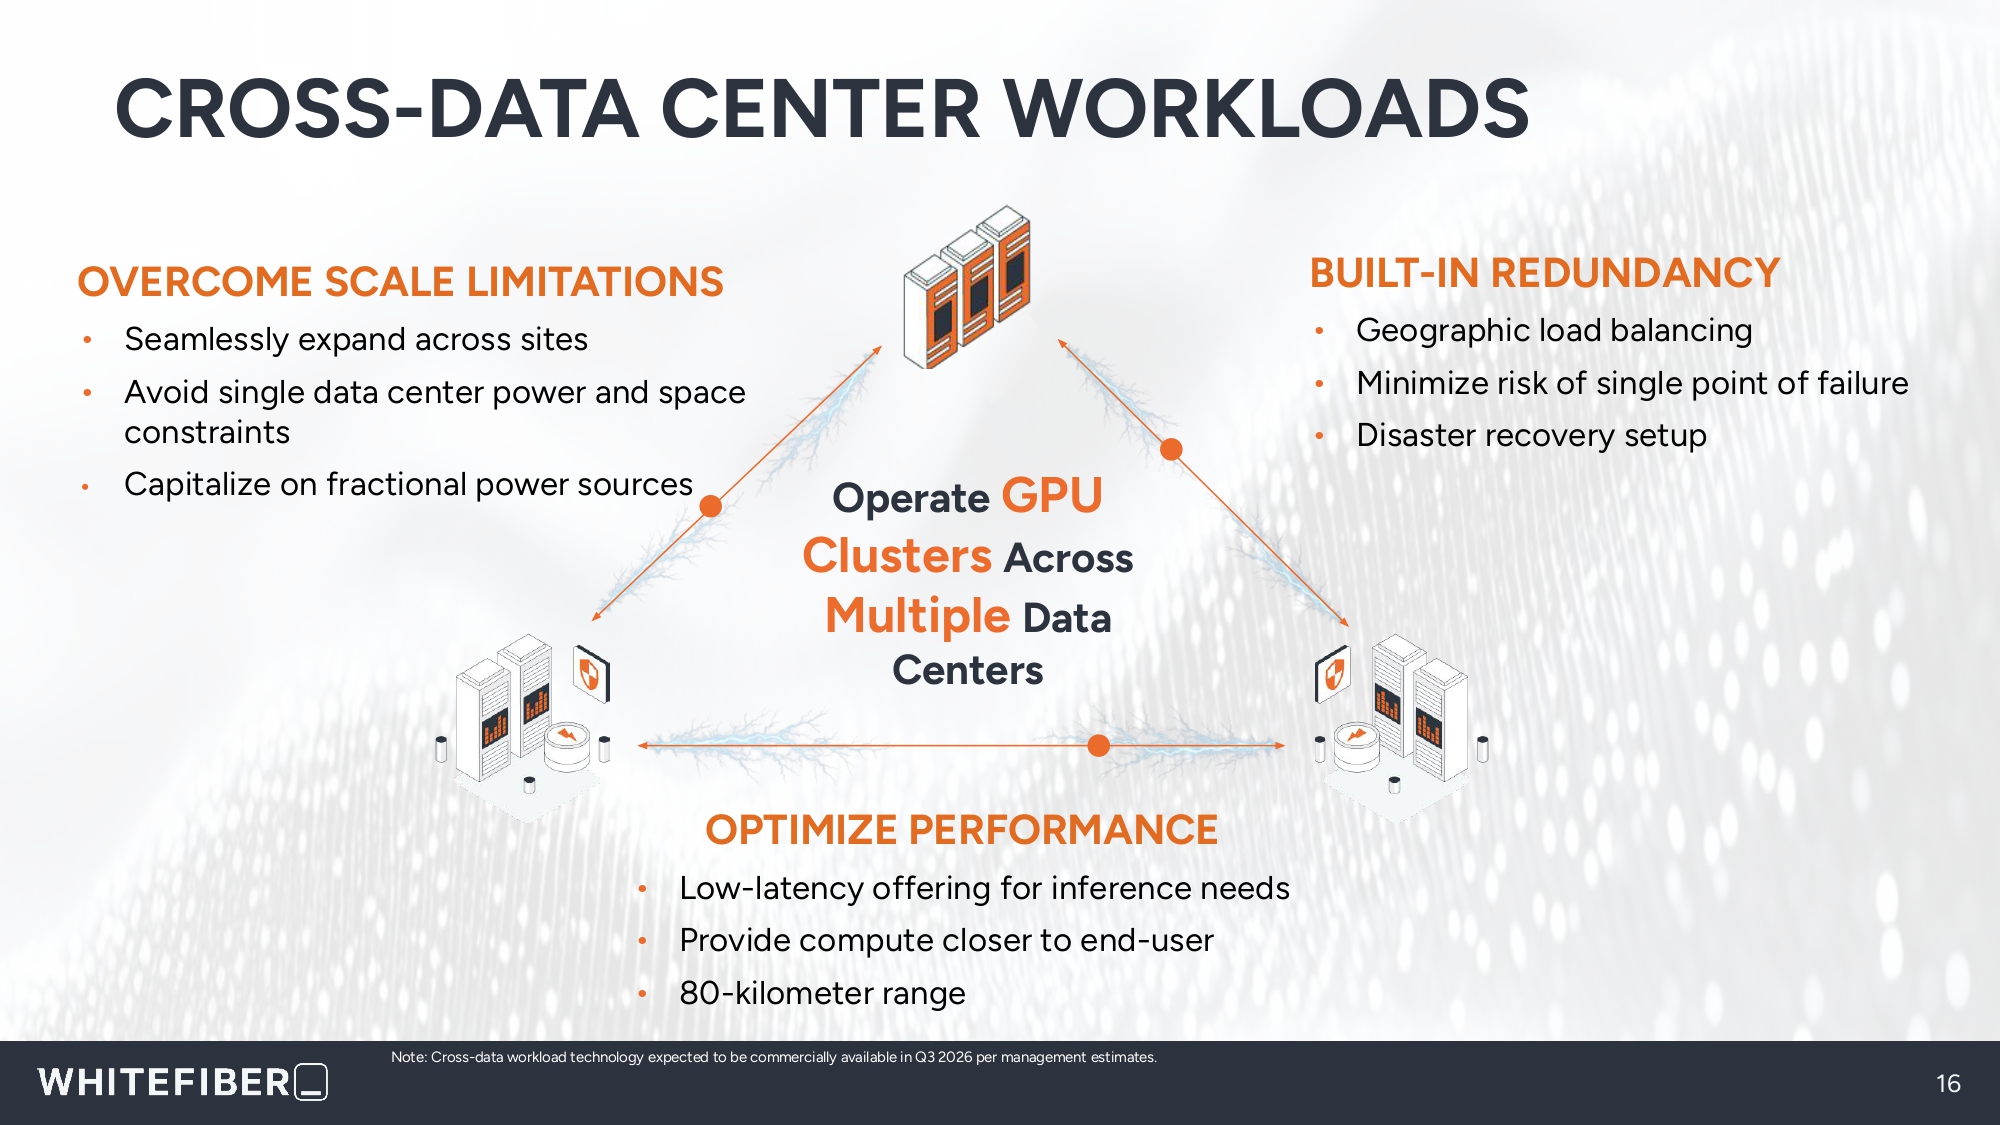
CROSS - DATA CENTER WORKLOADS 16 Note: Cross - data workload technology expected to be commercially available in Q3 2026 per management estimates. OPTIMIZE PERFORMANCE • Low - latency offering for inference needs • Provide compute closer to end - user • 80 - kilometer range OVERCOME SCALE LIMITATIONS • Seamlessly expand across sites • Avoid single data center power and space constraints • Capitalize on fractional power sources BUILT - IN REDUNDANCY • Geographic load balancing • Minimize risk of single point of failure • Disaster recovery setup Operate GPU Clusters Across Multiple Data Centers
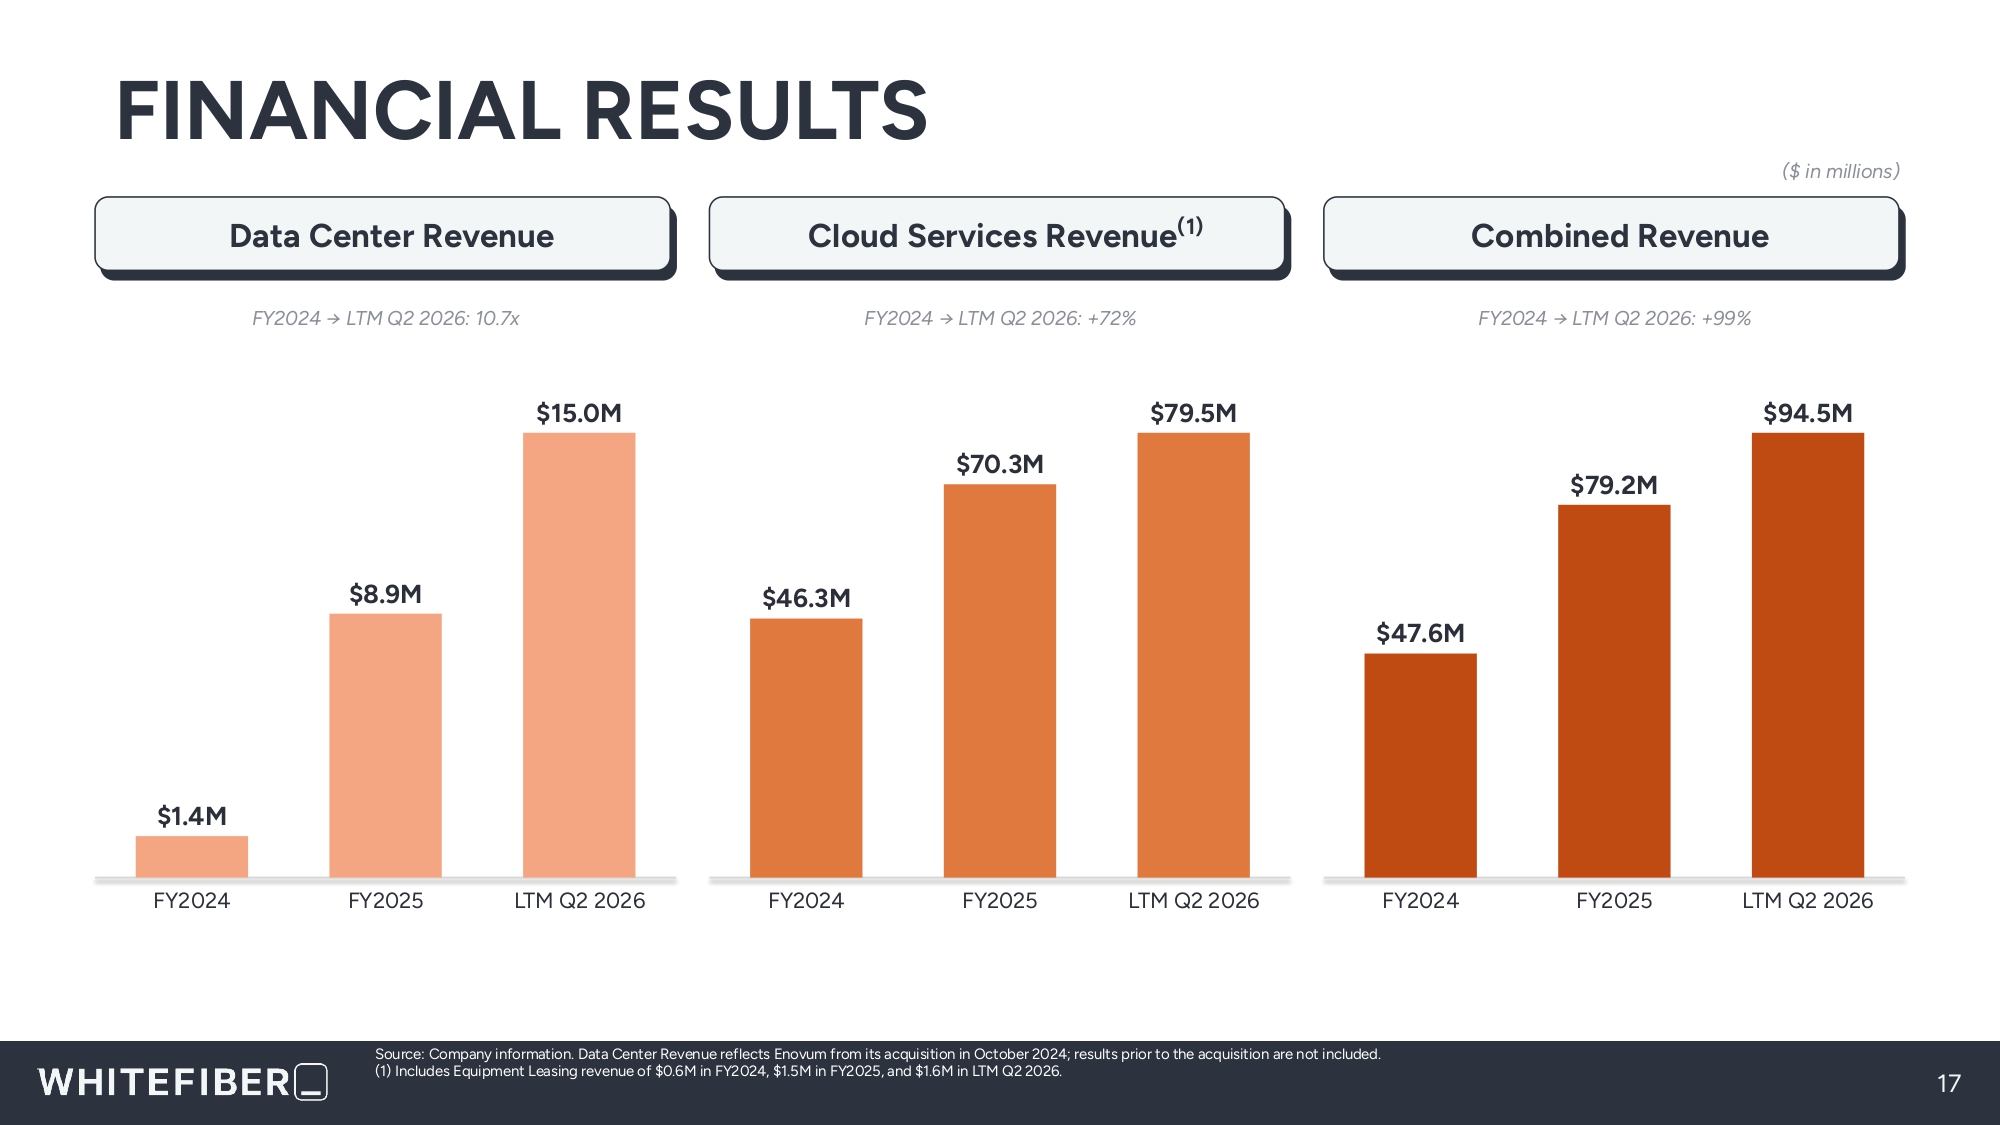
FINANCIAL RESULTS 17 Data Center Revenue Cloud Services Revenue (1) Combined Revenue $1.4M FY2024 $8.9M FY2025 $15.0M LTM Q2 2026 FY2024 → LTM Q2 2026: 10.7x $46.3M FY2024 $70.3M FY2025 $79.5M LTM Q2 2026 FY2024 → LTM Q2 2026: +72% $47.6M FY2024 $79.2M FY2025 $94.5M LTM Q2 2026 FY2024 → LTM Q2 2026: +99% ($ in millions) Source: Company information. Data Center Revenue reflects Enovum from its acquisition in October 2024; results prior to the acquisition are not included. (1) Includes Equipment Leasing revenue of $0.6M in FY2024, $1.5M in FY2025, and $1.6M in LTM Q2 2026.
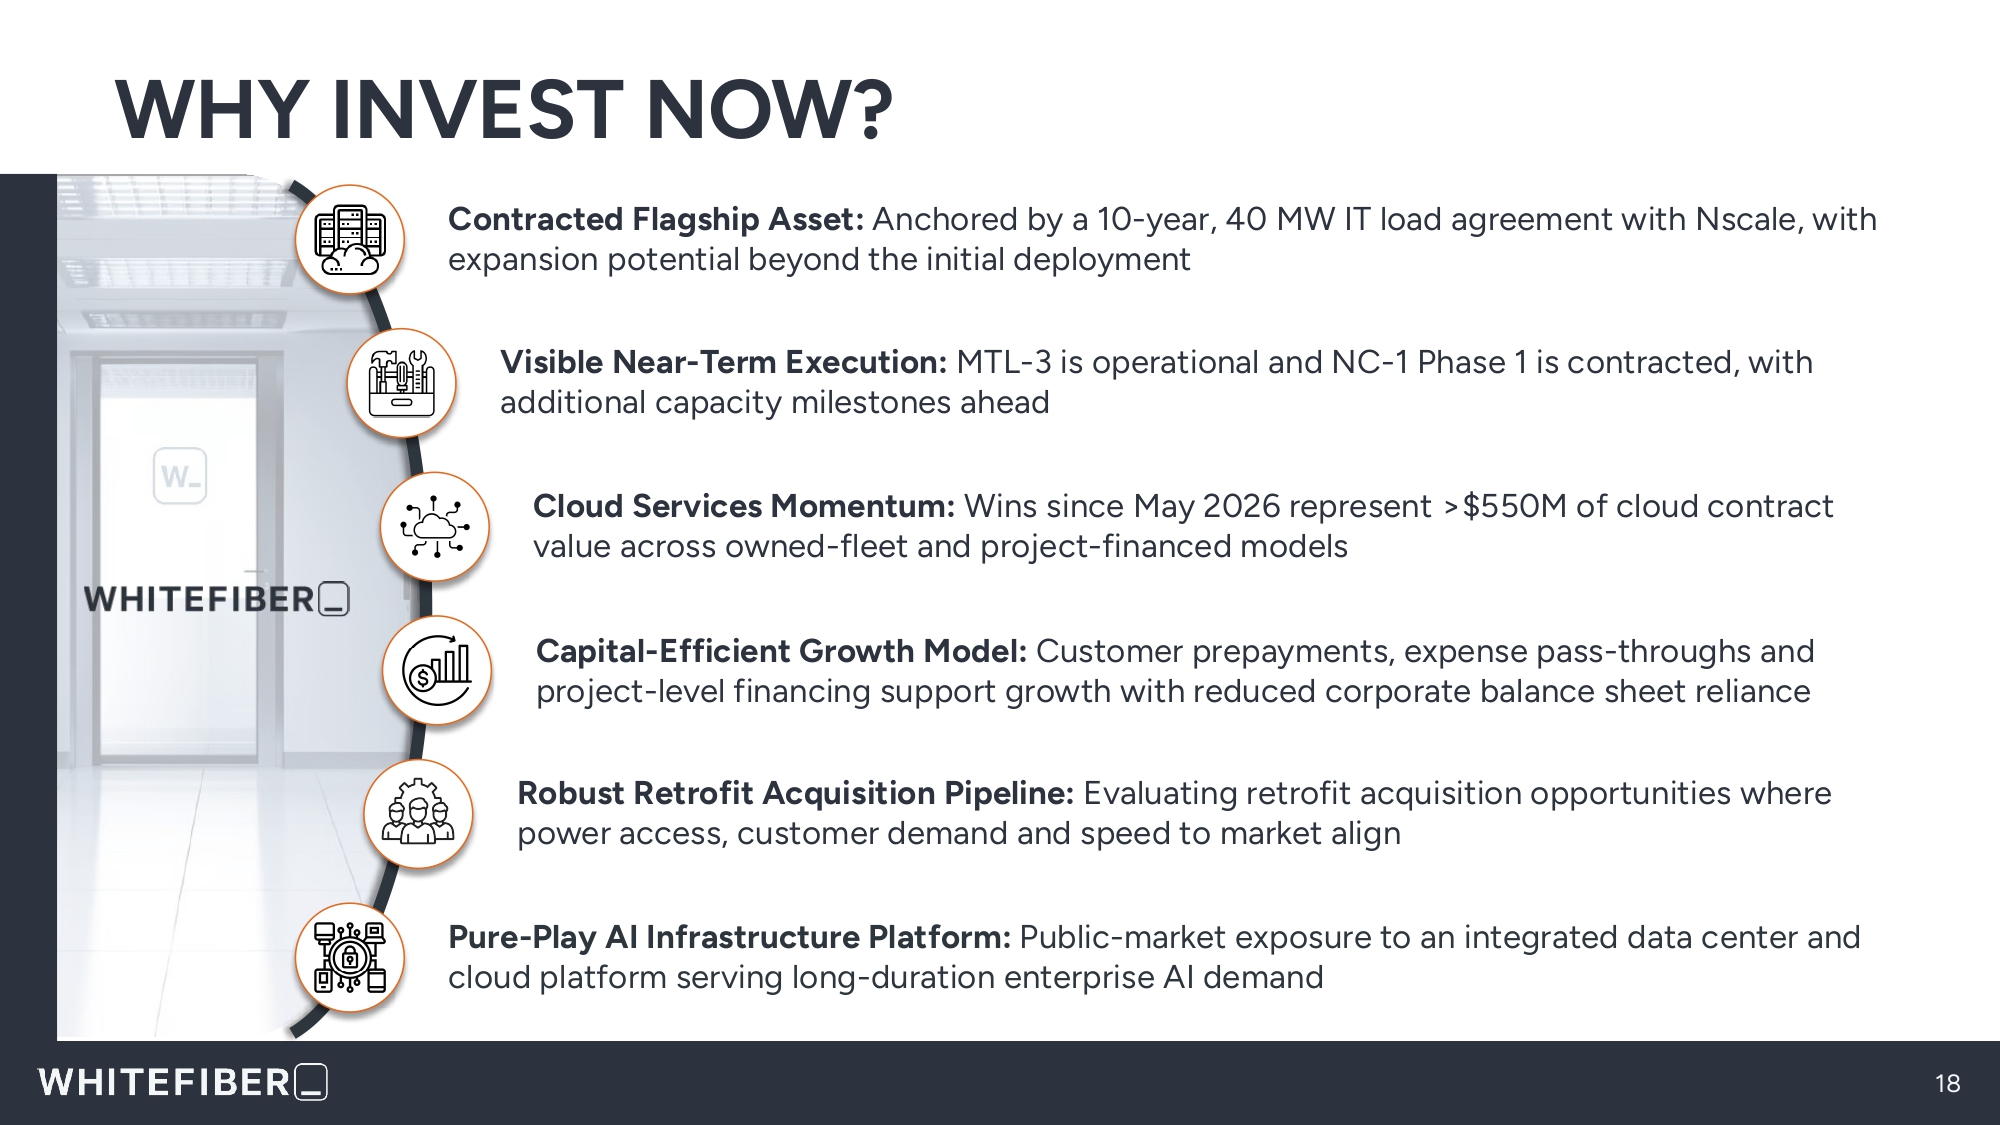
WHY INVEST NOW? 18 Contracted Flagship Asset: Anchored by a 10 - year, 40 MW IT load agreement with Nscale, with expansion potential beyond the initial deployment Visible Near - Term Execution: MTL - 3 is operational and NC - 1 Phase 1 is contracted, with additional capacity milestones ahead Cloud Services Momentum: Wins since May 2026 represent >$550M of cloud contract value across owned - fleet and project - financed models Capital - Efficient Growth Model: Customer prepayments, expense pass - throughs and project - level financing support growth with reduced corporate balance sheet reliance Robust Retrofit Acquisition Pipeline: Evaluating retrofit acquisition opportunities where power access, customer demand and speed to market align Pure - Play AI Infrastructure Platform: Public - market exposure to an integrated data center and cloud platform serving long - duration enterprise AI demand

APPENDIX ʙ
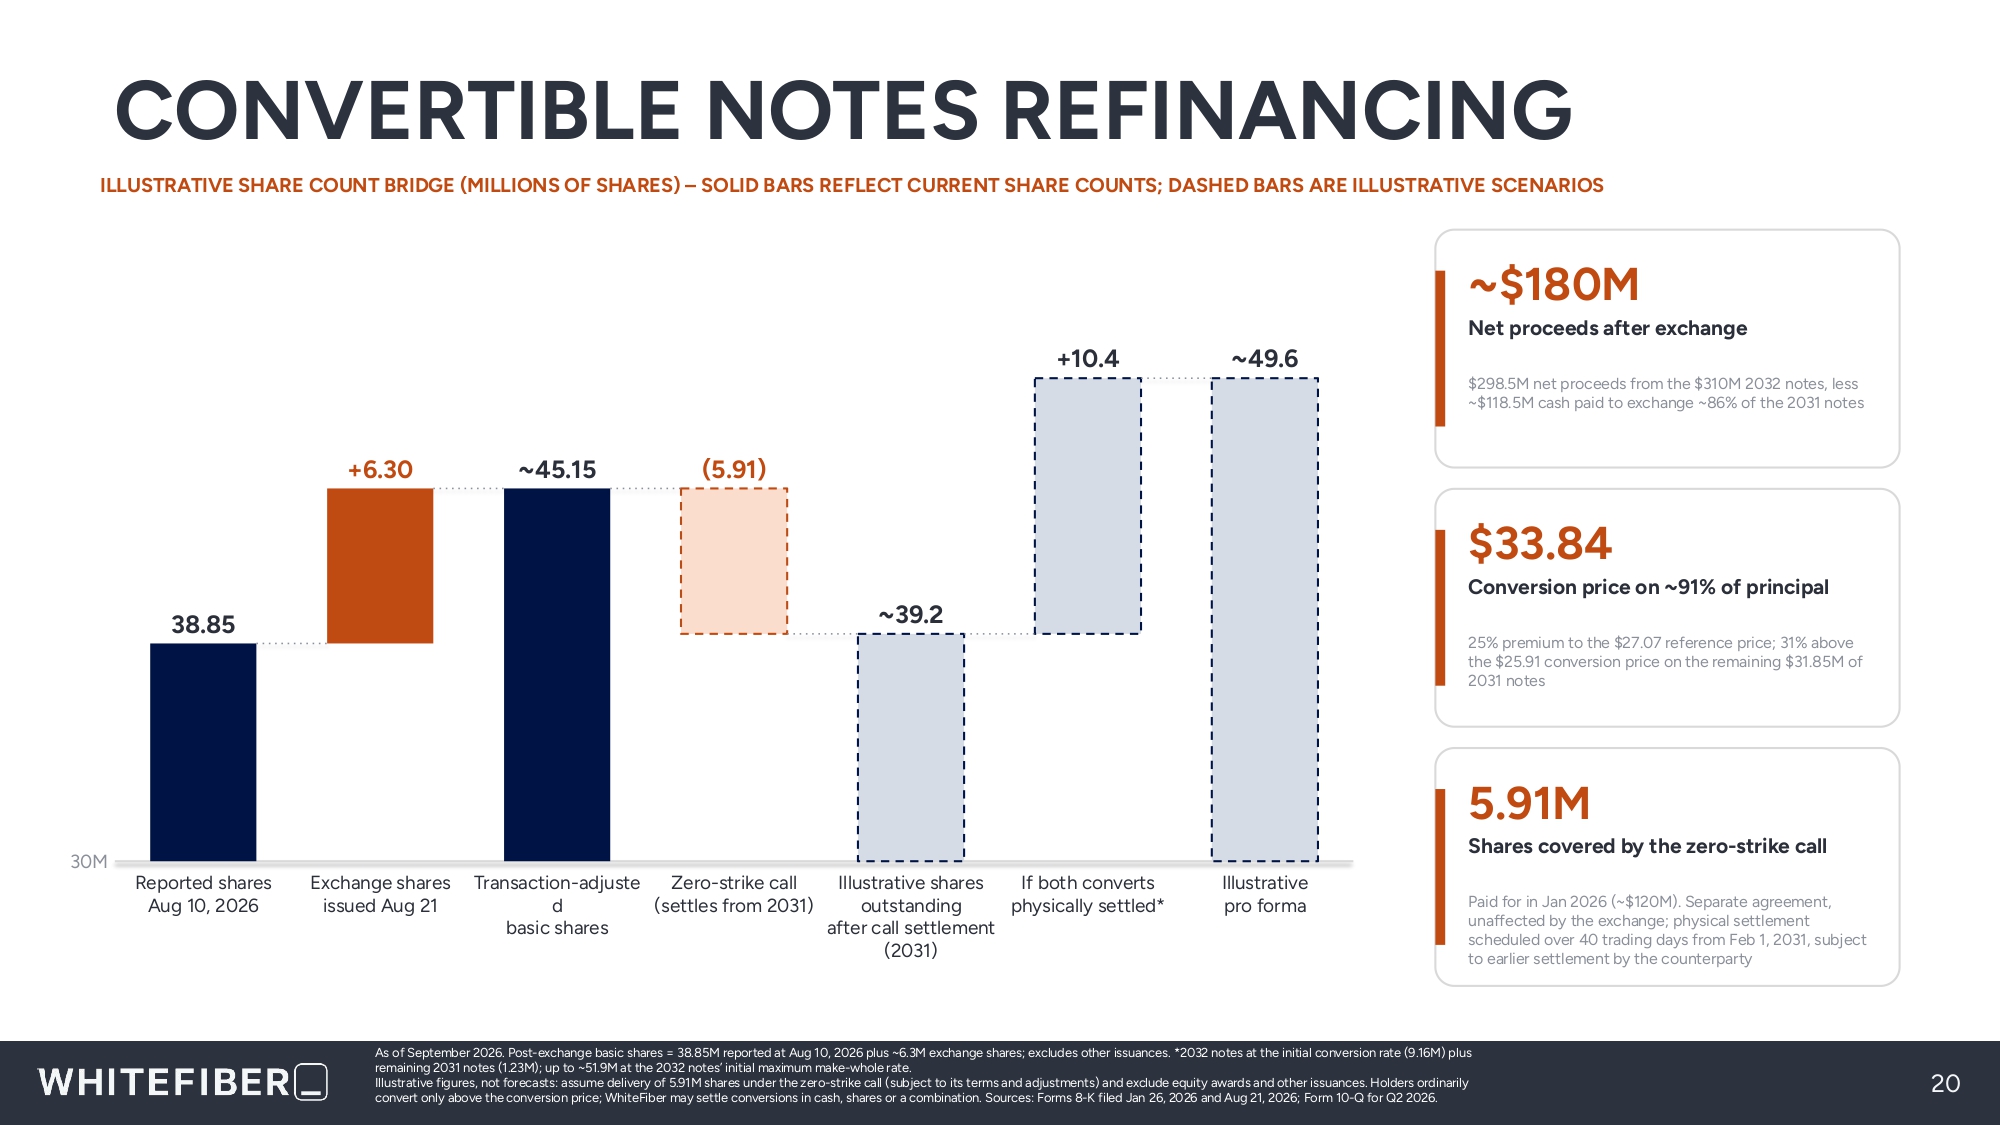
CONVERTIBLE NOTES REFINANCING ILLUSTRATIVE SHARE COUNT BRIDGE (MILLIONS OF SHARES) – SOLID BARS REFLECT CURRENT SHARE COUNTS; DASHED BARS ARE ILLUSTRATIVE SCENARIOS 20 30M 38.85 Reported shares Aug 10, 2026 +6.30 Exchange shares issued Aug 21 ~45.15 Transaction - adjuste d basic shares (5.91) Zero - strike call (settles from 2031) ~39.2 Illustrative shares outstanding after call settlement (2031) +10.4 If both converts physically settled* ~49.6 Illustrative pro forma ~$180M Net proceeds after exchange $298.5M net proceeds from the $310M 2032 notes, less ~$118.5M cash paid to exchange ~86% of the 2031 notes $33.84 Conversion price on ~91% of principal 25% premium to the $27.07 reference price; 31% above the $25.91 conversion price on the remaining $31.85M of 2031 notes 5.91M Shares covered by the zero - strike call Paid for in Jan 2026 (~$120M). Separate agreement, unaffected by the exchange; physical settlement scheduled over 40 trading days from Feb 1, 2031, subject to earlier settlement by the counterparty As of September 2026. Post - exchange basic shares = 38.85M reported at Aug 10, 2026 plus ~6.3M exchange shares; excludes other issuances. *2032 notes at the initial conversion rate (9.16M) plus remaining 2031 notes (1.23M); up to ~51.9M at the 2032 notes’ initial maximum make - whole rate. Illustrative figures, not forecasts: assume delivery of 5.91M shares under the zero - strike call (subject to its terms and adjustments) and exclude equity awards and other issuances. Holders ordinarily convert only above the conversion price; WhiteFiber may settle conversions in cash, shares or a combination. Sources: Forms 8 - K filed Jan 26, 2026 and Aug 21, 2026; Form 10 - Q for Q2 2026.
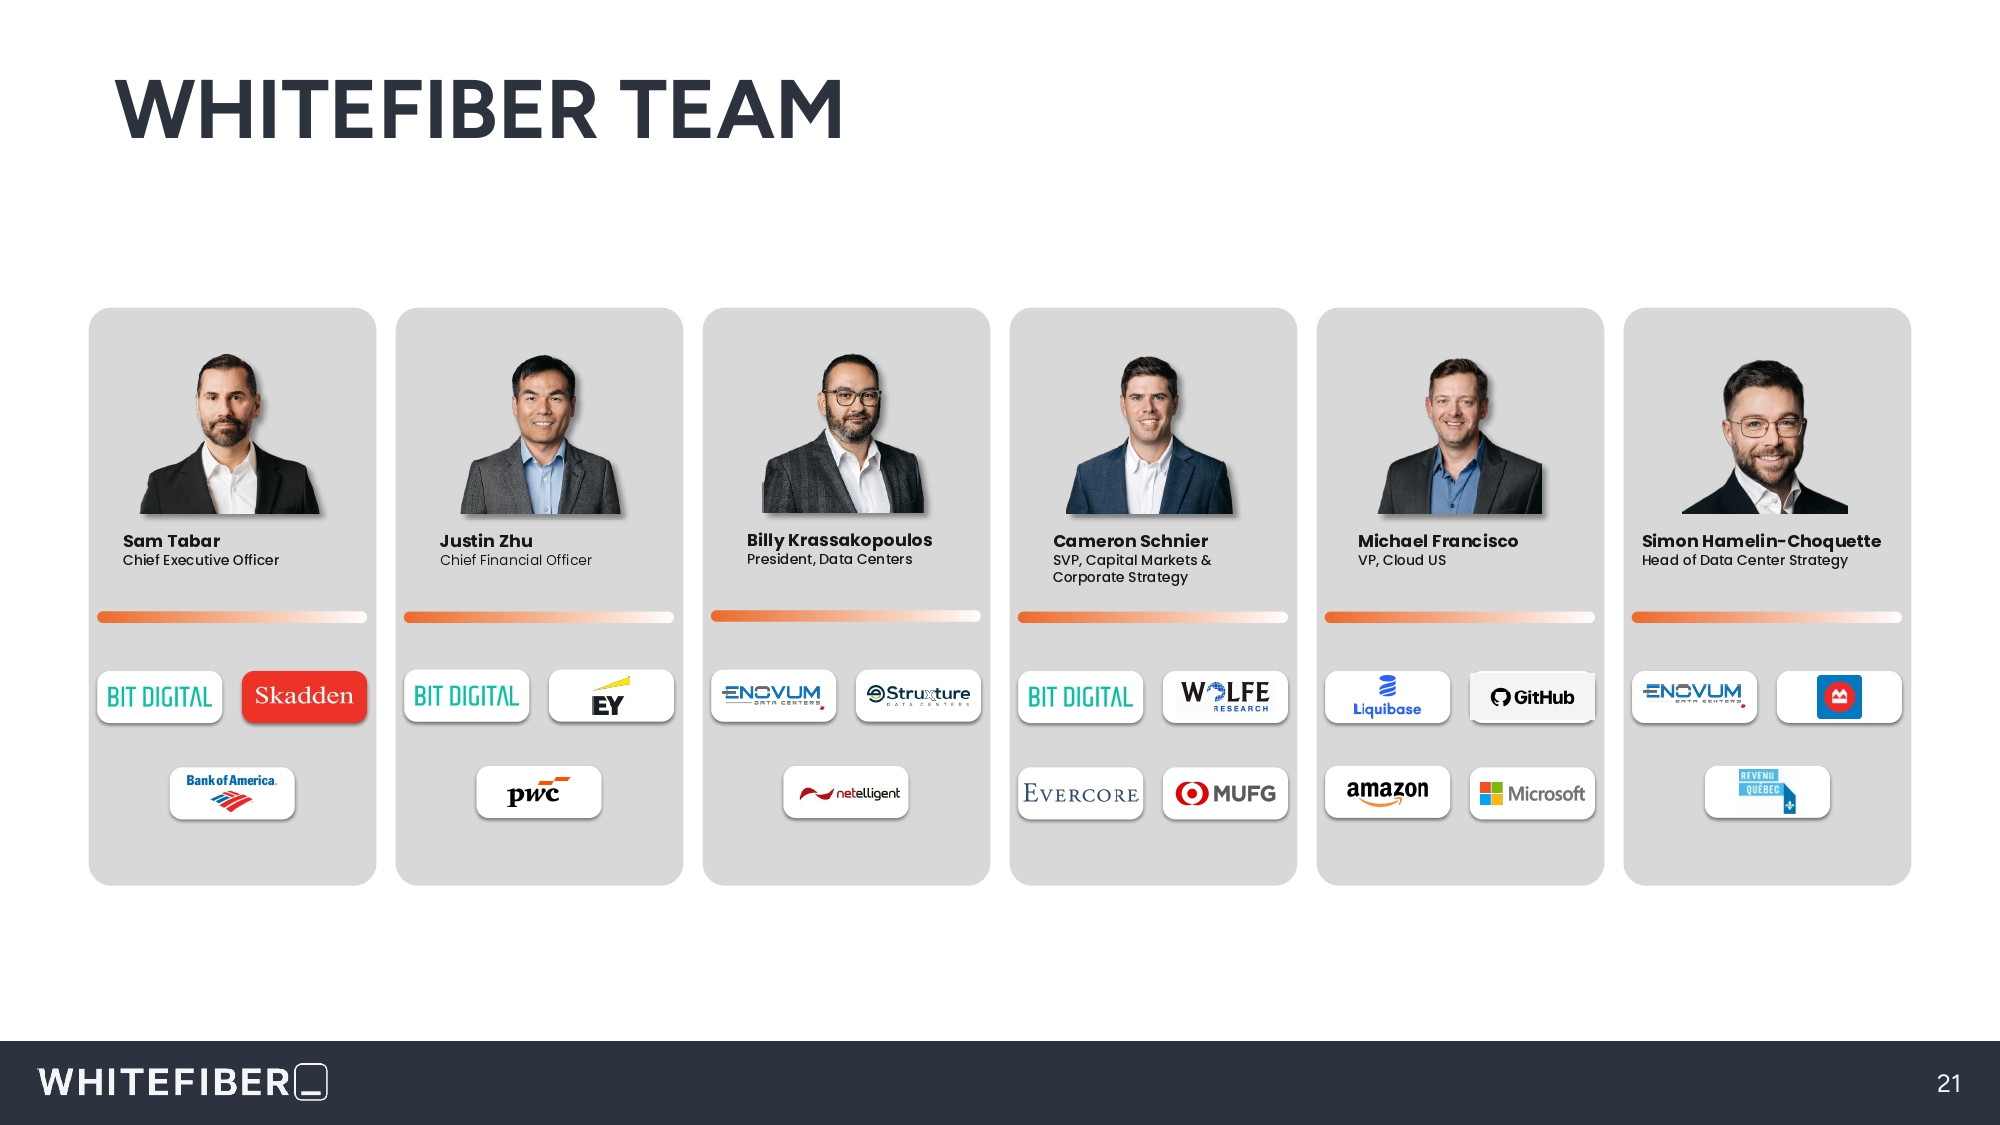
WHITEFIBER TEAM 21 Billy Krassakopoulos President, Data Centers Cameron Schnier SVP, Capital Markets & Corporate Strategy Michael Francisco VP, Cloud US Sam Tabar Chief Executive Officer Justin Zhu Chief Financial Officer Simon Hamelin - Choquette Head of Data Center Strategy
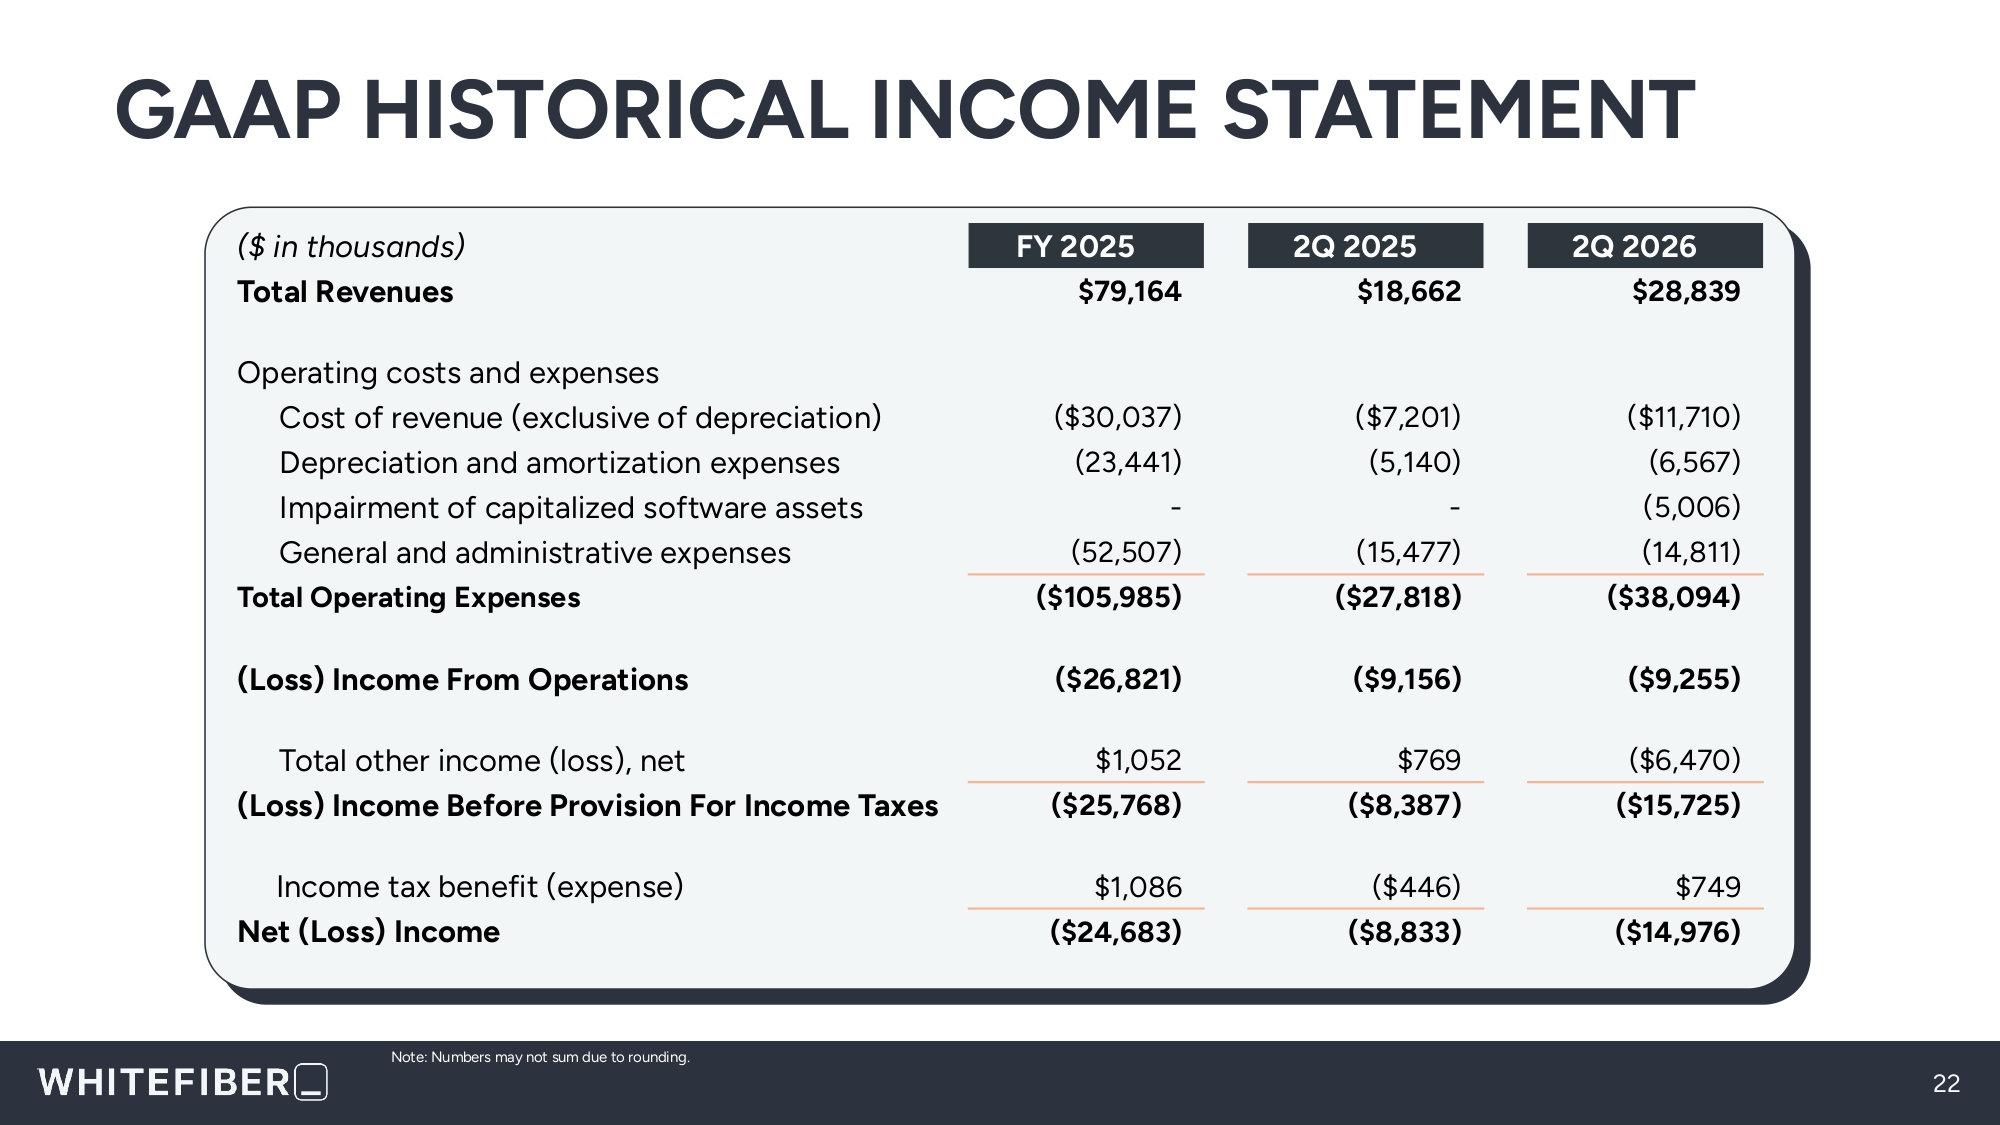
2Q 2026 2Q 2025 FY 2025 ($ in thousands) $28,839 $18,662 $79,164 Total Revenues ($11,710) ($7,201) ($30,037) Operating costs and expenses Cost of revenue (exclusive of depreciation) (6,567) (5,140) (23,441) Depreciation and amortization expenses (5,006) - - Impairment of capitalized software assets (14,811) (15,477) (52,507) General and administrative expenses ($38,094) ($27,818) ($105,985) Total Operating Expenses ($9,255) ($9,156) ($26,821) (Loss) Income From Operations ($6,470) $769 $1,052 Total other income (loss), net ($15,725) ($8,387) ($25,768) (Loss) Income Before Provision For Income Taxes $749 ($446) $1,086 Income tax benefit (expense) ($14,976) ($8,833) ($24,683) Net (Loss) Income GAAP HISTORICAL INCOME STATEMENT 22 Note: Numbers may not sum due to rounding.
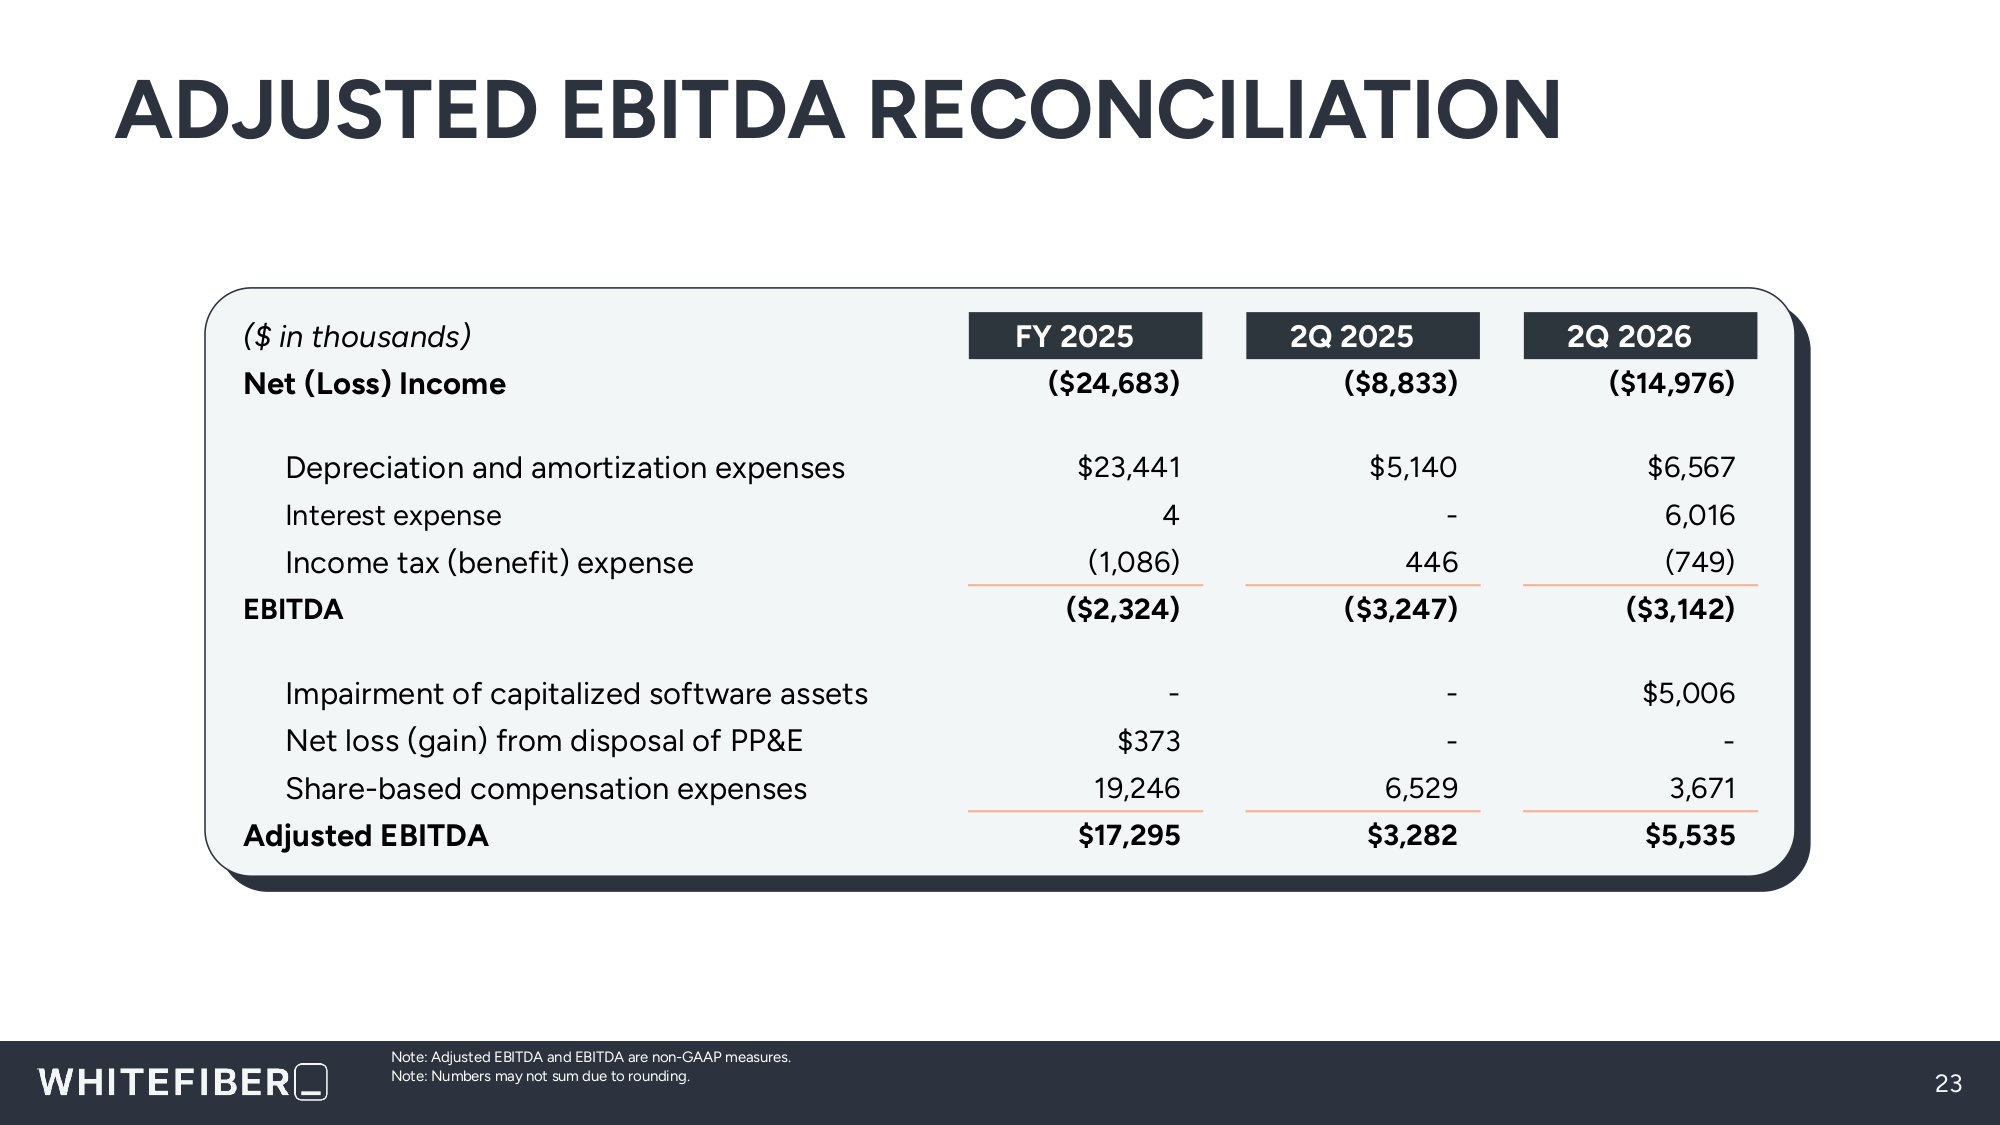
2Q 2026 2Q 2025 FY 2025 ($ in thousands) ($14,976) ($8,833) ($24,683) Net (Loss) Income $6,567 $5,140 $23,441 Depreciation and amortization expenses 6,016 - 4 Interest expense (749) 446 (1,086) Income tax (benefit) expense ($3,142) ($3,247) ($2,324) EBITDA $5,006 - - Impairment of capitalized software assets - - $373 Net loss (gain) from disposal of PP&E 3,671 6,529 19,246 Share - based compensation expenses $5,535 $3,282 $17,295 Adjusted EBITDA ADJUSTED EBITDA RECONCILIATION 23 Note: Adjusted EBITDA and EBITDA are non - GAAP measures. Note: Numbers may not sum due to rounding.