
September 14, 2026 Albert Luderer, PhD Chairman and Interim CEO Bionano
This presentation contains forward-looking statements within the meaning of the safe harbor provisions of the Private Securities Litigation Reform Act of 1995. All statements other than statements of historical facts contained in this press release, including statements regarding our future results of operations or financial condition, business strategy and plans, and objectives of management for future operations, are forward-looking statements. Words such as “anticipate,” “believe,” “could,” “estimate,” “expect,” “intend,” “may,” “plan,” “potential,” “predict,” “project,” “should,” “target,” “will,” or “would” and similar expressions (as well as other words or expressions referencing future events, conditions or circumstances) convey uncertainty of future events or outcomes and are intended to identify forward-looking statements. Forward-looking statements include statements regarding our intentions, beliefs, projections, outlook, analyses or current expectations concerning, among other things: our expectations regarding market adoption of our products; our commercial prospects and future financial and operating results; and our ability to meet our stated goals and commercial opportunities, including our any financial guidance. Each of these forward-looking statements involves risks and uncertainties. Accordingly, investors and prospective investors are cautioned not to place undue reliance on these forward-looking statements as they involve inherent risk and uncertainty (both general and specific) and should note that they are provided as a general guide only and should not be relied on as an indication or guarantee of future performance. There are a number of important factors that could cause the actual results to differ materially from those expressed in any forward-looking statement made by us. These factors include, but are not limited to: our ability to improve our margins, extend our cash runway and reach a potential pathway to profitability; our ability to retire our debt at maturity; our ability to continue as a going concern as disclosed in our filings with the SEC, which requires us to manage costs and obtain significant additional financing to fund our strategic plans and commercialization efforts; our ability to execute on our strategy and achieve our objectives; the impact and utility of our cost savings initiative and our recent financing; our ability to continue to drive optical genome mapping (OGM) adoption by potential customers for routine or clinical use in genomic analysis; the impact, or lack thereof, of Category I CPT codes to accelerate or increase the adoption of OGM; continued research, presentations and publications involving OGM and its utility compared to traditional cytogenetics and our technologies; the impact of our Stratys™ system and VIA™ software to increase throughput and simplify analysis of OGM data; our ability to drive adoption of OGM and our technology solutions; our ability to further deploy new products and applications for our technology platforms; our expectations and beliefs regarding future growth of the business and the markets in which we operate; our ability to consummate any strategic alternatives including the risk that if we fail to obtain additional financing we may seek relief under applicable insolvency laws; the size and growth potential of the markets for our products, and our ability to serve those markets; the rate and degree of market acceptance of our products; our ability to manage the growth of our business and integrate acquired businesses; our ability to expand our commercial organization to address effectively existing and new markets that we intend to target; the impact from future regulatory, judicial, and legislative changes or developments in the U.S. and foreign countries; our ability to compete effectively in a competitive industry; the introduction of competitive technologies or improvements in existing technologies and the success of any such technologies; the performance of our third-party contract sales organizations, suppliers and manufacturers; our ability to attract and retain key scientific or management personnel; the accuracy of our estimates regarding expenses, future revenues, reimbursement rates, capital requirements and needs for additional financing; the impact of adverse geopolitical and macroeconomic developments, such as recent and future bank failures, ongoing international conflicts, and related sanctions, regional or global pandemics, inflation, tariffs, increased cost of goods, supply chain issues, and global financial market conditions on our business and operations, as well as the business or operations of our suppliers, customers, manufacturers, research partners and other third parties with whom we conduct business and our expectations with respect to the duration of such impacts and the resulting effects on our business; our ability to realize the anticipated benefits and synergies of our prior and any future acquisitions or other strategic transactions; our ability to attract collaborators and strategic partnerships; and the risks and uncertainties associated with our business and financial condition in general, including the risks and uncertainties described in our filings with the Securities and Exchange Commission (“SEC”), including, without limitation, our Annual Report on Form 10-K for the year ended December 31, 2025, any subsequently filed Quarterly Reports on Form 10-Q and in other filings subsequently made by us with the SEC. All forward-looking statements contained in this press release speak only as of the date on which they were made and are based on management’s assumptions and estimates as of such date. We do not undertake any obligation to publicly update any forward-looking statements, whether as a result of the receipt of new information, the occurrence of future events or otherwise, except as may be required by law. Unless specifically noted otherwise, Bionano’s products are for research use only (RUO) and are not for use in diagnostic procedures. Safe Harbor Statement
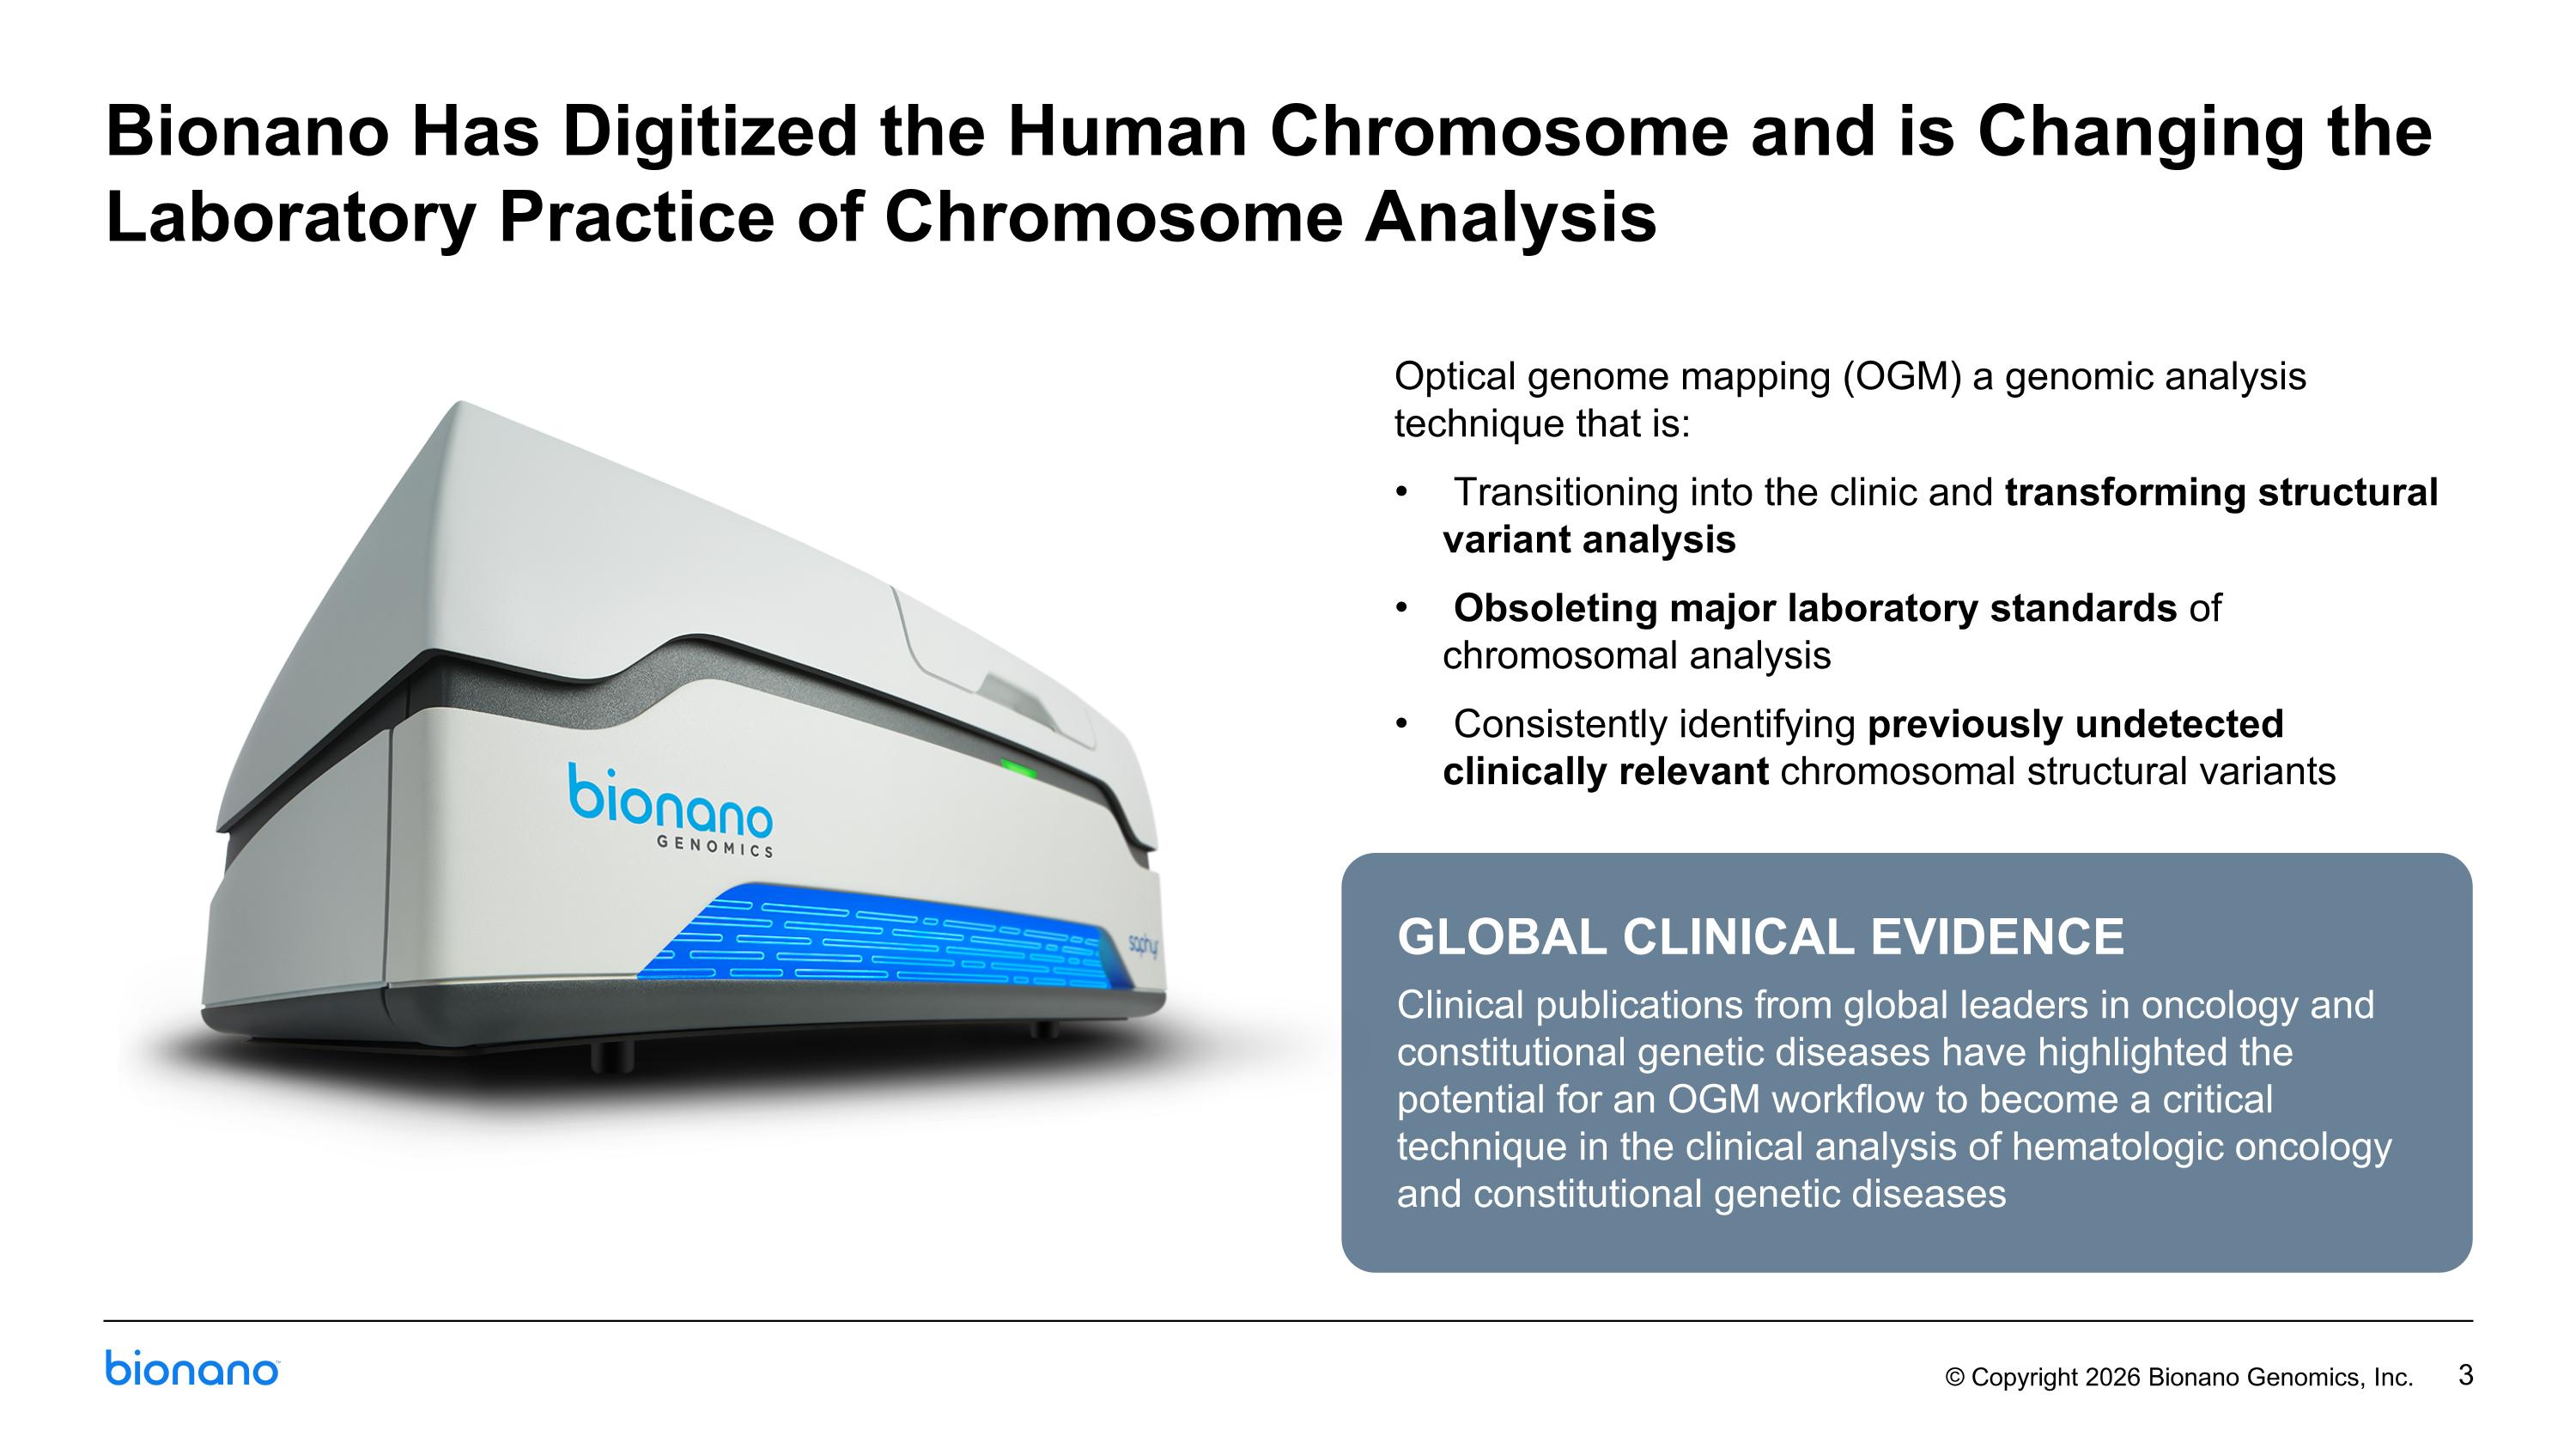
Optical genome mapping (OGM) a genomic analysis technique that is: Transitioning into the clinic and transforming structural variant analysis Obsoleting major laboratory standards of chromosomal analysis Consistently identifying previously undetected clinically relevant chromosomal structural variants Bionano Has Digitized the Human Chromosome and is Changing the Laboratory Practice of Chromosome Analysis GLOBAL CLINICAL EVIDENCE Clinical publications from global leaders in oncology and constitutional genetic diseases have highlighted the potential for an OGM workflow to become a critical technique in the clinical analysis of hematologic oncology and constitutional genetic diseases
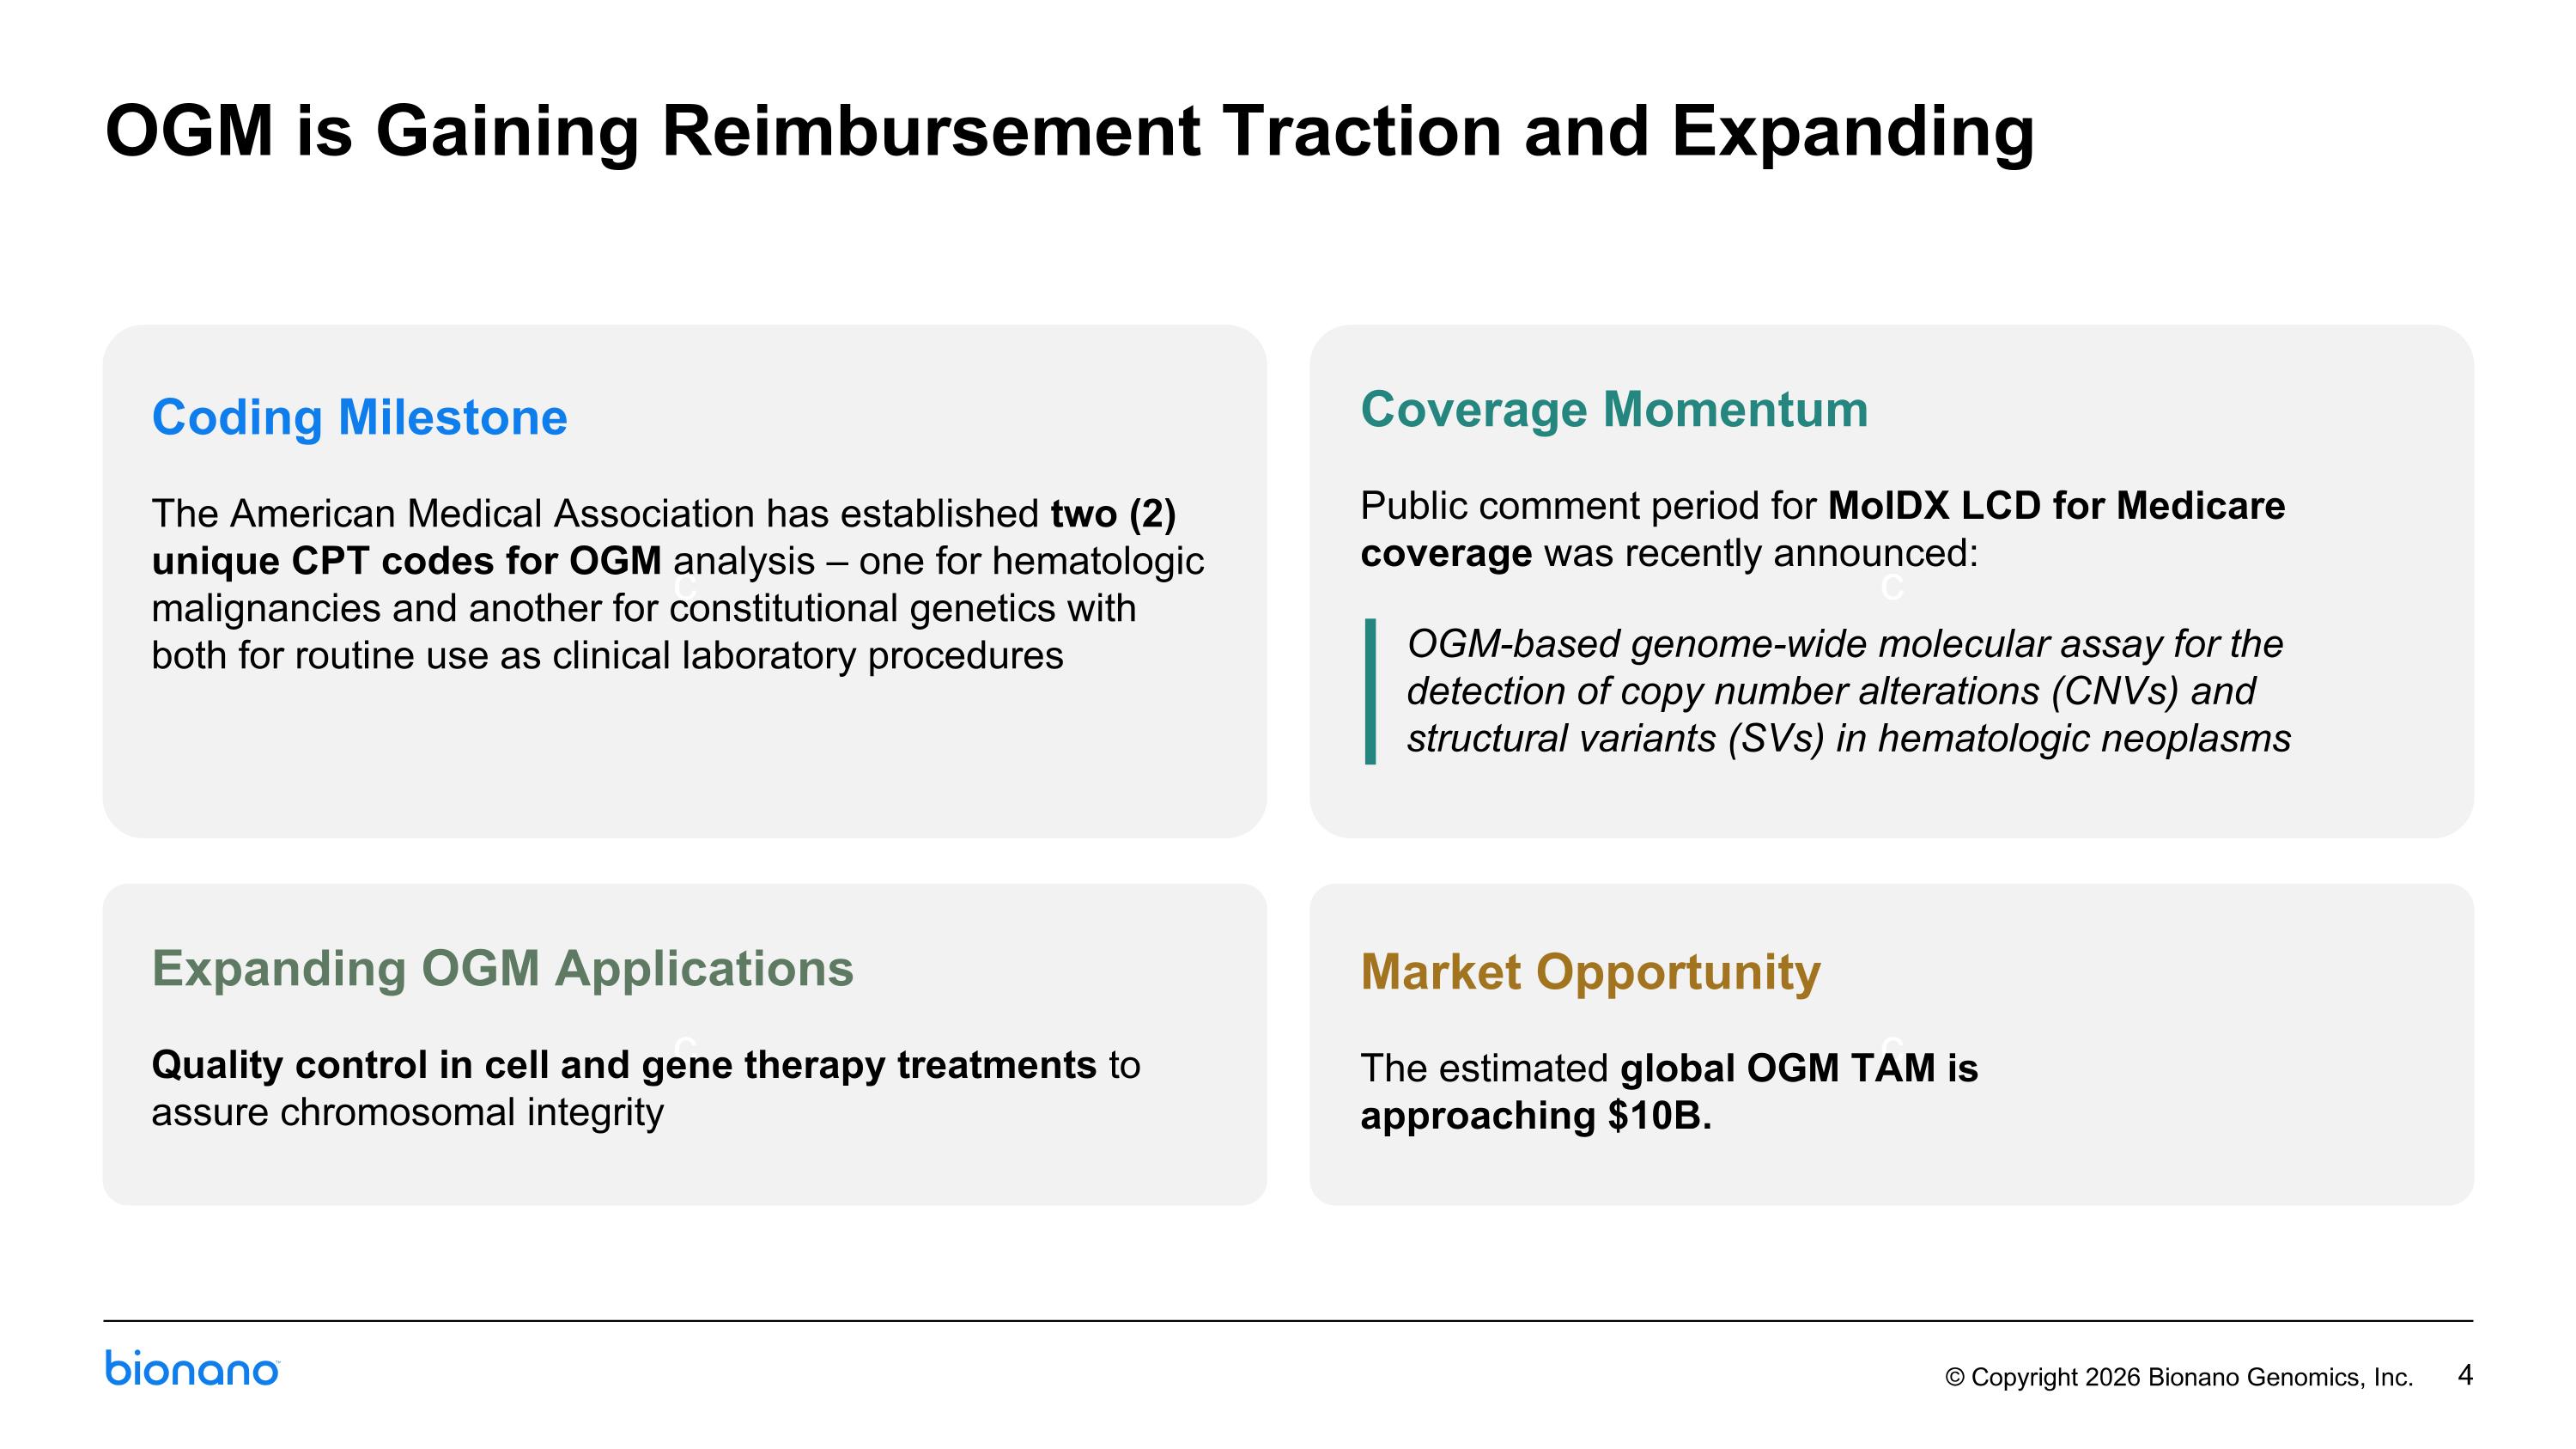
OGM is Gaining Reimbursement Traction and Expanding c c c c Coding Milestone The American Medical Association has established two (2) unique CPT codes for OGM analysis – one for hematologic malignancies and another for constitutional genetics with both for routine use as clinical laboratory procedures Market Opportunity The estimated global OGM TAM is approaching $10B. Expanding OGM Applications Quality control in cell and gene therapy treatments to assure chromosomal integrity Coverage Momentum Public comment period for MolDX LCD for Medicare coverage was recently announced: OGM-based genome-wide molecular assay for the detection of copy number alterations (CNVs) and structural variants (SVs) in hematologic neoplasms
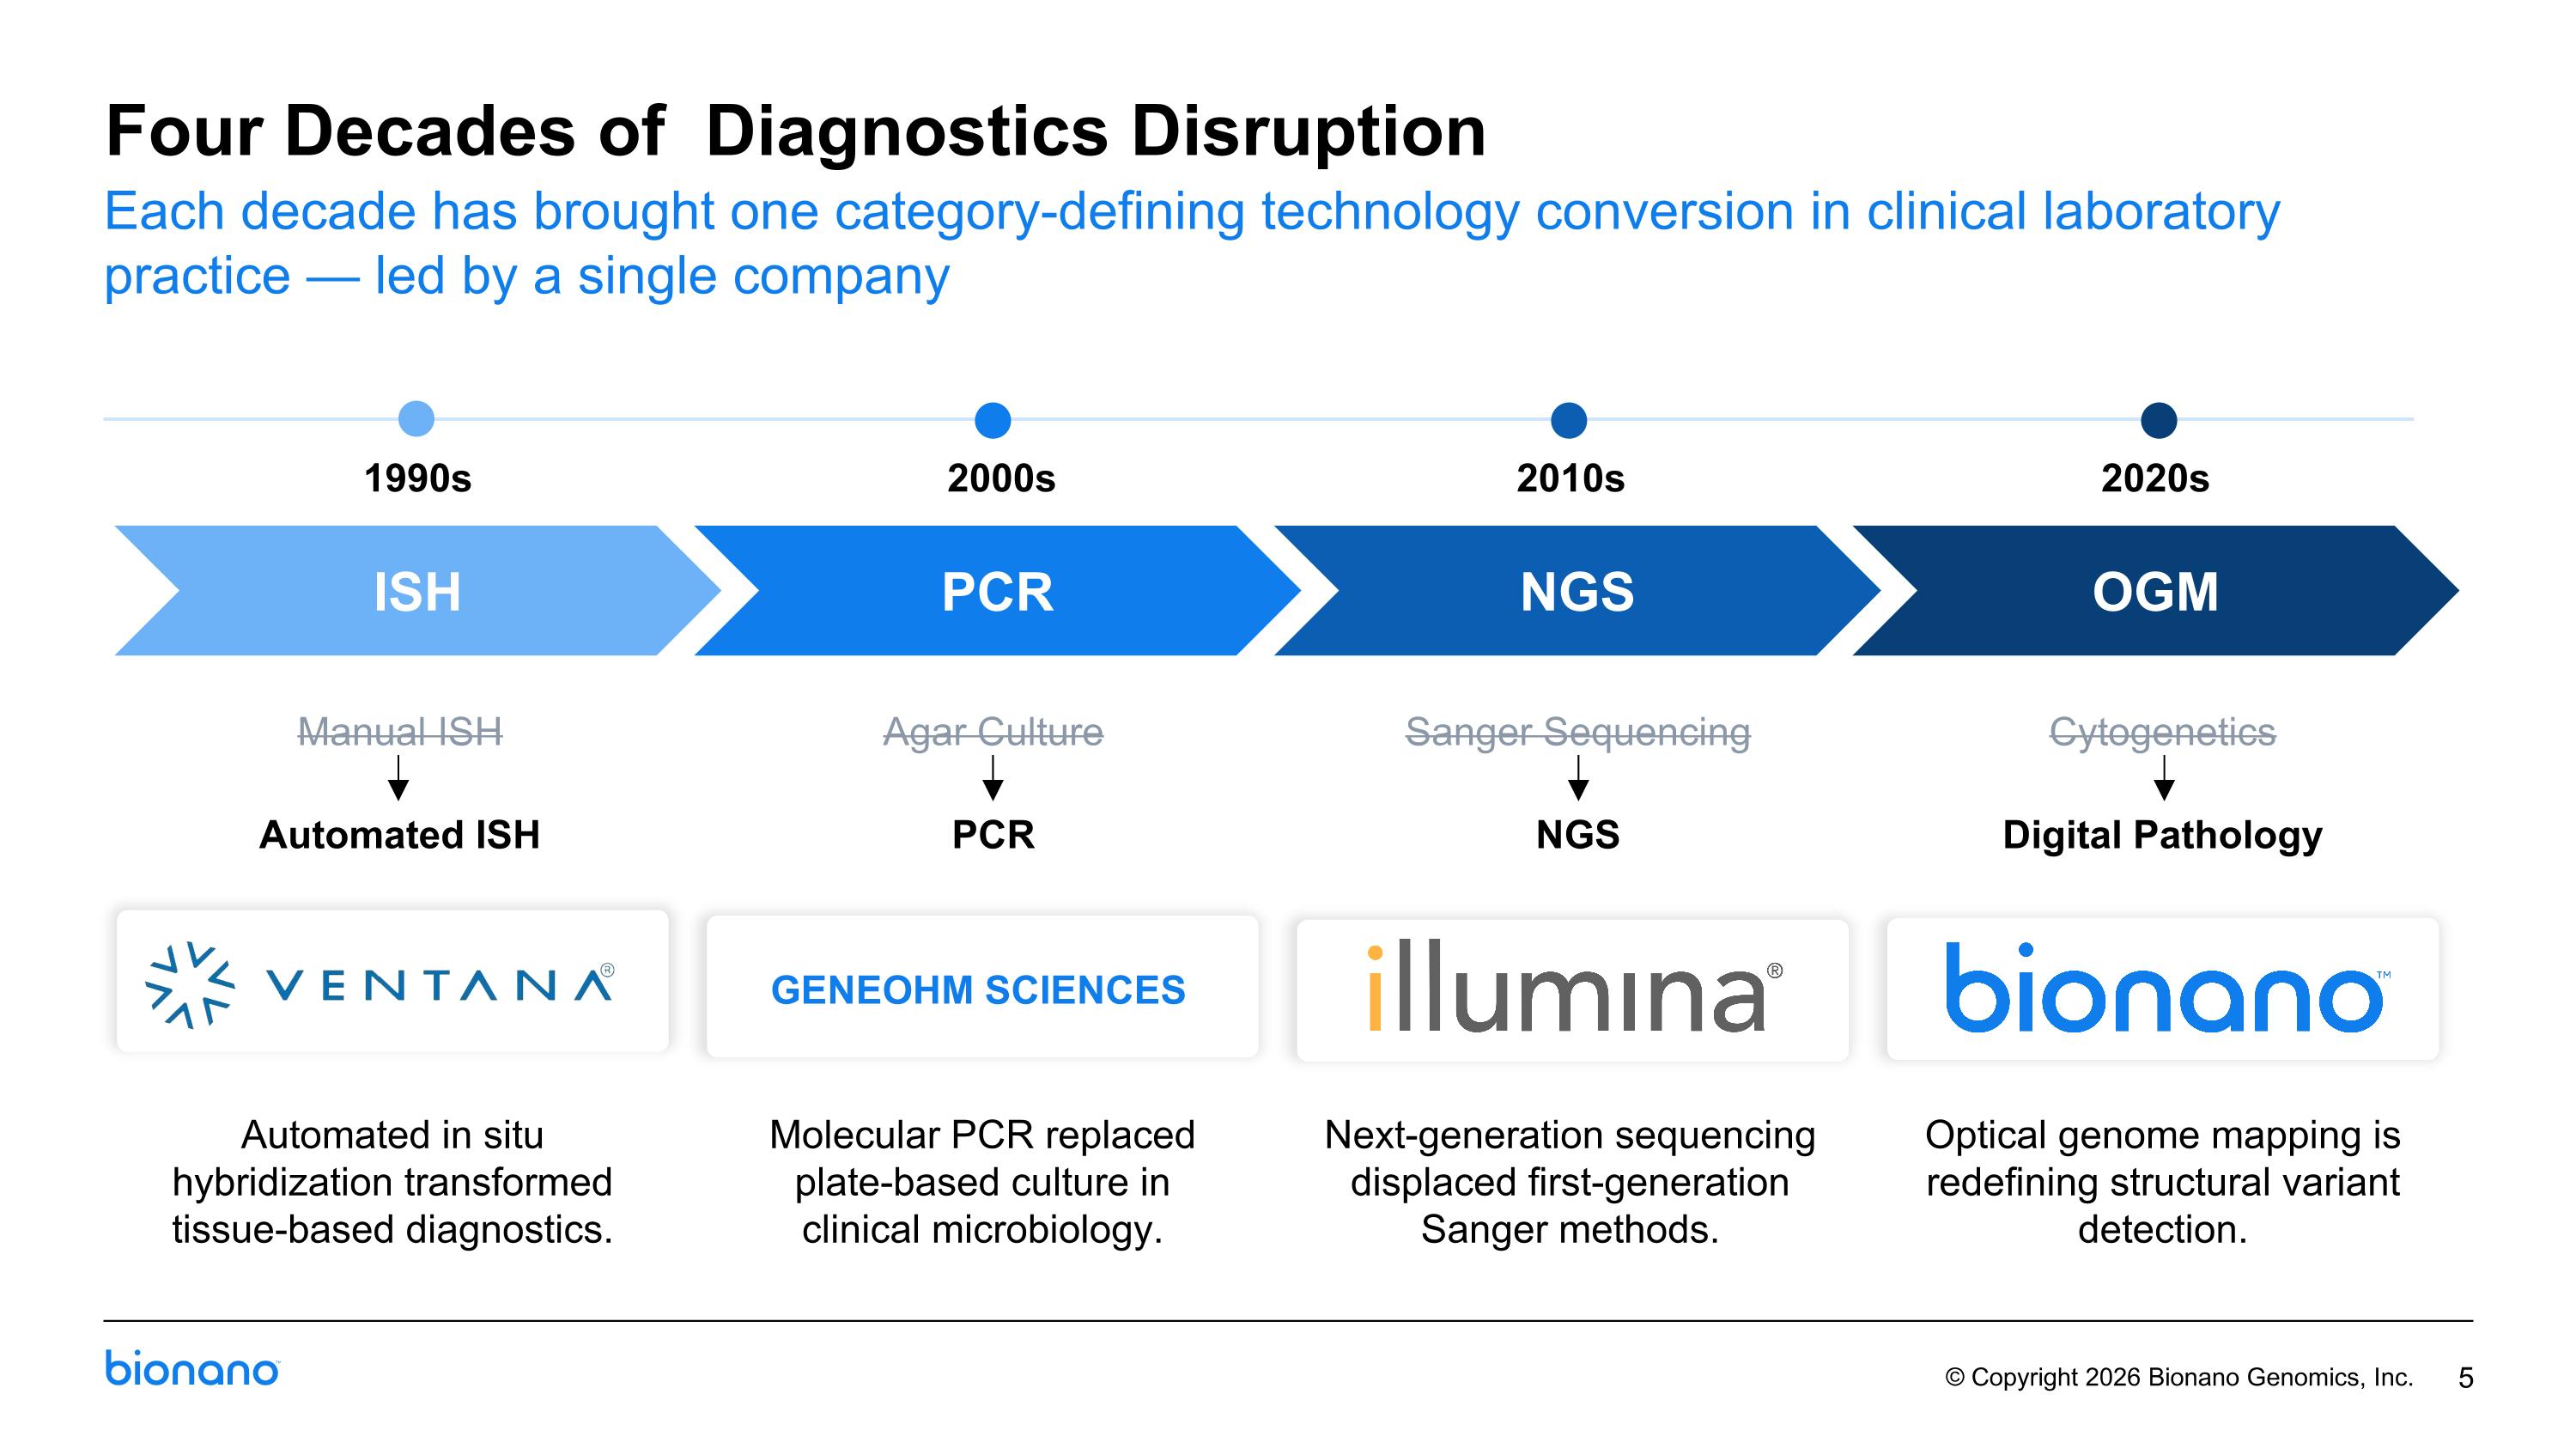
Four Decades of Diagnostics Disruption 1990s Manual ISH Automated ISH 2000s Agar Culture PCR GENEOHM SCIENCES 2010s Sanger Sequencing NGS 2020s Cytogenetics Digital Pathology Each decade has brought one category-defining technology conversion in clinical laboratory practice — led by a single company ISH PCR NGS OGM Automated in situ hybridization transformed tissue-based diagnostics. Optical genome mapping is redefining structural variant detection. Next-generation sequencing displaced first-generation Sanger methods. Molecular PCR replaced plate-based culture in clinical microbiology.
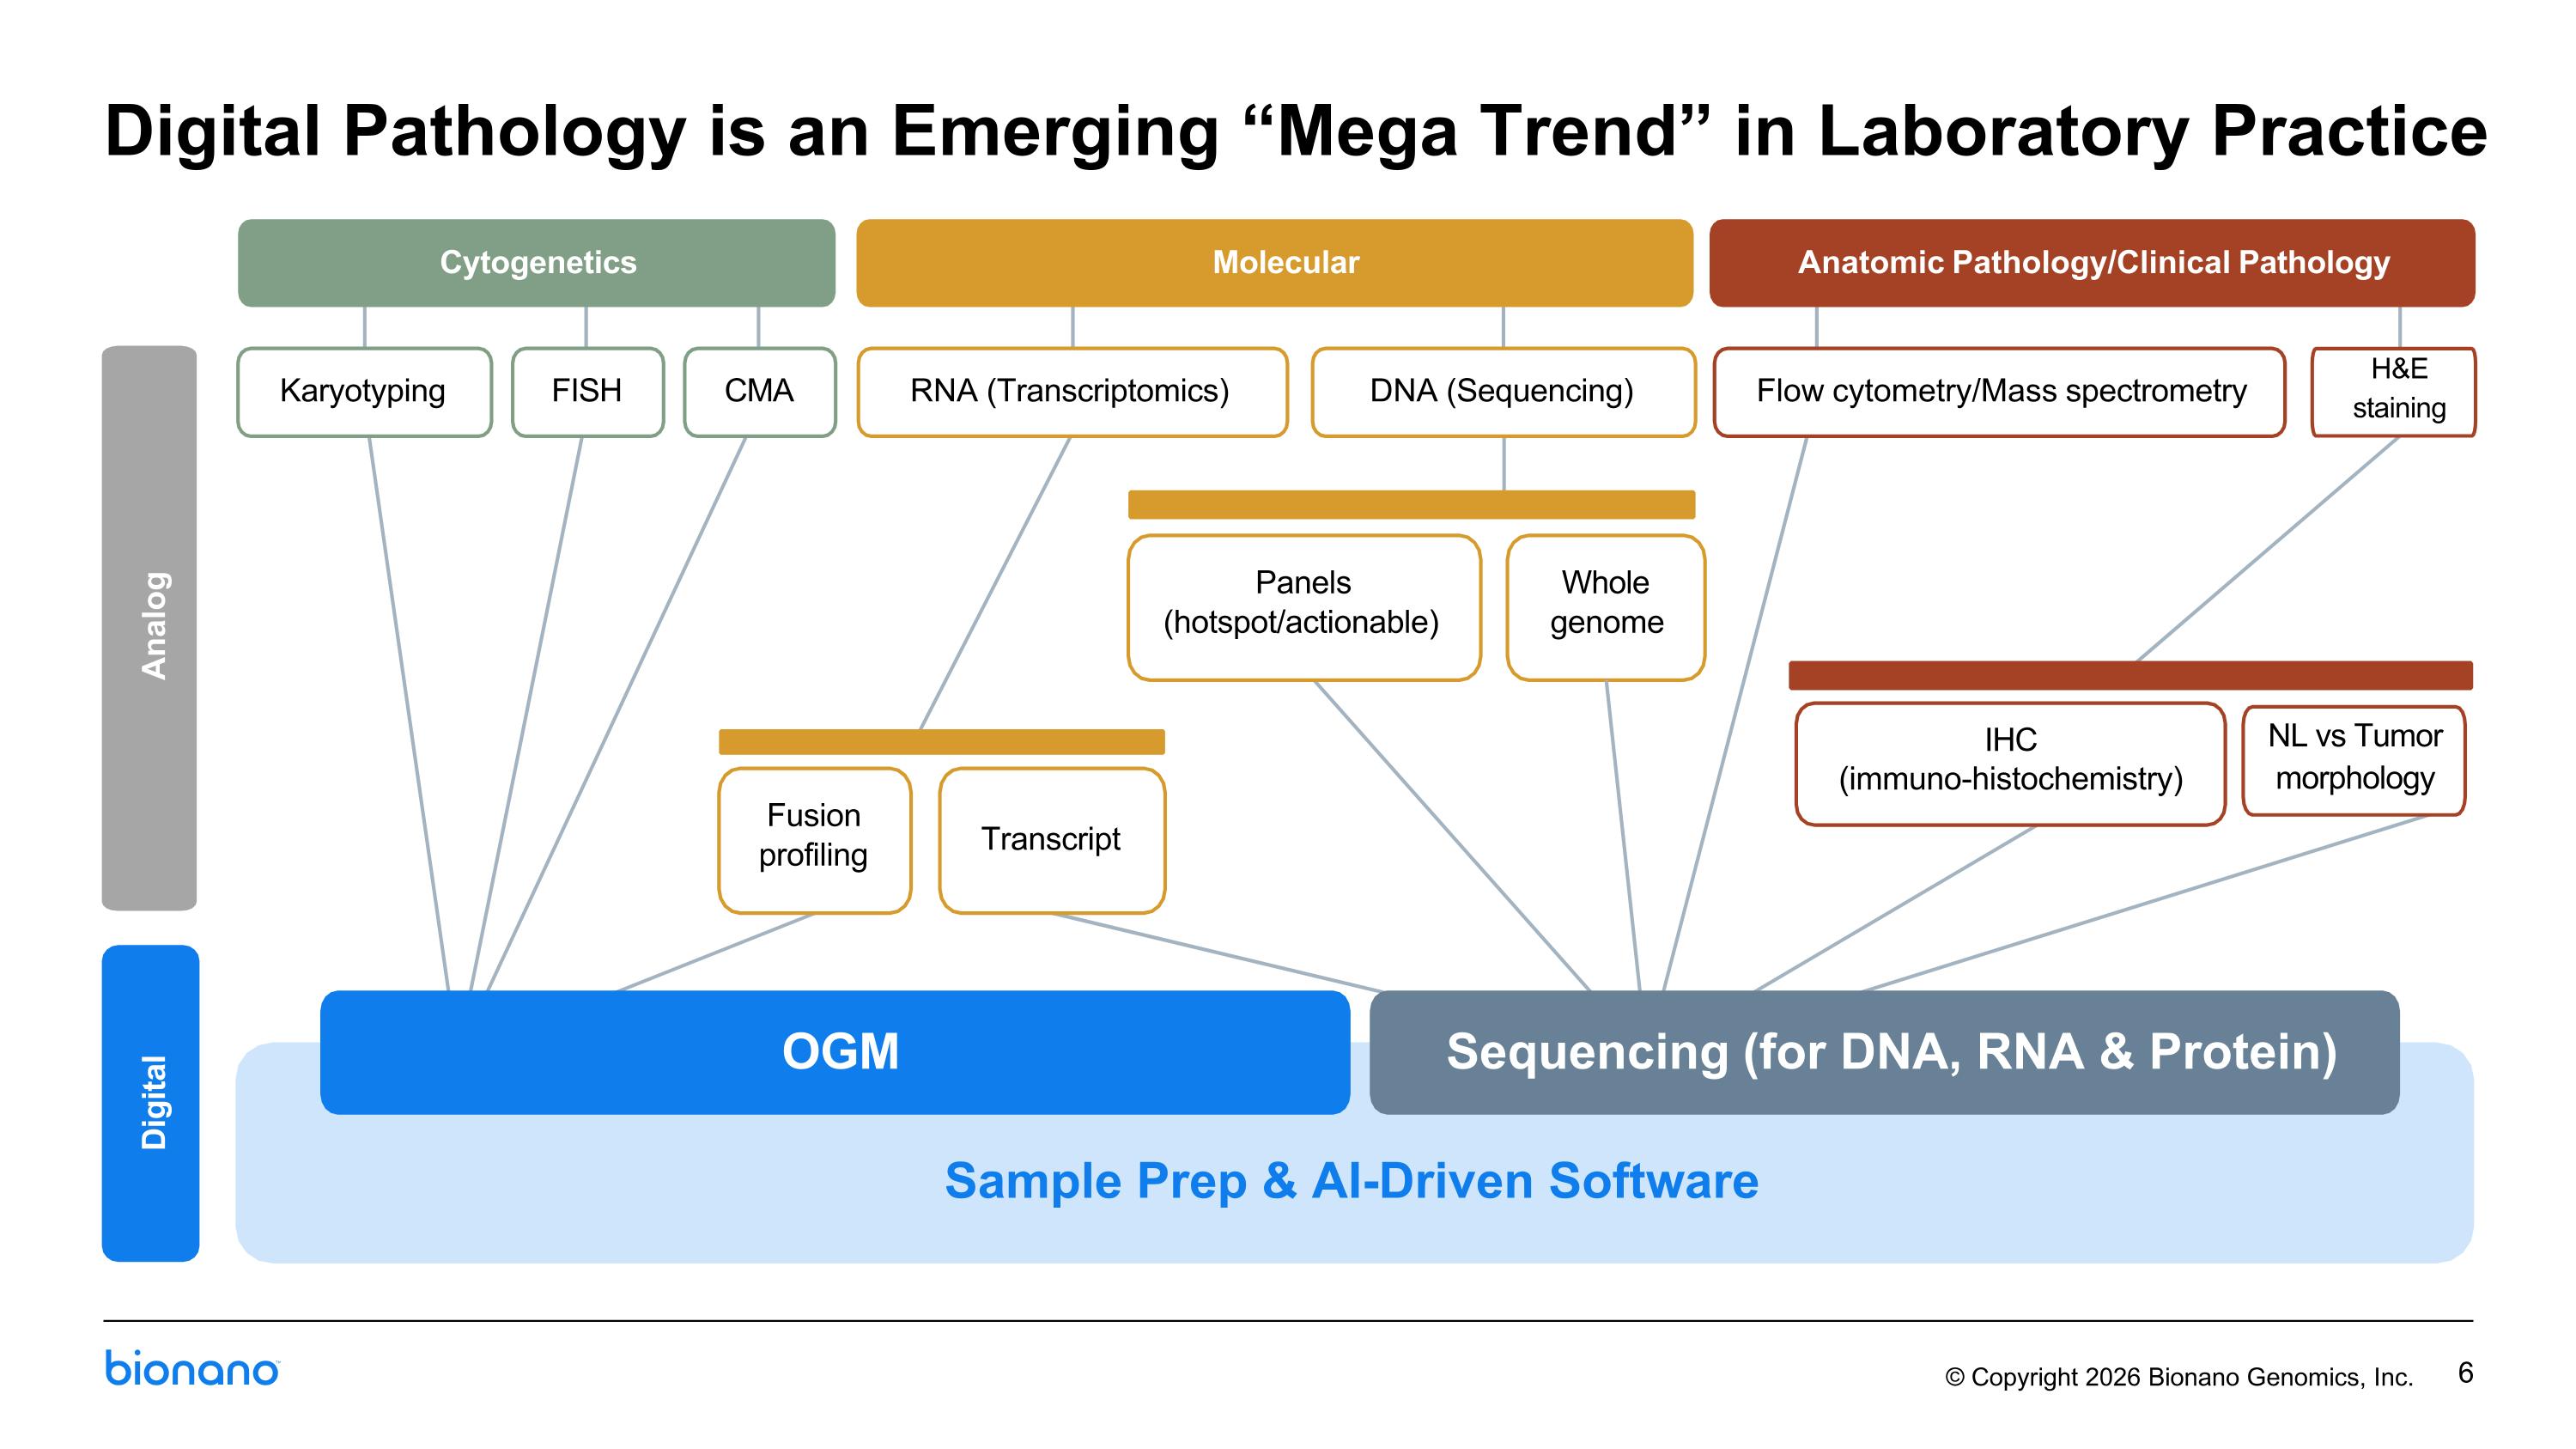
Digital Pathology is an Emerging “Mega Trend” in Laboratory Practice Cytogenetics Molecular Anatomic Pathology/Clinical Pathology Karyotyping FISH CMA RNA (Transcriptomics) DNA (Sequencing) Flow cytometry/Mass spectrometry Analog Fusion profiling Transcript Panels (hotspot/actionable) Whole genome IHC (immuno-histochemistry) H&E staining NL vs Tumor morphology OGM Sequencing (for DNA, RNA & Protein) Sample Prep & AI-Driven Software Digital
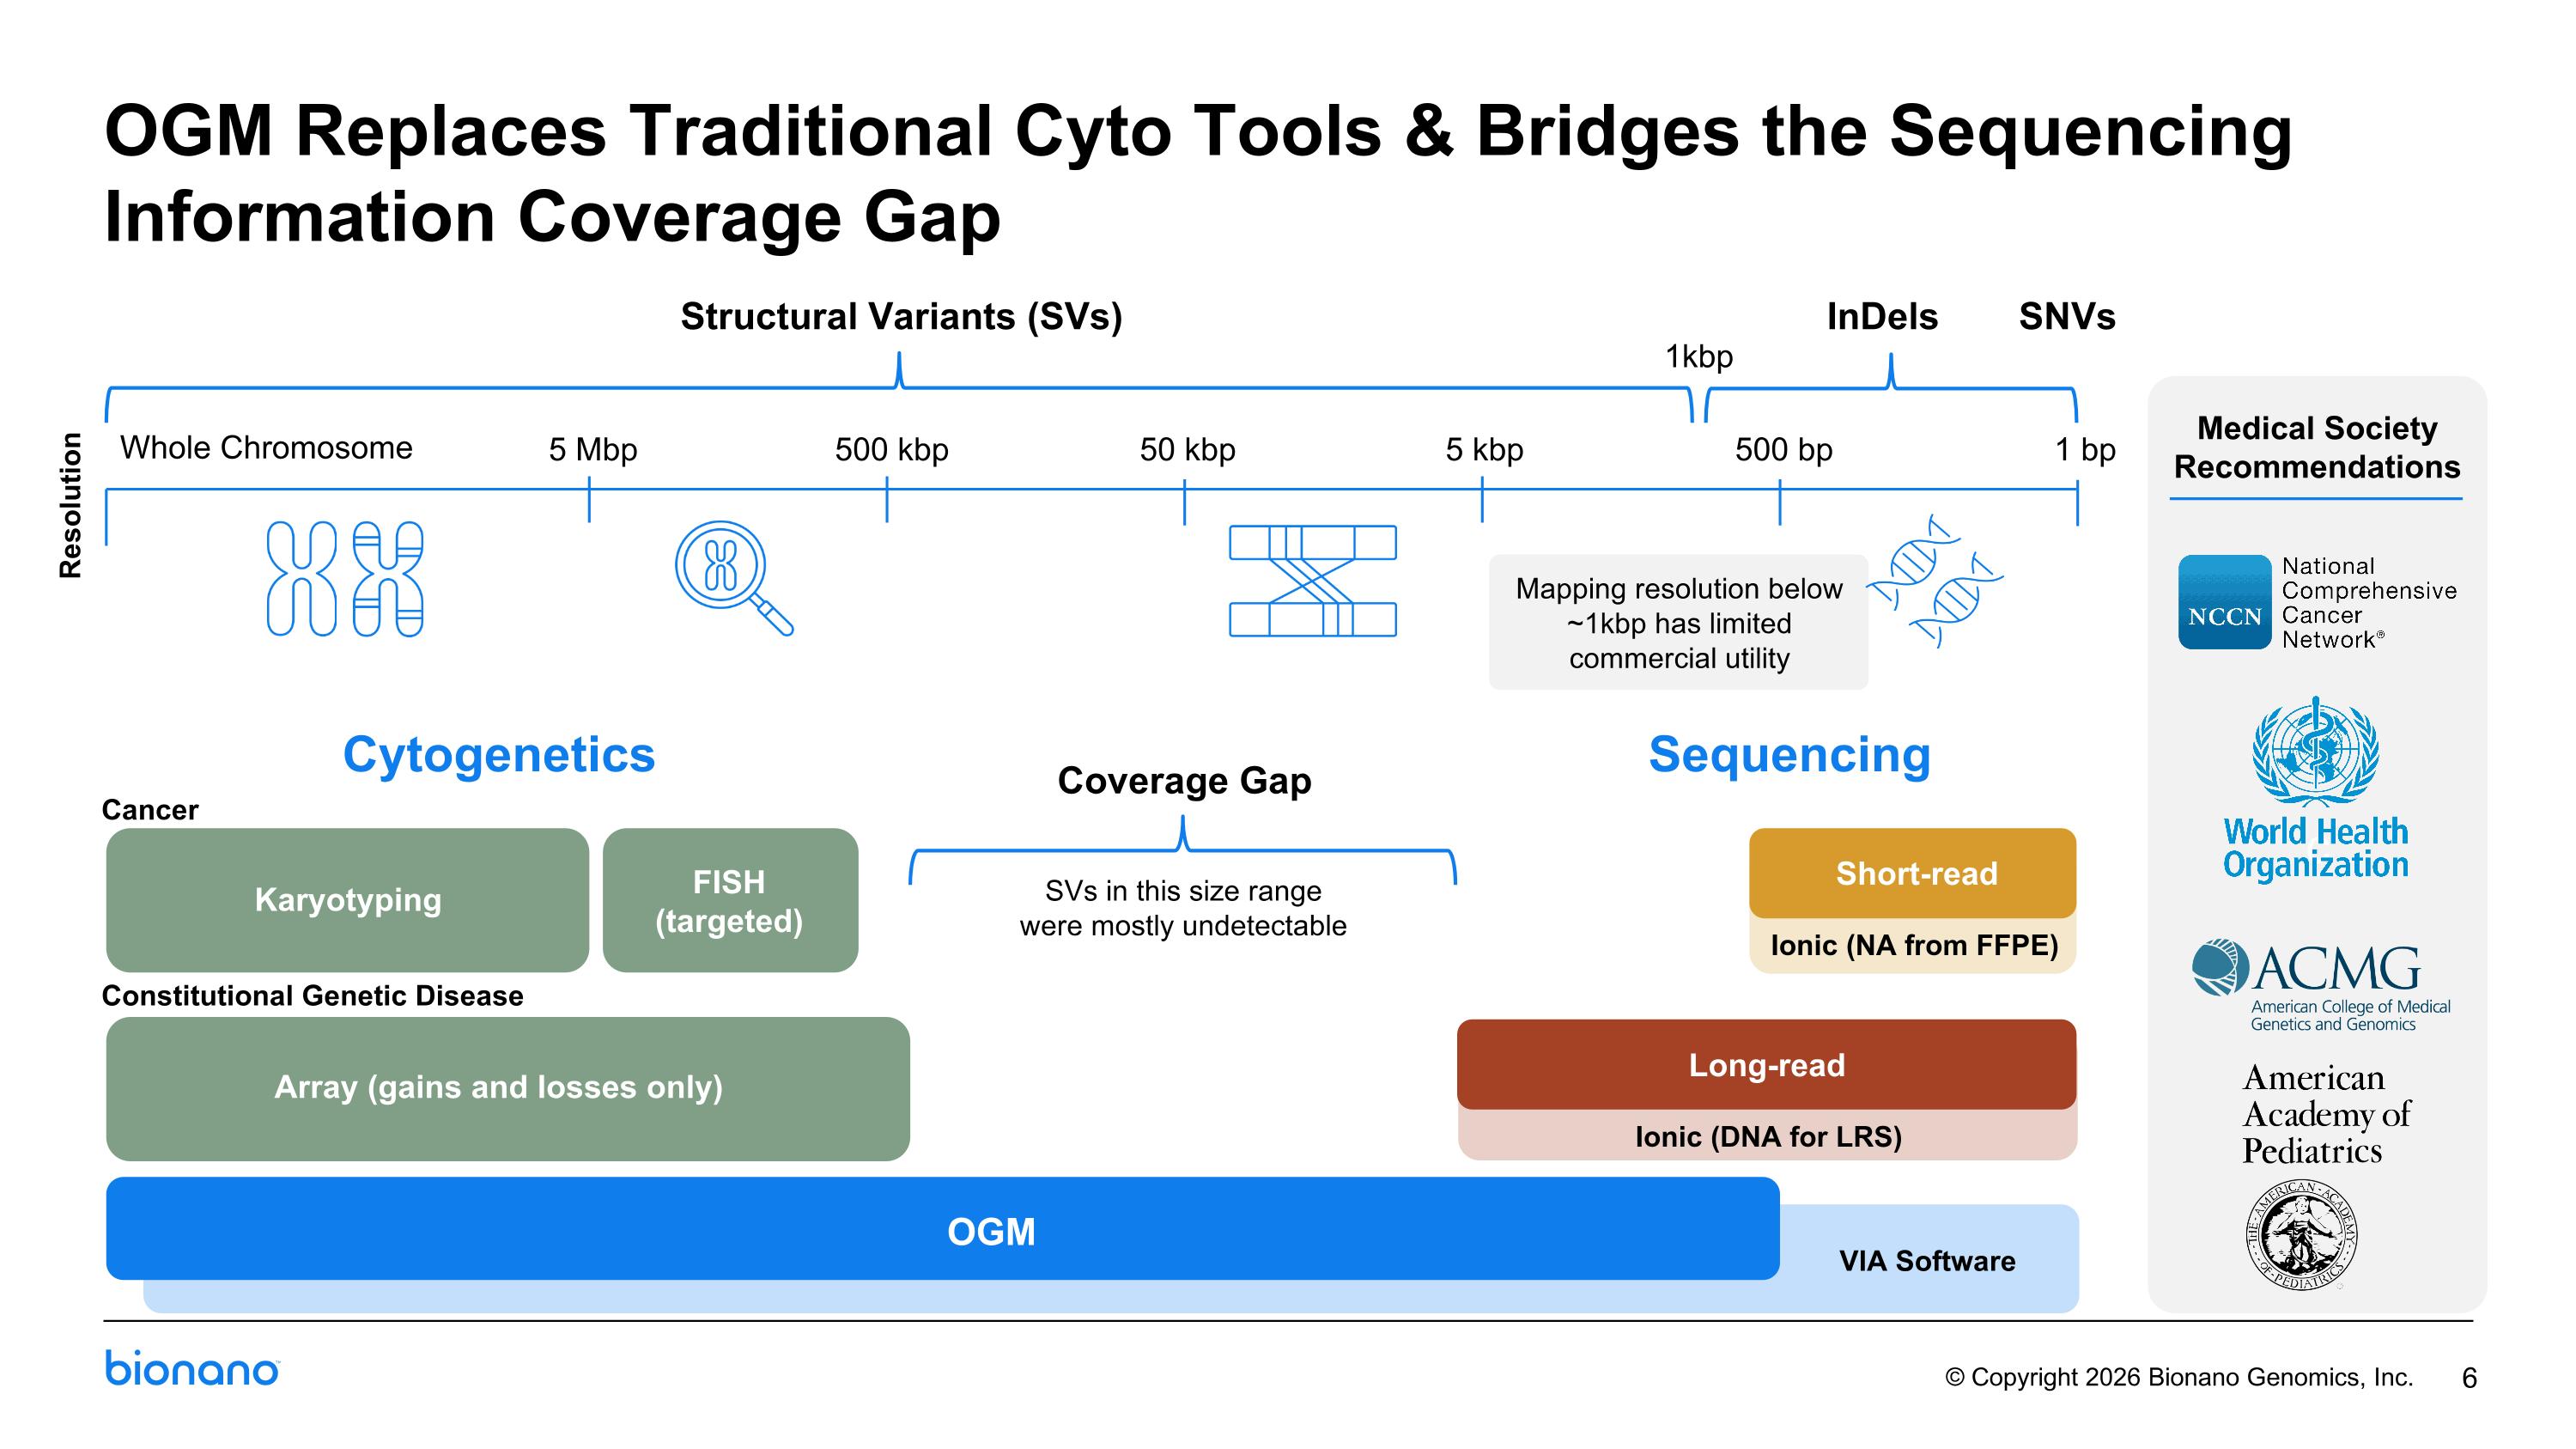
Short-read c Medical Society Recommendations Ionic (NA from FFPE) Sequencing Cytogenetics SNVs InDels Structural Variants (SVs) 5 Mbp 500 bp 1 bp 500 kbp 50 kbp 5 kbp 1kbp Whole Chromosome Karyotyping Array (gains and losses only) FISH (targeted) Long-read Coverage Gap OGM SVs in this size range were mostly undetectable Cancer Constitutional Genetic Disease Resolution VIA Software Ionic (DNA for LRS) Mapping resolution below ~1kbp has limited commercial utility 6 OGM Replaces Traditional Cyto Tools & Bridges the Sequencing Information Coverage Gap
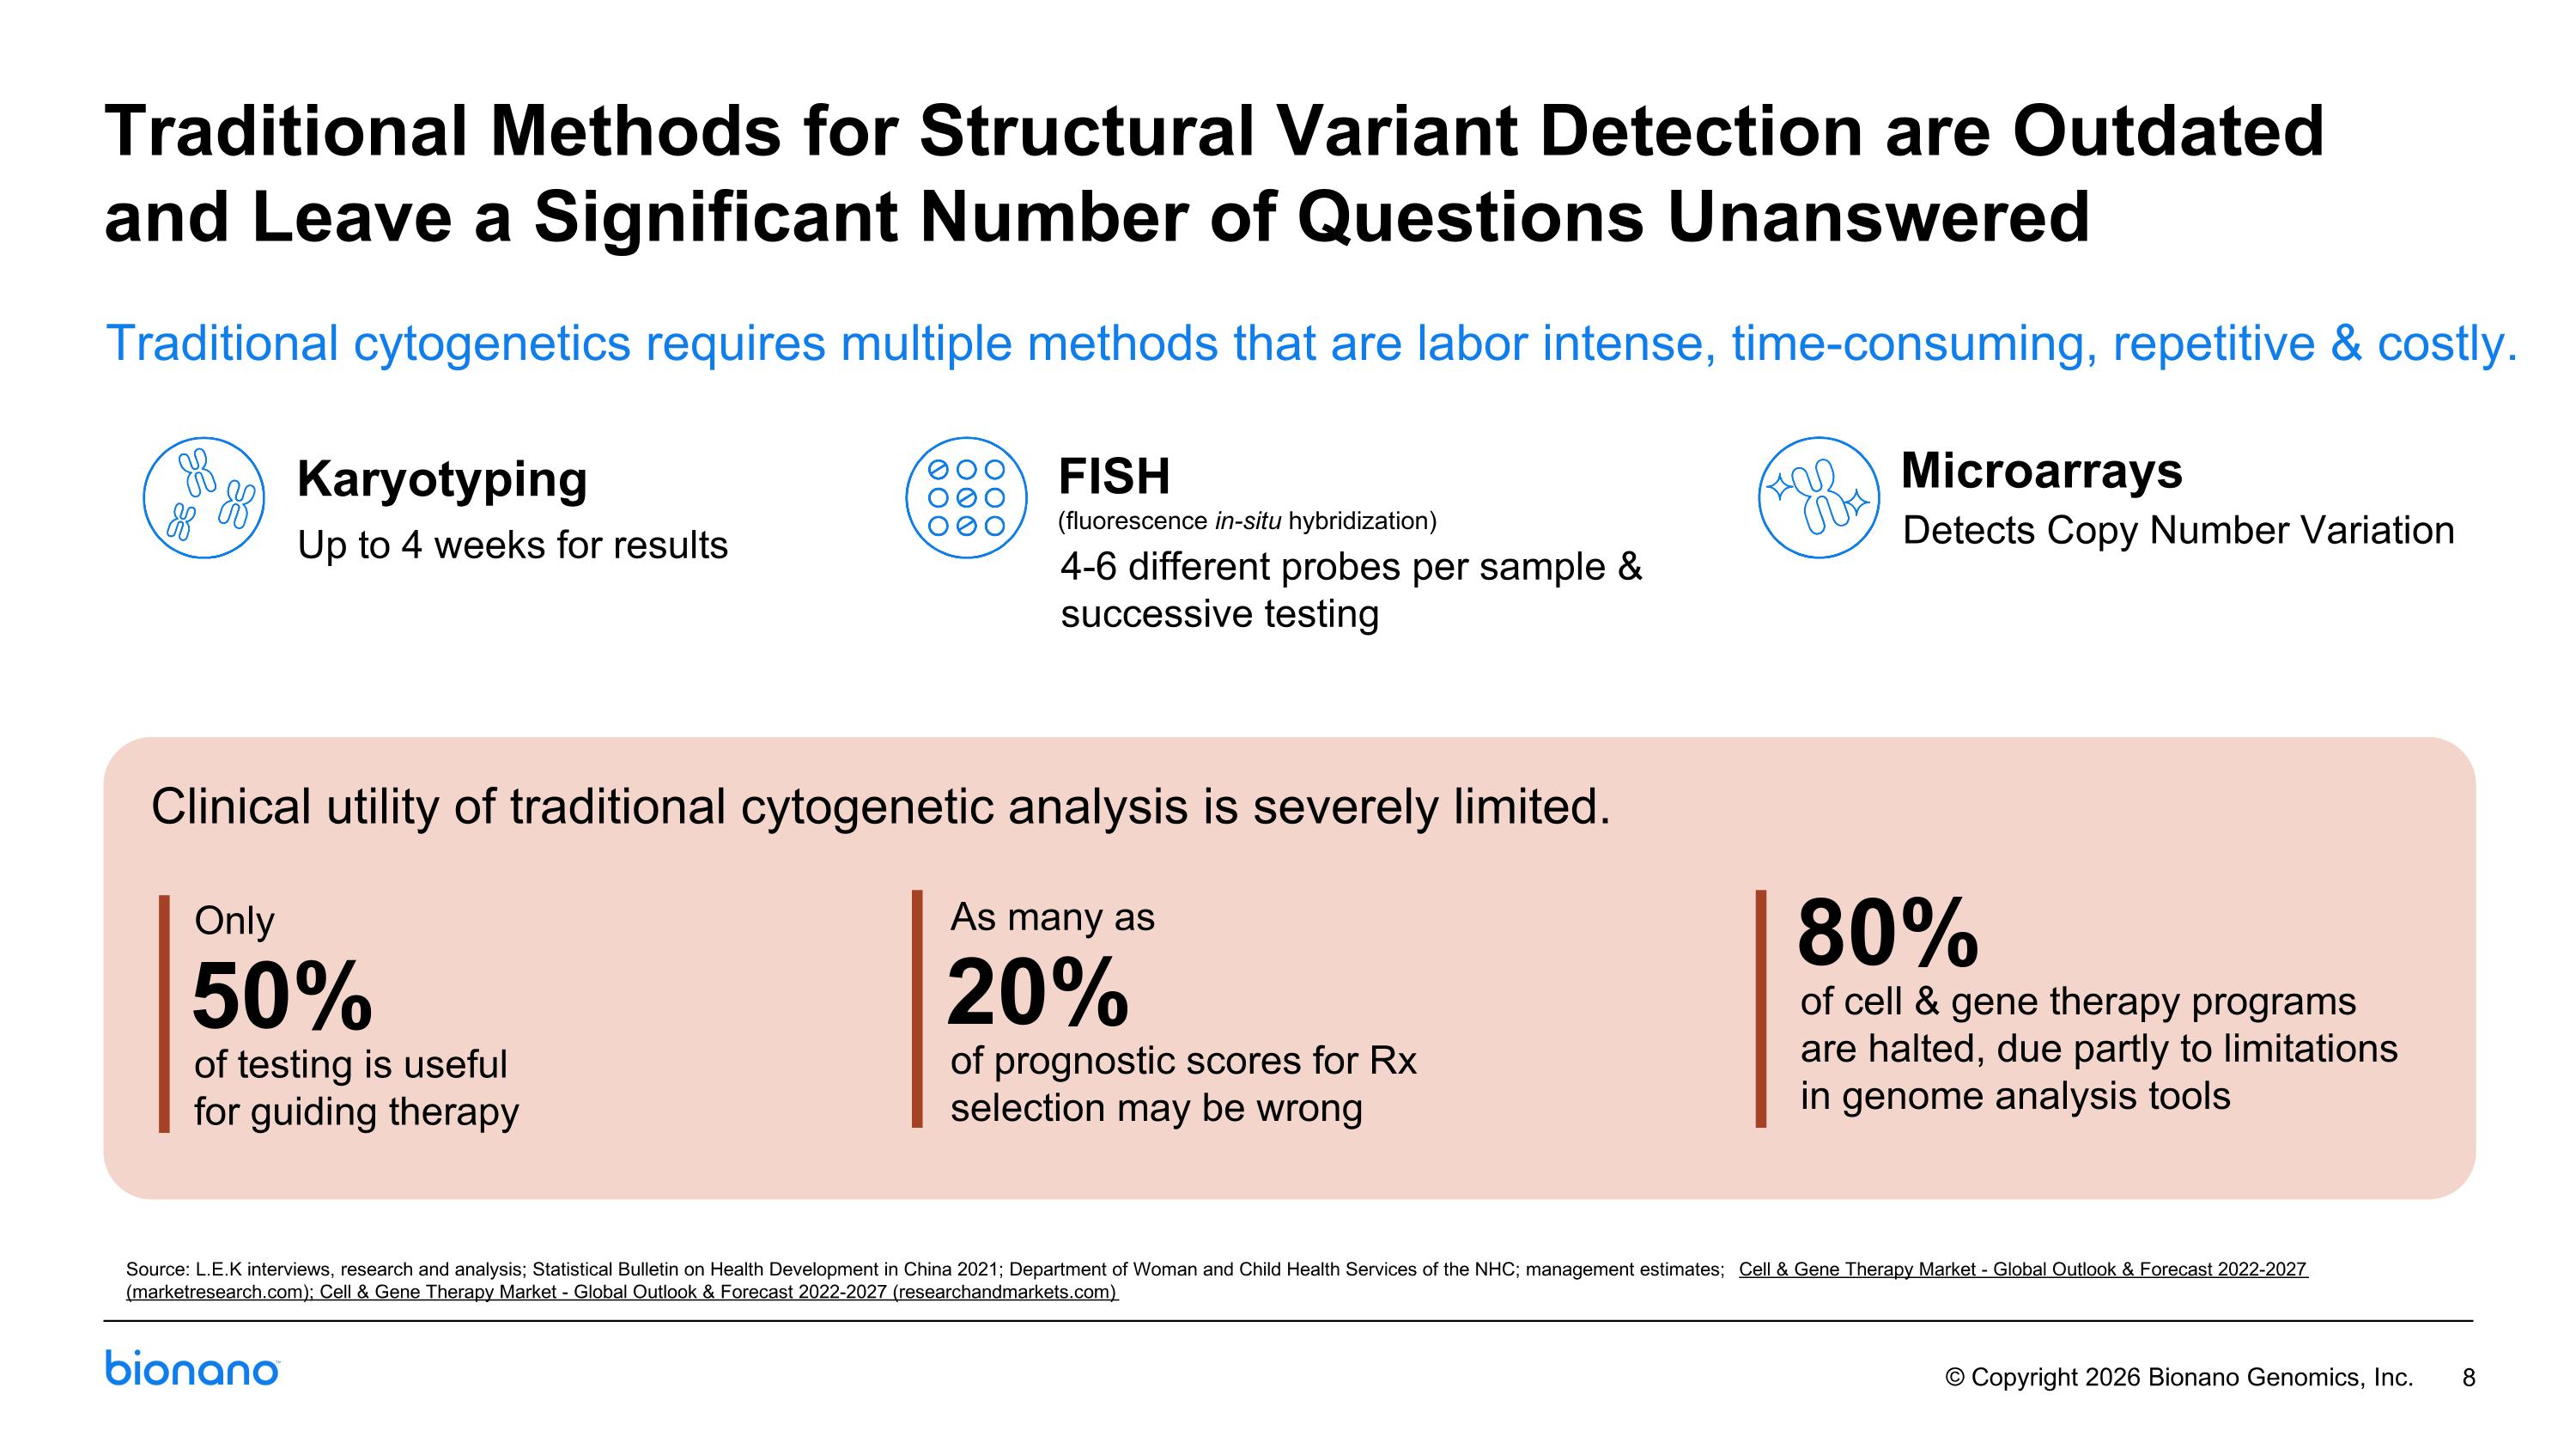
Traditional Methods for Structural Variant Detection are Outdated and Leave a Significant Number of Questions Unanswered Karyotyping FISH (fluorescence in-situ hybridization) Microarrays Traditional cytogenetics requires multiple methods that are labor intense, time-consuming, repetitive & costly. Up to 4 weeks for results 4-6 different probes per sample & successive testing Detects Copy Number Variation Clinical utility of traditional cytogenetic analysis is severely limited. Source: L.E.K interviews, research and analysis; Statistical Bulletin on Health Development in China 2021; Department of Woman and Child Health Services of the NHC; management estimates; Cell & Gene Therapy Market - Global Outlook & Forecast 2022-2027 (marketresearch.com); Cell & Gene Therapy Market - Global Outlook & Forecast 2022-2027 (researchandmarkets.com) of testing is useful for guiding therapy 50% Only of prognostic scores for Rx selection may be wrong 20% As many as of cell & gene therapy programs are halted, due partly to limitations in genome analysis tools 80%
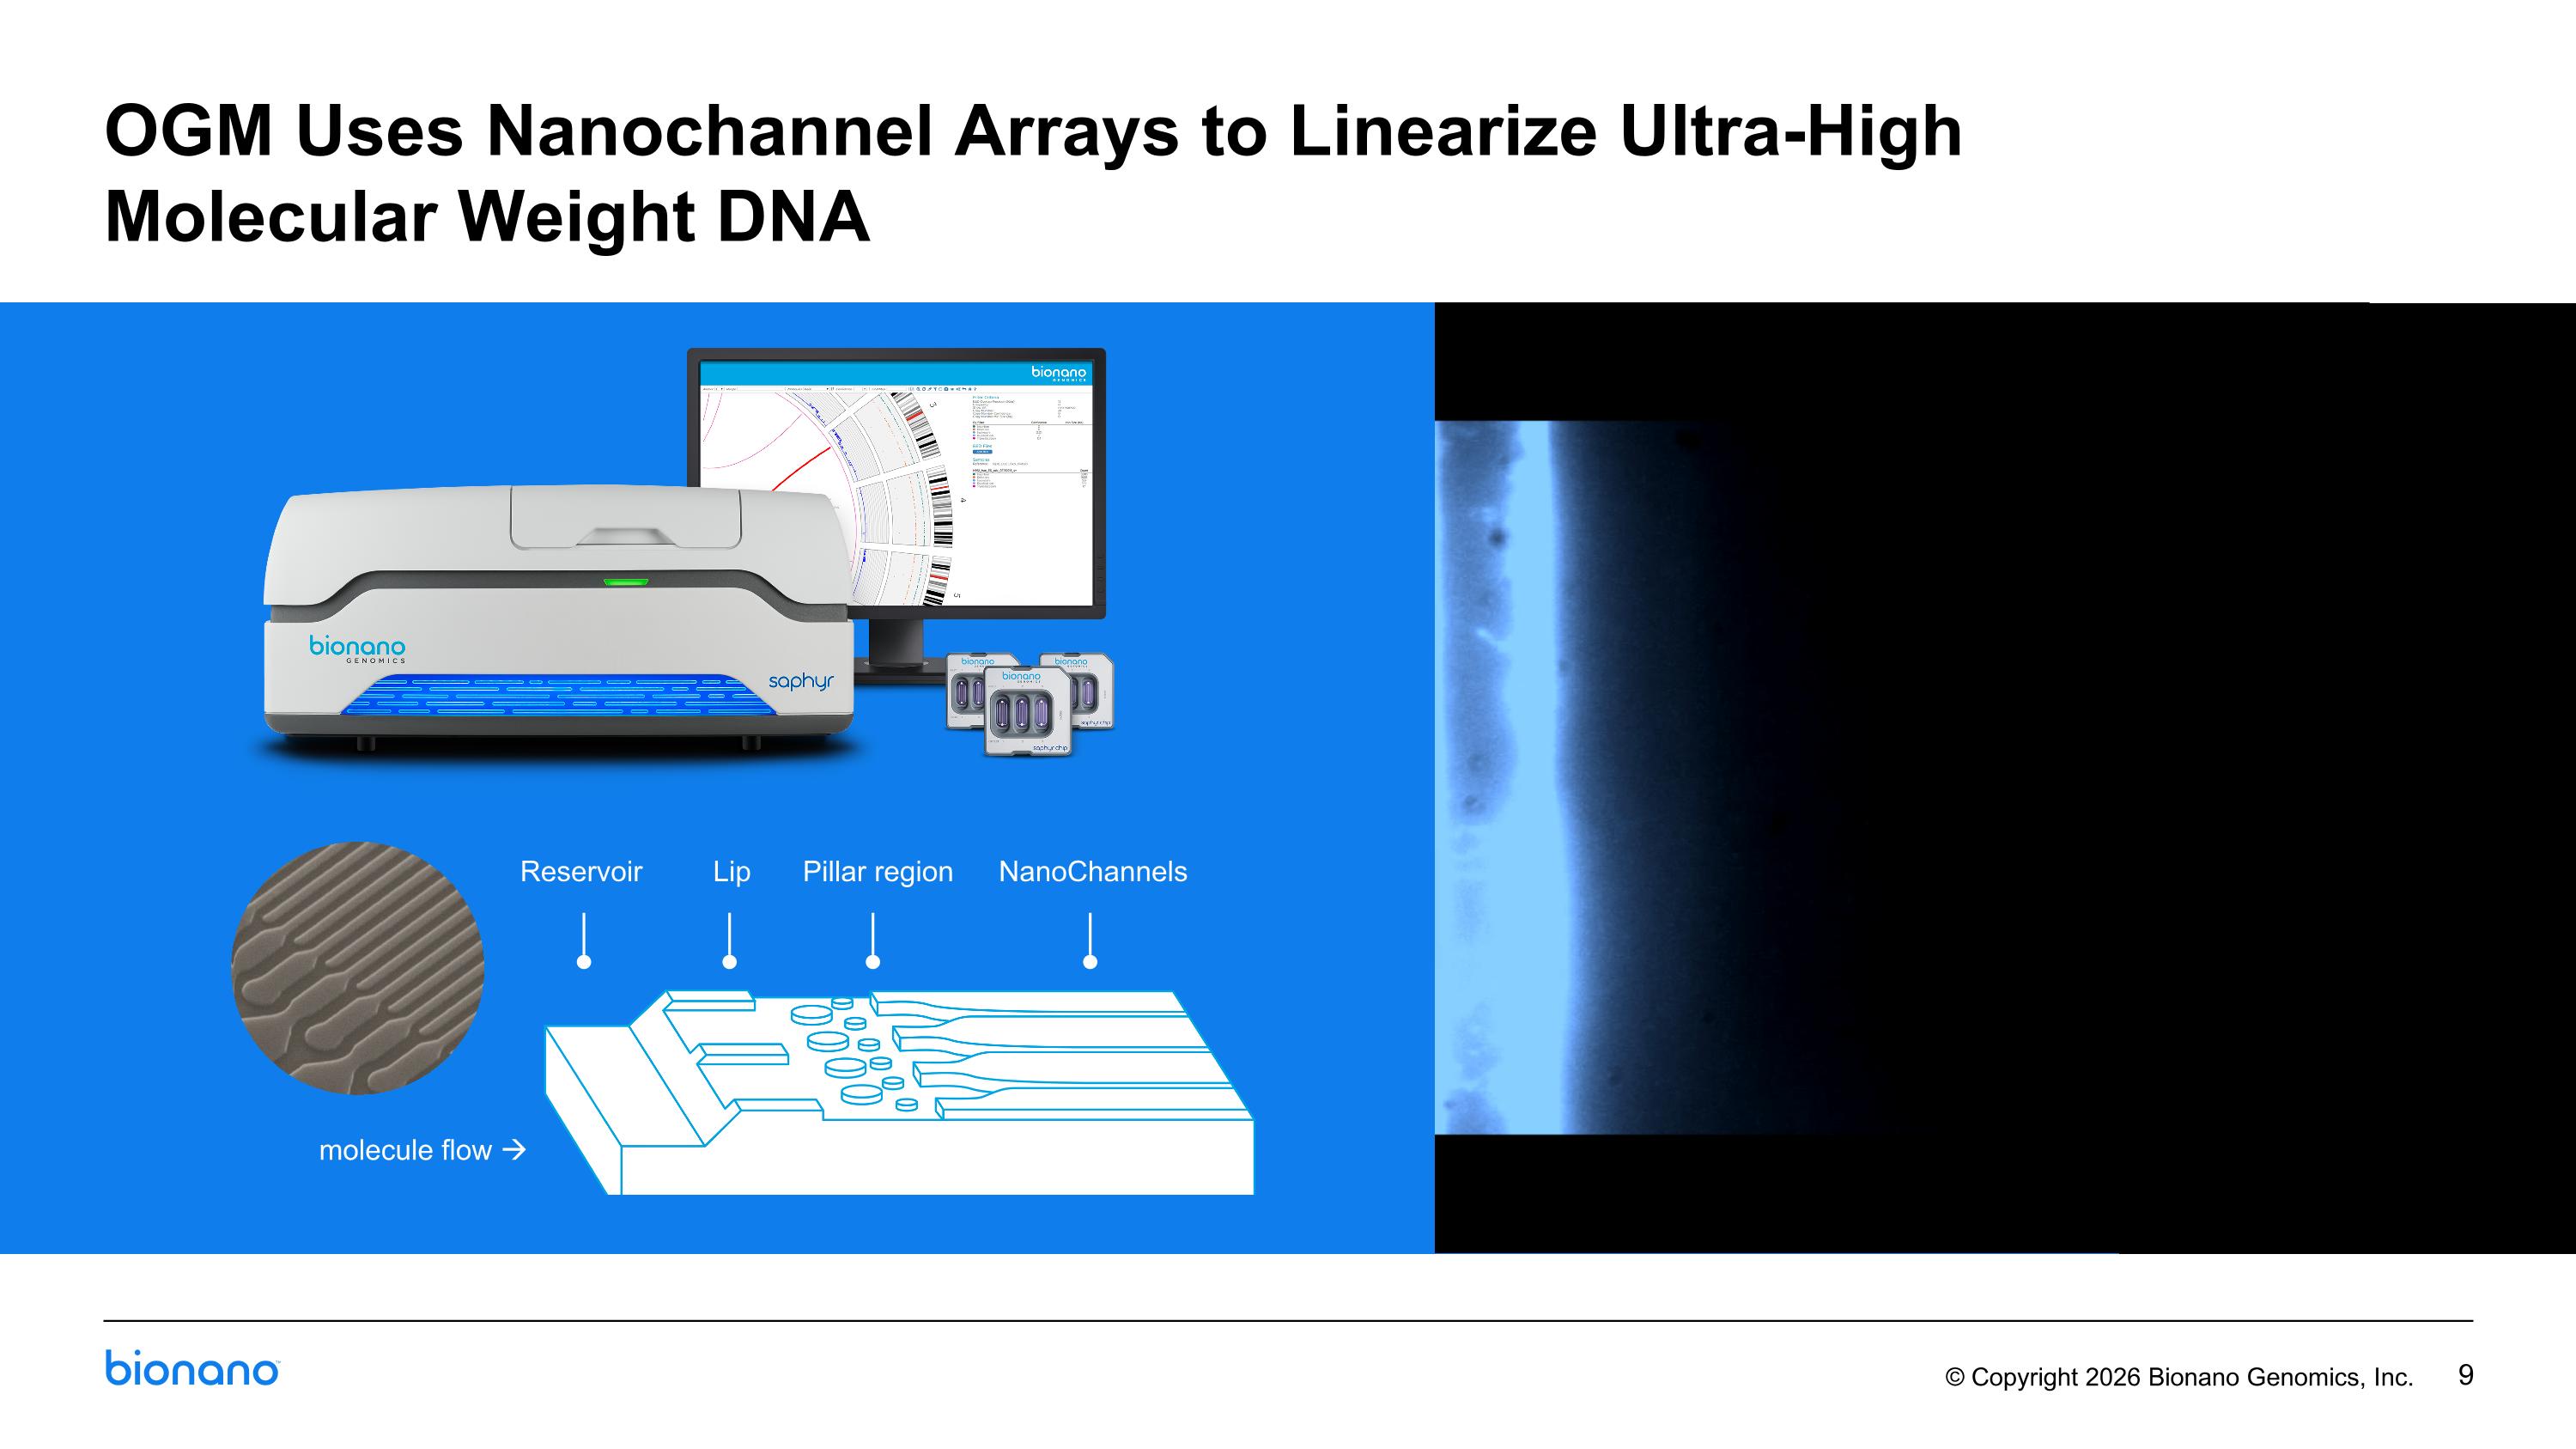
OGM Uses Nanochannel Arrays to Linearize Ultra-High Molecular Weight DNA molecule flow Reservoir Lip Pillar region NanoChannels
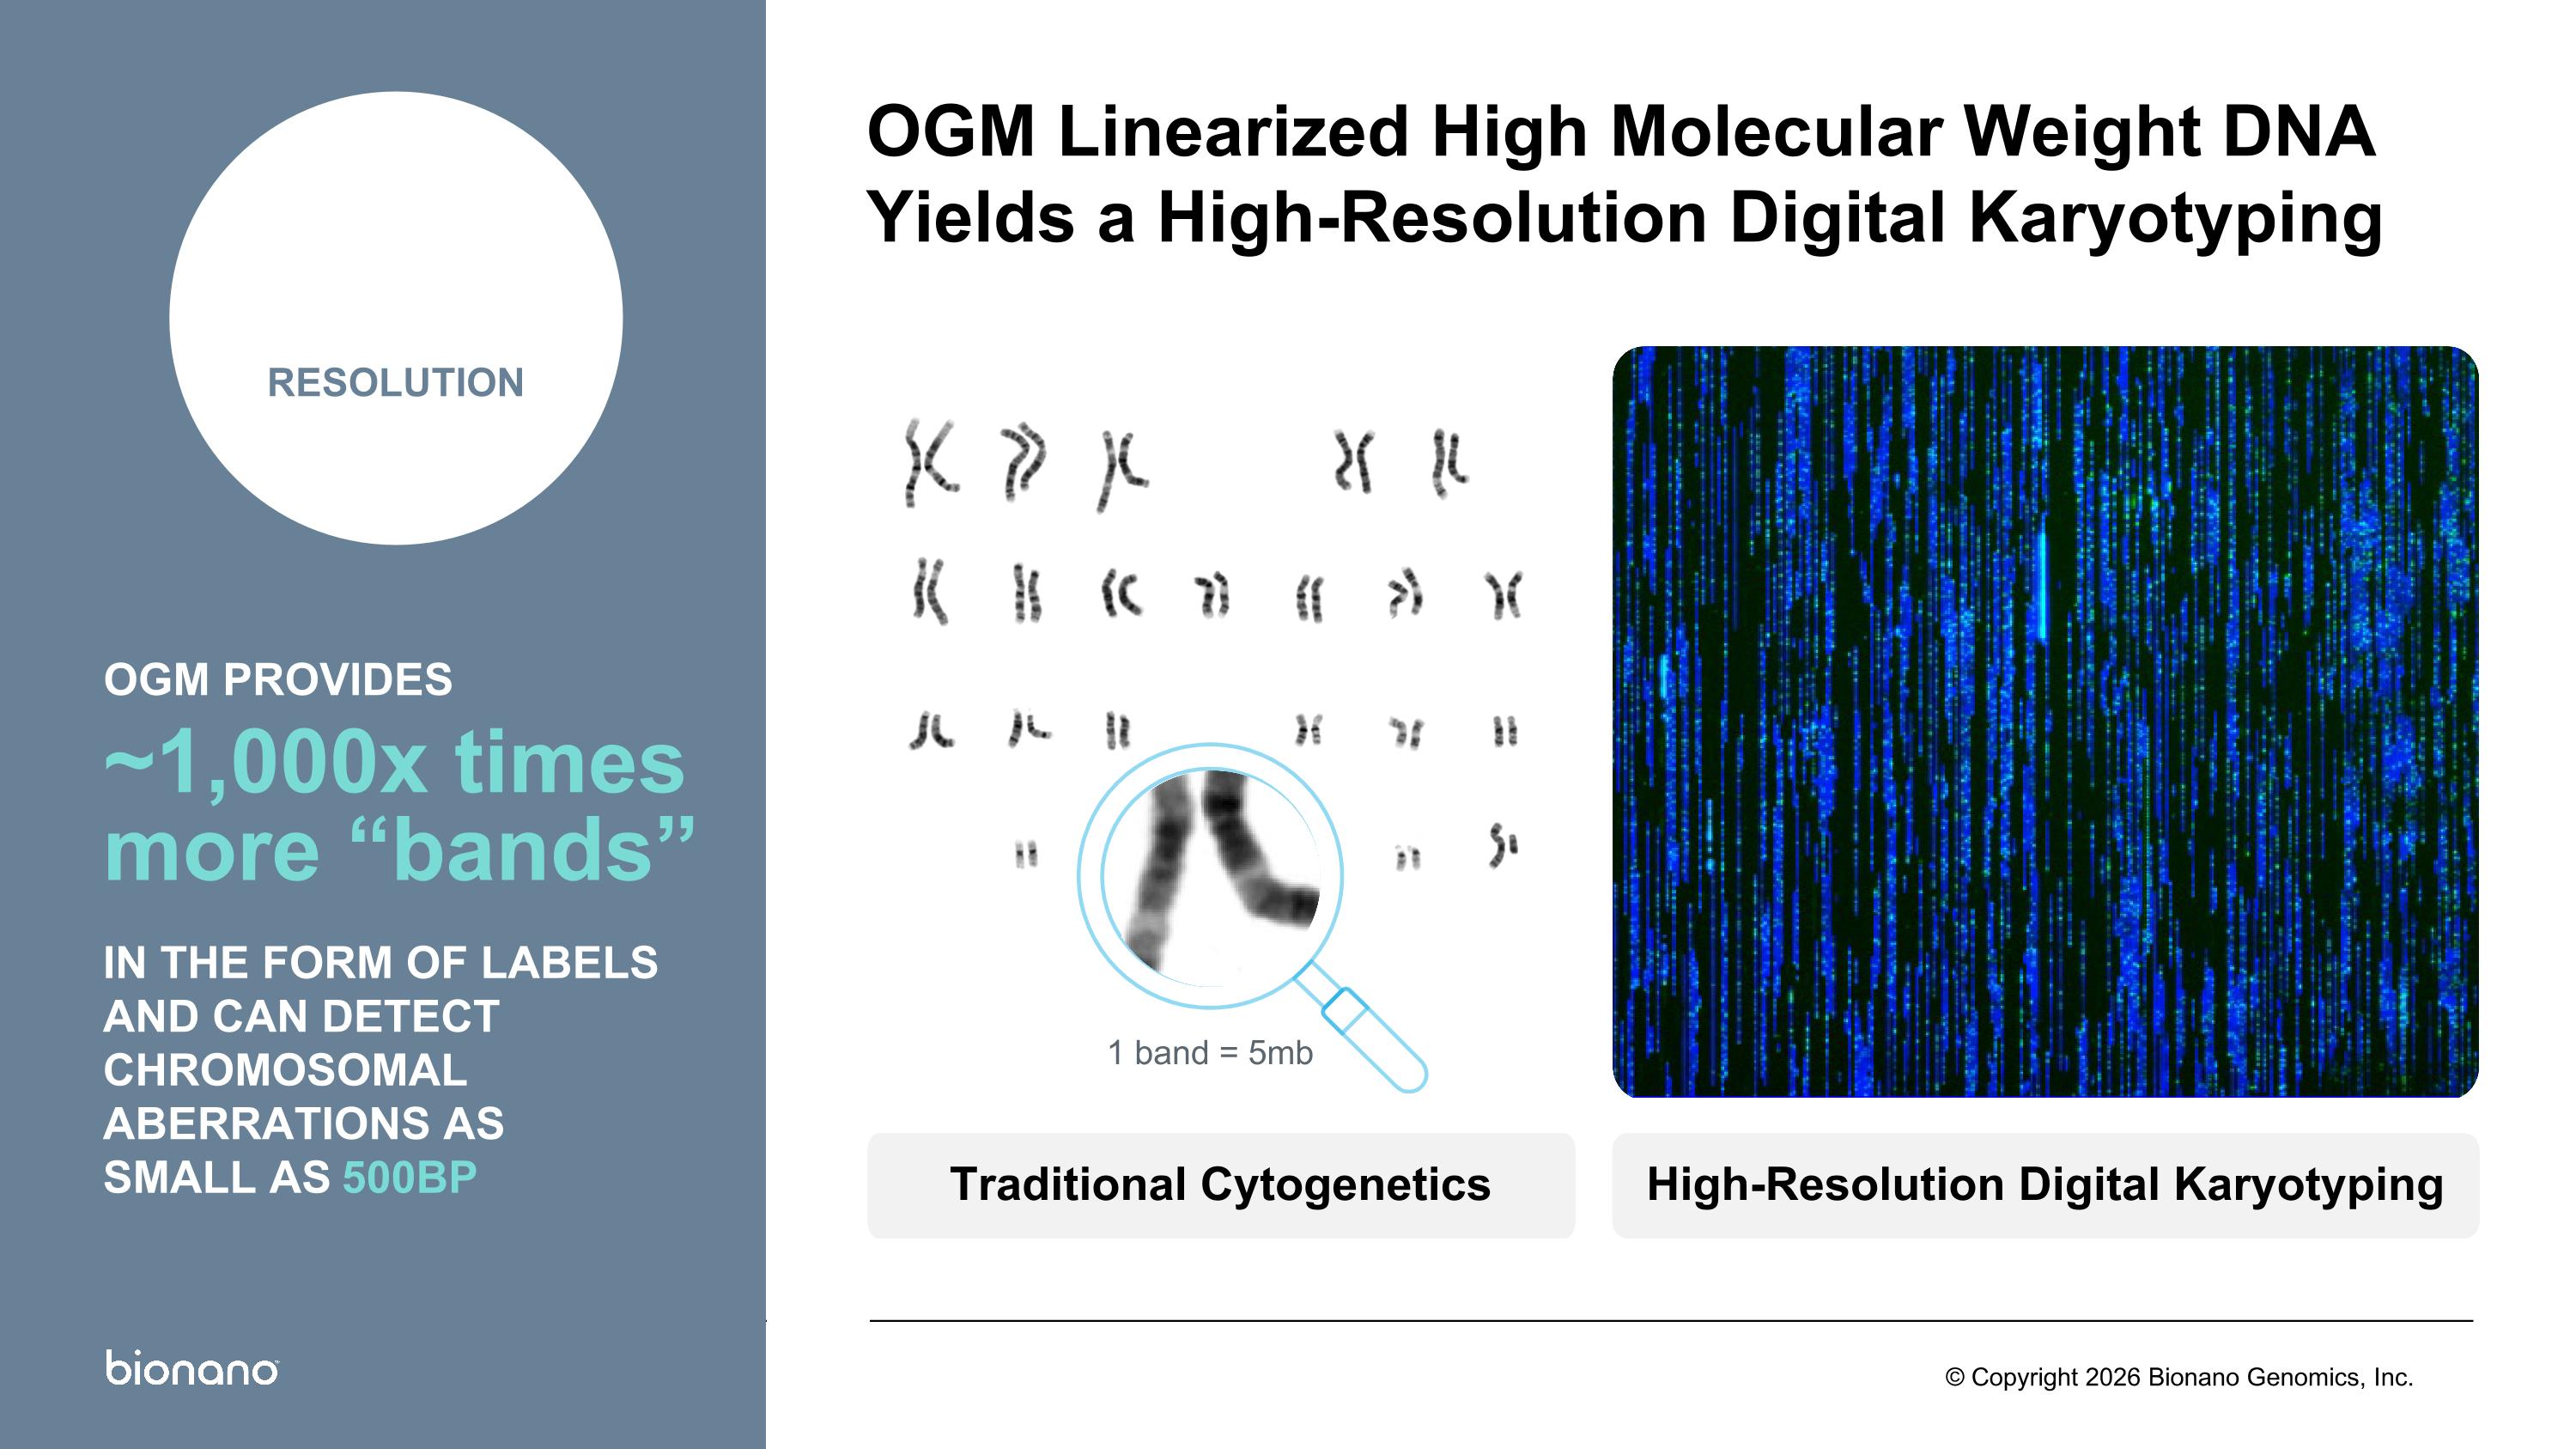
High-Resolution Digital Karyotyping Traditional Cytogenetics 1 band = 5mb OGM Linearized High Molecular Weight DNA Yields a High-Resolution Digital Karyotyping 10,000 RESOLUTION OGM PROVIDES ~1,000x times more “bands” IN THE FORM OF LABELS AND CAN DETECT CHROMOSOMAL ABERRATIONS AS SMALL AS 500BP
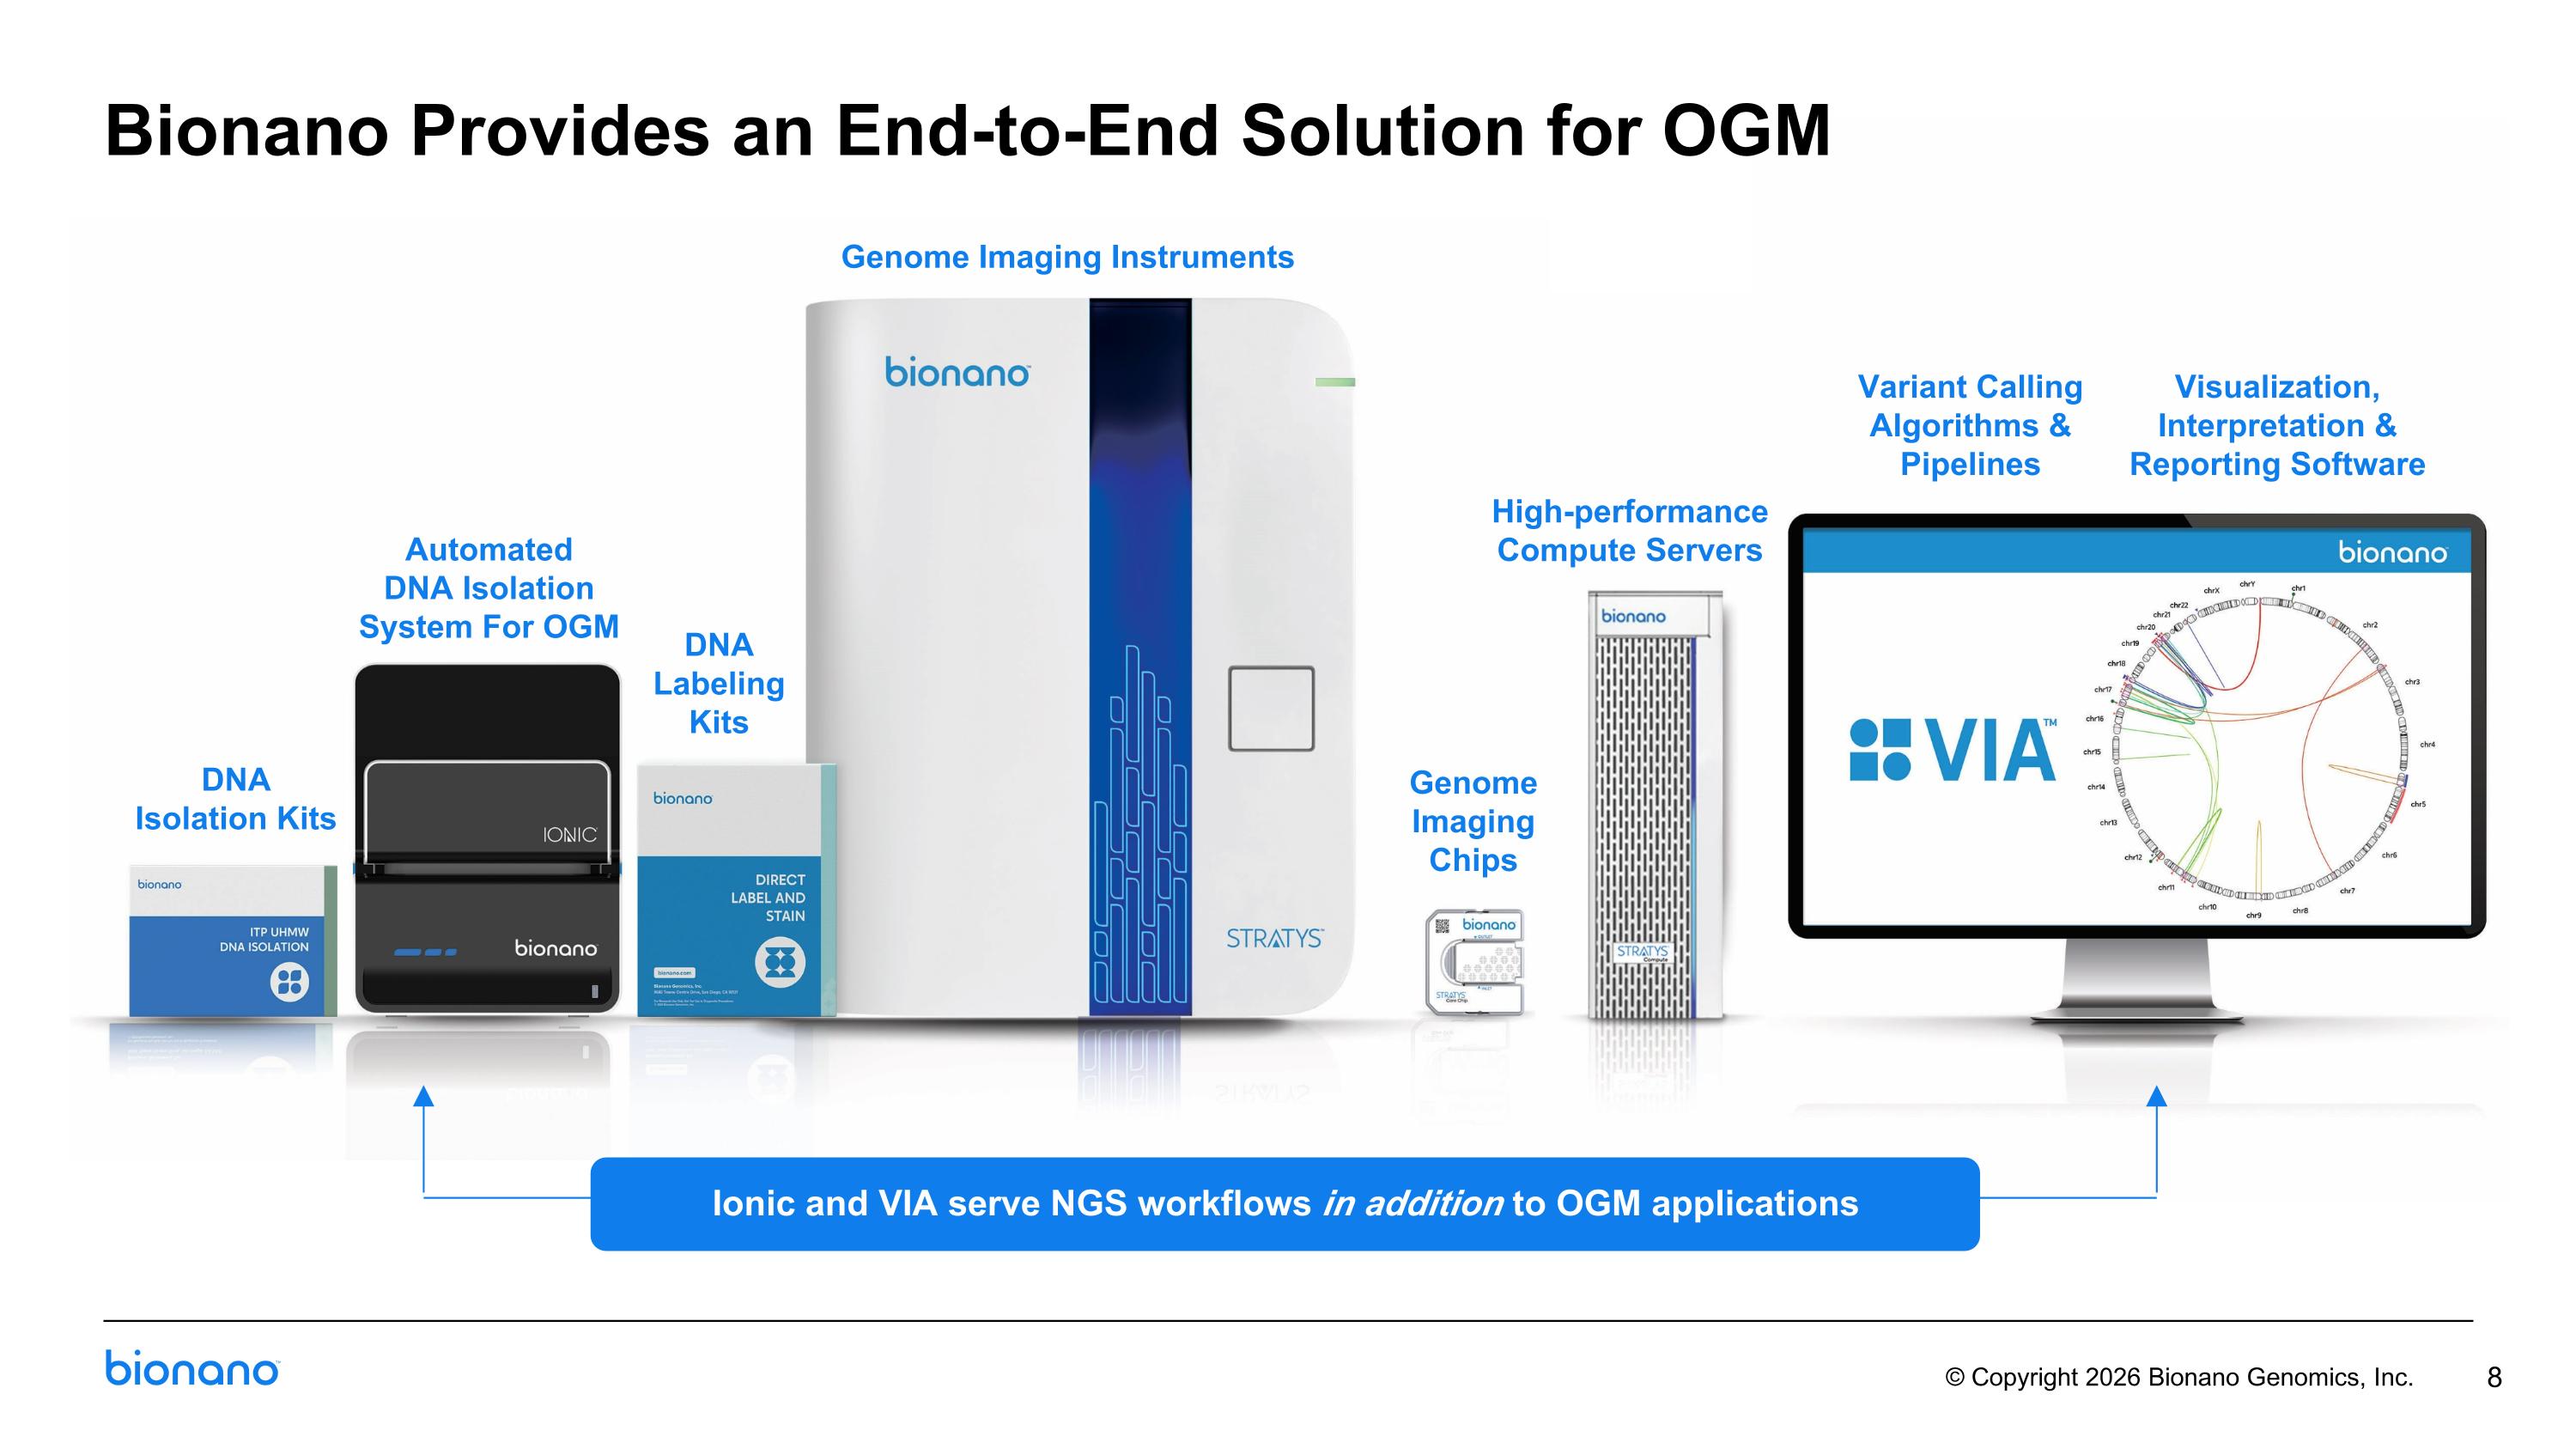
DNA Isolation Kits Genome Imaging Chips Genome Imaging Instruments High-performance Compute Servers Variant Calling Algorithms & Pipelines Visualization, Interpretation & Reporting Software DNA Labeling Kits Automated DNA Isolation System For OGM 8 Bionano Provides an End-to-End Solution for OGM Ionic and VIA serve NGS workflows in addition to OGM applications
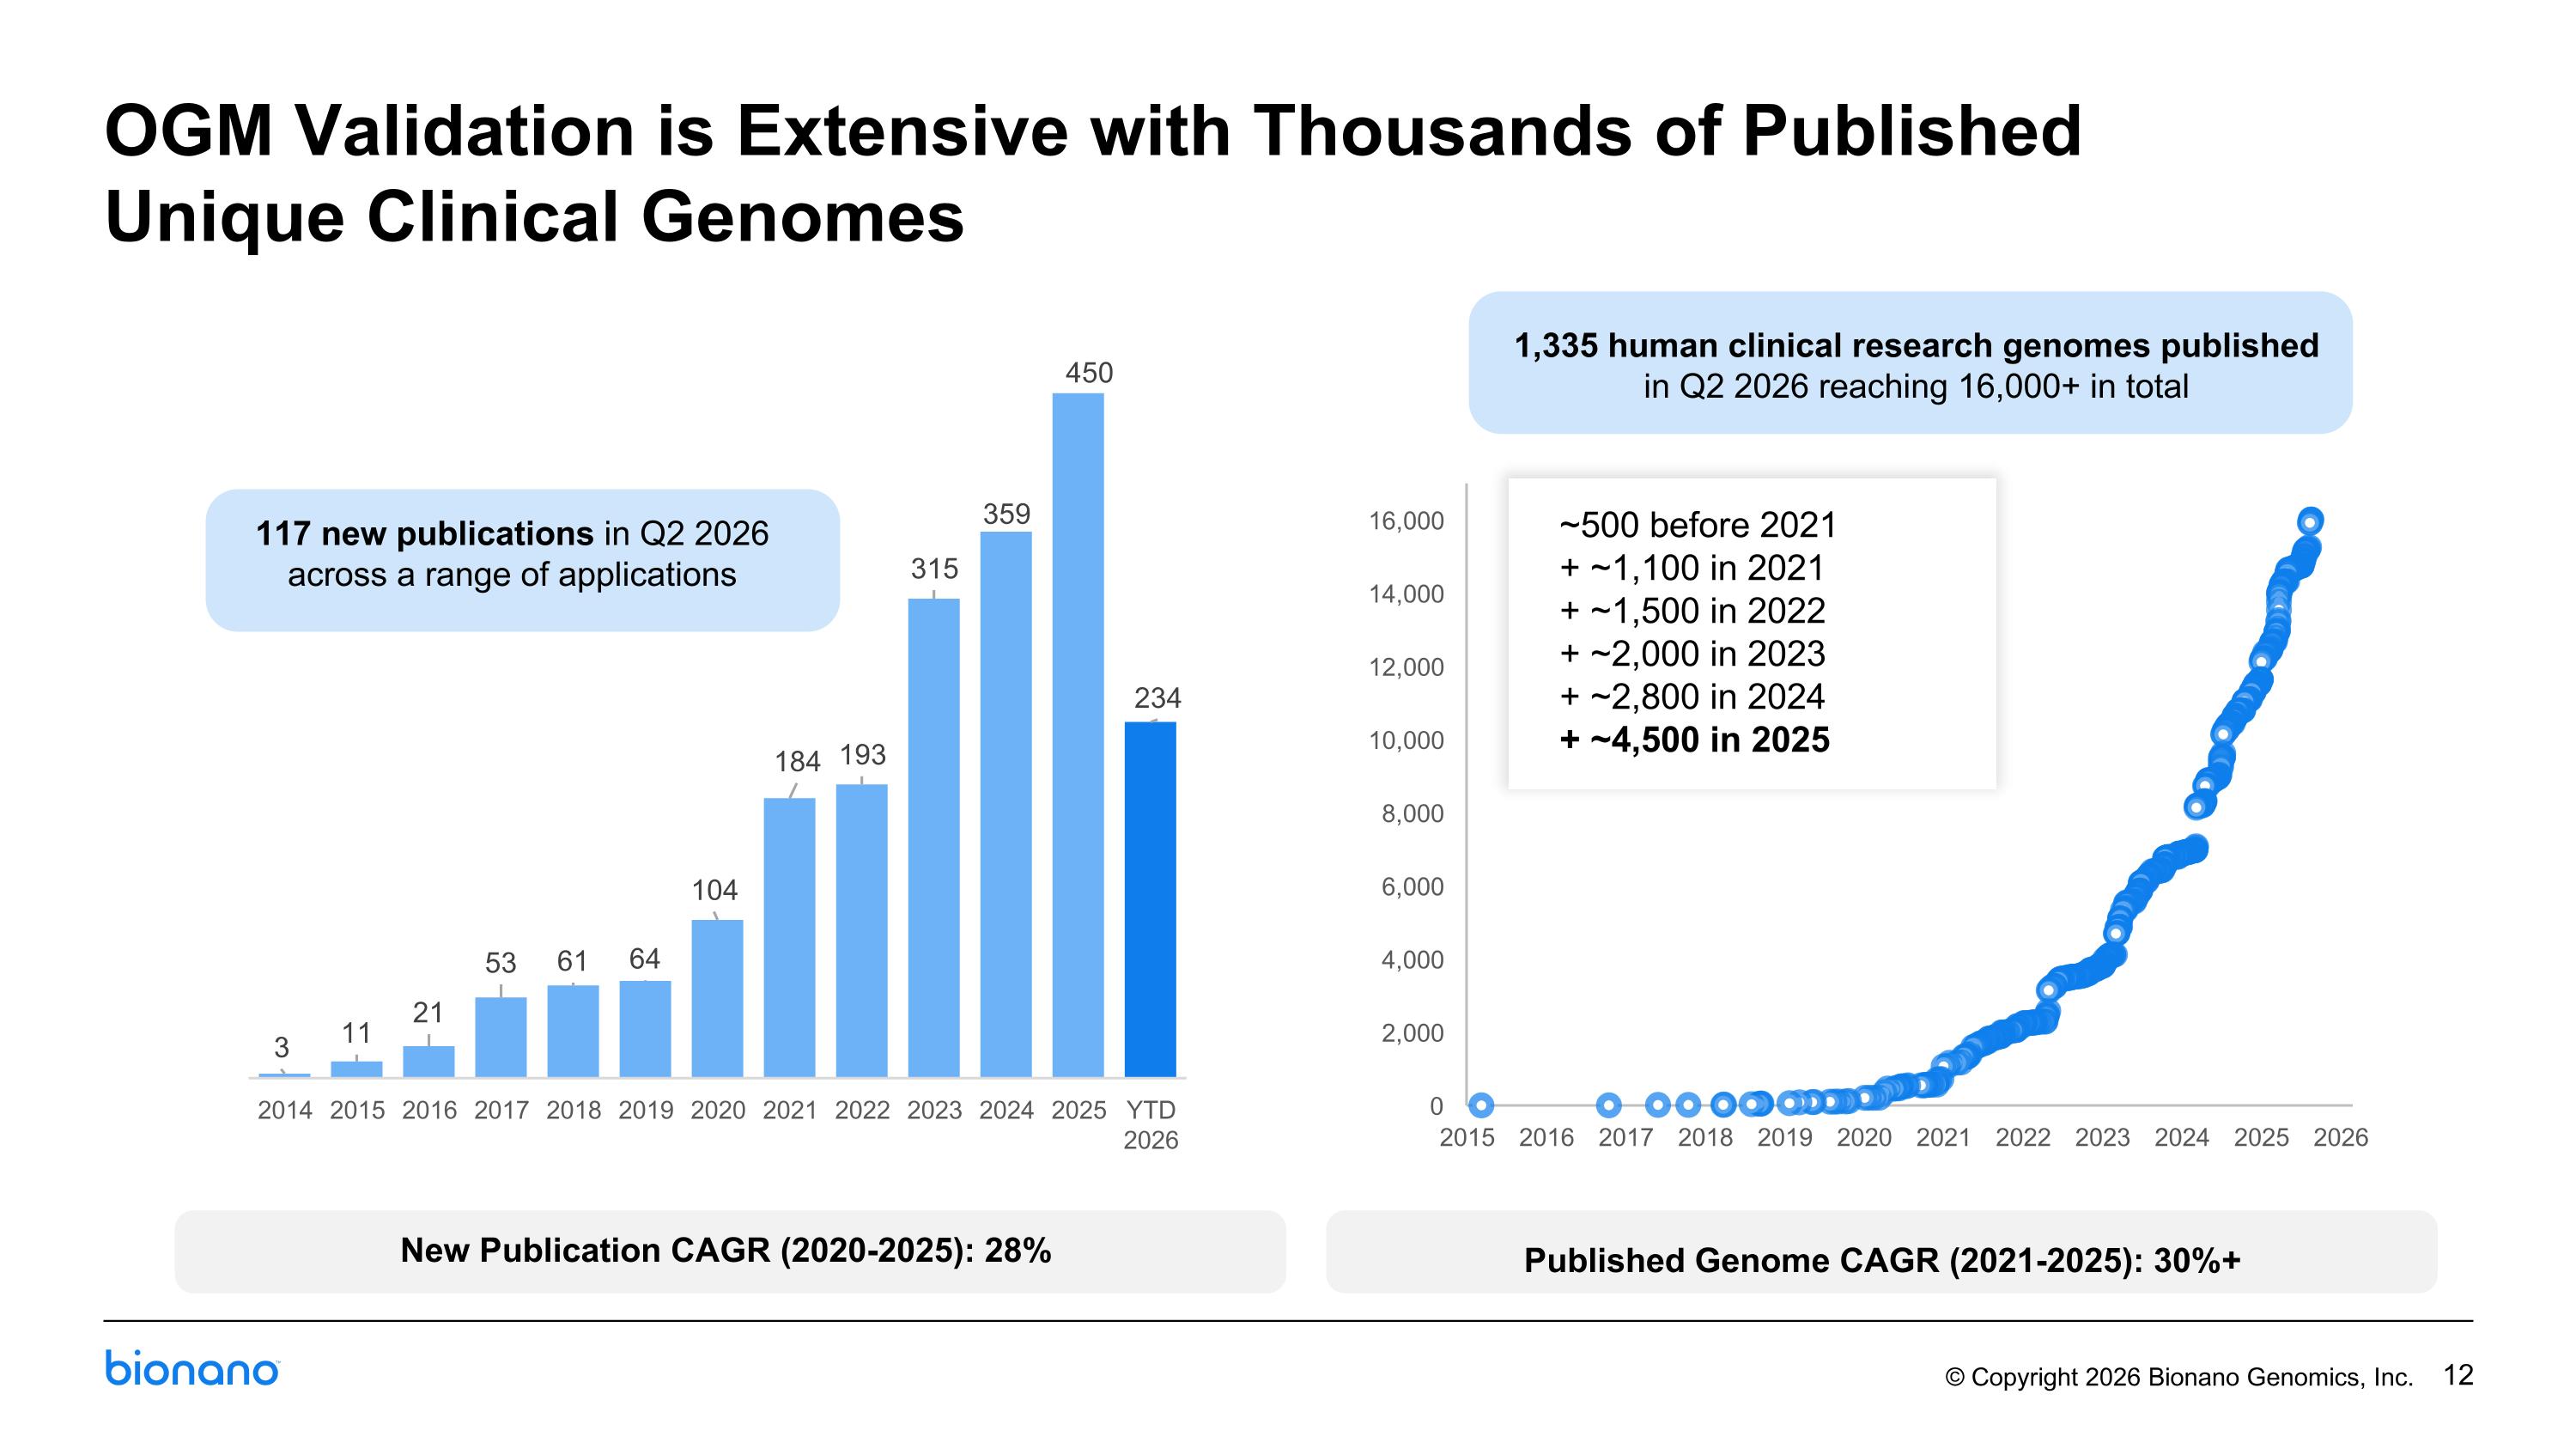
117 new publications in Q2 2026 across a range of applications 1,335 human clinical research genomes published in Q2 2026 reaching 16,000+ in total ~500 before 2021 + ~1,100 in 2021 + ~1,500 in 2022 + ~2,000 in 2023 + ~2,800 in 2024 + ~4,500 in 2025 New Publication CAGR (2020-2025): 28% Published Genome CAGR (2021-2025): 30%+ OGM Validation is Extensive with Thousands of Published Unique Clinical Genomes
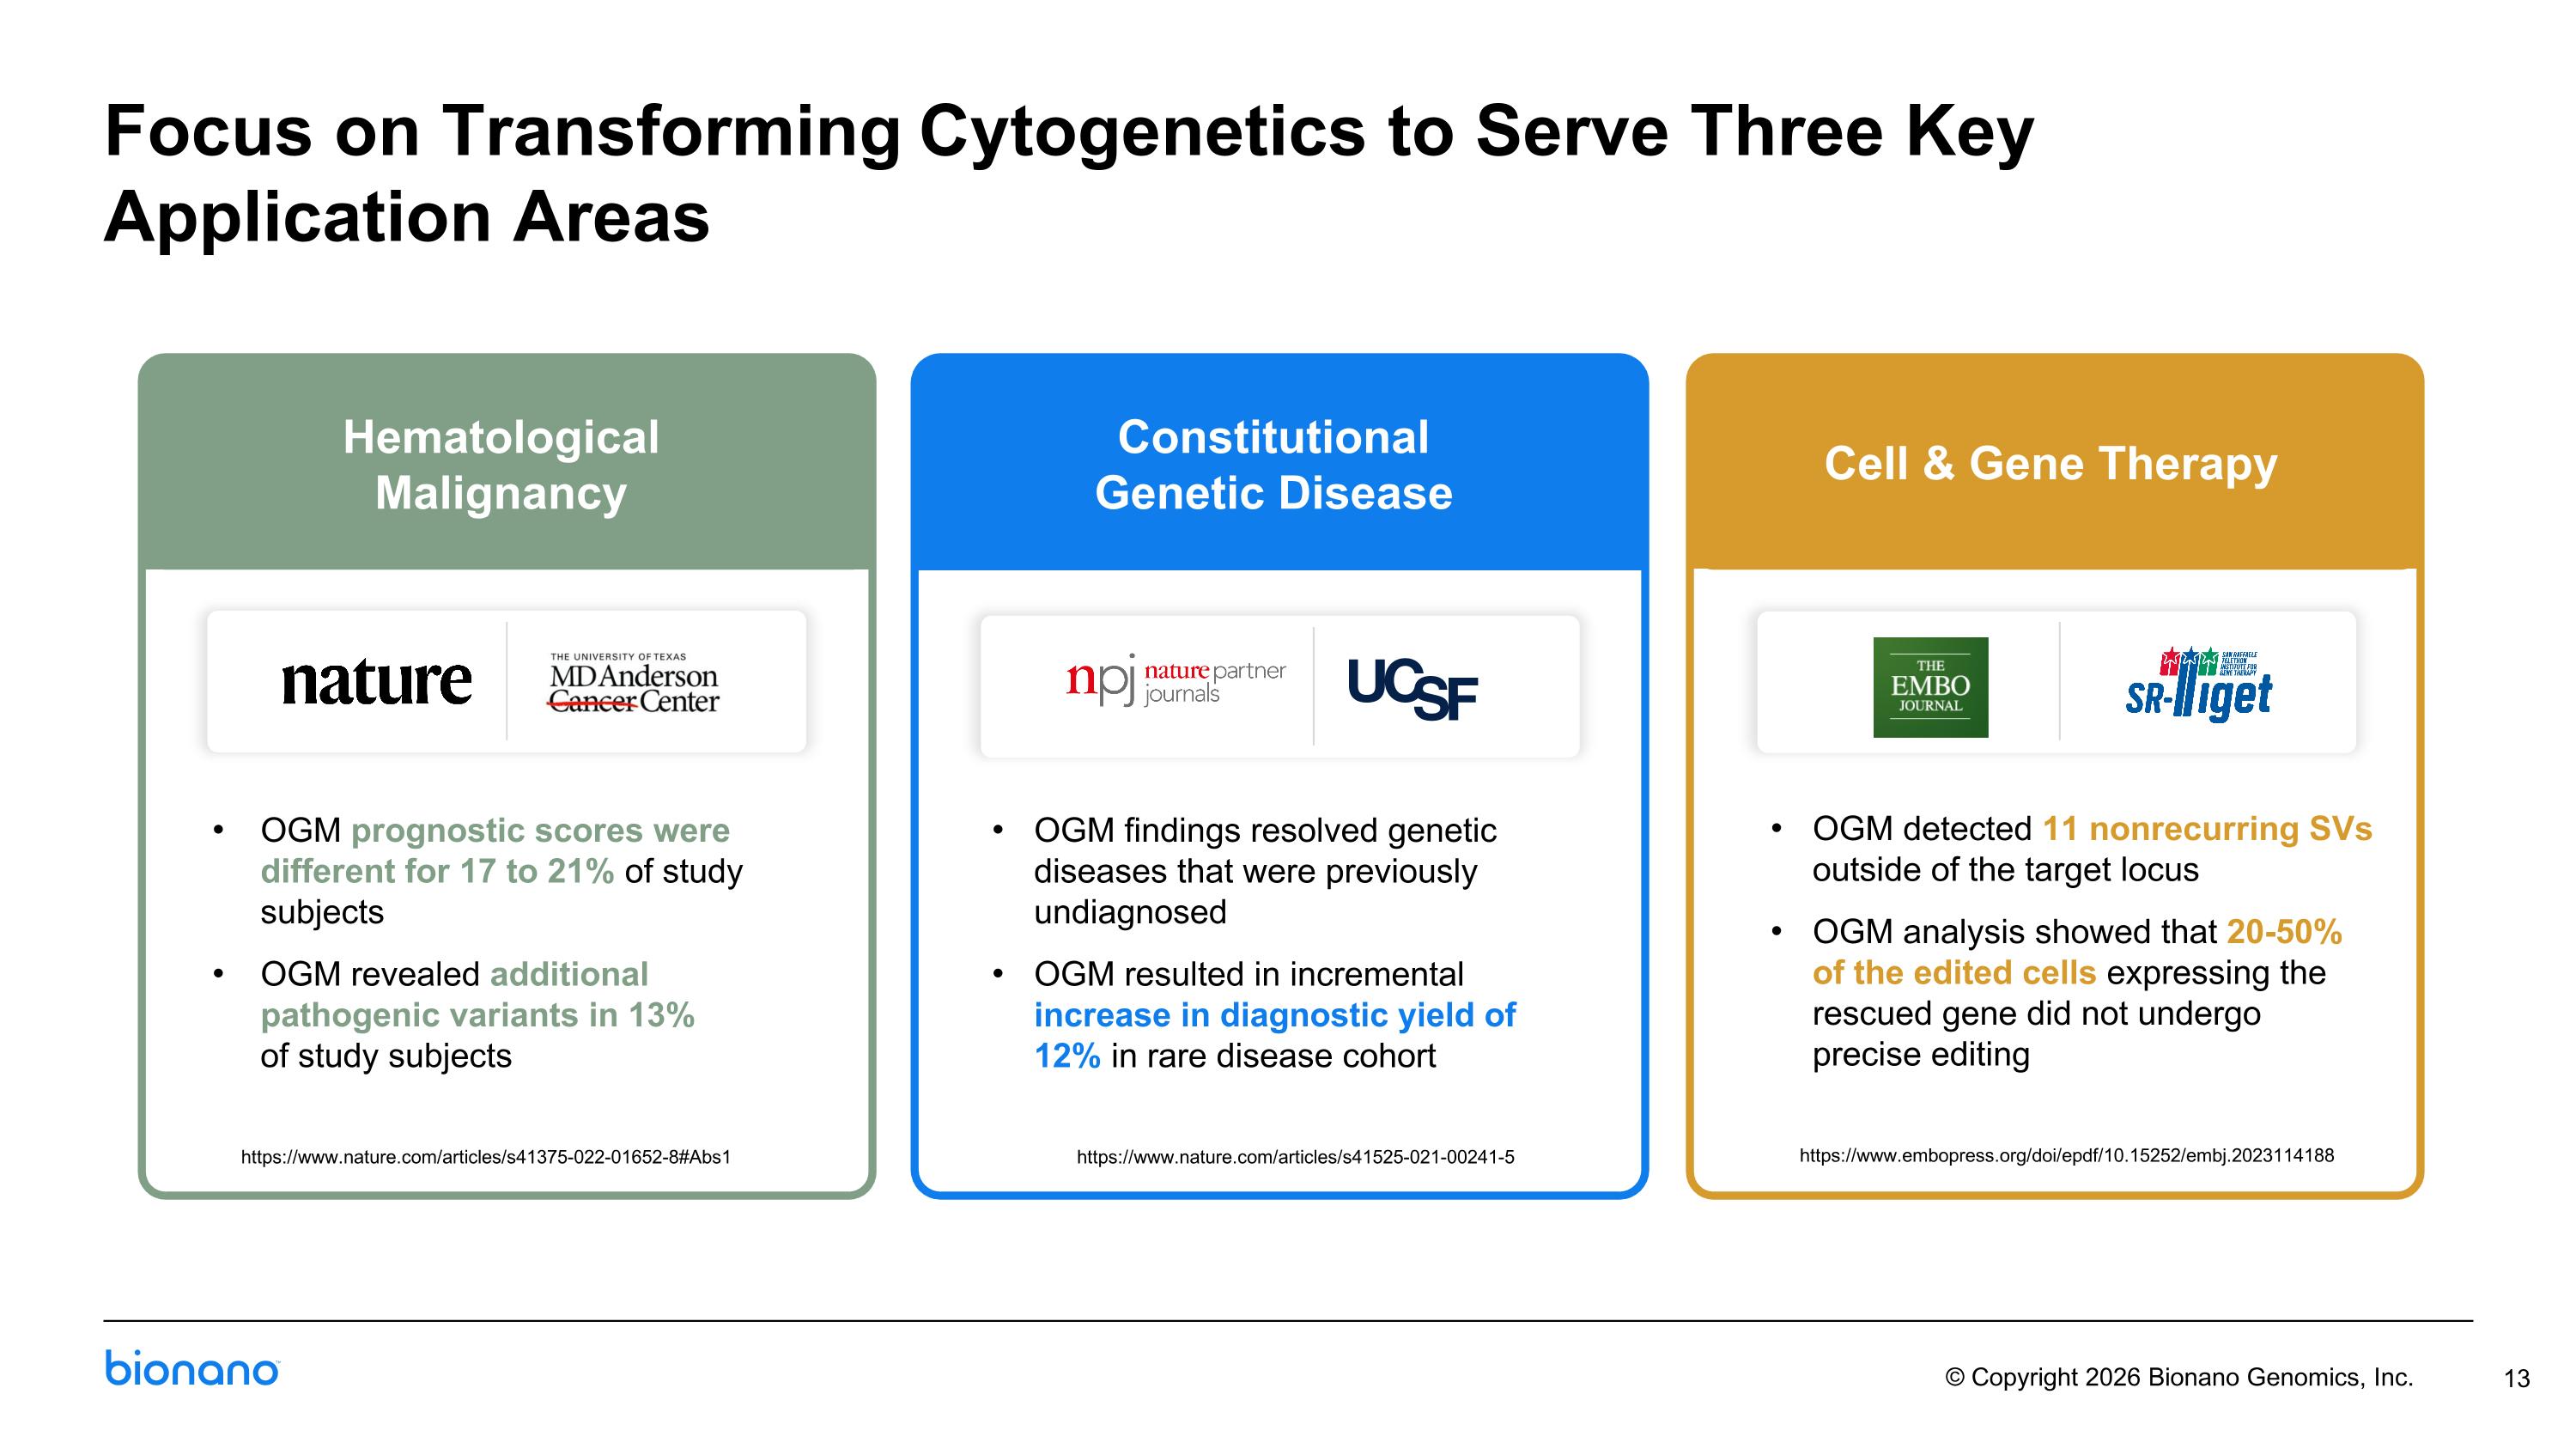
Focus on Transforming Cytogenetics to Serve Three Key Application Areas https://www.nature.com/articles/s41375-022-01652-8#Abs1 https://www.embopress.org/doi/epdf/10.15252/embj.2023114188 OGM prognostic scores were different for 17 to 21% of study subjects OGM revealed additional pathogenic variants in 13% of study subjects OGM findings resolved genetic diseases that were previously undiagnosed OGM resulted in incremental increase in diagnostic yield of 12% in rare disease cohort https://www.nature.com/articles/s41525-021-00241-5 OGM detected 11 nonrecurring SVs outside of the target locus OGM analysis showed that 20-50% of the edited cells expressing the rescued gene did not undergo precise editing Constitutional Genetic Disease Cell & Gene Therapy Hematological Malignancy Constitutional Genetic Disease Cell & Gene Therapy
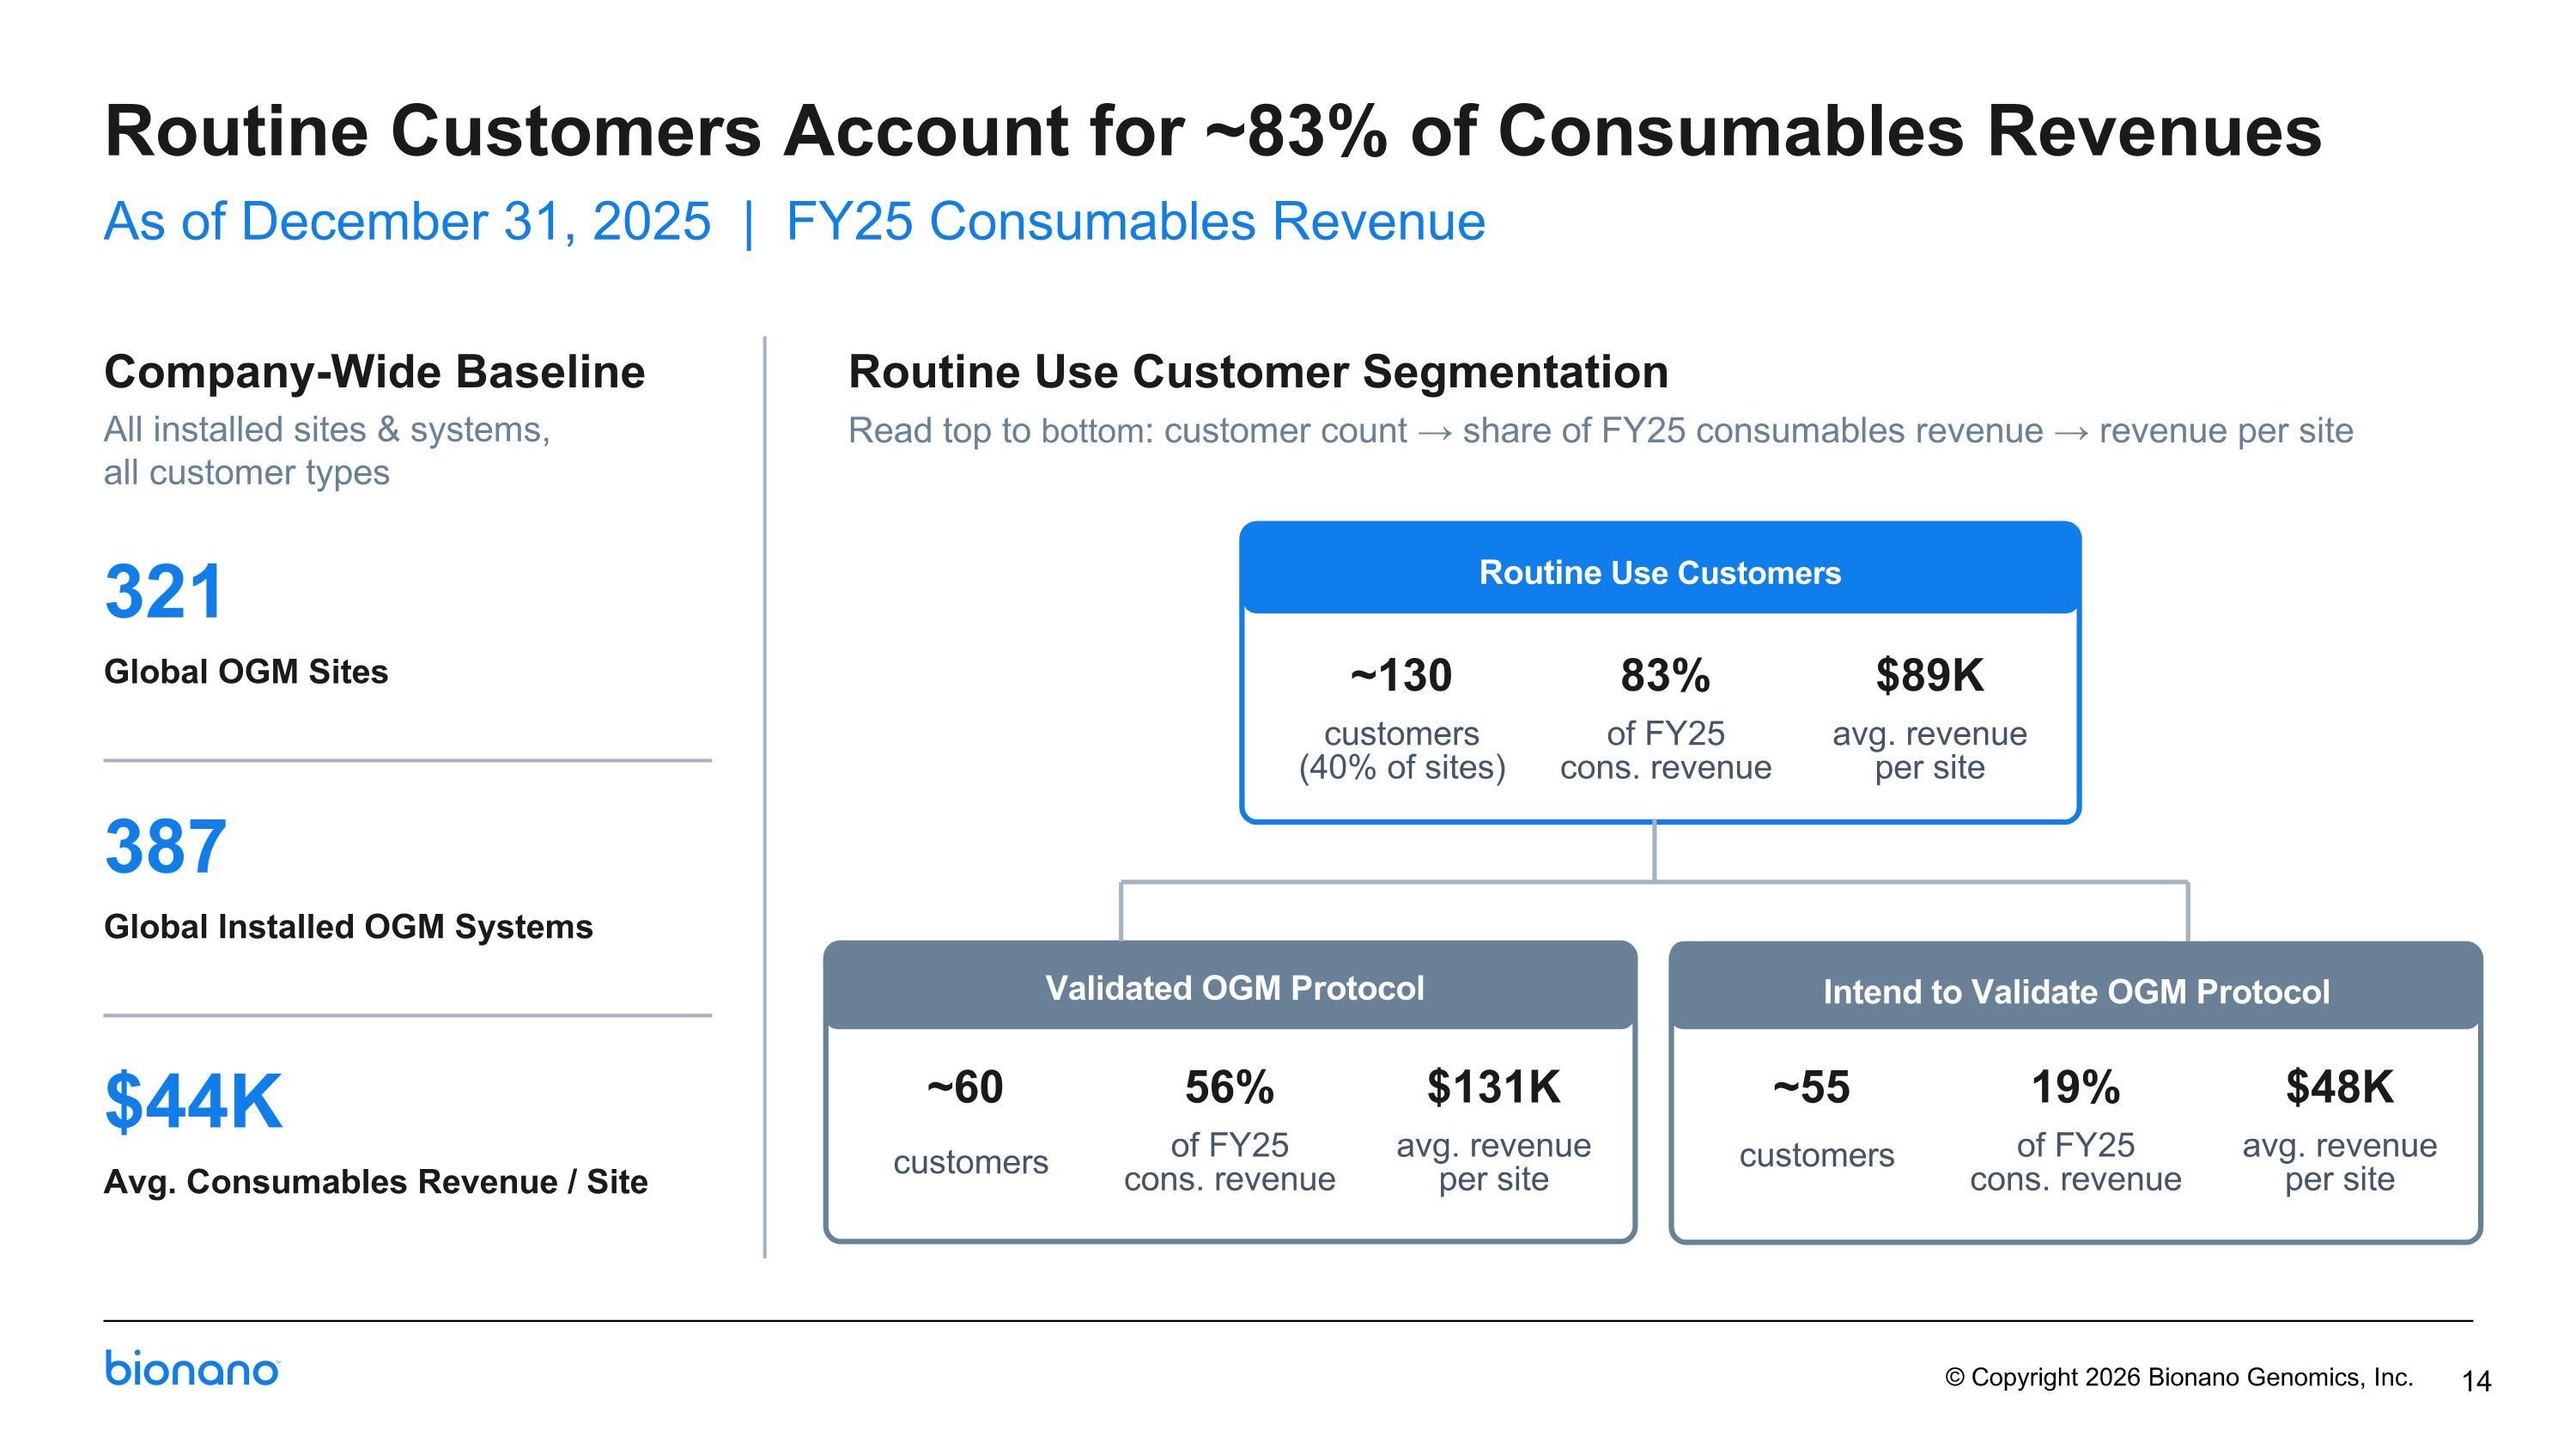
Company-Wide Baseline All installed sites & systems, all customer types 321 Global OGM Sites 387 Global Installed OGM Systems $44K Avg. Consumables Revenue / Site Routine Use Customer Segmentation Read top to bottom: customer count → share of FY25 consumables revenue → revenue per site 14 Routine Customers Account for ~83% of Consumables Revenues As of December 31, 2025 | FY25 Consumables Revenue Routine Use Customers ~130 customers (40% of sites) 83% of FY25 cons. revenue $89K avg. revenue per site ~60 customers 56% of FY25 cons. revenue $131K avg. revenue per site ~55 customers 19% of FY25 cons. revenue $48K avg. revenue per site Validated OGM Protocol Intend to Validate OGM Protocol
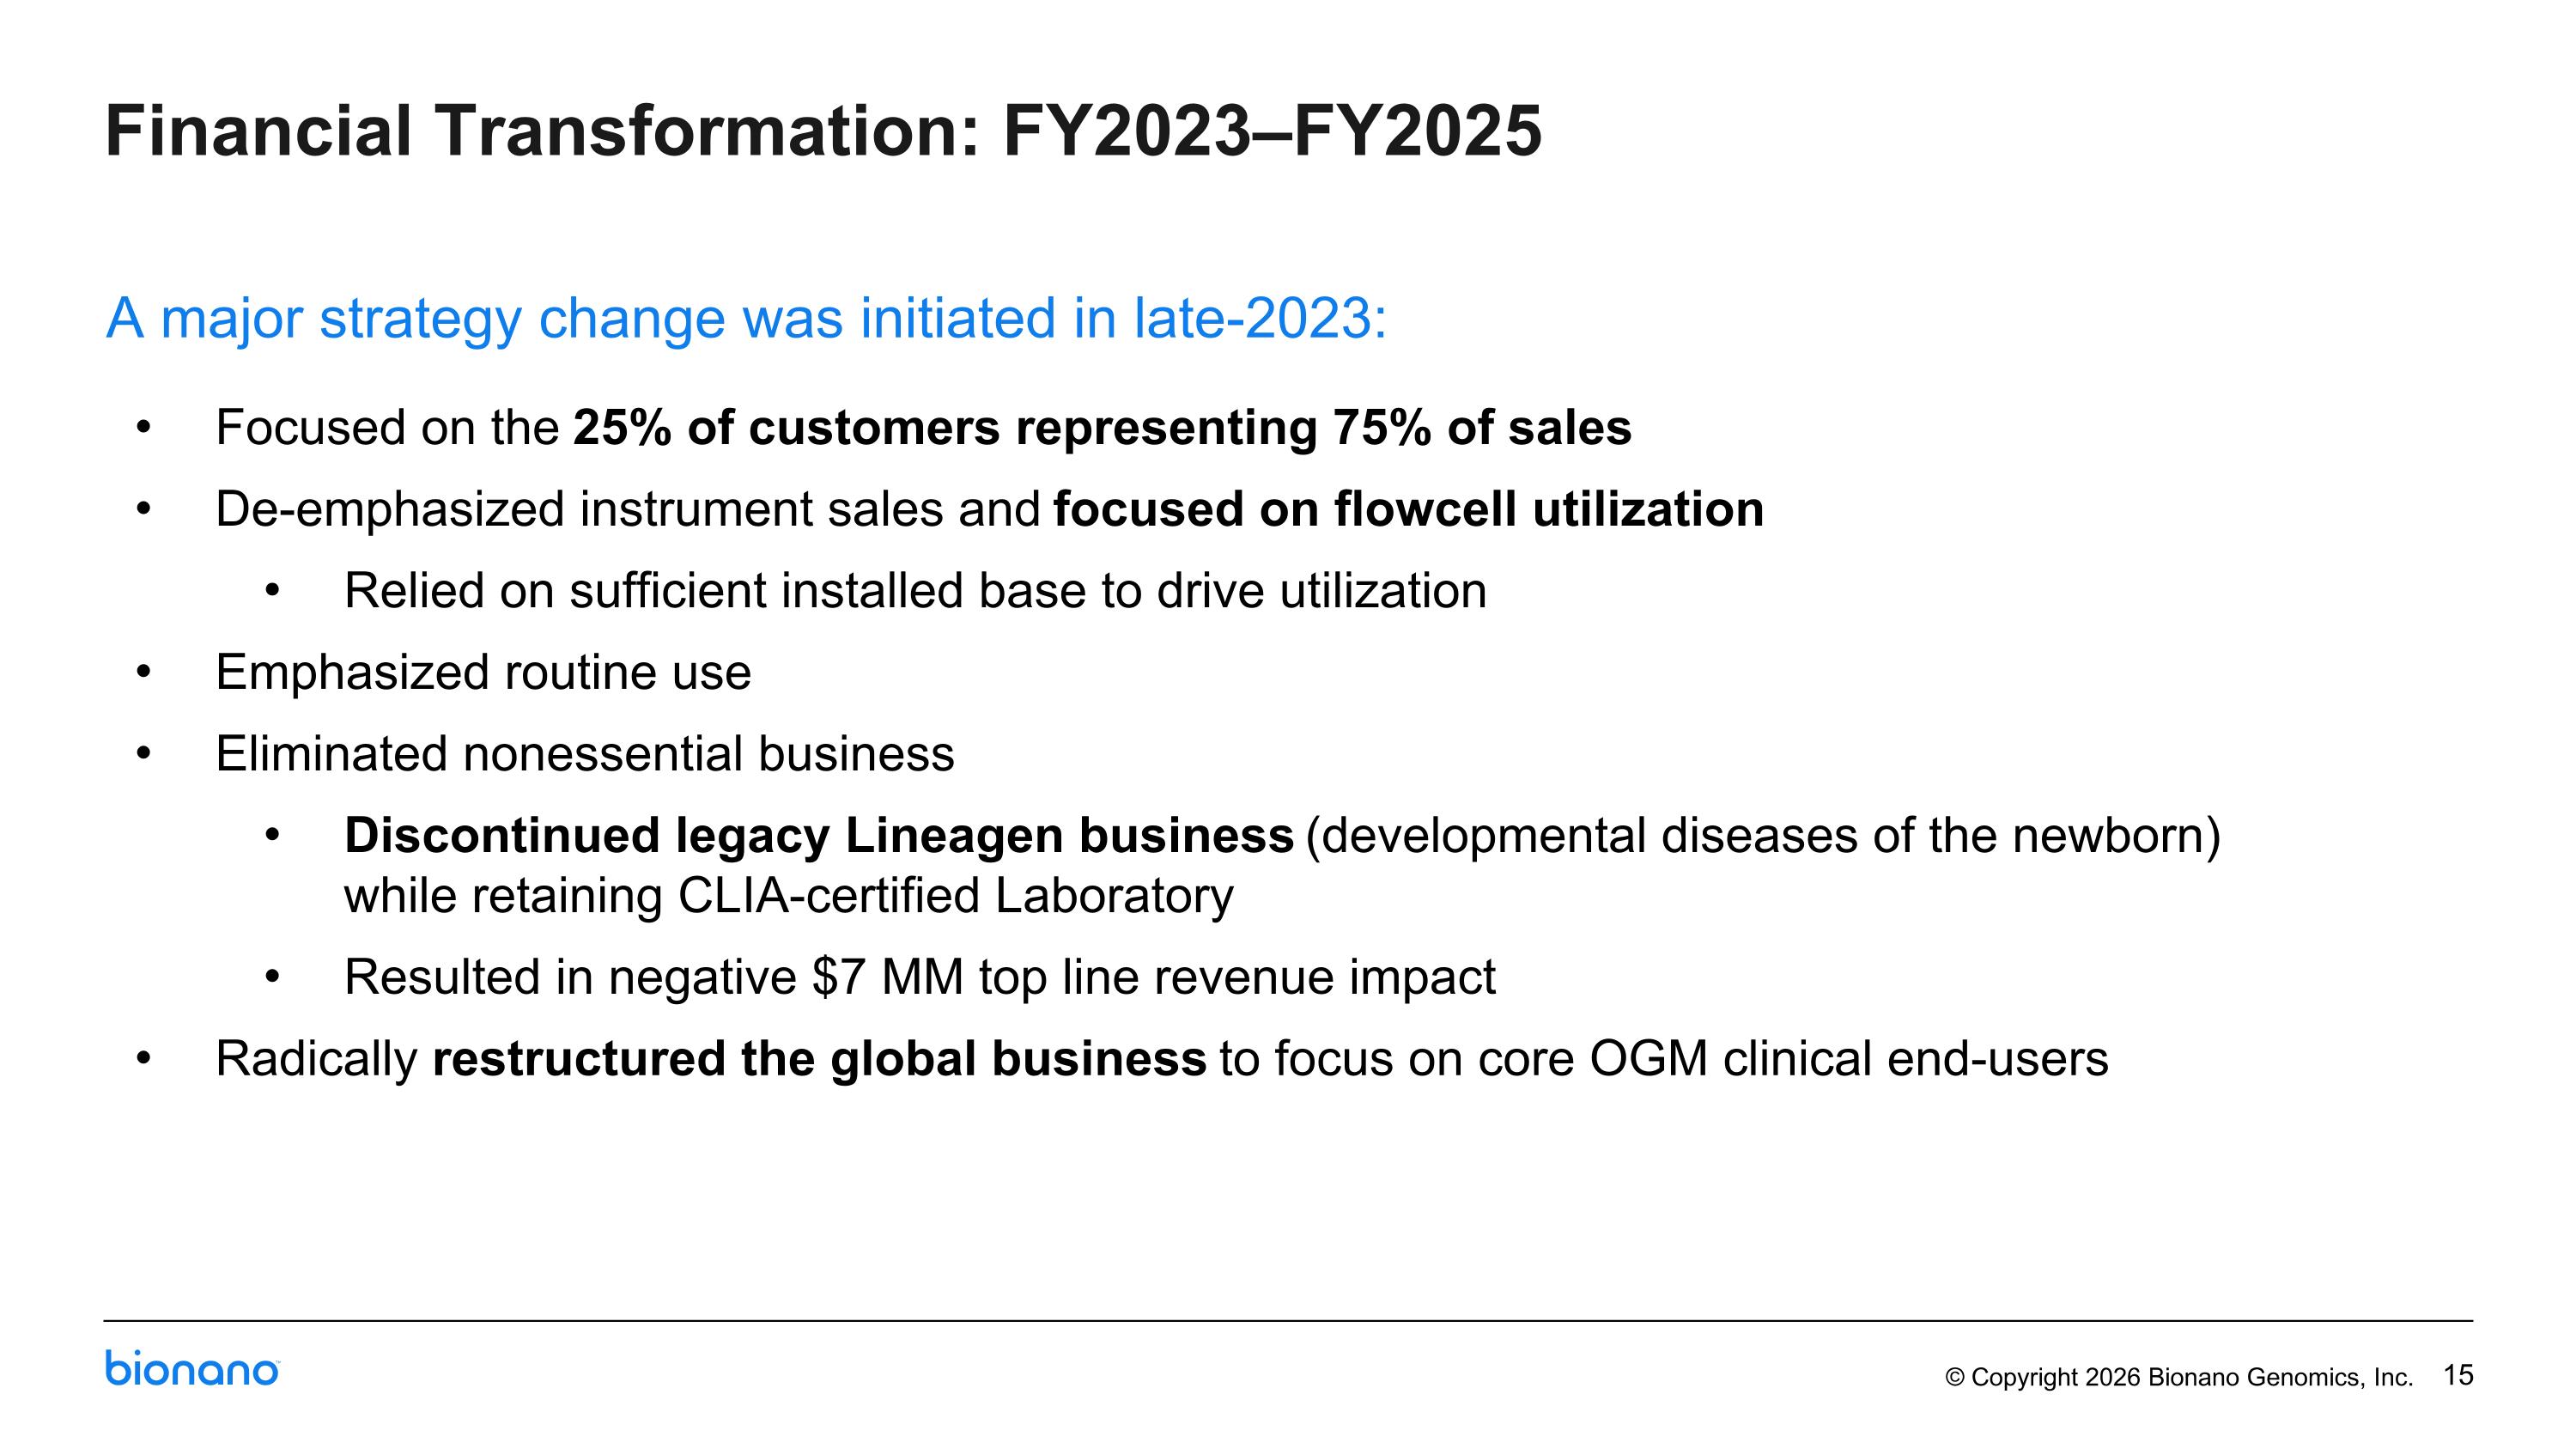
Financial Transformation: FY2023–FY2025 Focused on the 25% of customers representing 75% of sales De-emphasized instrument sales and focused on flowcell utilization Relied on sufficient installed base to drive utilization Emphasized routine use Eliminated nonessential business Discontinued legacy Lineagen business (developmental diseases of the newborn) while retaining CLIA-certified Laboratory Resulted in negative $7 MM top line revenue impact Radically restructured the global business to focus on core OGM clinical end-users A major strategy change was initiated in late-2023:
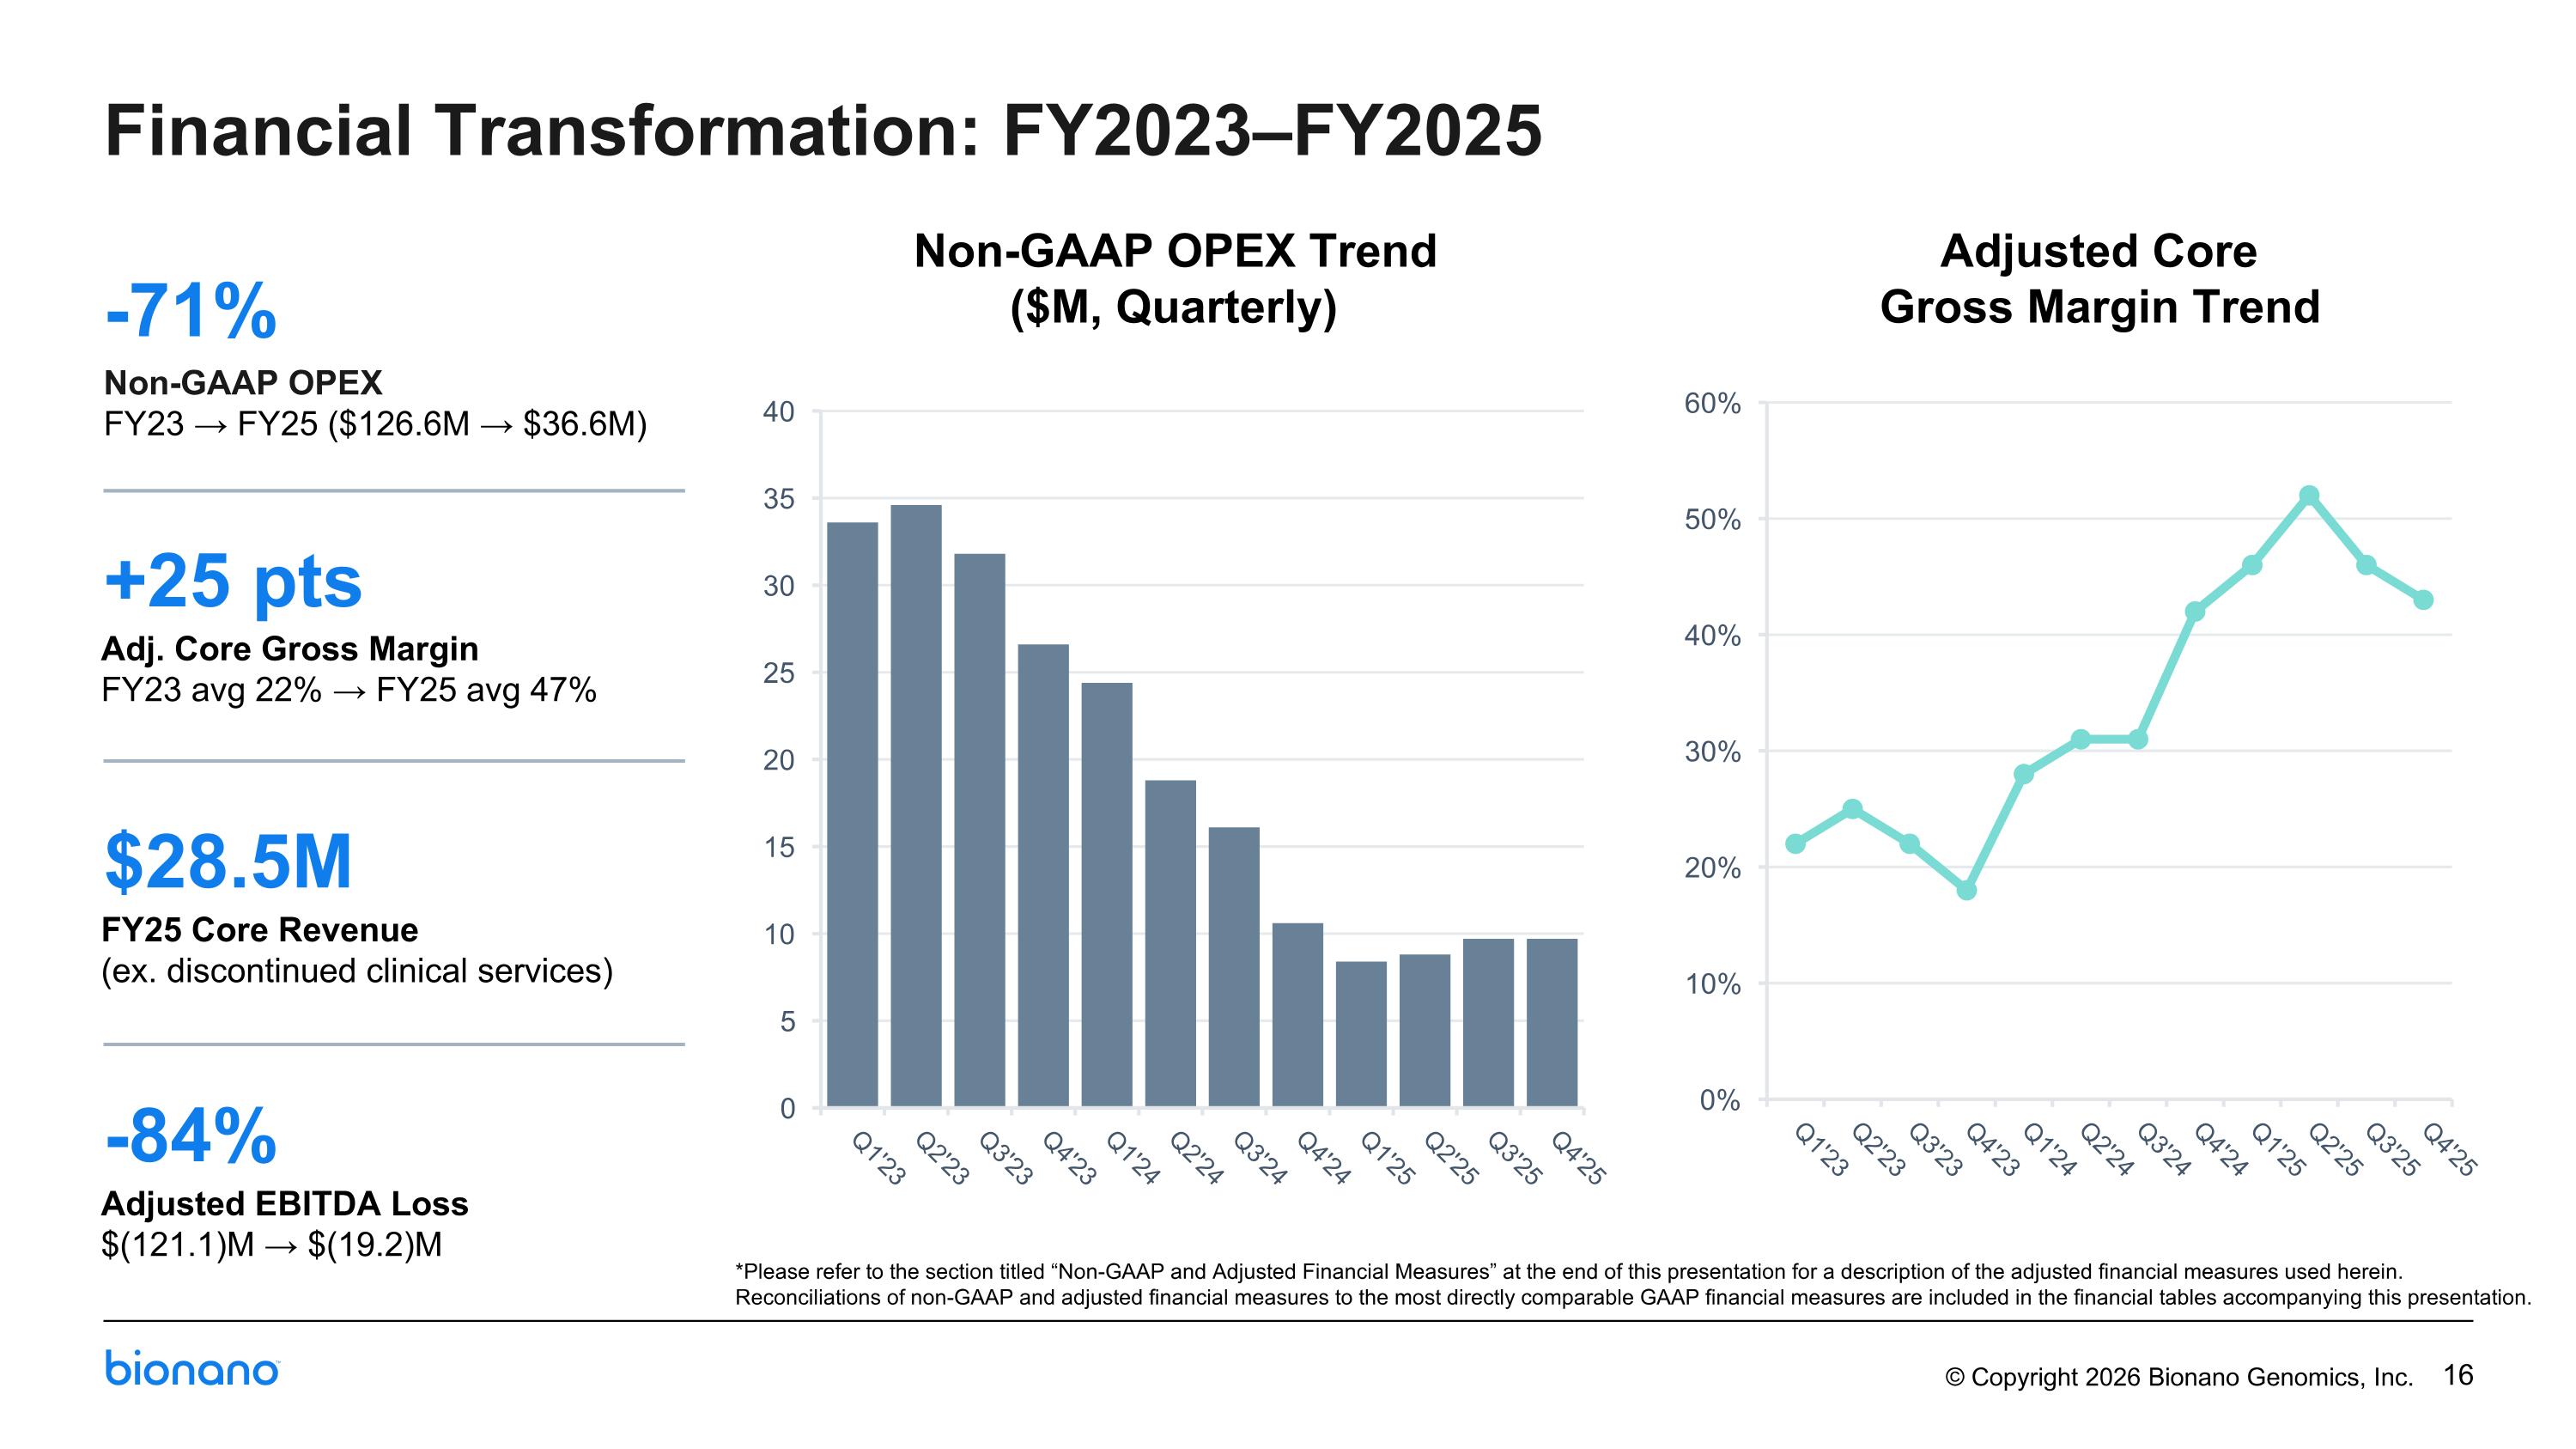
Non-GAAP OPEX Trend ($M, Quarterly) Adjusted Core Gross Margin Trend Financial Transformation: FY2023–FY2025 -71% Non-GAAP OPEX FY23 → FY25 ($126.6M → $36.6M) +25 pts Adj. Core Gross Margin FY23 avg 22% → FY25 avg 47% $28.5M FY25 Core Revenue (ex. discontinued clinical services) -84% Adjusted EBITDA Loss $(121.1)M → $(19.2)M *Please refer to the section titled “Non-GAAP and Adjusted Financial Measures” at the end of this presentation for a description of the adjusted financial measures used herein. Reconciliations of non-GAAP and adjusted financial measures to the most directly comparable GAAP financial measures are included in the financial tables accompanying this presentation.
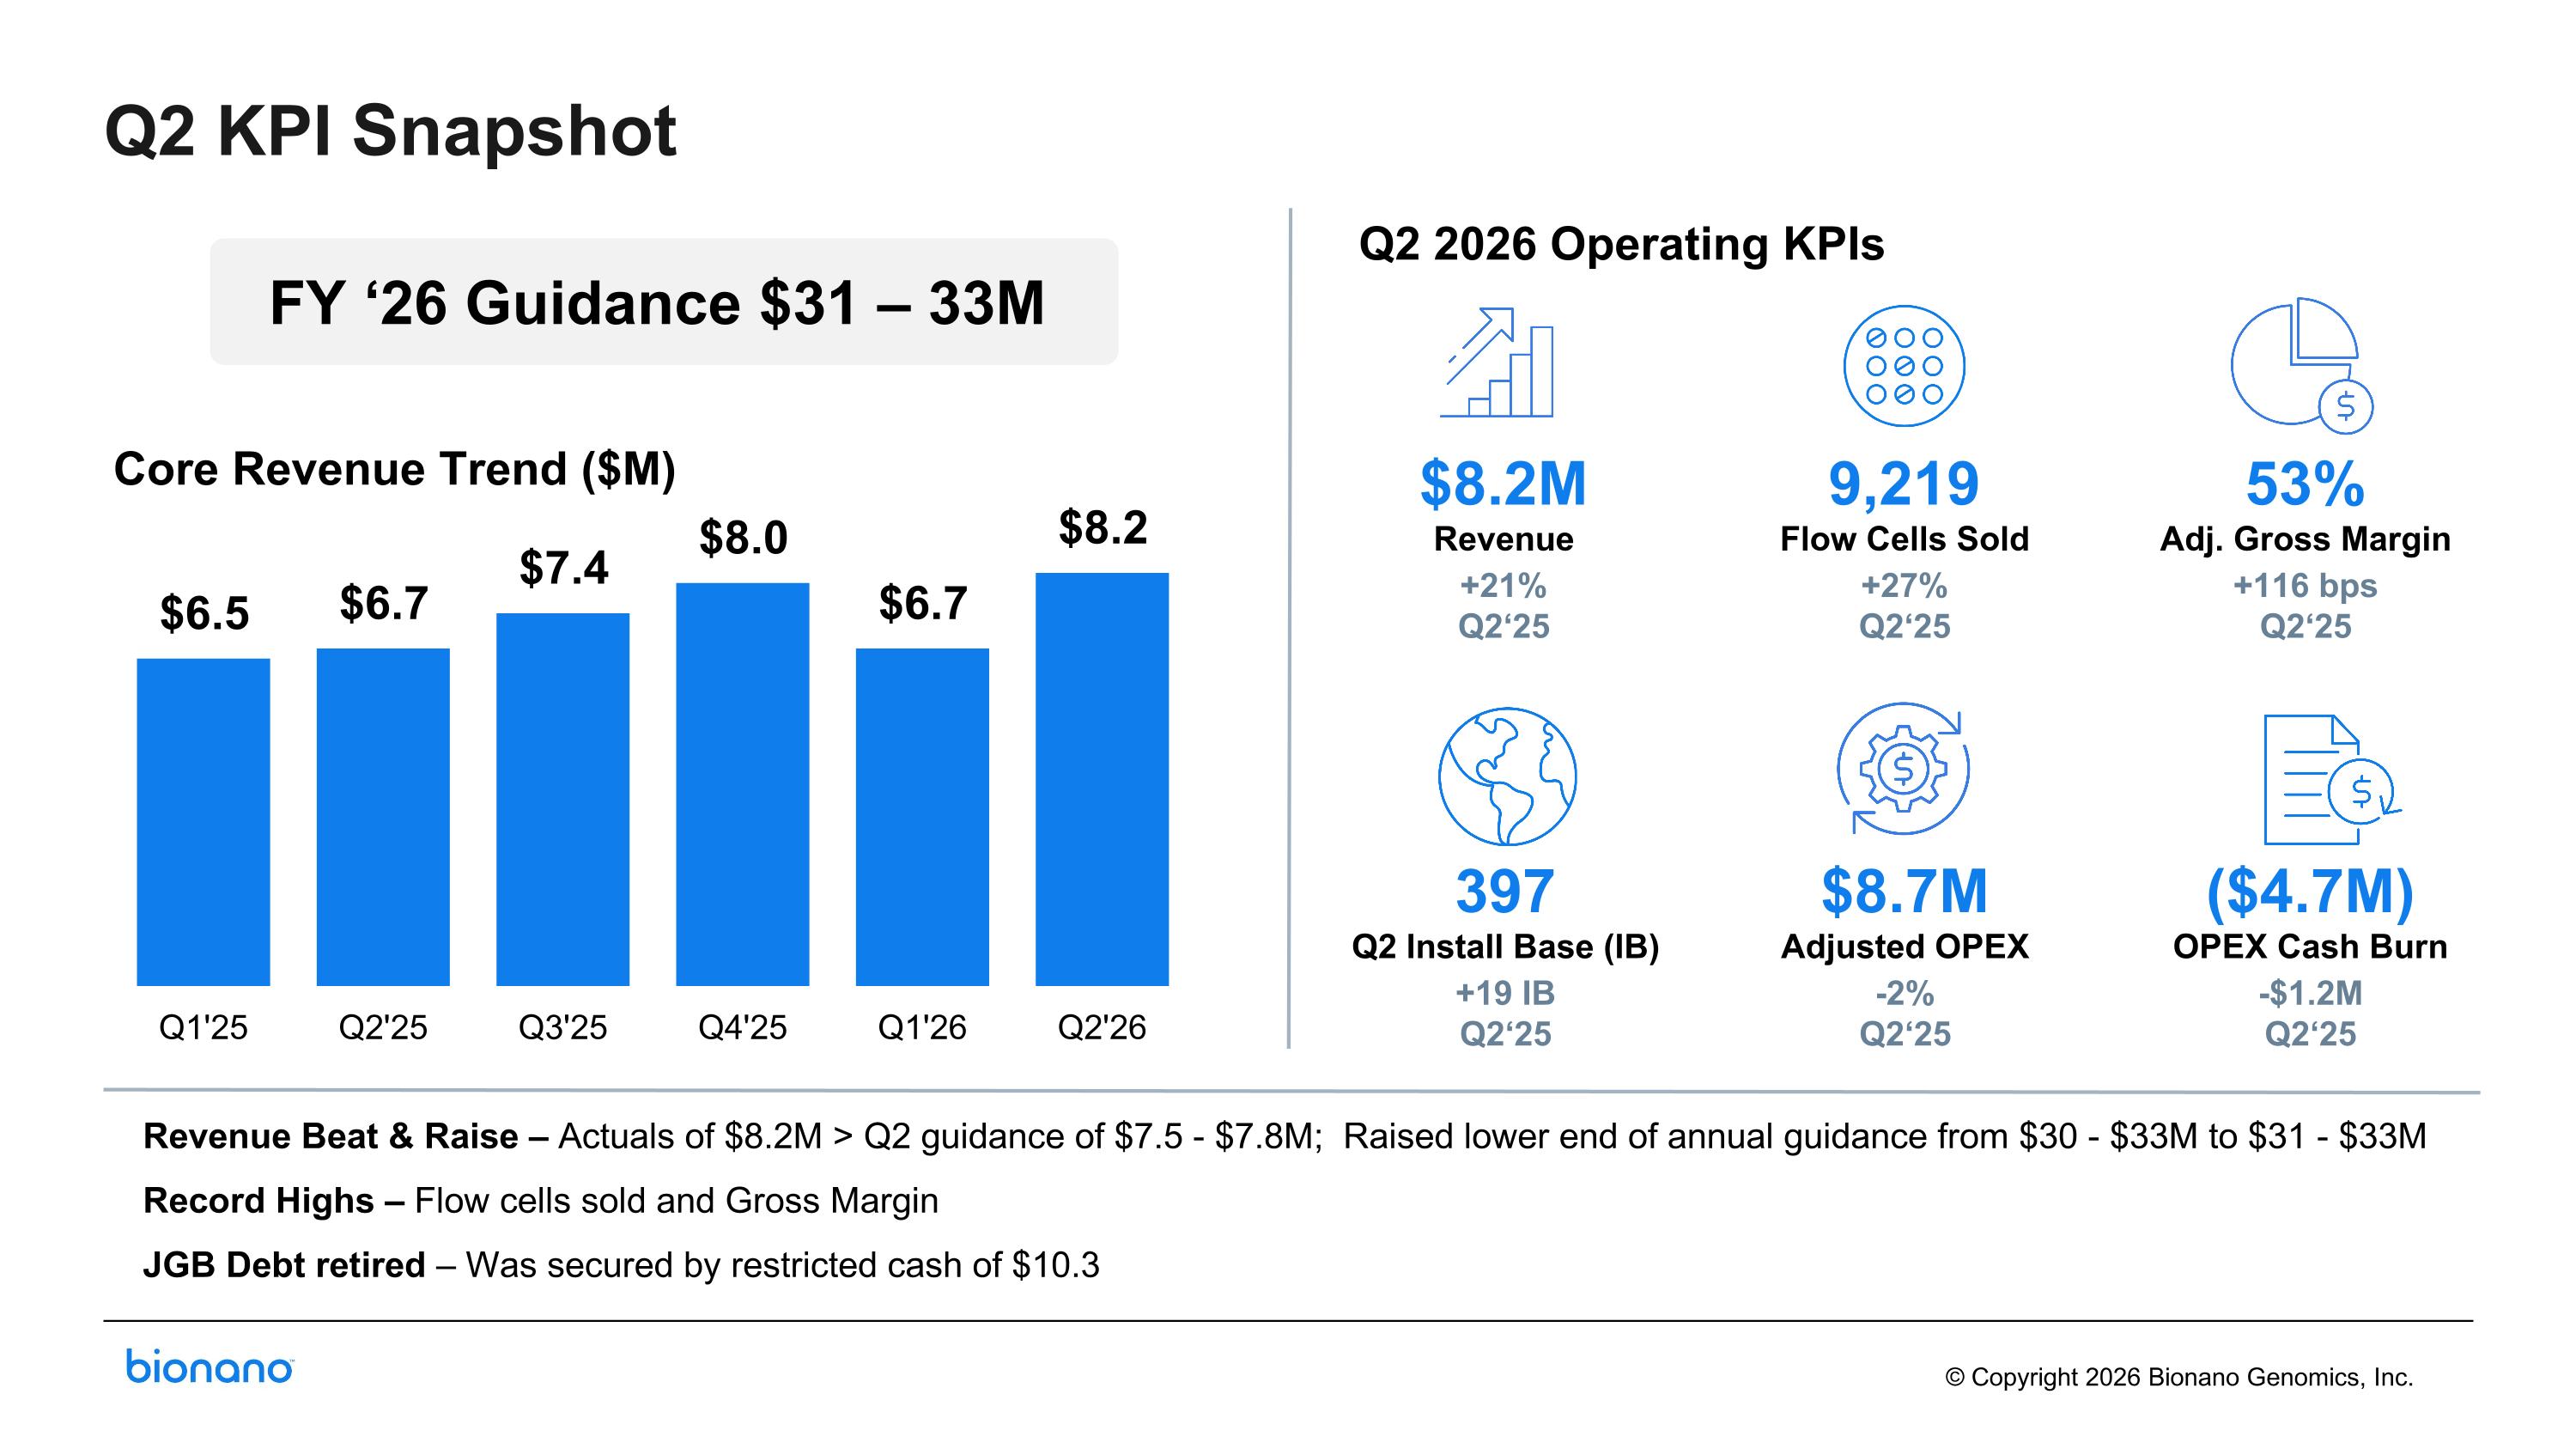
Q2 2026 Operating KPIs Revenue Beat & Raise – Actuals of $8.2M > Q2 guidance of $7.5 - $7.8M; Raised lower end of annual guidance from $30 - $33M to $31 - $33M Record Highs – Flow cells sold and Gross Margin JGB Debt retired – Was secured by restricted cash of $10.3 FY ‘26 Guidance $31 – 33M Q2 KPI Snapshot Core Revenue Trend ($M) 9,219 Flow Cells Sold +27% Q2‘25 $8.2M Revenue +21% Q2‘25 53% Adj. Gross Margin +116 bps Q2‘25 397 Q2 Install Base (IB) +19 IB Q2‘25 $8.7M Adjusted OPEX -2% Q2‘25 ($4.7M) OPEX Cash Burn -$1.2M Q2‘25
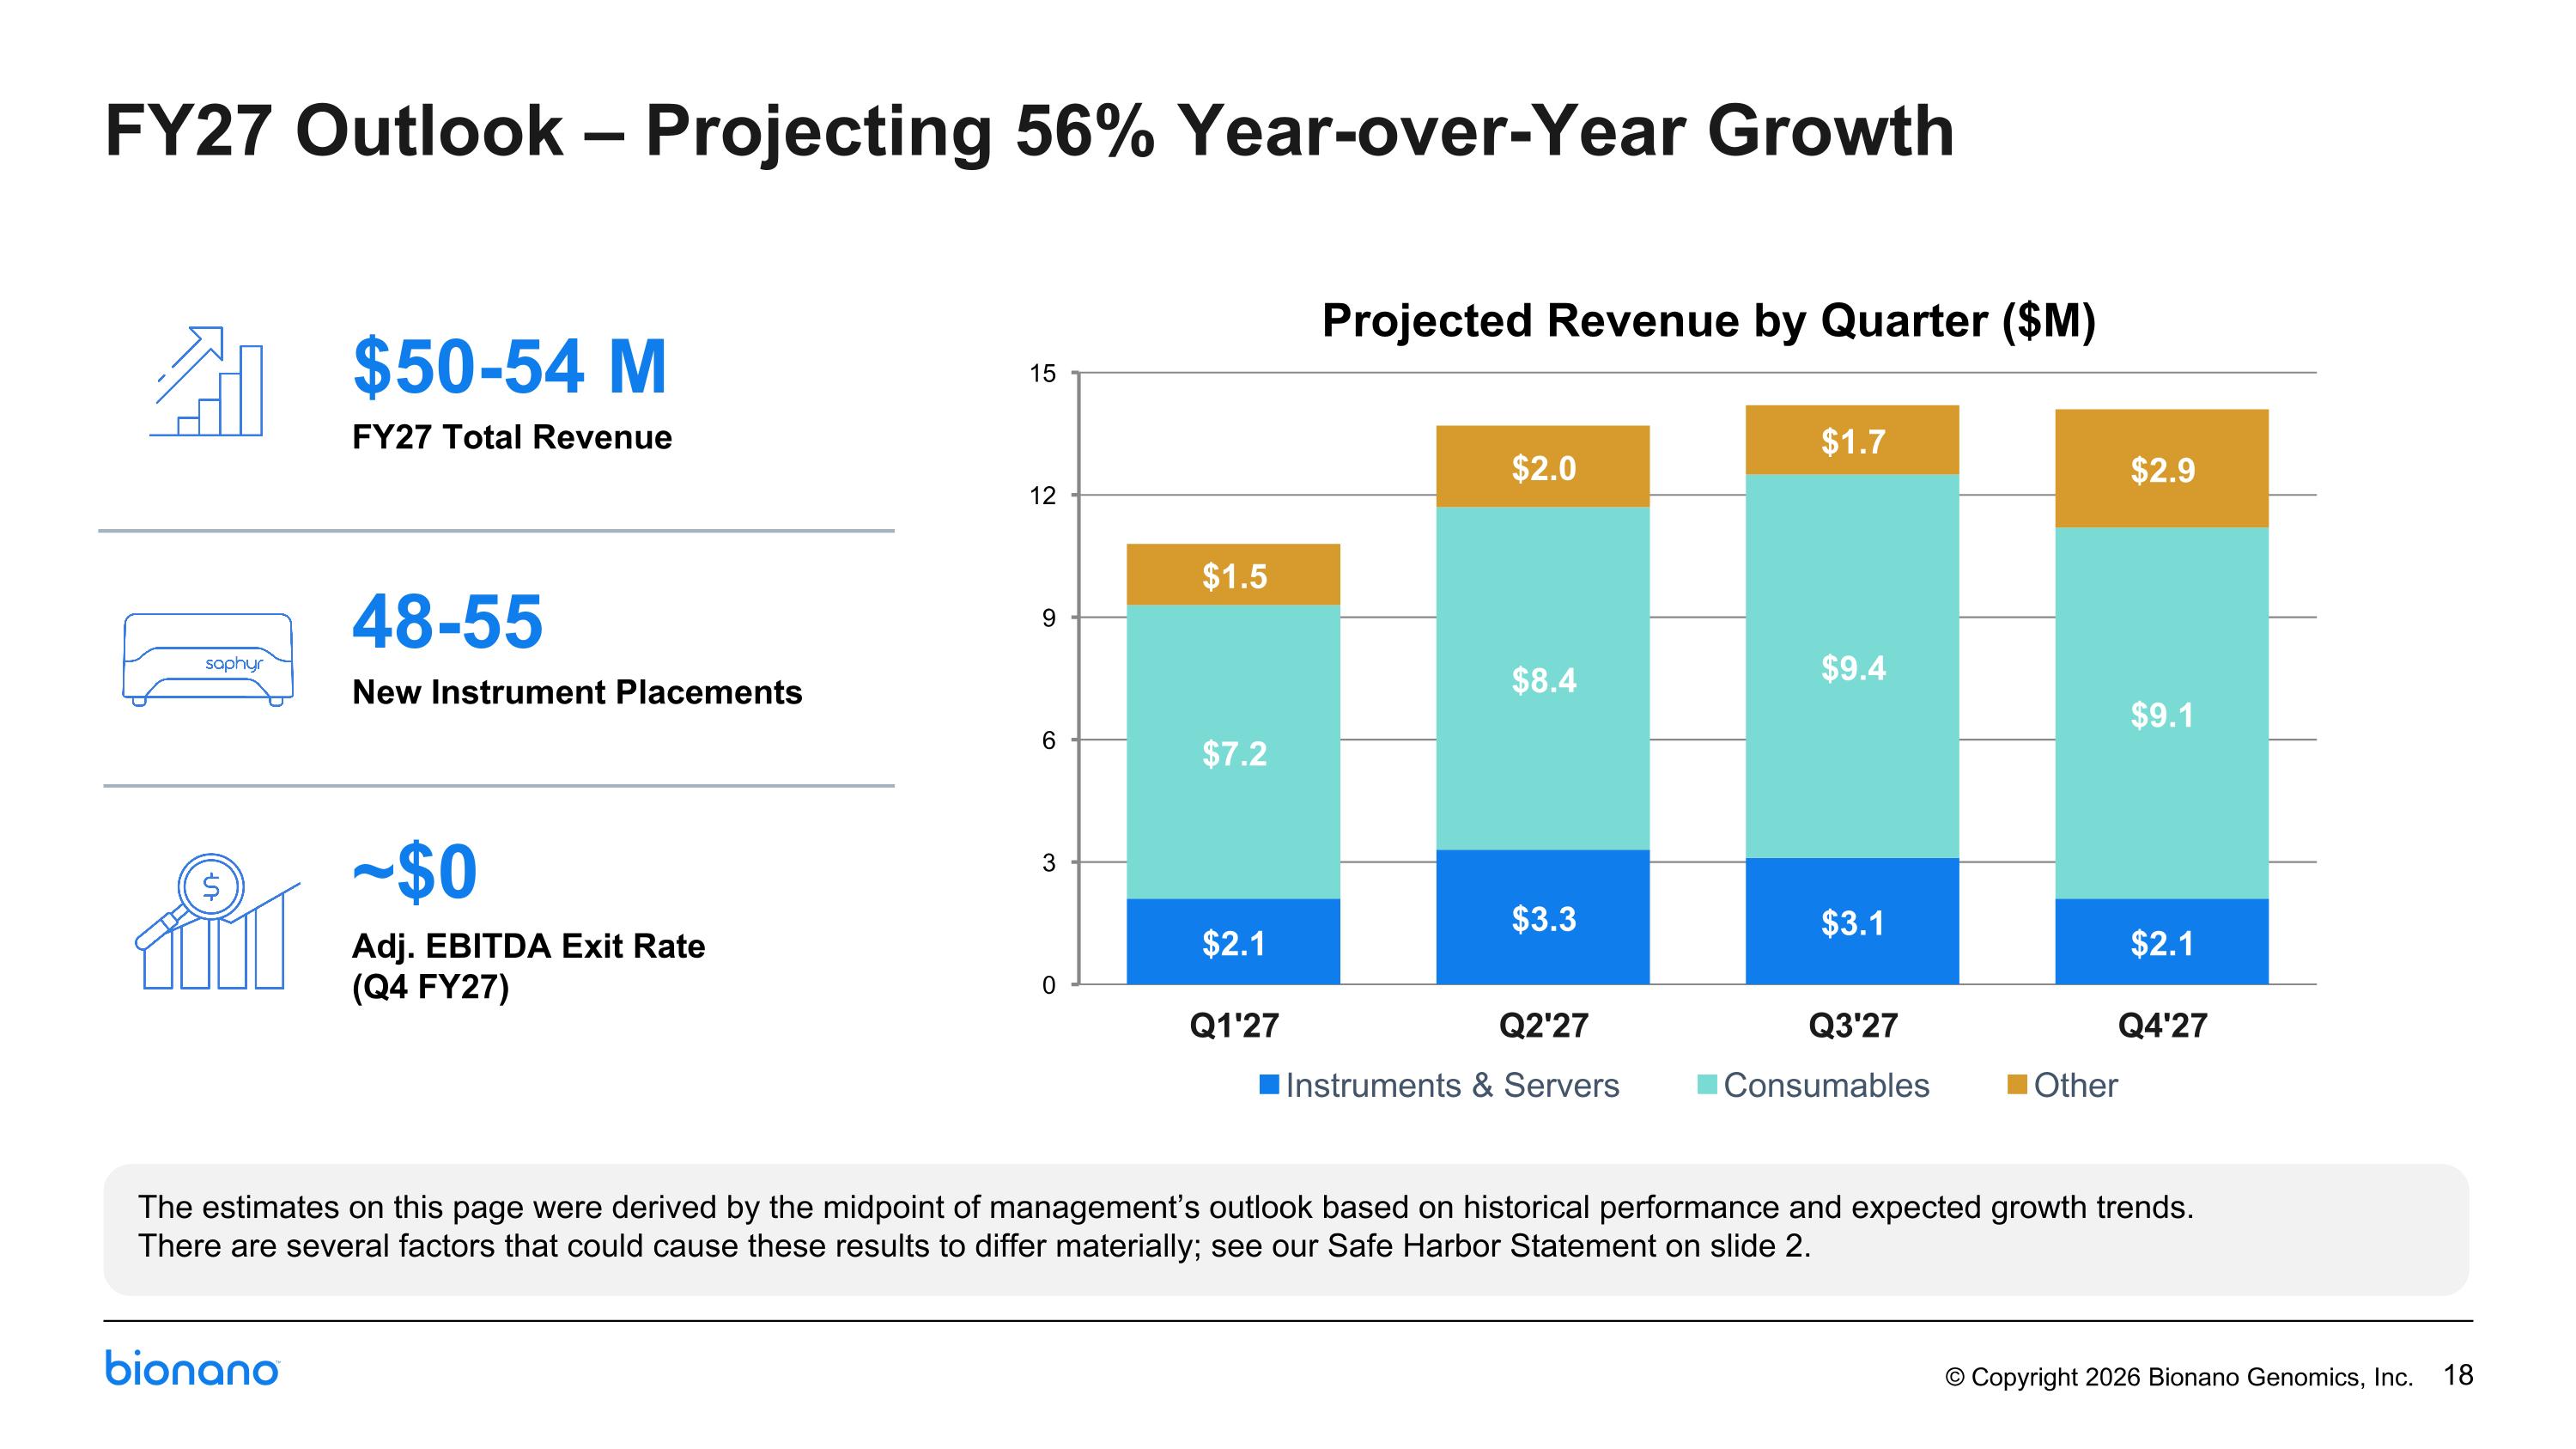
FY27 Outlook – Projecting 56% Year-over-Year Growth $50-54 M FY27 Total Revenue 48-55 New Instrument Placements ~$0 Adj. EBITDA Exit Rate (Q4 FY27) The estimates on this page were derived by the midpoint of management’s outlook based on historical performance and expected growth trends. There are several factors that could cause these results to differ materially; see our Safe Harbor Statement on slide 2. Projected Revenue by Quarter ($M)
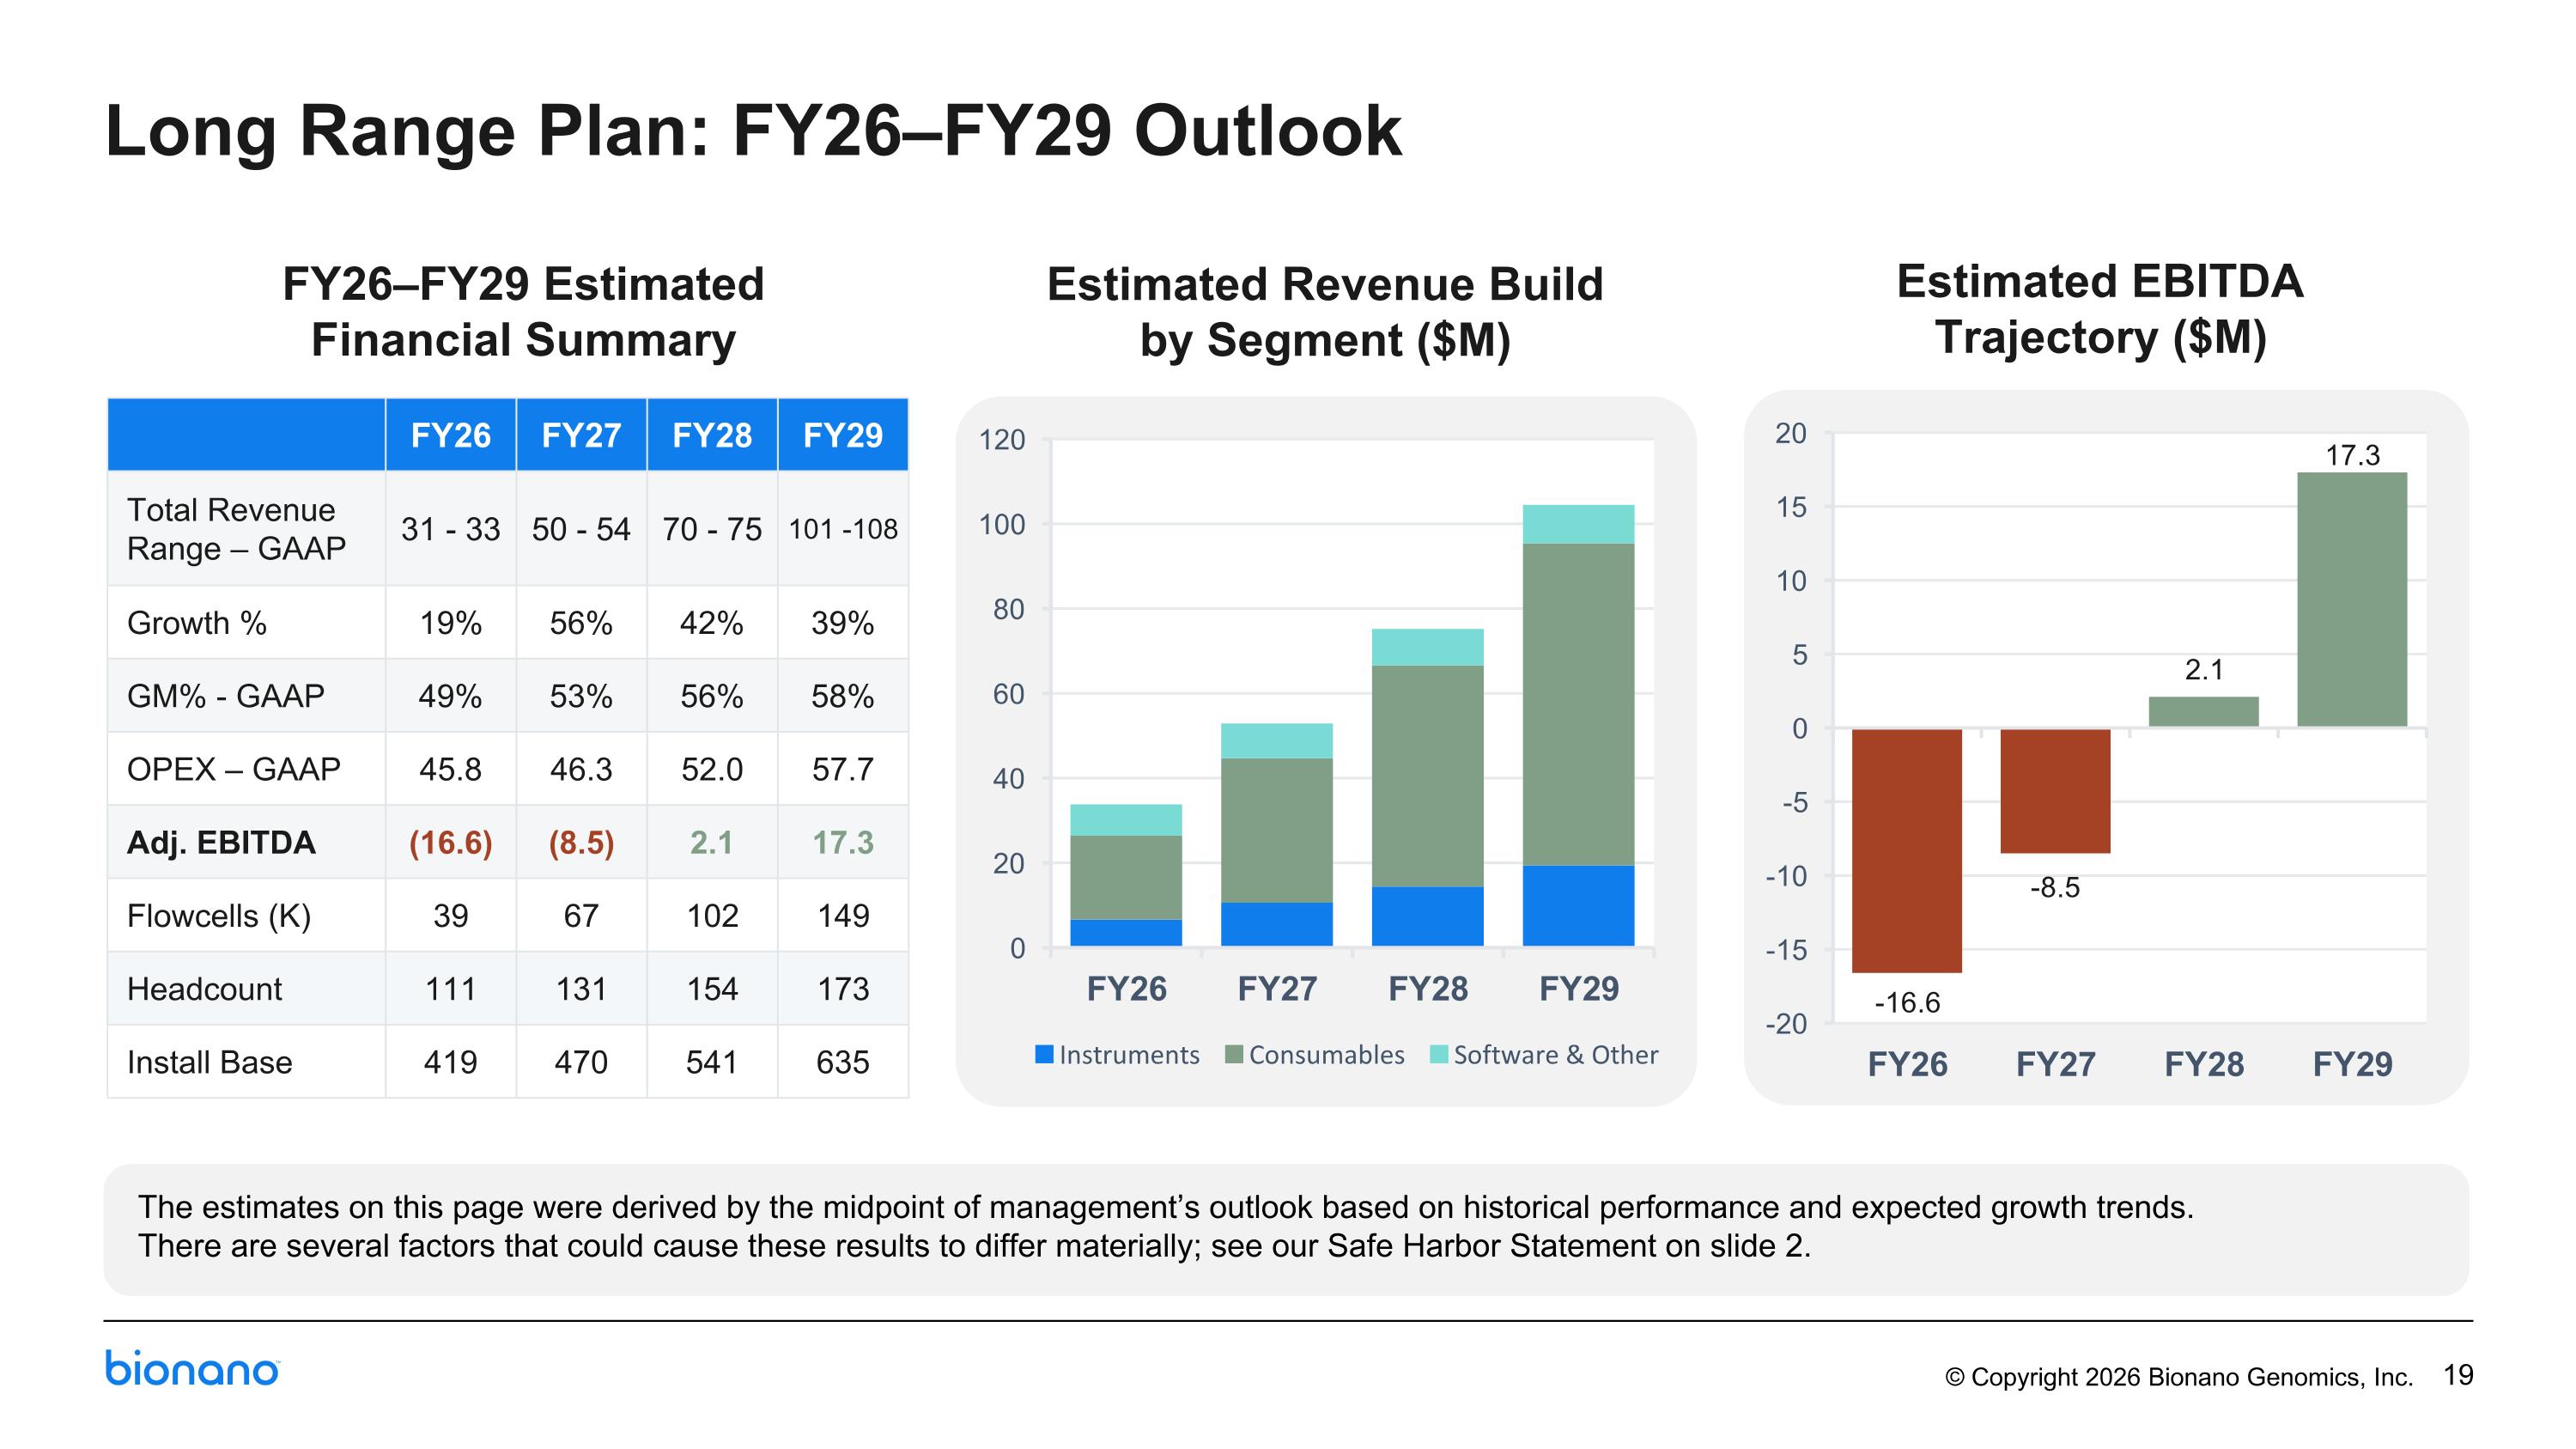
Long Range Plan: FY26–FY29 Outlook FY26–FY29 Estimated Financial Summary Estimated Revenue Build by Segment ($M) Estimated EBITDA Trajectory ($M) FY26 FY27 FY28 FY29 Total Revenue Range – GAAP 31 - 33 50 - 54 70 - 75 101 -108 Growth % 19% 56% 42% 39% GM% - GAAP 49% 53% 56% 58% OPEX – GAAP 45.8 46.3 52.0 57.7 Adj. EBITDA (16.6) (8.5) 2.1 17.3 Flowcells (K) 39 67 102 149 Headcount 111 131 154 173 Install Base 419 470 541 635 The estimates on this page were derived by the midpoint of management’s outlook based on historical performance and expected growth trends. There are several factors that could cause these results to differ materially; see our Safe Harbor Statement on slide 2.
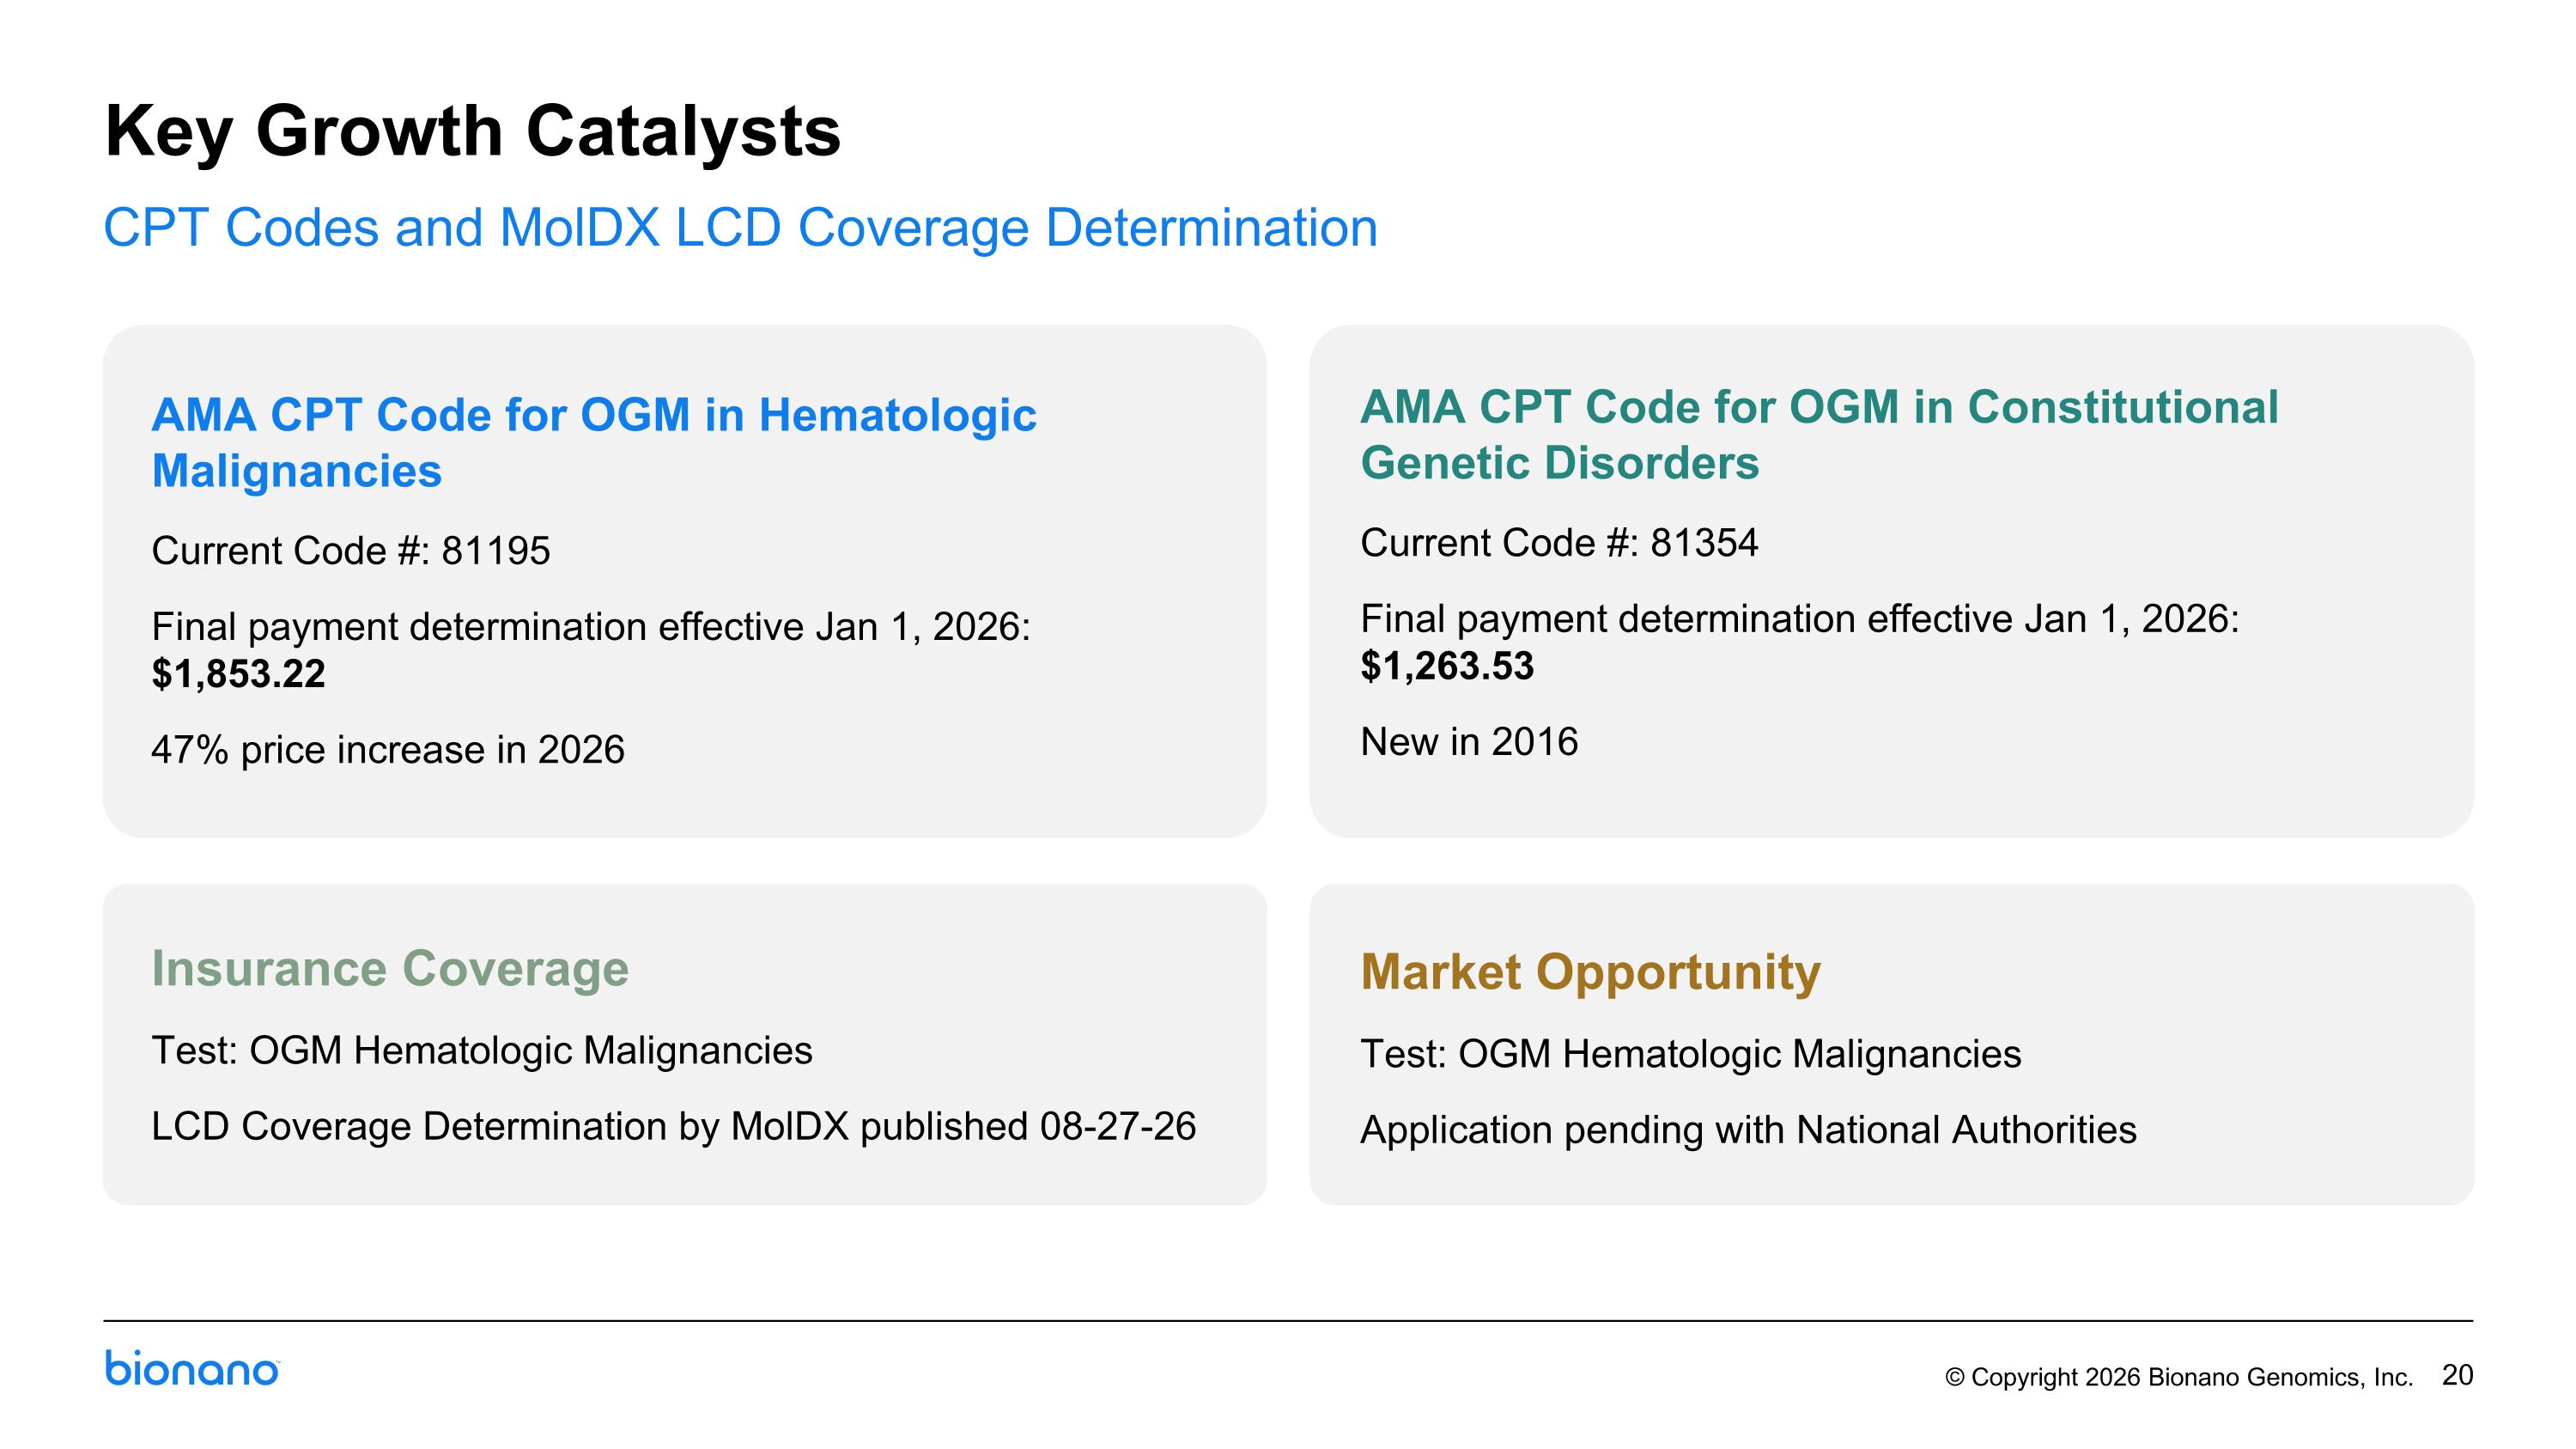
AMA CPT Code for OGM in Hematologic Malignancies Current Code #: 81195 Final payment determination effective Jan 1, 2026: $1,853.22 47% price increase in 2026 Market Opportunity Test: OGM Hematologic Malignancies Application pending with National Authorities Insurance Coverage Test: OGM Hematologic Malignancies LCD Coverage Determination by MolDX published 08-27-26 AMA CPT Code for OGM in Constitutional Genetic Disorders Current Code #: 81354 Final payment determination effective Jan 1, 2026: $1,263.53 New in 2016 Key Growth Catalysts CPT Codes and MolDX LCD Coverage Determination
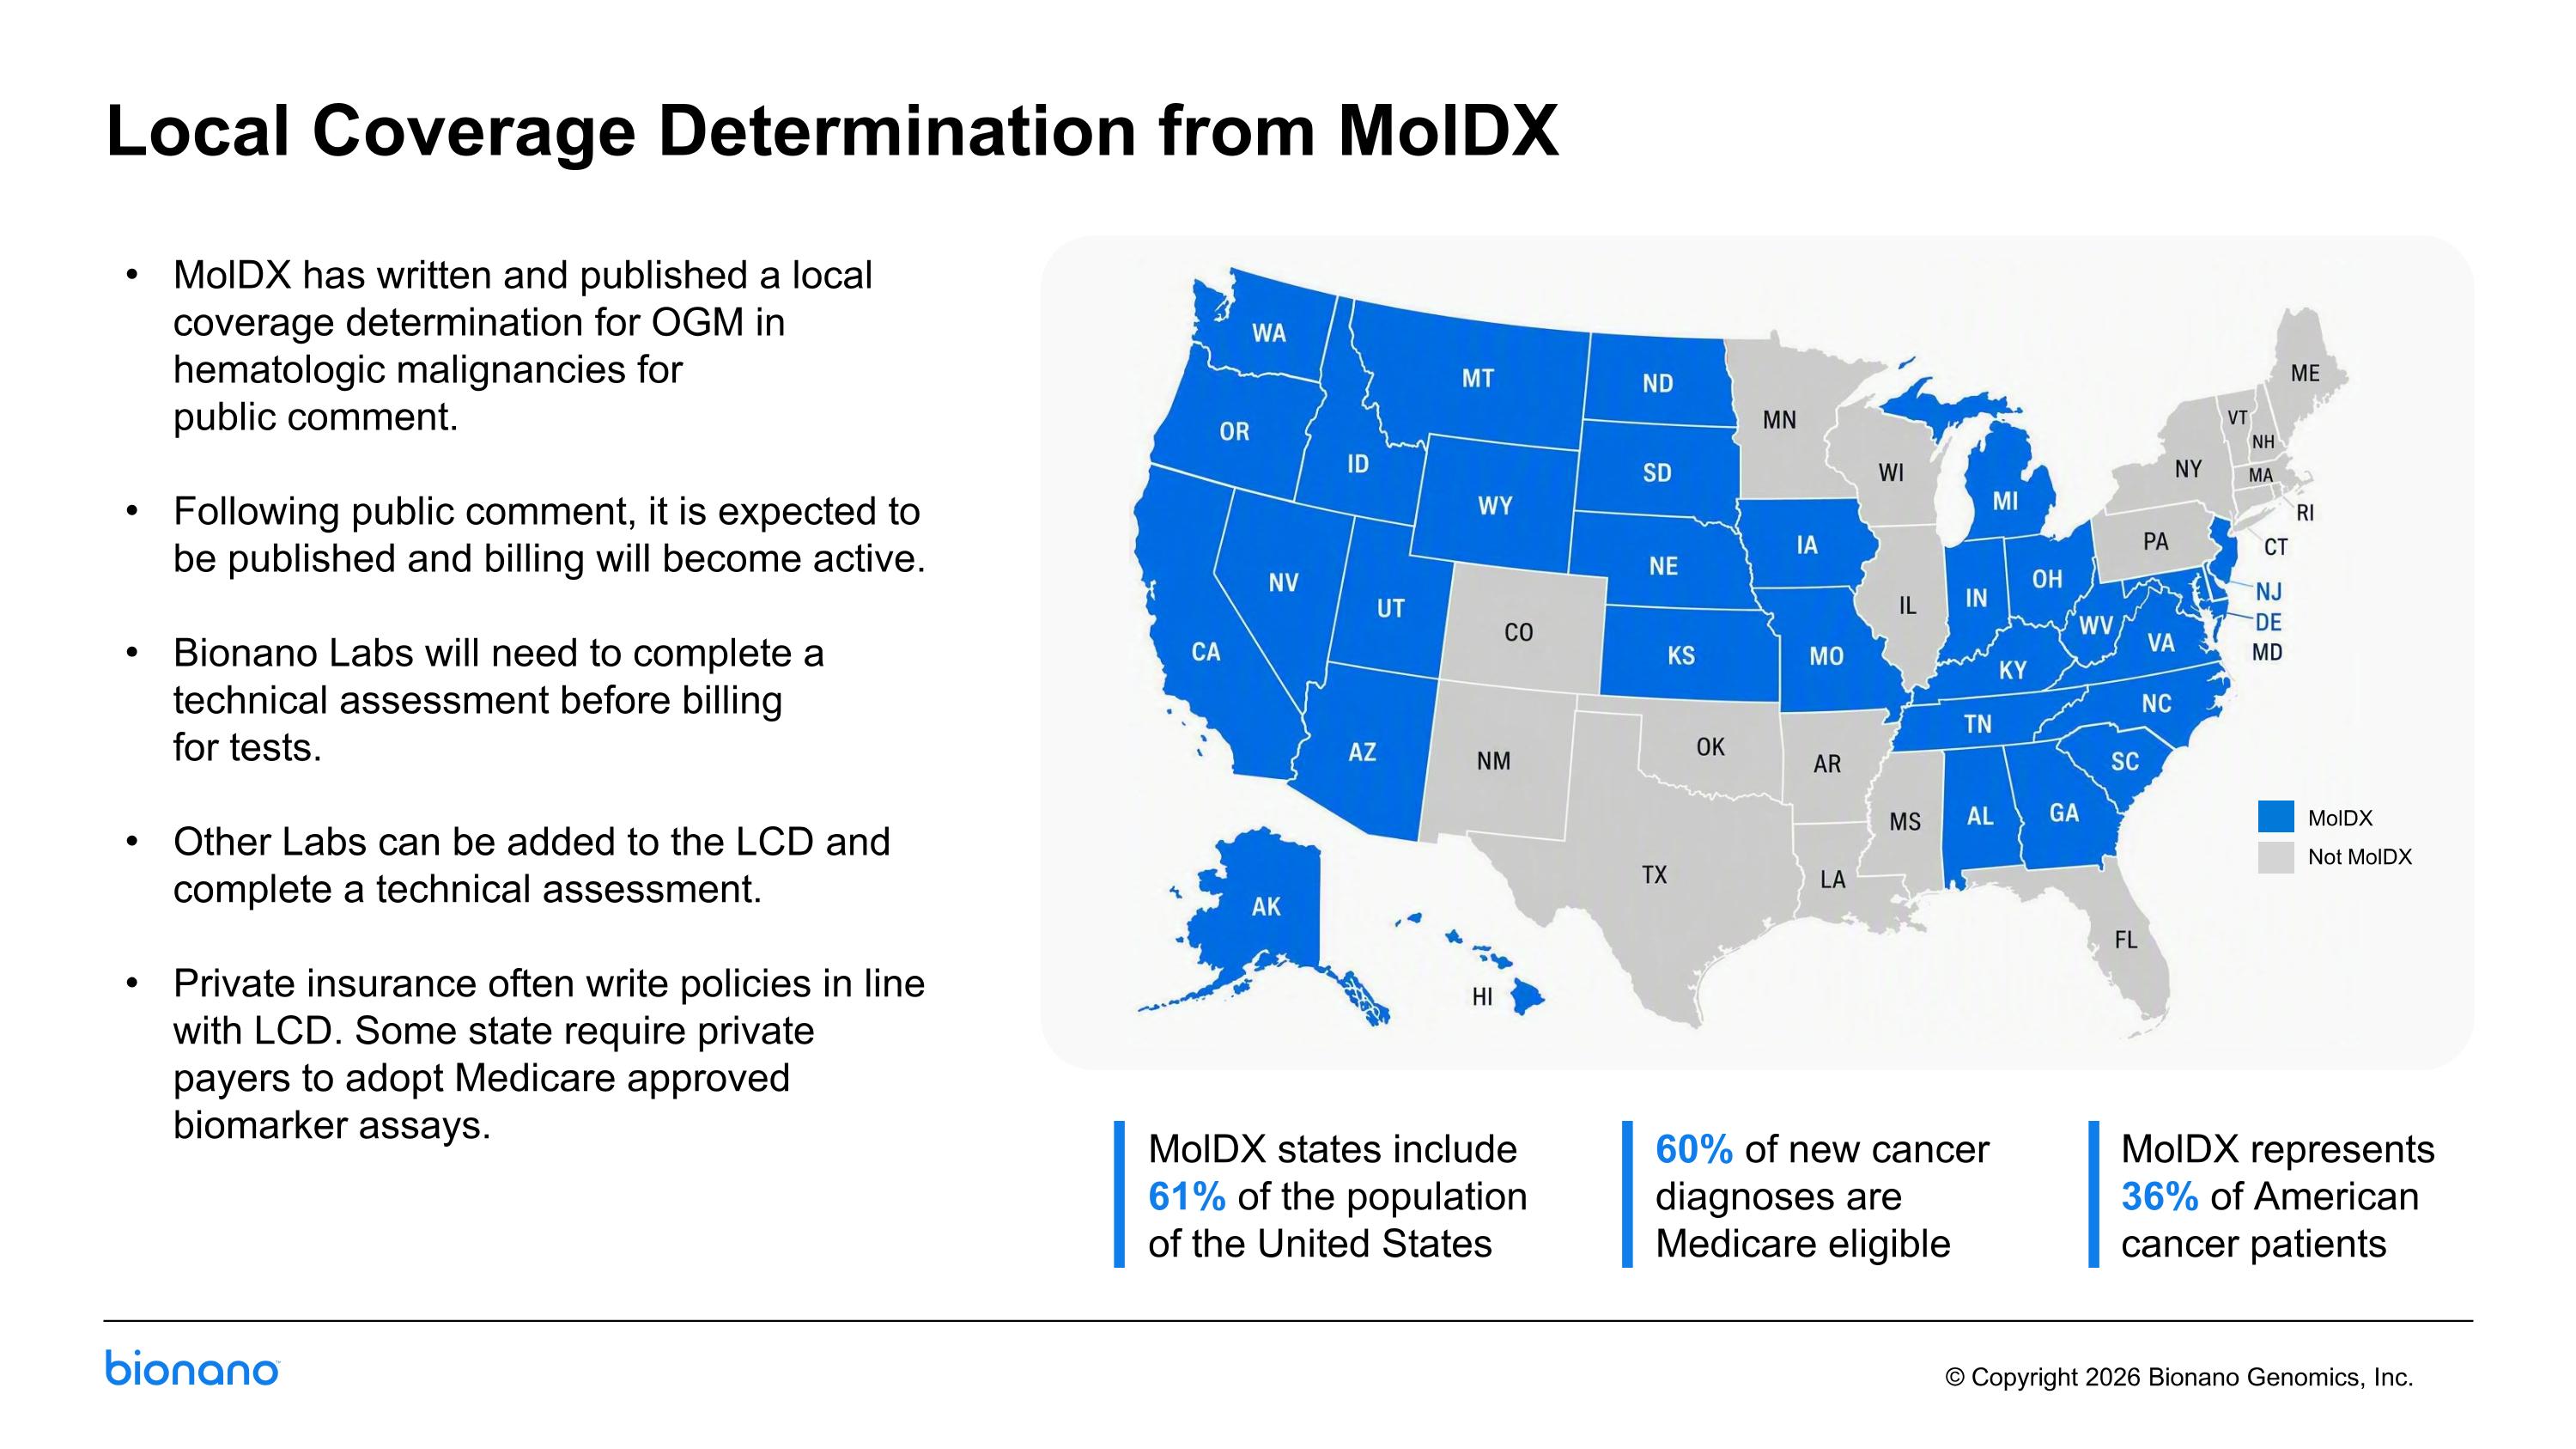
Local Coverage Determination from MolDX MolDX states include 61% of the population of the United States MolDX Not MolDX MolDX has written and published a local coverage determination for OGM in hematologic malignancies for public comment. Following public comment, it is expected to be published and billing will become active. Bionano Labs will need to complete a technical assessment before billing for tests. Other Labs can be added to the LCD and complete a technical assessment. Private insurance often write policies in line with LCD. Some state require private payers to adopt Medicare approved biomarker assays. 60% of new cancer diagnoses are Medicare eligible MolDX represents 36% of American cancer patients
New York State Approval of Laboratory Heme Workflow Unlocks MSKCC Ability to Offer OGM Testing
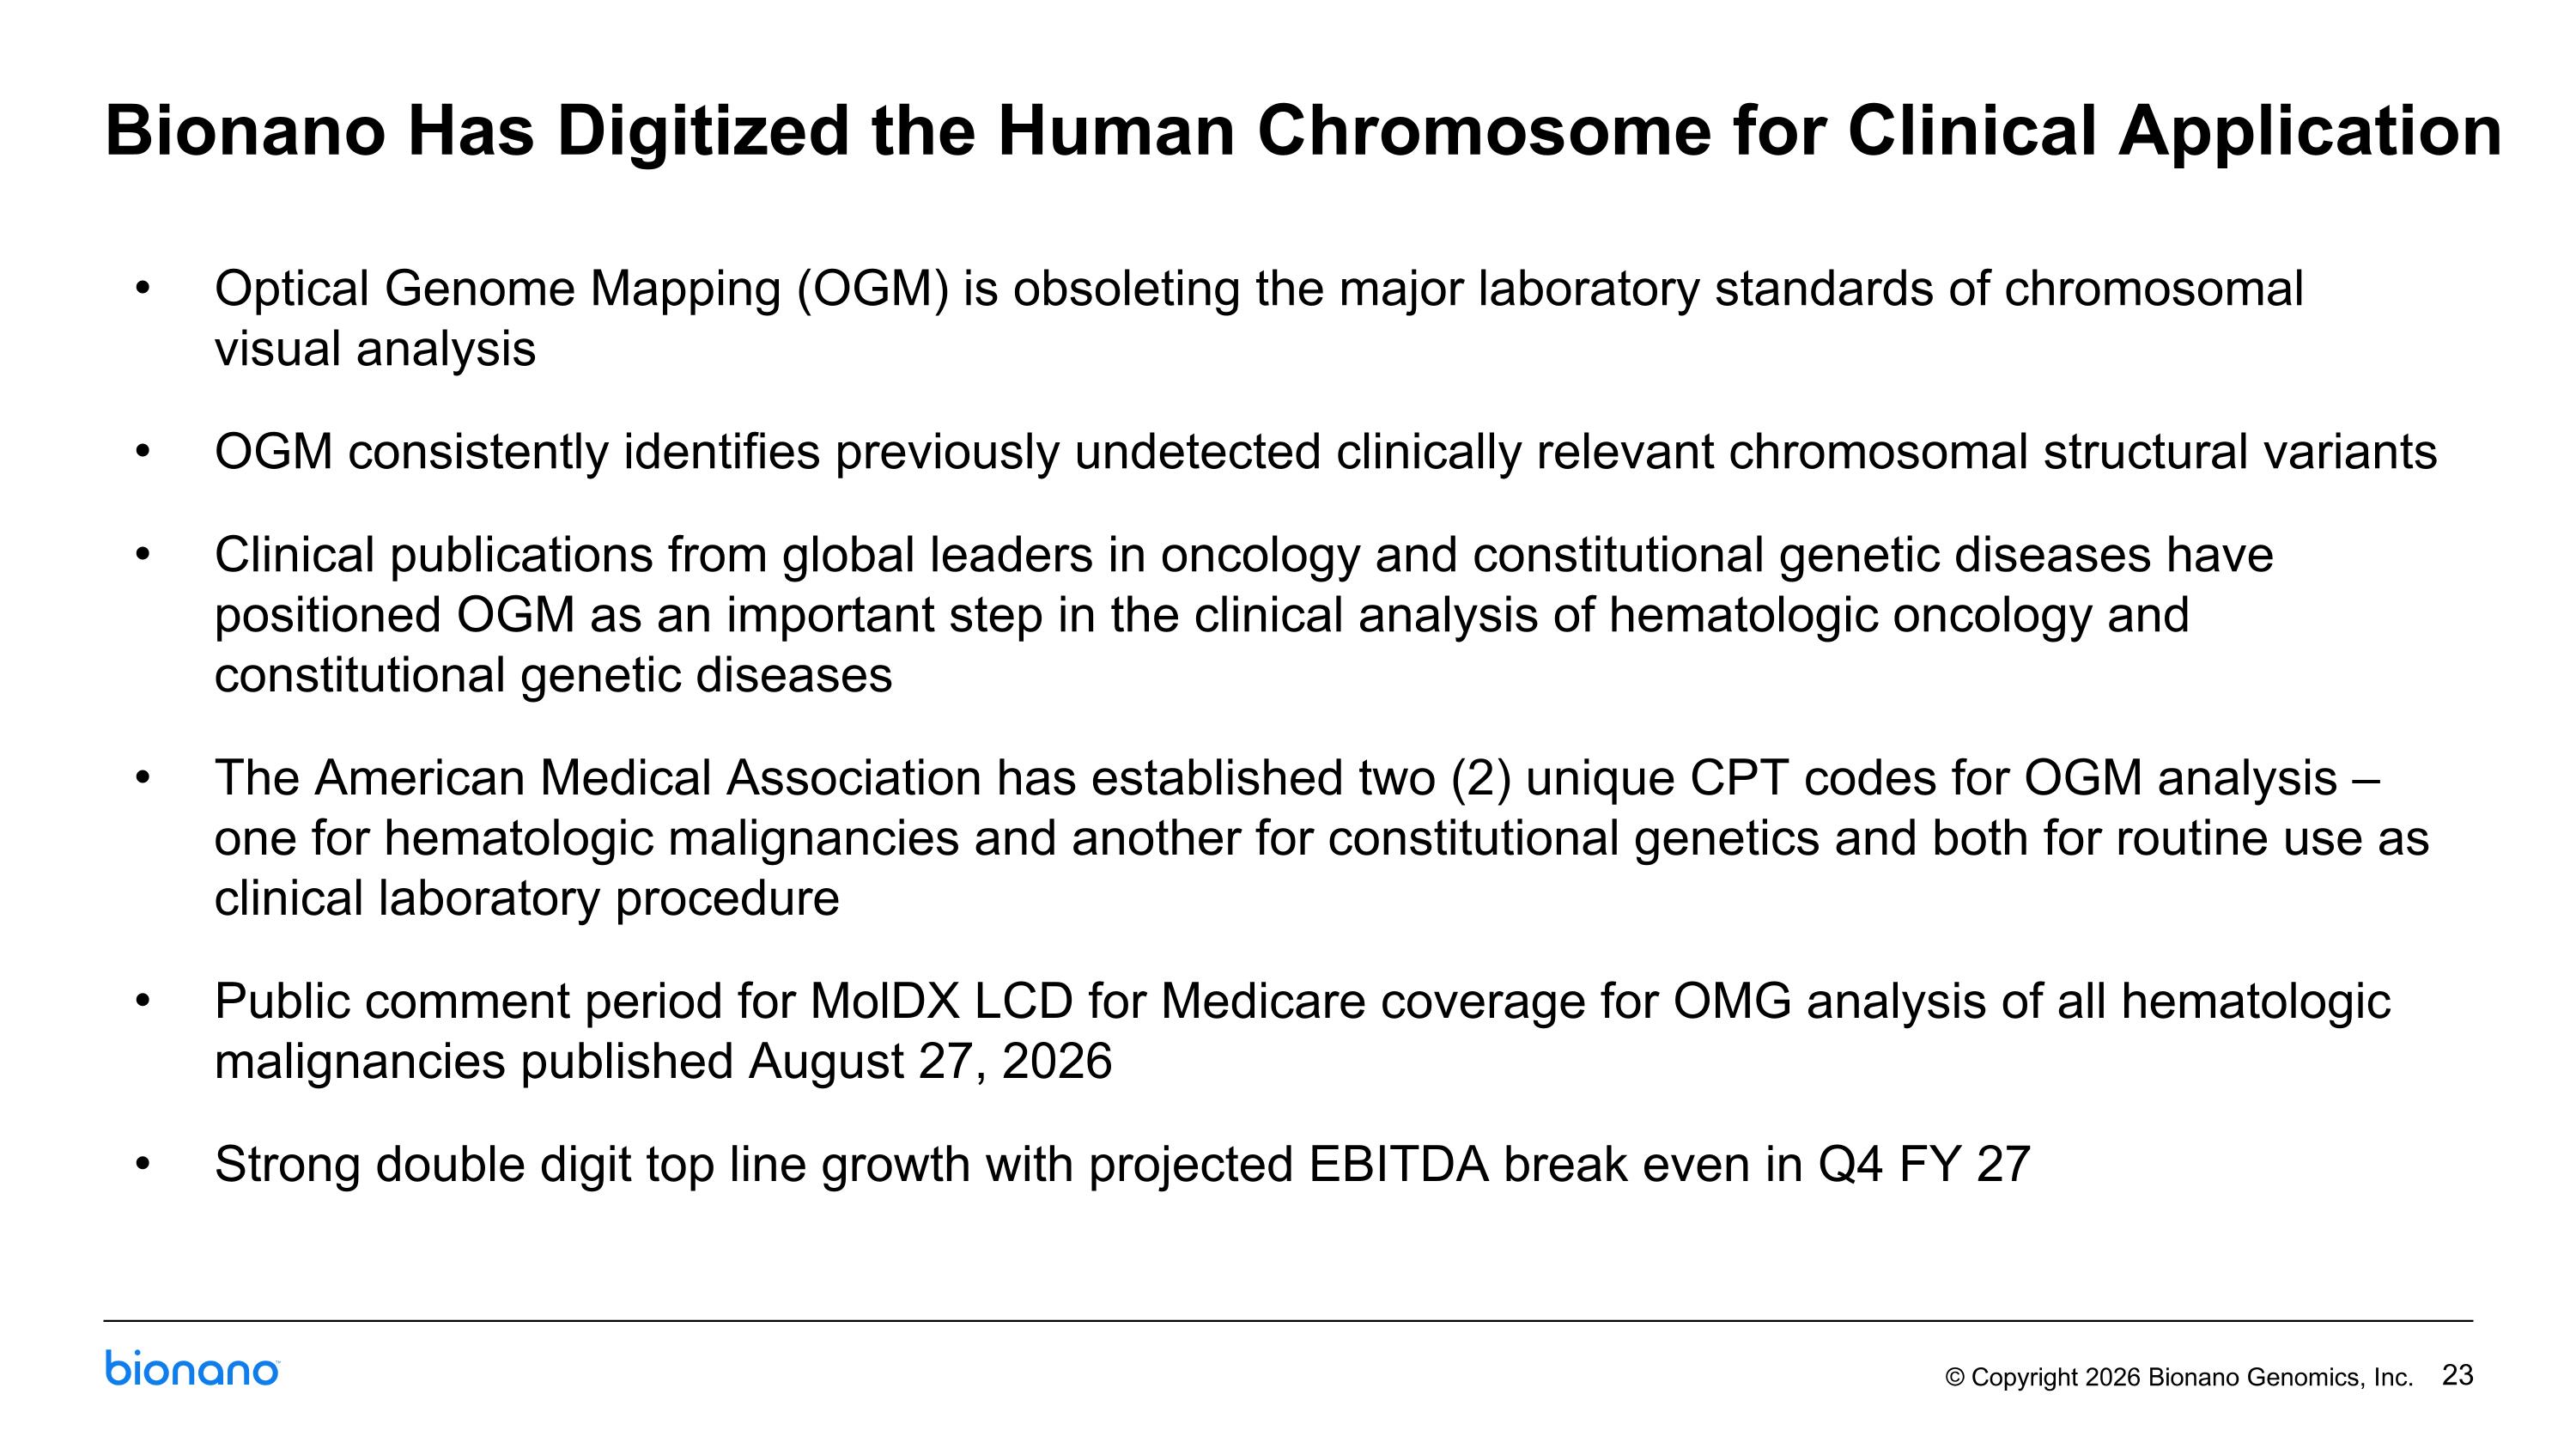
Bionano Has Digitized the Human Chromosome for Clinical Application Optical Genome Mapping (OGM) is obsoleting the major laboratory standards of chromosomal visual analysis OGM consistently identifies previously undetected clinically relevant chromosomal structural variants Clinical publications from global leaders in oncology and constitutional genetic diseases have positioned OGM as an important step in the clinical analysis of hematologic oncology and constitutional genetic diseases The American Medical Association has established two (2) unique CPT codes for OGM analysis – one for hematologic malignancies and another for constitutional genetics and both for routine use as clinical laboratory procedure Public comment period for MolDX LCD for Medicare coverage for OMG analysis of all hematologic malignancies published August 27, 2026 Strong double digit top line growth with projected EBITDA break even in Q4 FY 27

Thank you.
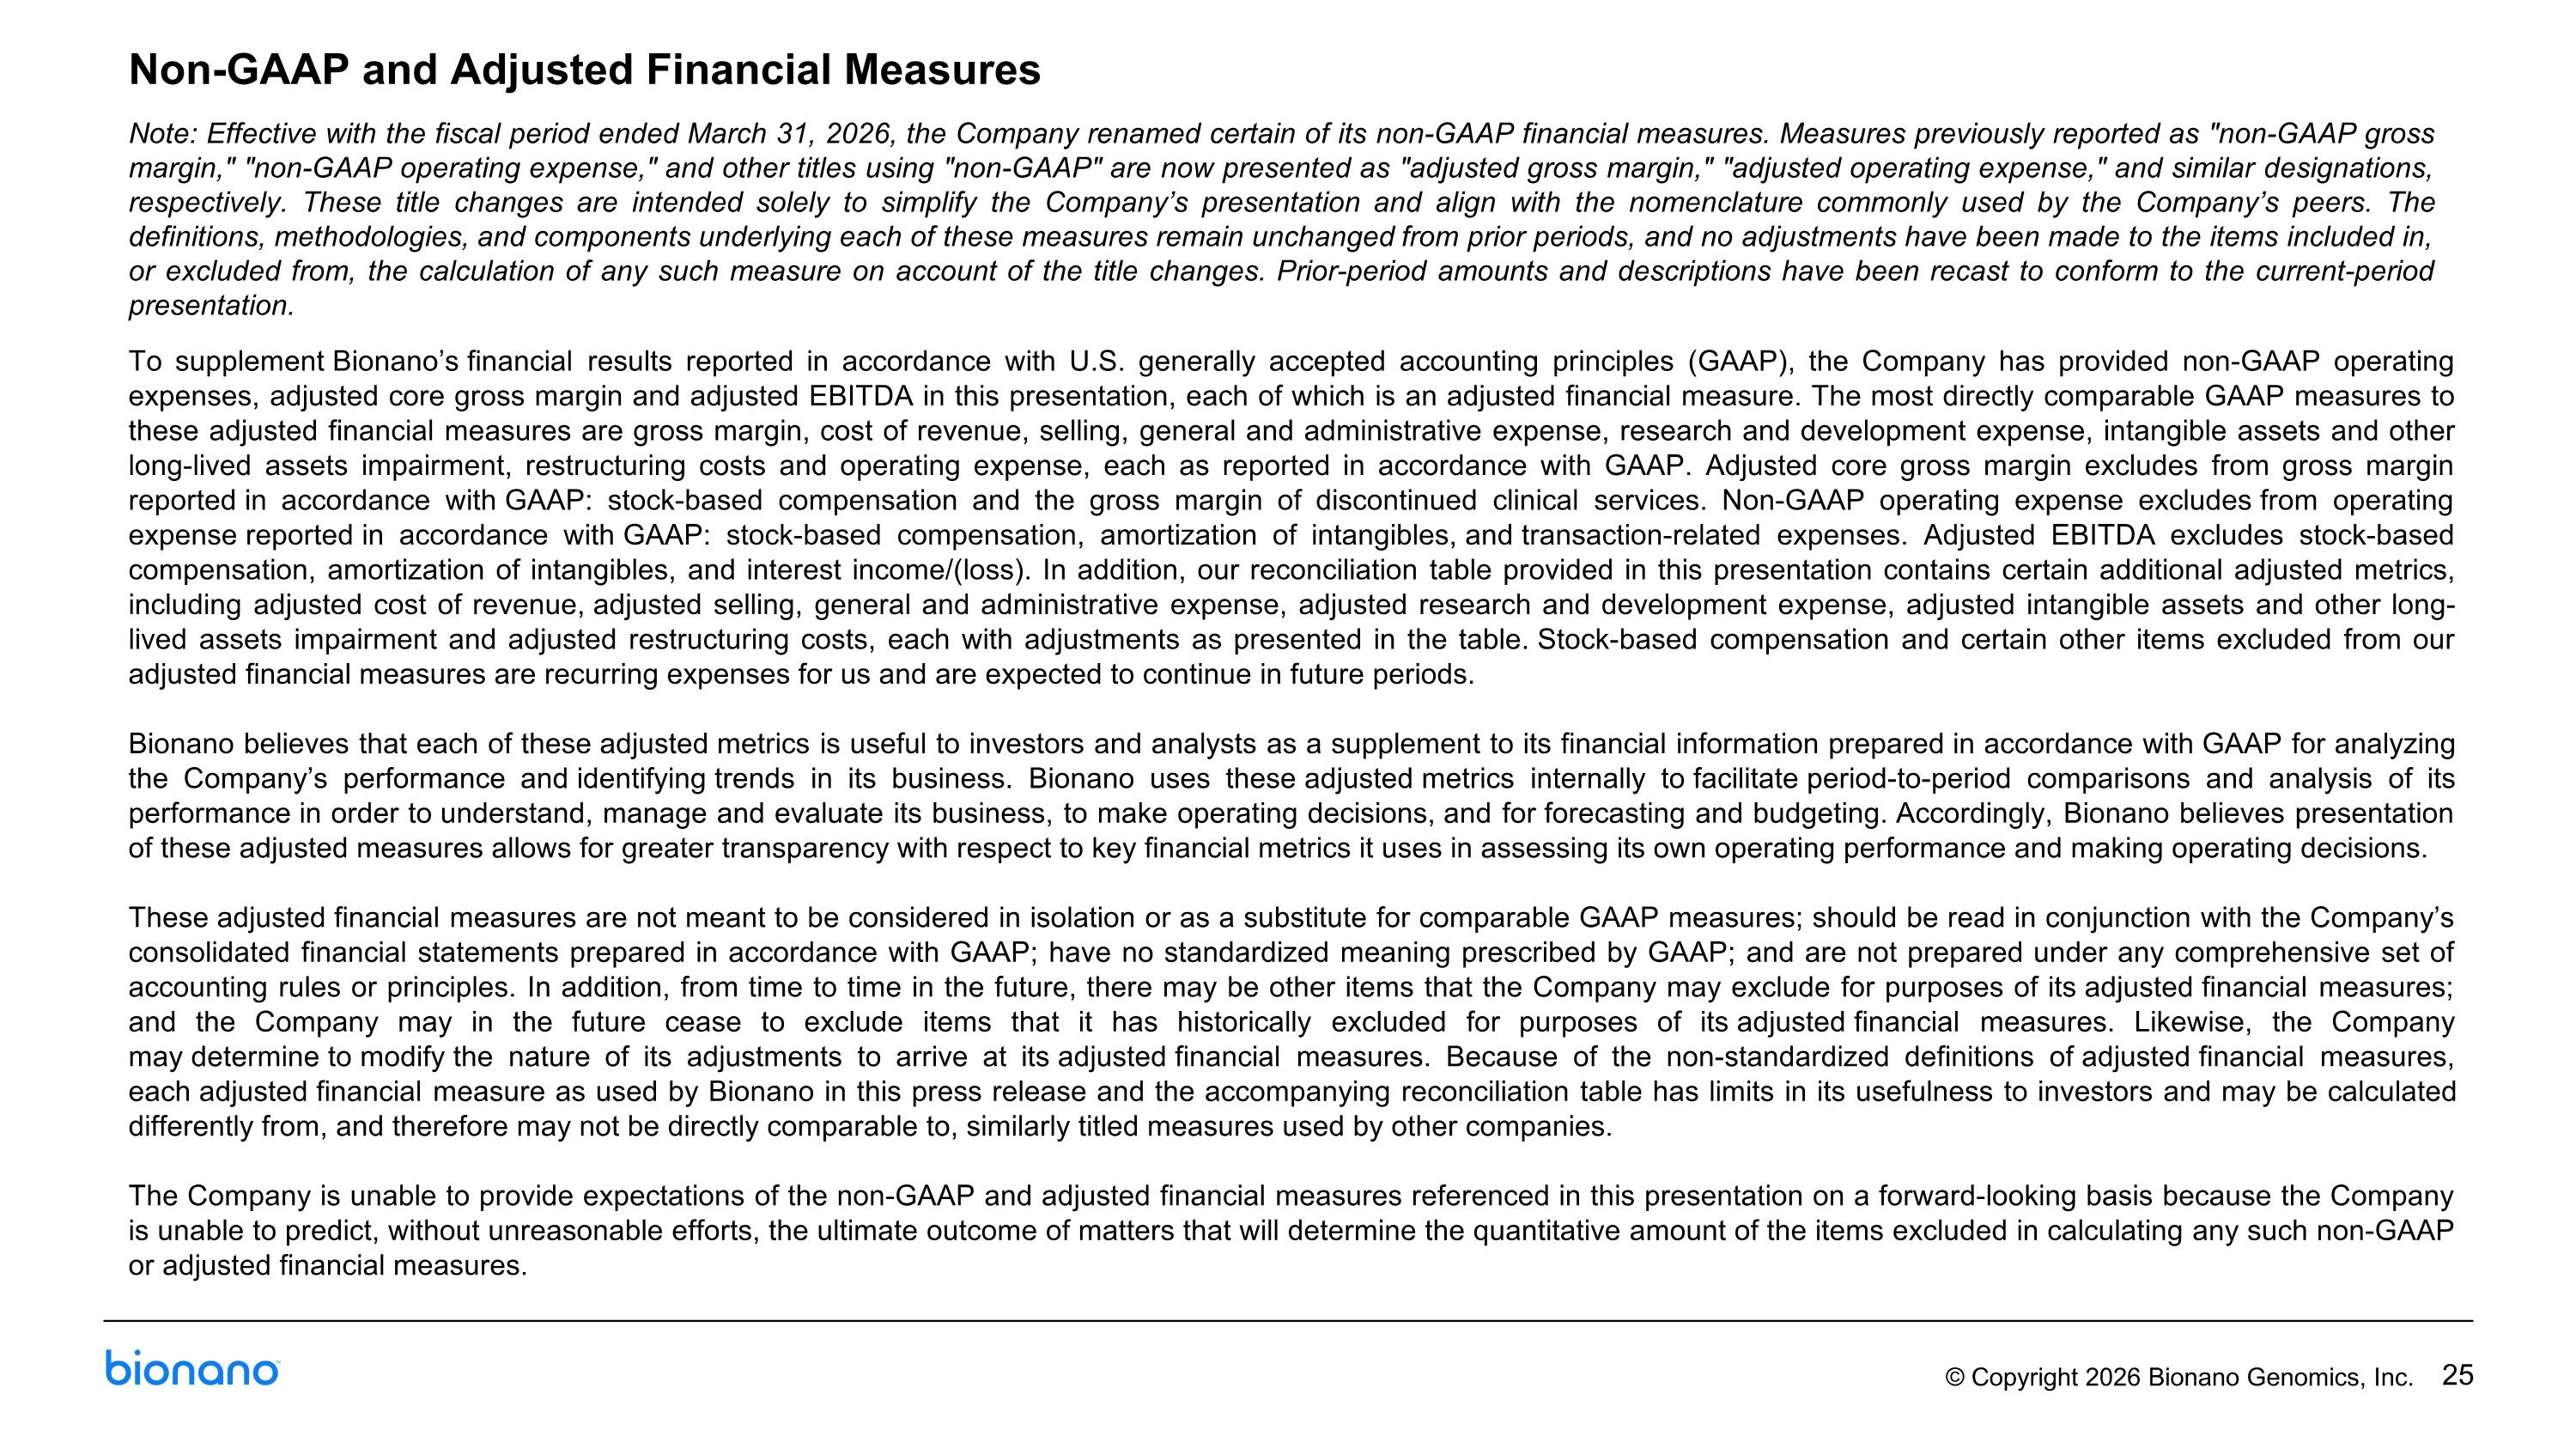
Non-GAAP and Adjusted Financial Measures Note: Effective with the fiscal period ended March 31, 2026, the Company renamed certain of its non-GAAP financial measures. Measures previously reported as "non-GAAP gross margin," "non-GAAP operating expense," and other titles using "non-GAAP" are now presented as "adjusted gross margin," "adjusted operating expense," and similar designations, respectively. These title changes are intended solely to simplify the Company’s presentation and align with the nomenclature commonly used by the Company’s peers. The definitions, methodologies, and components underlying each of these measures remain unchanged from prior periods, and no adjustments have been made to the items included in, or excluded from, the calculation of any such measure on account of the title changes. Prior-period amounts and descriptions have been recast to conform to the current-period presentation. To supplement Bionano’s financial results reported in accordance with U.S. generally accepted accounting principles (GAAP), the Company has provided non-GAAP operating expenses, adjusted core gross margin and adjusted EBITDA in this presentation, each of which is an adjusted financial measure. The most directly comparable GAAP measures to these adjusted financial measures are gross margin, cost of revenue, selling, general and administrative expense, research and development expense, intangible assets and other long-lived assets impairment, restructuring costs and operating expense, each as reported in accordance with GAAP. Adjusted core gross margin excludes from gross margin reported in accordance with GAAP: stock-based compensation and the gross margin of discontinued clinical services. Non-GAAP operating expense excludes from operating expense reported in accordance with GAAP: stock-based compensation, amortization of intangibles, and transaction-related expenses. Adjusted EBITDA excludes stock-based compensation, amortization of intangibles, and interest income/(loss). In addition, our reconciliation table provided in this presentation contains certain additional adjusted metrics, including adjusted cost of revenue, adjusted selling, general and administrative expense, adjusted research and development expense, adjusted intangible assets and other long-lived assets impairment and adjusted restructuring costs, each with adjustments as presented in the table. Stock-based compensation and certain other items excluded from our adjusted financial measures are recurring expenses for us and are expected to continue in future periods. Bionano believes that each of these adjusted metrics is useful to investors and analysts as a supplement to its financial information prepared in accordance with GAAP for analyzing the Company’s performance and identifying trends in its business. Bionano uses these adjusted metrics internally to facilitate period-to-period comparisons and analysis of its performance in order to understand, manage and evaluate its business, to make operating decisions, and for forecasting and budgeting. Accordingly, Bionano believes presentation of these adjusted measures allows for greater transparency with respect to key financial metrics it uses in assessing its own operating performance and making operating decisions. These adjusted financial measures are not meant to be considered in isolation or as a substitute for comparable GAAP measures; should be read in conjunction with the Company’s consolidated financial statements prepared in accordance with GAAP; have no standardized meaning prescribed by GAAP; and are not prepared under any comprehensive set of accounting rules or principles. In addition, from time to time in the future, there may be other items that the Company may exclude for purposes of its adjusted financial measures; and the Company may in the future cease to exclude items that it has historically excluded for purposes of its adjusted financial measures. Likewise, the Company may determine to modify the nature of its adjustments to arrive at its adjusted financial measures. Because of the non-standardized definitions of adjusted financial measures, each adjusted financial measure as used by Bionano in this press release and the accompanying reconciliation table has limits in its usefulness to investors and may be calculated differently from, and therefore may not be directly comparable to, similarly titled measures used by other companies. The Company is unable to provide expectations of the non-GAAP and adjusted financial measures referenced in this presentation on a forward-looking basis because the Company is unable to predict, without unreasonable efforts, the ultimate outcome of matters that will determine the quantitative amount of the items excluded in calculating any such non-GAAP or adjusted financial measures.
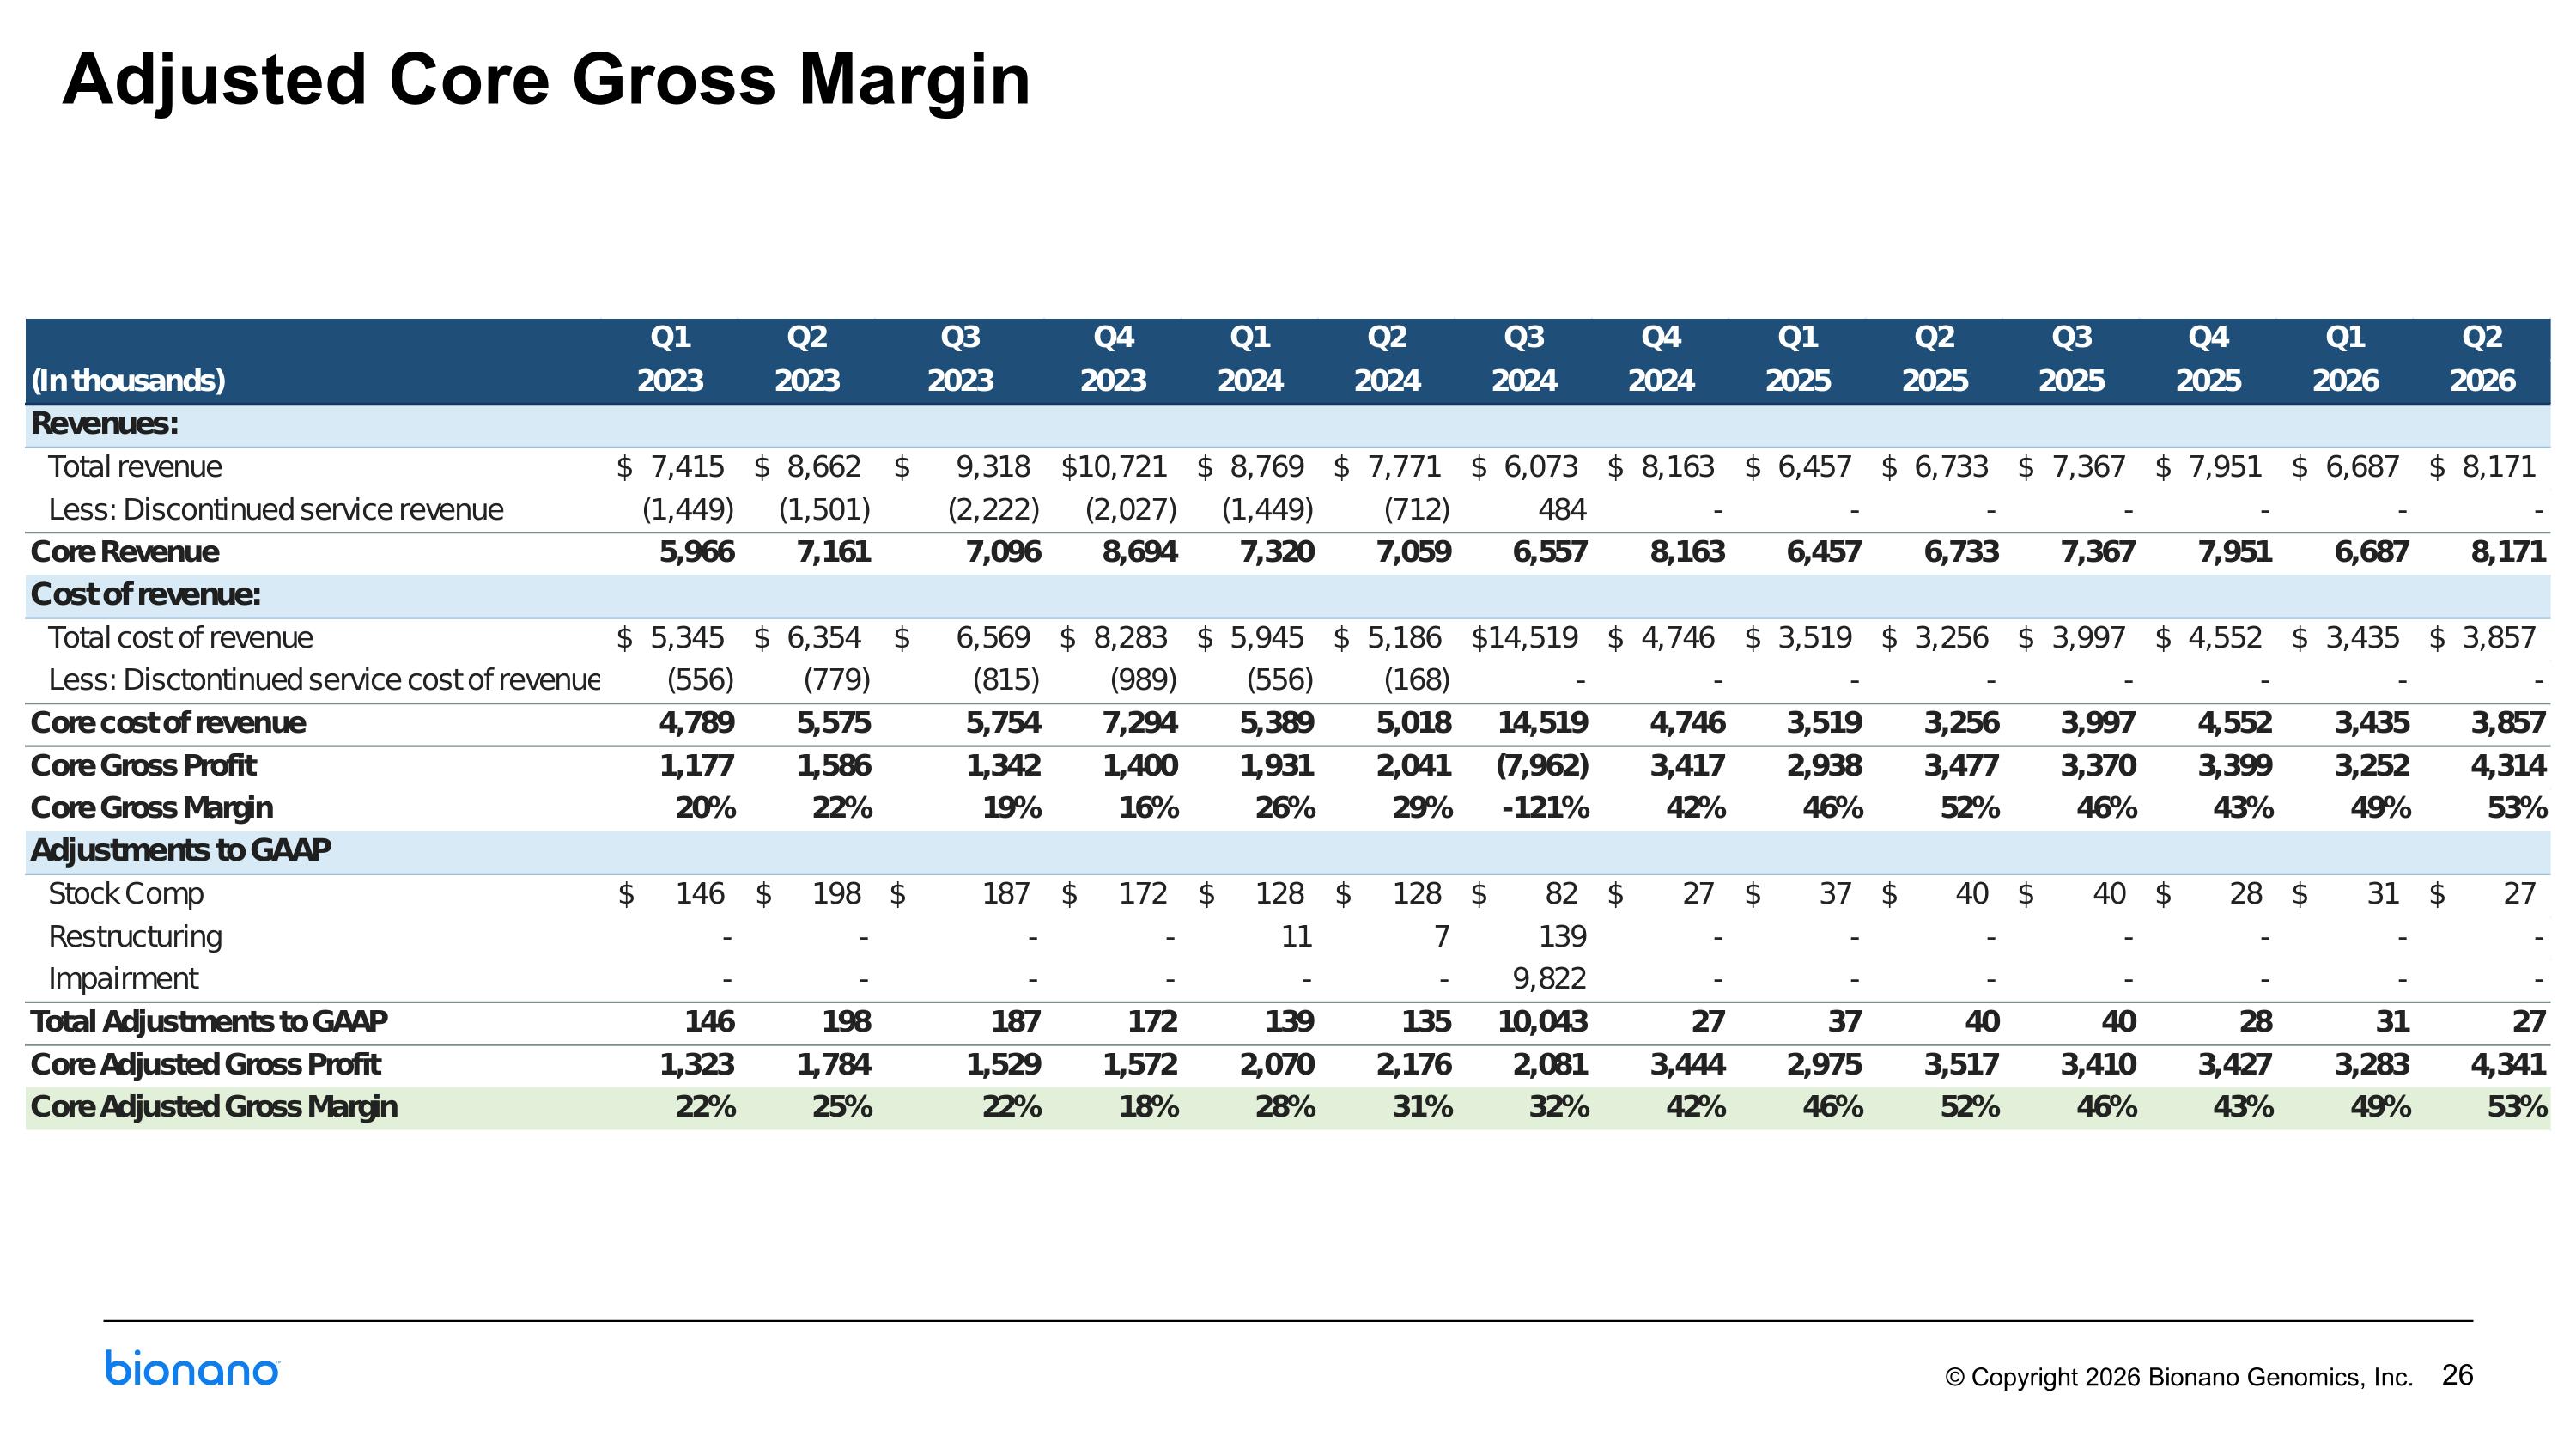
Adjusted Core Gross Margin
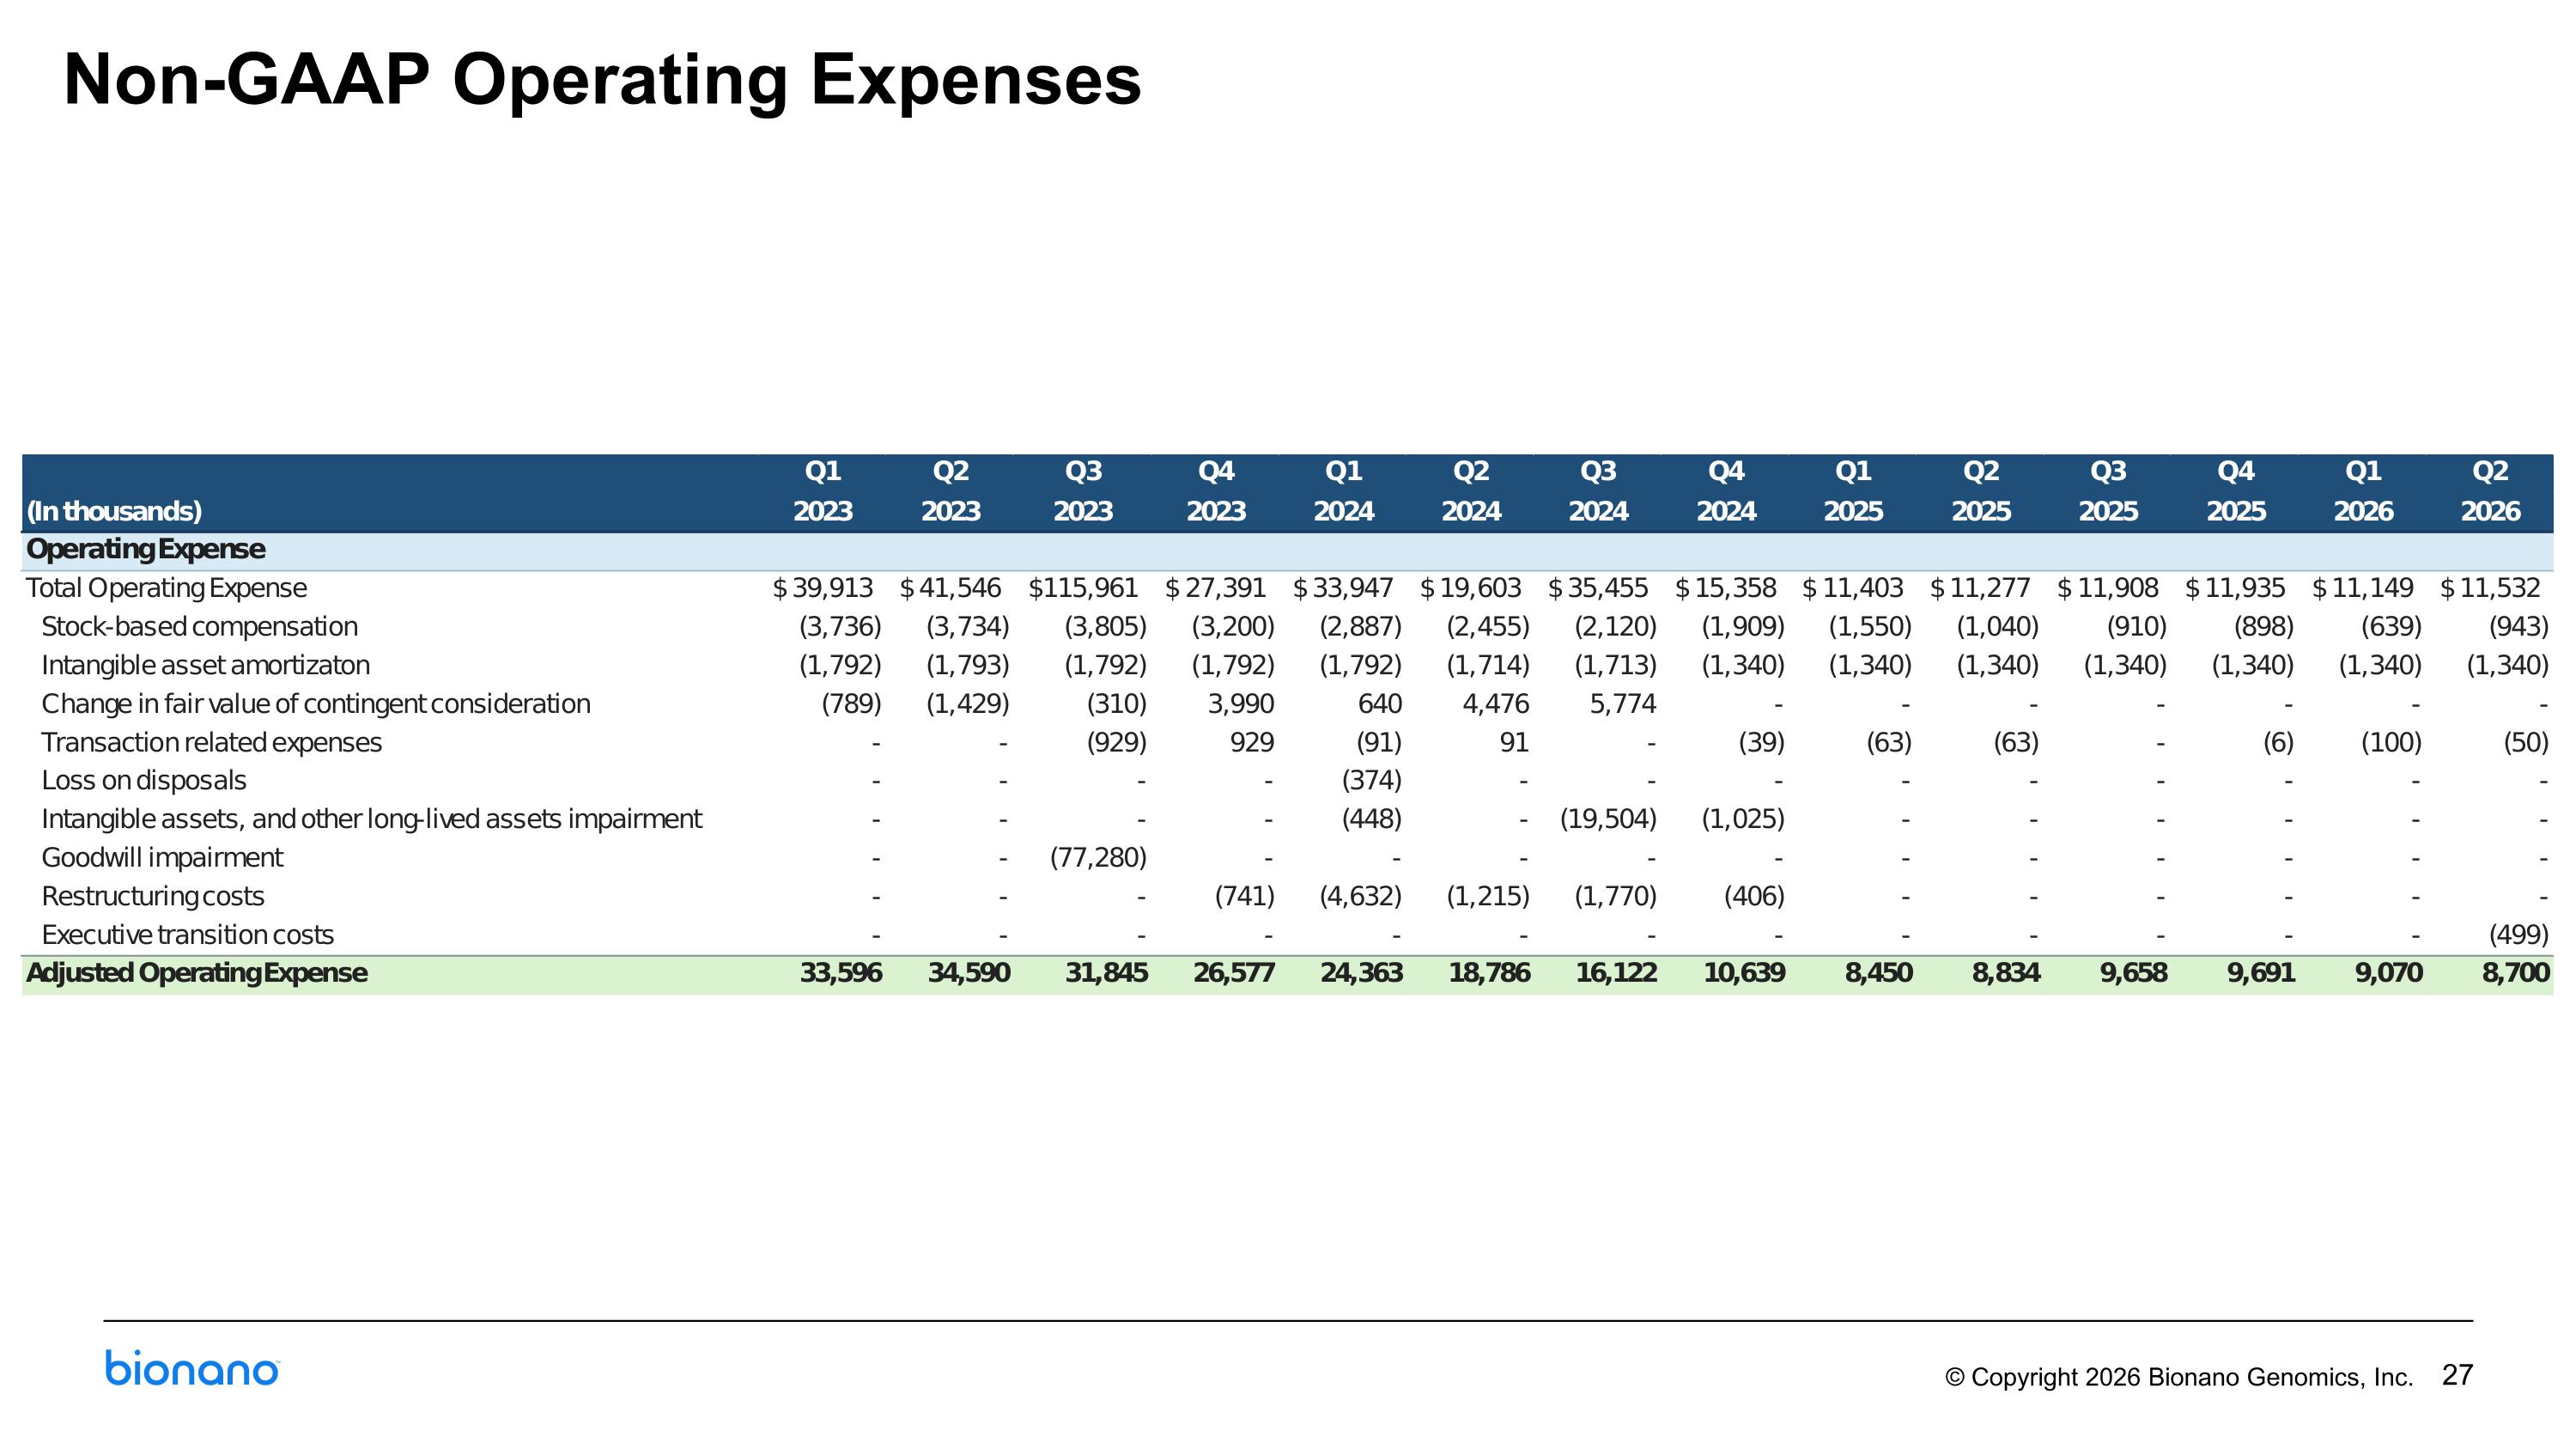
Non-GAAP Operating Expenses
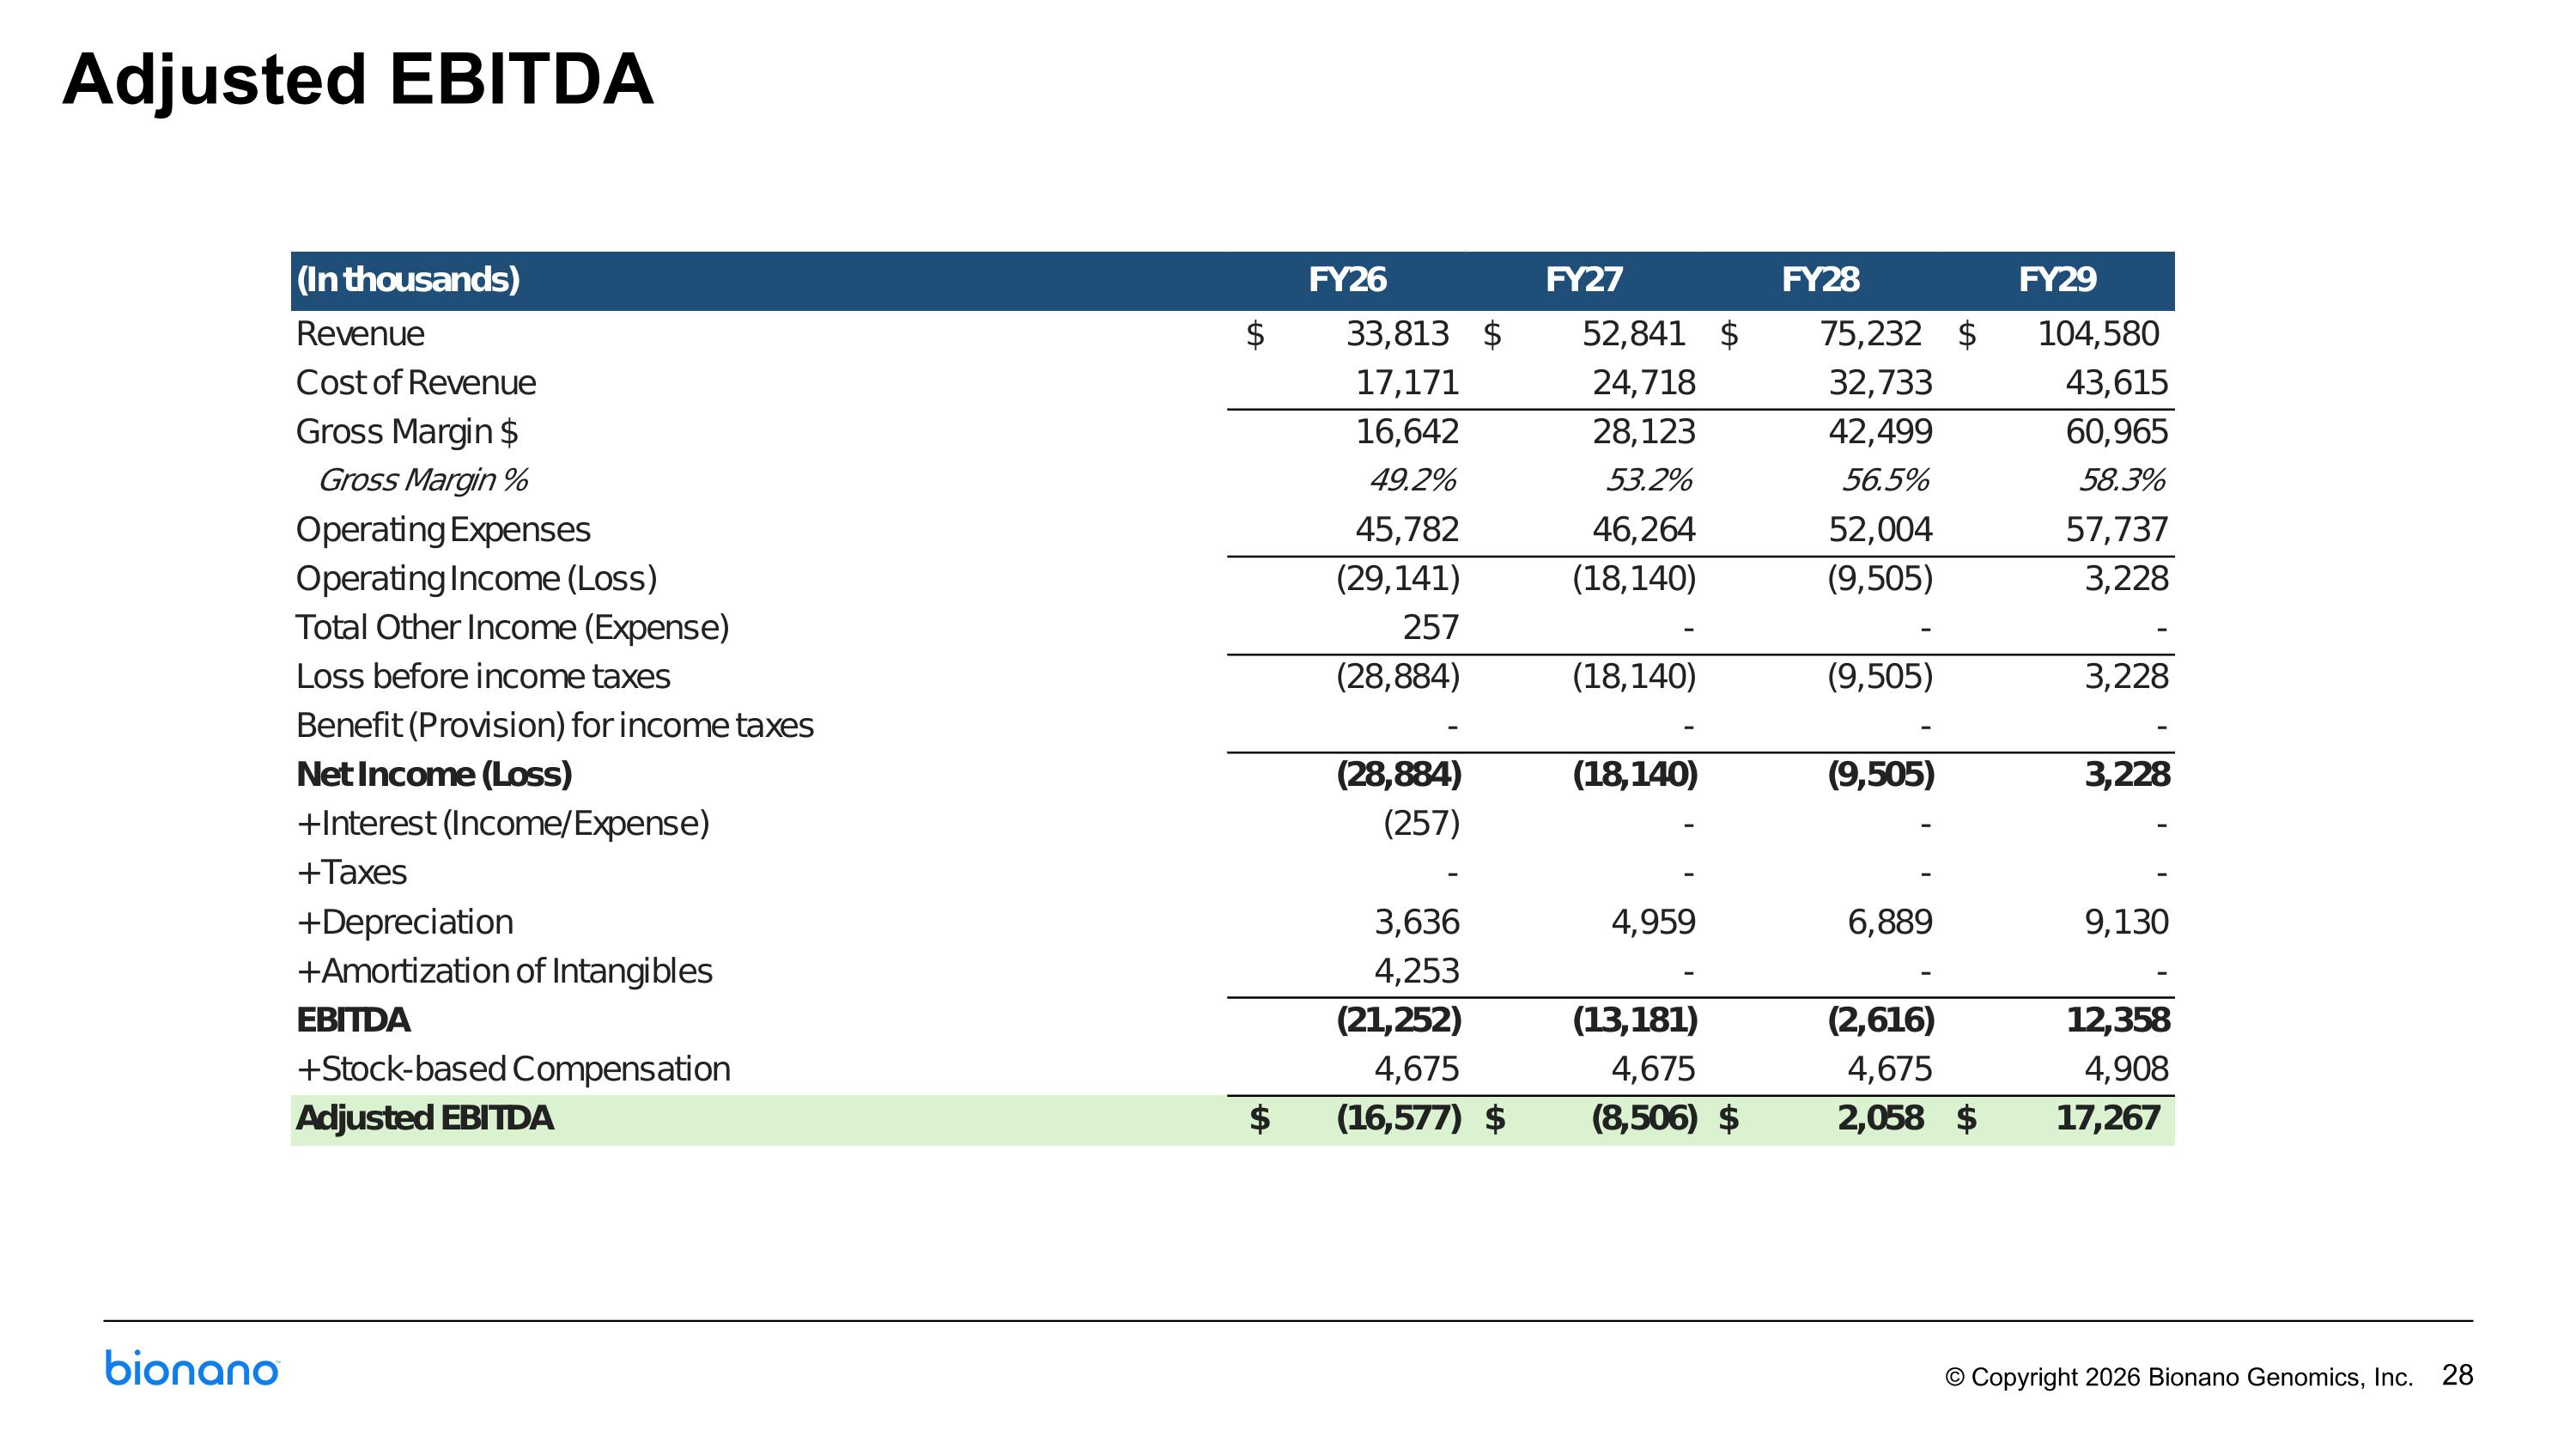
Adjusted EBITDA