Pay Versus Performance
The following information under the “Pay Versus Performance” heading should not be deemed filed or incorporated by reference into any of the Corporation’s other filings under the Securities Act of 1933 or the Securities Exchange Act of 1934, except to the extent the Corporation specifically incorporates this report by reference therein.
In accordance with rules adopted by the Securities and Exchange Commission (“SEC”), the following table presents information regarding compensation paid to our Chief Executive Officer (the “CEO”) and our other named executive officers shown in the Summary Compensation Table (collectively, the “Non-CEO NEOs”). The amounts set forth below under the headings “Compensation Actually Paid to CEO” and “Average Compensation Actually Paid to Non-CEO NEOs” have been calculated in a manner prescribed by the SEC rules and do not necessarily align with how the Corporation or the Committee views the link between our performance and pay of our named executive officers. The footnotes below set forth the adjustments from the total compensation for each of our NEOs reported in the Summary Compensation Table above. As permitted under the rules applicable to smaller reporting companies, we are including three years of data and are not including a peer group total shareholder return or company-selected measure.
|
Fiscal Year Ended June 30 (1) |
Summary Compensation Table Total for CEO (1) |
Compensation Actually Paid to CEO (2) |
Average Summary Compensation Table Total for Non-CEO NEOs (1) |
Average Compensation Actually Paid to Non-CEO NEOs (2) |
Value of Initial Fixed $100 Investment Based on Total Shareholder Return (3) |
Net Income (in thousands) |
||||||||||||||||||
|
2026 |
$ | 2,345,851 | $ | 5,724,843 | $ | 1,121,002 | $ | 2,780,099 | $ | 207.46 | $ | 34,537 | ||||||||||||
|
2025 |
$ | 2,411,245 | $ | 2,134,915 | $ | 1,156,197 | $ | 1,022,434 | $ | 79.84 | $ | (1,894 | ) | |||||||||||
|
2024 |
$ | 2,566,513 | $ | 2,877,213 | $ | 1,208,521 | $ | 1,328,191 | $ | 105.68 | $ | 10,988 | ||||||||||||
|
(1) |
The amounts reported in the “Summary Compensation Table Total for CEO” column are the amounts of total compensation reported for John H. Batten for each corresponding fiscal year in the “Total” column of the Summary Compensation Table. The amounts reported in the “Average Summary Compensation Table Total for Non-CEO NEOs” column are the amounts of total compensation reported for Jeffrey S. Knutson for each corresponding year in the “Total” column of the Summary Compensation Table. |
|
(2) |
The following amounts were added and deducted from the Summary Compensation Table amounts to determine the compensation actually paid to the Corporation’s CEO and the Non-CEO NEOs in accordance with SEC regulations: |
|
CEO |
Non-CEO NEO Average |
|||||||||||||||||||||||
|
2026 |
2025 |
2024 |
2026 |
2025 |
2024 |
|||||||||||||||||||
|
Summary Compensation Table (SCT) Total |
$ | 2,345,851 | $ | 2,411,245 | $ | 2,566,513 | $ | 1,121,002 | $ | 1,156,197 | $ | 1,208,521 | ||||||||||||
|
Minus amounts reported under “Stock Awards” column in SCT |
$ | 1,002,767 | $ | 1,033,830 | $ | 1,052,203 | $ | 492,365 | $ | 507,613 | $ | 516,632 | ||||||||||||
|
Minus amounts reported under “Option Awards” column in SCT |
— | — | — | — | — | — | ||||||||||||||||||
|
Plus fair value (as of fiscal year-end) of awards granted during fiscal year that remain outstanding and unvested as of fiscal year-end |
$ | 2,570,630 | $ | 672,714 | $ | 969,871 | $ | 1,262,196 | $ | 330,304 | $ | 476,207 | ||||||||||||
|
Plus/minus change in fair value from prior fiscal year-end to current fiscal year-end of awards granted in any prior fiscal year that are outstanding and unvested as of fiscal year-end |
$ | 1,810,004 | $ | 67,221 | $ | 316,947 | $ | 888,713 | $ | 33,008 | $ | 124,589 | ||||||||||||
|
Plus increase in fair value (as of vesting date) of awards granted during fiscal year that vest during the same fiscal year |
— | — | — | — | — | — | ||||||||||||||||||
|
Plus/minus change in fair value (as of vesting date) from prior fiscal year-end to vesting date of awards granted in any prior fiscal year that vested during fiscal year |
$ | 1,126 | $ | 17,565 | $ | 76,085 | $ | 553 | $ | 10,539 | $ | 35,506 | ||||||||||||
|
Minus fair value (as of end of prior fiscal year) of awards granted in any prior fiscal year that were forfeited during fiscal year |
— | — | — | — | — | — | ||||||||||||||||||
|
Plus value of dividends or other earnings paid on stock or option awards during fiscal year prior to vesting date not included in SCT total compensation |
— | — | — | — | — | — | ||||||||||||||||||
|
Total Adjustments |
$ | 3,378,992 | $ | (276,330 | ) | $ | 310,700 | $ | 1,659,097 | $ | (133,763 | ) | $ | 119,670 | ||||||||||
|
(3) |
Assumes $100 was invested in the Corporation for the period starting July 1, 2023, through the end of the listed fiscal year. |
|
CEO |
Non-CEO NEO Average |
|||||||||||||||||||||||
|
2026 |
2025 |
2024 |
2026 |
2025 |
2024 |
|||||||||||||||||||
|
Summary Compensation Table (SCT) Total |
$ | 2,345,851 | $ | 2,411,245 | $ | 2,566,513 | $ | 1,121,002 | $ | 1,156,197 | $ | 1,208,521 | ||||||||||||
|
Minus amounts reported under “Stock Awards” column in SCT |
$ | 1,002,767 | $ | 1,033,830 | $ | 1,052,203 | $ | 492,365 | $ | 507,613 | $ | 516,632 | ||||||||||||
|
Minus amounts reported under “Option Awards” column in SCT |
— | — | — | — | — | — | ||||||||||||||||||
|
Plus fair value (as of fiscal year-end) of awards granted during fiscal year that remain outstanding and unvested as of fiscal year-end |
$ | 2,570,630 | $ | 672,714 | $ | 969,871 | $ | 1,262,196 | $ | 330,304 | $ | 476,207 | ||||||||||||
|
Plus/minus change in fair value from prior fiscal year-end to current fiscal year-end of awards granted in any prior fiscal year that are outstanding and unvested as of fiscal year-end |
$ | 1,810,004 | $ | 67,221 | $ | 316,947 | $ | 888,713 | $ | 33,008 | $ | 124,589 | ||||||||||||
|
Plus increase in fair value (as of vesting date) of awards granted during fiscal year that vest during the same fiscal year |
— | — | — | — | — | — | ||||||||||||||||||
|
Plus/minus change in fair value (as of vesting date) from prior fiscal year-end to vesting date of awards granted in any prior fiscal year that vested during fiscal year |
$ | 1,126 | $ | 17,565 | $ | 76,085 | $ | 553 | $ | 10,539 | $ | 35,506 | ||||||||||||
|
Minus fair value (as of end of prior fiscal year) of awards granted in any prior fiscal year that were forfeited during fiscal year |
— | — | — | — | — | — | ||||||||||||||||||
|
Plus value of dividends or other earnings paid on stock or option awards during fiscal year prior to vesting date not included in SCT total compensation |
— | — | — | — | — | — | ||||||||||||||||||
|
Total Adjustments |
$ | 3,378,992 | $ | (276,330 | ) | $ | 310,700 | $ | 1,659,097 | $ | (133,763 | ) | $ | 119,670 | ||||||||||
|
(3) |
Assumes $100 was invested in the Corporation for the period starting July 1, 2023, through the end of the listed fiscal year. |
Relationship Between Compensation Actually Paid and TSR
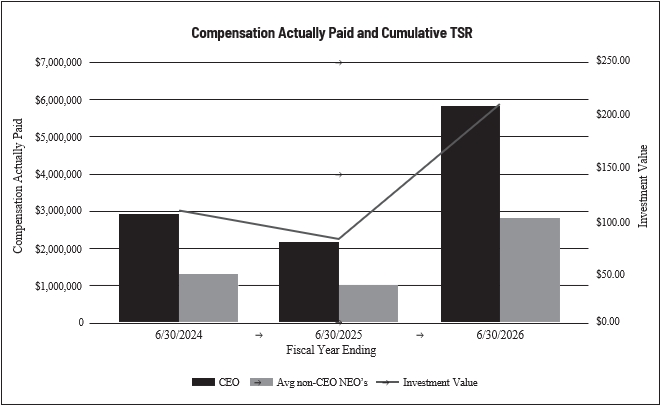
The chart below shows the relationship between the compensation actually paid to the Corporation’s CEO and the average compensation actually paid to the Corporation’s other NEOs, and Corporation’s cumulative TSR (total shareholder return, based on an initial investment of $100 on July 1, 2023) over the three most recently completed fiscal years.
Relationship Between Compensation Actually Paid and Net Income
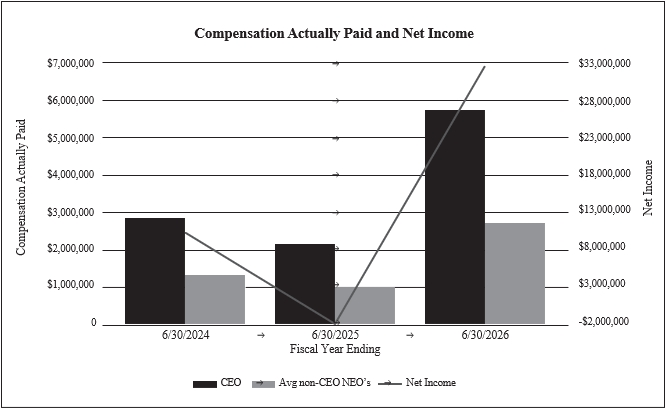
The chart below shows the relationship between the compensation actually paid to the Corporation’s CEO and the average compensation actually paid to the Corporation’s other NEOs, and the Corporation’s net income over the three most recently completed fiscal years.