Exhibit 99.2
MANAGEMENT’S DISCUSSION AND ANALYSIS OF
FINANCIAL CONDITION AND RESULTS OF OPERATIONS
The following discussion and analysis of our financial condition and results of operations should be read in conjunction with our unaudited condensed consolidated financial statements and related notes that appear in this interim report. In addition to historical consolidated financial information, the following discussion contains forward-looking statements that reflect our plans, estimates, and beliefs. Our actual results could differ materially from those discussed in the forward-looking statements.
Overview
Leishen Energy Holding Co., Ltd. (“Leishen Cayman”) was incorporated under the laws of Cayman Islands as an exempted company with limited liability on October 19, 2022. As a holding company with no material operations, Leishen Cayman conducts substantially all of its operations through its operating subsidiaries (collectively, the “Company”) in the PRC. The Company is a provider of clean-energy equipment and integrated solutions to the oil and gas industry, with a commitment to providing customers with high-performance, safe and cost-effective energy solutions. The Company’s major businesses segments include (i) clean-energy equipment; (ii) oil and gas engineering technical services; (iii) new energy production and operation; and (iv) digitalization and integration equipment. At present, the Company holds 102 invention and utility model patents, 3 trademarks and 8 software copyrights.
On December 20, 2024, Leishen Cayman (Nasdaq: LSE) consummated its initial public offering (the “IPO”) of 1,375,000 ordinary shares, par value $0.001 at $4.00 per share (each, an “Ordinary Share”), with gross proceeds of $5.5 million. On January 8, 2025, Leishen Cayman issued and sold 150,000 additional Ordinary Shares at $4.00 per share, pursuant to the partial exercise of the Over-Allotment Option, resulting in additional gross proceeds of $600,000. As a result, Leishen Cayman raised aggregate gross proceeds of $6.1 million in the IPO. After deducting underwriting discounts and commissions, the Company received total net proceeds of $5.4 million.
On November 27, 2025, the Company’s shareholders approved an amendment to the memorandum and articles of association to adopt a dual-class share structure. The authorized share capital of the Company is US$50,000 divided into 467,290,000 Class A Ordinary Shares of a nominal or par value of US$0.001 each and 32,710,000 Class B Ordinary Shares of a nominal or par value of US$0.001 each. All of the issued and outstanding ordinary shares (except the 6,355,000 and 6,355,000 held by Polar Energy Company Limited and WISE-POWER ENERGY SERVICES CO., LTD., respectively, were re-designated into Class A ordinary shares of par value US$0.001 each; the 6,355,000 and 6,355,000 Ordinary Shares held by Polar Energy Company Limited and WISEPOWER ENERGY SERVICES CO., LTD., respectively, were re-designated into class B ordinary shares of a par value of US$0.001 each; 20,000,000 of the authorized but unissued ordinary shares were re-designated into Class B ordinary shares of par value US$0.001 each; and all of the remaining authorized but unissued ordinary shares were re-designated into Class A ordinary shares of par value US$0.001 each. Under the new structure, the Company’s share capital consists of Class A Ordinary Shares and Class B Ordinary Shares. Each Class A Ordinary Share carries one (1) vote per share, and each Class B Ordinary Share carries twenty-five (25) votes per share and the other rights attached to it as set out in the Company’s amended and restated memorandum and articles.
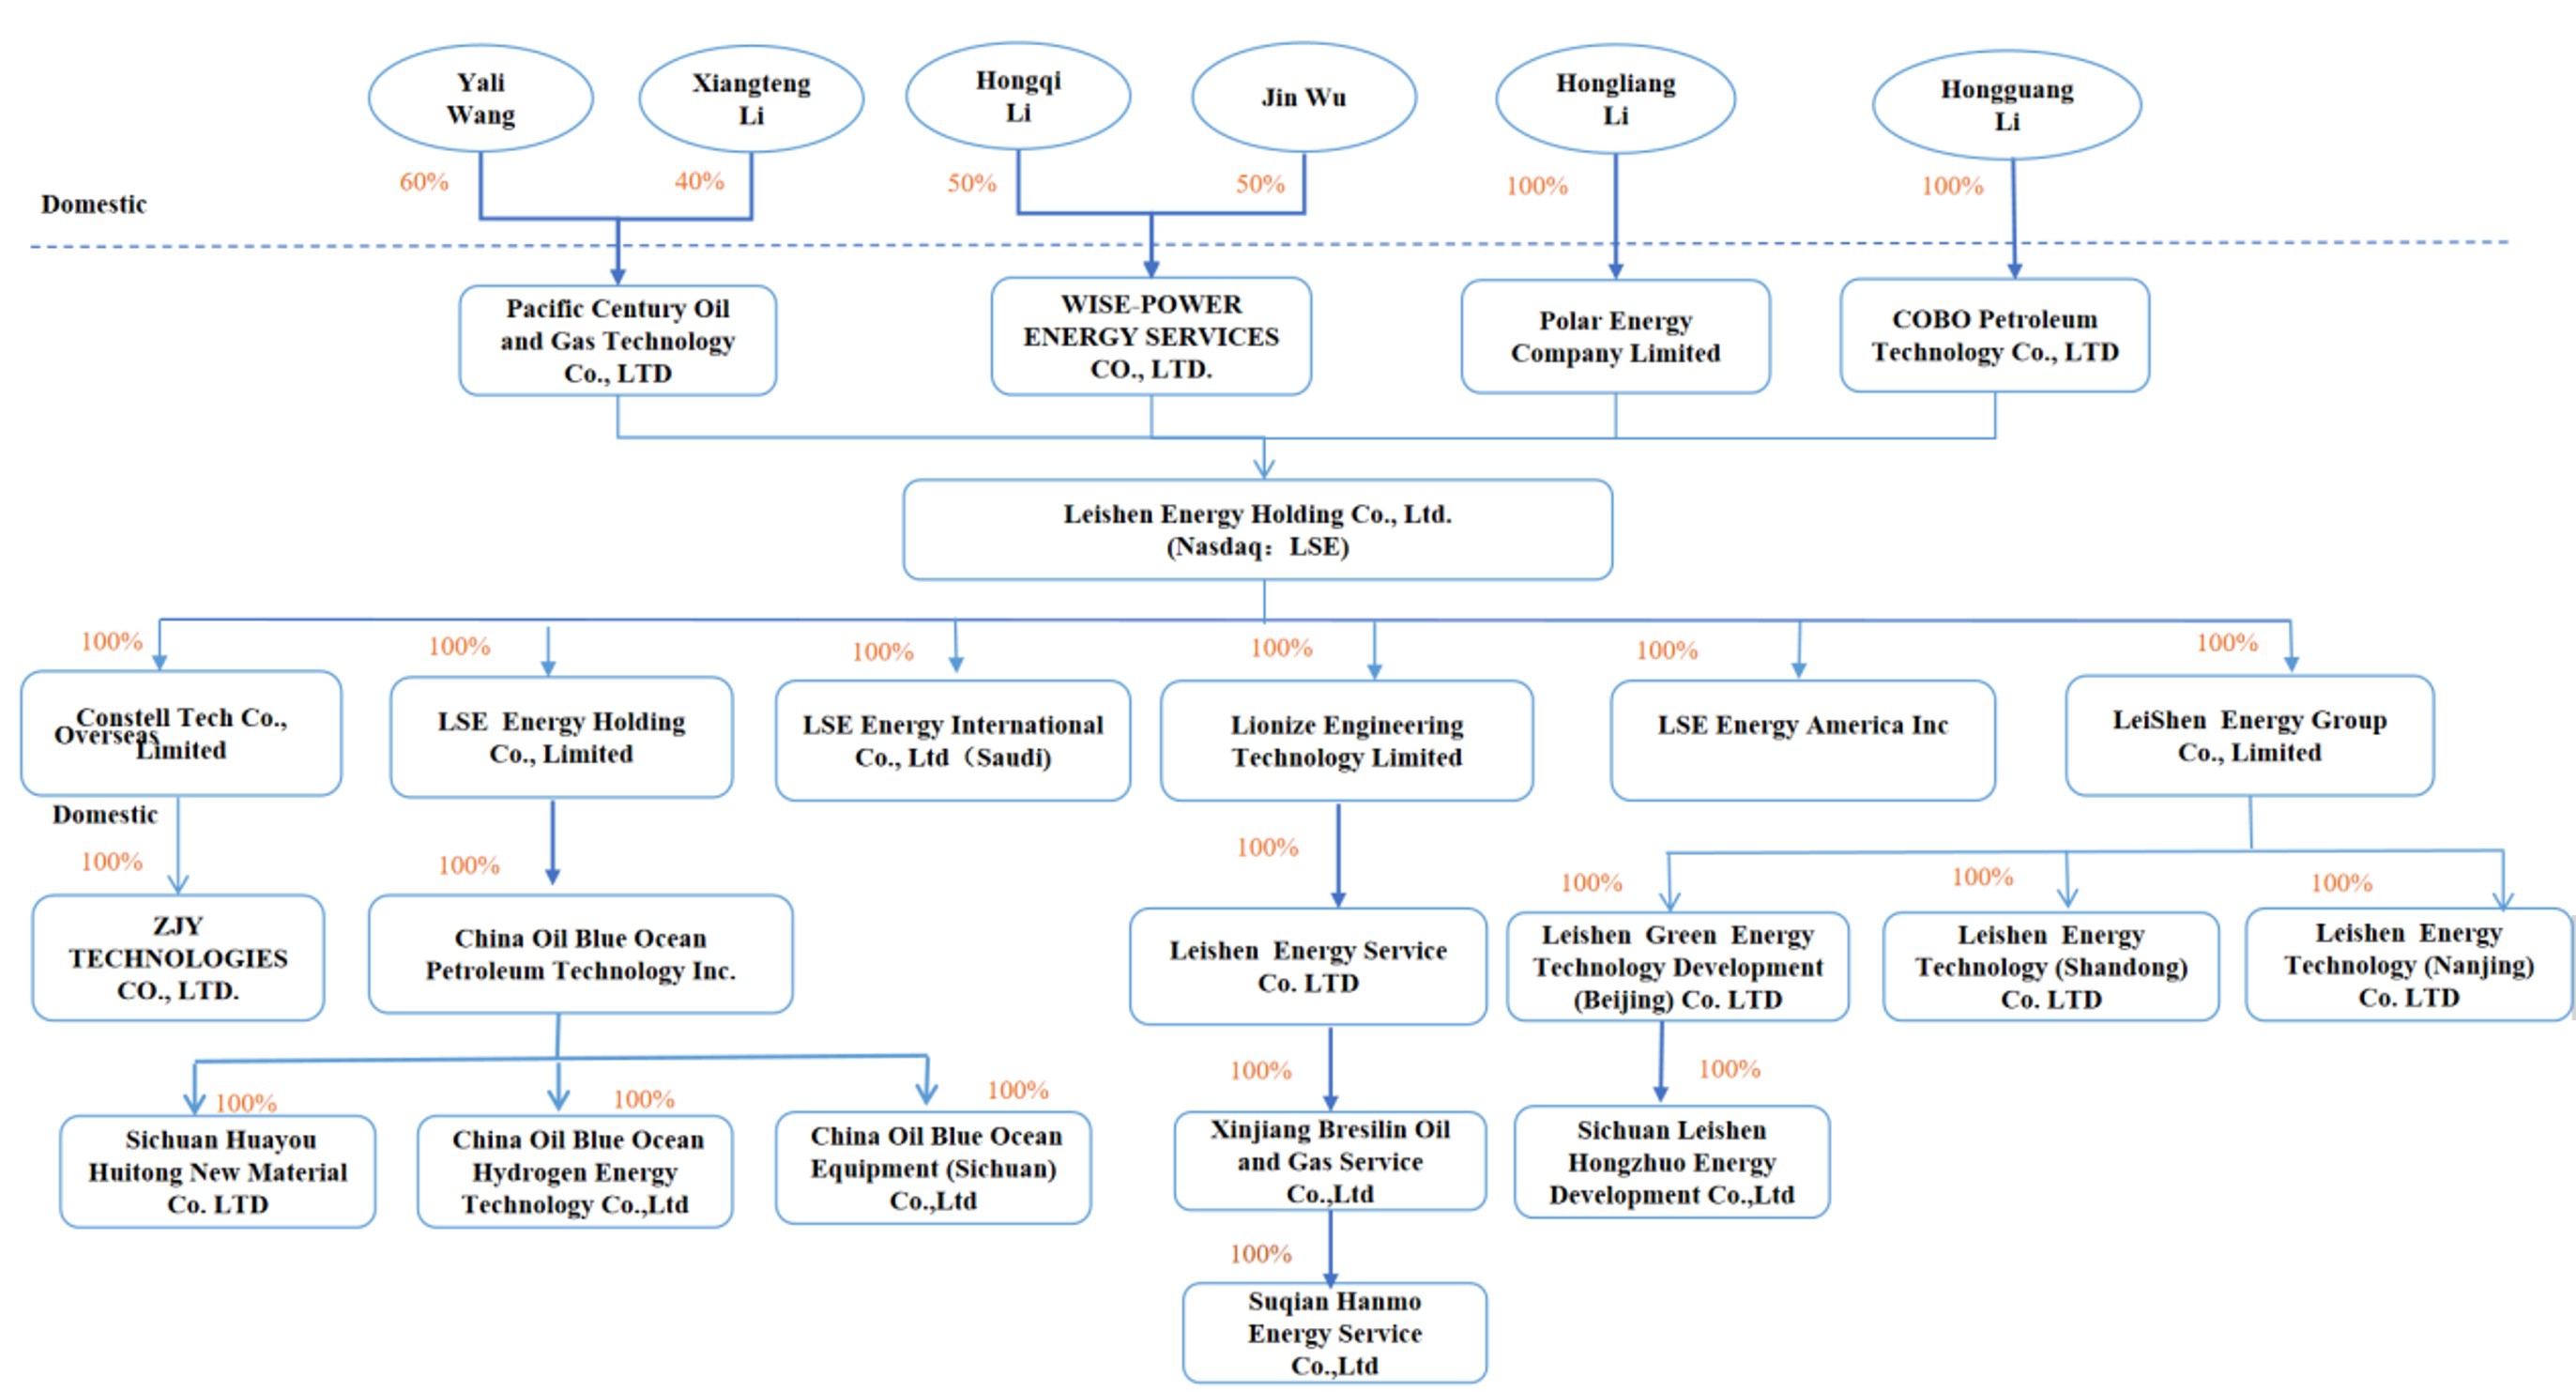
The Company’s corporate structure as of March 31, 2026 was as follows:
The Company’s principal subsidiaries are as follows:
| Legal Entity | Place
of Incorporation |
Date
of Incorporation |
Percentage
of beneficial ownership |
Principal activities | ||||
| Leishen Energy Holding Co., Ltd (“Leishen Cayman”) | Cayman Islands | October 19, 2022 | — | Holding company | ||||
| Leishen Energy Group Holding Co.,Ltd. (“Leishen (Holding) Hong Kong”) | Hongkong, China | November 25, 2022 | 100% | Holding company | ||||
| Leishen Energy Group Co., Ltd. (“Leishen Hong Kong”) | Hongkong, China | February 11, 2010 | 100% | Purchase and sale of oil and gas professional equipment and instruments | ||||
| ZJY Technologies Co., Ltd. (“ZJY Technologies”) | Beijing, China | March 2, 2007 | 100% | Design and sale of oil and gas professional equipment and after-sales support, and oilfield digitalization and integration service | ||||
| China Oil Blue Ocean Petroleum Technology Inc. (“China Oil Blue Ocean”) | Beijing, China | October 19, 2007 | 100% | Design and sale of oil and gas equipment and instruments, and engineering technology services | ||||
| Leishen Energy Technology (Nanjing) Co.,Ltd. (“Leishen Nanjing”) | Nanjing, China | September 27, 2022 | 100% | Purchase and sale of oil and gas professional equipment and instruments | ||||
| Leishen Green Energy Technology Development Co., Ltd. (“Beijing Leishen Green Energy”) | Beijing, China | January 29, 2018 | 100% | No business operations | ||||
| Leishen Energy Technology (Shandong) Co., Ltd. (“Leishen Shandong”) | Shandong, China | September 14, 2010 | 100% | Sales of oil and gas professional equipment and instruments | ||||
| Leishen Energy Services Co., Ltd. (“Leishen Services”) | Shandong, China | January 23, 2019 | 100% | No business operations | ||||
| Sichuan Leishen Hongzhuo Energy Development Co., Ltd. (“Sichuan Leishen Hongzhuo”) | Chengdu, China | January 16, 2019 | 100% | Production, storage and transportation of natural gas (LNG/CNG) | ||||
| Sichuan Huayou Huitong New Material Co. Ltd. (“Huayou Huitong”) | Chengdu, China | May 29, 2020 | 100% | Production and sales of bonded composite pipes | ||||
| Xinjiang Breslin Oil and Gas Service Co., Ltd. (“Xinjiang Breslin”) | Xinjiang, China | August 22, 2024 | 100% | Purchase and sale of oil and gas professional equipment and instruments, and sales of oil and gas engineering technical service | ||||
| Lionize Engineering Technology Limited | Hongkong, China | February 21, 2025 | 100% | No business operations | ||||
| Suqian Hanmo Energy Service Co., Ltd. (“Suqian Hanmo”) | Jiangsu, China | April 21, 2025 | 100% | Purchase and sale of oil and gas professional equipment and instruments, and sales of oil and gas engineering technical service | ||||
| LSE Energy International Co., Ltd (“LSE Energy International”) | Saudi Aribia | June 29, 2025 | 100% | No business operations | ||||
| LSE Energy America Inc (“LSE Energy America”) | United States | August 14, 2025 | 100% | No business operations | ||||
| China Oil Blue Ocean Hydrogen Energy Technology Co., Ltd (“China Oil Hydrogen Energy”) | Beijing, China | August 5, 2025 | 100% | No business operations | ||||
China Oil Blue Ocean Equipment (Sichuan) Co., Ltd |
Chengdu, China | December 11, 2025 | 100% | Purchase and sale of oil and gas professional equipment and instruments, and sales of oil and gas engineering technical service |
Results of Operations
Comparison of Results of Operations for the Six Months Ended March 31, 2026 and 2025
The following table summarizes our results of operations for the six months ended March 31, 2026 and 2025, and provides information regarding the dollar and percentage change during the six months.
| Six Months Ended March 31, | ||||||||||||||||||||||||
| 2026 | 2025 | Variance | ||||||||||||||||||||||
| Amount | %
of revenue | Amount | %
of revenue | Amount | % | |||||||||||||||||||
| (Unaudited) | (Unaudited) | |||||||||||||||||||||||
| Revenues | $ | 20,978,428 | 100.0 | % | $ | 28,195,284 | 100.0 | % | $ | (7,216,856 | ) | (25.6 | )% | |||||||||||
| Cost of revenues | (15,753,600 | ) | (75.1 | )% | (23,256,253 | ) | (82.5 | )% | 7,502,653 | (32.3 | )% | |||||||||||||
| Gross profit | 5,224,828 | 24.9 | % | 4,939,031 | 17.5 | % | 285,797 | 5.8 | % | |||||||||||||||
| Operating expenses: | ||||||||||||||||||||||||
| Selling and marketing | 1,535,890 | 7.3 | % | 635,306 | 2.3 | % | 900,584 | 141.8 | % | |||||||||||||||
| General and administrative | 2,133,900 | 10.2 | % | 3,045,282 | 10.8 | % | (911,382 | ) | (29.9 | )% | ||||||||||||||
| Provision for expected credit losses | 2,145,919 | 10.2 | % | 3,317,683 | 11.8 | % | (1,171,764 | ) | (35.3 | )% | ||||||||||||||
| Research and development | 97,448 | 0.5 | % | 163,008 | 0.6 | % | (65,560 | ) | (40.2 | )% | ||||||||||||||
| Total operating expenses | 5,913,157 | 28.2 | % | 7,161,279 | 25.5 | % | (1,248,122 | ) | (17.4 | )% | ||||||||||||||
| Loss from operations | (688,329 | ) | (3.3 | )% | (2,222,248 | ) | (8.0 | )% | 1,533,919 | (69.0 | )% | |||||||||||||
| Other (expenses) income: | ||||||||||||||||||||||||
| Interest expense | (36,080 | ) | (0.2 | )% | (20,035 | ) | (0.1 | )% | (16,045 | ) | 80.1 | % | ||||||||||||
| Exchange (loss) gains | (167,571 | ) | (0.8 | )% | 45,795 | 0.2 | % | (213,366 | ) | (465.9 | )% | |||||||||||||
| Income from equity investment | - | - | % | 171,368 | 0.6 | % | (171,368 | ) | (100.0 | )% | ||||||||||||||
| Net investment (loss) gain from short-term investments | (1,064,172 | ) | (5.1 | )% | 826,153 | 2.9 | % | (1,890,325 | ) | (228.8 | )% | |||||||||||||
| Interest income from loans receivable | 93,183 | 0.4 | % | 50,805 | 0.2 | % | 42,378 | 83.4 | % | |||||||||||||||
| (Loss) gain from disposal of property and equipment | (288,176 | ) | (1.4 | )% | 116,311 | 0.4 | % | (404,487 | ) | (347.8 | )% | |||||||||||||
| Other income, net | 197,232 | 0.9 | % | 77,831 | 0.3 | % | 119,401 | 153.4 | % | |||||||||||||||
| Total other (expenses) income, net | (1,265,584 | ) | (6.2 | )% | 1,268,228 | 4.5 | % | (2,533,812 | ) | (199.8 | )% | |||||||||||||
| Loss before income taxes | (1,953,913 | ) | (9.5 | )% | (954,020 | ) | (3.5 | )% | (999,893 | ) | 104.8 | % | ||||||||||||
| Income tax (benefit) expense | (117,174 | ) | (0.6 | )% | 14,635 | 0.1 | % | (131,809 | ) | (900.6 | )% | |||||||||||||
| Net loss | (1,836,739 | ) | (8.9 | )% | (968,655 | ) | (3.6 | )% | (868,084 | ) | 89.6 | % | ||||||||||||
| Less: net loss attributable to non-controlling interests | - | - | % | (344,240 | ) | (1.2 | )% | 344,240 | (100.0 | )% | ||||||||||||||
| Net loss attributable to Leishen Energy Holding Co., Ltd. | $ | (1,836,739 | ) | (8.9 | )% | $ | (624,415 | ) | (2.4 | )% | $ | (1,212,324 | ) | 194.2 | % | |||||||||
Revenues
Currently,
we have four revenue streams: clean-energy equipment sales, digitalization and integration equipment sales, new energy sales and
delivery of oil and gas field engineering technical services. Revenues decreased by $7,216,856, or 25.6%, to $20,978,428 for the six
months ended March 31, 2026 from $28,195,284 for the six months ended March 31, 2025. The decrease in our total revenues was
primarily attributable to ongoing initiative to scale-back our lower-margin businesses within our new energy and digitalization and
integration equipment segments, which objective is to enhance our overall gross profit.
The following table sets forth the breakdown of our revenues for the six months ended March 31, 2026 and 2025:
| Six Months Ended March 31, | ||||||||||||||||||||||||
| 2026 | 2025 | Variance | ||||||||||||||||||||||
| Amount | % | Amount | % | Amount | % | |||||||||||||||||||
| (Unaudited) | (Unaudited) | |||||||||||||||||||||||
| Clean-energy equipment | $ | 10,412,332 | 49.6 | % | $ | 13,196,043 | 46.8 | % | $ | (2,783,711 | ) | (21.1 | )% | |||||||||||
| Digitalization and integration equipment | 2,226,141 | 10.6 | % | 2,629,399 | 9.3 | % | (403,258 | ) | (15.3 | )% | ||||||||||||||
| New energy sales | 6,454,584 | 30.8 | % | 10,337,148 | 36.7 | % | (3,882,564 | ) | (37.6 | )% | ||||||||||||||
| Oil and gas engineering technical services | 1,885,371 | 9.0 | % | 2,032,694 | 7.2 | % | (147,323 | ) | (7.2 | )% | ||||||||||||||
| Total | $ | 20,978,428 | 100.0 | % | $ | 28,195,284 | 100.0 | % | $ | (7,216,856 | ) | (25.6 | )% | |||||||||||
Revenues
from clean-energy equipment sales. Revenues from clean-energy equipment sales accounted for 49.6% and 46.8% of our revenues for the
six months ended March 31, 2026 and 2025, respectively. Revenue from clean-energy equipment sales decreased by $2,783,711 or 21.1% to
$10,412,332 for the six months ended March 31, 2026 from $13,196,043 in
Revenues from digitalization and integration equipment sales. Revenues from digitalization and integration equipment sales accounted for 10.6% and 9.3% of our revenues for the six months ended March 31, 2026 and 2025, respectively. Revenue from digitalization and integration equipment sales decreased by $403,258 or 15.3% to $2,226,141 for the six months ended March 31, 2026 from $2,629,399 in 2025. The decrease was mainly due to our plan to scale-back the extent of low-margin businesses.
Revenues from new energy sales. Revenues from new energy sales accounted for 30.8% and 36.7% of our revenues for the six months ended March 31, 2026 and 2025, respectively. Revenue from new energy production and operation sales decreased by $3,882,564 or 37.6% to $6,454,584 for the six months ended March 31, 2026 from $10,337,148 in 2025. The decrease was mainly due to the Middle East geopolitical conflict, which drove volatility in international natural gas prices, alongside weak domestic demand and intense market competition. We have strategically reduced and will continue to scale back low-margin trading volumes in order to manage our exposure to pricing volatility.
Revenues from oil and gas engineering technical services. Revenues from oil and gas engineering technical services accounted for 9.0% and 7.2% of our revenues for the six months ended March 31, 2026 and 2025, respectively. Revenues from oil and gas field engineering technical services decreased by $147,323 or 7.2% to $1,885,371 for the six months ended March 31, 2026 from $2,032,694 in 2025. The decrease was due mainly to the decrease in volumes of our compressor rental service.
Cost of Revenues
The following table sets forth the breakdown of our cost of revenue for the six months ended March 31, 2026 and 2025:
| Six Months Ended March 31, | ||||||||||||||||||||||||
| 2026 | 2025 | Variance | ||||||||||||||||||||||
| Amount | % | Amount | % | Amount | % | |||||||||||||||||||
| (Unaudited) | (Unaudited) | |||||||||||||||||||||||
| Clean-energy equipment | $ | 6,842,781 | 43.4 | % | $ | 10,528,452 | 45.3 | % | $ | (3,685,671 | ) | (35.0 | )% | |||||||||||
| Digitalization and integration equipment | 2,064,862 | 13.1 | % | 2,032,358 | 8.7 | % | 32,504 | 1.6 | % | |||||||||||||||
| New energy sales | 6,276,614 | 39.8 | % | 10,178,056 | 43.7 | % | (3,901,442 | ) | (38.3 | )% | ||||||||||||||
| Oil and gas engineering technical services | 569,343 | 3.7 | % | 517,387 | 2.3 | % | 51,956 | 10.0 | % | |||||||||||||||
| Total | $ | 15,753,600 | 100.0 | % | $ | 23,256,253 | 100.0 | % | $ | (7,502,653 | ) | (32.3 | )% | |||||||||||
Cost of clean-energy equipment sales decreased by $3,685,671 or 35.0%, to $6,842,781 for the six months ended March 31, 2026 from $10,528,452 in 2025, which was mainly due to the 21.1% decrease in related sales revenue.
Cost of digitalization and integration equipment sales increased by $32,504 or 1.6%, to $2,064,862 for the six months ended March 31, 2026 from $2,032,358 in 2025.
Cost of new energy sales decreased by $3,901,442 or 38.3% to $6,276,614 for the six months ended March 31, 2026 from $10,178,056 in 2025, which was mainly due to the decrease of sales of new energy.
Cost of oil and gas engineering technical services increased by $51,956 or 10.0% to $569,343 for the six months ended March 31, 2026 from $517,387 in 2025. The increase was mainly due to the increase in customer requirements for technical expertise and equipment standards in leasing and technical services.
Gross Profit
Gross
profit was $5,224,828 for the six months ended March 31, 2026, an increase of $285,797 compared to $4,939,031 in 2025. Gross margin increased
to 24.9%, representing a 7.4% increase compared to 2025. The increase was mainly due to the Company’s deliberate scale-back of
low-margin businesses, which reduced the dilutive effect of low-margin activities and enhance our ability to enhance the overall gross
margin.
Our gross profit and gross margin by revenue stream were as follows:
| Six Months Ended March 31, | ||||||||||||||||||||||||
| 2026 | 2025 | Variance | ||||||||||||||||||||||
Gross Profit | Gross % | Gross Profit | Gross % | Gross Profit | Gross % | |||||||||||||||||||
| Clean-energy equipment | $ | 3,569,551 | 34.3 | % | $ | 2,667,591 | 20.2 | % | $ | 901,960 | 14.1 | % | ||||||||||||
| Digitalization and integration equipment | 161,279 | 7.2 | % | 597,041 | 22.7 | % | (435,762 | ) | (15.5 | )% | ||||||||||||||
| New energy sales | 177,970 | 2.8 | % | 159,092 | 1.5 | % | 18,878 | 1.3 | % | |||||||||||||||
| Oil and gas engineering technical services | 1,316,028 | 69.8 | % | 1,515,307 | 74.5 | % | (199,279 | ) | (4.7 | )% | ||||||||||||||
| Total | $ | 5,224,828 | 24.9 | % | $ | 4,939,031 | 17.5 | % | $ | 285,797 | 7.4 | % | ||||||||||||
Gross profit for clean-energy equipment sales increased by $901,960 to $3,569,551 for the six months ended March 31, 2026, compared to $2,667,591 in 2025. Gross margin increased by 14.1% to 34.3%, primarily attributable to favorable product mix, as we sold more high-margin products in the six months ended March 31, 2026 than in the comparable period of 2025, as well as ongoing cost-control initiatives.
Gross profit for digitalization and integration equipment sales decreased by $435,762 to $161,279 for the six months ended March 31, 2026, compared to $597,041 in 2025. Gross margin decreased by 15.5%, to 7.2% for the six months ended March 31, 2026, from 22.7% in 2025. The decrease in gross margin was mainly attributable to the scale-back of low-margin trading volumes and higher cost in product trading.
Gross profit for new energy sales increased by $18,878 to $177,970 for the six months ended March 31, 2026, compared to $159,092 for the comparable period in 2025. Gross margin increased by 1.3%, to 2.8% for the six months ended March 31, 2026, from 1.5% in 2025. The increase in gross profit was mainly due to the Company’s strategic scale-back of low-margin trading volumes to mitigate our exposure to pricing volatility.
Gross profit for oil and gas engineering technical services decreased to $1,316,028 for the six months ended March 31, 2026 from $1,515,307 in 2025. Gross margin decreased by 4.7%, to 69.8% for the six months ended March 31, 2026, from 74.5% in 2025. The decrease in gross margin was attributable to the increase in customer requirements for technical expertise and equipment standards in leasing and technical services.
Operating Expenses
Operating expenses were as following:
| Six Months Ended March 31, | ||||||||||||||||||||||||
| 2026 | 2025 | Variance | ||||||||||||||||||||||
| Amount | % | Amount | % | Amount | % | |||||||||||||||||||
| (Unaudited) | (Unaudited) | |||||||||||||||||||||||
| Selling and marketing | $ | 1,535,890 | 26.0 | % | $ | 635,306 | 8.9 | % | $ | 900,584 | 141.8 | % | ||||||||||||
| General and administrative | 2,133,900 | 36.1 | % | 3,045,282 | 42.5 | % | (911,382 | ) | (29.9 | )% | ||||||||||||||
| Provision for expected credit losses | 2,145,919 | 36.3 | % | 3,317,683 | 46.3 | % | (1,171,764 | ) | (35.3 | )% | ||||||||||||||
| Research and development | 97,448 | 1.6 | % | 163,008 | 2.3 | % | (65,560 | ) | (40.2 | )% | ||||||||||||||
| Total operating expenses | $ | 5,913,157 | 100.0 | % | $ | 7,161,279 | 100.0 | % | $ | (1,248,122 | ) | (17.4 | )% | |||||||||||
Selling and marketing Expenses
Selling
and marketing expenses consist primarily of shipping fees, consulting fees, bidding fees and payroll and benefits for employees involved
in the sales and distribution functions. Selling and marketing expenses were
General and Administrative Expenses
General
and administrative (“G&A”) expenses consist primarily of payroll and related costs for employees involved in general
corporate functions, including accounting, finance, tax, legal and human resources, professional fees and other general corporate expenses
as well as costs associated with the use by these functions of facilities and equipment, such as depreciation and rental expenses. Our
G&A expenses were $2,133,900 for the six months ended March 31, 2026, a decrease of $911,382, or 29.9%, from $3,045,282 in 2025.
The decrease was due mainly to 1) decrease of
Provision for expected credit losses
Provision for expected credit losses was $2,145,919 for the six months ended March 31, 2026, a decrease of $1,171,764 or 35.3%, from $3,317,683 for 2025. The decrease was mainly due to improvement in our collection of trade receivables.
Research and development expenses
Research and development (“R&D”) expenses consist primarily of payroll and related costs for employees involved in research functions and other general corporate expenses as well as costs associated with the use by these functions of facilities and equipment, such as depreciation and rental expenses. Our R&D expenses were $97,448 for the six months ended March 31, 2026, a decrease of $65,560 from $163,008 in 2025 due primarily due to reduction in R&D activities during the six months ended March 31, 2026.
Other (expenses) income, net
Other (expenses) income was as follows:
| Six Months Ended March 31, | ||||||||||||||||||||||||
| 2026 | 2025 | Variance | ||||||||||||||||||||||
| Amount | % | Amount | % | Amount | % | |||||||||||||||||||
| (Unaudited) | (Unaudited) | |||||||||||||||||||||||
| Interest expense | $ | (36,080 | ) | 2.9 | % | $ | (20,035 | ) | (1.6 | )% | $ | (16,045 | ) | 80.1 | % | |||||||||
| Exchange (loss) gains | (167,571 | ) | 13.2 | % | 45,795 | 3.6 | % | (213,366 | ) | (465.9 | )% | |||||||||||||
| Income from equity investment | - | - | % | 171,368 | 13.5 | % | (171,368 | ) | (100.0 | )% | ||||||||||||||
| Net investment (loss) gain from short-term investments | (1,064,172 | ) | 84.1 | % | 826,153 | 65.1 | % | (1,890,325 | ) | (228.8 | )% | |||||||||||||
| Interest income from loans receivable | 93,183 | (7.4 | )% | 50,805 | 4.0 | % | 42,378 | 83.4 | % | |||||||||||||||
| (Loss) gain from disposal of property and equipment | (288,176 | ) | 22.8 | % | 116,311 | 9.3 | % | (404,487 | ) | (347.8 | )% | |||||||||||||
| Other income, net | 197,232 | (15.6 | )% | 77,831 | 6.1 | % | 119,401 | 153.4 | % | |||||||||||||||
| Total (expenses) income, net | $ | (1,265,584 | ) | 100.0 | % | $ | 1,268,228 | 100.0 | % | $ | (2,533,812 | ) | (199.8 | )% | ||||||||||
Income from equity investment
Income from equity investment decreased by $171,368, or 100.0%, to nil for the six months ended March 31, 2026, from $171,368 for the six months ended March 31, 2025. The decrease was mainly due to the disposal of equity method investments prior to September 30, 2025.
Net investment (loss) gain from short-term investments
For
the six months ended March 31, 2026, we reported a net investment loss of $1,064,172, as opposed to a net investment gain of $826,153
for the six months ended March 31, 2025. The change was mainly due to the decrease in the fair value of common stocks that were publicly
traded on the Hong Kong Stock Exchange
(Loss) gain from disposal of property and equipment
For the six months ended March 31, 2026, the Company disposed of production equipment with net book value of RMB 2,066,784 ($294,590), received RMB 45,000 ($6,414) in cash and recognized a loss on disposal of RMB 2,021,784 ($288,176)
For the six months ended March 31, 2025, the Company disposed of production equipment with net book value of RMB 4,846,387 ($676,199), received RMB 5,680,000 ($792,510) in cash, and recognized a gain on disposal of RMB 833,613 ($116,311).
Other income, net
Other income, net increased by $119,401, or 153.4%, to $197,232 for the six months ended March 31, 2026, from $77,831 for the six months ended March 31, 2025. The increase was mainly due to the increase in government subsidies in the six months period ended March 31, 2026.
Income Taxes
Under the Enterprise Income Tax (“EIT”) Law of the PRC, domestic enterprises and Foreign Investment Enterprises (the “FIE”) are usually subject to a unified 25% EIT rate while preferential tax rates, tax holidays, and even tax exemptions may be granted on case-by-case basis. The PRC tax authorities grant preferential tax treatment to High and New Technology Enterprises (“HNTEs”). Under this preferential tax treatment, HNTEs are entitled to an income tax rate of 15%, subject to a requirement that they re-apply for HNTE status every three years. Since China Oil Blue Ocean was approved as an HNTE in December 2022, China Oil Blue Ocean is entitled to a reduced income tax rate of 15% beginning October 2022 and is able to enjoy the reduced income tax rate through October 2025. In October 2025, China Oil Blue Ocean renewed its HNTE certification for another three years. Since ZJY Technologies was approved as an HNTE in December 2022, ZJY Technologies is entitled to a reduced income tax rate of 15% beginning October 2022 and is able to enjoy the reduced income tax rate through October 2025. In December 2025, ZJY Technologies renewed its HNTE certification for another three years.
For the six months ended March 31, 2026 and 2025, our effective tax rates were 6.0% and (1.5)%, respectively. The increase in the effective tax rate was mainly due to the decrease in taxable income.
For the six months ended March 31, 2026, we reported an income tax benefit of $117,174 as opposed to an income tax expense of $14,635 in the comparable period of 2025. The variance is due mainly to higher net loss in the six months ended March 31, 2026.
Net Loss
As a result of the foregoing, our net loss for the six months ended March 31, 2026 and 2025 was $1,836,739 and $968,655, respectively. The Company is of the view that a continued net loss may pose pressure on its liquidity, but the Company has sufficient cash resources and has implemented measures to improve profitability and control costs. The Company will continue to monitor its liquidity and take necessary actions to ensure it can meet its obligations as they fall due.
Net loss attributable to non-controlling interests
Non-controlling interests are recognized to reflect the portion of net income that is not attributable, directly or indirectly, to the Company as the controlling shareholder.
For the six months ended March 31, 2025, non-controlling interests were $344,240, attributable to the minority shareholder’s 49% ownership interests in Sichuan Leishen Hongzhuo Energy Development Co., Ltd. (“Leishen Hongzhuo”), and Sichuan Huayou Huitong New Material Co., Ltd. (“Huayou Huitong”). The Company purchased non-controlling interests in Leishen Hongzhuo and Huayou Huitong in September and November 2025, respectively. For the six months ended March 31, 2026, the Company had no non-controlling interests.
Net loss attributable to Leishen Energy Holding Co., Ltd.
Net
loss attributable to Leishen Energy decreased by $1,212,324, or 194.2% from
Liquidity and Capital Resources
Presently, our principal sources of liquidity are generated from funds from our operations, bank loans and initial public offering. As of March 31, 2026 and September 30, 2025, we had cash of $10,249,822 and $10,159,656, respectively. Our current assets were $60,094,455 and $59,129,558 as of March 31, 2026 and September 30, 2025, respectively. Our current liabilities were $25,097,406 and $23,248,841 as of March 31, 2026 and September 30, 2025, respectively. Our current ratios as of March 31, 2026 and September 30, 2025 were 239.4% and 254.3%, respectively. Total equity as of March 31, 2026 and September 30, 2025 was $44,576,145 and $45,457,500 respectively.
As of March 31, 2026, we had outstanding bank loans of approximately $2.9 million. We also entered into operating leases for our factory. The following table sets forth our contractual obligations as of March 31, 2026:
| Payment Due by Period | ||||||||||||||||||||
| Less than | More than | |||||||||||||||||||
| Contractual Obligations | Total | 1 year | 1 – 3 years | 3 – 5 years | 5 years | |||||||||||||||
| Operating lease obligations | $ | 777,332 | $ | 111,486 | $ | 222,972 | $ | 222,972 | $ | 219,902 | ||||||||||
| Loan principal obligations | 2,890,424 | 2,890,424 | - | - | - | |||||||||||||||
| Total | $ | 3,667,756 | $ | 3,001,910 | $ | 222,972 | $ | 222,972 | $ | 219,902 | ||||||||||
On
December 20, 2024, we consummated our IPO and raised net proceeds of $5.4 million after deducting underwriting commission. In June 2026,
we filed a
With the uncertainty of the current market and macroeconomic conditions, our management believes it is necessary to enhance collection of outstanding accounts receivable and other receivables, and to be cautious on operational decisions and project selection. The Company reviews the accounts receivable on a periodic basis and makes general and specific allowances when there is doubt as to the collectability of individual balances. Our management is confident that the Company’s accounts receivable and other receivables are collectable.
Cash Flows Analysis
Six Months Ended March 31, 2026 Compared to Six Months Ended March 31, 2025
The following table sets forth a summary of our cash flows for the periods indicated:
| Six Months Ended March 31, | ||||||||
| 2026 | 2025 | |||||||
| (Unaudited) | (Unaudited) | |||||||
| Net cash provided by (used in) operating activities | $ | 730,075 | $ | (1,981,527 | ) | |||
| Net cash (used in) provided by investing activities | (391,698 | ) | 5,664,522 | |||||
| Net cash | (369,265 | ) | 7,987,112 | |||||
| Effect of foreign exchange rate on cash and restricted cash | 187,225 | (176,524 | ) | |||||
| Net increase in cash and restricted cash | 156,337 | 11,493,583 | ||||||
| Cash at the beginning of the period | 10,160,587 | 7,301,014 | ||||||
| Cash at the end of the period | $ | 10,316,924 | $ | 18,794,597 | ||||
Operating Activities
Net cash provided by operating activities was $730,075 for the six months ended March 31, 2026. It was primarily due to the following:
| a) | Net loss of $1,836,739 for the six months; | |
| b) | Adjusted by loss on disposal of property and equipment of $288,176, fair value change of financial instruments of $1,121,746 and provision for expected credit losses of $2,145,919; | |
| c) | Accounts receivable and notes receivable increased by $2,516,543, due to customers deferring their payments in response to the challenging economic environment; | |
| d) | An increase in accounts payable of $1,412,546 due to our delayed payments to suppliers amid the economic downturn. | |
| e) | An increase in advance to suppliers of $660,631; | |
| f) | A decrease in inventory of $627,921 due to the goods in transit was accepted by our customers; | |
| g) | An increase in taxes payable of $735,390; | |
| h) | An increase in other assets of $523,355 due to an increase in VAT Credit to be deducted. |
Net cash used in operating activities was $1,981,527 for the six months ended March 31, 2025. It was primarily due to the following:
| a) | Net loss of $968,655 for the six months; | |
| b) | Adjusted by fair value change of financial instruments of $826,153, provision for expected credit losses of $3,317,683; | |
| c) | Accounts receivable and notes receivable increased by $1,064,864, due to customers deferring their payments in response to the challenging economic environment; | |
| d) | An increase in advance to suppliers of $2,176,850 due to more suppliers requiring payments in advance; | |
| e) | A decrease in inventory of $1,609,405 due to the goods in transit was accepted by our customers. | |
| f) | A decrease in accounts payable of $2,417,661 due to payment to our vendors; | |
| g) | A decrease in advance from customers of $937,625 due to fewer new orders in this period | |
| h) | A decrease in due to related parties of $1,620,234. |
Investing Activities
Net cash used in investing activities was $391,689 for the six months ended March 31, 2026. It was primarily due to: a) purchase of short-term investments of $16,921,805; b) purchase of long-term investments of $712,677; c) loan to a related party of $622,364; d) purchases of property and equipment of $157,843; and e) loans to third parties of $1,514,666. These were partially offset by: f) maturities of short-term investments of $18,052,936; and g) collection of $1,562,188 in loans receivable from third parties.
Net cash provided by investing activities was $5,664,522 for the six months ended March 31, 2025. It was primarily due to: a) maturities of short-term investments of $24,563,110; b) proceeds on disposal of property and equipment of $701,336; partially offset by: c) purchase of short-term investments of $17,231,516; d) loans to third parties of $2,299,751.
Financing Activities
Net cash used in financing activities was $369,265 for the six months ended March 31, 2026. We obtained borrowings of $2,850,708 via bank loans as working capital, which were offset by the repayment of approximately 3,107,272. In addition, we paid dividends of $70,142 and purchase non-controlling interest of $42,559.
Net
cash provided by financing activities was $7,987,112 for the six months ended March 31, 2025. We obtained net borrowings of $2,733,921
via bank loans as working capital, and
Loan Facilities
(1) On March 16, 2026, the Company obtained a loan of RMB 10 million ($1,445,212) from Industrial and Commercial Bank of China Beijing Yayuncun Sub-branch. The loan carries an annual interest of 2.35% and is due on March 15, 2027.
(2) On March 25, 2026, the Company obtained a loan of RMB 10 million ($1,445,212) from Industrial and Commercial Bank of China Beijing Yayuncun Sub-branch. The loan carries an annual interest of 2.35% and it is due on March 19, 2027.
Contingencies
From time to time, the Company may be subject to legal proceedings, claims and disputes that arise in the ordinary course of business. Amounts accrued, as well as the total amount of possible losses with respect to such matters, individually and in the aggregate, are not deemed to be material to the consolidated financial statements.
Contractual Obligations
The Company leases office spaces and factories under non-cancellable operating leases, with terms from 24 to 120 months.
On January 22, 2022, Sichuan Leishen Hongzhuo leased a vacant land from Chengdu Longxing Natural Gas Co., Ltd. for the construction of a natural gas recovery station, which complies with national land-use standards. The lease term is eleven years and the annual rent is RMB 133,745($19,329). On April 1, 2023, Sichuan TIBO Fluid Technology Co., Ltd. leased the factory at Shiliba Industrial Park, Xinshi Town, Jianyang City, Sichuan Province to China Oil Blue Ocean. The term is ten years and the rent is RMB6,440,367 ($930,770) in total. Future minimum lease payments are $111,486 for the 12 months ending March 31, 2027.
Off-Balance Sheet Arrangements
We have not entered into any financial guarantees or other commitments to guarantee the payment obligations of any third parties. In addition, we have not entered into any derivative contracts that are indexed to our own shares and classified as shareholders’ equity, or that are not reflected in our consolidated financial statements. Furthermore, we do not have any retained or contingent interest in assets transferred to an unconsolidated entity that serves as credit, liquidity, or market risk support to such entity. Moreover, we do not have any variable interest in an unconsolidated entity that provides financing, liquidity, market risk, or credit support to us or engages in leasing, hedging, or research and development services with us.
Critical Accounting Estimates
Our consolidated financial statements are prepared in accordance with accounting principles generally accepted in the U.S., which require us to make estimates and assumptions that affect the reported amounts of assets and liabilities. On an ongoing basis, we evaluate our estimates, including those estimates that may have a significant effect on our financial condition and results of operations. Our significant accounting policies are disclosed in Note 2 to our consolidated financial statements. We base our estimates and judgment on historical experience and on various other factors that are believed to be reasonable under the circumstances. Actual results may differ from these estimates under different assumptions or conditions.
We consider an accounting estimate to be critical if:
| (a) | the nature of the estimate is material due to the levels of subjectivity and judgment necessary to account for highly uncertain matters or the susceptibility of such matters to change; and |
| (b) | the impact of the estimate on financial condition or operating performance is material. |
Expected Credit Losses
The Company follows Accounting Standards Update 326, Credit Losses (“ASC 326”) to account for the related expected credit losses. In accordance with ASC 326, the Company maintains an allowance for credit losses and records the allowance for credit losses as an offset to assets such as accounts receivable, and the estimated credit losses charged to the allowance are presented in the consolidated statements of operations and comprehensive loss.
The Company assesses collectability by reviewing receivables on a collective basis where similar characteristics exist, primarily based on the size and nature of specific customer’s receivables (the “CECL model”). In determining the amount of the allowance for credit losses, the Company considers not only the input from its CECL model but also historical collectability based on past due status, the age of the receivable balances, credit quality of customers based on ongoing credit evaluations, current economic conditions, reasonable and supportable forecasts of future economic conditions, and other factors that may affect the Company’s ability to collect from customers. Actual credit losses and related allowance are written off as incurred.
There were no significant changes in the key assumptions of our CECL model throughout the periods presented.