Pay vs Performance Disclosure - USD ($)
May 30, 2026
May 31, 2025
May 25, 2024
May 27, 2023
May 28, 2022
Summary Compensation Table Total for PEO Kate Duchene ($)(2) | Compensation Actually Paid to PEO Kate Duchene ($)(3) | Summary Compensation Table Total for PEO Roger Carlile ($)(2) | Compensation Actually Paid to PEO Roger Carlile ($)(3) | Average Summary Compensation Table Total for Non-PEO NEOs ($)(2) | Average Compensation Actually Paid to Non-PEO NEOs ($)(3) | Value of Initial Fixed $100 Investment Based On: | Net Income ($)(5) | Adjusted EBITDA ($)(6) | ||||||||||||||||||||||||||||||
Year(1) | Total Stockholder Return ($)(4) | Peer Group Total Stockholder Return ($)(4) | ||||||||||||||||||||||||||||||||||||
(a) | (b) | (c) | (d) | (e) | (f) | (g) | (h) | (i) | (j) | (k) | ||||||||||||||||||||||||||||
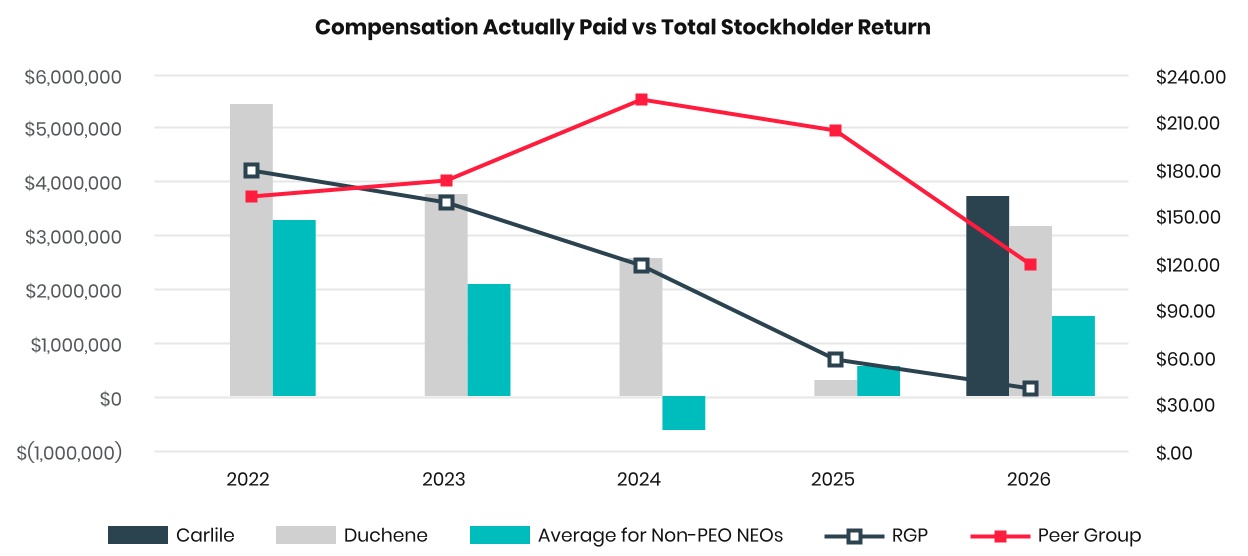
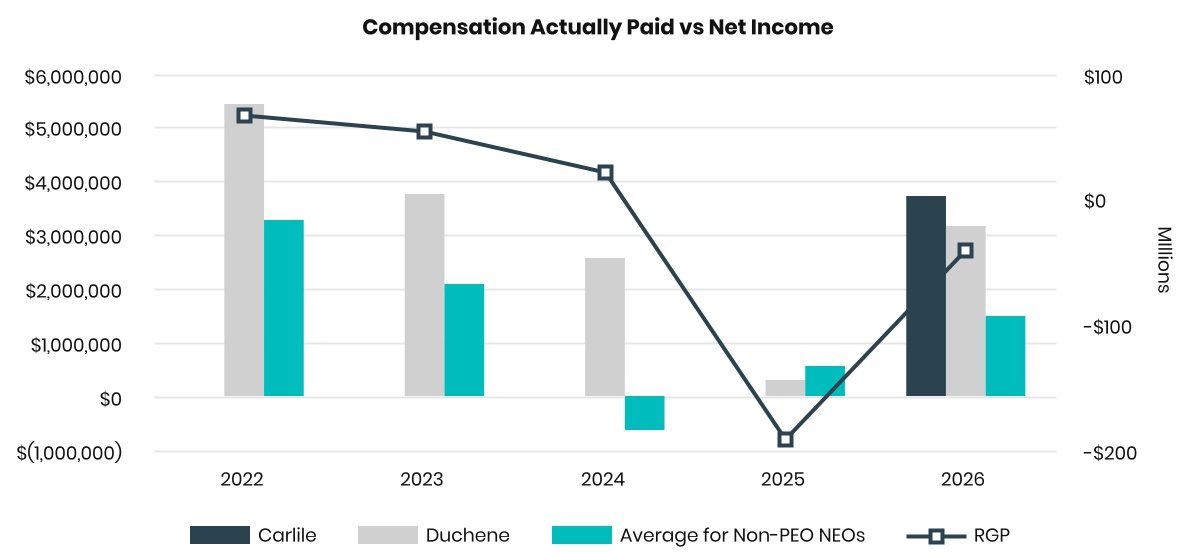
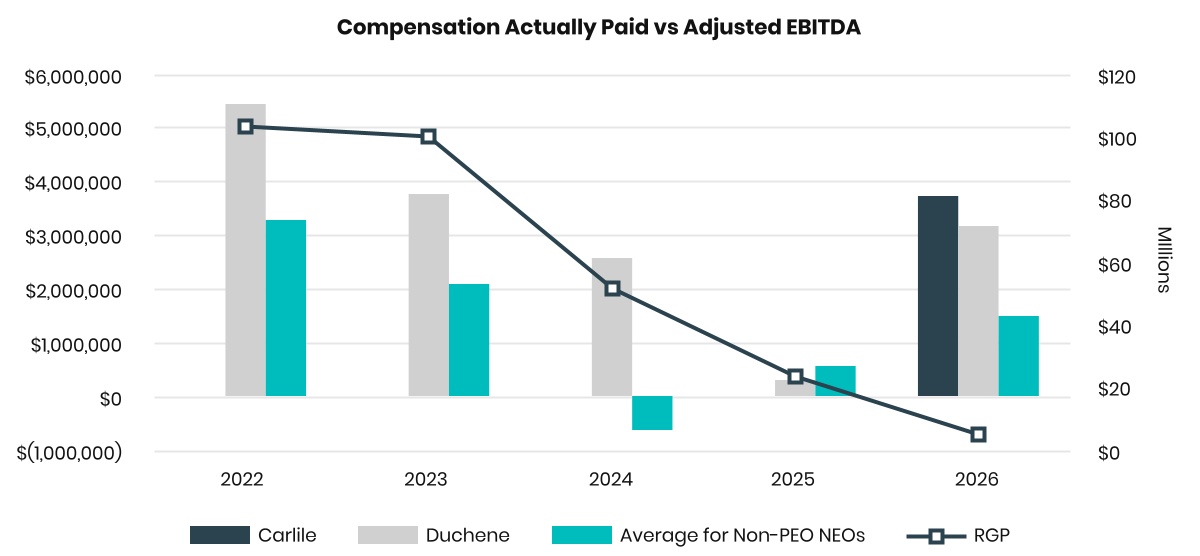
2026 | 3,062,768 | 3,177,853 | 3,669,837 | 3,723,201 | 1,597,603 | 1,495,928 | 39.00 | 118.11 | (40,601,000) | 5,046,000 | ||||||||||||||||||||||||||||
2025 | 2,673,316 | 306,572 | n/a | n/a | 1,522,815 | 564,859 | 57.82 | 204.25 | (191,780,000) | 23,457,000 | ||||||||||||||||||||||||||||
2024 | 2,850,507 | 2,592,677 | n/a | n/a | 930,638 | (610,465) | 117.94 | 224.03 | 21,034,000 | 51,483,000 | ||||||||||||||||||||||||||||
2023 | 4,013,909 | 3,776,753 | n/a | n/a | 2,289,718 | 2,093,310 | 157.85 | 172.04 | 54,359,000 | 100,194,000 | ||||||||||||||||||||||||||||
2022 | 4,624,537 | 5,449,459 | n/a | n/a | 2,652,879 | 3,274,788 | 178.65 | 161.97 | 67,175,000 | 103,131,000 | ||||||||||||||||||||||||||||
Year | PEO(s) | Non-PEO NEOs | ||||||||||||
2026 | Roger D. Carlile (November 3, 2025 to present) Kate W. Duchene (June 1, 2025 to November 2, 2025) | Jennifer Y. Ryu, Bhadresh Patel, Scott G. Rottmann, Michael W. Lane and Venkat Ramaswamy Iyer | ||||||||||||
2025 | Kate W. Duchene | Jennifer Y. Ryu and Bhadresh Patel | ||||||||||||
2024 | Kate W. Duchene | Jennifer Y. Ryu, Timothy L. Brackney and Bhadresh Patel | ||||||||||||
2023 | Kate W. Duchene | Jennifer Y. Ryu and Timothy L. Brackney | ||||||||||||
2022 | Kate W. Duchene | Jennifer Y. Ryu and Timothy L. Brackney | ||||||||||||
▪Plus the year-end value of awards granted in the covered fiscal year which were outstanding and unvested at the end of the covered fiscal year,
▪Plus/(less) the change in value as of the end of the covered fiscal year as compared to the end of the prior fiscal year for awards which were granted in prior years and were outstanding and unvested at the end of the covered fiscal year,
▪Plus the vesting date value of awards which were granted and vested during the same covered fiscal year,
▪Plus/(less) the change in value as of the vesting date as compared to the end of the prior fiscal year for awards which were granted in prior years and vested in the covered fiscal year,
▪Less, as to any awards which were granted in prior fiscal years and were forfeited during the covered fiscal year, the value of such awards as of the end of the prior fiscal year,
▪Plus the dollar value of any dividends or other earnings paid during the covered fiscal year on outstanding and unvested awards (no dividends or dividend equivalents were paid or credited on outstanding options, cash dividends were paid on outstanding unvested restricted stock awards, and, for other awards, the crediting of dividend equivalents in accordance with the applicable award terms has been taken into account in determining the applicable fiscal year-end or vesting date value of the award),
▪Plus, as to an award that is materially modified during the covered fiscal year, the amount by which the value of the award as of the date of the modification exceeds the value of the original award on the modification date (none of the RSUs or PSUs held by the NEOs were materially modified during the fiscal years covered by the table).
In making each of these adjustments, the “value” of an award is the fair value of the award on the applicable date determined in accordance with FASB ASC Topic 718 using the valuation assumptions we then use to calculate the fair value of our equity awards. For more information on the valuation of our equity awards, please see the notes to our financial statements that appear in our Annual Report on Form 10-K each year and the footnotes to the Summary Compensation Table that appear in our annual proxy statement.
The table reflects the CAP (determined as noted above) for our CEO(s) and, for our Non-PEO NEOs, the average of the CAPs determined for the Non-PEO NEOs for each of the fiscal years shown in the table.
The following table provides a reconciliation of the Summary Compensation Table Total to CAP for Kate W. Duchene.
| Reconciliation of Summary Compensation Table Total to Compensation Actually Paid for Kate W. Duchene | 2026 ($) | 2025 ($) | 2024 ($) | 2023 ($) | 2022 ($) | ||||||||||||||||||
Summary Compensation Table Total | 3,062,768 | 2,673,316 | 2,850,507 | 4,013,909 | 4,624,537 | ||||||||||||||||||
Grant Date Fair Value of Option and Stock Awards Granted in Fiscal Year | — | (1,832,485) | (1,999,984) | (2,099,971) | (1,799,965) | ||||||||||||||||||
Fair Value at Fiscal Year-End of Outstanding and Unvested Option and Stock Awards Granted in Fiscal Year | — | 1,135,578 | 1,771,153 | 1,910,412 | 1,871,266 | ||||||||||||||||||
Change in Fair Value of Outstanding and Unvested Option and Stock Awards Granted in Prior Fiscal Years | 75,789 | (967,343) | (468,586) | (114,458) | 521,263 | ||||||||||||||||||
Fair Value at Vesting of Option and Stock Awards Granted in Fiscal Year That Vested During Fiscal Year | 39,296 | 26,023 | 32,461 | 5,861 | 5,079 | ||||||||||||||||||
Change in Fair Value at Vesting of Option and Stock Awards Granted in Prior Fiscal Years That Vested During Fiscal Year | — | (86,092) | 407,126 | 61,000 | 227,279 | ||||||||||||||||||
Fair Value as of Prior Fiscal Year-End of Option and Stock Awards Granted in Prior Fiscal Years That Failed to Meet Applicable Vesting Conditions During Fiscal Year | — | (642,425) | — | — | — | ||||||||||||||||||
Increase Based on Dividends or Other Earnings Paid During Applicable Fiscal Year Period to Vesting Date | — | — | — | — | — | ||||||||||||||||||
Compensation Actually Paid | 3,177,853 | 306,572 | 2,592,677 | 3,776,753 | 5,449,459 | ||||||||||||||||||
The following table provides a reconciliation of the Summary Compensation Table Total to CAP for Roger D. Carlile.
| Reconciliation of Summary Compensation Table Total to Compensation Actually Paid for Roger D. Carlile | 2026 ($) | 2025 ($) | 2024 ($) | 2023 ($) | 2022 ($) | ||||||||||||||||||
Summary Compensation Table Total | 3,669,837 | n/a | n/a | n/a | n/a | ||||||||||||||||||
Grant Date Fair Value of Option and Stock Awards Granted in Fiscal Year | (3,193,875) | n/a | n/a | n/a | n/a | ||||||||||||||||||
Fair Value at Fiscal Year-End of Outstanding and Unvested Option and Stock Awards Granted in Fiscal Year | 3,256,323 | n/a | n/a | n/a | n/a | ||||||||||||||||||
Change in Fair Value of Outstanding and Unvested Option and Stock Awards Granted in Prior Fiscal Years | (8,630) | n/a | n/a | n/a | n/a | ||||||||||||||||||
Fair Value at Vesting of Option and Stock Awards Granted in Fiscal Year That Vested During Fiscal Year | — | n/a | n/a | n/a | n/a | ||||||||||||||||||
Change in Fair Value at Vesting of Option and Stock Awards Granted in Prior Fiscal Years That Vested During Fiscal Year | (454) | n/a | n/a | n/a | n/a | ||||||||||||||||||
Fair Value as of Prior Fiscal Year-End of Option and Stock Awards Granted in Prior Fiscal Years That Failed to Meet Applicable Vesting Conditions During Fiscal Year | — | n/a | n/a | n/a | n/a | ||||||||||||||||||
Increase Based on Dividends or Other Earnings Paid During Applicable Fiscal Year Period to Vesting Date | — | n/a | n/a | n/a | n/a | ||||||||||||||||||
Compensation Actually Paid | 3,723,201 | n/a | n/a | n/a | n/a | ||||||||||||||||||
▪Plus the year-end value of awards granted in the covered fiscal year which were outstanding and unvested at the end of the covered fiscal year,
▪Plus/(less) the change in value as of the end of the covered fiscal year as compared to the end of the prior fiscal year for awards which were granted in prior years and were outstanding and unvested at the end of the covered fiscal year,
▪Plus the vesting date value of awards which were granted and vested during the same covered fiscal year,
▪Plus/(less) the change in value as of the vesting date as compared to the end of the prior fiscal year for awards which were granted in prior years and vested in the covered fiscal year,
▪Less, as to any awards which were granted in prior fiscal years and were forfeited during the covered fiscal year, the value of such awards as of the end of the prior fiscal year,
▪Plus the dollar value of any dividends or other earnings paid during the covered fiscal year on outstanding and unvested awards (no dividends or dividend equivalents were paid or credited on outstanding options, cash dividends were paid on outstanding unvested restricted stock awards, and, for other awards, the crediting of dividend equivalents in accordance with the applicable award terms has been taken into account in determining the applicable fiscal year-end or vesting date value of the award),
▪Plus, as to an award that is materially modified during the covered fiscal year, the amount by which the value of the award as of the date of the modification exceeds the value of the original award on the modification date (none of the RSUs or PSUs held by the NEOs were materially modified during the fiscal years covered by the table).
In making each of these adjustments, the “value” of an award is the fair value of the award on the applicable date determined in accordance with FASB ASC Topic 718 using the valuation assumptions we then use to calculate the fair value of our equity awards. For more information on the valuation of our equity awards, please see the notes to our financial statements that appear in our Annual Report on Form 10-K each year and the footnotes to the Summary Compensation Table that appear in our annual proxy statement.
The table reflects the CAP (determined as noted above) for our CEO(s) and, for our Non-PEO NEOs, the average of the CAPs determined for the Non-PEO NEOs for each of the fiscal years shown in the table.
The following table provides a reconciliation of the Summary Compensation Table Total to CAP for Kate W. Duchene.
| Reconciliation of Summary Compensation Table Total to Compensation Actually Paid for Kate W. Duchene | 2026 ($) | 2025 ($) | 2024 ($) | 2023 ($) | 2022 ($) | ||||||||||||||||||
Summary Compensation Table Total | 3,062,768 | 2,673,316 | 2,850,507 | 4,013,909 | 4,624,537 | ||||||||||||||||||
Grant Date Fair Value of Option and Stock Awards Granted in Fiscal Year | — | (1,832,485) | (1,999,984) | (2,099,971) | (1,799,965) | ||||||||||||||||||
Fair Value at Fiscal Year-End of Outstanding and Unvested Option and Stock Awards Granted in Fiscal Year | — | 1,135,578 | 1,771,153 | 1,910,412 | 1,871,266 | ||||||||||||||||||
Change in Fair Value of Outstanding and Unvested Option and Stock Awards Granted in Prior Fiscal Years | 75,789 | (967,343) | (468,586) | (114,458) | 521,263 | ||||||||||||||||||
Fair Value at Vesting of Option and Stock Awards Granted in Fiscal Year That Vested During Fiscal Year | 39,296 | 26,023 | 32,461 | 5,861 | 5,079 | ||||||||||||||||||
Change in Fair Value at Vesting of Option and Stock Awards Granted in Prior Fiscal Years That Vested During Fiscal Year | — | (86,092) | 407,126 | 61,000 | 227,279 | ||||||||||||||||||
Fair Value as of Prior Fiscal Year-End of Option and Stock Awards Granted in Prior Fiscal Years That Failed to Meet Applicable Vesting Conditions During Fiscal Year | — | (642,425) | — | — | — | ||||||||||||||||||
Increase Based on Dividends or Other Earnings Paid During Applicable Fiscal Year Period to Vesting Date | — | — | — | — | — | ||||||||||||||||||
Compensation Actually Paid | 3,177,853 | 306,572 | 2,592,677 | 3,776,753 | 5,449,459 | ||||||||||||||||||
The following table provides a reconciliation of the Summary Compensation Table Total to CAP for Roger D. Carlile.
| Reconciliation of Summary Compensation Table Total to Compensation Actually Paid for Roger D. Carlile | 2026 ($) | 2025 ($) | 2024 ($) | 2023 ($) | 2022 ($) | ||||||||||||||||||
Summary Compensation Table Total | 3,669,837 | n/a | n/a | n/a | n/a | ||||||||||||||||||
Grant Date Fair Value of Option and Stock Awards Granted in Fiscal Year | (3,193,875) | n/a | n/a | n/a | n/a | ||||||||||||||||||
Fair Value at Fiscal Year-End of Outstanding and Unvested Option and Stock Awards Granted in Fiscal Year | 3,256,323 | n/a | n/a | n/a | n/a | ||||||||||||||||||
Change in Fair Value of Outstanding and Unvested Option and Stock Awards Granted in Prior Fiscal Years | (8,630) | n/a | n/a | n/a | n/a | ||||||||||||||||||
Fair Value at Vesting of Option and Stock Awards Granted in Fiscal Year That Vested During Fiscal Year | — | n/a | n/a | n/a | n/a | ||||||||||||||||||
Change in Fair Value at Vesting of Option and Stock Awards Granted in Prior Fiscal Years That Vested During Fiscal Year | (454) | n/a | n/a | n/a | n/a | ||||||||||||||||||
Fair Value as of Prior Fiscal Year-End of Option and Stock Awards Granted in Prior Fiscal Years That Failed to Meet Applicable Vesting Conditions During Fiscal Year | — | n/a | n/a | n/a | n/a | ||||||||||||||||||
Increase Based on Dividends or Other Earnings Paid During Applicable Fiscal Year Period to Vesting Date | — | n/a | n/a | n/a | n/a | ||||||||||||||||||
Compensation Actually Paid | 3,723,201 | n/a | n/a | n/a | n/a | ||||||||||||||||||
The following table provides a reconciliation of the average of the Summary Compensation Table Total for the Non-PEO NEOs for a fiscal year to the average of the Compensation Actually Paid for the Non-PEO NEOs for that fiscal year.
| Reconciliation of Summary Compensation Table Total to Compensation Actually Paid for Non-PEO NEOs | 2026 ($) | 2025 ($) | 2024 ($) | 2023 ($) | 2022 ($) | ||||||||||||||||||
Summary Compensation Table Total | 1,597,603 | 1,522,815 | 930,638 | 2,289,718 | 2,652,879 | ||||||||||||||||||
Grant Date Fair Value of Option and Stock Awards Granted in Fiscal Year | (525,254) | (879,988) | (549,988) | (1,049,986) | (849,974) | ||||||||||||||||||
Fair Value at Fiscal Year-End of Outstanding and Unvested Option and Stock Awards Granted in Fiscal Year | 490,914 | 541,873 | 489,006 | 954,112 | 885,349 | ||||||||||||||||||
Change in Fair Value of Outstanding and Unvested Option and Stock Awards Granted in Prior Fiscal Years | (14,058) | (385,025) | (334,419) | (218,403) | 429,984 | ||||||||||||||||||
Fair Value at Vesting of Option and Stock Awards Granted in Fiscal Year That Vested During Fiscal Year | 9,687 | (5,161) | 6,049 | 2,899 | 2,558 | ||||||||||||||||||
Change in Fair Value at Vesting of Option and Stock Awards Granted in Prior Fiscal Years That Vested During Fiscal Year | (18,562) | (61,407) | (134,654) | 113,745 | 152,067 | ||||||||||||||||||
Fair Value as of Prior Fiscal Year-End of Option and Stock Awards Granted in Prior Fiscal Years That Failed to Meet Applicable Vesting Conditions During Fiscal Year | (44,402) | (168,248) | (1,017,447) | — | — | ||||||||||||||||||
Increase Based on Dividends or Other Earnings Paid During Applicable Fiscal Year Period to Vesting Date | — | — | 350 | 1,225 | 1,925 | ||||||||||||||||||
Compensation Actually Paid | 1,495,928 | 564,859 | (610,465) | 2,093,310 | 3,274,788 | ||||||||||||||||||
▪Revenue
Following is an unranked list of the Company’s two financial performance measures we considered in linking the compensation actually paid to our NEOs for fiscal 2026 with Company performance.
These performance measures were used in our EIP performance measurement framework. For a discussion of these terms as used in our EIP, see the “Compensation Discussion and Analysis” section above.
In addition to the financial performance measures listed above, we view the Company’s stock price, upon which the value of all of our awards is dependent, as a key performance-based component of our executive compensation program in order to further align the interests of our senior management team with the interests of our stockholders.