Exhibit 99.3
DEBT OFFERING INVESTOR PRESENTATION Q3 2026 A final base shelf prospectus containing important information relating to the securities described in this document has been fi led with the securities regulatory authorities in each of the provinces of Canada. The final base shelf prospectus, any applicable shelf prospectus supplement and any amendment to the documents are accessibl e t hrough SEDAR+. Copies of the documents may be obtained from Morgan Stanley & Co. LLC toll - free at 1 - 866 - 718 - 1649, MUFG Securitie s Americas Inc. toll - free at (877) 649 - 6848, Wells Fargo Securities, LLC toll - free at (800) 645 - 3751 or BofA Securities, Inc. toll - free at (800) 294 - 1322. This document does not provide full disclosure of all material facts relating to the securities offered. Investors should rea d t he final base shelf prospectus, any applicable shelf prospectus supplement and any amendment to the documents for disclosure of those facts, especially risk factors relating to the securities offered, before making an investment decision.
FORWARD - LOOKING INFORMATION 2 Fortis includes forward - looking information in this presentation within the meaning of applicable Canadian securities laws and f orward - looking statements within the meaning of the Private Securities Litigation Reform Act of 1995 (collectively referred to as "forward - looking information"). Forward - looking information reflects expectations of Fortis’ management regarding future growth, results of opera tions, performance and business prospects and opportunities. Wherever possible, words such as anticipates, believes, budgets, co uld, estimates, expects, forecasts, intends, may, might, plans, projects, schedule, should, target, will, would, and the negative of these te rms , and other similar terminology or expressions have been used to identify the forward - looking information, which includes, witho ut limitation: forecast 2026 Rate Base; the 2026 - 2030 capital plan; forecast 2026 weighted average allowed ROE and equity ratio; expected timing, outcome, an d impact of legal and regulatory proceedings; expected and potential reductions in customer rates associated with various aff ord ability initiatives and certain projects, including load growth driven by interconnections at ITC Midwest, Springerville Natural Gas Generation Conve rsi on, data center load growth at TEP, Tilbury 1A Facility and 1B Expansion, and Eagle Mountain Pipeline Project; expected sourc es of funding for the 2026 - 2030 capital plan, including the sources of equity; the expectation of having a consistent capital structure over the plannin g p eriod; annual dividend growth guidance through 2030; forecast Capital Expenditures for 2026 through 2030 by business unit; th e n ature, timing, benefits, and costs of certain Major Capital Projects, including ITC's investments associated with MISO LRTP Tranches 1 and 2.1 and Big Ce dar Load Expansion, TEP Transmission Project, Springerville Natural Gas Generation Conversion, UNS Electric New Gas Generatio n, Vail - to - Tortolita Transmission Project, Tilbury LNG Storage Expansion, AMI Project, Tilbury 1B Project and Eagle Mountain Pipeline Project; for eca st Rate Base for 2026 through 2030 and forecast five - year Rate Base CAGR by business unit; forecast debt maturities for 2026 - 203 5; upcoming preferred share rate resets; the expectation of having a coal - free generation mix by 2032; and the 2050 net - zero GHG emissions target. Forward - looking information involves significant risks, uncertainties, and assumptions. Certain material factors or assumptions have been applied in drawing the conclusions contained in the forward - looking information including, without limitation: the suc cessful execution of the Capital Plan; no material capital project or financing cost overrun; sufficient human resources to deliver service and execut e t he Capital Plan; the realization of additional opportunities beyond the Capital Plan; no significant variability in interest rat es; no material changes in the assumed U.S. dollar - to - Canadian dollar exchange rate; the Board exercising its discretion to declare dividends, taking into acco unt the financial performance and condition of the Corporation; reasonable legal and regulatory decisions and the expectation of regulatory stability; no significant operational disruptions or environmental liability or upset; the continued ability to maintain the performance of th e electricity and gas systems; no severe and prolonged economic downturn; sufficient liquidity and capital resources; the abi lit y to hedge exposures to fluctuations in foreign exchange rates, natural gas prices and electricity prices; the continued availability of natural gas, fu el, coal and electricity supply; continuation of power supply and capacity purchase contracts; no significant changes in gove rnm ent energy policies, environmental laws and regulations that could have a material negative impact; maintenance of adequate insurance coverage; th e a bility to obtain and maintain licenses and permits; retention of existing service areas; no significant changes in tax laws a nd the continued tax deferred treatment of earnings from the Corporation's foreign operations; continued maintenance of information technology inf ras tructure and no material breach of cybersecurity; continued favourable relations with Indigenous Peoples; and favourable labour relations. Fortis cautions readers that a number of factors could cause actual results, performance or achievements to differ materially fr om the results discussed or implied in the forward - looking information. These factors should be considered carefully and undue r eliance should not be placed on the forward - looking information. For additional information with respect to certain of these risks or factors, referen ce should be made to the continuous disclosure materials filed from time to time by the Corporation with Canadian securities reg ulatory authorities (the “Canadian Securities Regulators”) and the Securities and Exchange Commission (“SEC”). All forward - looking information herein is given as of the date of this presentation. Fortis disclaims any intention or obligation to update or revise any forward - looking information, whether as a result of new information, future events or otherwise. GENERAL ADVISORY Fortis has filed a short form base shelf prospectus in each of the provinces of Canada and a registration statement (includin g s uch prospectus) with the SEC. Before you invest in any securities of Fortis, you should read such prospectus, the applicable pre liminary prospectus supplement and the other documents Fortis has filed with the Canadian Securities Regulators in each of the provinces of Canad a a nd the SEC for more complete information about Fortis. You may get these documents for free by visiting SEDAR+ at www.sedarplus.ca or EDGAR on the SEC website at www.sec.gov . Alternatively, if you call the underwriters participating in the offering, Fortis will arrange to send you the prospectus a nd the related prospectus supplement if you request it. The information contained in this presentation does not constitute investment, legal, accounting, regulatory, taxation or oth er advice, and the information does not take into account your investment objectives or legal, accounting, regulatory, taxation or financial situation or particular needs. You are solely responsible for forming your own opinions and conclusions on such matters and the market and fo r making your own independent assessment of the information. The information in this presentation is provided as of the date of this presentation. Fortis is under no obligation to update or keep current the information contained in this presentation. No representation or war ranty, express or implied, is or will be made, and no responsibility or liability is or will be accepted by Fortis, any under wri ters or any of their respective affiliates, agents or advisers as to, and no reliance should be placed on, the fairness, accuracy, completeness or correctnes s o f the information or opinions contained herein, and any reliance you place on them will be at your sole risk. Fortis, its aff ili ates and its advisors do not accept any liability whatsoever for any loss howsoever arising, directly or indirectly, from the use of this presentation or its con ten ts, or otherwise arising in connection with this document. None of the SEC, any state securities regulator or the Canadian Securities Regulators has approved or disapproved the securit ies described in this document or determined if Fortis’ final base shelf prospectus, preliminary prospectus supplement or any oth er applicable prospectus supplement to be filed in connection with the offering of such securities is truthful or complete. Any representation to the con trary is a criminal offence. NON - U.S. GAAP FINANCIAL INFORMATION Certain financial data included in this presentation consists of “non - U.S. GAAP financial measures”. Fortis uses non - U.S. GAAP m easures that do not have a standardized meaning as prescribed under U.S. GAAP. Therefore, these measures may not be comparabl e t o similar measures presented by other companies. Refer to the “Non - U.S. GAAP Financial Measures” section of the Fortis annual MD&A filed on February 12, 2026, the “Non - U.S. GAA P Financial Measure” section or the Fortis interim MD&A filed on July 31, 2026 and the “Non - US GAAP measures” section of the Fortis management information circular filed on March 30, 2026, in each case with Canadian Securities Regulato rs and the SEC. Unless otherwise specified, all financial information is in Canadian dollars and rate base refers to midyear rate base . Capitalized terms are defined on the last page of this presentation . U . S . dollar - denominated five - year Capital Plan and forecast rate base converted at a forecast USD : CAD foreign exchange rate of 1 . 35 for 2026 - 2030 .
OFFERING SUMMARY Issuer: Fortis Inc. Security: Junior Subordinated Notes Format: SEC Registered and Canadian Prospectus Qualified (MJDS) Size: $USD Benchmark Tenors: 30.5 NC 5.25 - years & 30.5 NC 10.25 - years Coupon Structure: Fixed - to - Fixed Rate subject to coupon floor Use of Proceeds: Repay maturing indebtedness and for general corporate purposes Optional Deferral: Cumulative, maximum of 10 consecutive years per deferral Optional Redemption: • In whole or in part at 100% on any day 90 - days prior to the Initial Interest Rate Reset Date • In whole or in part at 100% on any Interest Rate Reset date, thereafter • In whole, but not in part, at 100% upon a Tax Event • In whole, but not in part, at 102% upon a Rating Agency Event Subordination: Unsecured and rank junior in right of payment to all of the Company’s “Senior Indebtedness” Active Bookrunners: Morgan Stanley, MUFG, Wells Fargo Securities, BofA Securities 3
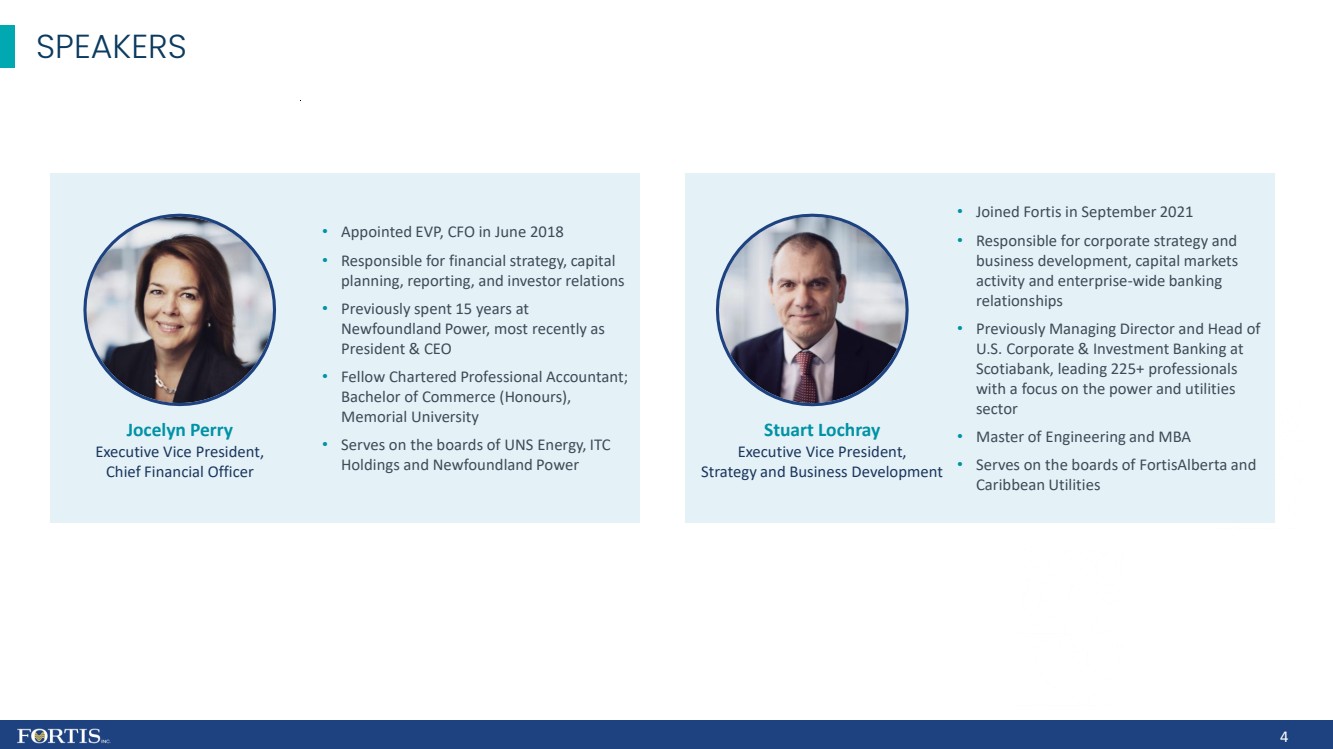
4 SPEAKERS Stuart Lochray Executive Vice President, Strategy and Business Development • Joined Fortis in September 2021 • Responsible for corporate strategy and business development, capital markets activity and enterprise - wide banking relationships • Previously Managing Director and Head of U.S. Corporate & Investment Banking at Scotiabank, leading 225+ professionals with a focus on the power and utilities sector • Master of Engineering and MBA • Serves on the boards of FortisAlberta and Caribbean Utilities Jocelyn Perry Executive Vice President, Chief Financial Officer • Appointed EVP, CFO in June 2018 • Responsible for financial strategy, capital planning, reporting, and investor relations • Previously spent 15 years at Newfoundland Power, most recently as President & CEO • Fellow Chartered Professional Accountant; Bachelor of Commerce (Honours), Memorial University • Serves on the boards of UNS Energy, ITC Holdings and Newfoundland Power
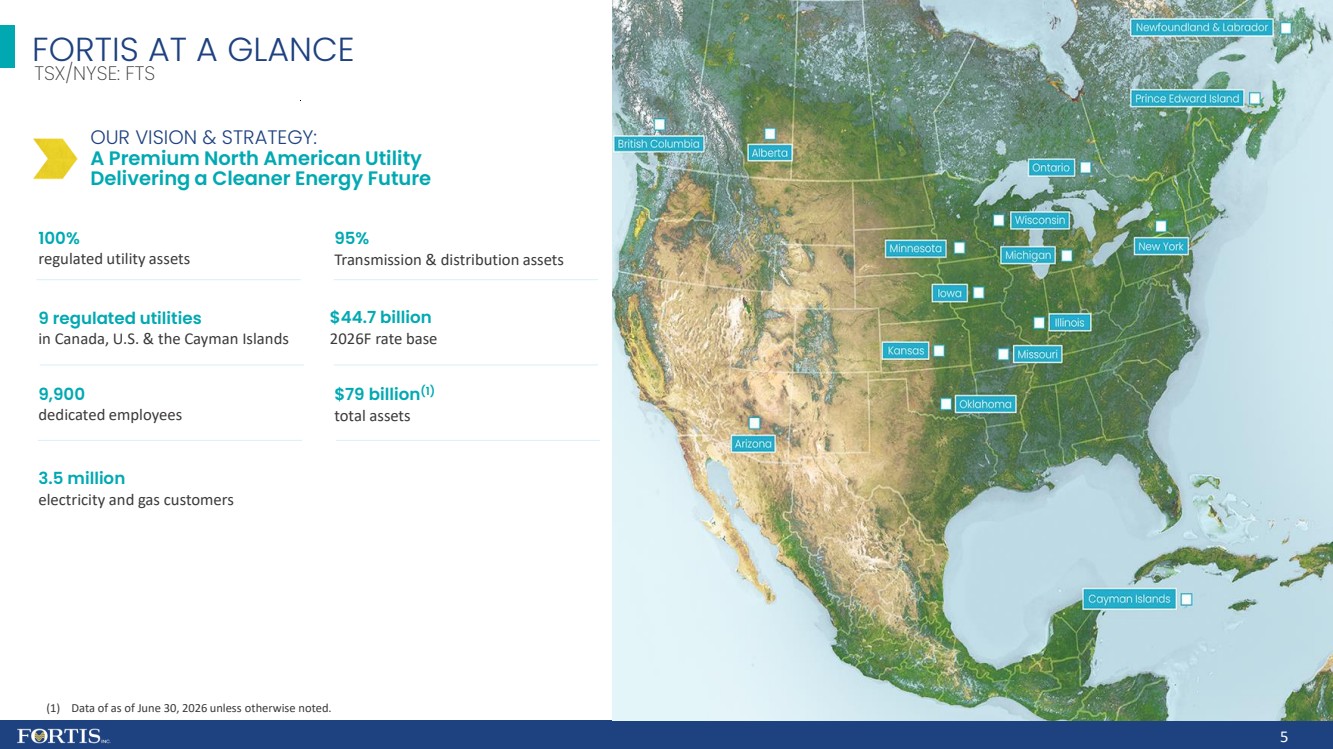
FORTIS AT A GLANCE 9 regulated utilities in Canada, U.S. & the Cayman Islands 3.5 million electricity and gas customers 95% Transmission & distribution assets $44.7 billion 2026F rate base 100% regulated utility assets 9,900 dedicated employees $79 billion (1) total assets TSX/NYSE: FTS OUR VISION & STRATEGY: A Premium North American Utility Delivering a Cleaner Energy Future (1) Data of as of June 30, 2026 unless otherwise noted. 5
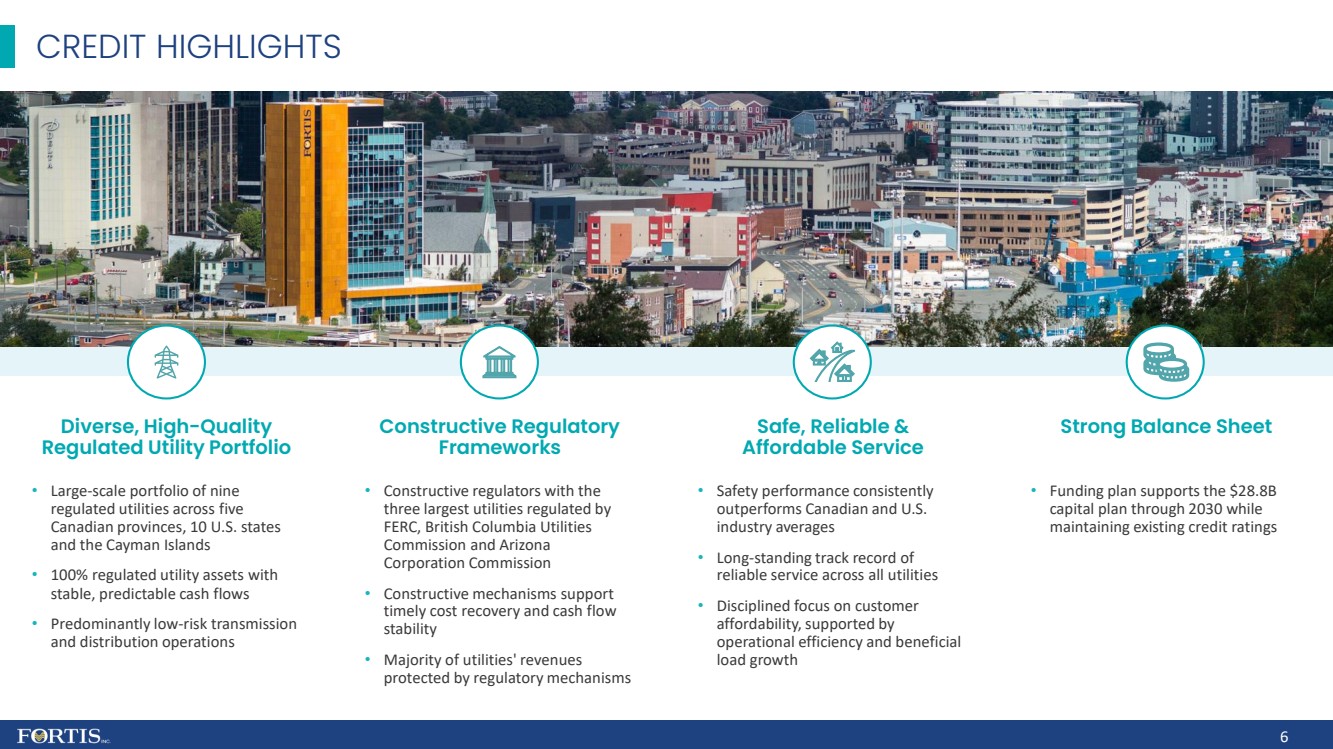
CREDIT HIGHLIGHTS 6 Diverse, High - Quality Regulated Utility Portfolio Constructive Regulatory Frameworks Safe, Reliable & Affordable Service Strong Balance Sheet • Large - scale portfolio of nine regulated utilities across five Canadian provinces, 10 U.S. states and the Cayman Islands • 100% regulated utility assets with stable, predictable cash flows • Predominantly low - risk transmission and distribution operations • Constructive regulators with the three largest utilities regulated by FERC, British Columbia Utilities Commission and Arizona Corporation Commission • Constructive mechanisms support timely cost recovery and cash flow stability • Majority of utilities' revenues protected by regulatory mechanisms • Safety performance consistently outperforms Canadian and U.S. industry averages • Long - standing track record of reliable service across all utilities • Disciplined focus on customer affordability, supported by operational efficiency and beneficial load growth • Funding plan supports the $28.8B capital plan through 2030 while maintaining existing credit ratings
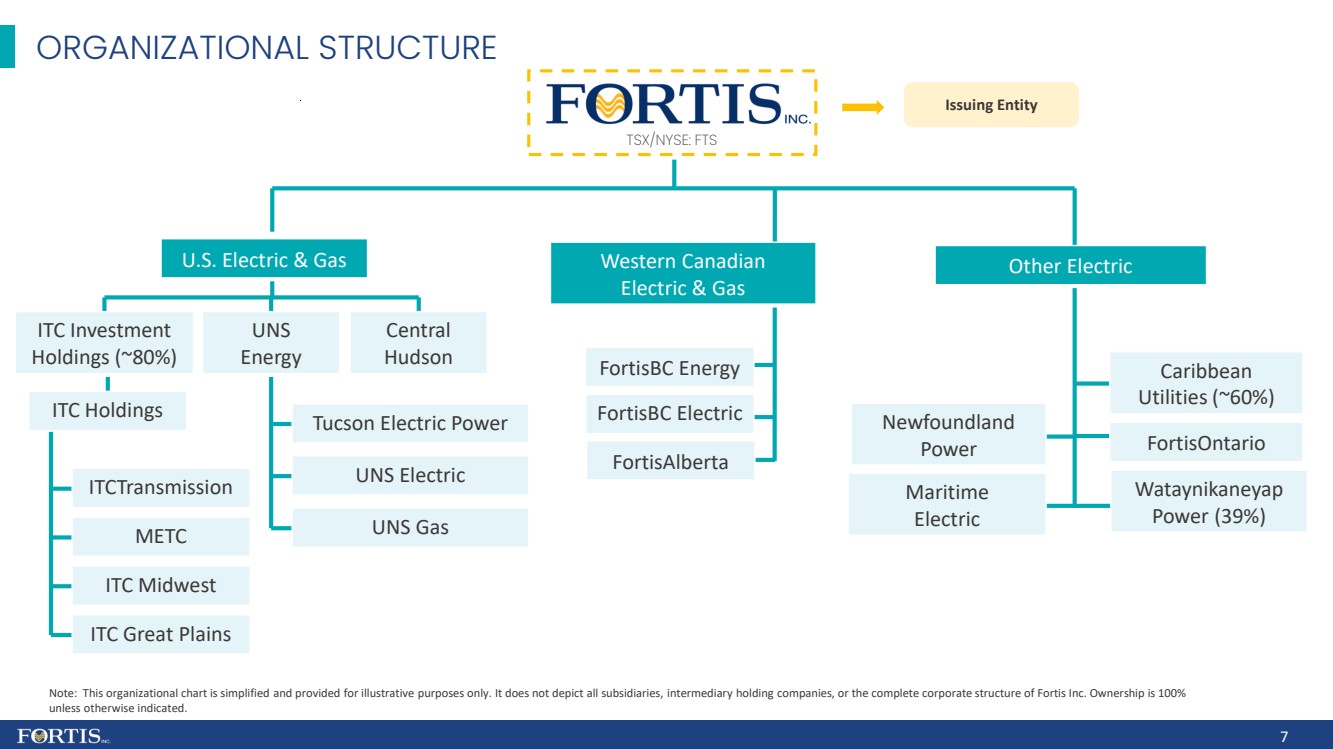
ORGANIZATIONAL STRUCTURE 7 ITC Holdings ITCTransmission METC ITC Midwest ITC Great Plains Tucson Electric Power UNS Electric UNS Gas Caribbean Utilities (~60%) Maritime Electric FortisBC Electric Newfoundland Power Wataynikaneyap Power (39%) U.S. Electric & Gas FortisBC Energy Western Canadian Electric & Gas FortisOntario Other Electric ITC Investment Holdings (~80%) UNS Energy Central Hudson Note: This organizational chart is simplified and provided for illustrative purposes only. It does not depict all subsidiaries, intermediary holding companies, or the complete corporate structure of Fortis Inc. Ownership is 100% unless otherwise indicated. TSX/NYSE: FTS FortisAlberta Issuing Entity
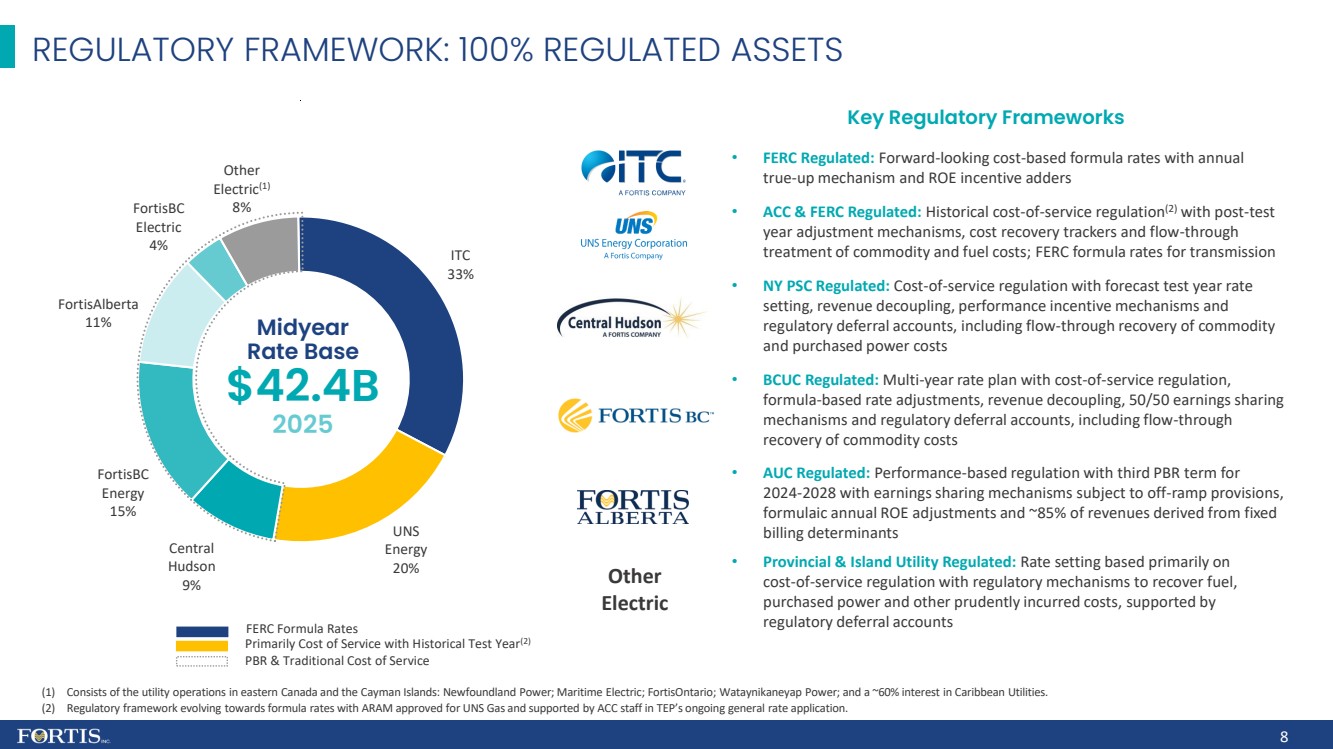
• FERC Regulated: Forward - looking c ost - based formula rates with annual true - up mechanism and ROE incentive adders • ACC & FERC Regulated: Historical cost - of - service regulation (2) with post - test year adjustment mechanisms, cost recovery trackers and flow - through treatment of commodity and fuel costs; FERC formula rates for transmission • NY PSC Regulated: Cost - of - service regulation with forecast test year rate setting, revenue decoupling, performance incentive mechanisms and regulatory deferral accounts, including flow - through recovery of commodity and purchased power costs • BCUC Regulated: Multi - year rate plan with cost - of - service regulation, formula - based rate adjustments, revenue decoupling, 50/50 earnings sharing mechanisms and regulatory deferral accounts, including flow - through recovery of commodity costs • AUC Regulated: Performance - based regulation with third PBR term for 2024 - 2028 with earnings sharing mechanisms subject to off - ramp provisions, formulaic annual ROE adjustments and ~85% of revenues derived from fixed billing determinants • Provincial & Island Utility Regulated: Rate setting based primarily on cost - of - service regulation with regulatory mechanisms to recover fuel, purchased power and other prudently incurred costs, supported by regulatory deferral accounts 8 REGULATORY FRAMEWORK: 100% REGULATED ASSETS (1) Consists of the utility operations in eastern Canada and the Cayman Islands: Newfoundland Power; Maritime Electric; FortisOnt ari o; Wataynikaneyap Power; and a ~60% interest in Caribbean Utilities. (2) Regulatory framework evolving towards formula rates with ARAM approved for UNS Gas and supported by ACC staff in TEP’s ongoin g g eneral rate application. ITC 33% UNS Energy 20% Central Hudson 9% FortisBC Energy 15% FortisAlberta 11% FortisBC Electric 4% Other Electric (1) 8% Key Regulatory Frameworks Midyear Rate Base $42.4B 2025 PBR & Traditional Cost of Service Primarily Cost of Service with Historical Test Year (2) FERC Formula Rates Other Electric
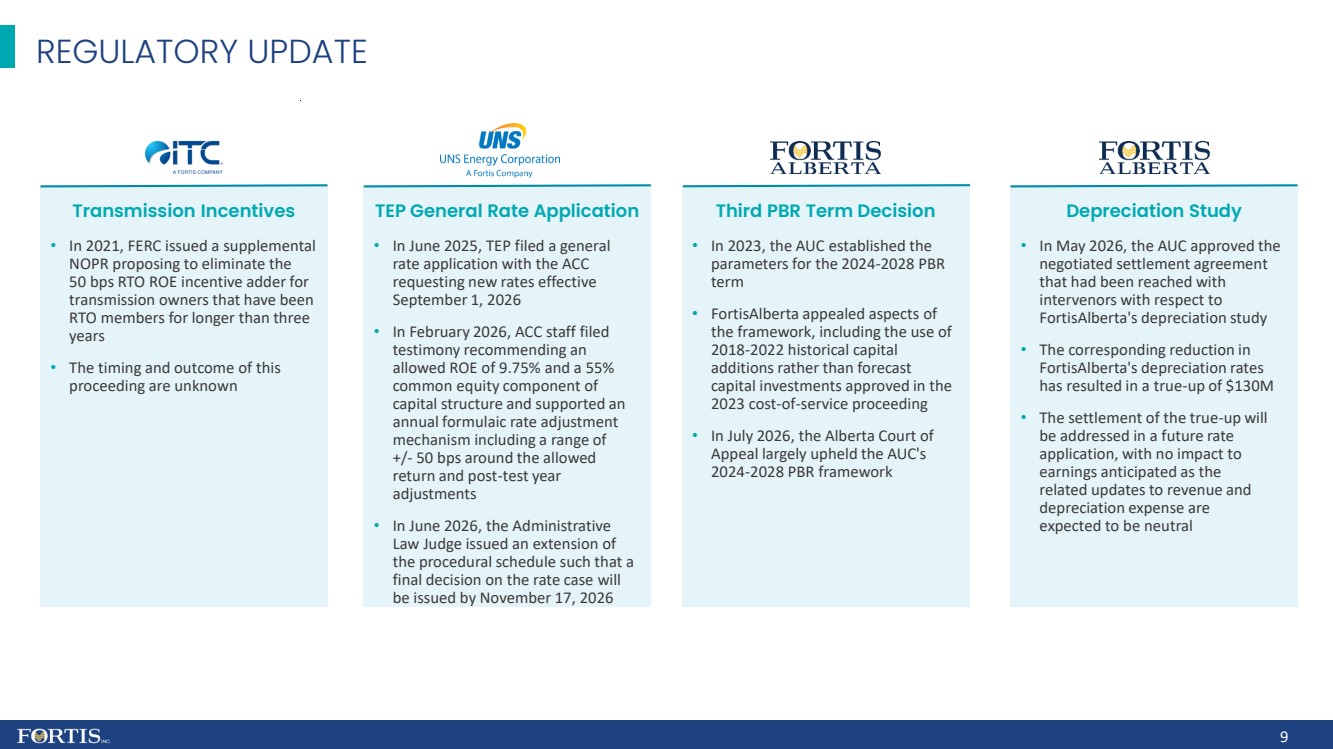
9 REGULATORY UPDATE • In 2021, FERC issued a supplemental NOPR proposing to eliminate the 50 bps RTO ROE incentive adder for transmission owners that have been RTO members for longer than three years • The timing and outcome of this proceeding are unknown • In May 2026, the AUC approved the negotiated settlement agreement that had been reached with intervenors with respect to FortisAlberta's depreciation study • The corresponding reduction in FortisAlberta's depreciation rates has resulted in a true - up of $130M • The settlement of the true - up will be addressed in a future rate application, with no impact to earnings anticipated as the related updates to revenue and depreciation expense are expected to be neutral • In June 2025, TEP filed a general rate application with the ACC requesting new rates effective September 1, 2026 • In February 2026, ACC staff filed testimony recommending an allowed ROE of 9.75% and a 55% common equity component of capital structure and supported an annual formulaic rate adjustment mechanism including a range of +/ - 50 bps around the allowed return and post - test year adjustments • In June 2026, the Administrative Law Judge issued an extension of the procedural schedule such that a final decision on the rate case will be issued by November 17, 2026 Transmission Incentives Depreciation Study TEP General Rate Application • In 2023, the AUC established the parameters for the 2024 - 2028 PBR term • FortisAlberta appealed aspects of the framework, including the use of 2018 - 2022 historical capital additions rather than forecast capital investments approved in the 2023 cost - of - service proceeding • In July 2026, the Alberta Court of Appeal largely upheld the AUC's 2024 - 2028 PBR framework Third PBR Term Decision
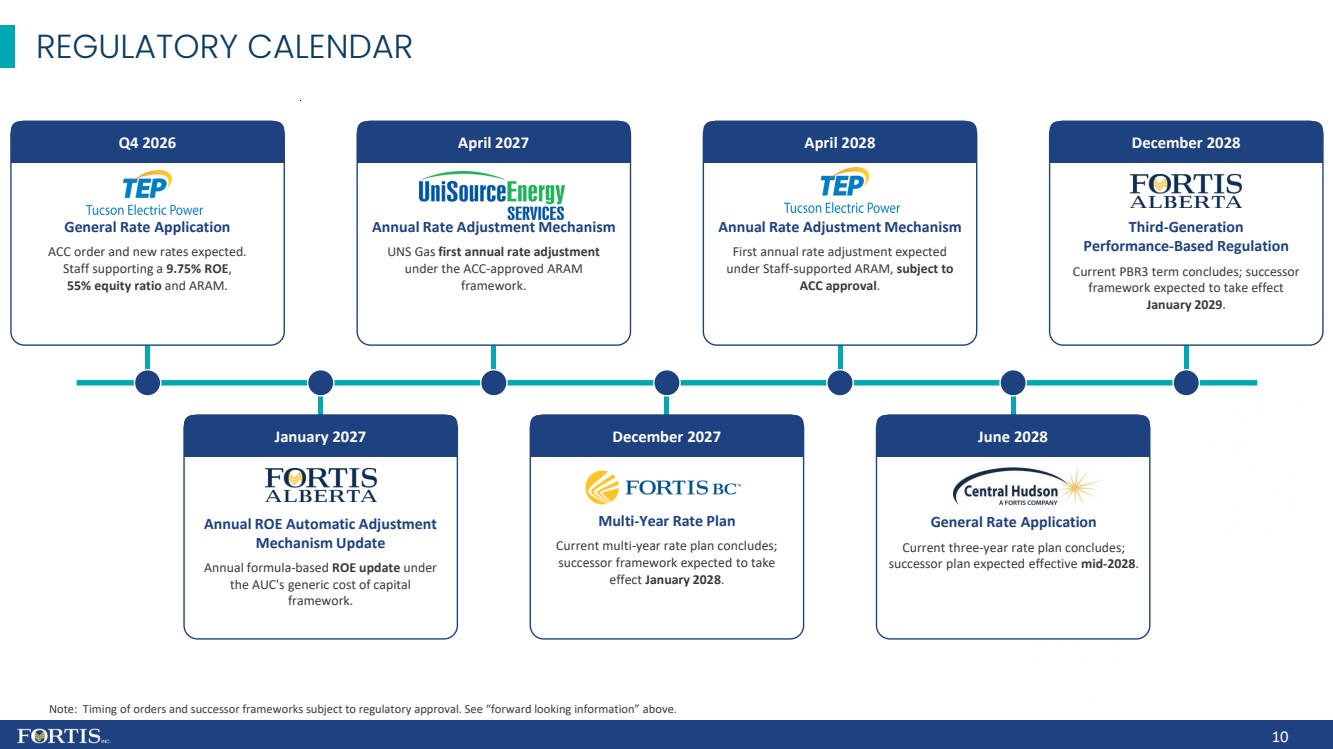
10 REGULATORY CALENDAR Q4 2026 General Rate Application ACC order and new rates expected. Staff supporting a 9.75% ROE , 55% equity ratio and ARAM. January 2027 Annual ROE Automatic Adjustment Mechanism Update Annual formula - based ROE update under the AUC's generic cost of capital framework. April 2027 Annual Rate Adjustment Mechanism UNS Gas first annual rate adjustment under the ACC - approved ARAM framework. December 2027 Multi - Year Rate Plan Current multi - year rate plan concludes; successor framework expected to take effect January 2028 . April 2028 Annual Rate Adjustment Mechanism First annual rate adjustment expected under Staff - supported ARAM, subject to ACC approval . June 2028 General Rate Application Current three - year rate plan concludes; successor plan expected effective mid - 2028 . December 2028 Third - Generation Performance - Based Regulation Current PBR3 term concludes; successor framework expected to take effect January 2029 . Note: Timing of orders and successor frameworks subject to regulatory approval. See “forward looking information” above.
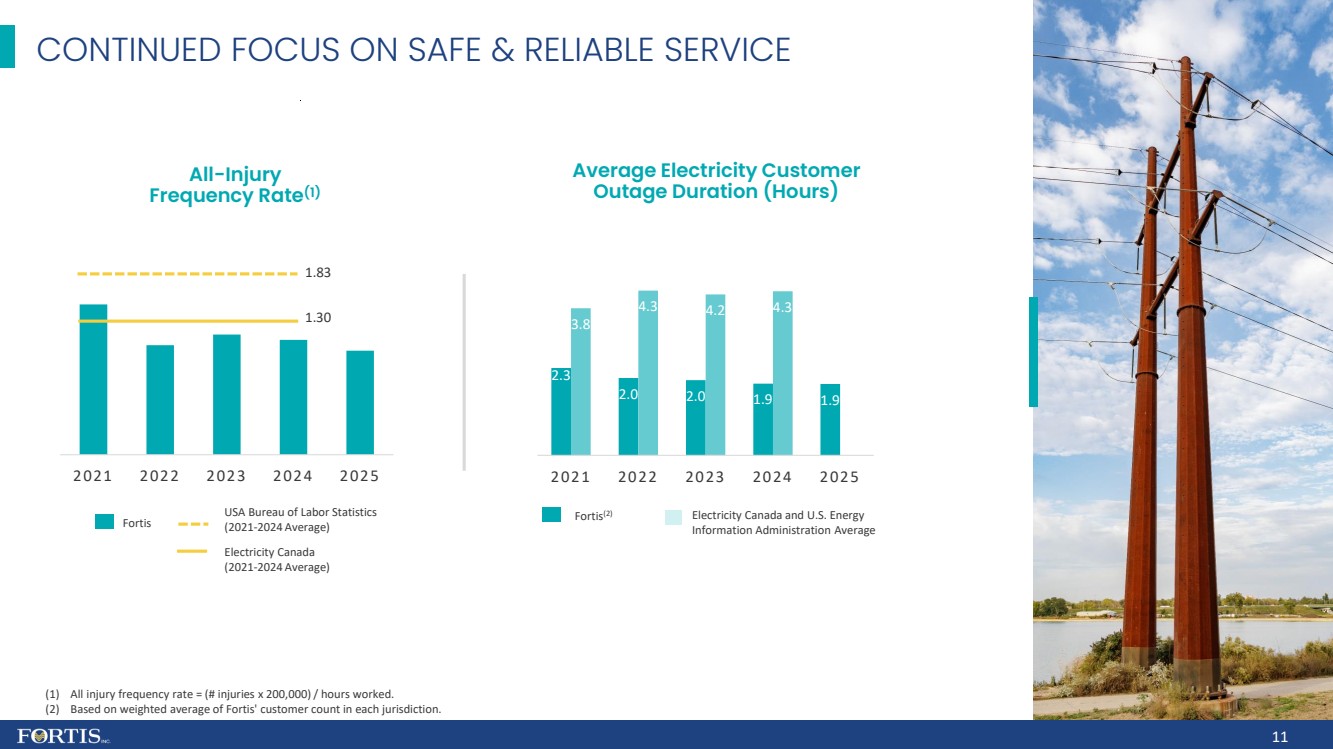
2021 2022 2023 2024 2025 CONTINUED FOCUS ON SAFE & RELIABLE SERVICE (1) All injury frequency rate = (# injuries x 200,000) / hours worked. (2) Based on weighted average of Fortis' customer count in each jurisdiction. 1.83 2.3 2.0 2.0 1.9 1.9 3.8 4.3 4.2 4.3 2021 2022 2023 2024 2025 Average Electricity Customer Outage Duration (Hours) Fortis (2) Electricity Canada and U.S. Energy Information Administration Average All - Injury Frequency Rate (1) Fortis USA Bureau of Labor Statistics (2021 - 2024 Average) Electricity Canada (2021 - 2024 Average) 1.30 11
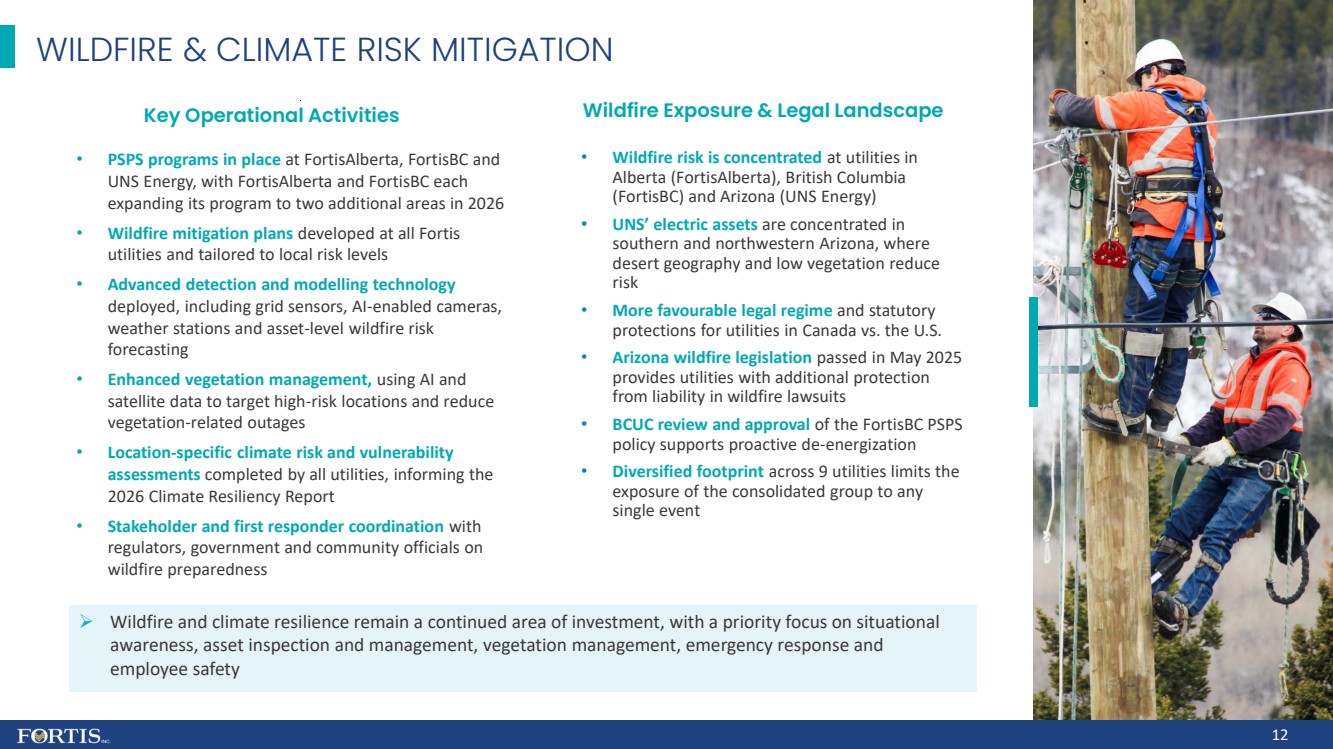
12 WILDFIRE & CLIMATE RISK MITIGATION • PSPS programs in place at FortisAlberta, FortisBC and UNS Energy, with FortisAlberta and FortisBC each expanding its program to two additional areas in 2026 • Wildfire mitigation plans developed at all Fortis utilities and tailored to local risk levels • Advanced detection and modelling technology deployed, including grid sensors, AI - enabled cameras, weather stations and asset - level wildfire risk forecasting • Enhanced vegetation management, using AI and satellite data to target high - risk locations and reduce vegetation - related outages • Location - specific climate risk and vulnerability assessments completed by all utilities, informing the 2026 Climate Resiliency Report • Stakeholder and first responder coordination with regulators, government and community officials on wildfire preparedness Key Operational Activities • Wildfire risk is concentrated at utilities in Alberta (FortisAlberta), British Columbia (FortisBC) and Arizona (UNS Energy) • UNS’ electric assets are concentrated in southern and northwestern Arizona, where desert geography and low vegetation reduce risk • More favourable legal regime and statutory protections for utilities in Canada vs. the U.S. • Arizona wildfire legislation passed in May 2025 provides utilities with additional protection from liability in wildfire lawsuits • BCUC review and approval of the FortisBC PSPS policy supports proactive de - energization • Diversified footprint across 9 utilities limits the exposure of the consolidated group to any single event Wildfire Exposure & Legal Landscape » Wildfire and climate resilience remain a continued area of investment, with a priority focus on situational awareness, asset inspection and management, vegetation management, emergency response and employee safety
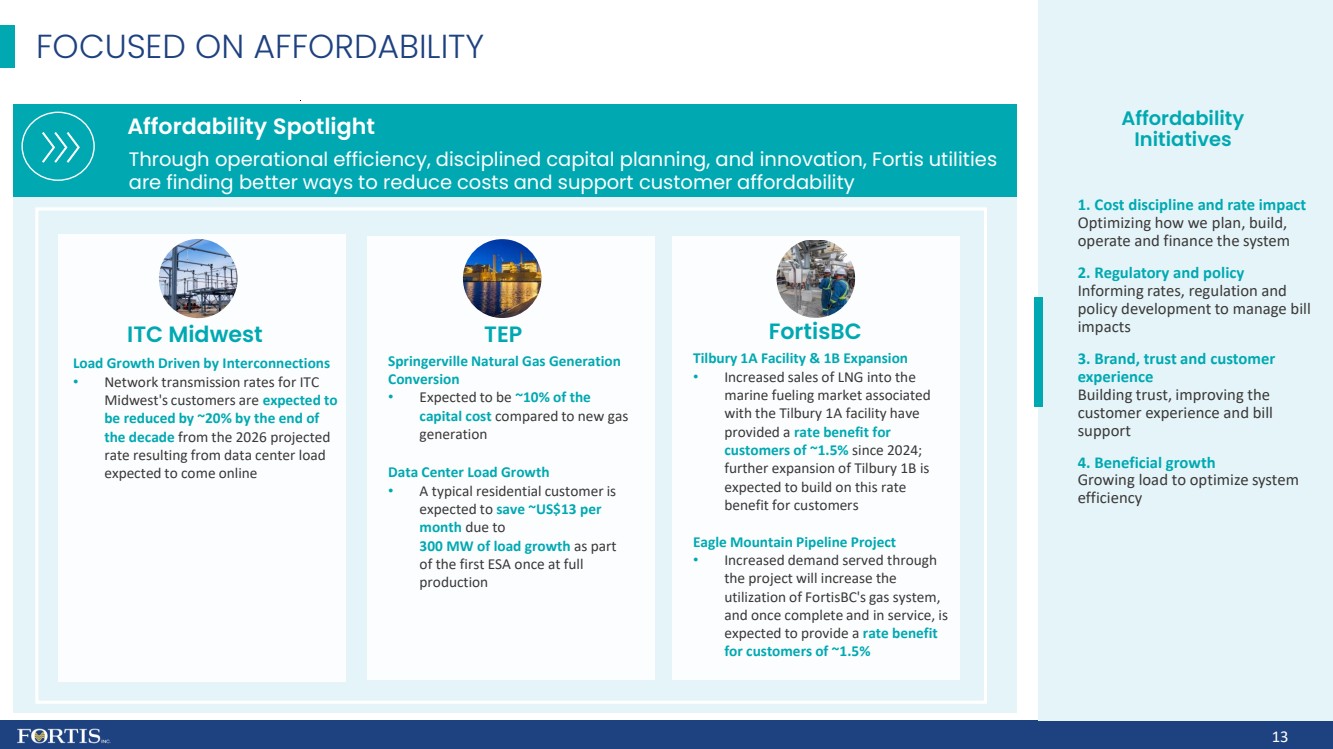
FOCUSED ON AFFORDABILITY 13 Affordability Initiatives ITC Midwest Load Growth Driven by Interconnections • Network transmission rates for ITC Midwest's customers are expected to be reduced by ~20% by the end of the decade from the 2026 projected rate resulting from data center load expected to come online TEP Springerville Natural Gas Generation Conversion • Expected to be ~10% of the capital cost compared to new gas generation Data Center Load Growth • A typical residential customer is expected to save ~US$13 per month due to 300 MW of load growth as part of the first ESA once at full production FortisBC Tilbury 1A Facility & 1B Expansion • Increased sales of LNG into the marine fueling market associated with the Tilbury 1A facility have provided a rate benefit for customers of ~1.5% since 2024; further expansion of Tilbury 1B is expected to build on this rate benefit for customers Eagle Mountain Pipeline Project • Increased demand served through the project will increase the utilization of FortisBC's gas system, and once complete and in service, is expected to provide a rate benefit for customers of ~1.5% Through operational efficiency, disciplined capital planning, and innovation, Fortis utilities are finding better ways to reduce costs and support customer affordability Affordability Spotlight 1. Cost discipline and rate impact Optimizing how we plan, build, operate and finance the system 2. Regulatory and policy Informing rates, regulation and policy development to manage bill impacts 3. Brand, trust and customer experience Building trust, improving the customer experience and bill support 4. Beneficial growth Growing load to optimize system efficiency
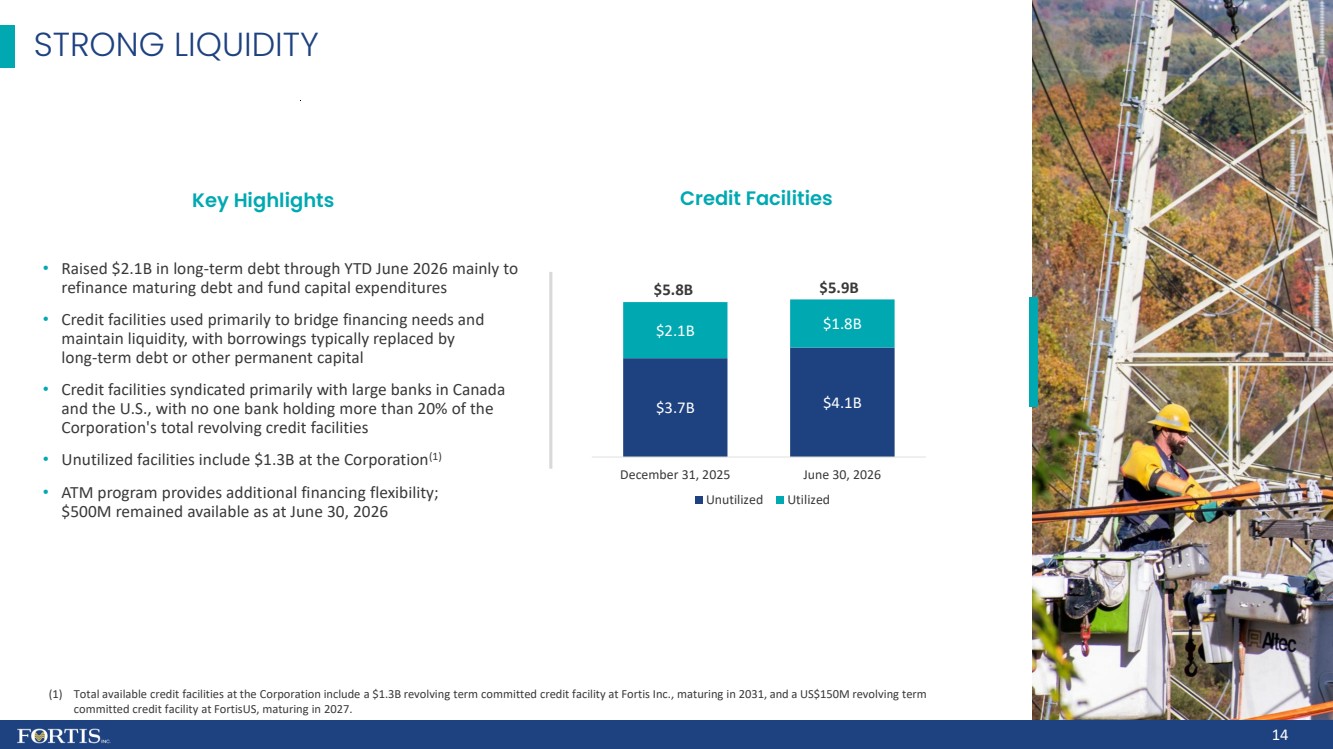
14 STRONG LIQUIDITY $3.7B $4.1B $2.1B $1.8B December 31, 2025 June 30, 2026 Unutilized Utilized Credit Facilities $5.8B $5.9B • Raised $2.1B in long - term debt through YTD June 2026 mainly to refinance maturing debt and fund capital expenditures • Credit facilities used primarily to bridge financing needs and maintain liquidity, with borrowings typically replaced by long - term debt or other permanent capital • Credit facilities syndicated primarily with large banks in Canada and the U.S., with no one bank holding more than 20% of the Corporation's total revolving credit facilities • Unutilized facilities include $1.3B at the Corporation (1) • ATM program provides additional financing flexibility; $500M remained available as at June 30, 2026 Key Highlights (1) Total available credit facilities at the Corporation include a $1.3B revolving term committed credit facility at Fortis Inc., ma turing in 2031, and a US$150M revolving term committed credit facility at FortisUS , maturing in 2027.
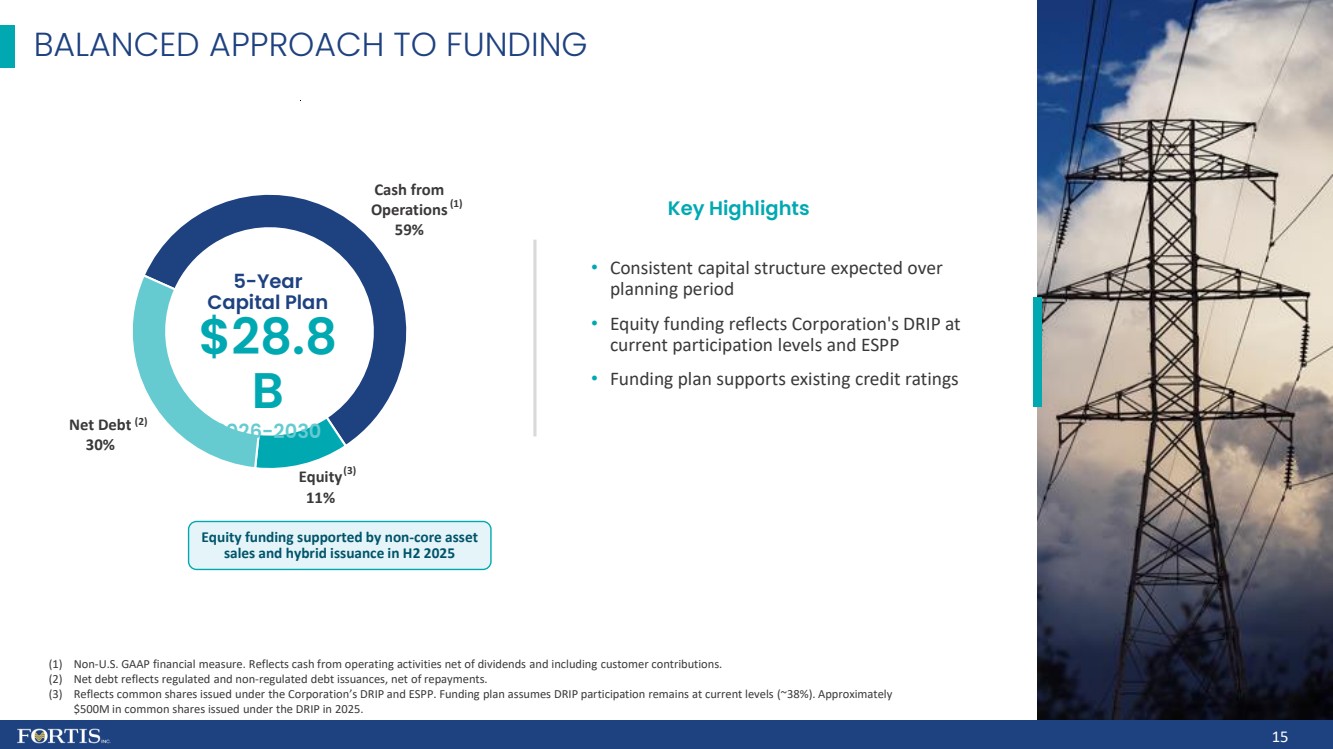
BALANCED APPROACH TO FUNDING (1) Non - U.S. GAAP financial measure . Reflects cash from operating activities net of dividends and including customer contributions. (2) Net debt reflects regulated and non - regulated debt issuances, net of repayments. (3) Reflects common shares issued under the Corporation’ s DRIP and ESPP. Funding plan assumes DRIP participation remains at current levels (~38%). Approximately $500M in common shares issued under the DRIP in 2025. 15 Cash from Operations 59% Equity 11% Net Debt 30% 5 - Year Capital Plan $28.8 B 2026 - 2030 (1) (3) (2) • Consistent capital structure expected over planning period • Equity funding reflects Corporation's DRIP at current participation levels and ESPP • Funding plan supports existing credit ratings Key Highlights Equity funding supported by non - core asset sales and hybrid issuance in H2 2025
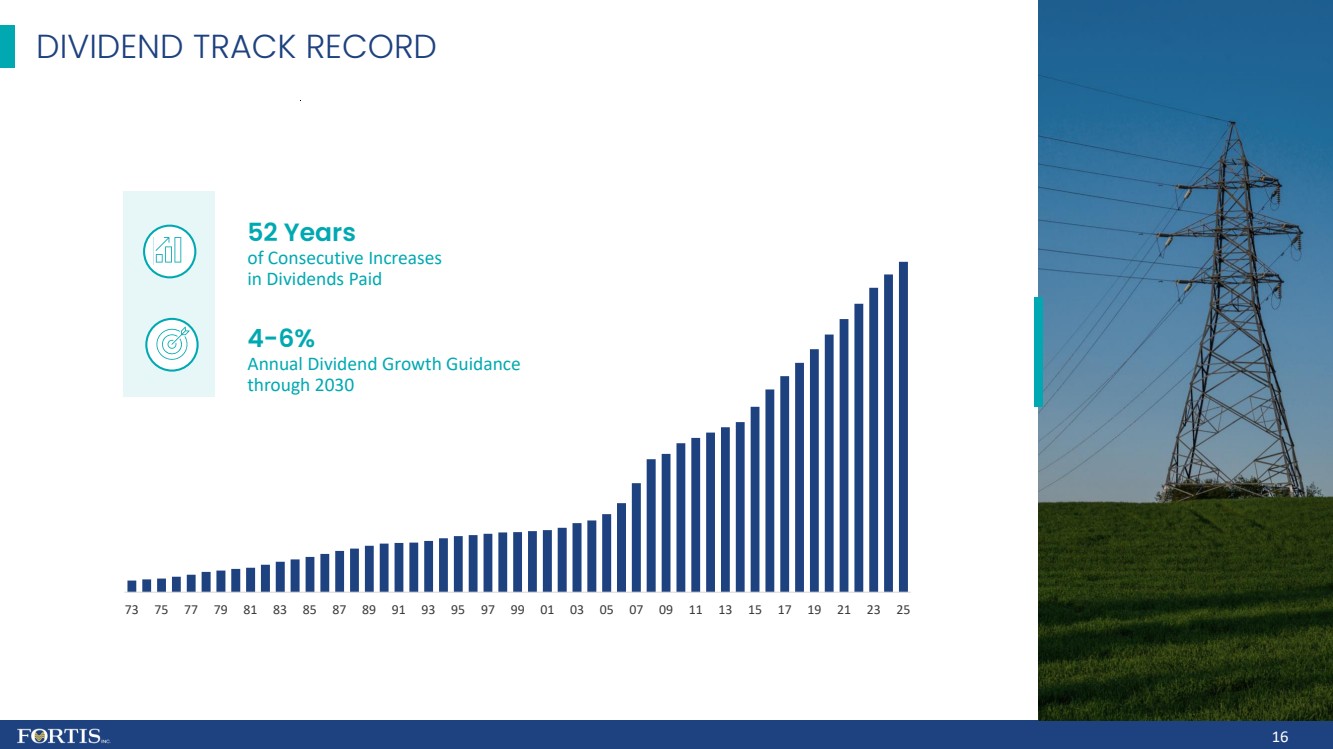
16 73 75 77 79 81 83 85 87 89 91 93 95 97 99 01 03 05 07 09 11 13 15 17 19 21 23 25 4 - 6% Annual Dividend Growth Guidance through 2030 52 Years of Consecutive Increases in Dividends Paid DIVIDEND TRACK RECORD
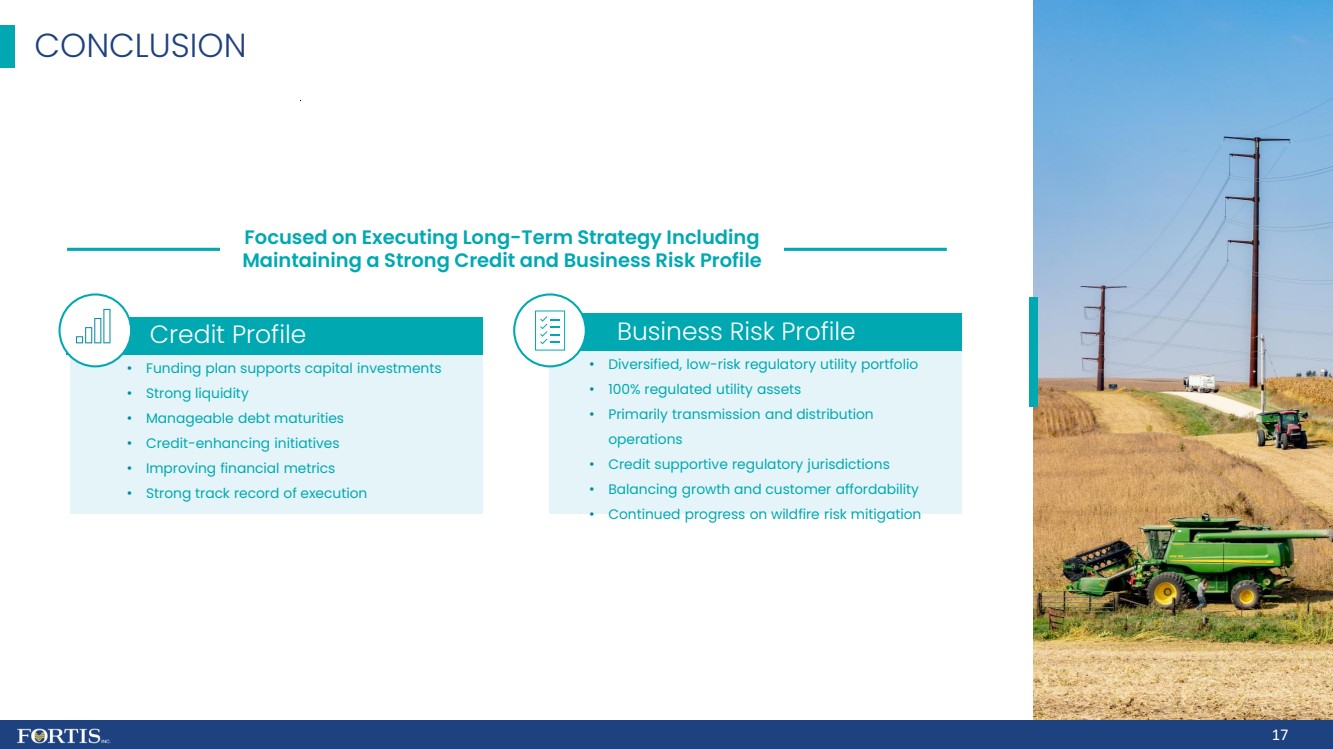
17 • Funding plan supports capital investments • Strong liquidity • Manageable debt maturities • Credit - enhancing initiatives • Improving financial metrics • Strong track r ecord of execution Business Risk Profile • Diversified, low - risk regulatory utility portfolio • 100% regulated utility assets • Primarily transmission and distribution operations • Credit supportive regulatory jurisdictions • Balancing growth and customer affordability • Continued progress on wildfire risk mitigation Credit Profile Focused on Executing Long - Term Strategy Including Maintaining a Strong Credit and Business Risk Profile CONCLUSION
APPENDIX
TABLE OF CONTENTS 20 - 25 Subsidiary Overviews 26 2026 - 2030 Capital Plan by Business Unit 27 Major Capital Projects 28 2025 - 2030 Rate Base by Business Unit 29 Long - Term Debt Maturities 30 Preference Shares 32 Our Sustainability Strategy 33 Glossary 19
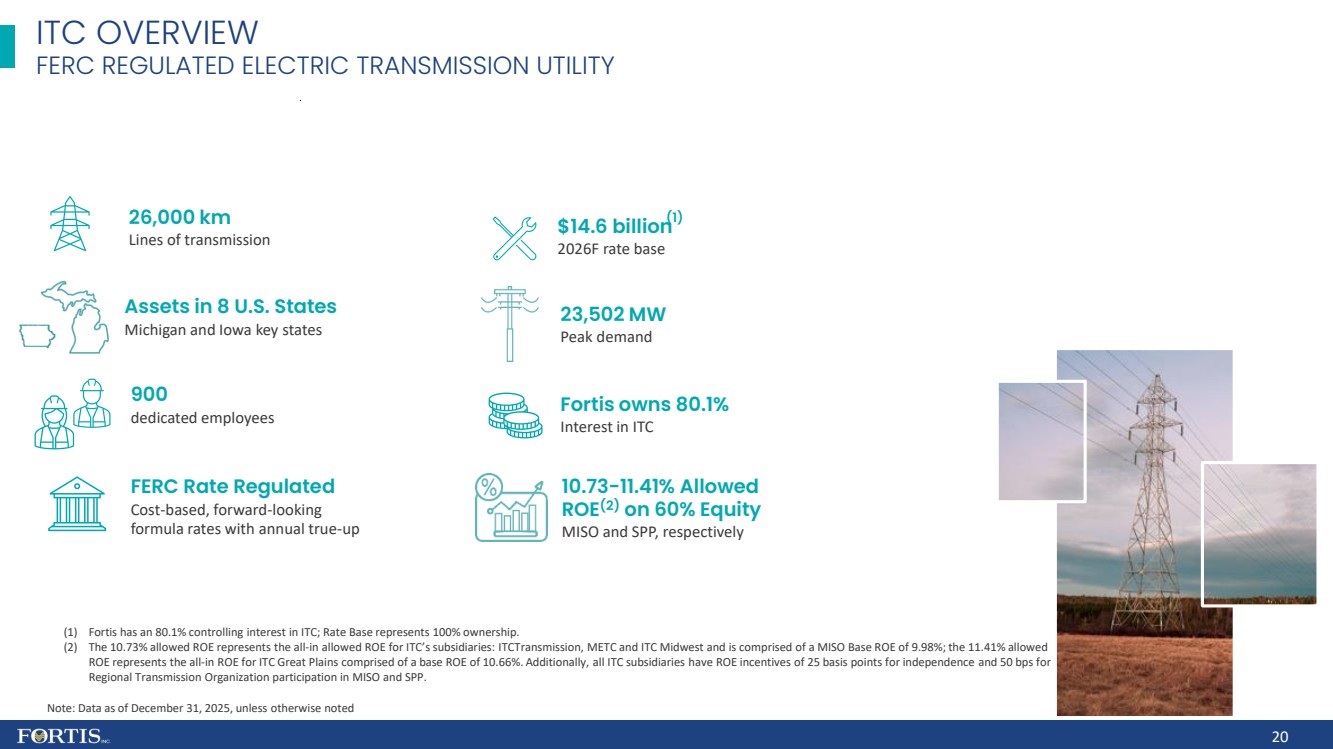
20 ITC OVERVIEW FERC REGULATED ELECTRIC TRANSMISSION UTILITY Note: Data as of December 31, 2025, unless otherwise noted 26,000 km Lines of transmission 900 dedicated employees Assets in 8 U.S. States Michigan and Iowa key states FERC Rate Regulated Cost - based, forward - looking formula rates with annual true - up Fortis owns 80.1% Interest in ITC 10.73 - 11.41% Allowed ROE (2) on 60% Equity MISO and SPP, respectively 23,502 MW Peak demand $14.6 billion 2026F rate base (1) (1) Fortis has an 80.1% controlling interest in ITC; Rate Base represents 100% ownership. (2) The 10.73% allowed ROE represents the all - in allowed ROE for ITC’s subsidiaries: ITCTransmission , METC and ITC Midwest and is comprised of a MISO Base ROE of 9.98%; the 11.41% allowed ROE represents the all - in ROE for ITC Great Plains comprised of a base ROE of 10.66%. Additionally, all ITC subsidiaries have ROE incentives of 25 basis points for independence and 50 bps fo r Regional Transmission Organization participation in MISO and SPP.
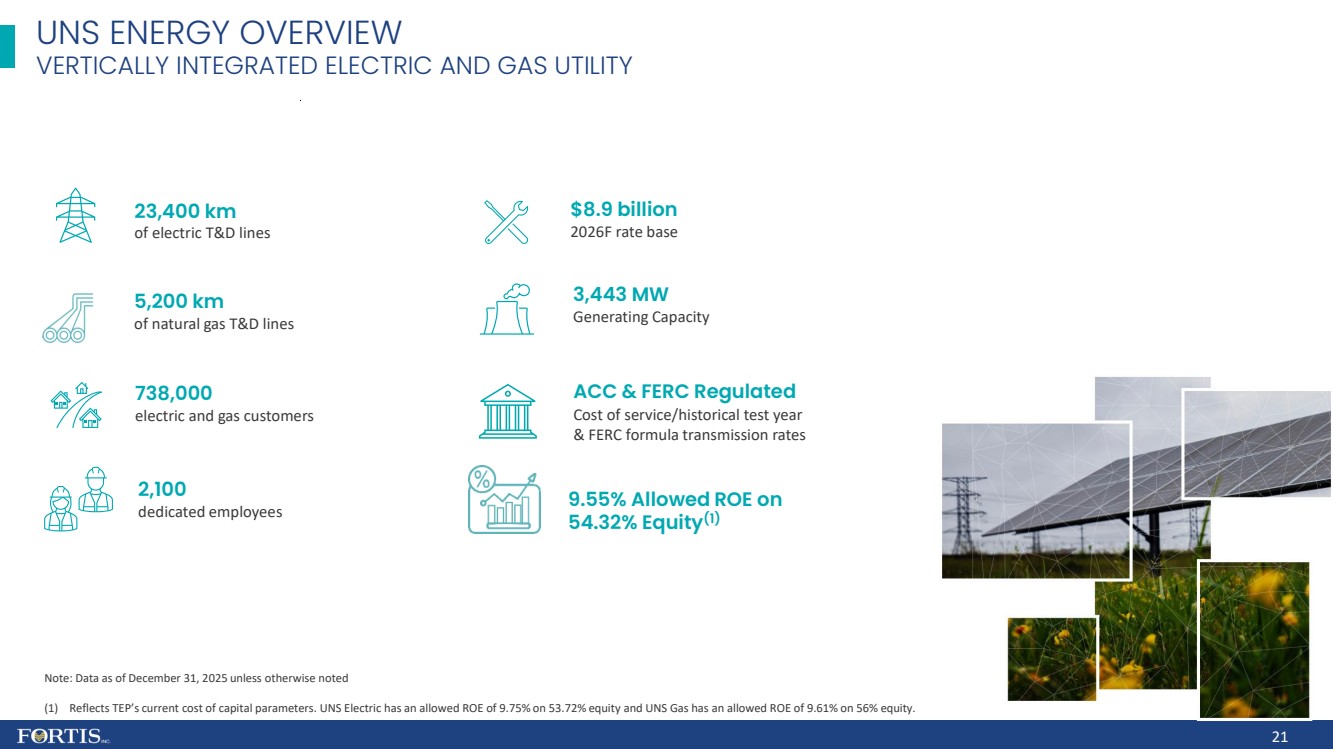
UNS ENERGY OVERVIEW VERTICALLY INTEGRATED ELECTRIC AND GAS UTILITY 21 738,000 electric and gas customers 2,100 dedicated employees 9.55% Allowed ROE on 54.32% Equity (1) 3,443 MW Generating Capacity $8.9 billion 2026F rate base 23,400 km of electric T&D lines 5,200 km of natural gas T&D lines ACC & FERC Regulated Cost of service/historical test year & FERC formula transmission rates Note: Data as of December 31, 2025 unless otherwise noted (1) Reflects TEP’s current cost of capital parameters. UNS Electric has an allowed ROE of 9.75% on 53.72% equity and UNS Gas has an allowed ROE of 9.61% on 56% equity.
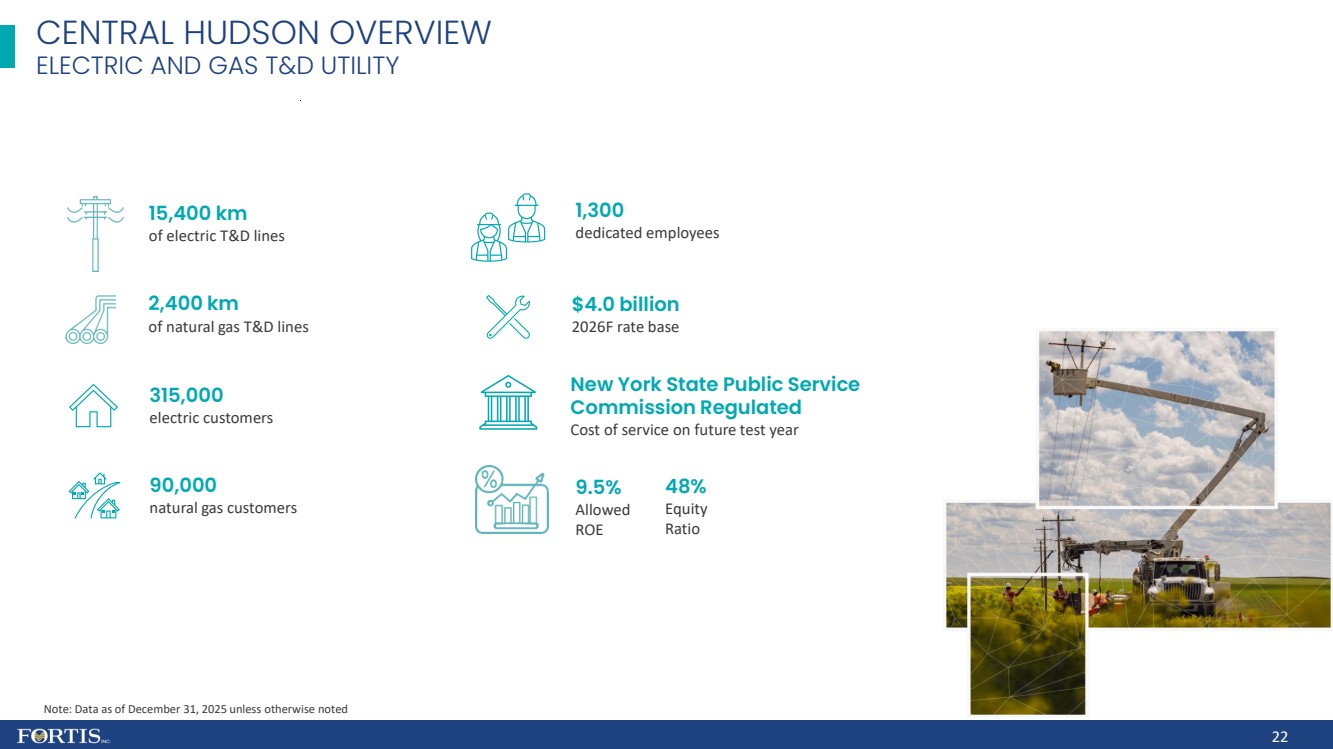
CENTRAL HUDSON OVERVIEW ELECTRIC AND GAS T&D UTILITY 22 Note: Data as of December 31, 2025 unless otherwise noted 315,000 electric customers 1,300 dedicated employees 90,000 natural gas customers $4.0 billion 2026F rate base 15,400 km of electric T&D lines 2,400 km of natural gas T&D lines 48% Equity Ratio 9.5% Allowed ROE New York State Public Service Commission Regulated Cost of service on future test year
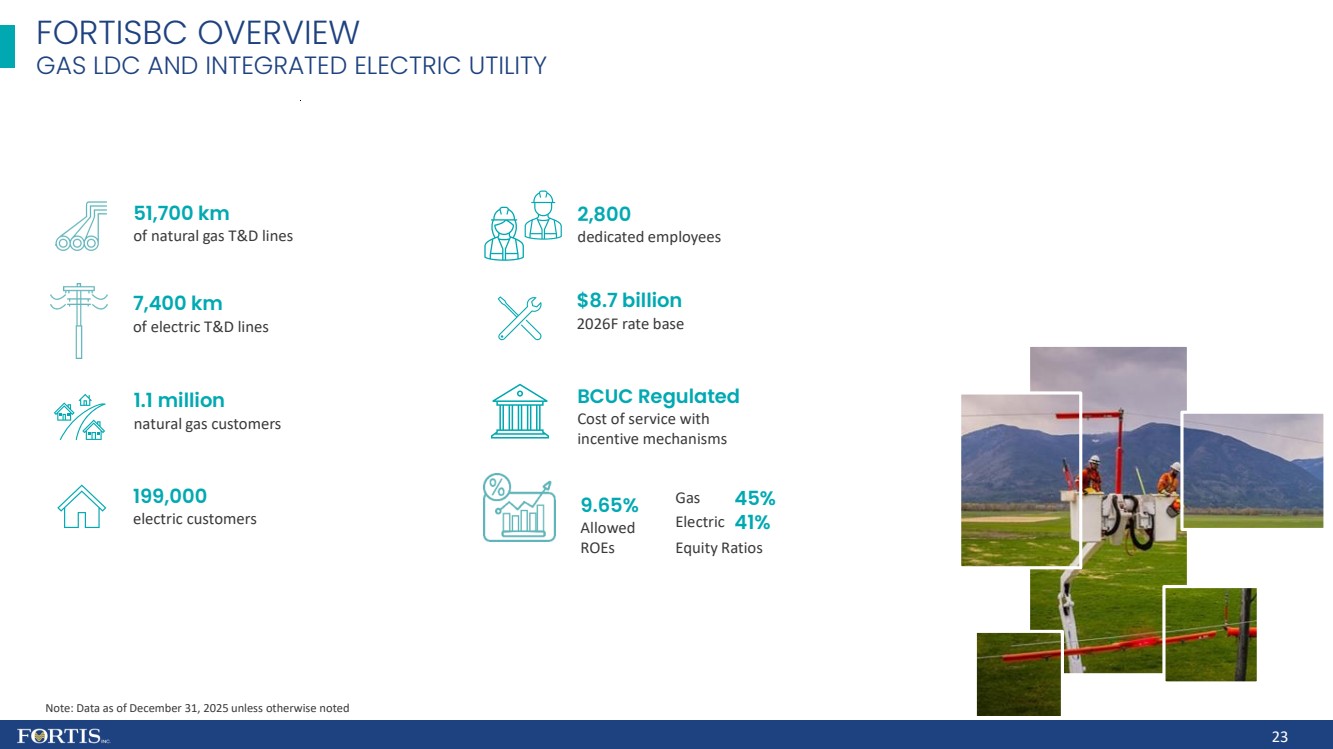
23 FORTISBC OVERVIEW GAS LDC AND INTEGRATED ELECTRIC UTILITY 1.1 million natural gas customers $8.7 billion 2026F rate base 51,700 km of natural gas T&D lines 7,400 km of electric T&D lines BCUC Regulated Cost of service with incentive mechanisms 199,000 electric customers 2,800 dedicated employees 45% 41% 9.65% Allowed ROEs Gas Electric Note: Data as of December 31, 2025 unless otherwise noted Equity Ratios
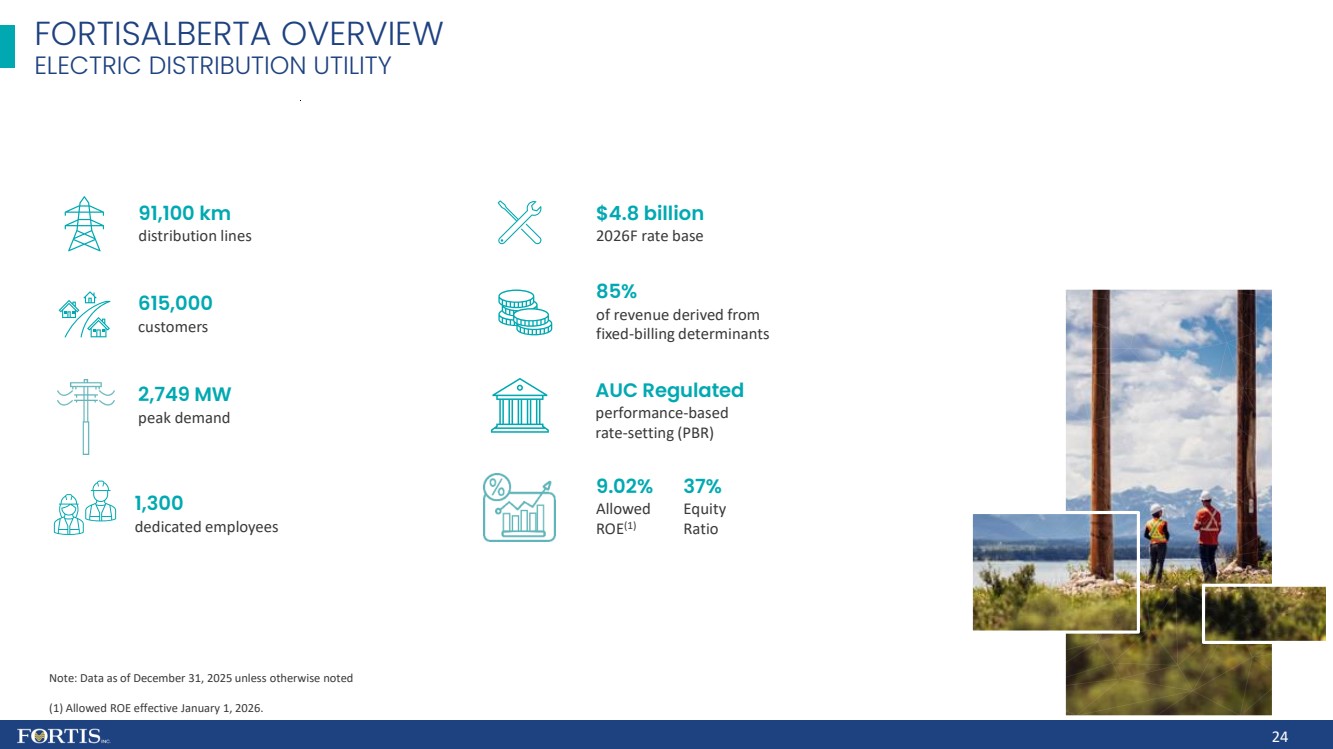
FORTISALBERTA OVERVIEW ELECTRIC DISTRIBUTION UTILITY 1,300 dedicated employees 2,749 MW peak demand $4.8 billion 2026F rate base 91,100 km distribution lines 615,000 customers 85% of revenue derived from fixed - billing determinants AUC Regulated performance - based rate - setting (PBR) 37% Equity Ratio 9.02% Allowed ROE (1) Note: Data as of December 31, 2025 unless otherwise noted (1) Allowed ROE effective January 1, 2026. 24
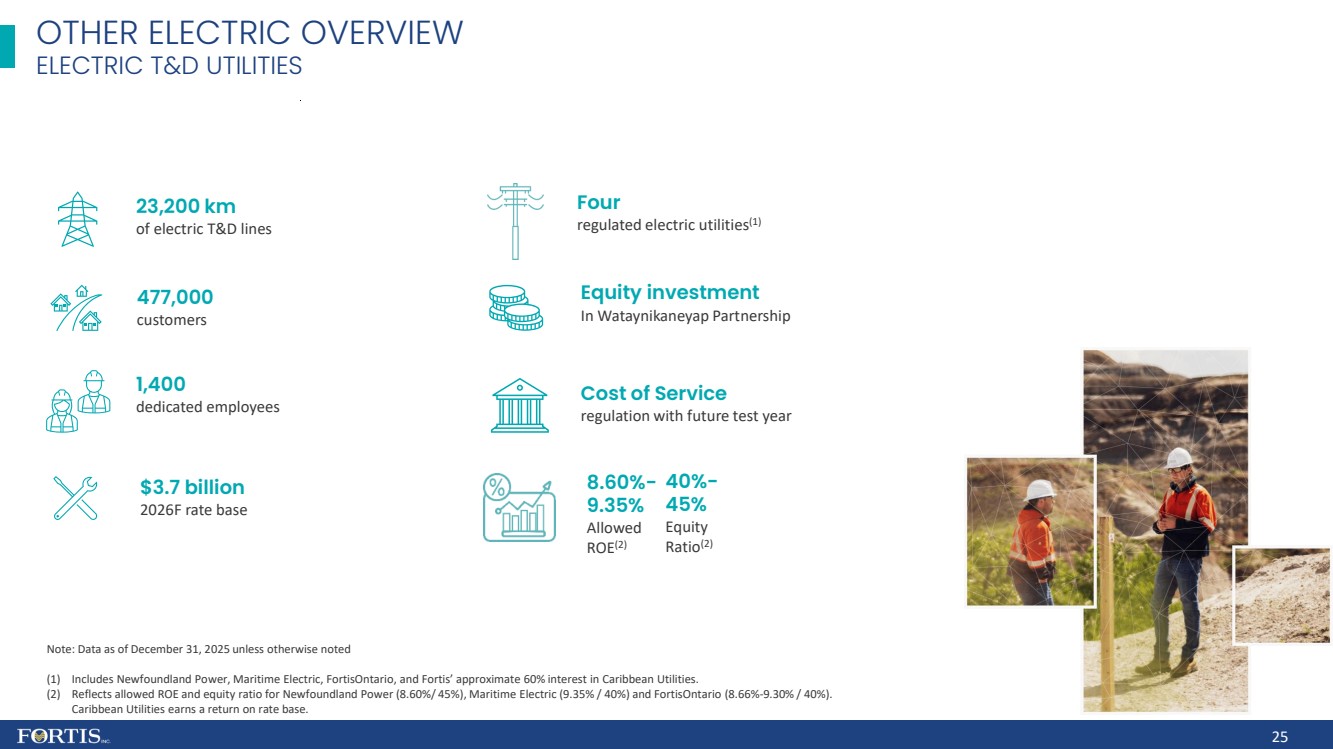
OTHER ELECTRIC OVERVIEW ELECTRIC T&D UTILITIES 1,400 dedicated employees $3.7 billion 2026F rate base 23,200 km of electric T&D lines 477,000 customers Cost of Service regulation with future test year Note: Data as of December 31, 2025 unless otherwise noted (1) Includes Newfoundland Power, Maritime Electric, FortisOntario , and Fortis’ approximate 60% interest in Caribbean Utilities. (2) Reflects allowed ROE and equity ratio for Newfoundland Power (8.60%/ 45%), Maritime Electric (9.35% / 40%) and FortisOntario (8. 66% - 9.30% / 40%). Caribbean Utilities earns a return on rate base. Four regulated electric utilities (1) 40% - 45% Equity Ratio (2) 8.60% - 9.35% Allowed ROE (2) Equity investment In Wataynikaneyap Partnership 25
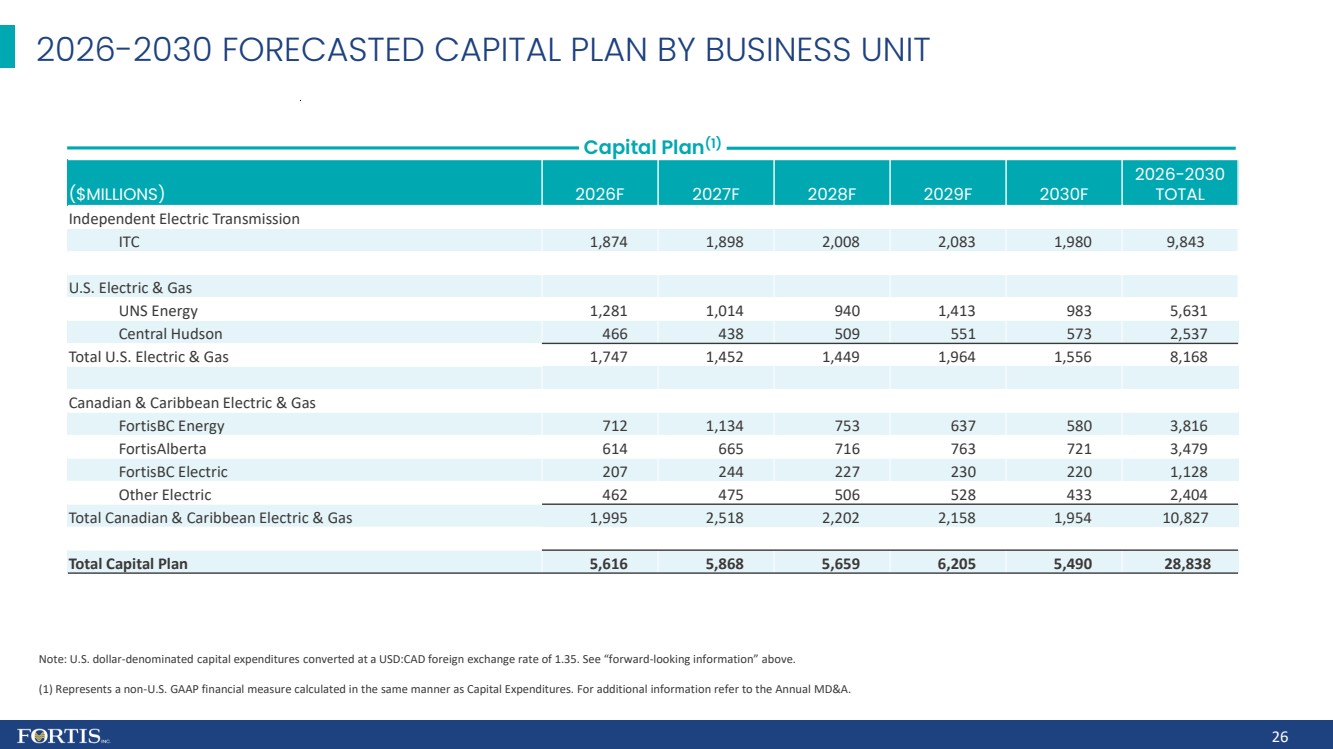
26 2026 - 2030 FORECASTED CAPITAL PLAN BY BUSINESS UNIT Capital Plan (1) 2026 - 2030 TOTAL 2030F 2029F 2028F 2027F 2026F ($MILLIONS) Independent Electric Transmission 9,843 1,980 2,083 2,008 1,898 1,874 ITC U.S. Electric & Gas 5,631 983 1,413 940 1,014 1,281 UNS Energy 2,537 573 551 509 438 466 Central Hudson 8,168 1,556 1,964 1,449 1,452 1,747 Total U.S. Electric & Gas Canadian & Caribbean Electric & Gas 3,816 580 637 753 1,134 712 FortisBC Energy 3,479 721 763 716 665 614 FortisAlberta 1,128 220 230 227 244 207 FortisBC Electric 2,404 433 528 506 475 462 Other Electric 10,827 1,954 2,158 2,202 2,518 1,995 Total Canadian & Caribbean Electric & Gas 28,838 5,490 6,205 5,659 5,868 5,616 Total Capital Plan Note: U.S. dollar - denominated capital expenditures converted at a USD:CAD foreign exchange rate of 1.35. See “forward - looking information” above. (1) Represents a non - U.S. GAAP financial measure calculated in the same manner as Capital Expenditures. For additional informati on refer to the Annual MD&A.
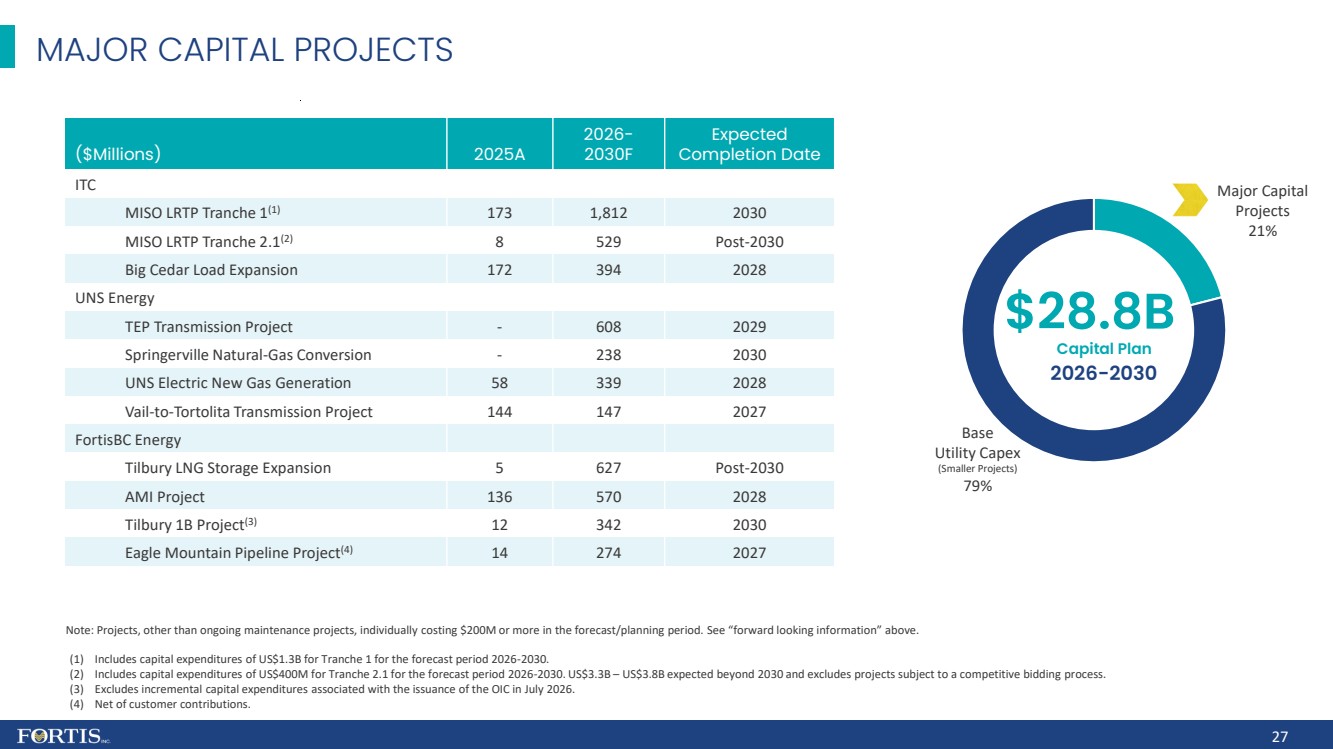
27 MAJOR CAPITAL PROJECTS Note: Projects, other than ongoing maintenance projects, individually costing $200M or more in the forecast/planning period. See “forward looking information” above. Major Capital Projects 21% Base Utility Capex (Smaller Projects) 79% $28.8B Capital Plan 2026 - 2030 (1) Includes capital expenditures of US$1.3B for Tranche 1 for the forecast period 2026 - 2030. (2) Includes capital expenditures of US$400M for Tranche 2.1 for the forecast period 2026 - 2030. US$3.3B – US$3.8B expected beyond 20 30 and excludes projects subject to a competitive bidding process. (3) Excludes incremental capital expenditures associated with the issuance of the OIC in July 2026. (4) Net of customer contributions. Expected Completion Date 2026 - 2030F 2025A ($Millions) ITC 2030 1,812 173 MISO LRTP Tranche 1 (1) Post - 2030 529 8 MISO LRTP Tranche 2.1 (2) 2028 394 172 Big Cedar Load Expansion UNS Energy 2029 608 - TEP Transmission Project 2030 238 - Springerville Natural - Gas Conversion 2028 339 58 UNS Electric New Gas Generation 2027 147 144 Vail - to - Tortolita Transmission Project FortisBC Energy Post - 2030 627 5 Tilbury LNG Storage Expansion 2028 570 136 AMI Project 2030 342 12 Tilbury 1B Project (3) 2027 274 14 Eagle Mountain Pipeline Project (4)
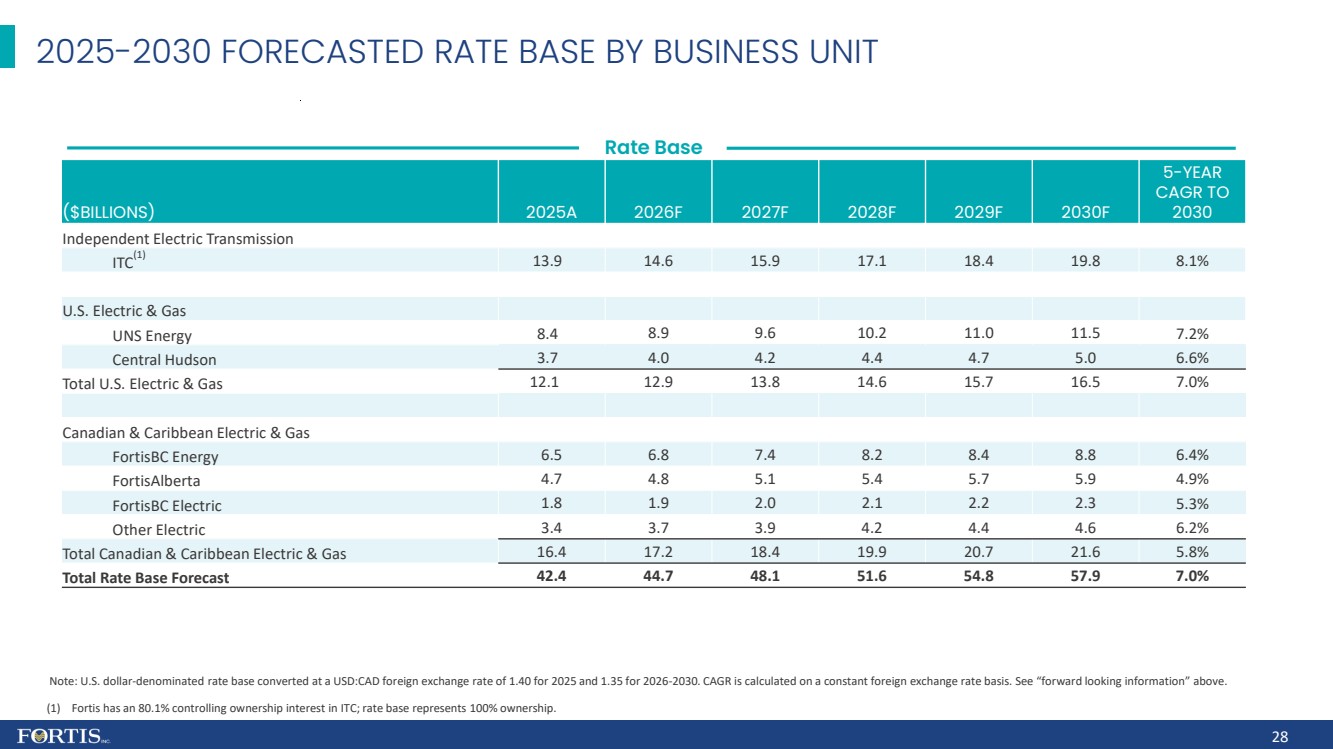
28 2025 - 2030 FORECASTED RATE BASE BY BUSINESS UNIT Rate Base 5 - YEAR CAGR TO 2030 2030F 2029F 2028F 2027F 2026F 2025A ($BILLIONS) Independent Electric Transmission 8.1% 19.8 18.4 17.1 15.9 14.6 13.9 ITC (1) U.S. Electric & Gas 7.2% 11.5 11.0 10.2 9.6 8.9 8.4 UNS Energy 6.6% 5.0 4.7 4.4 4.2 4.0 3.7 Central Hudson 7.0% 16.5 15.7 14.6 13.8 12.9 12.1 Total U.S. Electric & Gas Canadian & Caribbean Electric & Gas 6.4% 8.8 8.4 8.2 7.4 6.8 6.5 FortisBC Energy 4.9% 5.9 5.7 5.4 5.1 4.8 4.7 FortisAlberta 5.3% 2.3 2.2 2.1 2.0 1.9 1.8 FortisBC Electric 6.2% 4.6 4.4 4.2 3.9 3.7 3.4 Other Electric 5.8% 21.6 20.7 19.9 18.4 17.2 16.4 Total Canadian & Caribbean Electric & Gas 7.0% 57.9 54.8 51.6 48.1 44.7 42.4 Total Rate Base Forecast Note: U.S. dollar - denominated rate base converted at a USD:CAD foreign exchange rate of 1.40 for 2025 and 1.35 for 2026 - 2030. CA GR is calculated on a constant foreign exchange rate basis. See “forward looking information” above. (1) Fortis has an 80.1% controlling ownership interest in ITC; rate base represents 100% ownership.
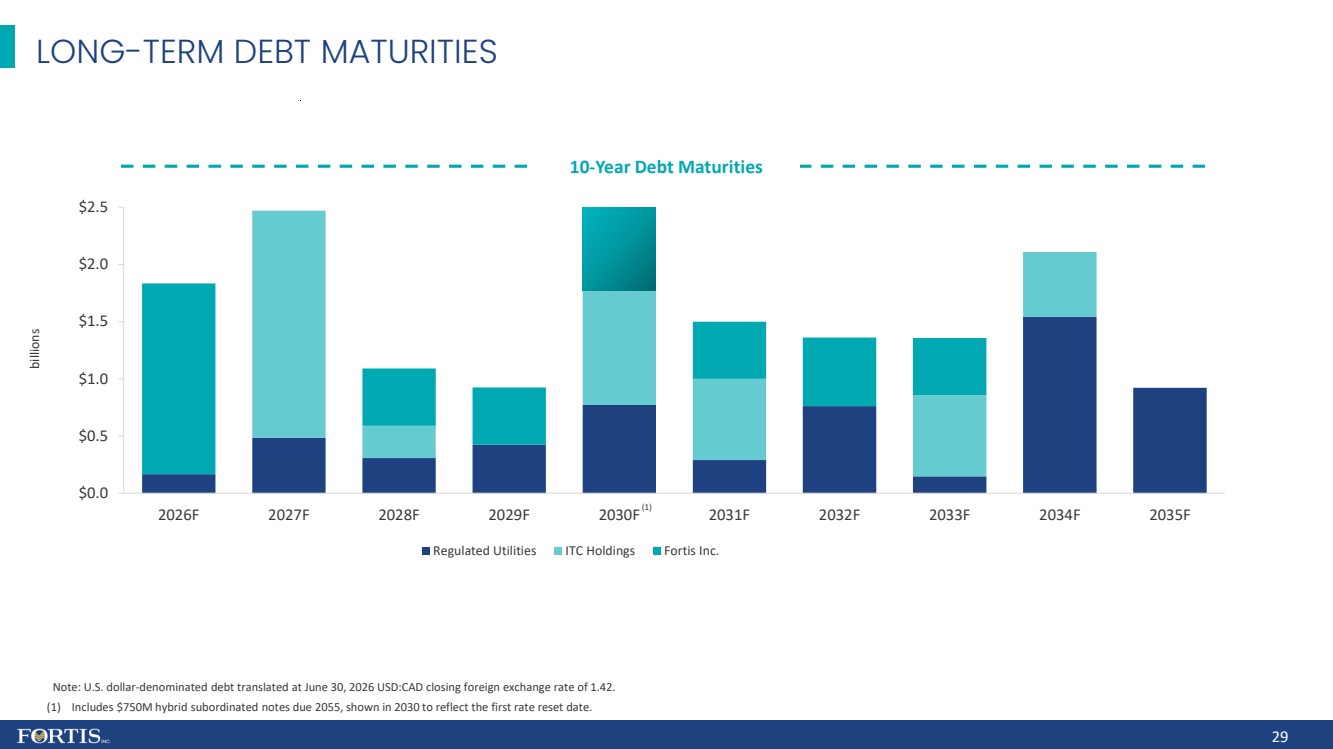
29 $0.0 $0.5 $1.0 $1.5 $2.0 $2.5 2026F 2027F 2028F 2029F 2030F 2031F 2032F 2033F 2034F 2035F Regulated Utilities ITC Holdings Fortis Inc. billions 10 - Year Debt Maturities (1) Includes $750M hybrid subordinated notes due 2055, shown in 2030 to reflect the first rate reset date. Note: U.S. dollar - denominated debt translated at June 30, 2026 USD:CAD closing foreign exchange rate of 1.42. LONG - TERM DEBT MATURITIES (1)
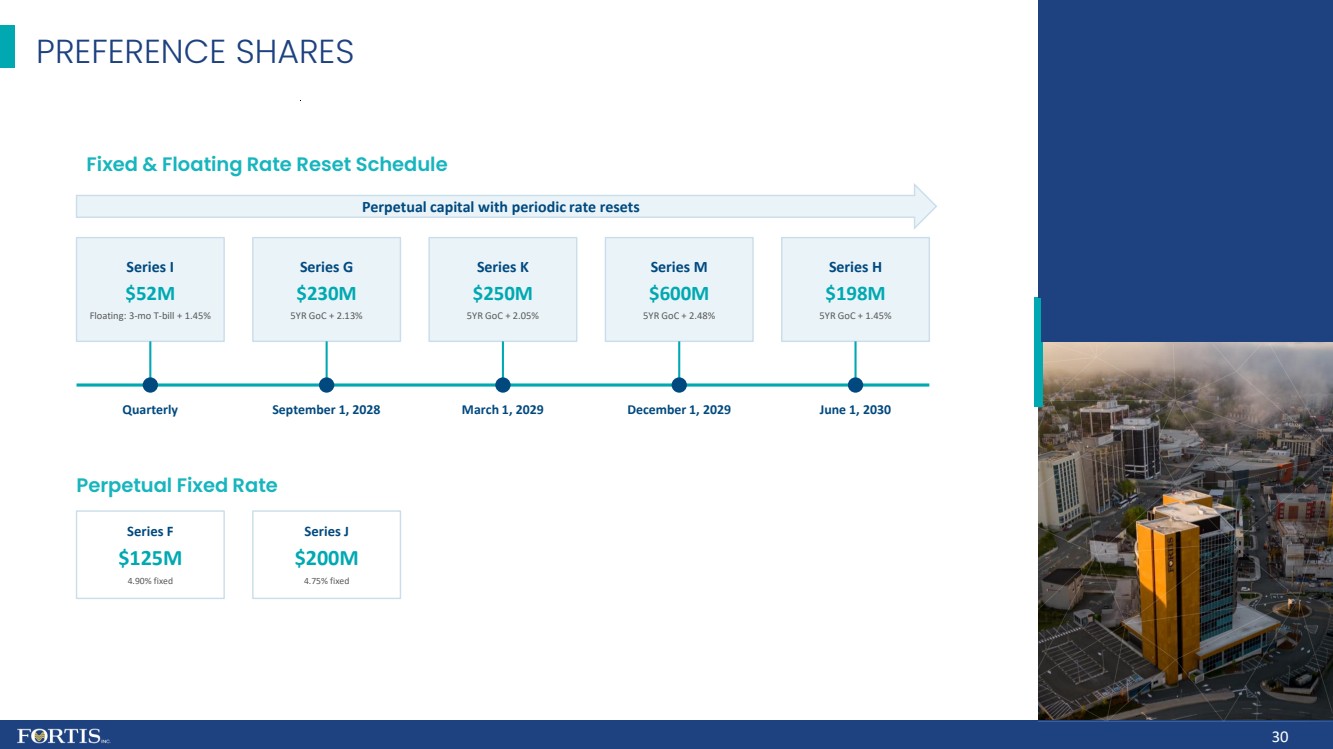
30 Fixed & Floating Rate Reset Schedule Series G $230M 5YR GoC + 2.13% September 1, 2028 Series K $250M 5YR GoC + 2.05% March 1, 2029 Series M $600M 5YR GoC + 2.48% December 1, 2029 Series H $198M 5YR GoC + 1.45% June 1, 2030 Perpetual Fixed Rate Series F $125M 4.90% fixed Series J $200M 4.75% fixed Series I $ 52M Floating: 3 - mo T - bill + 1.45% Quarterly PREFERENCE SHARES Perpetual capital with periodic rate resets
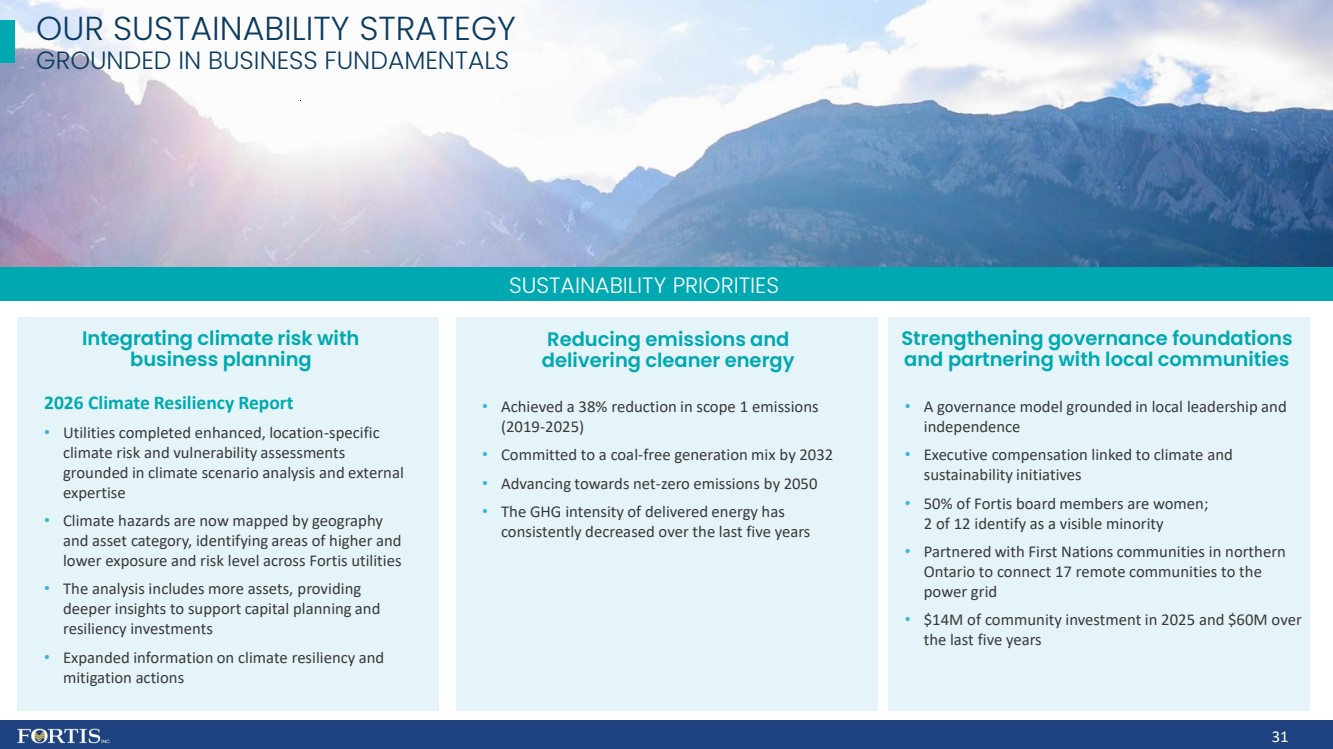
31 OUR SUSTAINABILITY STRATEGY GROUNDED IN BUSINESS FUNDAMENTALS SUSTAINABILITY PRIORITIES Integrating climate risk with business planning Reducing emissions and delivering cleaner energy Strengthening governance foundations and partnering with local communities 2026 Climate Resiliency Report • Utilities completed enhanced, location - specific climate risk and vulnerability assessments grounded in climate scenario analysis and external expertise • Climate hazards are now mapped by geography and asset category, identifying areas of higher and lower exposure and risk level across Fortis utilities • The analysis includes more assets, providing deeper insights to support capital planning and resiliency investments • Expanded information on climate resiliency and mitigation actions • Achieved a 38% reduction in scope 1 emissions (2019 - 2025) • Committed to a coal - free generation mix by 2032 • Advancing towards net - zero emissions by 2050 • The GHG intensity of delivered energy has consistently decreased over the last five years • A governance model grounded in local leadership and independence • Executive compensation linked to climate and sustainability initiatives • 50% of Fortis board members are women; 2 of 12 identify as a visible minority • Partnered with First Nations communities in northern Ontario to connect 17 remote communities to the power grid • $14M of community investment in 2025 and $60M over the last five years
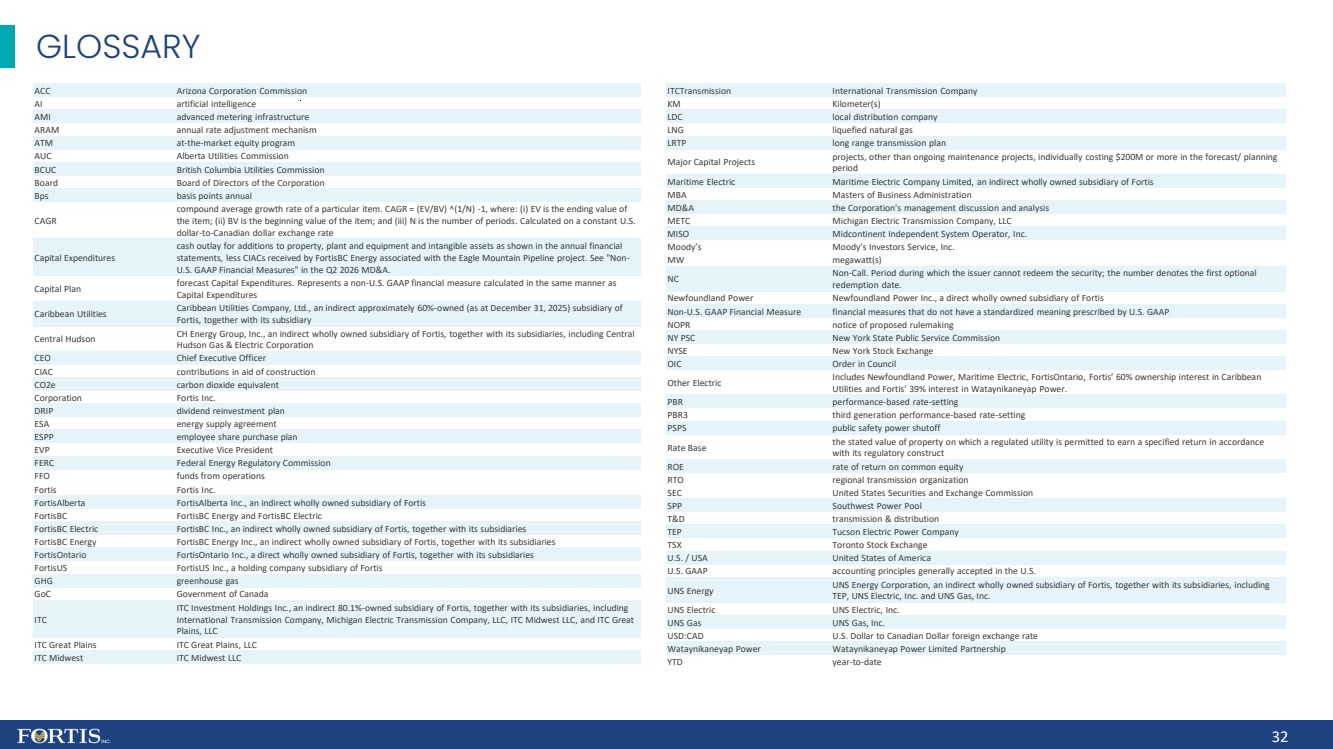
GLOSSARY 32 Arizona Corporation Commission ACC artificial intelligence AI advanced metering infrastructure AMI annual rate adjustment mechanism ARAM at - the - market equity program ATM Alberta Utilities Commission AUC British Columbia Utilities Commission BCUC Board of Directors of the Corporation Board basis points annual Bps compound average growth rate of a particular item. CAGR = (EV/BV) ^(1/N) - 1, where: (i) EV is the ending value of the item; (ii) BV is the beginning value of the item; and (iii) N is the number of periods. Calculated on a constant U.S. dollar - to - Canadian dollar exchange rate CAGR cash outlay for additions to property, plant and equipment and intangible assets as shown in the annual financial statements, less CIACs received by FortisBC Energy associated with the Eagle Mountain Pipeline project. See "Non - U.S. GAAP Financial Measures" in the Q2 2026 MD&A. Capital Expenditures forecast Capital Expenditures. Represents a non - U.S. GAAP financial measure calculated in the same manner as Capital Expenditures Capital Plan Caribbean Utilities Company, Ltd., an indirect approximately 60% - owned (as at December 31, 2025) subsidiary of Fortis, together with its subsidiary Caribbean Utilities CH Energy Group, Inc., an indirect wholly owned subsidiary of Fortis, together with its subsidiaries, including Central Hudson Gas & Electric Corporation Central Hudson Chief Executive Officer CEO contributions in aid of construction CIAC carbon dioxide equivalent CO2e Fortis Inc. Corporation dividend reinvestment plan DRIP energy supply agreement ESA employee share purchase plan ESPP Executive Vice President EVP Federal Energy Regulatory Commission FERC funds from operations FFO Fortis Inc. Fortis FortisAlberta Inc., an indirect wholly owned subsidiary of Fortis FortisAlberta FortisBC Energy and FortisBC Electric FortisBC FortisBC Inc., an indirect wholly owned subsidiary of Fortis, together with its subsidiaries FortisBC Electric FortisBC Energy Inc., an indirect wholly owned subsidiary of Fortis, together with its subsidiaries FortisBC Energy FortisOntario Inc., a direct wholly owned subsidiary of Fortis, together with its subsidiaries FortisOntario FortisUS Inc., a holding company subsidiary of Fortis FortisUS greenhouse gas GHG Government of Canada GoC ITC Investment Holdings Inc., an indirect 80.1% - owned subsidiary of Fortis, together with its subsidiaries, including International Transmission Company, Michigan Electric Transmission Company, LLC, ITC Midwest LLC, and ITC Great Plains, LLC ITC ITC Great Plains, LLC ITC Great Plains ITC Midwest LLC ITC Midwest International Transmission Company ITCTransmission Kilometer(s) KM local distribution company LDC liquefied natural gas LNG long range transmission plan LRTP projects, other than ongoing maintenance projects, individually costing $200M or more in the forecast/ planning period Major Capital Projects Maritime Electric Company Limited, an indirect wholly owned subsidiary of Fortis Maritime Electric Masters of Business Administration MBA the Corporation's management discussion and analysis MD&A Michigan Electric Transmission Company, LLC METC Midcontinent Independent System Operator, Inc. MISO Moody’s Investors Service, Inc. Moody’s megawatt(s) MW Non - Call. Period during which the issuer cannot redeem the security; the number denotes the first optional redemption date. NC Newfoundland Power Inc., a direct wholly owned subsidiary of Fortis Newfoundland Power financial measures that do not have a standardized meaning prescribed by U.S. GAAP Non - U.S. GAAP Financial Measure notice of proposed rulemaking NOPR New York State Public Service Commission NY PSC New York Stock Exchange NYSE Order in Council OIC Includes Newfoundland Power, Maritime Electric, FortisOntario , Fortis’ 60% ownership interest in Caribbean Utilities and Fortis’ 39% interest in Wataynikaneyap Power. Other Electric performance - based rate - setting PBR third generation performance - based rate - setting PBR3 public safety power shutoff PSPS the stated value of property on which a regulated utility is permitted to earn a specified return in accordance with its regulatory construct Rate Base rate of return on common equity ROE regional transmission organization RTO United States Securities and Exchange Commission SEC Southwest Power Pool SPP transmission & distribution T&D Tucson Electric Power Company TEP Toronto Stock Exchange TSX United States of America U.S. / USA accounting principles generally accepted in the U.S. U.S. GAAP UNS Energy Corporation, an indirect wholly owned subsidiary of Fortis, together with its subsidiaries, including TEP, UNS Electric, Inc. and UNS Gas, Inc. UNS Energy UNS Electric, Inc. UNS Electric UNS Gas, Inc. UNS Gas U.S. Dollar to Canadian Dollar foreign exchange rate USD:CAD Wataynikaneyap Power Limited Partnership Wataynikaneyap Power year - to - date YTD