Exhibit 99.2
OPERATING AND FINANCIAL REVIEW AND PROSPECTS
You should read the following discussion and analysis of results of operations, financial condition and prospects of Freightos Limited (referred to as “Freightos”, “the Company”, “our company”, “we”, “us” and similar terms) together with (i) our interim unaudited consolidated financial statements for the six months ended June 30, 2026, included as Exhibit 99.1 to the Report of Foreign Private Issuer on Form 6-K to which this Operating and Financial Review and Prospects is attached (the “Report”), and (ii) our audited consolidated financial statements and the related notes for the year ended December 31, 2025 appearing in our Annual Report on Form 20-F for the year ended December 31, 2025, filed with the Securities and Exchange Commission (the “SEC”) on March 26, 2026 (our “Annual Report”) and “Item 5— Operating and Financial Review and Prospects” of that Annual Report. This discussion contains forward-looking statements that reflect our plans, estimates and beliefs that involve risks and uncertainties. As a result of many factors, such as those set forth under “Item 3.D Risk Factors” and “Cautionary Note Regarding Forward-Looking Statements” sections of our Annual Report, our actual results may differ materially from those anticipated in these forward-looking statements.
Overview
Our mission is to expand trade among the people of the world and make global trade more efficient by streamlining air, ocean and ground shipments across carriers, freight forwarders, importers and exporters on the world’s digital freight pricing, procurement and booking platform, reducing the friction that plagues global supply chains.
Under our ONE Freightos framework, we offer our Software as a Service (“SaaS”) tools that provide a comprehensive suite of freight rate management, freight quoting and freight booking solutions for freight forwarders, as well as freight procurement and market intelligence solutions used by both enterprise shippers (“BCOs”) as well as freight forwarders and carriers. These solutions are embedded into the daily workflows of our customers, and we believe we can achieve sustainable revenue growth, with platform bookings following naturally.
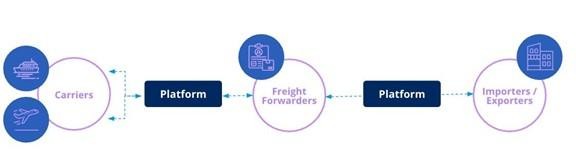
These solutions support our leading, vendor-neutral global freight booking and payments platforms (collectively, the “Platform”) that connect freight forwarders to carriers, and importers/exporters to logistics service providers.
Despite its size and importance, global freight has not yet undergone a comprehensive digital transformation. Unlike passenger travel, hotels and retail, cross-border freight services remain largely offline, opaque and inefficient. Most international air and ocean shipments involve multiple intermediaries, often with as many as 30 actors and 100 people, communicating across time zones. These manual processes, replicated hundreds of thousands of times each day, typically result in delays, extra expenses, non-binding and inconsistent pricing, and uncertain transit times. Even on major trade lanes, such as Asia to the United States, our research shows that it is common for importers and exporters to wait several days for a spot price quote, and prices often vary by tens of percentage points. Actual prices and transit times are not guaranteed and are unpredictable, impairing supply chain planning.
The consequences of this dysfunction flow through international freight, supply chains and, ultimately, businesses and consumers everywhere. As a result, consumers pay more for goods, businesses experience reduced margins, and goods remain under or overstocked. The environment also suffers from this lack of efficiency; according to the International Air Transport Association, air cargo holds, for example, are typically about 50% unutilized, doubling greenhouse gas emissions per unit weight.
These challenges are exacerbated by ongoing and persistent supply chain disruptions, making global freight pricing more volatile than most stock and commodity markets. Without digitalization, supply chains are unable to respond to stressors in an agile and cost-effective manner. As a result, supply chains have struggled to adjust in an agile and cost-effective manner to stresses, such as wars, pandemics, weather problems, strikes, blockages of trade routes, such as the closure of the Strait of Hormuz, and trade wars.
Our strategy for 2026 is focused on our freight pricing and procurement solutions, including multimodal solutions (air and ocean) as well as both spot and contract via our procurement tools, embedding our software tools into the daily workflows of our customers, whether forwarders, carriers or BCOs. We believe that when our software is integral to customer operations, platform bookings follow naturally, as validated in our success in converting our air rate management solution success into growth in air cargo bookings. Long-term, we view our SaaS offerings as the critical enabler for our Platform.
Our Platform business is measured by metrics like #Transactions and GBV, the latter of which represents the value of transactions consummated between importers/exporters or freight forwarders that purchase services (“Buyers”) and carriers or freight forwarders that are sellers of services (“Sellers”) on our Platform. GBV is primarily a trailing indicator of the adoption of our products and services. Our GBV has continuously risen on an annual basis, growing from $671.7 million to $894.0 million to $1.286 billion in the years ended December 31, 2023, 2024 and 2025, respectively. For the six months ended June 30, 2026, our GBV rose to $422 million, compared to $317 million during the six-months ended June 30, 2025, reflecting both continued growth in transaction volumes and the sustained elevation of average air freight rates.
Our Business Model
Our Platform is a three-sided marketplace, digitally connecting freight carriers (primarily airlines, and also ocean liners and trucking companies), freight forwarders and other logistics service providers and importers/exporters. The platform participants, for the most part, leverage our software solutions for both internal pricing or procurement automation and in order to interact with other industry players. As more market participants use our Platform, we are able to drive increased efficiencies throughout the highly-fragmented international freight industry.
We derive most of our revenue from (1) transaction fees and service fees through our Platform segment and (2) subscriptions and professional service fees through our Solutions segment, which includes SaaS solutions as well as data offerings such as price indexes. The majority of our revenue is generated from our Solutions segment. As per our strategy, we anticipate that long term, increased usage by forwarders and BCOs of our solutions will drive marketplace growth dynamics and increased monetization across a growing suite of features.
Platform Growth Dynamics
Currently, our primary business objective is shifting from direct attempts to scale booking #Transactions on our Platform to support more sustainable growth in our solutions which we believe will, as we have shown in air cargo, support long term transaction growth. As our Platform grows and matures, expanding across more regions, carriers and modes, we expect Solutions revenue to increase. As a second-order effect, as we increase value to users with our products and services, we expect Buyers and Sellers will be willing to pay higher fees for our services, so that revenue growth will follow GBV growth after some time lag.
Key processes which we use to grow our Platform are:
| ● | Delivering SaaS tools to help Sellers automate price quotes, which increases the supply that is available online, and tools to help Buyers organize and expand their online procurement. |
| ● | Attracting and retaining Buyers and Sellers, thereby increasing supply and demand, respectively. |
| ● | Enabling online payments that are reconciled automatically with actual shipment bookings. |
| ● | Providing benchmark data to increase transparency and optimize pricing for market participants. |
Segment Reporting
We operate under two segments, Solutions and Platform.
Solutions Segment
In our Solutions segment, we generate revenue through our SaaS offerings, which are typically recurring subscriptions priced per site or user per month, depending on the type of product or based on a negotiated global license. Customers may also purchase additional services or capabilities, such as data ingestion or API integrations, among others. This segment also includes subscriptions to our data products, such as FBX, FAX and custom market pricing data reports, which are priced per unit of time based on the number of users, granularity of data, number of data points and permitted data usage. We also generate some non-recurring revenue, including revenue from professional services such as engineering, customization and setup. SaaS fees are typically collected on a monthly, quarterly or annual basis.
We have been steadily expanding the scope of our Solutions segment over the recent past. One notable change has been to offer a dedicated ocean freight rate management, quoting and booking solution. This has seen initial uptake from enterprise and midmarket forwarders. We have also seen increased demand for our tender procurement and negotiation tool, which supports our long-term effort to extend from spot pricing and booking to annual contract pricing management and, eventually, air and ocean bookings conducted against annually tendered rates.
Platform Segment
In our Platform segment, we generate revenue from facilitating transactions between Buyers and Sellers on our Platform based on flat fees per transaction and/or fees that are a percentage of transaction value. In addition to freight services, certain ancillary services offered by Sellers, such as insurance and customs brokerage, generate additional revenue. These services often have higher margins than freight services allowing us to generate a higher fee for introducing Buyers. In certain Platform transactions, with respect to U.S. and Canadian customs brokerage transactions only, a Freightos company is the Seller, while in all other cases the Seller is a third party. Buyers typically pay for access to, and the ability to compare, prices, shipping options and historical performance across multiple Sellers. Our services save Buyers time and money with instant freight quoting, convenient online payments through our payment processing partners, and online booking and management tools.
Our Platform revenue has evolved as our Platform grows and matures. In certain cases, Sellers may utilize our Platform without charge for a period of time or benefit from other special arrangements. Overall, our operational Platform revenue take rate ranges from zero to approximately 10% of booking value, with an average of approximately 1% during the six months ended June 30, 2026.
Key Financial and Operating Metrics
Solutions Segment
We do not currently utilize supplemental key performance indicators for our Solutions segment, as we believe revenue provides a good indication of this segment’s performance.
Platform Segment
For our Platform segment, which is effectively a marketplace, we believe that certain KPIs are important to help understand our business. We monitor the key performance indicators (KPIs) listed in the table below to evaluate our Platform business, measure our performance, identify trends and make strategic decisions.
| | | | | | | | | | | | | | | | | | | | | | | | |
| | Q3 2024 | | Q4 2024 | | Q1 2025 | | Q2 2025 | | Q3 2025 | | Q4 2025 | | Q1 2026 | | Q2 2026 | ||||||||
#Transactions | | | 339,060 | | | 350,383 | | | 370,900 | | | 397,111 | | | 429,306 | | | 445,259 | | | 425,402 | | | 457,546 |
GBV (in thousands) | | $ | 217,541 | | $ | 280,696 | | $ | 276,084 | | $ | 316,820 | | $ | 335,569 | | $ | 357,322 | | $ | 343,315 | | $ | 422,459 |
#Unique Buyer Users | | | 19,749 | | | 20,131 | | | 19,708 | | | 20,191 | | | 20,618 | | | 20,704 | | | 20,630 | | | 21,016 |
#Carriers | | | 55 | | | 67 | | | 71 | | | 75 | | | 77 | | | 77 | | | 79 | | | 75 |
#Transactions
#Transactions represents the number of bookings for freight services, and related services, placed by Buyers across our Platform with third-party Sellers and with Clearit, net of cancellations. Sellers in Transactions include carriers (airlines, ocean liners and less-than-container load (LCL) consolidators) and also other providers of freight services such as trucking companies, freight forwarders, general sales agents, and air master loaders. Transactions booked on white label portals hosted by Freightos are included if a transactional fee applies.
Gross Booking Value
GBV represents the total monetary value of freight and related services contracted between Buyers and Sellers on our Platform, including related fees charged to Buyers and Sellers and pass-through payments such as duties, converted to U.S. dollars at transaction time.
#Unique Buyer Users
#Unique Buyer Users represents the number of unique individual user logins placing bookings during the period. The number of Buyers, which counts unique customer businesses, does not reflect the fact that some Buyers are large multinational organizations while others are small or midsize businesses. Therefore, we find it more useful to monitor #Unique Buyer Users than the number of Buyer businesses.
#Carriers
#Carriers represents the number of unique air carriers that have acted as sellers in Transactions, counted only when more than five bookings were placed with the carrier over the course of a quarter.
Key Factors Affecting Our Performance
We believe our performance and future success depend on several factors, including those discussed below and in “Item 3.D. Risk Factors” of our Annual Report. The core driver of our growth is global freight pricing and procurement digitalization by carriers, global forwarders and shippers. As more customers digitalize their technology stacks, including rate management, quoting, tendering and booking across air and ocean freight, it drives more Solutions usage and Platform usage.
Carrier Digitalization
Our Platform is highly dependent on the availability of direct digital connections, known as application programming interfaces (“APIs”), to carriers, which enable instant binding price quotes and bookings.
While our Platform provides some offline capabilities, revenue and transaction growth depend significantly on the continued digitalization of carriers.
Transaction Growth Strategy
Our primary transactional growth strategy is to leverage the usage of our multimodal software solutions to become embedded in our customers’ daily workflows for rate management, quoting, procurement and pricing. Under our ONE Freightos initiative, as we unify our product suite across air, ocean, and land modes and expand direct carrier connections, we expect continued long-term growth in Transactions. Going forward our execution focus is sharply targeted on converting our growing SaaS pipeline into recurring revenue and bookings to drive this flywheel.
We believe our market opportunity is immense, and we will continue to invest in scaling our technology in order to enhance our growth prospects. We intend to maintain a responsible expenditure strategy, limiting spending while maintaining high gross profit margins, with the goal to achieve positive free cash flow with the cash reserves on hand.
The success of our efforts to enhance our long-term Transaction potential may be impacted by our competition. For additional information, see “Item 4.B. Information on the Company - Business Overview - Competition” in our Annual Report.
Global Disruptions
Geopolitical events and supply chain disruptions can have a mixed impact on our platform.
Disruptions often drive up freight rates, and higher freight rates may increase GBV. Diversions away from the Red Sea, for example, quickly absorbed a significant share of global container shipping capacity and drove up prices globally. The closure of the Strait of Hormuz has increased fuel costs and driven up ocean rates. The closure has also caused an early and concentrated ocean freight peak season, which pushed container rates even higher.
For air cargo, higher fuel costs have also meant significantly elevated air cargo rates, and the disruption to capacity due to airspace closures and carriers avoiding the Middle East has also put upward pressure on prices for air shipments.
Disruptions can also sometimes spur digital adoption, in an effort by logistics stakeholders to be able to appreciate market changes more quickly, access rapidly changing rates, find scarce capacity, and react more quickly and efficiently during volatile times.
On the other hand, disruptions also may decrease transactions on the Platform, especially for price sensitive importers/exporters, particularly SMBs. Similarly, if new trade barriers were to reduce volumes on certain lanes, that reduction could be reflected in transactions as well. Likewise, disruptions can negatively impact the overall Buyer experience on our Platform, even if beyond our control.
Seasonality
Freight markets are seasonal, with ocean freight peak season typically running from July through September or October and a short high-volume period in the weeks just before Lunar New Year. Air cargo peak season normally starts in late October or November and lasts until mid-December.
Components of Our Results of Operations
Revenue
Solutions Revenue
Solutions revenue is primarily subscription-based SaaS and data. It is typically priced per user or per site, per time period. Revenue from our Solutions segment includes certain non-recurring revenue from services ancillary to our SaaS products, such as engineering, customization, configuration and data services for digitizing offline data. We also recognize revenue from data subscriptions, including subscriptions to FBX and FAX indexes, and custom data reports.
Platform Revenue
Platform revenue reflects fees charged to Buyers and Sellers in relation to transactions executed on our Platform. For bookings conducted by importers/exporters, our fees are typically structured as a percentage of booking value, depending on the mode and nature of the service. When freight forwarders book with carriers, the Sellers often pay a pre-negotiated flat fee per transaction. When we handle payments for transactions on our Platform, Buyer and Sellers will typically pay a percentage fee for the payment handling.
Clearit customs brokerage fees are reported in our Platform segment. We charge flat fees for customs brokerage through Clearit, depending on the mode and complexity, and may charge additional fees for ancillary services.
Cost of Revenue
Cost of revenue consists primarily of customer service costs, which include salaries of team members directly involved in supporting our service delivery, cloud hosting costs, and direct financial costs, such as credit card processing fees and collection costs.
Research and Development Expenses
Research and development expenses consist primarily of personnel-related costs, third-party hosting costs and third-party software expenses related to development. Research and development costs are expensed as incurred. We make significant investments in research and development to create new product features and launch new products. We believe continued investments in research and development are important to achieve our strategic goals.
Selling and Marketing Expenses
Selling and marketing expenses consist primarily of expenses related to personnel-related costs, including sales commissions and travel, which we expense as incurred, and advertising and marketing activities, including paid digital advertising and trade shows. We make significant investments in sales and marketing to grow our business, including finding and acquiring new clients and driving brand awareness.
General and Administrative Expenses
General and administrative expenses consist primarily of personnel-related expenses attributable to our finance, legal, human resources and support functions. General and administrative expenses also include costs related to outside consulting, legal and accounting services, rent and insurance, as well as expenses associated with operating as a public company, including investor relations costs, insurance premiums and compliance costs.
Reorganization Expenses
Reorganization expenses consist primarily of expenses related to the operational efficiency and cost reduction restructuring announced in March 2026, including employee severance and other related expenses.
Change in fair value of warrants
Change in fair value of warrants consists of changes in the fair value of the Company’s public warrants that were issued as part of the business combination whereby Freightos became a public company, and are traded under the symbol “CRGOW”.
Finance Income
Finance income consists primarily of interest income on short-term deposits and investments, net foreign exchange rate differences, changes in the fair value of contingent consideration and certain financial liabilities, and hedging income.
Finance Expenses
Finance expenses consist primarily of bank charges, interest expense in respect of our lease liabilities, and hedging expense.
Income Taxes, net
Income taxes consist primarily of income taxes attributable to our subsidiaries in the US, Spain and the Palestinian Authority, which have been profitable in recent years, and, to a limited extent, certain other jurisdictions. Our subsidiaries in Hong Kong, Israel, Luxembourg, and Canada, to a lesser extent, have accumulated significant carry-forward losses for tax purposes in past years, for which we do not recognize deferred tax assets because the utilization of such assets in the foreseeable future is not probable. As we expand our international business activities, any changes in the tax regime of the jurisdictions in which we operate may increase our overall provision for income taxes in the future.
Pursuant to a ruling received by us from the Israeli Tax Authority, we are required to register for tax purposes in Israel and, accordingly, will be treated as an Israeli resident company for Israeli tax purposes. The current corporate tax rate in Israel is 23%. However, the corporate tax rate applicable to a company’s income that is eligible for certain tax benefits under Israeli government programs may be considerably lower. For additional information see “Item 10.E. Additional Information - Certain Material Israeli Tax Considerations” in our Annual Report.
Results of Operations
Six months ended June 30, 2026 compared with six months ended June 30, 2025
The following tables summarize Freightos’ historical results of operations for the six months ended June 30, 2026 and 2025. The data contained in the table has been derived from our interim unaudited consolidated financial statements attached as Exhibit 99.1 to the Report. The operating results for the six-month period ended June 30, 2026 should not be considered indicative of results for the entire year ending December 31, 2026 or for any future period. This information should be read in conjunction with the interim unaudited consolidated financial statements and notes thereto included as Exhibit 99.1 to the Report.
| | Six months ended June 30, | ||||
(dollars in thousands) | | 2026 | | 2025 | ||
Revenue | | $ | 14,847 | | $ | 14,383 |
Cost of revenue | |
| 4,883 | |
| 4,751 |
Gross profit | |
| 9,964 | |
| 9,632 |
Operating expenses: | | | | | | |
Research and development | |
| 5,685 | |
| 5,914 |
Selling and marketing | |
| 6,503 | |
| 7,536 |
General and administrative | |
| 6,061 | |
| 5,377 |
Reorganization | | | 1,488 | | | — |
Total operating expenses | |
| 19,737 | |
| 18,827 |
Operating loss | |
| (9,773) | |
| (9,195) |
Change in fair value of warrants | |
| 1,521 | |
| (508) |
Finance income | |
| 469 | |
| 1,153 |
Finance expenses | |
| (135) | |
| (134) |
Finance income, net | |
| 334 | |
| 1,019 |
Loss before taxes on income | |
| (7,918) | |
| (8,684) |
Income taxes, net | |
| 171 | |
| 93 |
Loss | | $ | (8,089) | | $ | (8,777) |
| | Six months ended June 30, |
| ||
(as % of revenue) | | 2026 | | 2025 |
|
Revenue |
| 100 | % | 100 | % |
Cost of revenue |
| 33 |
| 33 | |
Gross profit |
| 67 |
| 67 | |
Operating expenses: |
| |
| | |
Research and development |
| 38 |
| 41 | |
Selling and marketing |
| 44 |
| 52 | |
General and administrative |
| 41 |
| 37 | |
Reorganization | | 10 | | — | |
Total operating expenses |
| 133 |
| 130 | |
Operating loss |
| (66) |
| (63) | |
Change in fair value of warrants |
| 10 |
| (4) | |
Finance income |
| 3 |
| 8 | |
Finance expenses |
| (1) |
| (1) | |
Finance income, net |
| 2 |
| 7 | |
Loss before taxes on income |
| (53) |
| (60) | |
Income taxes, net |
| 1 |
| 1 | |
Loss |
| (54) | % | (61) | % |
Revenue by Segment
| | Six months ended June 30, | | 2026 vs. 2025 |
| |||||||
(in thousands, except for percentages) | | 2026 | | 2025 | | Change $ | | Change % |
| |||
Solutions | | $ | 9,565 | | $ | 9,627 | | $ | (62) | | (1) | % |
percentage of total revenue | | | 64 | % | | 67 | % | | | | |
|
Platform | | $ | 5,282 | | $ | 4,756 | | $ | 526 |
| 11 | % |
percentage of total revenue | |
| 36 | % |
| 33 | % |
| |
| | |
Total revenue | | $ | 14,847 | | $ | 14,383 | | $ | 464 |
| 3 | % |
Revenue increased by $0.5 million, or 3%, to $14.8 million for the six months ended June 30, 2026, compared to $14.4 million for the six months ended June 30, 2025.
Solutions revenue was essentially even at $9.6 million for the six months ended June 30, 2026, compared to the same period in 2025.
Platform revenue increased by $0.5 million, or 11%, to $5.3 million for the six months ended June 30, 2026, compared to $4.8 million for the six months ended June 30, 2025. The increase was primarily as a result of an increase in #Transactions and higher revenue from customs services.
Cost of Revenue
| | Six months ended June 30, | | | | | |
| ||||
(in thousands, except for percentages) | | 2026 | | 2025 | | Change $ | | Change % | | |||
Cost of revenue | | $ | 4,883 | | $ | 4,751 | | $ | 132 |
| 3 | % |
Total gross margins | |
| 67 | % |
| 67 | % |
| |
| | |
Cost of revenue increased by $0.1 million, or 3%, to $4.9 million for the six months ended June 30, 2026, compared to $4.8 million for the six months ended June 30, 2025. The increase was primarily due to an increase of $0.3 million in labor-related costs, offset in part by a decrease in credit card processing fees of $0.3 million. The increase in labor related cost, as well as some other cost items, included the adverse impact of currency exchange rates on our costs, specifically the average devaluation of the U.S. dollar (“USD”) against the Euro (the “EUR”) and New Israeli Shekel (“ILS”) currencies during the six months ended June 30, 2026.
Research and Development
| | Six months ended June 30, | | | | | |
| ||||
(in thousands, except for percentages) | | 2026 | | 2025 | | Change $ | | Change % | | |||
Research and development | | $ | 5,685 | | $ | 5,914 | | $ | (229) | | (4) | % |
Research and development expenses decreased by $0.2 million, or 4%, to $5.7 million for the six months ended June 30, 2026, compared to $5.9 million for the six months ended June 30, 2025. The decrease was primarily due to a decrease in labor-related expenses of $0.2 million. The decrease was offset in part by the adverse impact of currency exchange rates on our costs, specifically the average devaluation of the USD against the EUR and ILS currencies during the six months ended June 30, 2026.
Selling and Marketing
| | Six months ended June 30, | | | | | |
| ||||
(in thousands, except for percentages) | | 2026 | | 2025 | | Change $ | | Change % | | |||
Selling and marketing | | $ | 6,503 | | $ | 7,536 | | $ | (1,033) | | (14) | % |
Selling and marketing expenses decreased by $1.0 million, or 14%, to $6.5 million for the six months ended June 30, 2026, compared to $7.5 million for the six months ended June 30, 2025. The decrease was primarily due to decreases of $0.3 million in digital advertising, $0.2 million in labor-related expenses, $0.2 million in share-based compensation, $0.1 in software tool costs, and $0.1 million in trade show costs. The decrease was offset in part by the adverse impact of currency exchange rates on our costs, specifically the average devaluation of the USD against the EUR and ILS currencies during the six months ended June 30, 2026.
General and Administrative
| | Six months ended June 30, | | | | | |
| ||||
(in thousands, except for percentages) | | 2026 | | 2025 | | Change $ | | Change % | | |||
General and administrative | | $ | 6,061 | | $ | 5,377 | | $ | 684 |
| 13 | % |
General and administrative expenses increased by $0.7 million, or 13%, to $6.1 million for the six months ended June 30, 2026, compared to $5.4 million for the six months ended June 30, 2025. The increase was primarily due to increases of $0.4 million in share-based compensation, $0.1 million in consulting expenses, and $0.1 million in bad debt expenses. The increase also includes the adverse impact of currency exchange rates on our costs, specifically the average devaluation of the USD against the EUR and ILS currencies during the six months ended June 30, 2026.
Reorganization
| | Six months ended June 30, | | |
| ||||||
(in thousands, except for percentages) | | 2026 | | 2025 | | Change $ | | Change % | | ||
Reorganization | | $ | 1,488 |
| — | | $ | 1,488 |
| 100 | % |
Reorganization expenses were $1.5 million for the six months ended June 30, 2026, consisting primarily of severance payments associated with the workforce reduction announced in March 2026, with no corresponding costs for the six months ended June 30, 2025.
Change in Fair Value of Warrants
| | Six months ended June 30, | | | | | |
| ||||
(in thousands, except for percentages) | | 2026 | | 2025 | | Change $ | | Change % | | |||
Change in fair value of warrants | | $ | 1,521 | | $ | (508) | | $ | 2,029 | | (399) | % |
We recorded a gain from the change in fair value of warrants of $1.5 million for the six months ended June 30, 2026, compared to a loss of $0.5 million for the six months ended June 30, 2025. The $2.0 million variance was due to fluctuations in the market price of the Freightos public warrants as of June 30, 2026 compared to June 30, 2025.
Finance Income
| | Six months ended June 30, | | | | | |
| ||||
(in thousands, except for percentages) | | 2026 | | 2025 | | Change $ | | Change % | | |||
Finance income | | $ | 469 | | $ | 1,153 | | $ | (684) |
| (59) | % |
Finance income decreased by $0.7 million, or 59%, to $0.5 million for the six months ended June 30, 2026, compared to $1.2 million for the six months ended June 30, 2025. The decrease was primarily due to a decrease in interest on bank deposits of $0.4 million and a decrease in income from hedging instruments of $0.2 million.
Finance Expenses
| | Six months ended June 30, | | | | | |
| ||||
(in thousands, except for percentages) | | 2026 | | 2025 | | Change $ | | Change % | | |||
Finance expenses | | $ | (135) | | $ | (134) | | $ | (1) | | 1 | % |
Finance expenses were essentially flat at $0.1 million for the six months ended June 30, 2026, compared to the same period in 2025.
Income Taxes, Net
| | Six months ended June 30, | | | | | |
| ||||
(in thousands, except for percentages) | | 2026 | | 2025 | | Change $ | | Change % | | |||
Income taxes, net | | $ | 171 | | $ | 93 | | $ | 78 |
| 84 | % |
Income taxes, net increased by $0.1 million, or 84%, to $0.2 million for the six months ended June 30, 2026, compared to $0.1 million for the six months ended June 30, 2025. The increase was primarily due to an increase in current tax expenses of $0.1 million.
Non-IFRS Financial Measures
Our management team uses loss before income taxes, finance income, finance expenses, change in fair value of warrants, share-based payment expense, reorganization expenses and depreciation and amortization (“Adjusted EBITDA”), a financial measure that does not conform to International Financial Reporting Standards (“IFRS”), to evaluate our operating performance and make strategic decisions. We believe that Adjusted EBITDA provides useful information to investors and others in understanding and evaluating our operating results because it provides a supplemental measure of our core operating performance and offers consistency and comparability with both past financial performance and with financial information of peer companies.
However, Adjusted EBITDA is presented for supplemental information purposes only, has limitations as an analytical tool, and should not be considered in isolation or as a substitute for financial information presented in accordance with IFRS.
The following table provides a reconciliation of loss to Adjusted EBITDA for the time periods presented:
| | Six Months Ended |
| ||||
| | June 30, |
| ||||
(in thousands, except for percentages) | | 2026 | | 2025 | | ||
Loss | | $ | (8,089) | | $ | (8,777) | |
Income taxes | |
| 171 | |
| 93 | |
Finance income | |
| (469) | |
| (1,153) | |
Finance expenses | |
| 135 | |
| 134 | |
Change in fair value of warrants | |
| (1,521) | |
| 508 | |
Operating loss | | | (9,773) | | | (9,195) | |
Share-based payment expense | |
| 1,733 | |
| 1,508 | |
Depreciation and amortization | |
| 1,685 | |
| 1,744 | |
Reorganization | | $ | 1,488 | | | — | |
Adjusted EBITDA | | $ | (4,867) | | $ | (5,943) | |
Adjusted EBITDA margins | | | (33) | % | | (41) | % |
Loss margin (under IFRS) | | | (54) | % | | (61) | % |
Adjusted EBITDA improved by $1.1 million, or 18%, to $(4.9) million for the six months ended June 30, 2026, compared to $(5.9) million for the six months ended June 30, 2025. Adjusted EBITDA improved primarily due to a decrease in loss, increase in finance income and an increase in reorganization expenses offset in part by the change in the fair value of warrants.
Liquidity and Capital Resources
Since our inception, we have financed our operations primarily through equity financings.
Our cash, cash equivalents and short term bank deposits were $21.4 million as of June 30, 2026, compared to $27.9 million as of December 31, 2025. In addition, we had restricted deposits to secure payments to airlines, support currency hedging activity, and secure bank guarantees and credit cards, amounting to $1.8 million in the aggregate as of each of June 30, 2026 and December 31, 2025.
Our primary uses of liquidity and capital resources are financing research and development, selling and marketing, working capital; , and general corporate purposes. We believe that our sources of liquidity and capital resources will be sufficient to meet our business needs for at least the next 12 months.
Cash Flows
The following table summarizes our cash flows for the periods presented:
| | Six Months Ended June 30, | ||||
(in thousands) | | 2026 | | 2025 | ||
Net cash used in operating activities | | $ | (5,985) | | $ | (2,532) |
Net cash provided by investing activities | |
| 5,991 | |
| 11,944 |
Net cash provided by (used in) financing activities | |
| (226) | |
| 189 |
Exchange differences on balances of cash and cash equivalents | | | 192 | |
| 236 |
Gains (losses) from translation of cash and cash equivalents of foreign activity | | | (8) | | | 26 |
Increase (decrease) in cash and cash equivalents | | $ | (36) | | $ | 9,863 |
Net Cash Used in Operating Activities
Net cash used in operating activities was $6.0 million for the six months ended June 30, 2026, an increase of $3.5 million compared to $2.5 million for the six months ended June 30, 2025. The increase in cash used primarily resulted from unfavorable working capital movements of $2.1 million and an increase in loss after non-cash adjustments, representing a decrease in loss of $0.7 million, which was offset by an increase of $2.0 million in change in fair value of warrants.
Net Cash Provided by Investing Activities
Net cash provided by investing activities was $6.0 million for the six months ended June 30, 2026, a decrease of $6.0 million compared to $11.9 million for the six months ended June 30, 2025. The decrease primarily resulted from an increase in investment in short-term bank deposit of $8.0 million, offset in part by a decrease in withdrawals of short term bank deposits of $2.0 million.
Net Cash Provided by (Used in) Financing Activities
Net cash used in financing activities was $0.2 million for the six months ended June 30, 2026, compared to net cash provided by financing activities of $0.2 million for the six months ended June 30, 2025. The $0.4 million change primarily resulted from lower share option exercise proceeds of $0.3 million.
Contractual Obligations and Other Commitments
We have various contractual obligations and commercial commitments that are recorded as liabilities in our financial statements.
As of June 30, 2026, we had contractual, undiscounted lease liabilities of $2.6 million that will be due in the coming periods in the amounts set forth below:
| | (dollars in thousands) | |
Remainder of 2026 |
| $ | 323 |
2027 |
| | 715 |
2028 |
| | 453 |
2029 |
| | 241 |
2030 and thereafter | | | 824 |
Total | | $ | 2,556 |
Off-Balance Sheet Arrangements
As of June 30, 2026, we had outstanding unfulfilled orders placed with Platform Sellers of approximately $0.4 million (compared to $0.5 million as of December 31, 2025) for which Buyers’ funds were not yet collected and, therefore, no liability was recorded in our financial statements. These amounts will be recorded as liabilities and corresponding receivables once the shipments are delivered.
Recently Issued Accounting Pronouncements
For information on recently issued accounting pronouncements, refer to Note 3 to our audited consolidated financial statements included in our Annual Report.