
INVESTOR PRESENTATION SEPTEMBER 2026
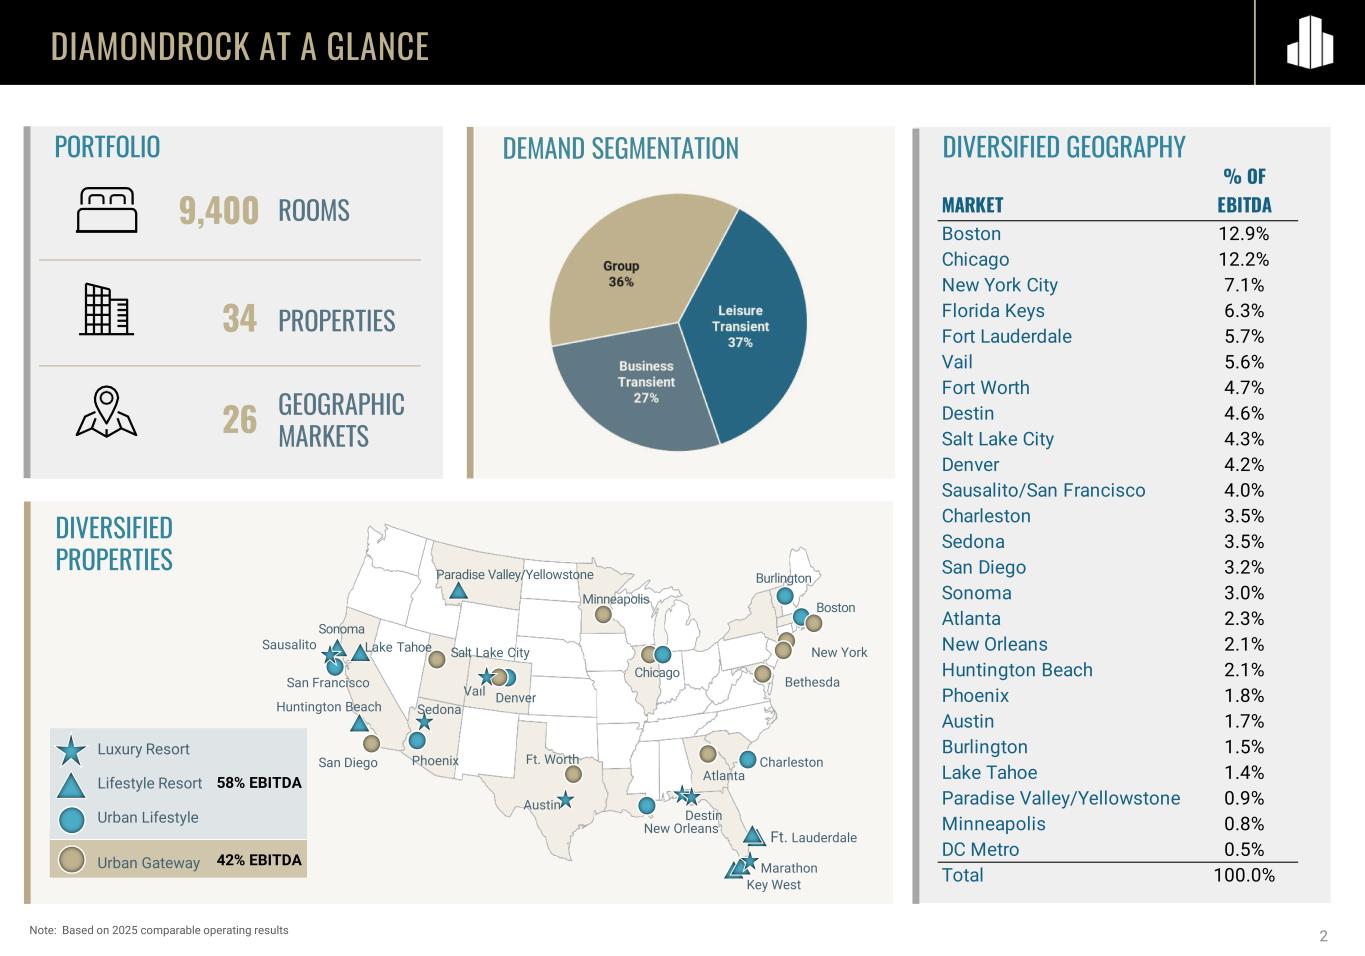
DIAMONDROCK AT A GLANCE DIVERSIFIED PROPERTIES 9,400 34 26 ROOMS GEOGRAPHIC MARKETS PROPERTIES Luxury Resort Lifestyle Resort Urban Lifestyle Urban Gateway 58% EBITDA 42% EBITDA Boston Ft. Worth Ft. Lauderdale Chicago Vail Sausalito Salt Lake City San Diego Key West Sonoma Burlington Phoenix Denver Destin Atlanta Huntington Beach Charleston New Orleans San Francisco Lake Tahoe Sedona New York Austin Paradise Valley/Yellowstone Marathon Minneapolis Bethesda DIVERSIFIED GEOGRAPHYDEMAND SEGMENTATIONPORTFOLIO 2Note: Based on 2025 comparable operating results % OF MARKET EBITDA Boston 12.9% Chicago 12.2% New York City 7.1% Florida Keys 6.3% Fort Lauderdale 5.7% Vail 5.6% Fort Worth 4.7% Destin 4.6% Salt Lake City 4.3% Denver 4.2% Sausalito/San Francisco 4.0% Charleston 3.5% Sedona 3.5% San Diego 3.2% Sonoma 3.0% Atlanta 2.3% New Orleans 2.1% Huntington Beach 2.1% Phoenix 1.8% Austin 1.7% Burlington 1.5% Lake Tahoe 1.4% Paradise Valley/Yellowstone 0.9% Minneapolis 0.8% DC Metro 0.5% Total 100.0%
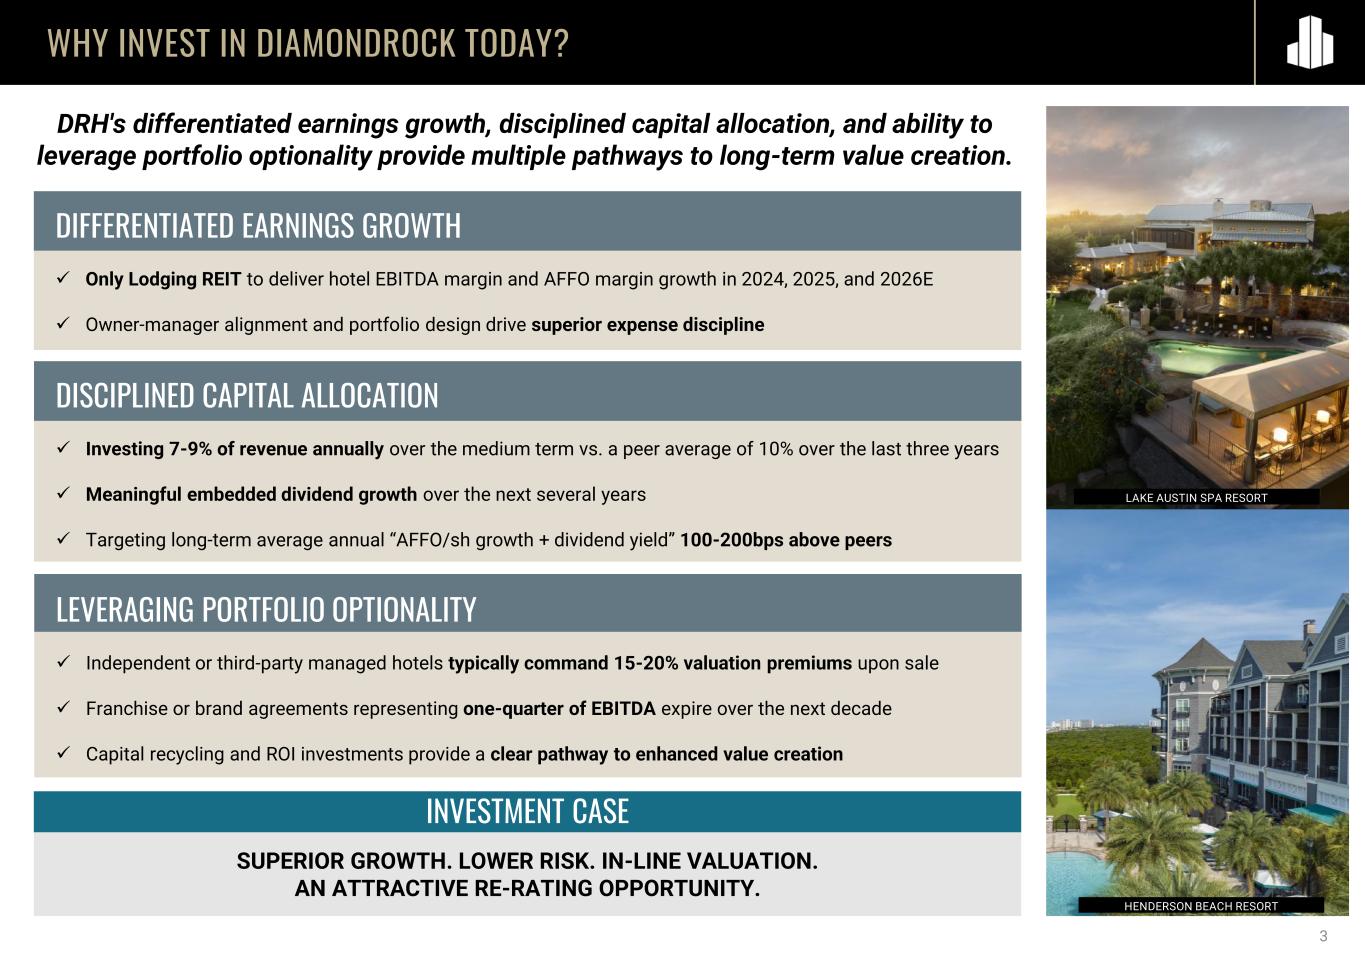
WHY INVEST IN DIAMONDROCK TODAY? DRH's differentiated earnings growth, disciplined capital allocation, and ability to leverage portfolio optionality provide multiple pathways to long-term value creation. 3 DIFFERENTIATED EARNINGS GROWTH ✓ Only Lodging REIT to deliver hotel EBITDA margin and AFFO margin growth in 2024, 2025, and 2026E ✓ Owner-manager alignment and portfolio design drive superior expense discipline LAKE AUSTIN SPA RESORT HENDERSON BEACH RESORT DISCIPLINED CAPITAL ALLOCATION ✓ Investing 7-9% of revenue annually over the medium term vs. a peer average of 10% over the last three years ✓ Meaningful embedded dividend growth over the next several years ✓ Targeting long-term average annual “AFFO/sh growth + dividend yield” 100-200bps above peers LEVERAGING PORTFOLIO OPTIONALITY ✓ Independent or third-party managed hotels typically command 15-20% valuation premiums upon sale ✓ Franchise or brand agreements representing one-quarter of EBITDA expire over the next decade ✓ Capital recycling and ROI investments provide a clear pathway to enhanced value creation SUPERIOR GROWTH. LOWER RISK. IN-LINE VALUATION. AN ATTRACTIVE RE-RATING OPPORTUNITY. INVESTMENT CASE

4 DIFFERENTIATED EARNINGS GROWTH
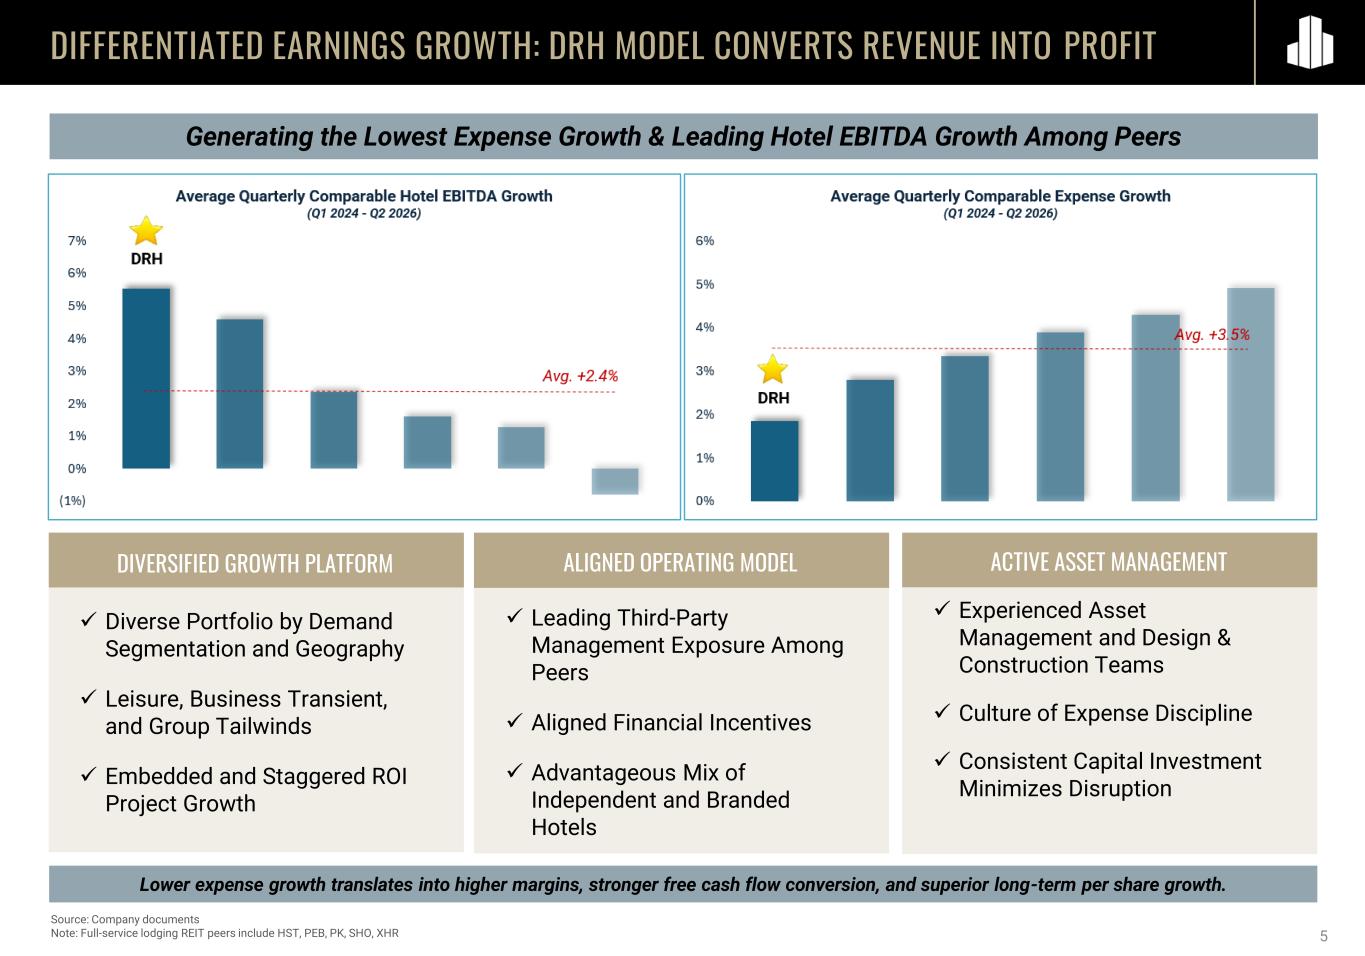
5 Generating the Lowest Expense Growth & Leading Hotel EBITDA Growth Among Peers DIFFERENTIATED EARNINGS GROWTH: DRH MODEL CONVERTS REVENUE INTO PROFIT Source: Company documents Note: Full-service lodging REIT peers include HST, PEB, PK, SHO, XHR ALIGNED OPERATING MODEL ✓ Leading Third-Party Management Exposure Among Peers ✓ Aligned Financial Incentives ✓ Advantageous Mix of Independent and Branded Hotels ACTIVE ASSET MANAGEMENT ✓ Experienced Asset Management and Design & Construction Teams ✓ Culture of Expense Discipline ✓ Consistent Capital Investment Minimizes Disruption DIVERSIFIED GROWTH PLATFORM ✓ Diverse Portfolio by Demand Segmentation and Geography ✓ Leisure, Business Transient, and Group Tailwinds ✓ Embedded and Staggered ROI Project Growth Lower expense growth translates into higher margins, stronger free cash flow conversion, and superior long-term per share growth.
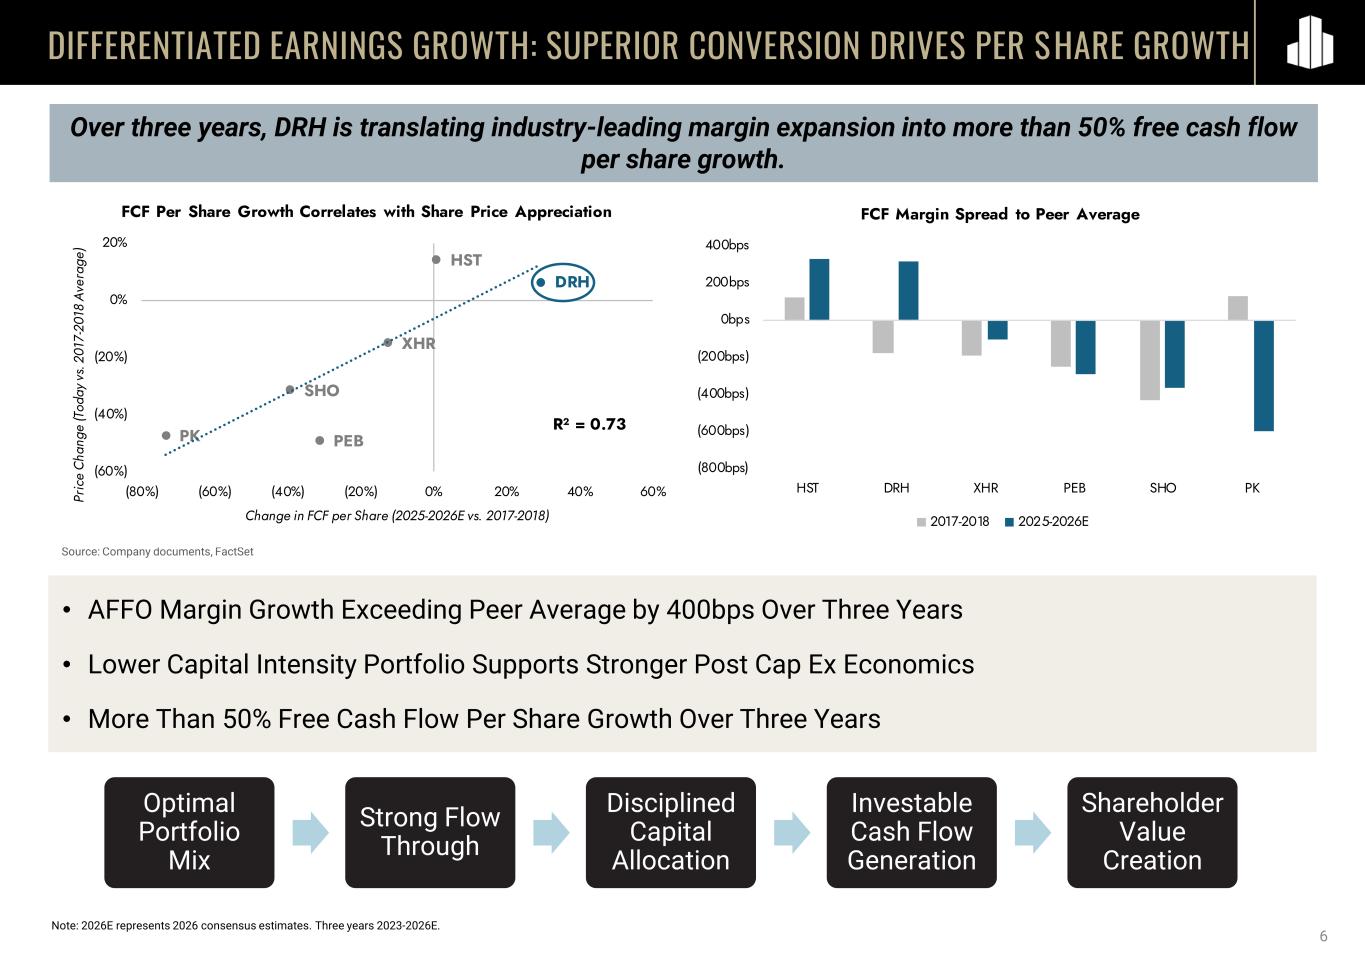
6 Over three years, DRH is translating industry-leading margin expansion into more than 50% free cash flow per share growth. DIFFERENTIATED EARNINGS GROWTH: SUPERIOR CONVERSION DRIVES PER SHARE GROWTH • AFFO Margin Growth Exceeding Peer Average by 400bps Over Three Years • Lower Capital Intensity Portfolio Supports Stronger Post Cap Ex Economics • More Than 50% Free Cash Flow Per Share Growth Over Three Years Source: Company documents, FactSet Note: 2026E represents 2026 consensus estimates. Three years 2023-2026E. Optimal Portfolio Mix Strong Flow Through Disciplined Capital Allocation Investable Cash Flow Generation Shareholder Value Creation (800bps) (600bps) (400bps) (200bps) 0bps 200bps 400bps HST DRH XHR PEB SHO PK FCF Margin Spread to Peer Average 2017-2018 2025-2026E DRH HST XHR PEB SHO PK R² = 0.73 (60%) (40%) (20%) 0% 20% (80%) (60%) (40%) (20%) 0% 20% 40% 60%Pr ic e Ch an ge (T od ay vs . 2 01 7- 20 18 A ve ra ge ) Change in FCF per Share (2025-2026E vs. 2017-2018) FCF Per Share Growth Correlates with Share Price Appreciation
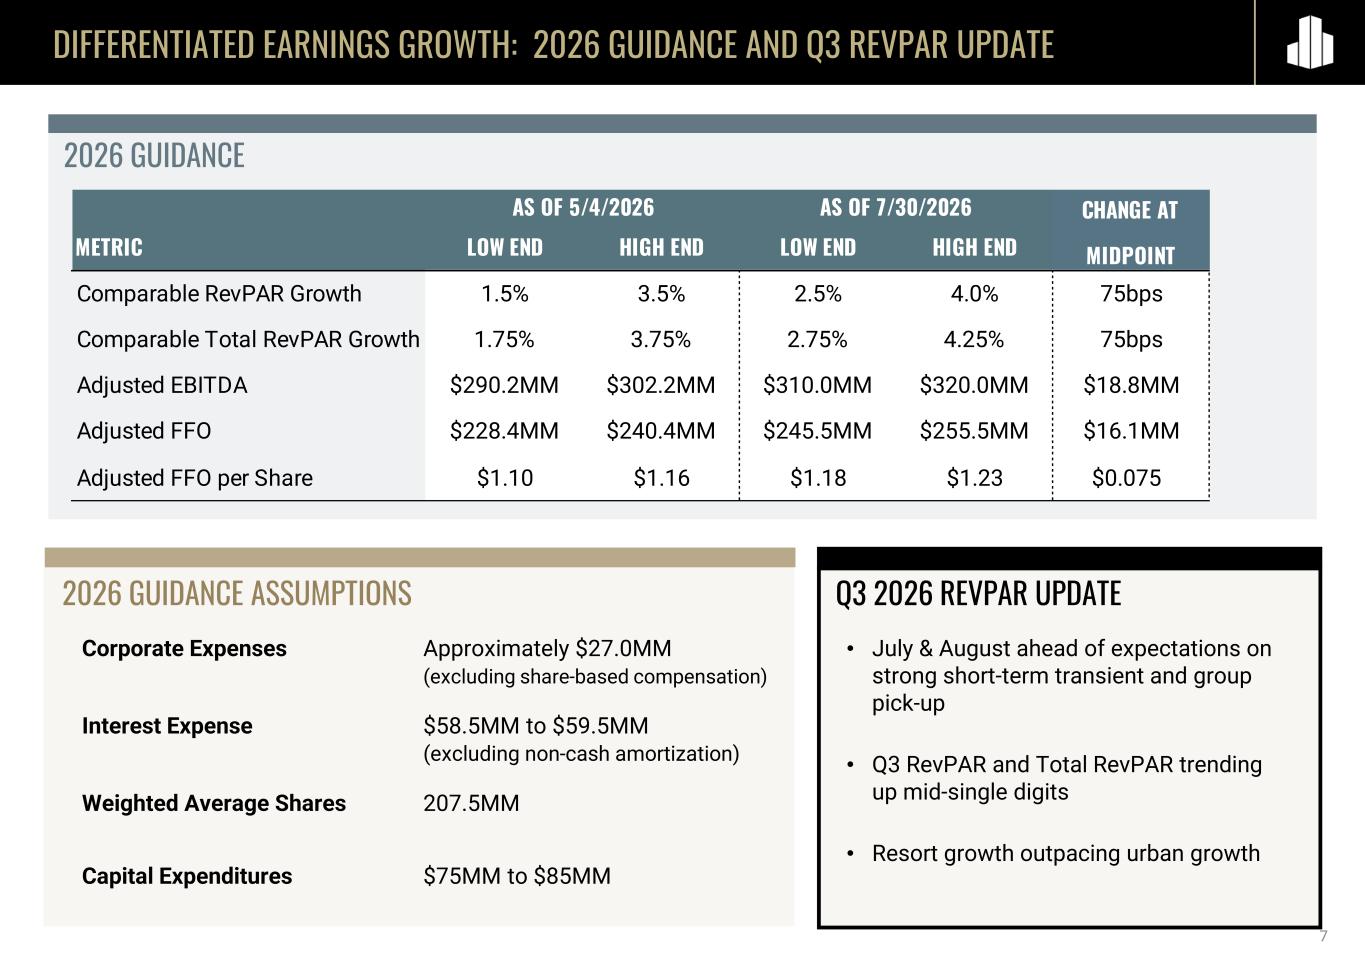
DIFFERENTIATED EARNINGS GROWTH: 2026 GUIDANCE AND Q3 REVPAR UPDATE 2026 GUIDANCE 2026 GUIDANCE ASSUMPTIONS 7 Corporate Expenses Approximately $27.0MM (excluding share-based compensation) Interest Expense $58.5MM to $59.5MM (excluding non-cash amortization) Weighted Average Shares 207.5MM Capital Expenditures $75MM to $85MM • July & August ahead of expectations on strong short-term transient and group pick-up • Q3 RevPAR and Total RevPAR trending up mid-single digits • Resort growth outpacing urban growth METRIC LOW END HIGH END LOW END HIGH END Comparable RevPAR Growth 1.5% 3.5% 2.5% 4.0% 75bps Comparable Total RevPAR Growth 1.75% 3.75% 2.75% 4.25% 75bps Adjusted EBITDA $290.2MM $302.2MM $310.0MM $320.0MM $18.8MM Adjusted FFO $228.4MM $240.4MM $245.5MM $255.5MM $16.1MM Adjusted FFO per Share $1.10 $1.16 $1.18 $1.23 $0.075 AS OF 5/4/2026 AS OF 7/30/2026 CHANGE AT MIDPOINT Q3 2026 REVPAR UPDATE
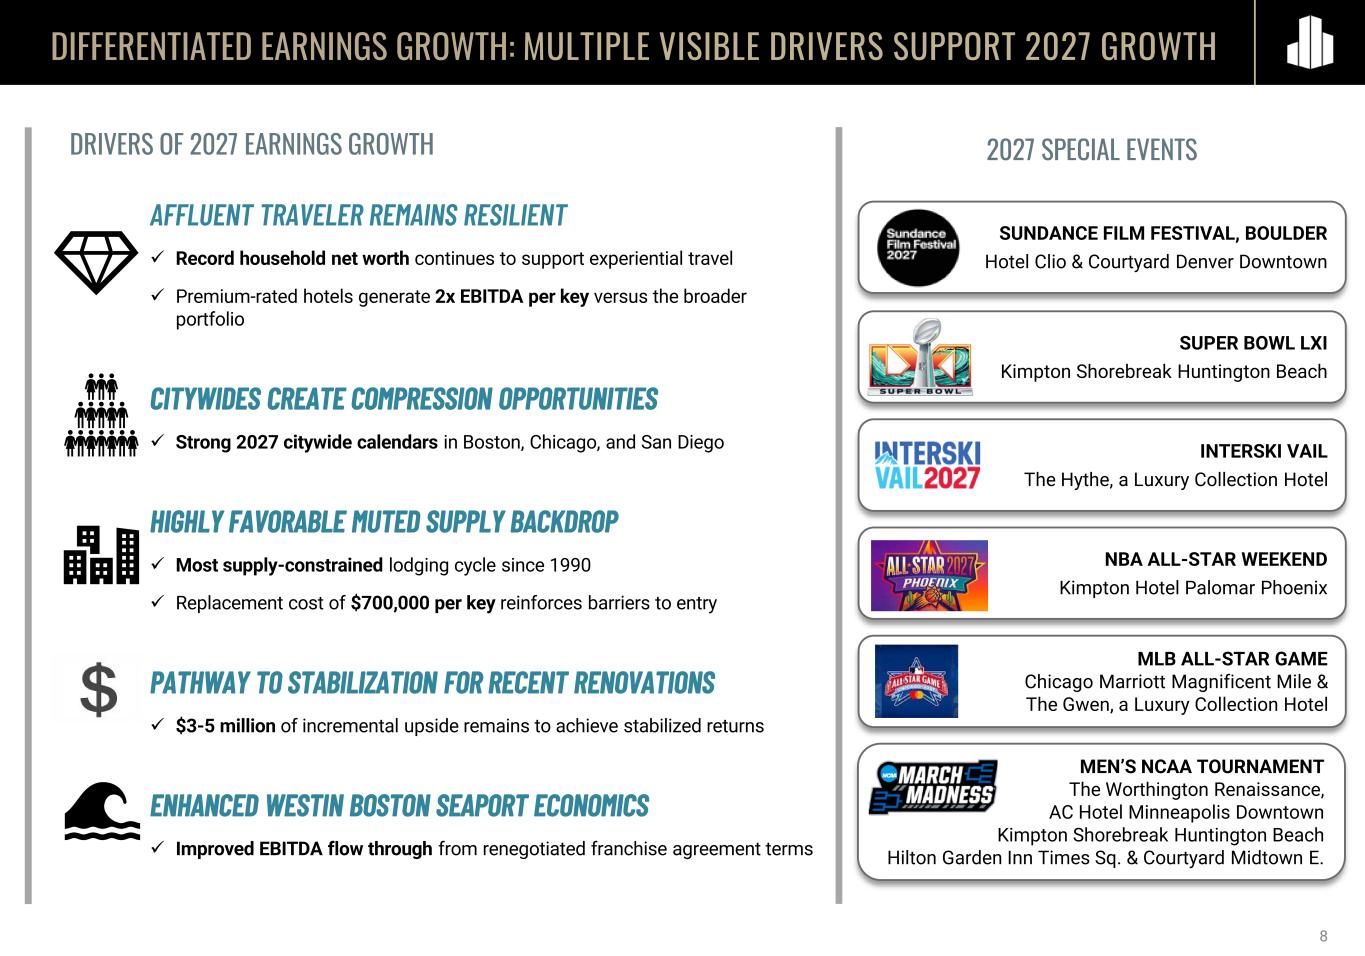
8 DIFFERENTIATED EARNINGS GROWTH: MULTIPLE VISIBLE DRIVERS SUPPORT 2027 GROWTH AFFLUENT TRAVELER REMAINS RESILIENT ✓ Record household net worth continues to support experiential travel ✓ Premium-rated hotels generate 2x EBITDA per key versus the broader portfolio CITYWIDES CREATE COMPRESSION OPPORTUNITIES ✓ Strong 2027 citywide calendars in Boston, Chicago, and San Diego HIGHLY FAVORABLE MUTED SUPPLY BACKDROP ✓ Most supply-constrained lodging cycle since 1990 ✓ Replacement cost of $700,000 per key reinforces barriers to entry PATHWAY TO STABILIZATION FOR RECENT RENOVATIONS ✓ $3-5 million of incremental upside remains to achieve stabilized returns ENHANCED WESTIN BOSTON SEAPORT ECONOMICS ✓ Improved EBITDA flow through from renegotiated franchise agreement terms 2027 SPECIAL EVENTSDRIVERS OF 2027 EARNINGS GROWTH SUNDANCE FILM FESTIVAL, BOULDER Hotel Clio & Courtyard Denver Downtown SUPER BOWL LXI Kimpton Shorebreak Huntington Beach INTERSKI VAIL The Hythe, a Luxury Collection Hotel NBA ALL-STAR WEEKEND Kimpton Hotel Palomar Phoenix MLB ALL-STAR GAME Chicago Marriott Magnificent Mile & The Gwen, a Luxury Collection Hotel MEN’S NCAA TOURNAMENT The Worthington Renaissance, AC Hotel Minneapolis Downtown Kimpton Shorebreak Huntington Beach Hilton Garden Inn Times Sq. & Courtyard Midtown E.
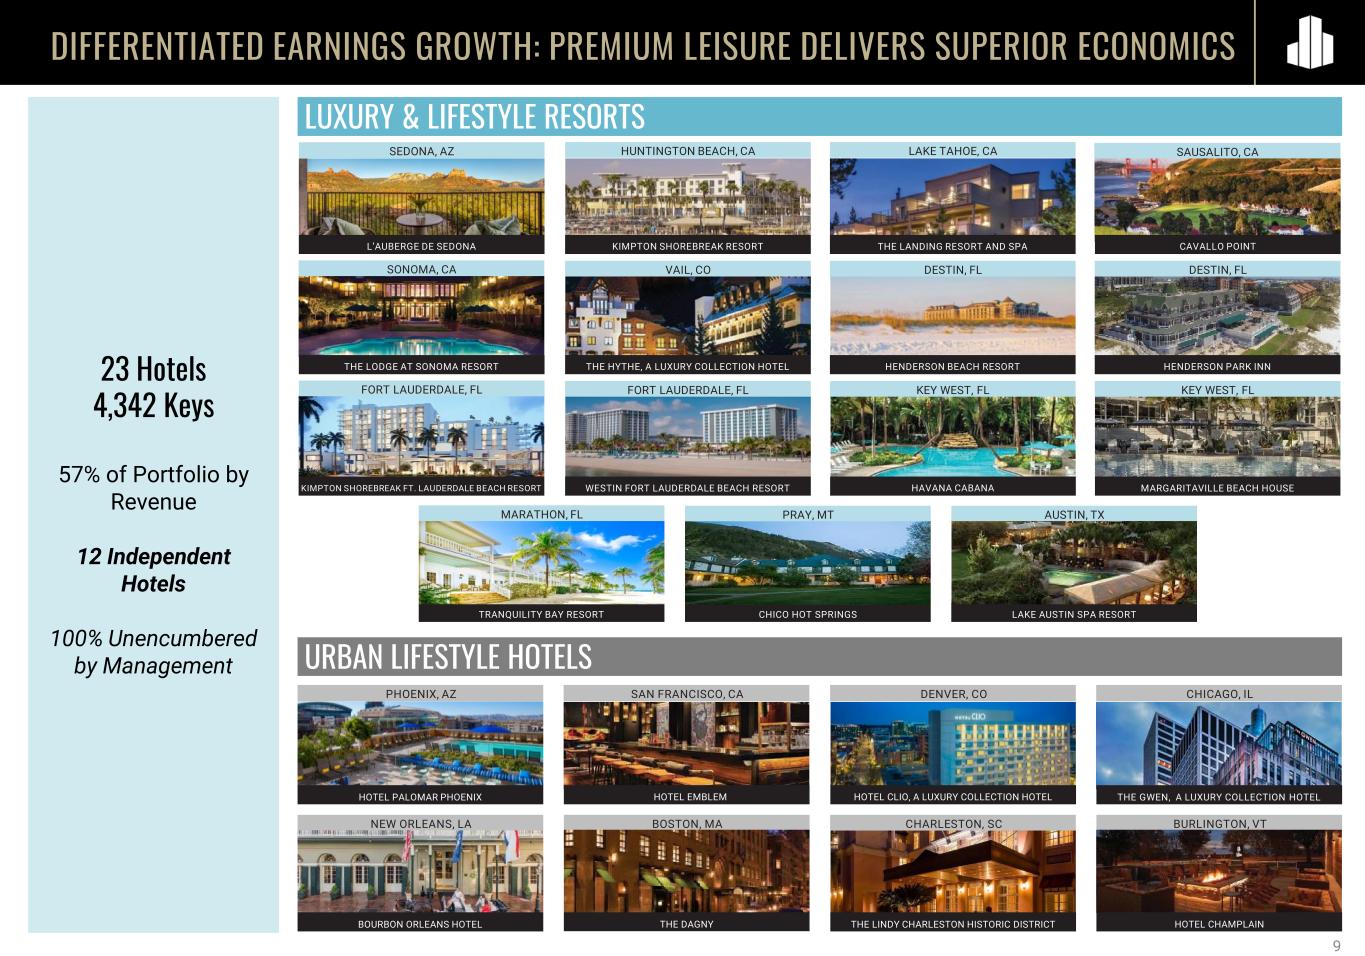
THE LODGE AT SONOMA RESORT23 Hotels 4,342 Keys 57% of Portfolio by Revenue 12 Independent Hotels 100% Unencumbered by Management DIFFERENTIATED EARNINGS GROWTH: PREMIUM LEISURE DELIVERS SUPERIOR ECONOMICS LUXURY & LIFESTYLE RESORTS URBAN LIFESTYLE HOTELS KEY WEST, FL THE HYTHE, A LUXURY COLLECTION HOTEL HAVANA CABANA PHOENIX, AZ SAN FRANCISCO, CA DENVER, CO BOSTON, MANEW ORLEANS, LA CHARLESTON, SC BURLINGTON, VT CHICAGO, IL KIMPTON SHOREBREAK RESORT HUNTINGTON BEACH, CA SONOMA, CA SAUSALITO, CA VAIL, CO DESTIN, FL FORT LAUDERDALE, FL FORT LAUDERDALE, FL KEY WEST, FL HENDERSON PARK INN MARGARITAVILLE BEACH HOUSE LAKE TAHOE, CA 9 THE LANDING RESORT AND SPA AUSTIN, TX LAKE AUSTIN SPA RESORT PRAY, MT CHICO HOT SPRINGSTRANQUILITY BAY RESORT MARATHON, FL CAVALLO POINTL’AUBERGE DE SEDONA DESTIN, FL SEDONA, AZ WESTIN FORT LAUDERDALE BEACH RESORT HENDERSON BEACH RESORT KIMPTON SHOREBREAK FT. LAUDERDALE BEACH RESORT HOTEL EMBLEM HOTEL CLIO, A LUXURY COLLECTION HOTEL THE GWEN, A LUXURY COLLECTION HOTELHOTEL PALOMAR PHOENIX BOURBON ORLEANS HOTEL THE LINDY CHARLESTON HISTORIC DISTRICTTHE DAGNY HOTEL CHAMPLAIN
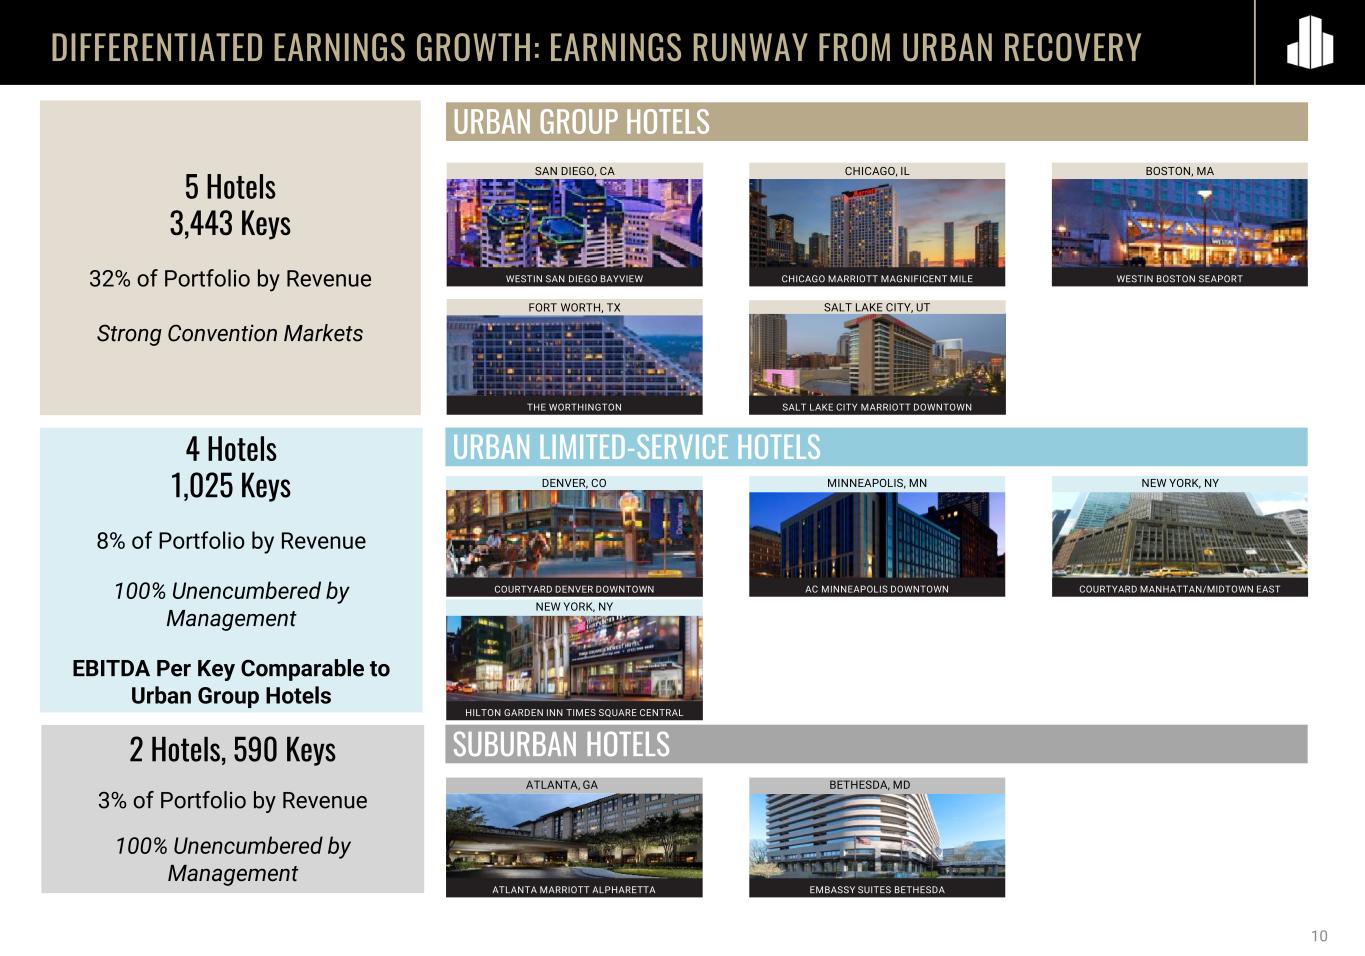
DIFFERENTIATED EARNINGS GROWTH: EARNINGS RUNWAY FROM URBAN RECOVERY 10 AC MINNEAPOLIS DOWNTOWN COURTYARD MANHATTAN/MIDTOWN EASTCOURTYARD DENVER DOWNTOWN 4 Hotels 1,025 Keys 8% of Portfolio by Revenue 100% Unencumbered by Management EBITDA Per Key Comparable to Urban Group Hotels 5 Hotels 3,443 Keys 32% of Portfolio by Revenue Strong Convention Markets 2 Hotels, 590 Keys 3% of Portfolio by Revenue 100% Unencumbered by Management THE WORTHINGTON SALT LAKE CITY MARRIOTT DOWNTOWN EMBASSY SUITES BETHESDAATLANTA MARRIOTT ALPHARETTA URBAN GROUP HOTELS URBAN LIMITED-SERVICE HOTELS SUBURBAN HOTELS CHICAGO, ILSAN DIEGO, CA BETHESDA, MDATLANTA, GA NEW YORK, NYMINNEAPOLIS, MNDENVER, CO NEW YORK, NY BOSTON, MA FORT WORTH, TX SALT LAKE CITY, UT CHICAGO MARRIOTT MAGNIFICENT MILEWESTIN SAN DIEGO BAYVIEW WESTIN BOSTON SEAPORT HILTON GARDEN INN TIMES SQUARE CENTRAL
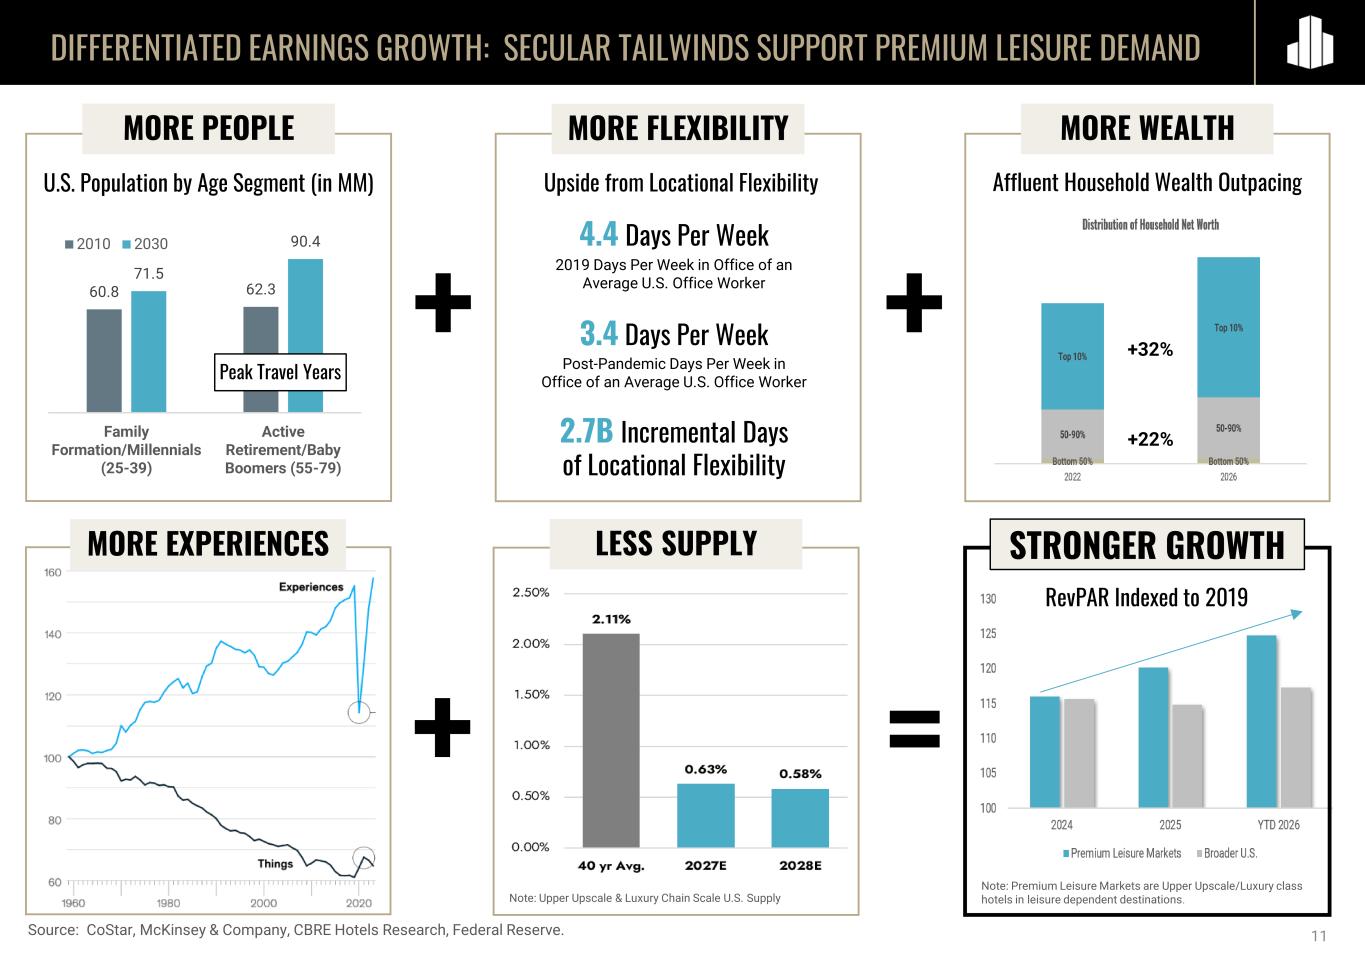
Affluent Household Wealth Outpacing MORE WEALTH DIFFERENTIATED EARNINGS GROWTH: SECULAR TAILWINDS SUPPORT PREMIUM LEISURE DEMAND 11 60.8 62.3 71.5 90.4 Family Formation/Millennials (25-39) Active Retirement/Baby Boomers (55-79) 2010 2030 MORE PEOPLE U.S. Population by Age Segment (in MM) Peak Travel Years Source: CoStar, McKinsey & Company, CBRE Hotels Research, Federal Reserve. 4.4 Days Per Week 2019 Days Per Week in Office of an Average U.S. Office Worker 3.4 Days Per Week Post-Pandemic Days Per Week in Office of an Average U.S. Office Worker 2.7B Incremental Days of Locational Flexibility MORE FLEXIBILITY +32% +22% Note: Premium Leisure Markets are Upper Upscale/Luxury class hotels in leisure dependent destinations. Upside from Locational Flexibility + + MORE EXPERIENCES LESS SUPPLY + = RevPAR Indexed to 2019 STRONGER GROWTH Note: Upper Upscale & Luxury Chain Scale U.S. Supply

12 DISCIPLINED CAPITAL ALLOCATION
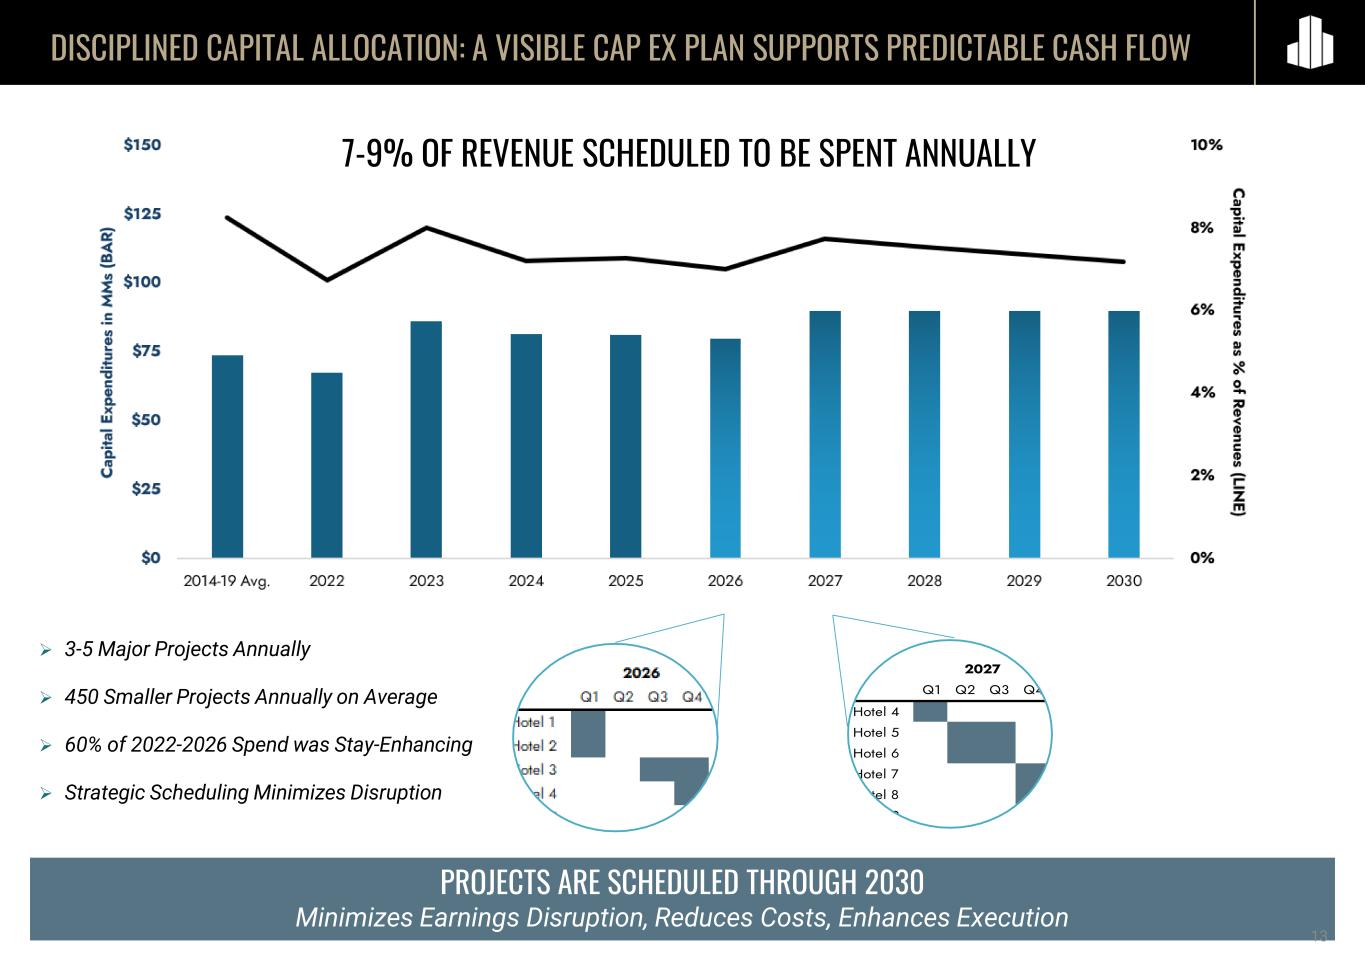
PROJECTS ARE SCHEDULED THROUGH 2030 Minimizes Earnings Disruption, Reduces Costs, Enhances Execution DISCIPLINED CAPITAL ALLOCATION: A VISIBLE CAP EX PLAN SUPPORTS PREDICTABLE CASH FLOW 13 7-9% OF REVENUE SCHEDULED TO BE SPENT ANNUALLY ➢ 3-5 Major Projects Annually ➢ 450 Smaller Projects Annually on Average ➢ 60% of 2022-2026 Spend was Stay-Enhancing ➢ Strategic Scheduling Minimizes Disruption Q1 Q2 Q3 Q4 Hotel 4 Hotel 5 Hotel 6 Hotel 7 Hotel 8 Hotel 9 2027

DISCIPLINED CAPITAL ALLOCATION: L’AUBERGE DEMONSTRATES THE ROI PLAYBOOK 14 RENOVATION & INTEGRATION OF L’AUBERGE DE SEDONA • Total Cost: $25MM • Estimated Stabilized Yield on Cost: 20% • Completed: Q3 2025 • New cliffside pool, bar, and event space with some of the best views of Sedona’s red rocks • Significant rate opportunity
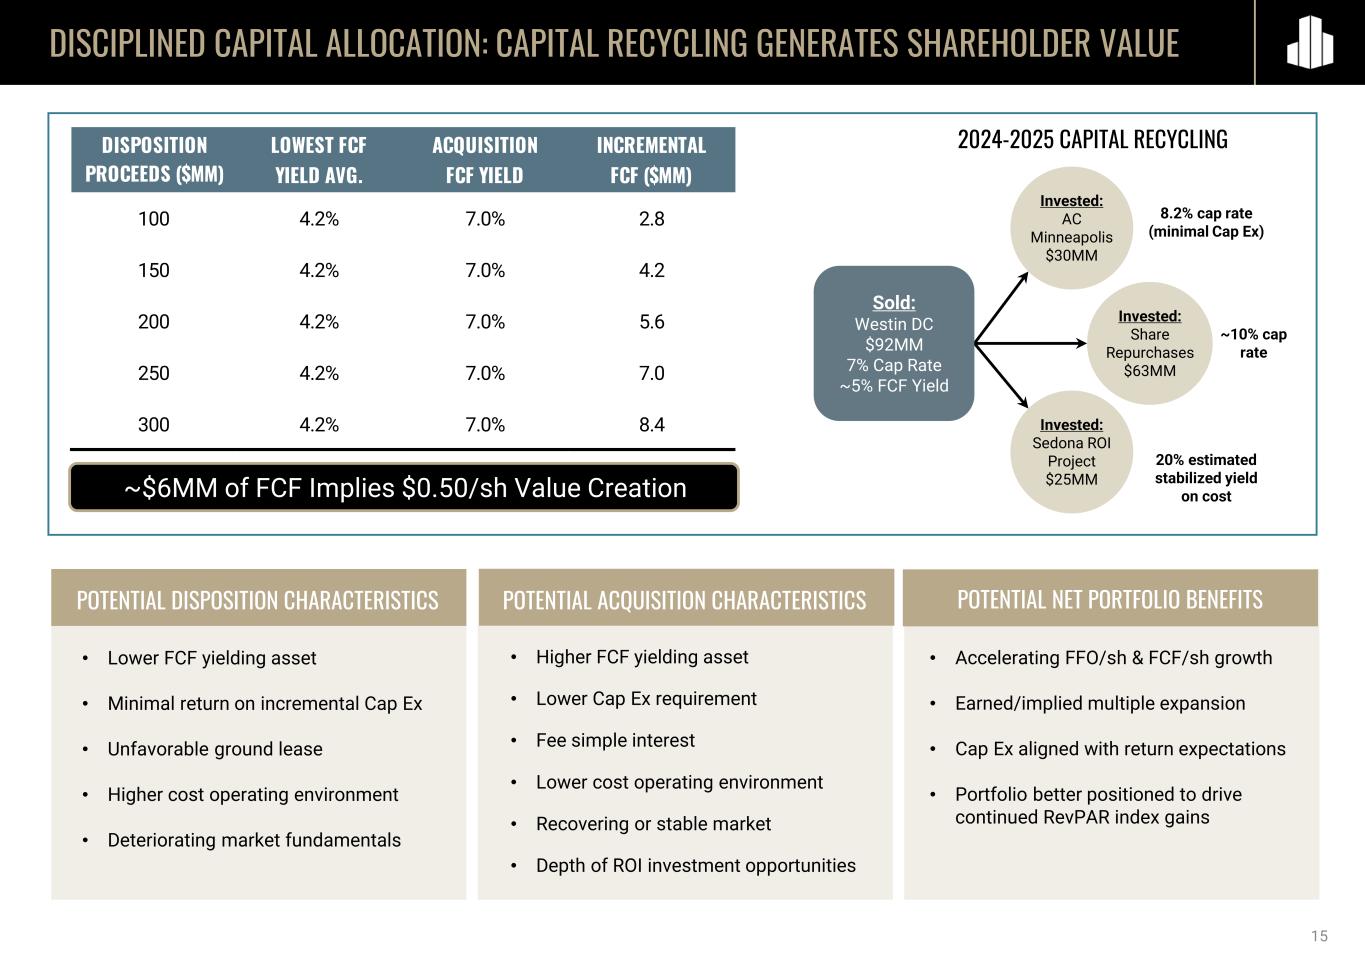
DISCIPLINED CAPITAL ALLOCATION: CAPITAL RECYCLING GENERATES SHAREHOLDER VALUE POTENTIAL ACQUISITION CHARACTERISTICS POTENTIAL NET PORTFOLIO BENEFITSPOTENTIAL DISPOSITION CHARACTERISTICS • Lower FCF yielding asset • Minimal return on incremental Cap Ex • Unfavorable ground lease • Higher cost operating environment • Deteriorating market fundamentals • Higher FCF yielding asset • Lower Cap Ex requirement • Fee simple interest • Lower cost operating environment • Recovering or stable market • Depth of ROI investment opportunities • Accelerating FFO/sh & FCF/sh growth • Earned/implied multiple expansion • Cap Ex aligned with return expectations • Portfolio better positioned to drive continued RevPAR index gains ~$6MM of FCF Implies $0.50/sh Value Creation 2024-2025 CAPITAL RECYCLING 8.2% cap rate (minimal Cap Ex) Invested: AC Minneapolis $30MM Invested: Share Repurchases $63MM Invested: Sedona ROI Project $25MM ~10% cap rate 20% estimated stabilized yield on cost Sold: Westin DC $92MM 7% Cap Rate ~5% FCF Yield 15 DISPOSITION LOWEST FCF ACQUISITION INCREMENTAL PROCEEDS ($MM) YIELD AVG. FCF YIELD FCF ($MM) 100 4.2% 7.0% 2.8 150 4.2% 7.0% 4.2 200 4.2% 7.0% 5.6 250 4.2% 7.0% 7.0 300 4.2% 7.0% 8.4
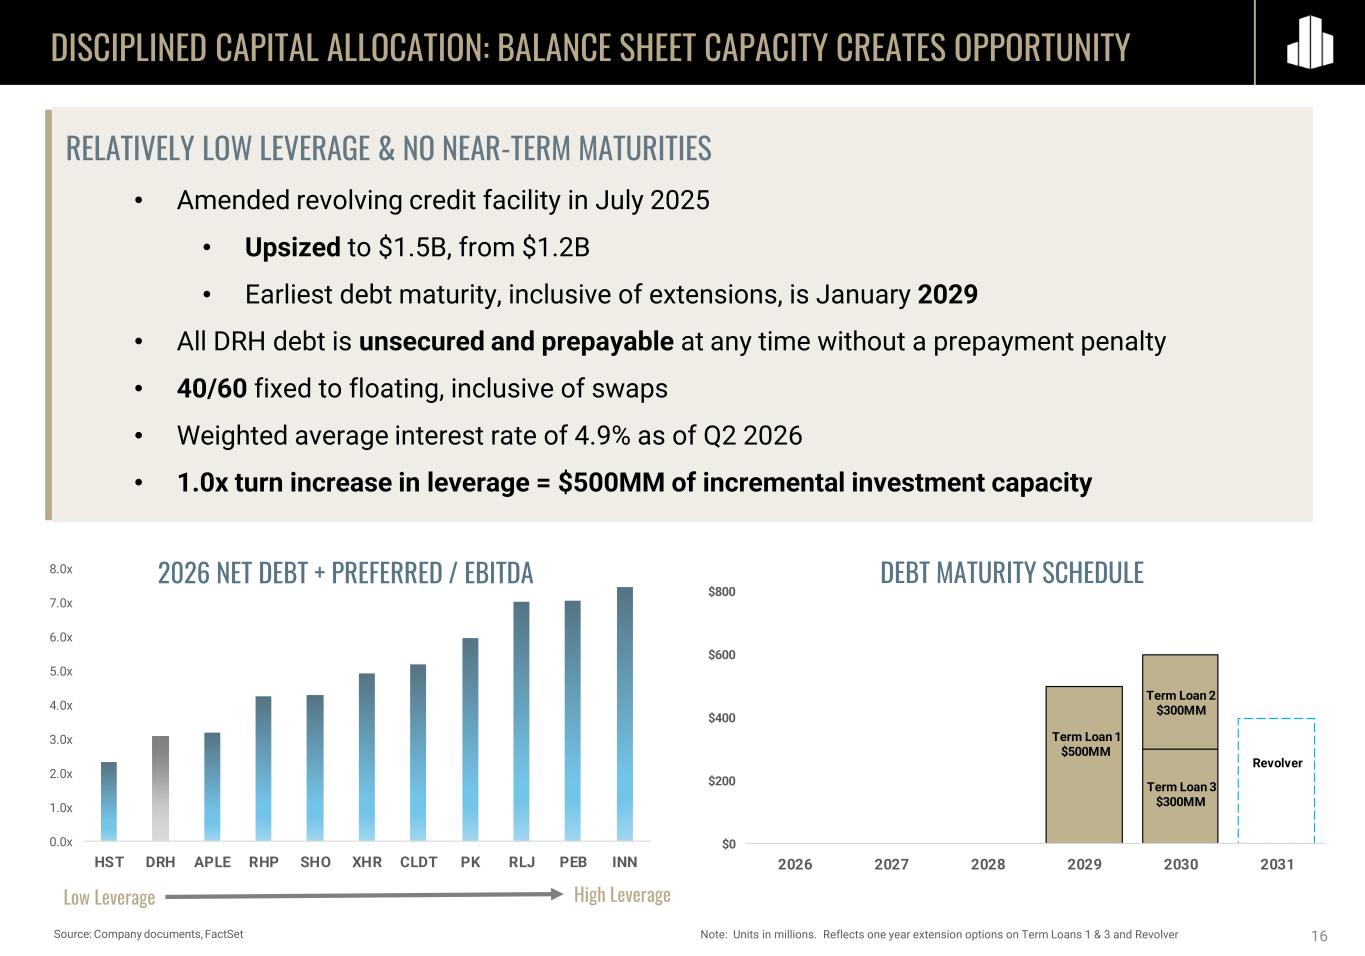
Term Loan 2 $300MM $0 $200 $400 $600 $800 2026 2027 2028 2029 2030 2031 Term Loan 1 $500MM Term Loan 3 $300MM Revolver 0.0x 1.0x 2.0x 3.0x 4.0x 5.0x 6.0x 7.0x 8.0x HST DRH APLE RHP SHO XHR CLDT PK RLJ PEB INN DISCIPLINED CAPITAL ALLOCATION: BALANCE SHEET CAPACITY CREATES OPPORTUNITY 16 High LeverageLow Leverage RELATIVELY LOW LEVERAGE & NO NEAR-TERM MATURITIES • Amended revolving credit facility in July 2025 • Upsized to $1.5B, from $1.2B • Earliest debt maturity, inclusive of extensions, is January 2029 • All DRH debt is unsecured and prepayable at any time without a prepayment penalty • 40/60 fixed to floating, inclusive of swaps • Weighted average interest rate of 4.9% as of Q2 2026 • 1.0x turn increase in leverage = $500MM of incremental investment capacity Source: Company documents, FactSet Note: Units in millions. Reflects one year extension options on Term Loans 1 & 3 and Revolver 2026 NET DEBT + PREFERRED / EBITDA DEBT MATURITY SCHEDULE

17 LEVERAGING PORTFOLIO OPTIONALITY
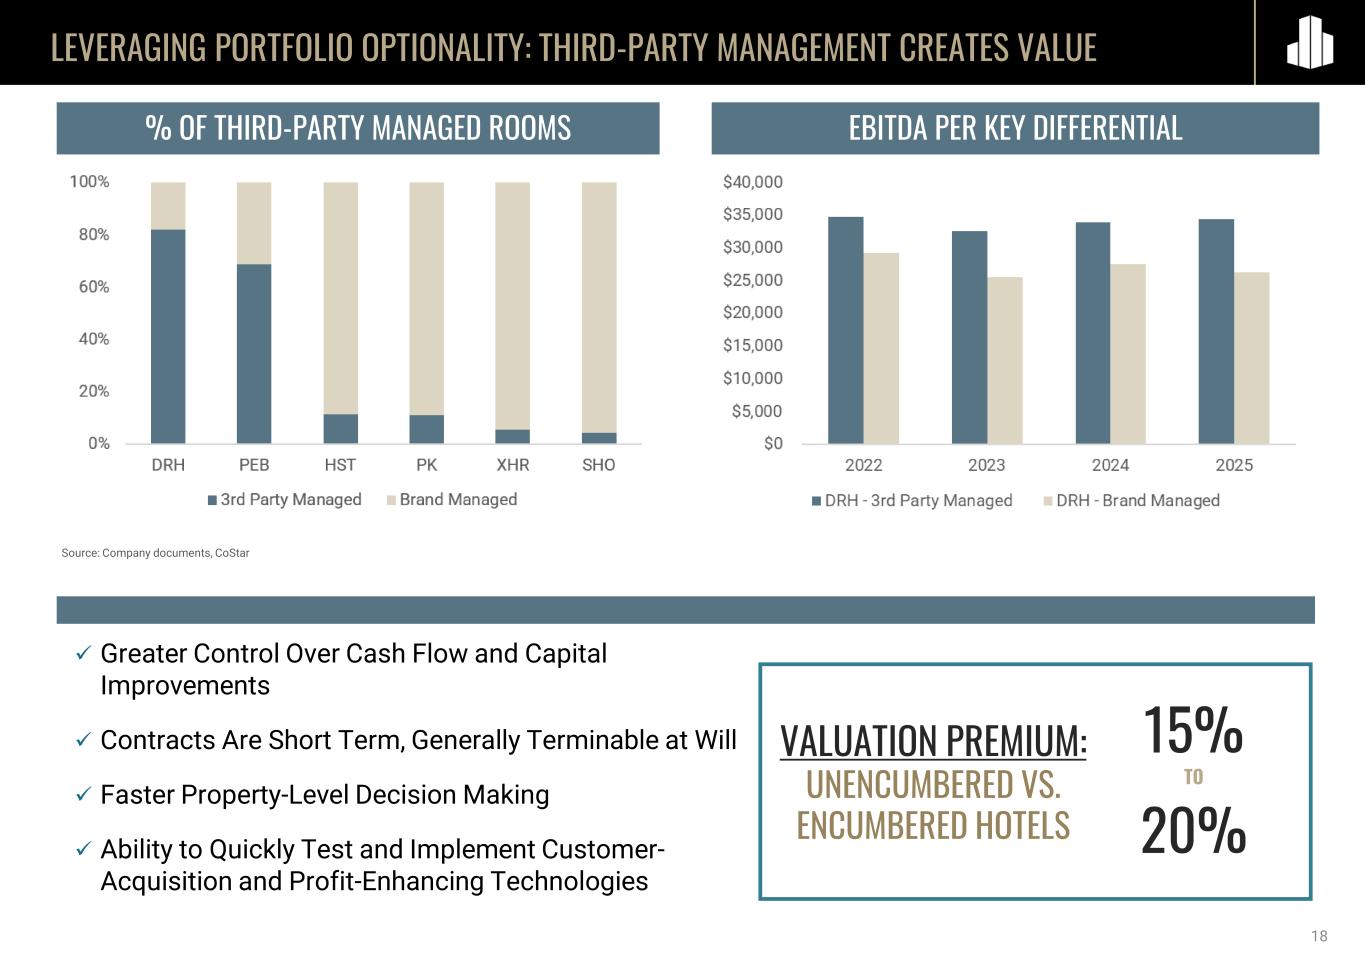
LEVERAGING PORTFOLIO OPTIONALITY: THIRD-PARTY MANAGEMENT CREATES VALUE 18 ✓ Greater Control Over Cash Flow and Capital Improvements ✓ Contracts Are Short Term, Generally Terminable at Will ✓ Faster Property-Level Decision Making ✓ Ability to Quickly Test and Implement Customer- Acquisition and Profit-Enhancing Technologies % OF THIRD-PARTY MANAGED ROOMS Source: Company documents, CoStar EBITDA PER KEY DIFFERENTIAL VALUATION PREMIUM: UNENCUMBERED VS. ENCUMBERED HOTELS 15% TO 20%

19 Exploring Adding More Waterfront Guest Rooms Currently 37 Rooms Entitled for 135 Ocean-Front Units Assessing Highest and Best Use of Westin Fort Lauderdale The Westin Fort Lauderdale Beach Resort LEVERAGING PORTFOLIO OPTIONALITY: DEEP PIPELINE OF VALUE CREATION OPPORTUNITIES Courtyard Denver Downtown Franchise Expiring in 2027 Potential Upbranding & Expansion Entitled to Add 11 Keys Exploring Spa and Meeting Space Expansion, Adding Guest Rooms Exploring Adding New Cabins Franchise Expired in 2025 Contract Expirations Over the Next Decade Represent More Than 25% of EBITDA ROI Opportunities, Underwritten to Double Digit Returns Contract Expirations May Lead to Lower Fees, Brand Conversions, Flag Removals, Key Money – Avenues of Value Creation
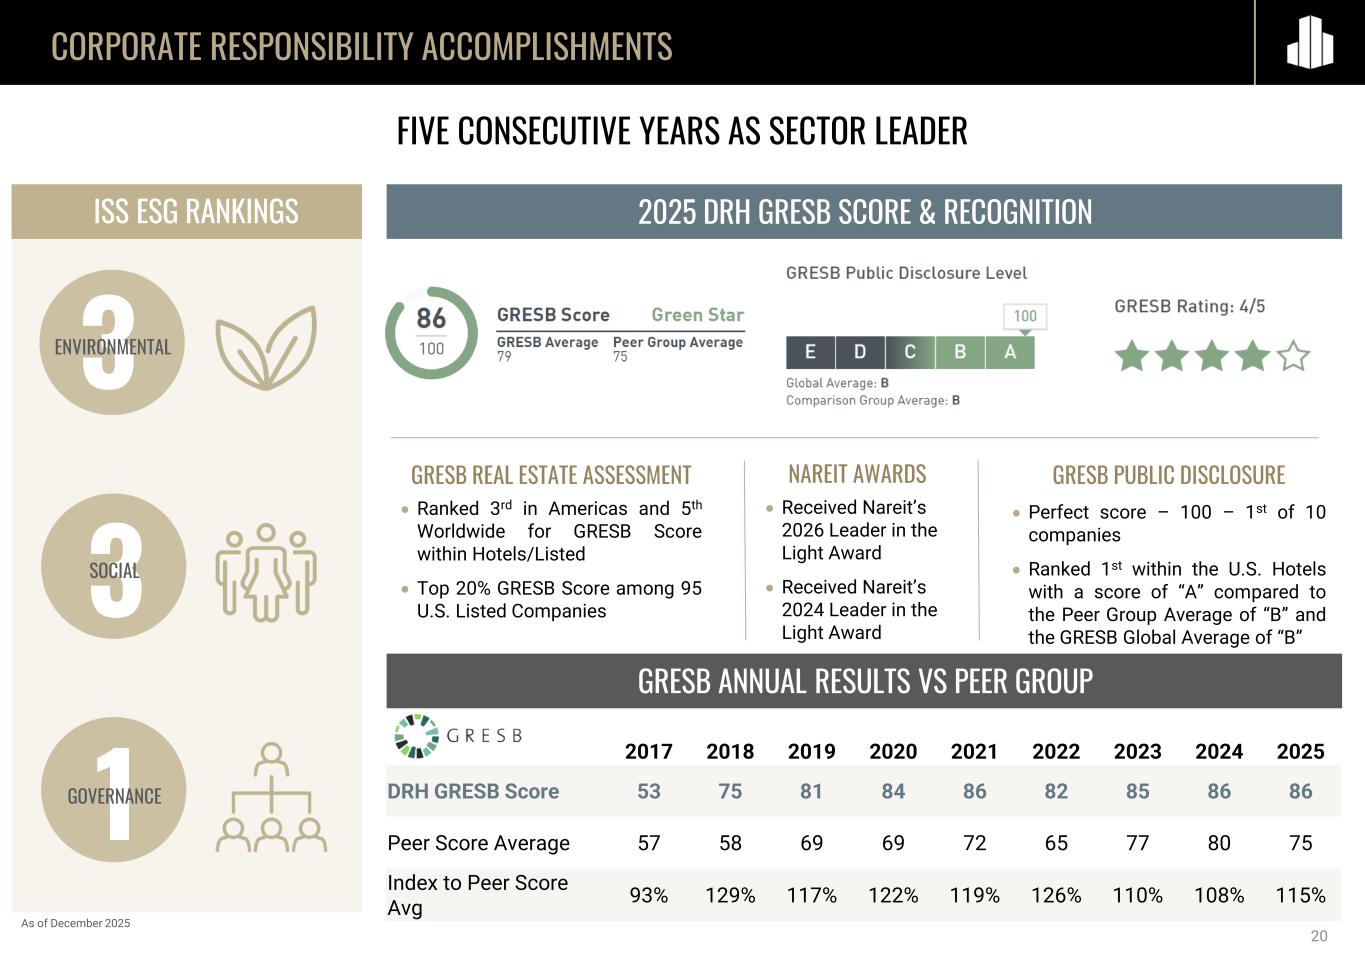
CORPORATE RESPONSIBILITY ACCOMPLISHMENTS GRESB ANNUAL RESULTS VS PEER GROUP 2025 DRH GRESB SCORE & RECOGNITION FIVE CONSECUTIVE YEARS AS SECTOR LEADER GRESB REAL ESTATE ASSESSMENT • Ranked 3rd in Americas and 5th Worldwide for GRESB Score within Hotels/Listed • Top 20% GRESB Score among 95 U.S. Listed Companies GRESB PUBLIC DISCLOSURE • Perfect score – 100 – 1st of 10 companies • Ranked 1st within the U.S. Hotels with a score of “A” compared to the Peer Group Average of “B” and the GRESB Global Average of “B” ISS ESG RANKINGS 3ENVIRONMENTAL 3SOCIAL 1GOVERNANCE As of December 2025 NAREIT AWARDS • Received Nareit’s 2026 Leader in the Light Award • Received Nareit’s 2024 Leader in the Light Award 20 2017 2018 2019 2020 2021 2022 2023 2024 2025 DRH GRESB Score 53 75 81 84 86 82 85 86 86 Peer Score Average 57 58 69 69 72 65 77 80 75 Index to Peer Score Avg 93% 129% 117% 122% 119% 126% 110% 108% 115%
FORWARD LOOKING STATEMENTS 21 This presentation contains forward-looking statements within the meaning of federal securities laws and regulations. These forward-looking statements are identified by their use of terms and phrases such as "believe," "expect," "intend," "project," "forecast," "plan" and other similar terms and phrases, including references to assumptions and forecasts of future results. Forward-looking statements are not guarantees of future performance and involve known and unknown risks, uncertainties and other factors which may cause the actual results to differ materially from those anticipated at the time the forward-looking statements are made. These risks include, but are not limited to: the adverse impact of any future pandemic, epidemic or outbreak of any highly infectious disease on the U.S., regional and global economies, travel, the hospitality industry, and the financial condition and results of operations of the Company and its hotels; negative developments or volatility in the economy, including, but not limited to elevated inflation and interest rates, job loss or growth trends, the imposition of trade sanctions or tariffs and any potential retaliatory responses thereto, an increase in unemployment or a decrease in corporate earnings and investment; risks associated with the lodging industry overall, including, without limitation, decreases in the frequency of travel, decreases in the demand for, or frequency of, international travel as a result of evolving global trade dynamics or otherwise, and increases in operating costs; relationships with property managers; the ability to compete effectively in areas such as access, location, quality of accommodations and room rate structures; changes in taxes and government regulations which influence or determine wages, prices, construction procedures and costs; and other risk factors contained in the Company's filings with the Securities and Exchange Commission. Although the Company believes the expectations reflected in such forward-looking statements are based upon reasonable assumptions, it can give no assurance that the expectations will be attained or that any deviation will not be material. All information in this presentation is as of the date of this presentation, and the Company undertakes no obligation to update any forward-looking statement to conform the statement to actual results or changes in the Company's expectations. This presentation contains statistics and other data that has been obtained or compiled from information made available by third-party service providers and believed to be reliable, but the accuracy and completeness of the information is not assured. The Company has not independently verified any such information.
22 NON-GAAP FINANCIAL MEASURES Included in this presentation are certain “non-GAAP financial measures,” which are measures of our historical or future financial performance that are not calculated and presented in accordance with U.S. GAAP, within the meaning of applicable SEC rules. They are as follows: (i) EBITDA, EBITDAre, and Adjusted EBITDA, both at the hotel and company level, (ii) FFO, Adjusted FFO, and Adjusted FFO Per Share, (iii) Free Cash Flow and Free Cash Flow Per Share, (iv) Comparable Hotel Operating Statistics and Results, and (v) measures derived from Hotel Adjusted EBITDA and Hotel NOI such as EBITDA multiples and capitalization rates. Use and Limitations of Non-GAAP Financial Measures Our management and Board of Directors use these non-GAAP measures to evaluate the performance of our hotels and to facilitate comparisons between us and other lodging REITs, hotel owners who are not REITs and other capital-intensive companies. The use of these non-GAAP financial measures has certain limitations. These non- GAAP financial measures as presented by us, may not be comparable to non-GAAP financial measures as calculated by other real estate companies. These measures do not reflect certain expenses or expenditures that we incurred and will incur, such as depreciation, interest and capital expenditures. We compensate for these limitations by separately considering the impact of these excluded items to the extent they are material to operating decisions or assessments of our operating performance. Our reconciliations to the most comparable U.S. GAAP financial measures, and our consolidated statements of operations and comprehensive income and consolidated statements of cash flows, include interest expense, capital expenditures, and other excluded items, all of which should be considered when evaluating our performance, as well as the usefulness of our non-GAAP financial measures. These non-GAAP financial measures are used in addition to and in conjunction with results presented in accordance with U.S. GAAP. They should not be considered as alternatives to operating profit, cash flow from operations, or any other operating performance measure prescribed by U.S. GAAP. These non-GAAP financial measures reflect additional ways of viewing our operations that we believe, when viewed with our U.S. GAAP results and the reconciliations to the corresponding U.S. GAAP financial measures, provide a more complete understanding of factors and trends affecting our business than could be obtained absent this disclosure. We strongly encourage investors to review our financial information in its entirety and not to rely on a single financial measure. A reconciliation of these non-GAAP financial measures to the most directly comparable financial measures prepared in accordance with U.S. GAAP can be found in the Company’s second quarter 2026 earnings press release dated July 30, 2026. EBITDA and EBITDAre EBITDA represents net income (calculated in accordance with U.S. GAAP) excluding: (1) interest expense; (2) provision for income taxes, including income taxes applicable to sale of assets; and (3) depreciation and amortization. The Company computes EBITDAre in accordance with the National Association of Real Estate Investment Trusts ("Nareit") guidelines, as defined in its September 2017 white paper "Earnings Before Interest, Taxes, Depreciation and Amortization for Real Estate." EBITDAre represents net income (calculated in accordance with U.S. GAAP) adjusted for: (1) interest expense; (2) provision for income taxes, including income taxes applicable to sale of assets; (3) depreciation and amortization; (4) gains or losses on the disposition of depreciated property including gains or losses on change of control; (5) impairment write-downs of depreciated property and of investments in unconsolidated affiliates caused by a decrease in value of depreciated property in the affiliate; and (6) adjustments to reflect the entity's share of EBITDAre of unconsolidated affiliates. We believe EBITDA and EBITDAre are useful to an investor in evaluating our operating performance because they help investors evaluate and compare the results of our operations from period to period by removing the impact of our capital structure (primarily interest expense) and our asset base (primarily depreciation and amortization, and in the case of EBITDAre, impairment and gains or losses on dispositions of depreciated property) from our operating results. In addition, covenants included in our debt agreements use EBITDA as a measure of financial compliance. We also use EBITDA and EBITDAre as measures in determining the value of hotel acquisitions and dispositions.
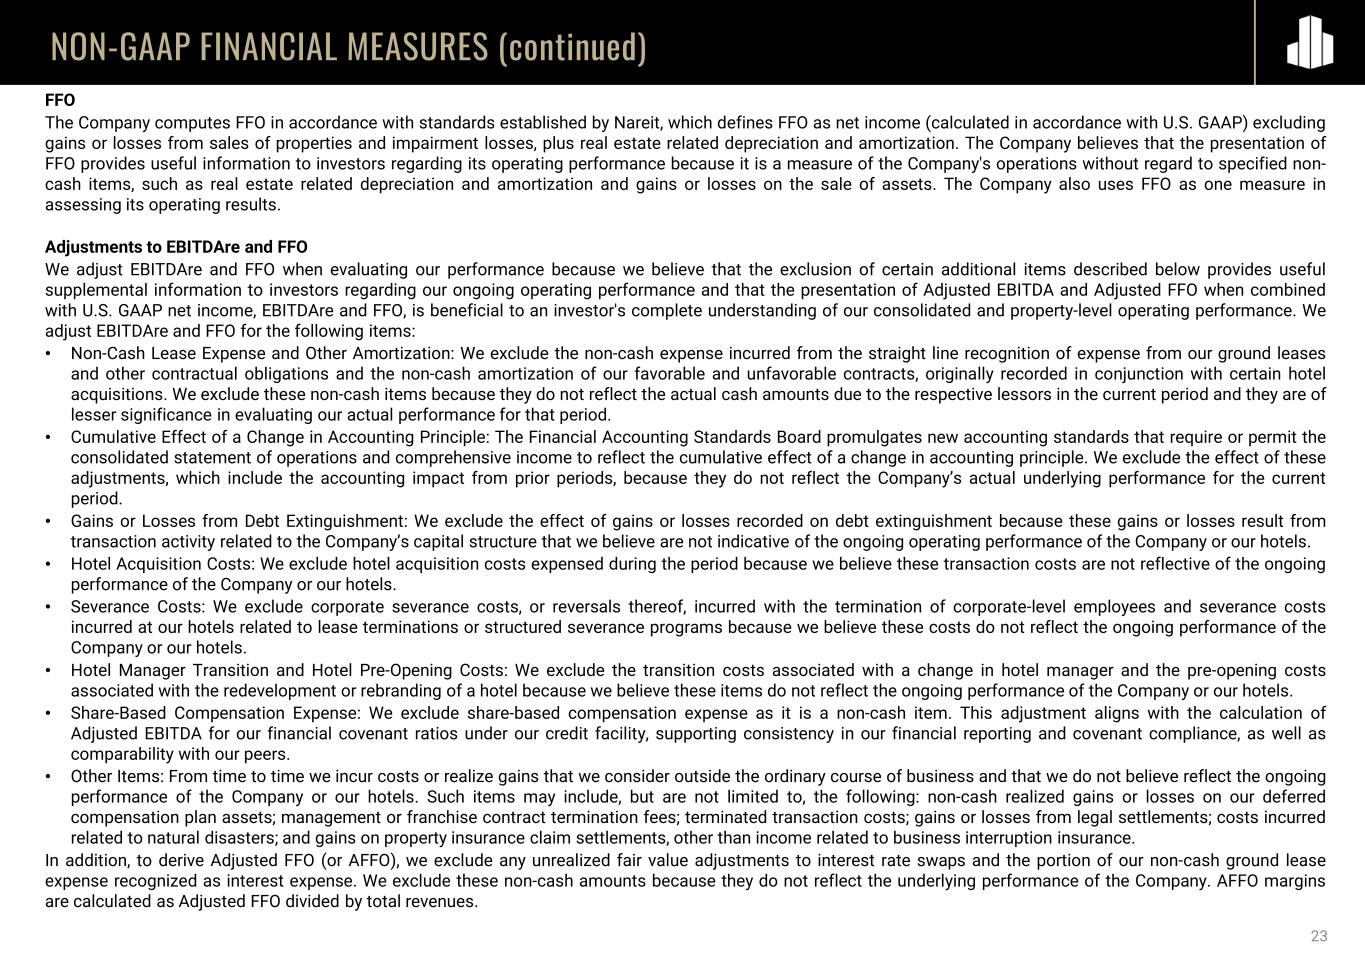
23 NON-GAAP FINANCIAL MEASURES (continued) FFO The Company computes FFO in accordance with standards established by Nareit, which defines FFO as net income (calculated in accordance with U.S. GAAP) excluding gains or losses from sales of properties and impairment losses, plus real estate related depreciation and amortization. The Company believes that the presentation of FFO provides useful information to investors regarding its operating performance because it is a measure of the Company's operations without regard to specified non- cash items, such as real estate related depreciation and amortization and gains or losses on the sale of assets. The Company also uses FFO as one measure in assessing its operating results. Adjustments to EBITDAre and FFO We adjust EBITDAre and FFO when evaluating our performance because we believe that the exclusion of certain additional items described below provides useful supplemental information to investors regarding our ongoing operating performance and that the presentation of Adjusted EBITDA and Adjusted FFO when combined with U.S. GAAP net income, EBITDAre and FFO, is beneficial to an investor's complete understanding of our consolidated and property-level operating performance. We adjust EBITDAre and FFO for the following items: • Non-Cash Lease Expense and Other Amortization: We exclude the non-cash expense incurred from the straight line recognition of expense from our ground leases and other contractual obligations and the non-cash amortization of our favorable and unfavorable contracts, originally recorded in conjunction with certain hotel acquisitions. We exclude these non-cash items because they do not reflect the actual cash amounts due to the respective lessors in the current period and they are of lesser significance in evaluating our actual performance for that period. • Cumulative Effect of a Change in Accounting Principle: The Financial Accounting Standards Board promulgates new accounting standards that require or permit the consolidated statement of operations and comprehensive income to reflect the cumulative effect of a change in accounting principle. We exclude the effect of these adjustments, which include the accounting impact from prior periods, because they do not reflect the Company’s actual underlying performance for the current period. • Gains or Losses from Debt Extinguishment: We exclude the effect of gains or losses recorded on debt extinguishment because these gains or losses result from transaction activity related to the Company’s capital structure that we believe are not indicative of the ongoing operating performance of the Company or our hotels. • Hotel Acquisition Costs: We exclude hotel acquisition costs expensed during the period because we believe these transaction costs are not reflective of the ongoing performance of the Company or our hotels. • Severance Costs: We exclude corporate severance costs, or reversals thereof, incurred with the termination of corporate-level employees and severance costs incurred at our hotels related to lease terminations or structured severance programs because we believe these costs do not reflect the ongoing performance of the Company or our hotels. • Hotel Manager Transition and Hotel Pre-Opening Costs: We exclude the transition costs associated with a change in hotel manager and the pre-opening costs associated with the redevelopment or rebranding of a hotel because we believe these items do not reflect the ongoing performance of the Company or our hotels. • Share-Based Compensation Expense: We exclude share-based compensation expense as it is a non-cash item. This adjustment aligns with the calculation of Adjusted EBITDA for our financial covenant ratios under our credit facility, supporting consistency in our financial reporting and covenant compliance, as well as comparability with our peers. • Other Items: From time to time we incur costs or realize gains that we consider outside the ordinary course of business and that we do not believe reflect the ongoing performance of the Company or our hotels. Such items may include, but are not limited to, the following: non-cash realized gains or losses on our deferred compensation plan assets; management or franchise contract termination fees; terminated transaction costs; gains or losses from legal settlements; costs incurred related to natural disasters; and gains on property insurance claim settlements, other than income related to business interruption insurance. In addition, to derive Adjusted FFO (or AFFO), we exclude any unrealized fair value adjustments to interest rate swaps and the portion of our non-cash ground lease expense recognized as interest expense. We exclude these non-cash amounts because they do not reflect the underlying performance of the Company. AFFO margins are calculated as Adjusted FFO divided by total revenues.
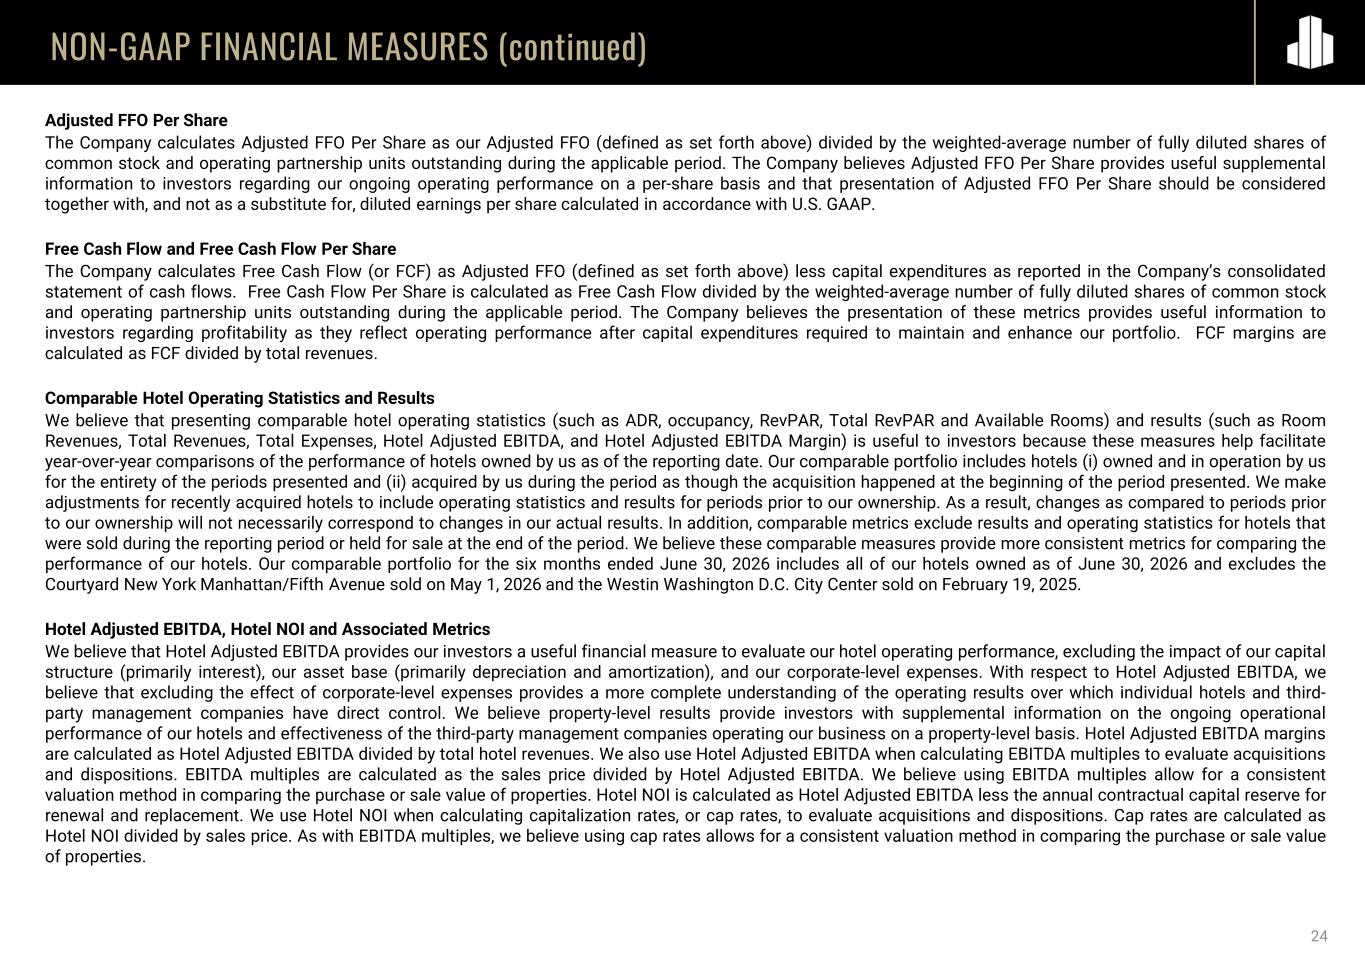
24 NON-GAAP FINANCIAL MEASURES (continued) Adjusted FFO Per Share The Company calculates Adjusted FFO Per Share as our Adjusted FFO (defined as set forth above) divided by the weighted-average number of fully diluted shares of common stock and operating partnership units outstanding during the applicable period. The Company believes Adjusted FFO Per Share provides useful supplemental information to investors regarding our ongoing operating performance on a per-share basis and that presentation of Adjusted FFO Per Share should be considered together with, and not as a substitute for, diluted earnings per share calculated in accordance with U.S. GAAP. Free Cash Flow and Free Cash Flow Per Share The Company calculates Free Cash Flow (or FCF) as Adjusted FFO (defined as set forth above) less capital expenditures as reported in the Company’s consolidated statement of cash flows. Free Cash Flow Per Share is calculated as Free Cash Flow divided by the weighted-average number of fully diluted shares of common stock and operating partnership units outstanding during the applicable period. The Company believes the presentation of these metrics provides useful information to investors regarding profitability as they reflect operating performance after capital expenditures required to maintain and enhance our portfolio. FCF margins are calculated as FCF divided by total revenues. Comparable Hotel Operating Statistics and Results We believe that presenting comparable hotel operating statistics (such as ADR, occupancy, RevPAR, Total RevPAR and Available Rooms) and results (such as Room Revenues, Total Revenues, Total Expenses, Hotel Adjusted EBITDA, and Hotel Adjusted EBITDA Margin) is useful to investors because these measures help facilitate year-over-year comparisons of the performance of hotels owned by us as of the reporting date. Our comparable portfolio includes hotels (i) owned and in operation by us for the entirety of the periods presented and (ii) acquired by us during the period as though the acquisition happened at the beginning of the period presented. We make adjustments for recently acquired hotels to include operating statistics and results for periods prior to our ownership. As a result, changes as compared to periods prior to our ownership will not necessarily correspond to changes in our actual results. In addition, comparable metrics exclude results and operating statistics for hotels that were sold during the reporting period or held for sale at the end of the period. We believe these comparable measures provide more consistent metrics for comparing the performance of our hotels. Our comparable portfolio for the six months ended June 30, 2026 includes all of our hotels owned as of June 30, 2026 and excludes the Courtyard New York Manhattan/Fifth Avenue sold on May 1, 2026 and the Westin Washington D.C. City Center sold on February 19, 2025. Hotel Adjusted EBITDA, Hotel NOI and Associated Metrics We believe that Hotel Adjusted EBITDA provides our investors a useful financial measure to evaluate our hotel operating performance, excluding the impact of our capital structure (primarily interest), our asset base (primarily depreciation and amortization), and our corporate-level expenses. With respect to Hotel Adjusted EBITDA, we believe that excluding the effect of corporate-level expenses provides a more complete understanding of the operating results over which individual hotels and third- party management companies have direct control. We believe property-level results provide investors with supplemental information on the ongoing operational performance of our hotels and effectiveness of the third-party management companies operating our business on a property-level basis. Hotel Adjusted EBITDA margins are calculated as Hotel Adjusted EBITDA divided by total hotel revenues. We also use Hotel Adjusted EBITDA when calculating EBITDA multiples to evaluate acquisitions and dispositions. EBITDA multiples are calculated as the sales price divided by Hotel Adjusted EBITDA. We believe using EBITDA multiples allow for a consistent valuation method in comparing the purchase or sale value of properties. Hotel NOI is calculated as Hotel Adjusted EBITDA less the annual contractual capital reserve for renewal and replacement. We use Hotel NOI when calculating capitalization rates, or cap rates, to evaluate acquisitions and dispositions. Cap rates are calculated as Hotel NOI divided by sales price. As with EBITDA multiples, we believe using cap rates allows for a consistent valuation method in comparing the purchase or sale value of properties.

25