Exhibit 99.1
AIB Data Centers Inc. Power First Compute Infrastructure Investor Presentation September 2026 NYSE American: AIB
Forward-Looking Statements This presentation contains forward-looking statements within the meaning of the Private Securities Litigation Reform Act of 1995, including statements regarding the expectations, plans and prospects of AIB Data Centers Inc. (AIB), such as anticipated financial performance, growth strategy, data center development, power capacity, and potential commercial opportunities. These statements are based on current assumptions and are subject to risk and uncertainties that could cause actual results to differ materially, including AIB's ability to execute its business plan, secure and develop infrastructure and power resources, enter into definitive agreements, and general economic, market, regulatory and business conditions as well as the risks described in AIB's filings with the U.S. Securities and Exchange Commission. Words such as "anticipate," "expect," "plan," "believe," "estimate," "intend," "project," "target," "may," "will," "should," "could," "would," "seek," and similar expressions, or the negative of such terms, are intended to identify forward-looking statements This presentation and any oral statements made in connection with this presentation shall neither constitute an offer to sell nor the solicitation of an offer to buy any securities, nor shall there be any sale of securities in any jurisdiction in which the offer, solicitation or sale would be unlawful prior to the registration or qualification under the securities laws of any such jurisdiction. This communication is restricted by law; it is not intended for distribution to, or use by any person in, any jurisdiction where such distribution or use would be contrary to local law or regulation. No Representations and Warranties This presentation is for informational purposes only and does not purport to contain all of the information that may be required to evaluate a possible investment decision with respect AIB or any of its subsidiaries. The recipient agrees and acknowledges that this presentation is not intended to form the basis of any investment decision by the recipient and does not constitute financial investment, tax or legal advice. No representation or warranty, express or implied, is or will be given by AIB or any of its respective affiliates, directors, officers, employees or advisers or any other person as to the accuracy or completeness of the information (including as to the accuracy, completeness or reasonableness of statements, estimates, targets, projections, assumptions or judgments) in this presentation or in any other written, oral or other communications transmitted or otherwise made available to any party in the course of its evaluation of a possible investment and no responsibility or liability whatsoever is accepted for the accuracy or sufficiency thereof or for any errors, omissions or misstatements, negligent or otherwise, relating thereto. The recipient also acknowledges and agrees that the information contained in this presentation is preliminary in nature and is subject to change, and any such changes may be material. AIB disclaims any duty to update the information contained in this presentation.
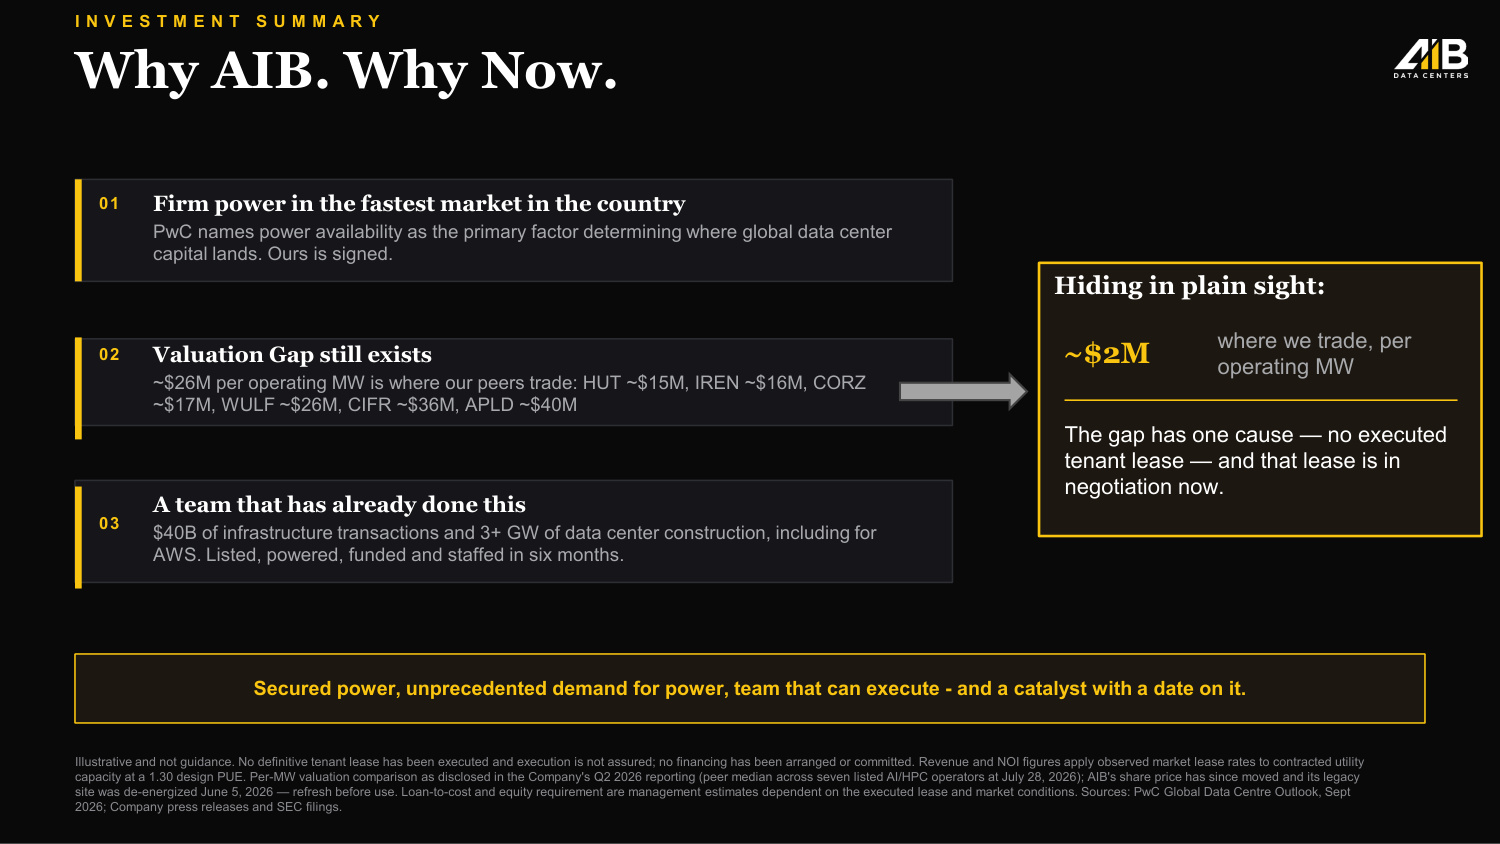
I N V E S T M E N T S U M M A R Y Why AIB. Why Now. 01 Firm power in the fastest market in the country PwC names power availability as the primary factor determining where global data center capital lands. Ours is signed. 02 Valuation Gap still exists ~$26M per operating MW is where our peers trade: HUT ~$15M, IREN ~$16M, CORZ ~$17M, WULF ~$26M, CIFR ~$36M, APLD ~$40M 03 A team that has already done this $40B of infrastructure transactions and 3+ GW of data center construction, including for AWS. Listed, powered, funded and staffed in six months. Hiding in plain sight: ~$2M where we trade, per operating MW The gap has one cause — no executed tenant lease — and that lease is in negotiation now. Secured power, unprecedented demand for power, team that can execute - and a catalyst with a date on it. Illustrative and not guidance. No definitive tenant lease has been executed and execution is not assured; no financing has been arranged or committed. Revenue and NOI figures apply observed market lease rates to contracted utility capacity at a 1.30 design PUE. Per-MW valuation comparison as disclosed in the Company's Q2 2026 reporting (peer median across seven listed AI/HPC operators at July 28, 2026); AIB's share price has since moved and its legacy site was de-energized June 5, 2026 — refresh before use. Loan-to-cost and equity requirement are management estimates dependent on the executed lease and market conditions. Sources: PwC Global Data Centre Outlook, Sept 2026; Company press releases and SEC filings.
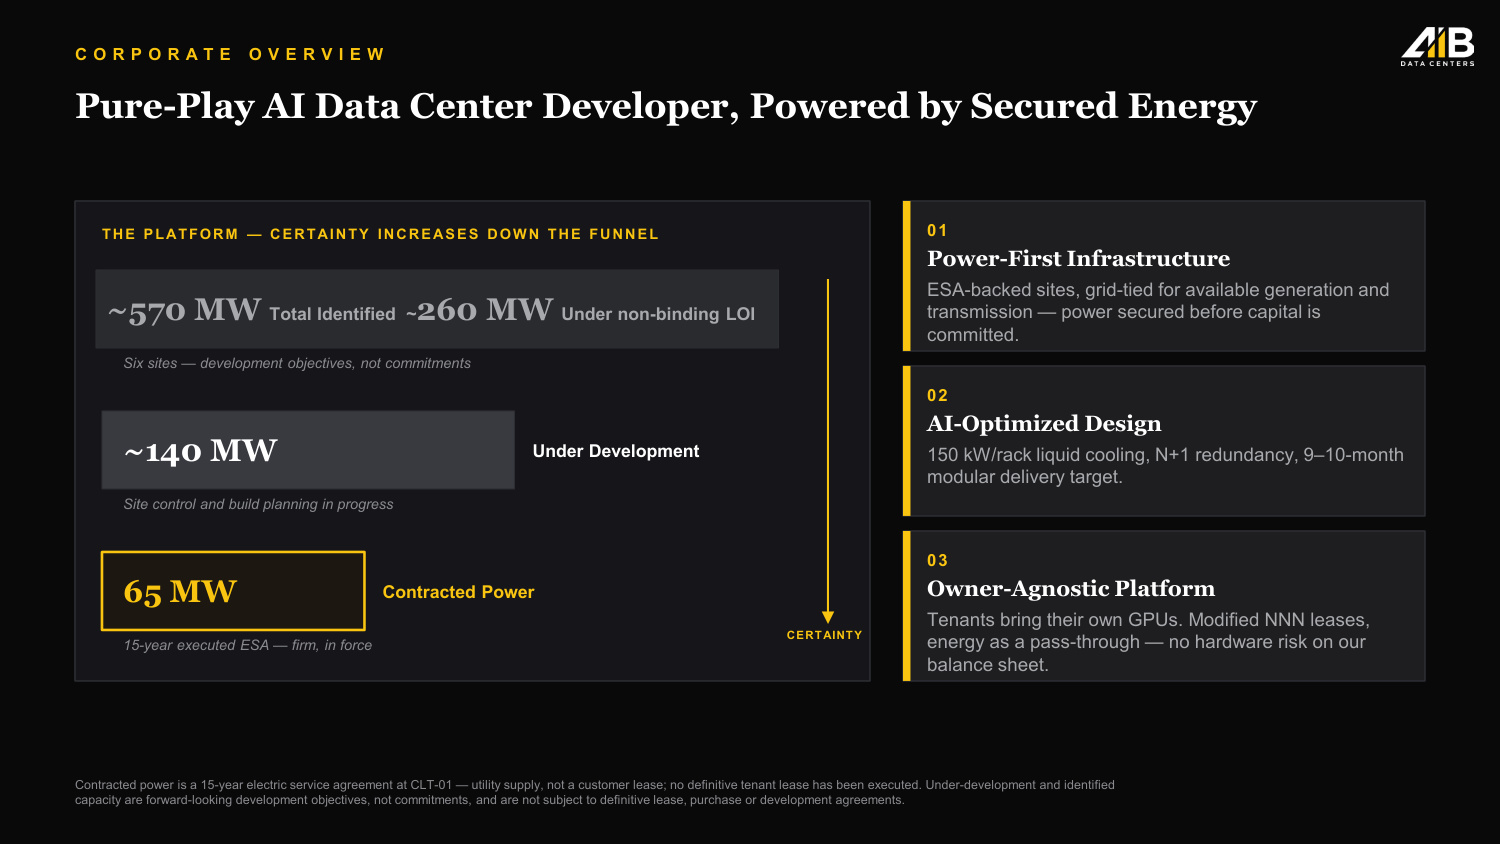
C O R P O R A T E O V E R V I E W Pure-Play AI Data Center Developer, Powered by Secured Energy THE PLATFORM — CERTAINTY INCREASES DOWN THE FUNNEL ~570 MW Total Identified ~260 MW Under non-binding LOI Six sites — development objectives, not commitments ~140 MW Under Development Site control and build planning in progress 65 MW Contracted Power 15-year executed ESA — firm, in force CERTAINTY 01 Power-First Infrastructure ESA-backed sites, grid-tied for available generation and transmission — power secured before capital is committed. 02 AI-Optimized Design 150 kW/rack liquid cooling, N+1 redundancy, 9–10-month modular delivery target. 03 Owner-Agnostic Platform Tenants bring their own GPUs. Modified NNN leases, energy as a pass-through — no hardware risk on our balance sheet. Contracted power is a 15-year electric service agreement at CLT-01 — utility supply, not a customer lease; no definitive tenant lease has been executed. Under-development and identified capacity are forward-looking development objectives, not commitments, and are not subject to definitive lease, purchase or development agreements.
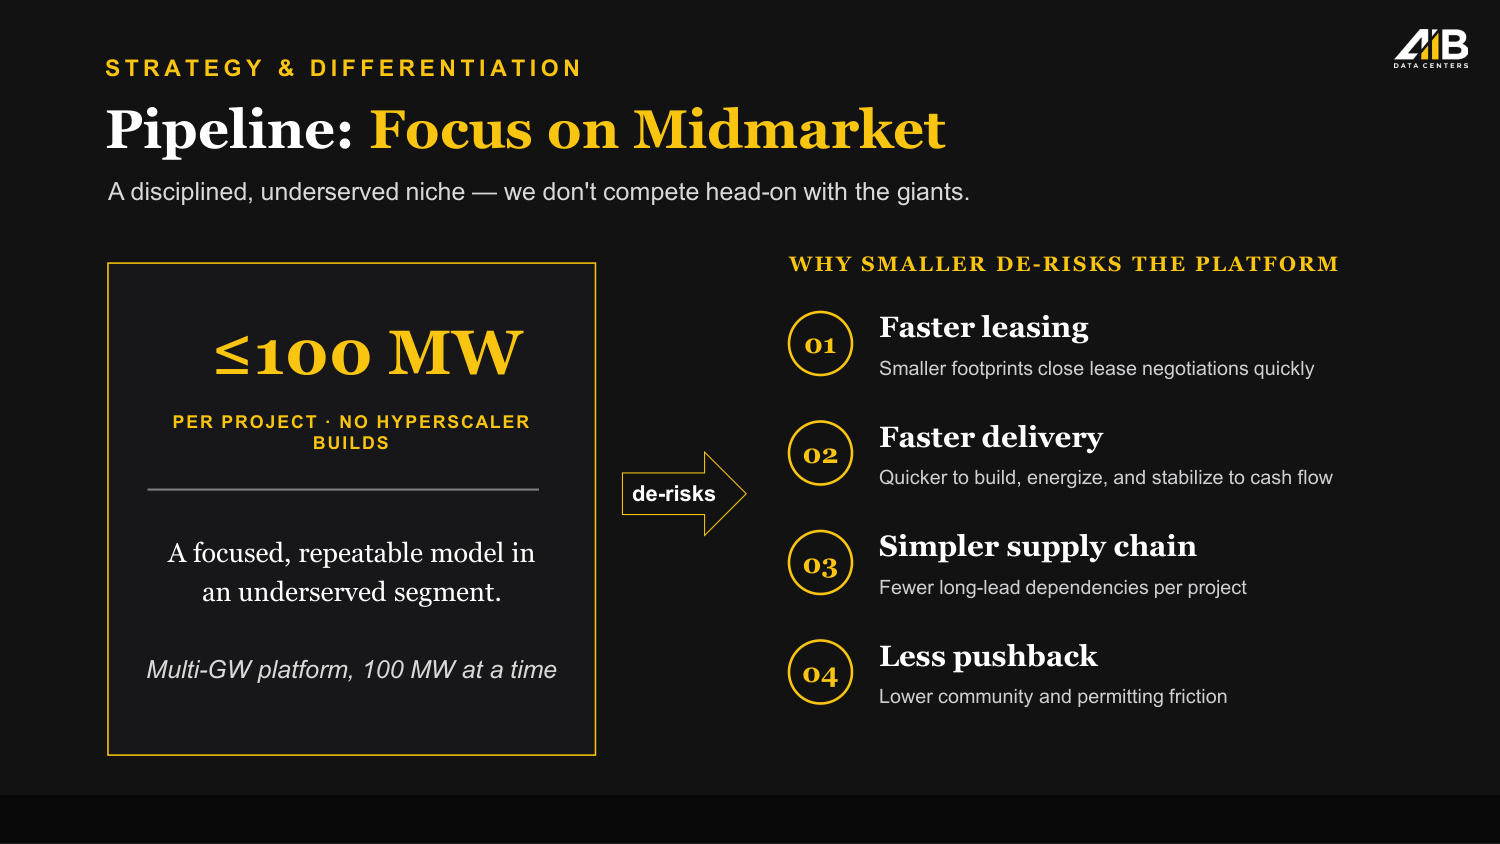
S T R A T E G Y & D I F F E R E N T I A T I O N Pipeline: Focus on Midmarket A disciplined, underserved niche — we don't compete head-on with the giants. ≤100 MW PER PROJECT · NO HYPERSCALER BUILDS A focused, repeatable model in an underserved segment. Multi-GW platform, 100 MW at a time de-risks WHY SMALLER DE-RISKS THE PLATFORM 01 Faster leasing Smaller footprints close lease negotiations quickly 02 Faster delivery Quicker to build, energize, and stabilize to cash flow 03 Simpler supply chain Fewer long-lead dependencies per project 04 Less pushback Lower community and permitting friction
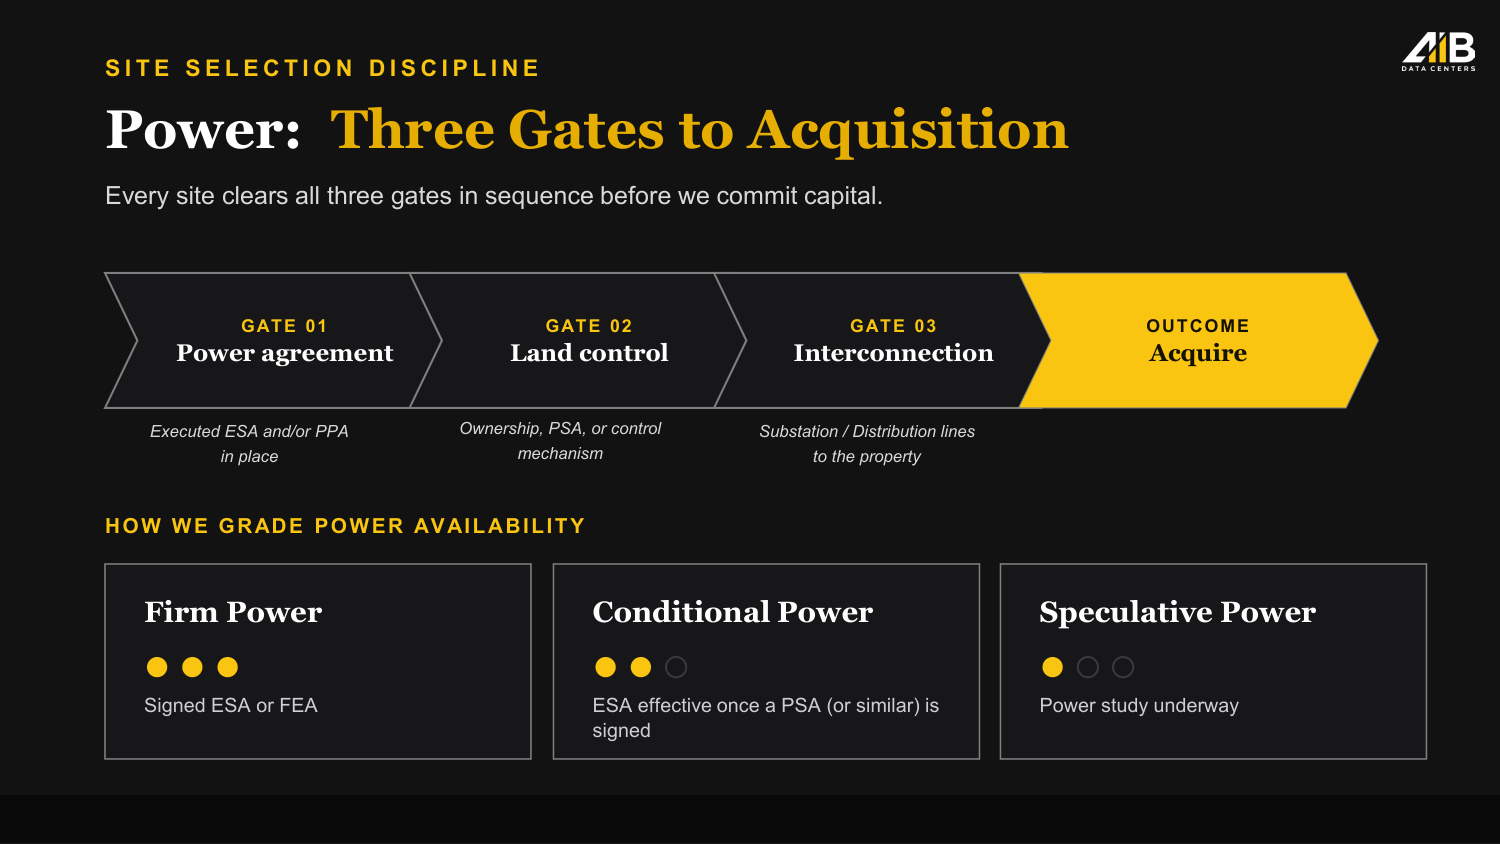
S I T E S E L E C T I O N D I S C I P L I N E Power: Three Gates to Acquisition Every site clears all three gates in sequence before we commit capital. GATE 01 Power agreement Executed ESA and/or PPA in place GATE 02 Land control Ownership, PSA, or control mechanism GATE 03 Interconnection Substation / Distribution lines to the property OUTCOME Acquire HOW WE GRADE POWER AVAILABILITY Firm Power Signed ESA or FEA Conditional Power ESA effective once a PSA (or similar) is signed Speculative Power Power study underway
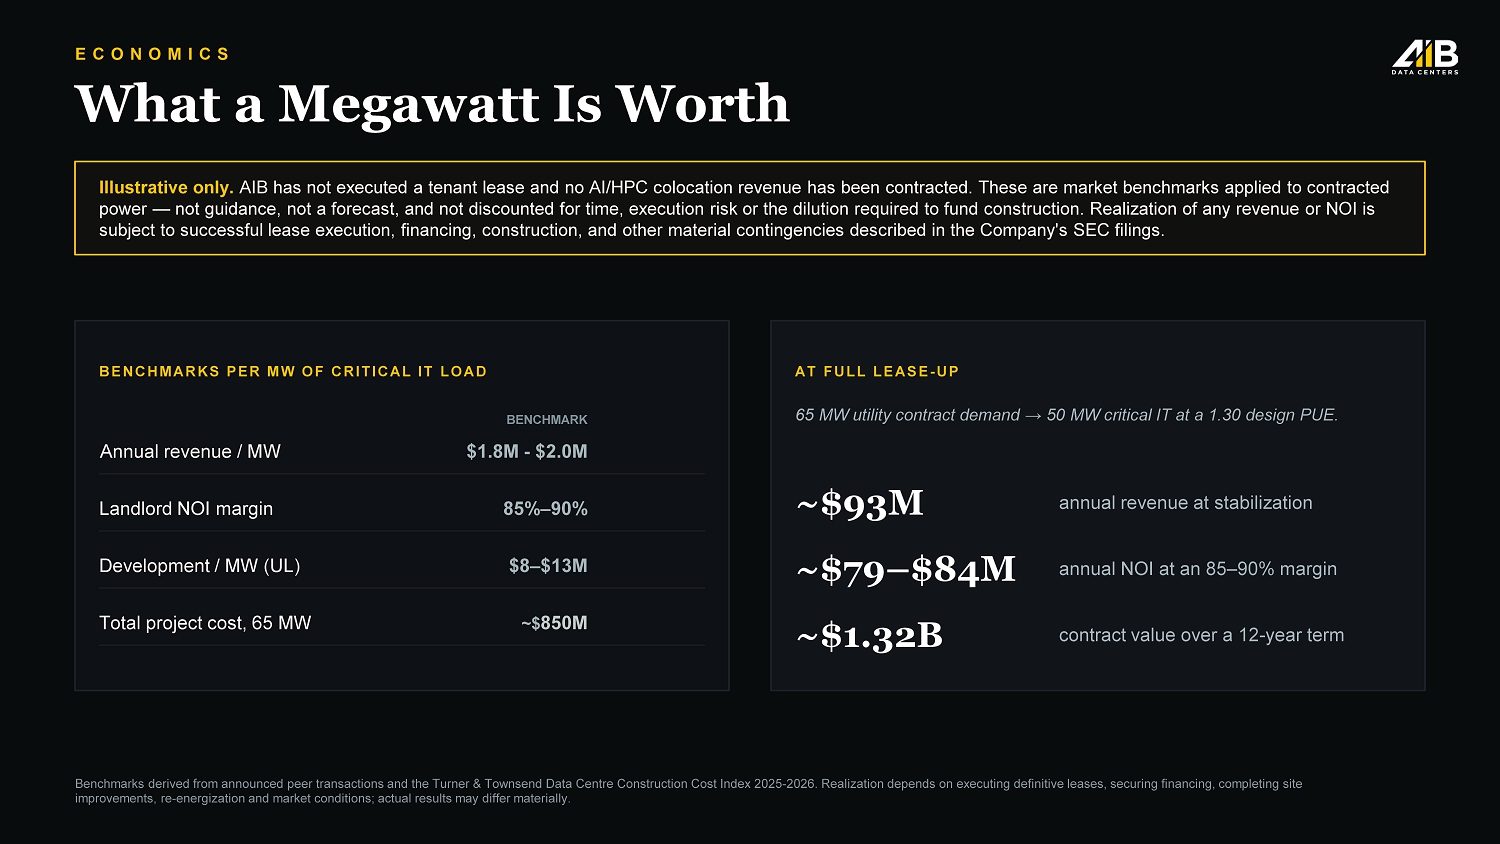
E C O N O M I C S What a Megawatt Is Worth BENCHMARKS PER MW OF CRITICAL IT LOAD BENCHMARK Annual revenue / MW $1.8M - $2.0M Landlord NOI margin 85%–90% Development / MW (UL) $8–$13M Total project cost, 65 MW ~$850M AT FULL LEASE-UP 65 MW utility contract demand → 50 MW critical IT at a 1.30 design PUE. ~$93M annual revenue at stabilization ~$79–$84M annual NOI at an 85–90% margin ~$1.32B contract value over a 12-year term Illustrative only. AIB has not executed a tenant lease and no AI/HPC colocation revenue has been contracted. These are market benchmarks applied to contracted power — not guidance, not a forecast, and not discounted for time, execution risk or the dilution required to fund construction. Realization of any revenue or NOI is subject to successful lease execution, financing, construction, and other material contingencies described in the Company's SEC filings. Benchmarks derived from announced peer transactions and the Turner & Townsend Data Centre Construction Cost Index 2025-2026. Realization depends on executing definitive leases, securing financing, completing site improvements, re-energization and market conditions; actual results may differ materially.
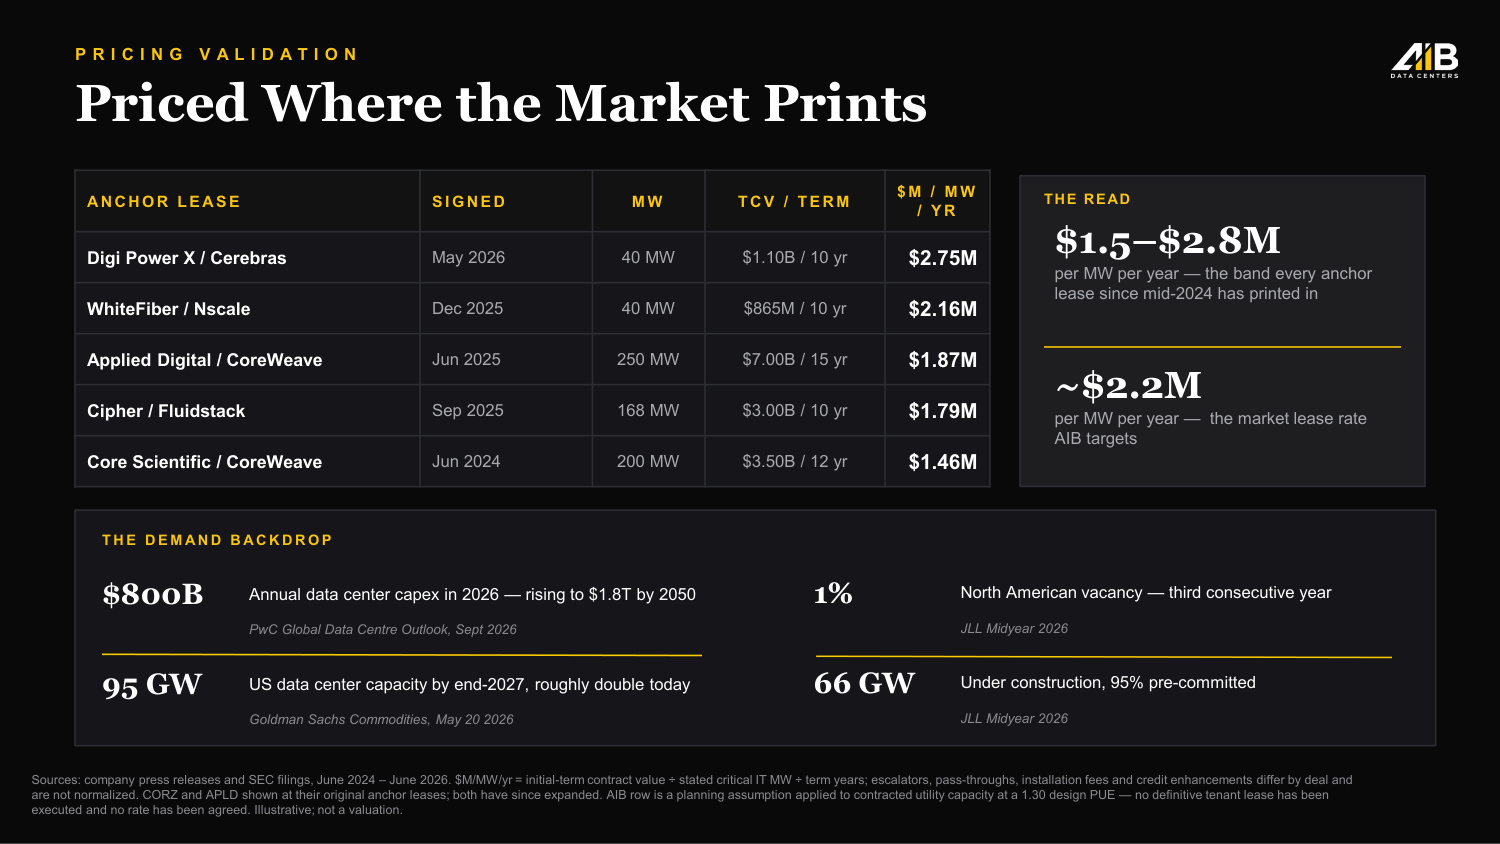
P R I C I N G V A L I D A T I O N Priced Where the Market Prints A N C H O R L E A S E S I G N E D M W T C V / T E R M $ M / M W / Y R Digi Power X / Cerebras May 2026 40 MW $1.10B / 10 yr $2.75M WhiteFiber / Nscale Dec 2025 40 MW $865M / 10 yr $2.16M Applied Digital / CoreWeave Jun 2025 250 MW $7.00B / 15 yr $1.87M Cipher / Fluidstack Sep 2025 168 MW $3.00B / 10 yr $1.79M Core Scientific / CoreWeave Jun 2024 200 MW $3.50B / 12 yr $1.46M THE READ $1.5–$2.8M per MW per year — the band every anchor lease since mid-2024 has printed in ~$2.2M per MW per year — the market lease rate AIB targets Sources: company press releases and SEC filings, June 2024 – June 2026. $M/MW/yr = initial-term contract value ÷ stated critical IT MW ÷ term years; escalators, pass-throughs, installation fees and credit enhancements differ by deal and are not normalized. CORZ and APLD shown at their original anchor leases; both have since expanded. AIB row is a planning assumption applied to contracted utility capacity at a 1.30 design PUE — no definitive tenant lease has been executed and no rate has been agreed. Illustrative; not a valuation. T H E D E M A N D B A C K D R O P $800B Annual data center capex in 2026 — rising to $1.8T by 2050 PwC Global Data Centre Outlook, Sept 2026 95 GW US data center capacity by end-2027, roughly double today Goldman Sachs Commodities, May 20 2026 1% North American vacancy — third consecutive year JLL Midyear 2026 66 GW Under construction, 95% pre-committed JLL Midyear 2026
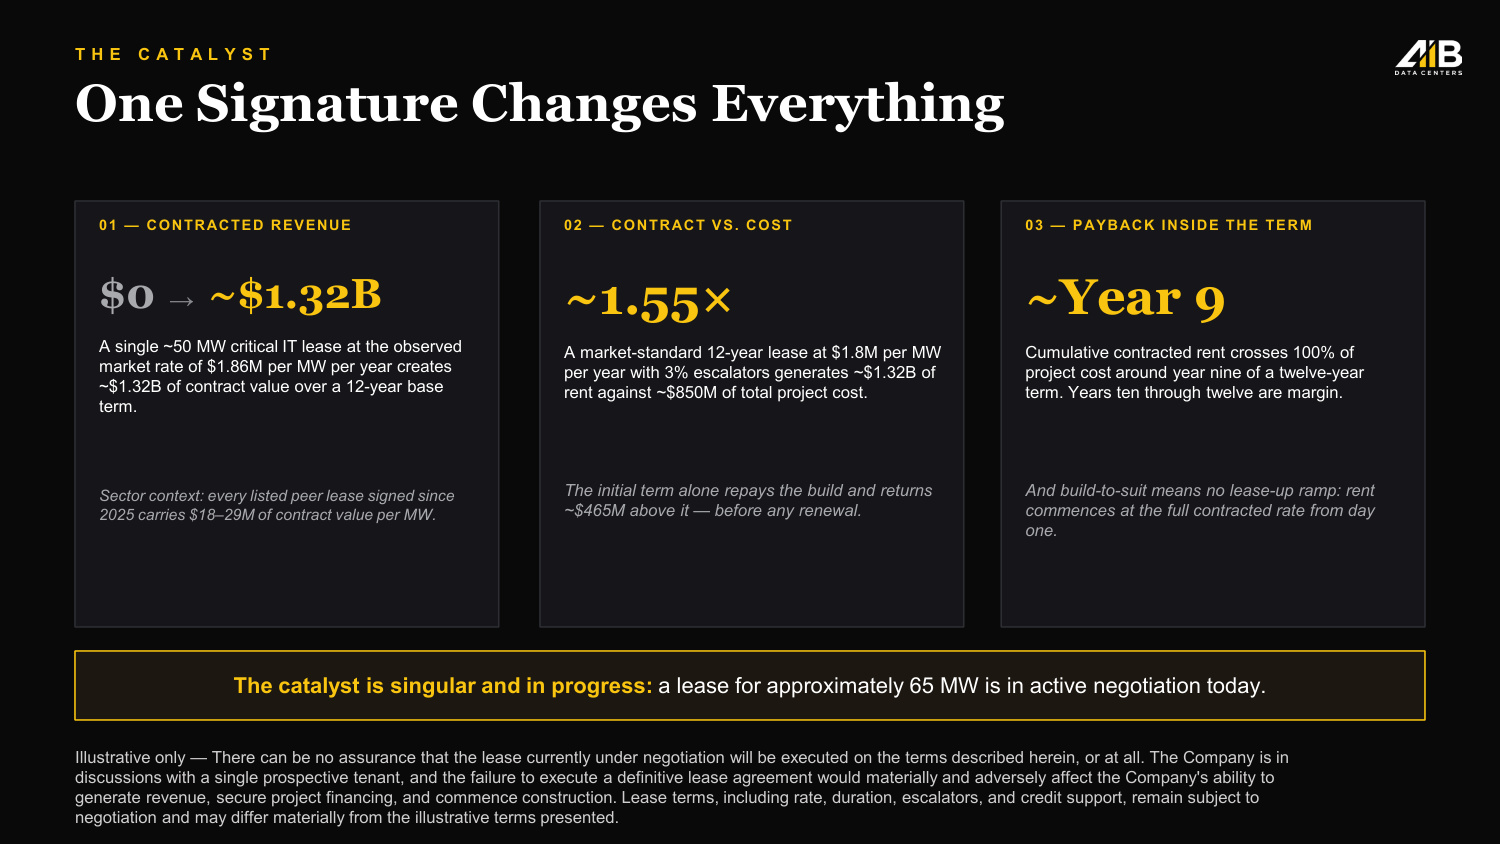
T H E C A T A L Y S T One Signature Changes Everything 01 — CONTRACTED REVENUE $0 → ~$1.32B A single ~50 MW critical IT lease at the observed market rate of $1.86M per MW per year creates ~$1.32B of contract value over a 12-year base term. Sector context: every listed peer lease signed since 2025 carries $18–29M of contract value per MW. The catalyst is singular and in progress: a lease for approximately 65 MW is in active negotiation today. Illustrative only — There can be no assurance that the lease currently under negotiation will be executed on the terms described herein, or at all. The Company is in discussions with a single prospective tenant, and the failure to execute a definitive lease agreement would materially and adversely affect the Company's ability to generate revenue, secure project financing, and commence construction. Lease terms, including rate, duration, escalators, and credit support, remain subject to negotiation and may differ materially from the illustrative terms presented. 02 — CONTRACT VS. COST 03 — PAYBACK INSIDE THE TERM ~1.55× A market-standard 12-year lease at $1.8M per MW per year with 3% escalators generates ~$1.32B of rent against ~$850M of total project cost. The initial term alone repays the build and returns ~$465M above it — before any renewal. ~Year 9 Cumulative contracted rent crosses 100% of project cost around year nine of a twelve-year term. Years ten through twelve are margin. And build-to-suit means no lease-up ramp: rent commences at the full contracted rate from day one.
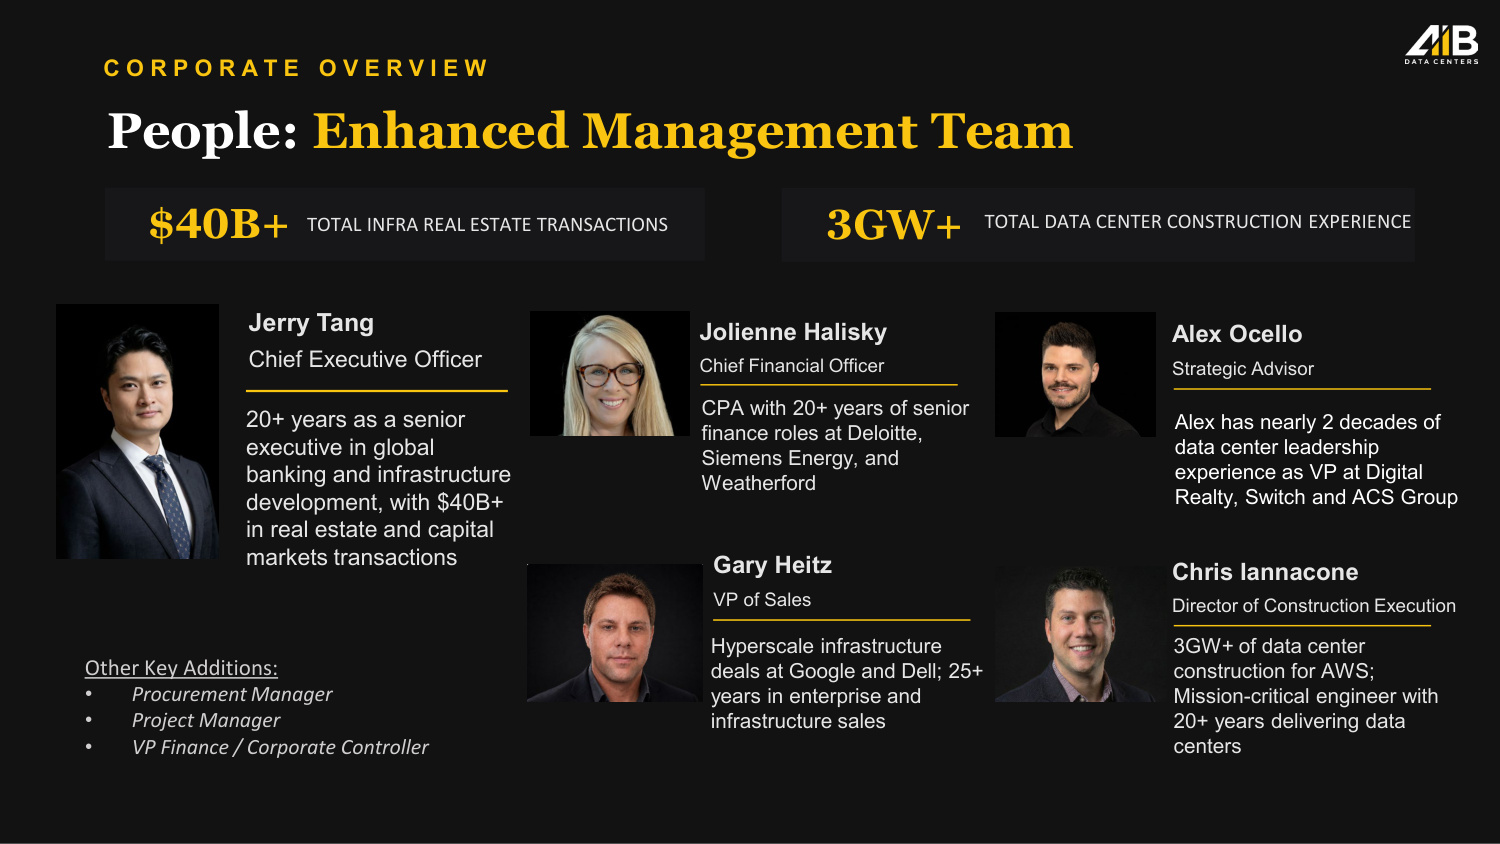
Gary Heitz VP of Sales Hyperscale infrastructure deals at Google and Dell; 25+ years in enterprise and infrastructure sales Jolienne Halisky Chief Financial Officer CPA with 20+ years of senior finance roles at Deloitte, Siemens Energy, and Weatherford Alex Ocello Strategic Advisor Chris Iannacone Director of Construction Execution 3GW+ of data center construction for AWS; Mission-critical engineer with 20+ years delivering data centers $40B+ TOTAL INFRA REAL ESTATE TRANSACTIONS 3GW+ TOTAL DATA CENTER CONSTRUCTION EXPERIENCE People: Enhanced Management Team C O R P O R A T E O V E R V I E W Jerry Tang Chief Executive Officer 20+ years as a senior executive in global banking and infrastructure development, with $40B+ in real estate and capital markets transactions Alex has nearly 2 decades of data center leadership experience as VP at Digital Realty, Switch and ACS Group Other Key Additions: • Procurement Manager • Project Manager • VP Finance / Corporate Controller
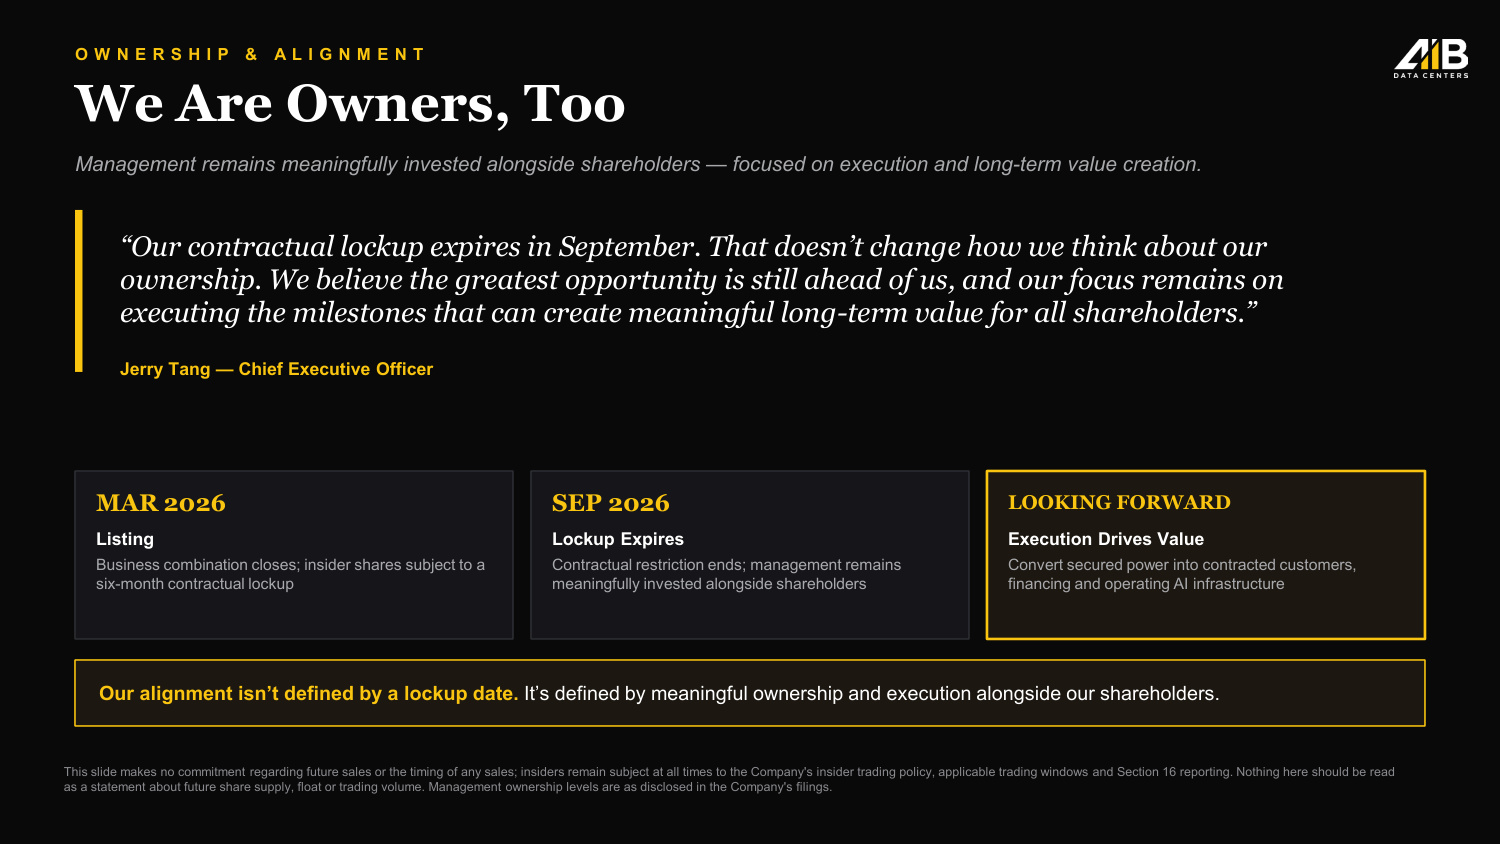
O W N E R S H I P & A L I G N M E N T We Are Owners, Too Management remains meaningfully invested alongside shareholders — focused on execution and long-term value creation. "Our contractual lockup expires in September. That doesn't change how we think about our ownership. We believe the greatest opportunity is still ahead of us, and our focus remains on executing the milestones that can create meaningful long-term value for all shareholders." Jerry Tang — Chief Executive Officer MAR 2026 Listing Business combination closes; insider shares subject to a six-month contractual lockup SEP 2026 Lockup Expires Contractual restriction ends; management remains meaningfully invested alongside shareholders LOOKING FORWARD Execution Drives Value Convert secured power into contracted customers, financing and operating AI infrastructure Our alignment isn't defined by a lockup date. It's defined by meaningful ownership and execution alongside our shareholders. This slide makes no commitment regarding future sales or the timing of any sales; insiders remain subject at all times to the Company's insider trading policy, applicable trading windows and Section 16 reporting. Nothing here should be read as a statement about future share supply, float or trading volume. Management ownership levels are as disclosed in the Company's filings.
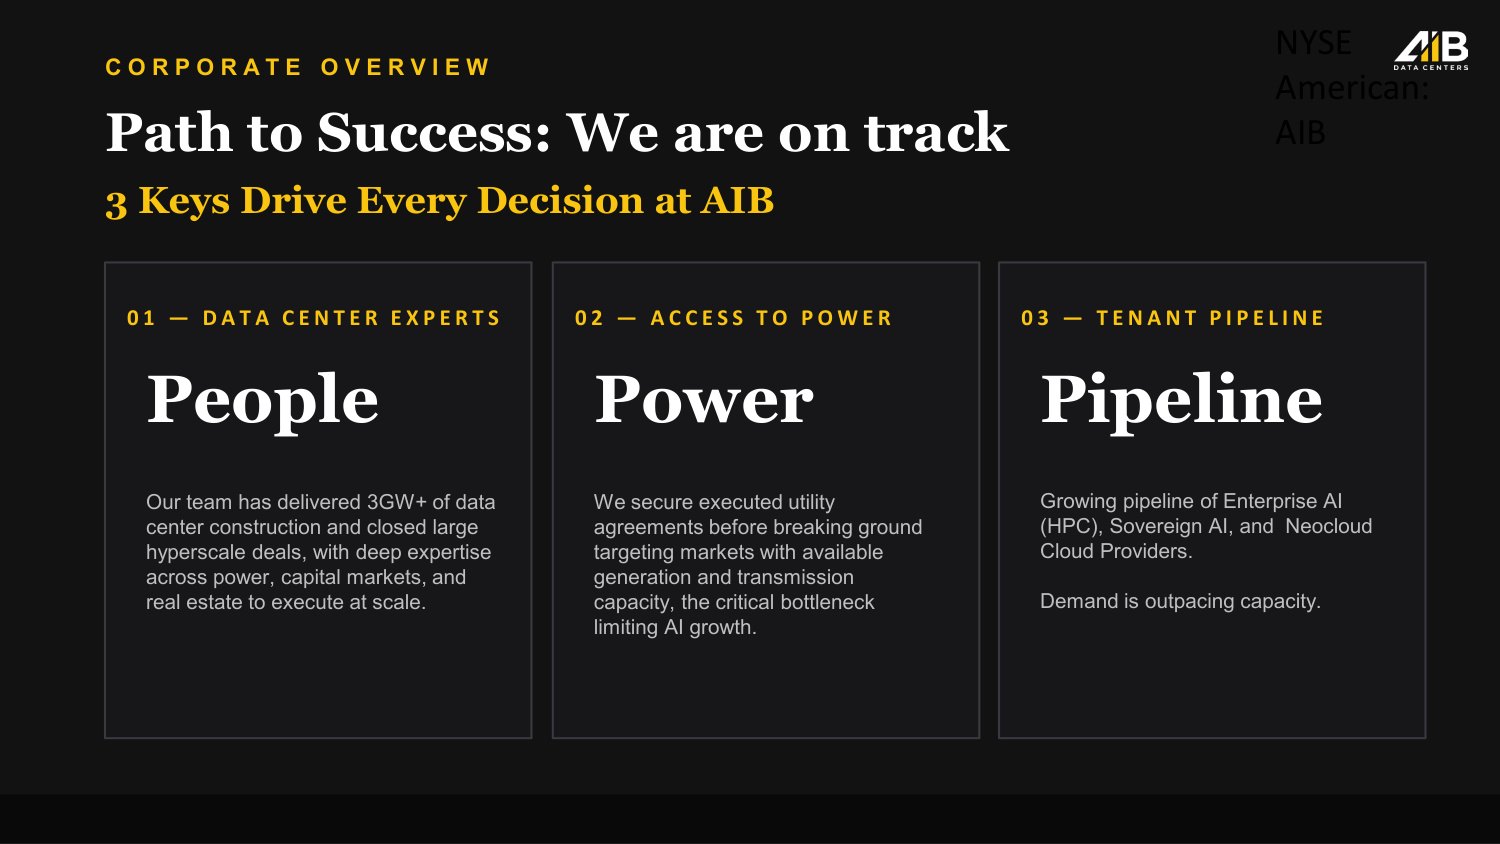
NYSE American: AIB Path to Success: We are on track 3 Keys Drive Every Decision at AIB 0 2 — A C C E S S T O P O W E R Power We secure executed utility agreements before breaking ground targeting markets with available generation and transmission capacity, the critical bottleneck limiting AI growth. 0 3 — T E N A N T P I P E L I N E Pipeline Growing pipeline of Enterprise AI (HPC), Sovereign AI, and Neocloud Cloud Providers. Demand is outpacing capacity. 0 1 — D A T A C E N T E R E X P E R T S People Our team has delivered 3GW+ of data center construction and closed large hyperscale deals, with deep expertise across power, capital markets, and real estate to execute at scale. C O R P O R A T E O V E R V I E W
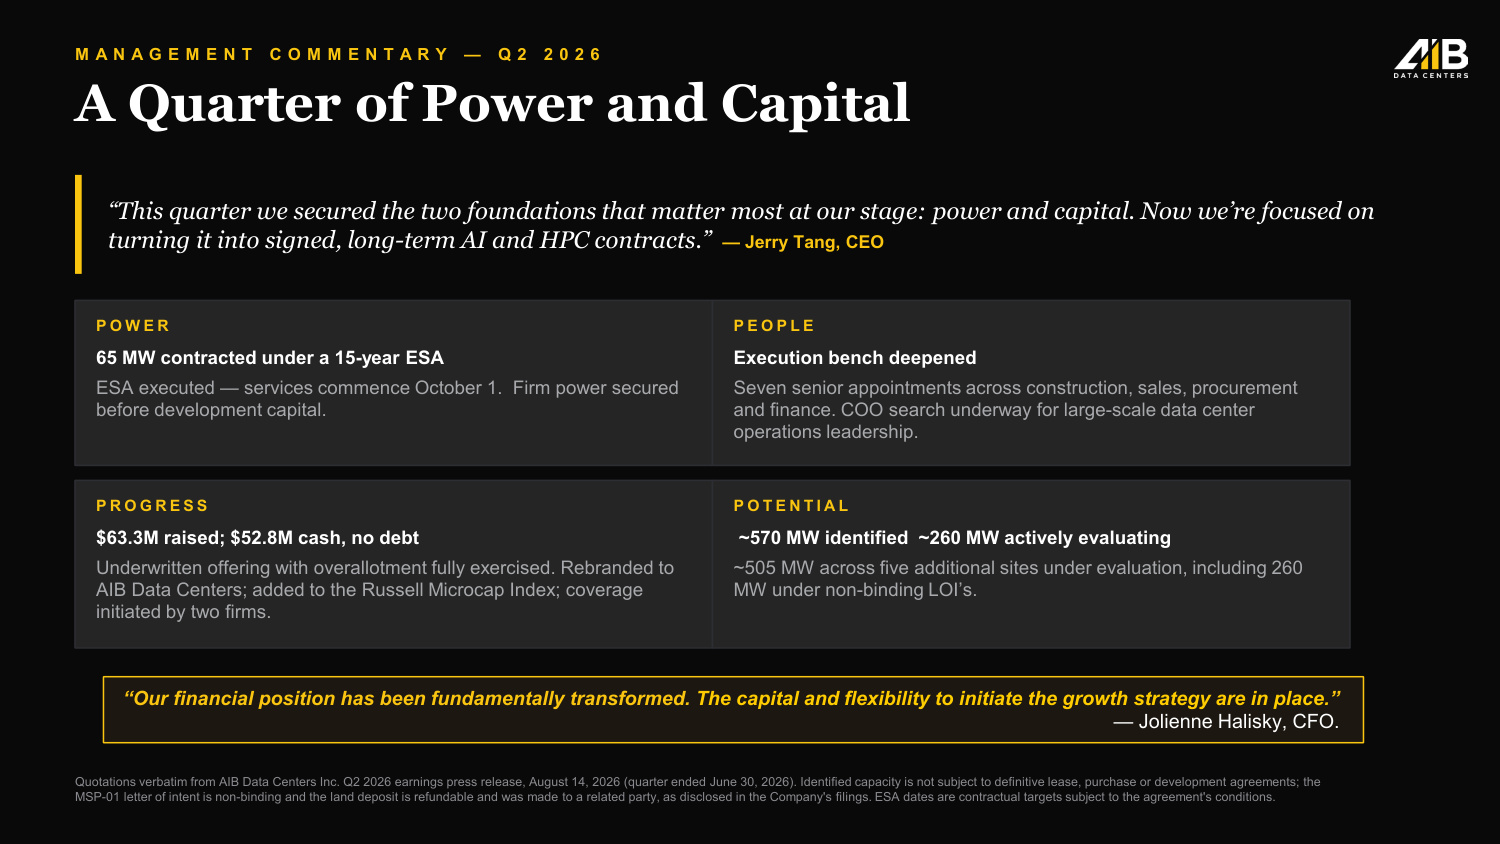
M A N A G E M E N T C O M M E N T A R Y — Q 2 2 0 2 6 A Quarter of Power and Capital "This quarter we secured the two foundations that matter most at our stage: power and capital. Now we're focused on turning it into signed, long-term AI and HPC contracts." — Jerry Tang, CEO P O W E R 65 MW contracted under a 15-year ESA ESA executed — services commence October 1. Firm power secured before development capital. P E O P L E Execution bench deepened Seven senior appointments across construction, sales, procurement and finance. COO search underway for large-scale data center operations leadership. P R O G R E S S $63.3M raised; $52.8M cash, no debt Underwritten offering with overallotment fully exercised. Rebranded to AIB Data Centers; added to the Russell Microcap Index; coverage initiated by two firms. P O T E N T I A L ~570 MW identified ~260 MW actively evaluating ~505 MW across five additional sites under evaluation, including 260 MW under non-binding LOI's. "Our financial position has been fundamentally transformed. The capital and flexibility to initiate the growth strategy are in place." — Jolienne Halisky, CFO. Quotations verbatim from AIB Data Centers Inc. Q2 2026 earnings press release, August 14, 2026 (quarter ended June 30, 2026). Identified capacity is not subject to definitive lease, purchase or development agreements; the MSP-01 letter of intent is non-binding and the land deposit is refundable and was made to a related party, as disclosed in the Company's filings. ESA dates are contractual targets subject to the agreement's conditions.
14 Appendix Financial Statements
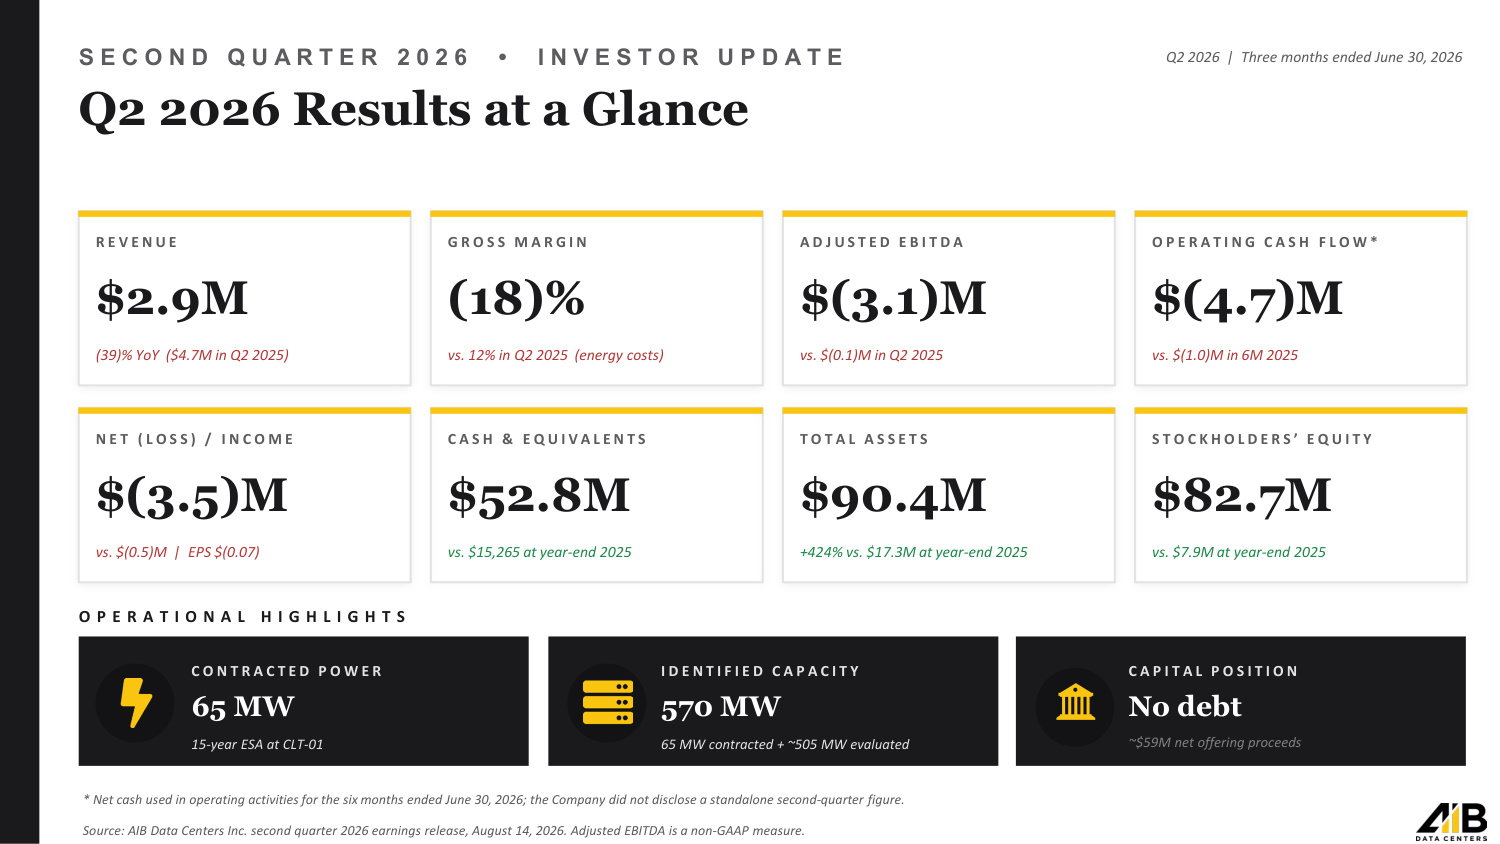
S E C O N D Q U A R T E R 2 0 2 6 • I N V E S T O R U P D A T E Q2 2026 Results at a Glance Q2 2026 | Three months ended June 30, 2026 R E V E N U E $2.9M (39)% YoY ($4.7M in Q2 2025) G R O S S M A R G I N (18)% vs. 12% in Q2 2025 (energy costs) A D J U S T E D E B I T D A $(3.1)M vs. $(0.1)M in Q2 2025 O P E R A T I N G C A S H F L O W * $(4.7)M vs. $(1.0)M in 6M 2025 N E T ( L O S S ) / I N C O M E $(3.5)M vs. $(0.5)M | EPS $(0.07) C A S H & E Q U I V A L E N T S $52.8M vs. $15,265 at year-end 2025 T O T A L A S S E T S $90.4M +424% vs. $17.3M at year-end 2025 S T O C K H O L D E R S ' E Q U I T Y $82.7M vs. $7.9M at year-end 2025 O P E R A T I O N A L H I G H L I G H T S C O N T R A C T E D P O W E R 65 MW 15-year ESA at CLT-01 I D E N T I F I E D C A P A C I T Y 570 MW 65 MW contracted + ~505 MW evaluated C A P I T A L P O S I T I O N No debt ~$59M net offering proceeds Source: AIB Data Centers Inc. second quarter 2026 earnings release, August 14, 2026. Adjusted EBITDA is a non-GAAP measure. * Net cash used in operating activities for the six months ended June 30, 2026; the Company did not disclose a standalone second-quarter figure.
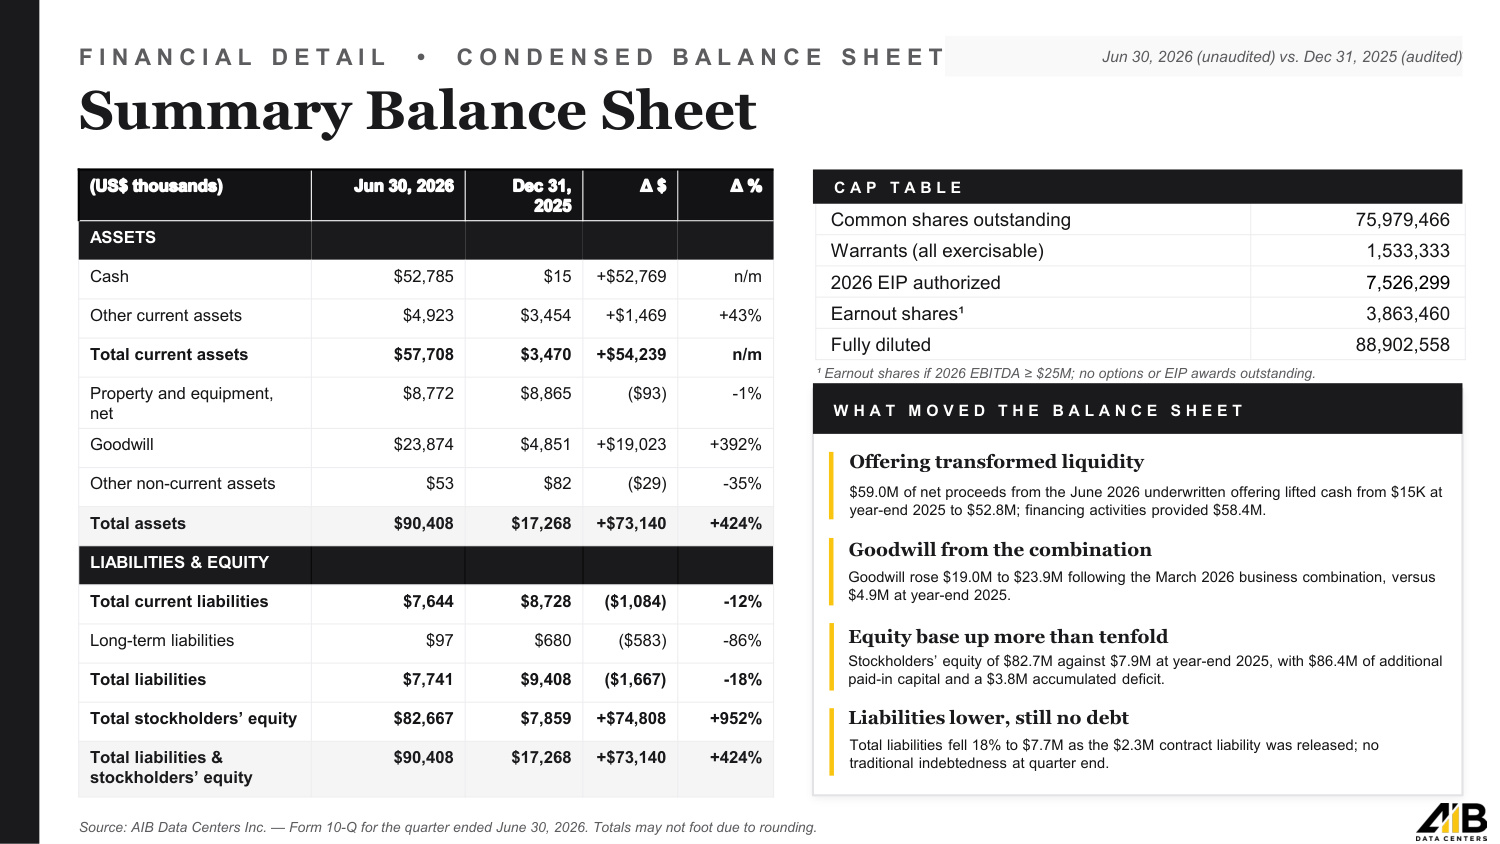
F I N A N C I A L D E T A I L • C O N D E N S E D B A L A N C E S H E E T Summary Balance Sheet Q2 2026 | As of June 30, 2026 Jun 30, 2026 (unaudited) vs. Dec 31, 2025 (audited) ASSETS Cash $52,785 $15 +$52,769 n/m Other current assets $4,923 $3,454 +$1,469 +43% Total current assets $57,708 $3,470 +$54,239 n/m Property and equipment, net $8,772 $8,865 ($93) -1% Goodwill $23,874 $4,851 +$19,023 +392% Other non-current assets $53 $82 ($29) -35% Total assets $90,408 $17,268 +$73,140 +424% LIABILITIES & EQUITY Total current liabilities $7,644 $8,728 ($1,084) -12% Long-term liabilities $97 $680 ($583) -86% Total liabilities $7,741 $9,408 ($1,667) -18% Total stockholders' equity $82,667 $7,859 +$74,808 +952% Total liabilities & stockholders' equity $90,408 $17,268 +$73,140 +424% W H A T M O V E D T H E B A L A N C E S H E E T Offering transformed liquidity $59.0M of net proceeds from the June 2026 underwritten offering lifted cash from $15K at year-end 2025 to $52.8M; financing activities provided $58.4M. Goodwill from the combination Goodwill rose $19.0M to $23.9M following the March 2026 business combination, versus $4.9M at year-end 2025. Equity base up more than tenfold Stockholders' equity of $82.7M against $7.9M at year-end 2025, with $86.4M of additional paid-in capital and a $3.8M accumulated deficit. Liabilities lower, still no debt Total liabilities fell 18% to $7.7M as the $2.3M contract liability was released; no traditional indebtedness at quarter end. Source: AIB Data Centers Inc. — Form 10-Q for the quarter ended June 30, 2026. Totals may not foot due to rounding. Common shares outstanding 75,979,466 Warrants (all exercisable) 1,533,333 2026 EIP authorized 7,526,299 Earnout shares¹ 3,863,460 Fully diluted 88,902,558 C A P T A B L E ¹ Earnout shares if 2026 EBITDA ≥ $25M; no options or EIP awards outstanding.
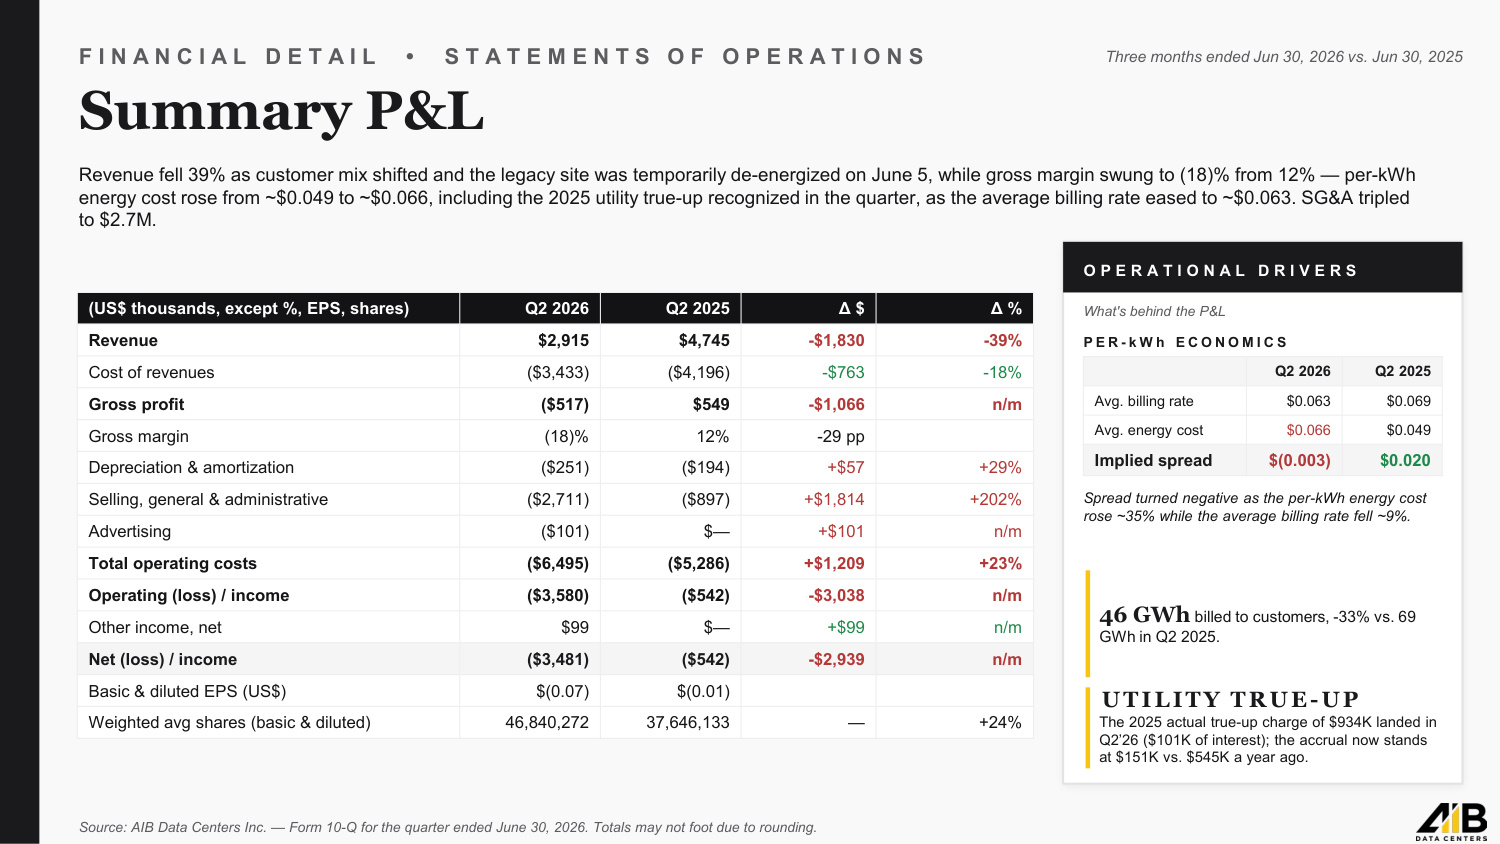
F I N A N C I A L D E T A I L • S T A T E M E N T S O F O P E R A T I O N S Summary P&L Three months ended Jun 30, 2026 vs. Jun 30, 2025 Three months ended Jun 30, 2026 vs. Jun 30, 2025 Revenue fell 39% as customer mix shifted and the legacy site was temporarily de-energized on June 5, while gross margin swung to (18)% from 12% — per-kWh energy cost rose from ~$0.049 to ~$0.066, including the 2025 utility true-up recognized in the quarter, as the average billing rate eased to ~$0.063. SG&A tripled to $2.7M. (US$ thousands, except %, EPS, shares) Q2 2026 Q2 2025 Δ $ Δ % Revenue $2,915 $4,745 -$1,830 -39% Cost of revenues ($3,433) ($4,196) -$763 -18% Gross profit ($517) $549 -$1,066 n/m Gross margin (18)% 12% -29 pp Depreciation & amortization ($251) ($194) +$57 +29% Selling, general & administrative ($2,711) ($897) +$1,814 +202% Advertising ($101) $— +$101 n/m Total operating costs ($6,495) ($5,286) +$1,209 +23% Operating (loss) / income ($3,580) ($542) -$3,038 n/m Other income, net $99 $— +$99 n/m Net (loss) / income ($3,481) ($542) -$2,939 n/m Basic & diluted EPS (US$) $(0.07) $(0.01) Weighted avg shares (basic & diluted) 46,840,272 37,646,133 — +24% O P E R A T I O N A L D R I V E R S What's behind the P&L P E R - k W h E C O N O M I C S Q2 2026 Q2 2025 Avg. billing rate $0.063 $0.069 Avg. energy cost $0.066 $0.049 Implied spread $(0.003) $0.020 Spread turned negative as the per-kWh energy cost rose ~35% while the average billing rate fell ~9%. 46 GWh billed to customers, -33% vs. 69 GWh in Q2 2025. UTILITY TRUE-UP The 2025 actual true-up charge of $934K landed in Q2'26 ($101K of interest); the accrual now stands at $151K vs. $545K a year ago. Source: AIB Data Centers Inc. — Form 10-Q for the quarter ended June 30, 2026. Totals may not foot due to rounding.
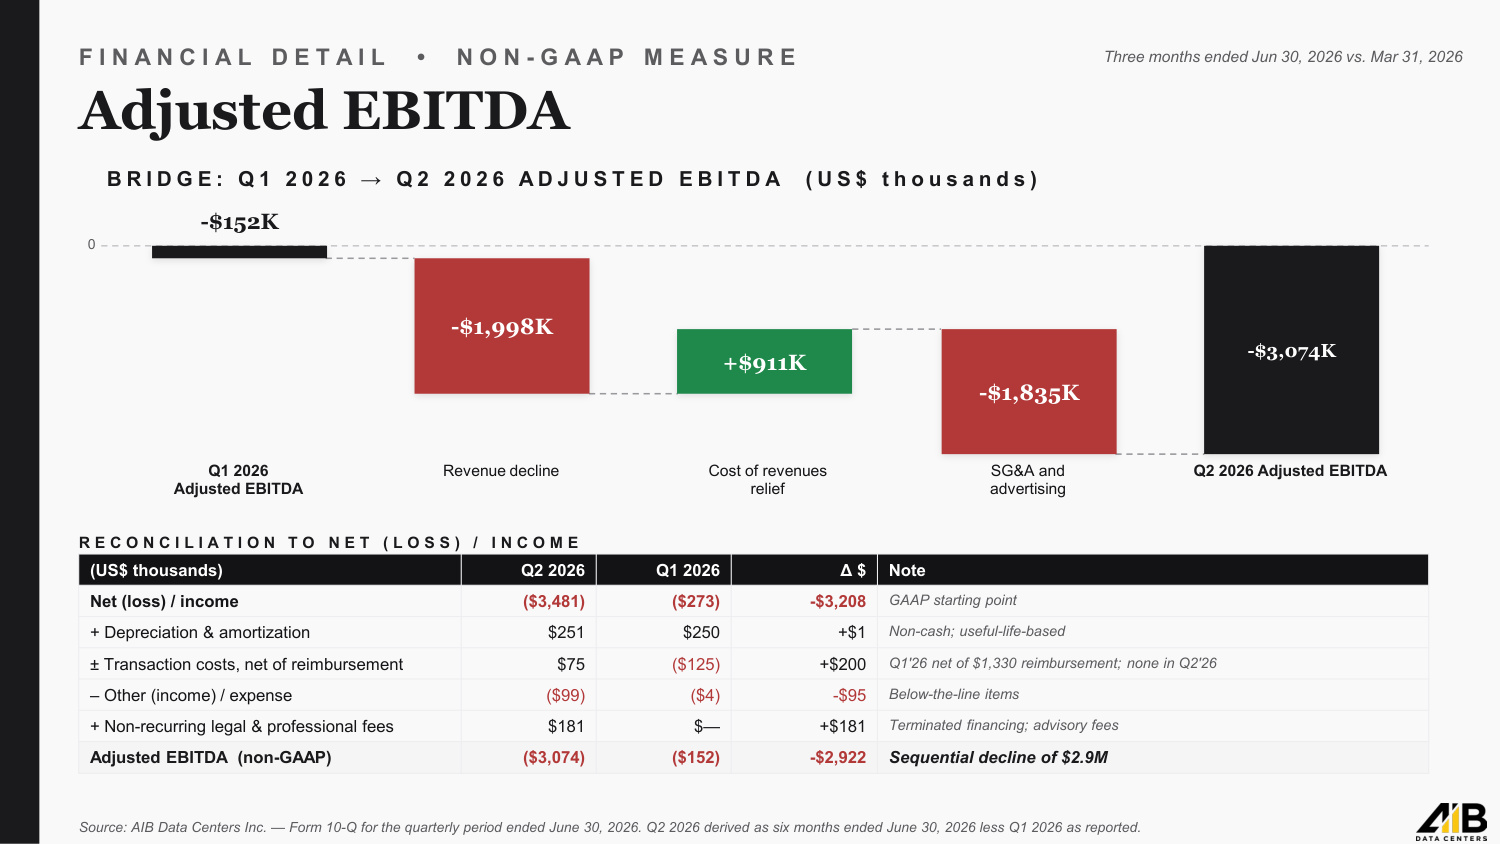
F I N A N C I A L D E T A I L • N O N - G A A P M E A S U R E Adjusted EBITDA Three months ended Jun 30, 2026 vs. Mar 31, 2026 Three months ended Jun 30, 2026 vs. Mar 31, 2026 B R I D G E : Q 1 2 0 2 6 → Q 2 2 0 2 6 A D J U S T E D E B I T D A ( U S $ t h o u s a n d s ) 0 -$152K Q1 2026 Adjusted EBITDA -$1,998K Revenue decline +$911K Cost of revenues relief -$1,835K SG&A and advertising Q2 2026 Adjusted EBITDA R E C O N C I L I A T I O N T O N E T ( L O S S ) / I N C O M E (US$ thousands) Q2 2026 Q1 2026 Δ $ Note Net (loss) / income ($3,481) ($273) -$3,208 GAAP starting point + Depreciation & amortization $251 $250 +$1 Non-cash; useful-life-based ± Transaction costs, net of reimbursement $75 ($125) +$200 Q1'26 net of $1,330 reimbursement; none in Q2'26 – Other (income) / expense ($99) ($4) -$95 Below-the-line items + Non-recurring legal & professional fees $181 $— +$181 Terminated financing; advisory fees Adjusted EBITDA (non-GAAP) ($3,074) ($152) -$2,922 Sequential decline of $2.9M Source: AIB Data Centers Inc. — Form 10-Q for the quarterly period ended June 30, 2026. Q2 2026 derived as six months ended June 30, 2026 less Q1 2026 as reported. -$3,074K