Exhibit 99.1
| Confidential Investor Presentation 1 INVESTOR PRESENTATION September 2026 |

| 2 Draft 09.13.17 2 Disclaimer (1) The acquisition is subject to applicable regulatory approvals, approval of the Minden shareholders and other customary closing conditions. The private placement is not conditional on the closing of the acquisition. This presentation has been prepared by us solely for informational purposes based on our own information, as well as information from public and industry sources. This presentation does not constitute an offer to sell, nor a solicitation of an offer to buy, any securities by any person in any jurisdiction in which it is unlawful for such person to make such an offering or solicitation. Neither the SEC nor any other regulatory agency has approved or disapproved of our securities or passed upon the accuracy or adequacy of this presentation. Any representation to the contrary is a criminal offense. Our common stock is not a deposit account of our bank subsidiary and is not insured by the FDIC or any other governmental agency. Forward-Looking Statements This presentation includes statements that are, or may be deemed, “forward-looking statements.” In some cases, these forward-looking statements can be identified by the use of forward-looking terminology, including the terms “believes,” “estimates,” “anticipates,” “expects,” “plans,” “intends,” “may,” “could,” “might,” “will,” “should,” “approximately,” “potential,” “projected,” “pro forma” or, in each case, their negatives or other variations thereon or comparable terminology, although not all forward-looking statements contain these words. Any or all of the forward-looking statements herein made by us may turn out to be incorrect. Examples of forward-looking statements include, but are not limited to, estimates with respect to the financial condition, results of operations and business of Hanover Bancorp, Inc. Any or all of the forward-looking statements in this release and in any other public statements made by Hanover Bancorp, Inc. may turn out to be incorrect as a result of inaccurate assumptions that Hanover Bancorp, Inc. might make or by known or unknown risks and uncertainties. There are a number of important factors that could cause future results to differ materially from historical performance and these forward-looking statements. Factors that might cause such a difference include, but are not limited to: (1) the impact of a pandemic or other health crises and the government’s response to such pandemic or crises on our operations as well as those of our customers and on the economy generally and in our market area specifically; (2) competitive pressures among depository institutions may increase significantly; (3) changes in the interest rate environment may reduce interest margins; (4) loan origination and sale volumes, charge-offs and credit loss provisions may vary substantially from period to period; (5) general economic conditions may be less favorable than expected; (6) political developments, wars or other hostilities may disrupt or increase volatility in securities markets or other economic conditions; (7) legislative or regulatory changes or actions may adversely affect the businesses in which Hanover Bancorp, Inc. is engaged; (8) the impacts of tariffs, sanctions and other trade policies of the United States and its global trading counterparts; (9) changing political conditions and the outcome of federal, state, and local elections and the resulting economic and other impact on the areas in which we conduct business; (10) changes relating to rent regulation and housing, including recent legislative action in New York City to freeze rents on certain rent-regulated properties; (11) changes and trends in the securities markets may adversely impact Hanover Bancorp, Inc.; (12) a delayed or incomplete resolution of regulatory issues could adversely impact our planning; (13) difficulties in integrating any businesses that we may acquire, which may increase our expenses and delay the achievement of any benefits that we may expect from such acquisitions; (14) the impact of the strategic credit cleanup that we implemented during the fourth quarter of 2025 and the wholesale funding restructuring we implemented during the first quarter of 2026; (15) the impact of reputation risk created by the developments discussed above on such matters as business generation and retention, funding and liquidity could be significant; (16) our ability to hire and retain key personnel; and (17) the outcome of any future regulatory and legal investigations and proceedings may not be anticipated. By their nature, forward-looking statements involve risks and uncertainties because they relate to future events, competitive dynamics, and banking, regulatory, and other developments, and depend on anticipated circumstances that may or may not occur (or may occur on longer or shorter timelines than anticipated). They can be affected by inaccurate assumptions that we might make, or by known or unknown risks and uncertainties, including those discussed in our Annual Report on Form 10-K under Item 1A - Risk Factors, as updated by our subsequent filings with the Securities and Exchange Commission. Forward-looking statements speak only as of the date they are made. Although we believe that we have a reasonable basis for each forward-looking statement contained in this presentation, we caution you that forward-looking statements are not guarantees of future performance and that our actual results of operations, financial condition, and liquidity, and the development of the industry in which we operate may differ materially from the forward-looking statements contained in this presentation. In addition, even if our results of operations, financial condition and liquidity, and the development of the industry in which we operate are consistent with the forward-looking statements contained in this presentation, they may not be predictive of results or developments in future periods. Any forward-looking statements that we make in this presentation speak only as of the respective dates of such statements, and we undertake no obligation to update such statements to reflect events or circumstances after the date of this presentation, except as required by law. Non-GAAP Financial Measures This presentation contains supplemental financial information, which includes the Company’s adjusted net income, adjusted diluted earnings per share, adjusted return on average assets (“Adjusted ROAA”), adjusted return on average common equity, tangible common equity (“TCE”) ratio, TCE, tangible assets, tangible book value per share, return on average tangible common equity (“ROATCE”), Adjusted ROATCE and pre-provision net revenue (“PPNR”), which are financial measures not determined in accordance with accounting principles generally accepted in the United States of America (“GAAP”). Our management uses these non-GAAP measures in its analysis of our performance. These measures should not be considered a substitute for GAAP basis measures nor should they be viewed as a substitute for operating results determined in accordance with GAAP. Management believes that the presentation of these non-GAAP financial measures provides both management and investors useful supplemental information that is essential to a proper understanding of our financial condition and results. Non-GAAP measures are not formally defined under GAAP, and other entities may use calculation methods that differ from those used by us. As a complement to GAAP financial measures, our management believes these non-GAAP financial measures assist investors in comparing the financial condition and results of operations of financial institutions due to the industry prevalence of such non-GAAP measures. A reconciliation of our non-GAAP financial measures to the most directly comparable GAAP measures has been provided herein in the appendix to this presentation. |
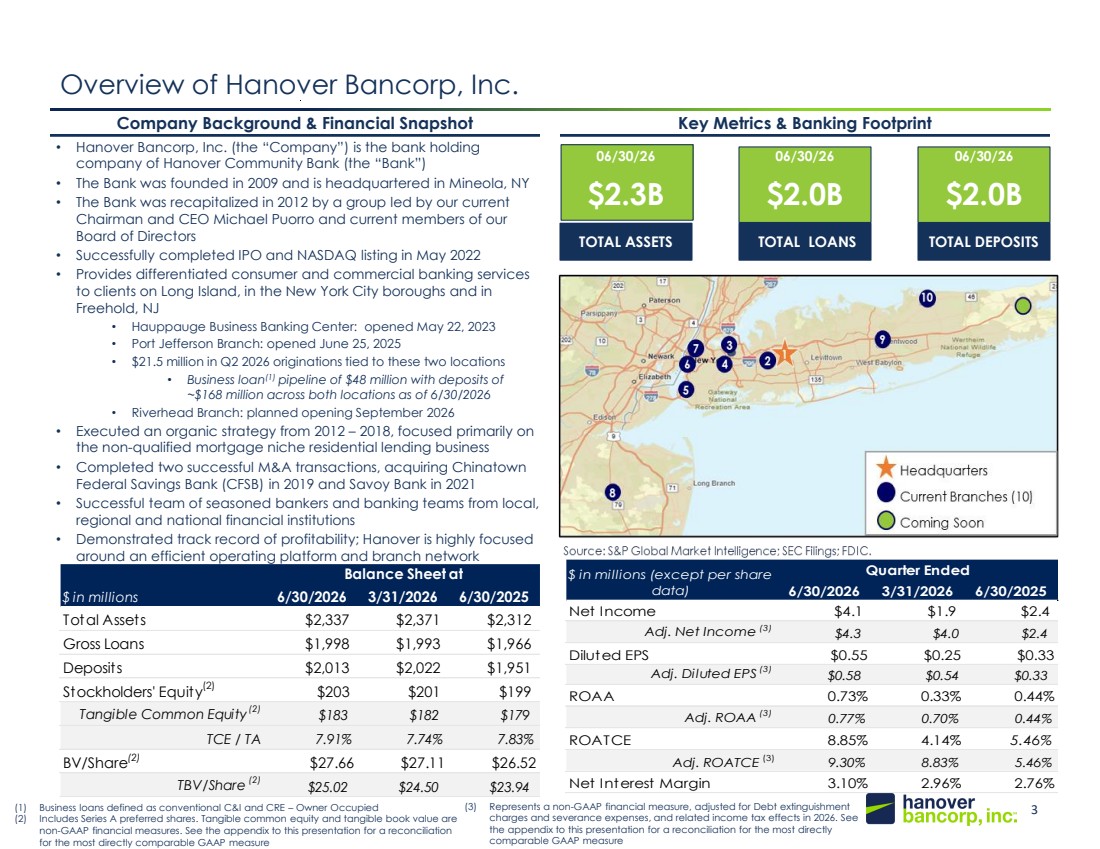
| 3 148, 201, 61 20, 49, 89 Overview of Hanover Bancorp, Inc. • Hanover Bancorp, Inc. (the “Company”) is the bank holding company of Hanover Community Bank (the “Bank”) • The Bank was founded in 2009 and is headquartered in Mineola, NY • The Bank was recapitalized in 2012 by a group led by our current Chairman and CEO Michael Puorro and current members of our Board of Directors • Successfully completed IPO and NASDAQ listing in May 2022 • Provides differentiated consumer and commercial banking services to clients on Long Island, in the New York City boroughs and in Freehold, NJ • Hauppauge Business Banking Center: opened May 22, 2023 • Port Jefferson Branch: opened June 25, 2025 • $21.5 million in Q2 2026 originations tied to these two locations • Business loan(1) pipeline of $48 million with deposits of ~$168 million across both locations as of 6/30/2026 • Riverhead Branch: planned opening September 2026 • Executed an organic strategy from 2012 – 2018, focused primarily on the non-qualified mortgage niche residential lending business • Completed two successful M&A transactions, acquiring Chinatown Federal Savings Bank (CFSB) in 2019 and Savoy Bank in 2021 • Successful team of seasoned bankers and banking teams from local, regional and national financial institutions • Demonstrated track record of profitability; Hanover is highly focused around an efficient operating platform and branch network Company Background & Financial Snapshot Key Metrics & Banking Footprint 06/30/26 $2.3B TOTAL ASSETS 06/30/26 $2.0B TOTAL LOANS 06/30/26 $2.0B TOTAL DEPOSITS Headquarters Current Branches (10) 9 8 2 3 4 5 6 7 1 10 (1) Business loans defined as conventional C&I and CRE – Owner Occupied (2) Includes Series A preferred shares. Tangible common equity and tangible book value are non-GAAP financial measures. See the appendix to this presentation for a reconciliation for the most directly comparable GAAP measure Source: S&P Global Market Intelligence; SEC Filings; FDIC. (3) Represents a non-GAAP financial measure, adjusted for Debt extinguishment charges and severance expenses, and related income tax effects in 2026. See the appendix to this presentation for a reconciliation for the most directly comparable GAAP measure $ in millions 6/30/2026 3/31/2026 6/30/2025 Total Assets $2,337 $2,371 $2,312 Gross Loans $1,998 $1,993 $1,966 Deposits $2,013 $2,022 $1,951 Stockholders' Equity(2) $203 $201 $199 Tangible Common Equity(2) $183 $182 $179 TCE / TA 7.91% 7.74% 7.83% BV/Share(2) $27.66 $27.11 $26.52 TBV/Share (2) $25.02 $24.50 $23.94 Balance Sheet at 6/30/2026 3/31/2026 6/30/2025 Net Income $4.1 $1.9 $2.4 Adj. Net Income (3) $4.3 $4.0 $2.4 Diluted EPS $0.55 $0.25 $0.33 Adj. Diluted EPS (3) $0.58 $0.54 $0.33 ROAA 0.73% 0.33% 0.44% Adj. ROAA (3) 0.77% 0.70% 0.44% ROATCE 8.85% 4.14% 5.46% Adj. ROATCE (3) 9.30% 8.83% 5.46% Net Interest Margin 3.10% 2.96% 2.76% $ in millions (except per share Quarter Ended data) |
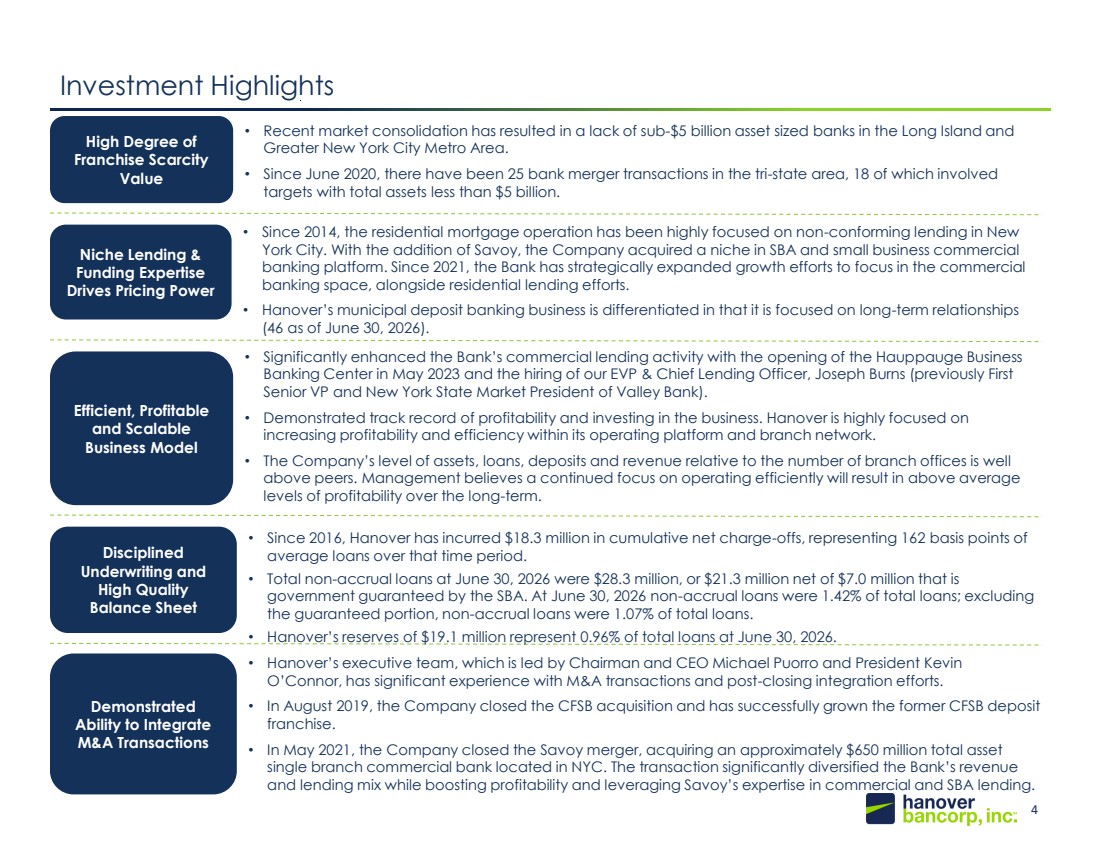
| 4 148, 201, 61 20, 49, 89 Investment Highlights • Recent market consolidation has resulted in a lack of sub-$5 billion asset sized banks in the Long Island and Greater New York City Metro Area. • Since June 2020, there have been 25 bank merger transactions in the tri-state area, 18 of which involved targets with total assets less than $5 billion. High Degree of Franchise Scarcity Value • Since 2014, the residential mortgage operation has been highly focused on non-conforming lending in New York City. With the addition of Savoy, the Company acquired a niche in SBA and small business commercial banking platform. Since 2021, the Bank has strategically expanded growth efforts to focus in the commercial banking space, alongside residential lending efforts. • Hanover’s municipal deposit banking business is differentiated in that it is focused on long-term relationships (46 as of June 30, 2026). Niche Lending & Funding Expertise Drives Pricing Power • Significantly enhanced the Bank’s commercial lending activity with the opening of the Hauppauge Business Banking Center in May 2023 and the hiring of our EVP & Chief Lending Officer, Joseph Burns (previously First Senior VP and New York State Market President of Valley Bank). • Demonstrated track record of profitability and investing in the business. Hanover is highly focused on increasing profitability and efficiency within its operating platform and branch network. • The Company’s level of assets, loans, deposits and revenue relative to the number of branch offices is well above peers. Management believes a continued focus on operating efficiently will result in above average levels of profitability over the long-term. Efficient, Profitable and Scalable Business Model • Since 2016, Hanover has incurred $18.3 million in cumulative net charge-offs, representing 162 basis points of average loans over that time period. • Total non-accrual loans at June 30, 2026 were $28.3 million, or $21.3 million net of $7.0 million that is government guaranteed by the SBA. At June 30, 2026 non-accrual loans were 1.42% of total loans; excluding the guaranteed portion, non-accrual loans were 1.07% of total loans. • Hanover’s reserves of $19.1 million represent 0.96% of total loans at June 30, 2026. Disciplined Underwriting and High Quality Balance Sheet • Hanover’s executive team, which is led by Chairman and CEO Michael Puorro and President Kevin O’Connor, has significant experience with M&A transactions and post-closing integration efforts. • In August 2019, the Company closed the CFSB acquisition and has successfully grown the former CFSB deposit franchise. • In May 2021, the Company closed the Savoy merger, acquiring an approximately $650 million total asset single branch commercial bank located in NYC. The transaction significantly diversified the Bank’s revenue and lending mix while boosting profitability and leveraging Savoy’s expertise in commercial and SBA lending. Demonstrated Ability to Integrate M&A Transactions |
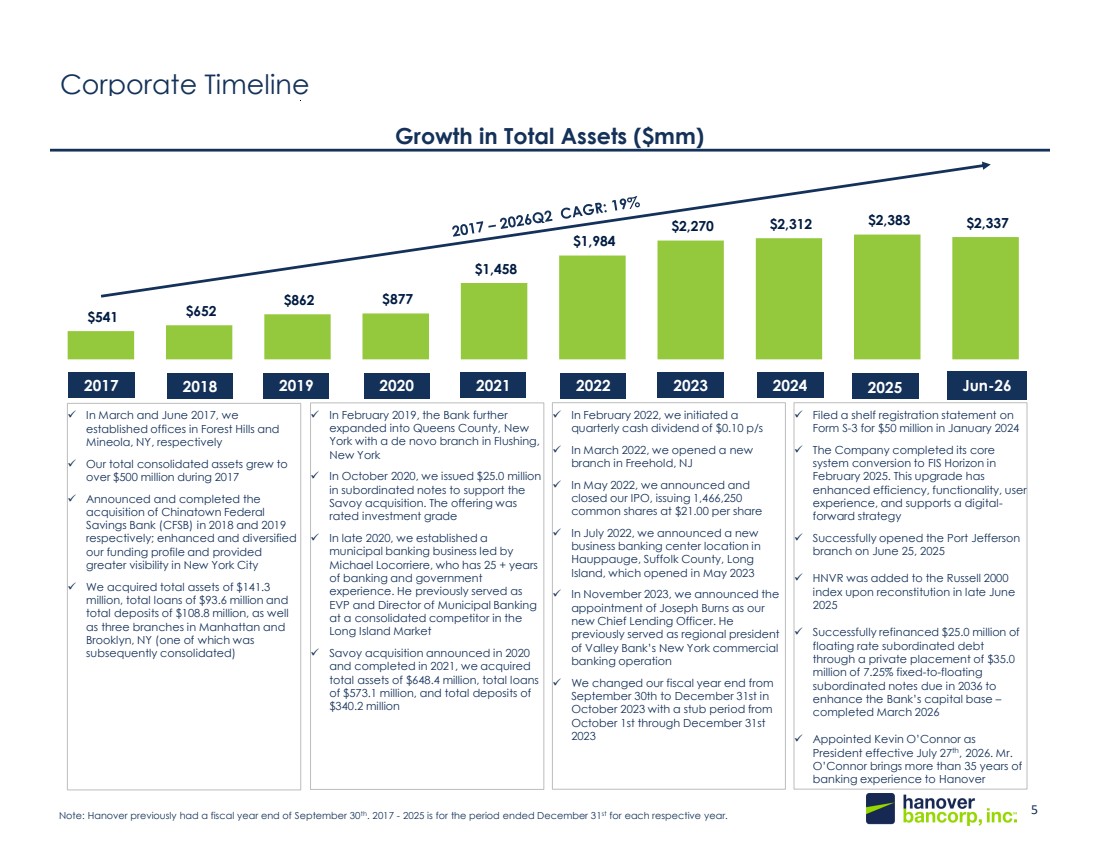
| 5 148, 201, 61 20, 49, 89 $541 $652 $862 $877 $1,458 $1,984 $2,270 $2,312 $2,383 $2,337 Corporate Timeline Growth in Total Assets ($mm) Note: Hanover previously had a fiscal year end of September 30th. 2017 - 2025 is for the period ended December 31st for each respective year. ✓ In February 2022, we initiated a quarterly cash dividend of $0.10 p/s ✓ In March 2022, we opened a new branch in Freehold, NJ ✓ In May 2022, we announced and closed our IPO, issuing 1,466,250 common shares at $21.00 per share ✓ In July 2022, we announced a new business banking center location in Hauppauge, Suffolk County, Long Island, which opened in May 2023 ✓ In November 2023, we announced the appointment of Joseph Burns as our new Chief Lending Officer. He previously served as regional president of Valley Bank’s New York commercial banking operation ✓ We changed our fiscal year end from September 30th to December 31st in October 2023 with a stub period from October 1st through December 31st 2023 ✓ In March and June 2017, we established offices in Forest Hills and Mineola, NY, respectively ✓ Our total consolidated assets grew to over $500 million during 2017 ✓ Announced and completed the acquisition of Chinatown Federal Savings Bank (CFSB) in 2018 and 2019 respectively; enhanced and diversified our funding profile and provided greater visibility in New York City ✓ We acquired total assets of $141.3 million, total loans of $93.6 million and total deposits of $108.8 million, as well as three branches in Manhattan and Brooklyn, NY (one of which was subsequently consolidated) ✓ In February 2019, the Bank further expanded into Queens County, New York with a de novo branch in Flushing, New York ✓ In October 2020, we issued $25.0 million in subordinated notes to support the Savoy acquisition. The offering was rated investment grade ✓ In late 2020, we established a municipal banking business led by Michael Locorriere, who has 25 + years of banking and government experience. He previously served as EVP and Director of Municipal Banking at a consolidated competitor in the Long Island Market ✓ Savoy acquisition announced in 2020 and completed in 2021, we acquired total assets of $648.4 million, total loans of $573.1 million, and total deposits of $340.2 million ✓ Filed a shelf registration statement on Form S-3 for $50 million in January 2024 ✓ The Company completed its core system conversion to FIS Horizon in February 2025. This upgrade has enhanced efficiency, functionality, user experience, and supports a digital-forward strategy ✓ Successfully opened the Port Jefferson branch on June 25, 2025 ✓ HNVR was added to the Russell 2000 index upon reconstitution in late June 2025 ✓ Successfully refinanced $25.0 million of floating rate subordinated debt through a private placement of $35.0 million of 7.25% fixed-to-floating subordinated notes due in 2036 to enhance the Bank’s capital base – completed March 2026 ✓ Appointed Kevin O’Connor as President effective July 27th, 2026. Mr. O’Connor brings more than 35 years of banking experience to Hanover 2017 2018 2019 2020 2021 2022 2023 2024 2025 Jun-26 |
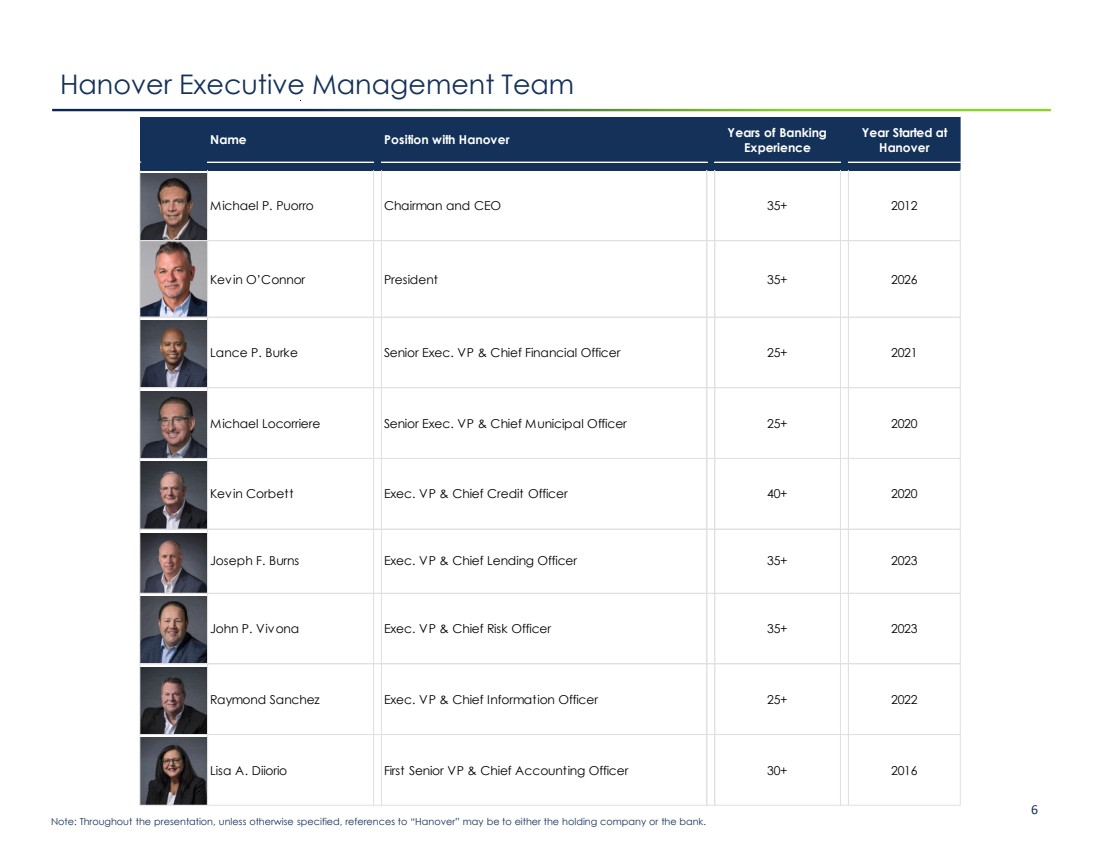
| Confidential Investor Presentation 6 Note: Throughout the presentation, unless otherwise specified, references to “Hanover” may be to either the holding company or the bank. Hanover Executive Management Team Name Position with Hanover Years of Banking Experience Year Started at Hanover Michael P. Puorro Chairman and CEO 35+ 2012 Kevin O’Connor President 35+ 2026 Lance P. Burke Senior Exec. VP & Chief Financial Officer 25+ 2021 Michael Locorriere Senior Exec. VP & Chief Municipal Officer 25+ 2020 Kevin Corbett Exec. VP & Chief Credit Officer 40+ 2020 Joseph F. Burns Exec. VP & Chief Lending Officer 35+ 2023 John P. Vivona Exec. VP & Chief Risk Officer 35+ 2023 Raymond Sanchez Exec. VP & Chief Information Officer 25+ 2022 Lisa A. Diiorio First Senior VP & Chief Accounting Officer 30+ 2016 |
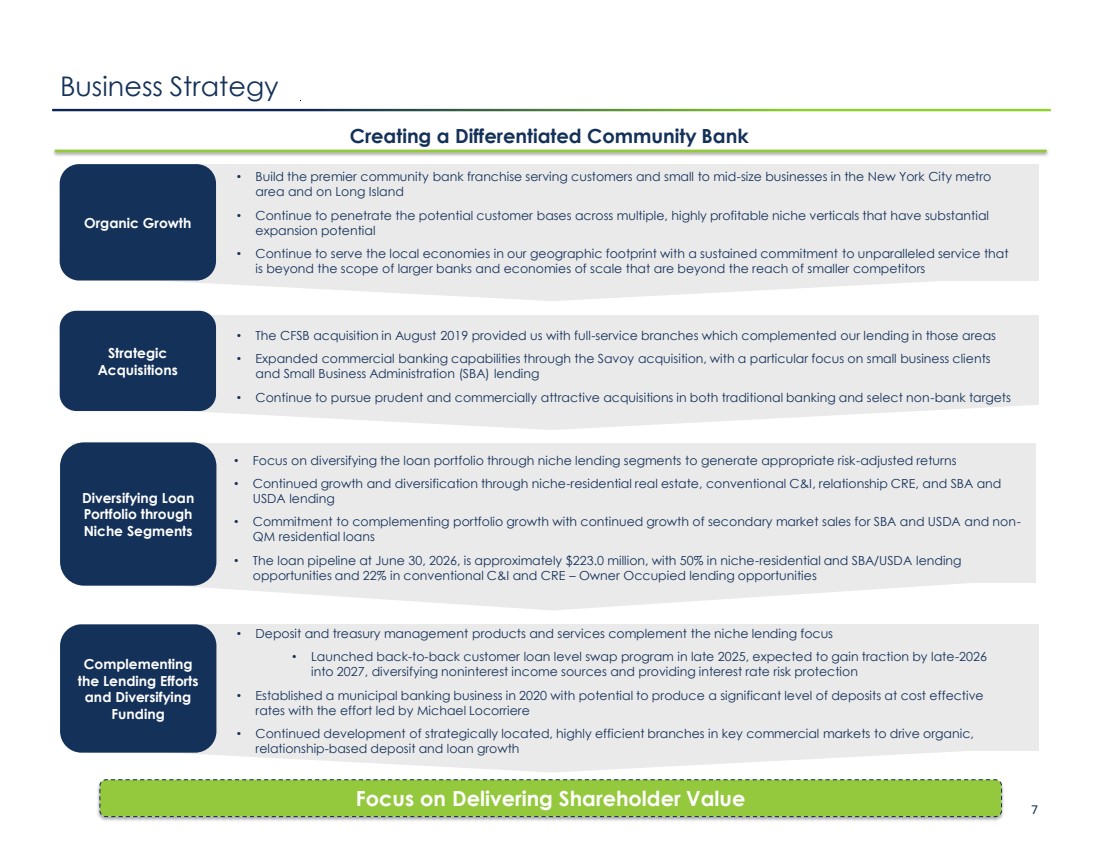
| Confidential Investor Presentation 7 Business Strategy Creating a Differentiated Community Bank Focus on Delivering Shareholder Value Organic Growth • Build the premier community bank franchise serving customers and small to mid-size businesses in the New York City metro area and on Long Island • Continue to penetrate the potential customer bases across multiple, highly profitable niche verticals that have substantial expansion potential • Continue to serve the local economies in our geographic footprint with a sustained commitment to unparalleled service that is beyond the scope of larger banks and economies of scale that are beyond the reach of smaller competitors • Focus on diversifying the loan portfolio through niche lending segments to generate appropriate risk-adjusted returns • Continued growth and diversification through niche-residential real estate, conventional C&I, relationship CRE, and SBA and USDA lending • Commitment to complementing portfolio growth with continued growth of secondary market sales for SBA and USDA and non-QM residential loans • The loan pipeline at June 30, 2026, is approximately $223.0 million, with 50% in niche-residential and SBA/USDA lending opportunities and 22% in conventional C&I and CRE – Owner Occupied lending opportunities Diversifying Loan Portfolio through Niche Segments • Deposit and treasury management products and services complement the niche lending focus • Launched back-to-back customer loan level swap program in late 2025, expected to gain traction by late-2026 into 2027, diversifying noninterest income sources and providing interest rate risk protection • Established a municipal banking business in 2020 with potential to produce a significant level of deposits at cost effective rates with the effort led by Michael Locorriere • Continued development of strategically located, highly efficient branches in key commercial markets to drive organic, relationship-based deposit and loan growth Complementing the Lending Efforts and Diversifying Funding Strategic Acquisitions • The CFSB acquisition in August 2019 provided us with full-service branches which complemented our lending in those areas • Expanded commercial banking capabilities through the Savoy acquisition, with a particular focus on small business clients and Small Business Administration (SBA) lending • Continue to pursue prudent and commercially attractive acquisitions in both traditional banking and select non-bank targets |
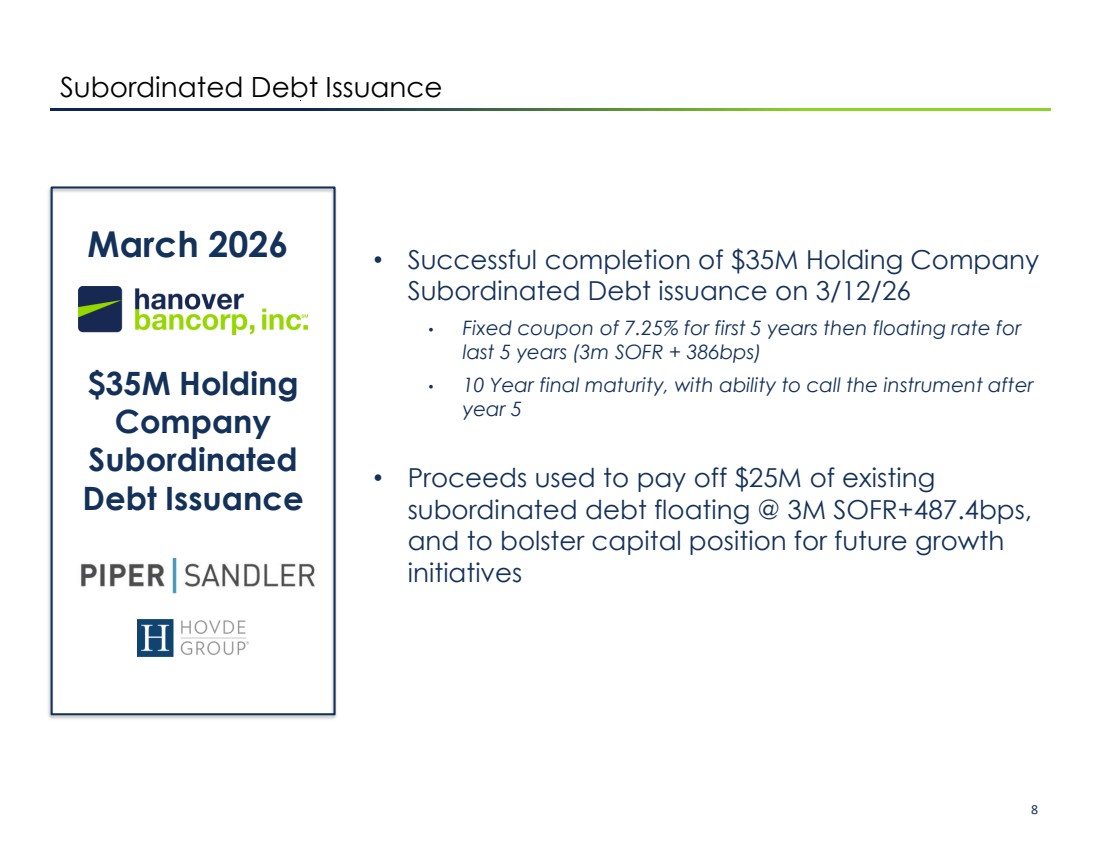
| Confidential Investor Presentation 8 March 2026 $35M Holding Company Subordinated Debt Issuance • Successful completion of $35M Holding Company Subordinated Debt issuance on 3/12/26 • Fixed coupon of 7.25% for first 5 years then floating rate for last 5 years (3m SOFR + 386bps) • 10 Year final maturity, with ability to call the instrument after year 5 • Proceeds used to pay off $25M of existing subordinated debt floating @ 3M SOFR+487.4bps, and to bolster capital position for future growth initiatives Subordinated Debt Issuance |
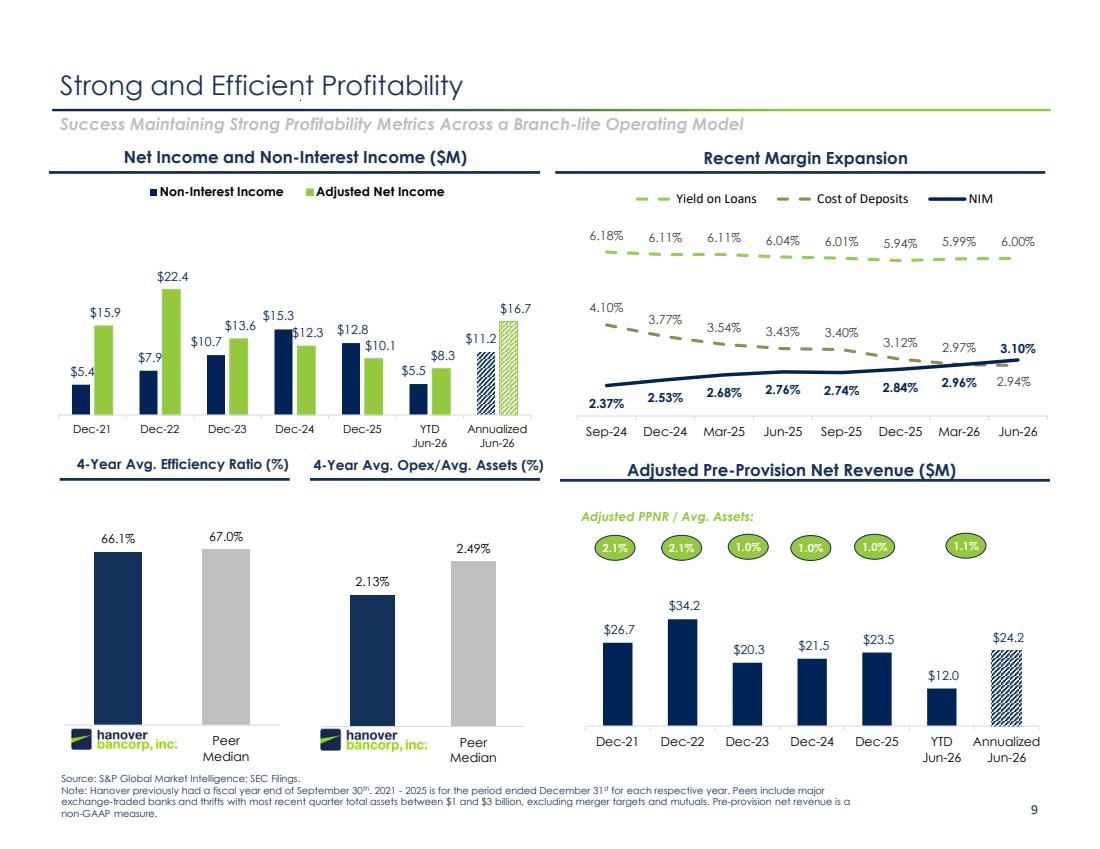
| Confidential Investor Presentation 9 2.13% 2.49% HNVR Peer Median 66.1% 67.0% HNVR Peer Median $26.7 $34.2 $20.3 $21.5 $23.5 $12.0 $24.2 Dec-21 Dec-22 Dec-23 Dec-24 Dec-25 YTD Jun-26 Annualized Jun-26 Strong and Efficient Profitability Success Maintaining Strong Profitability Metrics Across a Branch-lite Operating Model Source: S&P Global Market Intelligence; SEC Filings. Note: Hanover previously had a fiscal year end of September 30th. 2021 - 2025 is for the period ended December 31st for each respective year. Peers include major exchange-traded banks and thrifts with most recent quarter total assets between $1 and $3 billion, excluding merger targets and mutuals. Pre-provision net revenue is a non-GAAP measure. Net Income and Non-Interest Income ($M) Recent Margin Expansion 4-Year Avg. Efficiency Ratio (%) Adjusted Pre-Provision Net Revenue ($M) 4-Year Avg. Opex/Avg. Assets (%) 2.1% 1.0% 1.0% Adjusted PPNR / Avg. Assets: 2.1% 1.0% 1.1% 6.18% 6.11% 6.11% 6.04% 6.01% 5.94% 5.99% 6.00% 4.10% 3.77% 3.54% 3.43% 3.40% 3.12% 2.97% 2.94% 2.37% 2.53% 2.68% 2.76% 2.74% 2.84% 2.96% 3.10% Sep-24 Dec-24 Mar-25 Jun-25 Sep-25 Dec-25 Mar-26 Jun-26 Yield on Loans Cost of Deposits NIM $5.4 $7.9 $10.7 $15.3 $12.8 $5.5 $11.2 $15.9 $22.4 $13.6 $12.3 $10.1 $8.3 $16.7 Dec-21 Dec-22 Dec-23 Dec-24 Dec-25 YTD Jun-26 Annualized Jun-26 Non-Interest Income Adjusted Net Income |
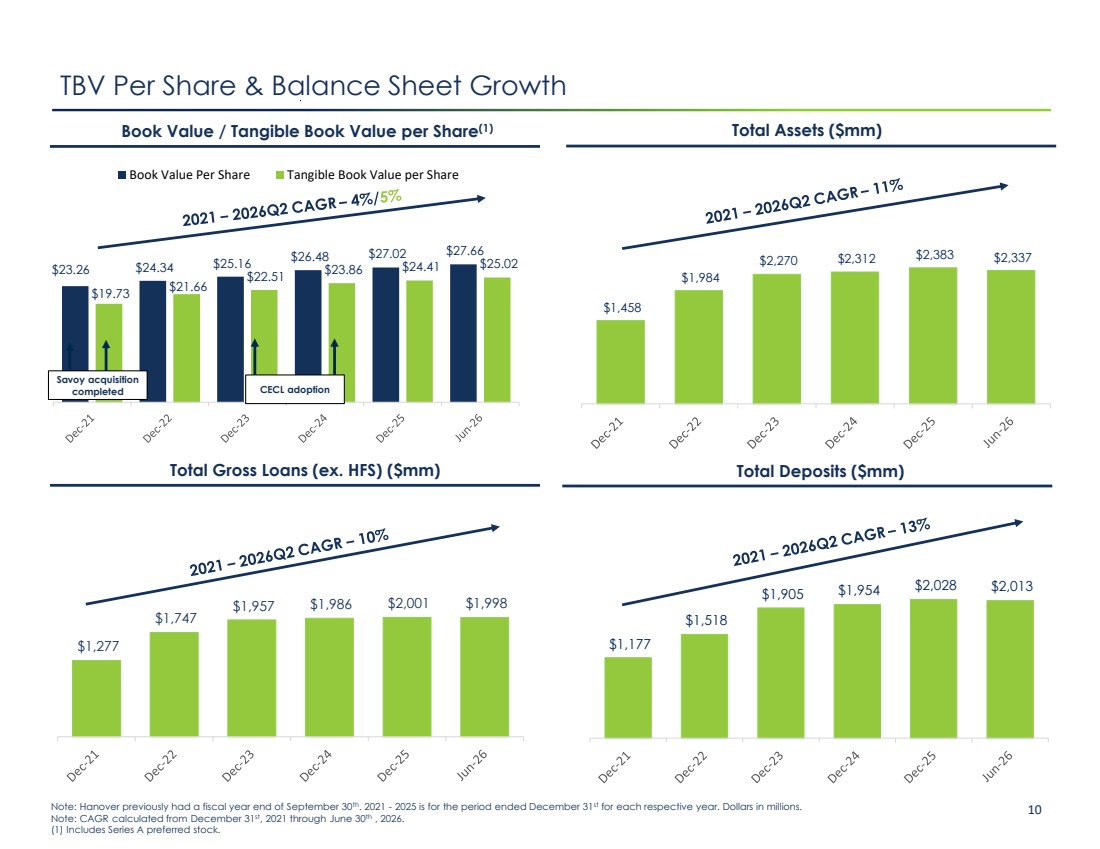
| Confidential Investor Presentation 10 $1,177 $1,518 $1,905 $1,954 $2,028 $2,013 $1,277 $1,747 $1,957 $1,986 $2,001 $1,998 $1,458 $1,984 $2,270 $2,312 $2,383 $2,337 $23.26 $24.34 $25.16 $26.48 $27.02 $27.66 $19.73 $21.66 $22.51 $23.86 $24.41 $25.02 Book Value Per Share Tangible Book Value per Share TBV Per Share & Balance Sheet Growth Note: Hanover previously had a fiscal year end of September 30th. 2021 - 2025 is for the period ended December 31st for each respective year. Dollars in millions. Note: CAGR calculated from December 31st, 2021 through June 30th , 2026. (1) Includes Series A preferred stock. Book Value / Tangible Book Value per Share(1) Total Gross Loans (ex. HFS) ($mm) Total Deposits ($mm) Total Assets ($mm) Savoy acquisition completed CECL adoption |
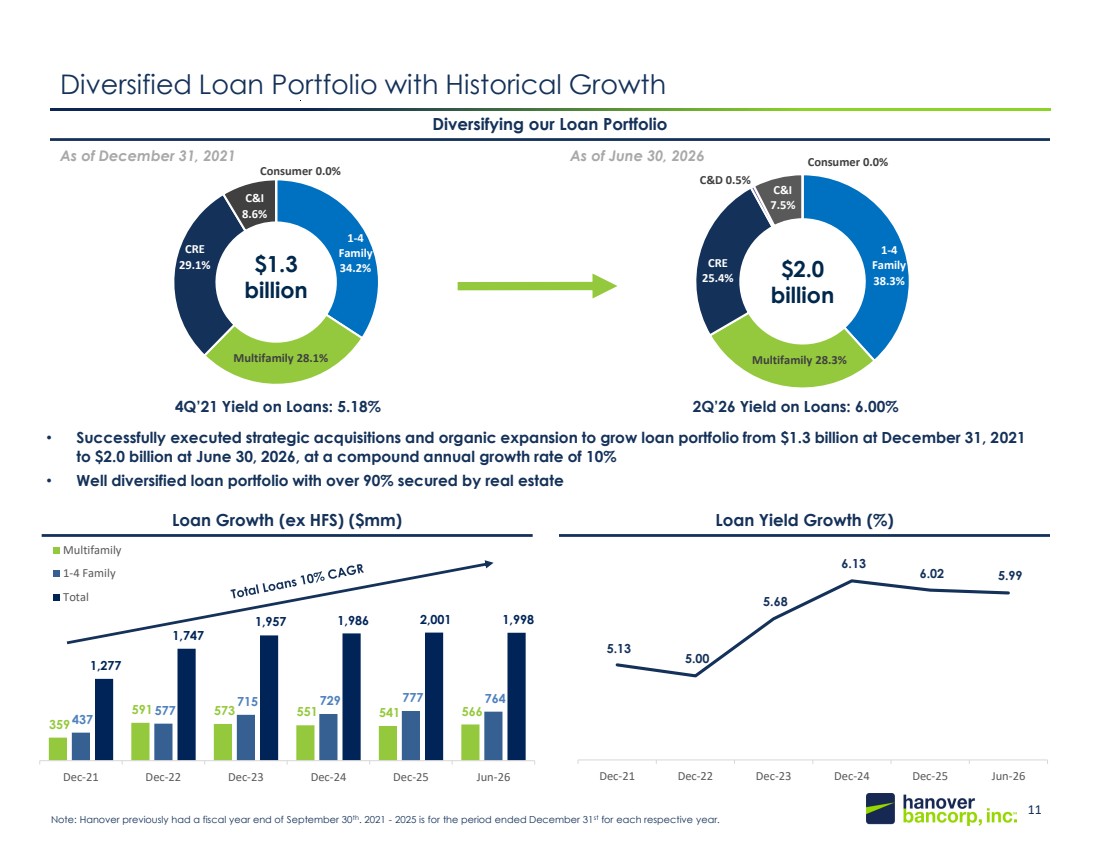
| 11 148, 201, 61 20, 49, 89 359 591 573 551 541 566 437 577 715 729 777 764 1,277 1,747 1,957 1,986 2,001 1,998 Dec-21 Dec-22 Dec-23 Dec-24 Dec-25 Jun-26 Multifamily 1-4 Family Total 1-4 Family 38.3% Multifamily 28.3% CRE 25.4% C&D 0.5% C&I 7.5% Consumer 0.0% 1-4 Family 34.2% Multifamily 28.1% CRE 29.1% C&I 8.6% Consumer 0.0% Loan Growth (ex HFS) ($mm) Loan Yield Growth (%) Diversified Loan Portfolio with Historical Growth • Successfully executed strategic acquisitions and organic expansion to grow loan portfolio from $1.3 billion at December 31, 2021 to $2.0 billion at June 30, 2026, at a compound annual growth rate of 10% • Well diversified loan portfolio with over 90% secured by real estate Diversifying our Loan Portfolio As of December 31, 2021 As of June 30, 2026 $1.3 billion 0 92 176 Note: Hanover previously had a fiscal year end of September 30th. 2021 - 2025 is for the period ended December 31st for each respective year. $2.0 billion 4Q’21 Yield on Loans: 5.18% 2Q’26 Yield on Loans: 6.00% 5.13 5.00 5.68 6.13 6.02 5.99 Dec-21 Dec-22 Dec-23 Dec-24 Dec-25 Jun-26 |
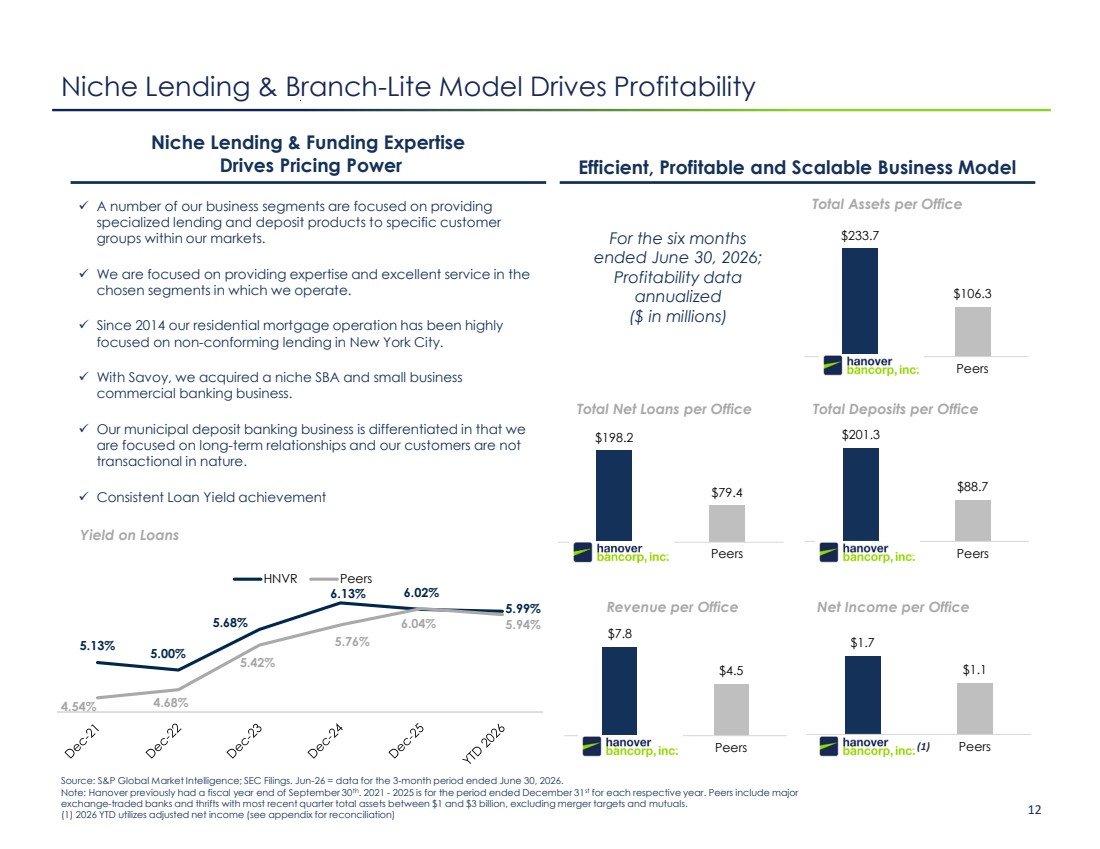
| Confidential Investor Presentation 12 $1.7 $1.1 HNVR Peers $7.8 $4.5 HNVR Peers $201.3 $88.7 HNVR Peers $198.2 $79.4 HNVR Peers $233.7 $106.3 HNVR Peers Niche Lending & Branch-Lite Model Drives Profitability Niche Lending & Funding Expertise Drives Pricing Power Efficient, Profitable and Scalable Business Model Yield on Loans ✓ A number of our business segments are focused on providing specialized lending and deposit products to specific customer groups within our markets. ✓ We are focused on providing expertise and excellent service in the chosen segments in which we operate. ✓ Since 2014 our residential mortgage operation has been highly focused on non-conforming lending in New York City. ✓ With Savoy, we acquired a niche SBA and small business commercial banking business. ✓ Our municipal deposit banking business is differentiated in that we are focused on long-term relationships and our customers are not transactional in nature. ✓ Consistent Loan Yield achievement Revenue per Office Total Net Loans per Office Total Deposits per Office Total Assets per Office Net Income per Office For the six months ended June 30, 2026; Profitability data annualized ($ in millions) Source: S&P Global Market Intelligence; SEC Filings. Jun-26 = data for the 3-month period ended June 30, 2026. Note: Hanover previously had a fiscal year end of September 30th. 2021 - 2025 is for the period ended December 31st for each respective year. Peers include major exchange-traded banks and thrifts with most recent quarter total assets between $1 and $3 billion, excluding merger targets and mutuals. (1) 2026 YTD utilizes adjusted net income (see appendix for reconciliation) (1) 5.13% 5.00% 5.68% 6.13% 6.02% 5.99% 4.54% 4.68% 5.42% 5.76% 6.04% 5.94% HNVR Peers |
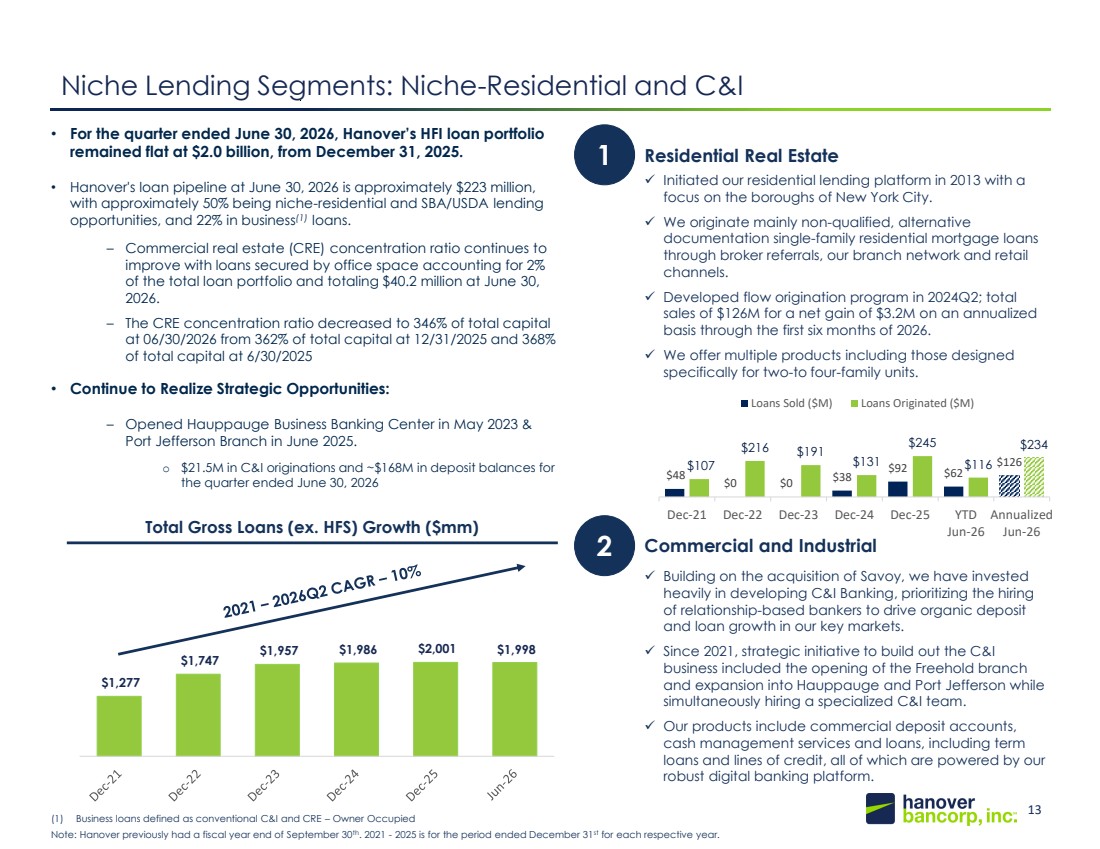
| 13 148, 201, 61 20, 49, 89 $1,277 $1,747 $1,957 $1,986 $2,001 $1,998 • For the quarter ended June 30, 2026, Hanover’s HFI loan portfolio remained flat at $2.0 billion, from December 31, 2025. • Hanover's loan pipeline at June 30, 2026 is approximately $223 million, with approximately 50% being niche-residential and SBA/USDA lending opportunities, and 22% in business(1) loans. – Commercial real estate (CRE) concentration ratio continues to improve with loans secured by office space accounting for 2% of the total loan portfolio and totaling $40.2 million at June 30, 2026. – The CRE concentration ratio decreased to 346% of total capital at 06/30/2026 from 362% of total capital at 12/31/2025 and 368% of total capital at 6/30/2025 • Continue to Realize Strategic Opportunities: – Opened Hauppauge Business Banking Center in May 2023 & Port Jefferson Branch in June 2025. o $21.5M in C&I originations and ~$168M in deposit balances for the quarter ended June 30, 2026 Niche Lending Segments: Niche-Residential and C&I Note: Hanover previously had a fiscal year end of September 30th. 2021 - 2025 is for the period ended December 31st for each respective year. Total Gross Loans (ex. HFS) Growth ($mm) 1 Residential Real Estate ✓ Initiated our residential lending platform in 2013 with a focus on the boroughs of New York City. ✓ We originate mainly non-qualified, alternative documentation single-family residential mortgage loans through broker referrals, our branch network and retail channels. ✓ Developed flow origination program in 2024Q2; total sales of $126M for a net gain of $3.2M on an annualized basis through the first six months of 2026. ✓ We offer multiple products including those designed specifically for two-to four-family units. ✓ Building on the acquisition of Savoy, we have invested heavily in developing C&I Banking, prioritizing the hiring of relationship-based bankers to drive organic deposit and loan growth in our key markets. ✓ Since 2021, strategic initiative to build out the C&I business included the opening of the Freehold branch and expansion into Hauppauge and Port Jefferson while simultaneously hiring a specialized C&I team. ✓ Our products include commercial deposit accounts, cash management services and loans, including term loans and lines of credit, all of which are powered by our robust digital banking platform. 2 Commercial and Industrial (1) Business loans defined as conventional C&I and CRE – Owner Occupied $48 $0 $0 $38 $92 $62 $126 $107 $216 $191 $131 $245 $116 $234 Dec-21 Dec-22 Dec-23 Dec-24 Dec-25 YTD Jun-26 Annualized Jun-26 Loans Sold ($M) Loans Originated ($M) |
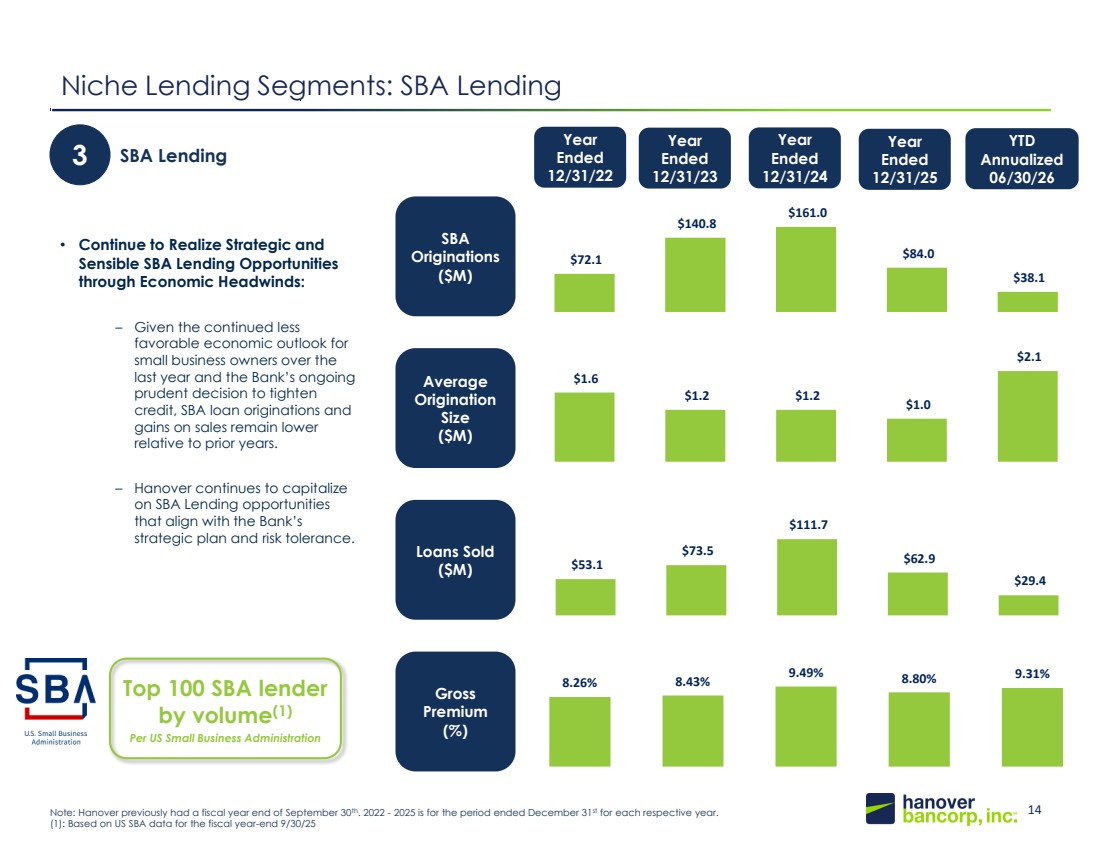
| 14 148, 201, 61 20, 49, 89 Niche Lending Segments: SBA Lending Year Ended 12/31/22 Year Ended 12/31/24 3 SBA Lending • Continue to Realize Strategic and Sensible SBA Lending Opportunities through Economic Headwinds: – Given the continued less favorable economic outlook for small business owners over the last year and the Bank’s ongoing prudent decision to tighten credit, SBA loan originations and gains on sales remain lower relative to prior years. – Hanover continues to capitalize on SBA Lending opportunities that align with the Bank’s strategic plan and risk tolerance. SBA Originations ($M) Average Origination Size ($M) Loans Sold ($M) Gross Premium (%) Note: Hanover previously had a fiscal year end of September 30th. 2022 - 2025 is for the period ended December 31st for each respective year. (1): Based on US SBA data for the fiscal year-end 9/30/25 Top 100 SBA lender by volume(1) Per US Small Business Administration Year Ended 12/31/25 Year Ended 12/31/23 YTD Annualized 06/30/26 8.26% 8.43% 9.49% 8.80% 9.31% $72.1 $140.8 $161.0 $84.0 $38.1 $1.6 $1.2 $1.2 $1.0 $2.1 $53.1 $73.5 $111.7 $62.9 $29.4 |
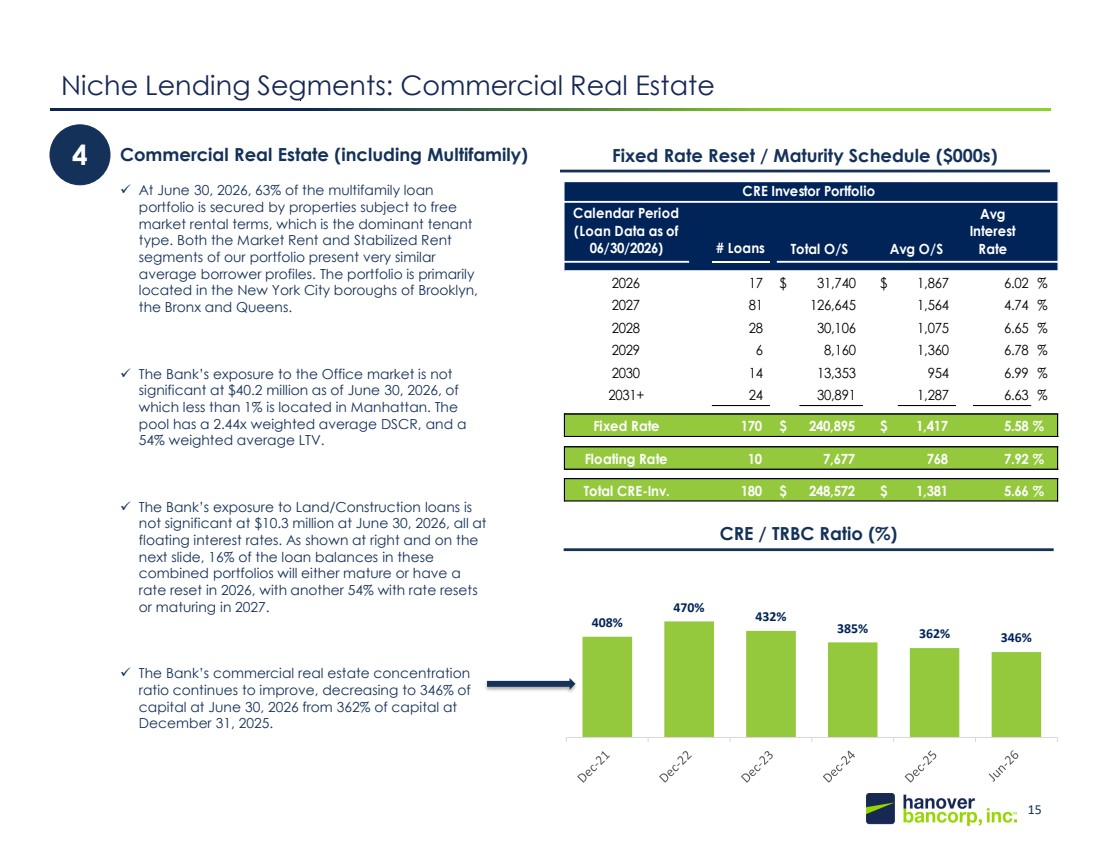
| 15 148, 201, 61 20, 49, 89 408% 470% 432% 385% 362% 346% Niche Lending Segments: Commercial Real Estate 4 Commercial Real Estate (including Multifamily) ✓ At June 30, 2026, 63% of the multifamily loan portfolio is secured by properties subject to free market rental terms, which is the dominant tenant type. Both the Market Rent and Stabilized Rent segments of our portfolio present very similar average borrower profiles. The portfolio is primarily located in the New York City boroughs of Brooklyn, the Bronx and Queens. ✓ The Bank’s exposure to the Office market is not significant at $40.2 million as of June 30, 2026, of which less than 1% is located in Manhattan. The pool has a 2.44x weighted average DSCR, and a 54% weighted average LTV. ✓ The Bank’s exposure to Land/Construction loans is not significant at $10.3 million at June 30, 2026, all at floating interest rates. As shown at right and on the next slide, 16% of the loan balances in these combined portfolios will either mature or have a rate reset in 2026, with another 54% with rate resets or maturing in 2027. ✓ The Bank’s commercial real estate concentration ratio continues to improve, decreasing to 346% of capital at June 30, 2026 from 362% of capital at December 31, 2025. Fixed Rate Reset / Maturity Schedule ($000s) CRE / TRBC Ratio (%) Calendar Period (Loan Data as of 06/30/2026) # Loans 2026 17 $ 31,740 $ 1,867 6.02 % 2027 81 126,645 1,564 4.74 % 2028 28 30,106 1,075 6.65 % 2029 6 8,160 1,360 6.78 % 2030 14 13,353 954 6.99 % 2031+ 24 30,891 1,287 6.63 % Fixed Rate 170 $ 240,895 $ 1,417 5.58 % Floating Rate 10 7,677 768 7.92 % Total CRE-Inv. 180 $ 248,572 $ 1,381 5.66 % CRE Investor Portfolio Total O/S Avg O/S Avg Interest Rate |
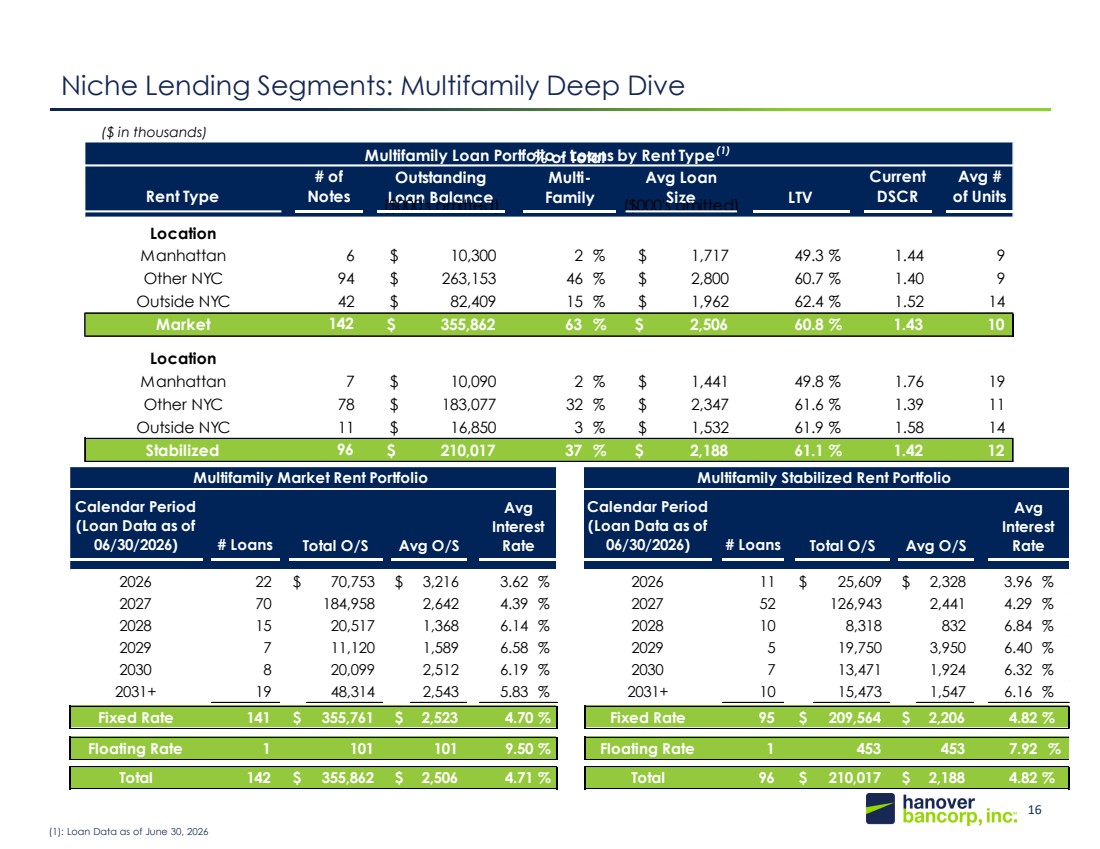
| 16 148, 201, 61 20, 49, 89 Niche Lending Segments: Multifamily Deep Dive (1): Loan Data as of June 30, 2026 ($ in thousands) Rent Type # of Notes Current DSCR Avg # of Units Location Manhattan 6 $ 10,300 2 % $ 1,717 49.3 % 1.44 9 Other NYC 94 $ 263,153 46 % $ 2,800 60.7 % 1.40 9 Outside NYC 42 $ 82,409 15 % $ 1,962 62.4 % 1.52 14 Market 142 $ 355,862 63 % $ 2,506 60.8 % 1.43 10 Location Manhattan 7 $ 10,090 2 % $ 1,441 49.8 % 1.76 19 Other NYC 78 $ 183,077 32 % $ 2,347 61.6 % 1.39 11 Outside NYC 11 $ 16,850 3 % $ 1,532 61.9 % 1.58 14 Stabilized 96 $ 210,017 37 % $ 2,188 61.1 % 1.42 12 Multifamily Loan Portfolio - Loans by Rent Type(1) Outstanding Loan Balance % of Total Multi-Family Avg Loan Size LTV ($000's omitted) ($000's omitted) Calendar Period (Loan Data as of 06/30/2026) # Loans Calendar Period (Loan Data as of 06/30/2026) # Loans 2026 22 $ 70,753 $ 3,216 3.62 % 2026 11 $ 25,609 $ 2,328 3.96 % 2027 70 184,958 2,642 4.39 % 2027 52 126,943 2,441 4.29 % 2028 15 20,517 1,368 6.14 % 2028 10 8,318 832 6.84 % 2029 7 11,120 1,589 6.58 % 2029 5 19,750 3,950 6.40 % 2030 8 20,099 2,512 6.19 % 2030 7 13,471 1,924 6.32 % 2031+ 19 48,314 2,543 5.83 % 2031+ 10 15,473 1,547 6.16 % Fixed Rate 141 $ 355,761 $ 2,523 4.70 % Fixed Rate 95 $ 209,564 $ 2,206 4.82 % Floating Rate 1 101 101 9.50 % Floating Rate 1 453 453 7.92 % Total 142 $ 355,862 $ 2,506 4.71 % Total 96 $ 210,017 $ 2,188 4.82 % Multifamily Market Rent Portfolio Multifamily Stabilized Rent Portfolio Total O/S Avg O/S Avg Interest Rate Total O/S Avg O/S Avg Interest Rate |
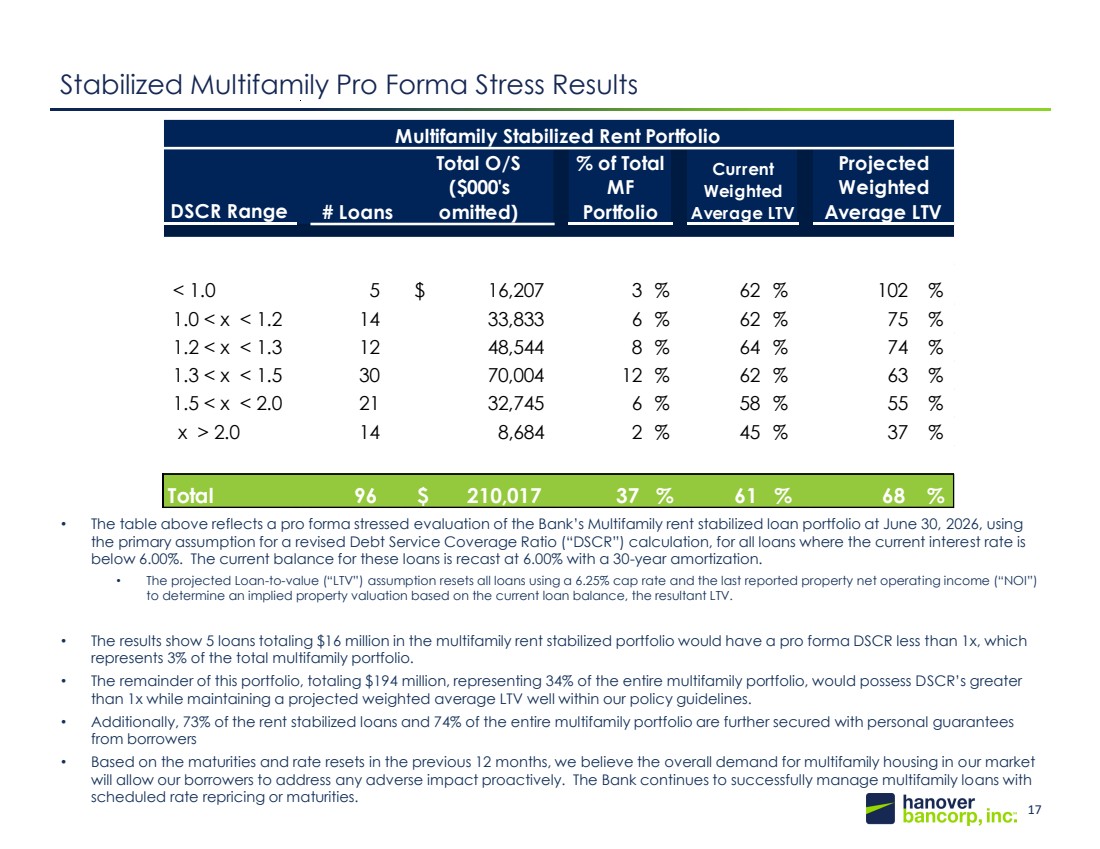
| 17 148, 201, 61 20, 49, 89 Stabilized Multifamily Pro Forma Stress Results • The table above reflects a pro forma stressed evaluation of the Bank’s Multifamily rent stabilized loan portfolio at June 30, 2026, using the primary assumption for a revised Debt Service Coverage Ratio (“DSCR”) calculation, for all loans where the current interest rate is below 6.00%. The current balance for these loans is recast at 6.00% with a 30-year amortization. • The projected Loan-to-value (“LTV”) assumption resets all loans using a 6.25% cap rate and the last reported property net operating income (“NOI”) to determine an implied property valuation based on the current loan balance, the resultant LTV. • The results show 5 loans totaling $16 million in the multifamily rent stabilized portfolio would have a pro forma DSCR less than 1x, which represents 3% of the total multifamily portfolio. • The remainder of this portfolio, totaling $194 million, representing 34% of the entire multifamily portfolio, would possess DSCR’s greater than 1x while maintaining a projected weighted average LTV well within our policy guidelines. • Additionally, 73% of the rent stabilized loans and 74% of the entire multifamily portfolio are further secured with personal guarantees from borrowers • Based on the maturities and rate resets in the previous 12 months, we believe the overall demand for multifamily housing in our market will allow our borrowers to address any adverse impact proactively. The Bank continues to successfully manage multifamily loans with scheduled rate repricing or maturities. DSCR Range < 1.0 5 $ 16,207 3 % 62 % 102 % 1.0 < x < 1.2 14 33,833 6 % 62 % 75 % 1.2 < x < 1.3 12 48,544 8 % 64 % 74 % 1.3 < x < 1.5 30 70,004 12 % 62 % 63 % 1.5 < x < 2.0 21 32,745 6 % 58 % 55 % x > 2.0 14 8,684 2 % 45 % 37 % Total 96 $ 210,017 37 % 61 % 68 % # Loans Multifamily Stabilized Rent Portfolio Total O/S ($000's omitted) % of Total MF Portfolio Current Weighted Average LTV Projected Weighted Average LTV |
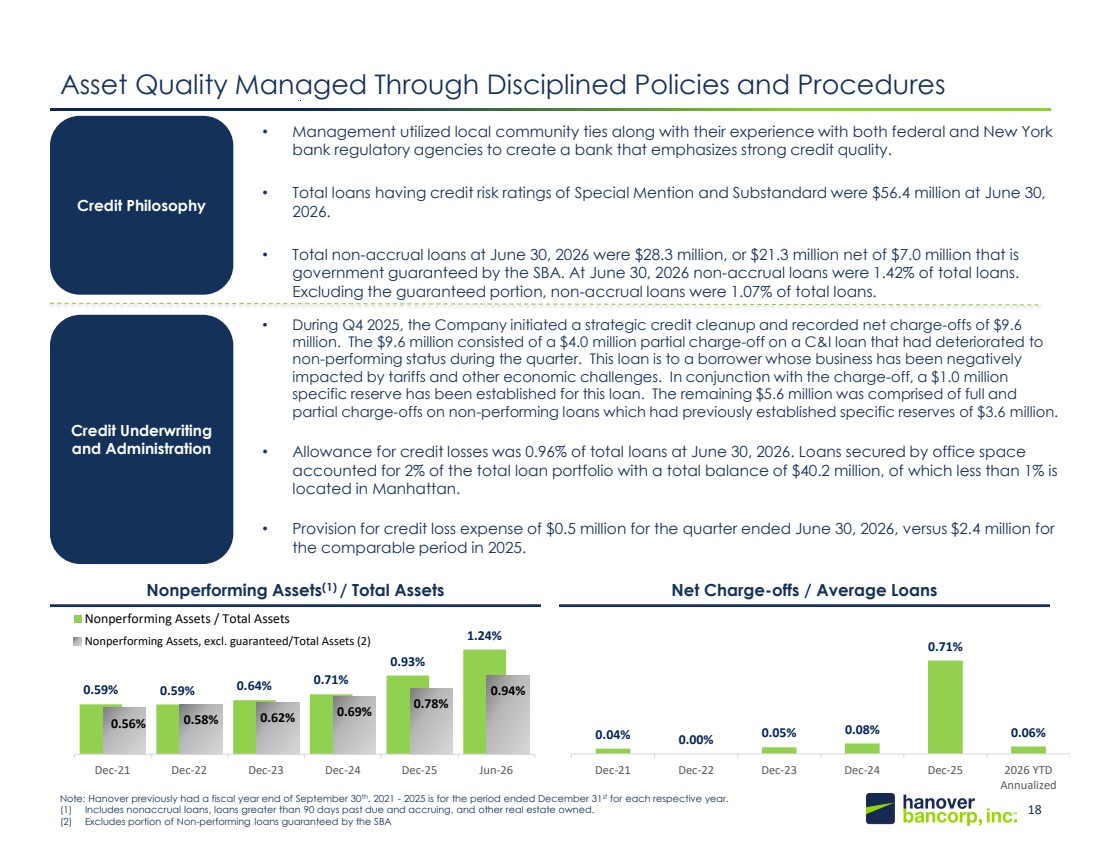
| 18 148, 201, 61 20, 49, 89 0.04% 0.00% 0.05% 0.08% 0.71% 0.06% Dec-21 Dec-22 Dec-23 Dec-24 Dec-25 2026 YTD Annualized Note: Hanover previously had a fiscal year end of September 30th. 2021 - 2025 is for the period ended December 31st for each respective year. (1) Includes nonaccrual loans, loans greater than 90 days past due and accruing, and other real estate owned. (2) Excludes portion of Non-performing loans guaranteed by the SBA Asset Quality Managed Through Disciplined Policies and Procedures Credit Philosophy Credit Underwriting and Administration • Management utilized local community ties along with their experience with both federal and New York bank regulatory agencies to create a bank that emphasizes strong credit quality. • Total loans having credit risk ratings of Special Mention and Substandard were $56.4 million at June 30, 2026. • Total non-accrual loans at June 30, 2026 were $28.3 million, or $21.3 million net of $7.0 million that is government guaranteed by the SBA. At June 30, 2026 non-accrual loans were 1.42% of total loans. Excluding the guaranteed portion, non-accrual loans were 1.07% of total loans. • During Q4 2025, the Company initiated a strategic credit cleanup and recorded net charge-offs of $9.6 million. The $9.6 million consisted of a $4.0 million partial charge-off on a C&I loan that had deteriorated to non-performing status during the quarter. This loan is to a borrower whose business has been negatively impacted by tariffs and other economic challenges. In conjunction with the charge-off, a $1.0 million specific reserve has been established for this loan. The remaining $5.6 million was comprised of full and partial charge-offs on non-performing loans which had previously established specific reserves of $3.6 million. • Allowance for credit losses was 0.96% of total loans at June 30, 2026. Loans secured by office space accounted for 2% of the total loan portfolio with a total balance of $40.2 million, of which less than 1% is located in Manhattan. • Provision for credit loss expense of $0.5 million for the quarter ended June 30, 2026, versus $2.4 million for the comparable period in 2025. Nonperforming Assets(1) / Total Assets Net Charge-offs / Average Loans 0.59% 0.59% 0.64% 0.71% 0.93% 1.24% 0.56% 0.58% 0.62% 0.69% 0.78% 0.94% Dec-21 Dec-22 Dec-23 Dec-24 Dec-25 Jun-26 Nonperforming Assets / Total Assets Nonperforming Assets, excl. guaranteed/Total Assets (2) |
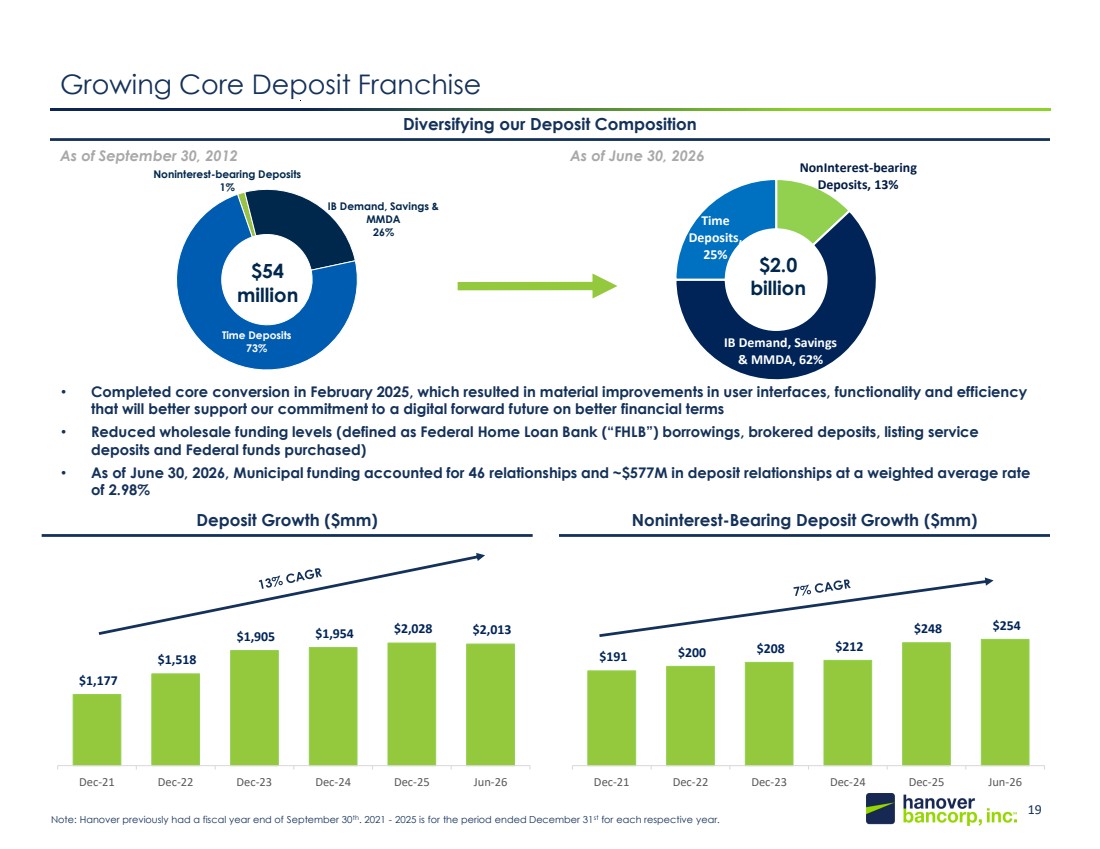
| 19 148, 201, 61 20, 49, 89 $1,177 $1,518 $1,905 $1,954 $2,028 $2,013 Dec-21 Dec-22 Dec-23 Dec-24 Dec-25 Jun-26 NonInterest-bearing Deposits, 13% IB Demand, Savings & MMDA, 62% Time Deposits, 25% Deposit Growth ($mm) Noninterest-Bearing Deposit Growth ($mm) Noninterest-bearing Deposits 1% IB Demand, Savings & MMDA 26% Time Deposits 73% Growing Core Deposit Franchise • Completed core conversion in February 2025, which resulted in material improvements in user interfaces, functionality and efficiency that will better support our commitment to a digital forward future on better financial terms • Reduced wholesale funding levels (defined as Federal Home Loan Bank (“FHLB”) borrowings, brokered deposits, listing service deposits and Federal funds purchased) • As of June 30, 2026, Municipal funding accounted for 46 relationships and ~$577M in deposit relationships at a weighted average rate of 2.98% Diversifying our Deposit Composition As of September 30, 2012 As of June 30, 2026 $54 million 0 92 176 Note: Hanover previously had a fiscal year end of September 30th. 2021 - 2025 is for the period ended December 31st for each respective year. $2.0 billion $191 $200 $208 $212 $248 $254 Dec-21 Dec-22 Dec-23 Dec-24 Dec-25 Jun-26 |
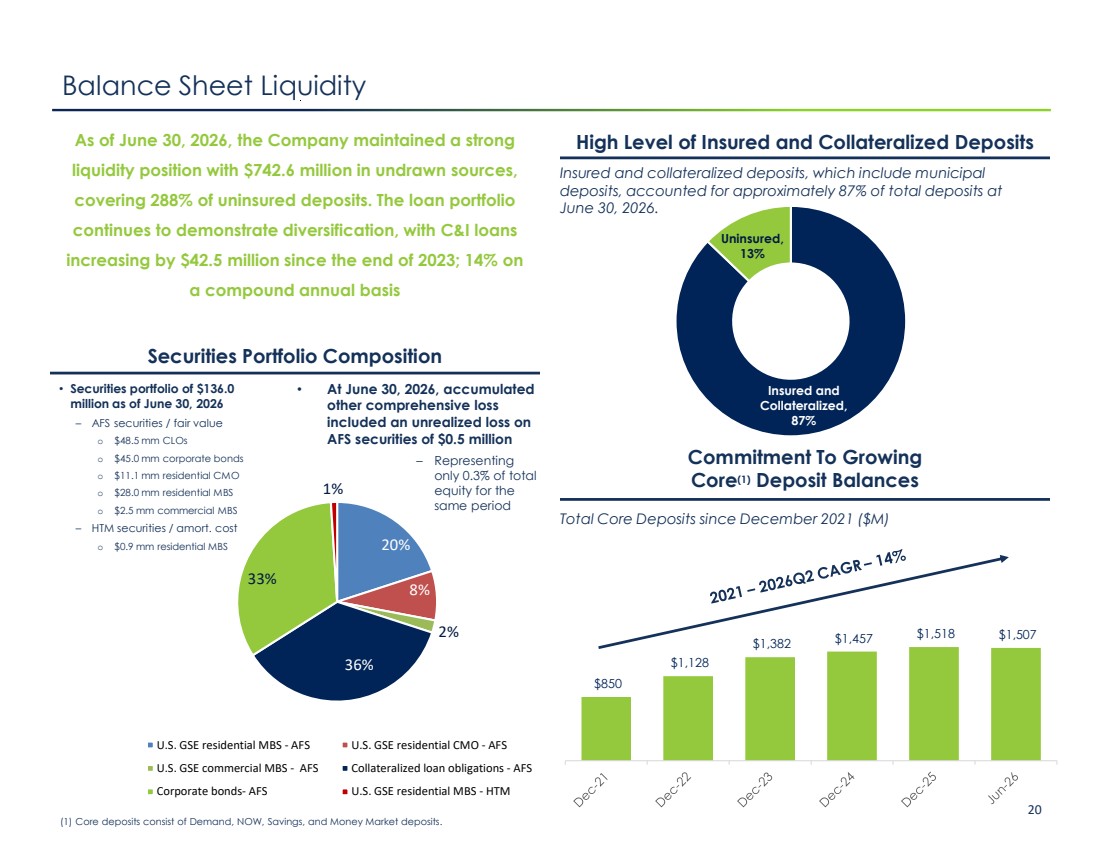
| Confidential Investor Presentation 20 Insured and Collateralized, 87% Uninsured, 13% 20% 8% 2% 36% 33% 1% U.S. GSE residential MBS - AFS U.S. GSE residential CMO - AFS U.S. GSE commercial MBS - AFS Collateralized loan obligations - AFS Corporate bonds- AFS U.S. GSE residential MBS - HTM $850 $1,128 $1,382 $1,457 $1,518 $1,507 High Level of Insured and Collateralized Deposits Insured and collateralized deposits, which include municipal deposits, accounted for approximately 87% of total deposits at June 30, 2026. Commitment To Growing Core(1) Deposit Balances Balance Sheet Liquidity Securities Portfolio Composition As of June 30, 2026, the Company maintained a strong liquidity position with $742.6 million in undrawn sources, covering 288% of uninsured deposits. The loan portfolio continues to demonstrate diversification, with C&I loans increasing by $42.5 million since the end of 2023; 14% on a compound annual basis • At June 30, 2026, accumulated other comprehensive loss included an unrealized loss on AFS securities of $0.5 million – Representing only 0.3% of total equity for the same period Total Core Deposits since December 2021 ($M) (1) Core deposits consist of Demand, NOW, Savings, and Money Market deposits. 151 185 224 • Securities portfolio of $136.0 million as of June 30, 2026 – AFS securities / fair value o $48.5 mm CLOs o $45.0 mm corporate bonds o $11.1 mm residential CMO o $28.0 mm residential MBS o $2.5 mm commercial MBS – HTM securities / amort. cost o $0.9 mm residential MBS |
| Confidential Investor Presentation 21 |
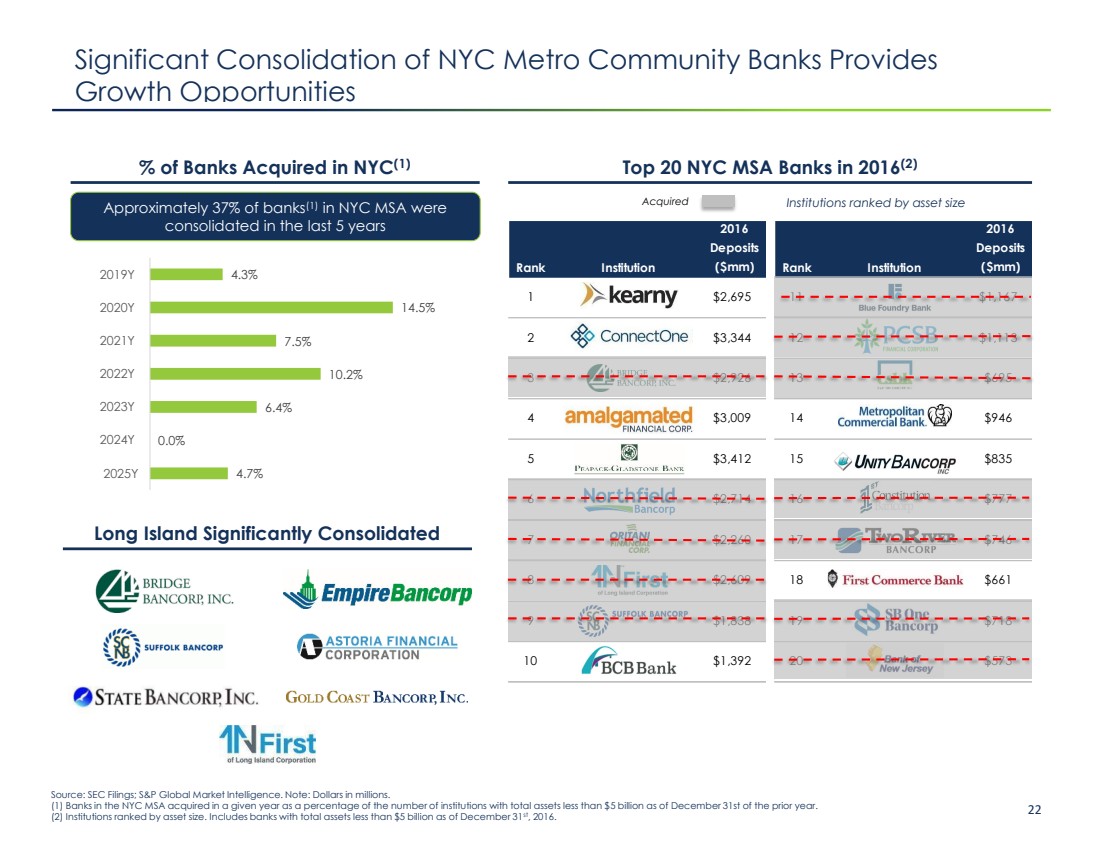
| Confidential Investor Presentation 22 2016 Rank Institution Deposits ($mm) 1 $2,695 2 $3,344 3 $2,926 4 $3,009 5 $3,412 6 $2,714 7 $2,260 8 $2,609 9 $1,838 10 $1,392 Significant Consolidation of NYC Metro Community Banks Provides Growth Opportunities Source: SEC Filings; S&P Global Market Intelligence. Note: Dollars in millions. (1) Banks in the NYC MSA acquired in a given year as a percentage of the number of institutions with total assets less than $5 billion as of December 31st of the prior year. (2) Institutions ranked by asset size. Includes banks with total assets less than $5 billion as of December 31st, 2016. % of Banks Acquired in NYC(1) Top 20 NYC MSA Banks in 2016(2) Approximately 37% of banks(1) in NYC MSA were consolidated in the last 5 years 2016 Rank Institution Deposits ($mm) 11 $1,167 12 $1,113 13 $695 14 $946 15 $835 16 $777 17 $746 18 $661 19 $718 20 $573 Acquired Institutions ranked by asset size Long Island Significantly Consolidated 4.3% 14.5% 7.5% 10.2% 6.4% 0.0% 4.7% 2019Y 2020Y 2021Y 2022Y 2023Y 2024Y 2025Y |
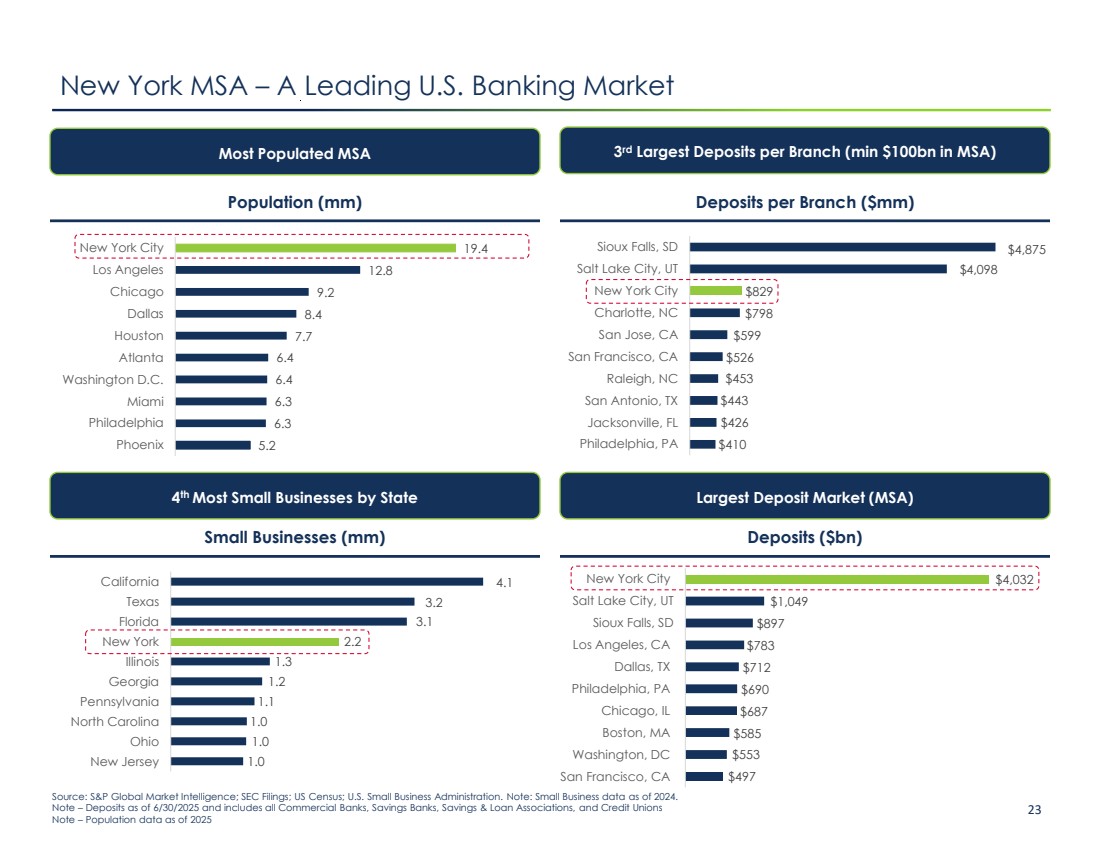
| Confidential Investor Presentation 23 1.0 1.0 1.0 1.1 1.2 1.3 2.2 3.1 3.2 4.1 New Jersey Ohio North Carolina Pennsylvania Georgia Illinois New York Florida Texas California 19.4 12.8 9.2 8.4 7.7 6.4 6.4 6.3 6.3 5.2 New York City Los Angeles Chicago Dallas Houston Atlanta Washington D.C. Miami Philadelphia Phoenix New York MSA – A Leading U.S. Banking Market Population (mm) Deposits per Branch ($mm) Deposits ($bn) Most Populated MSA 3 rd Largest Deposits per Branch (min $100bn in MSA) Largest Deposit Market (MSA) Small Businesses (mm) 4 th Most Small Businesses by State $410 $426 $443 $453 $526 $599 $798 $829 $4,098 $4,875 Philadelphia, PA Jacksonville, FL San Antonio, TX Raleigh, NC San Francisco, CA San Jose, CA Charlotte, NC New York City Salt Lake City, UT Sioux Falls, SD $497 $553 $585 $687 $690 $712 $783 $897 $1,049 $4,032 San Francisco, CA Washington, DC Boston, MA Chicago, IL Philadelphia, PA Dallas, TX Los Angeles, CA Sioux Falls, SD Salt Lake City, UT New York City Source: S&P Global Market Intelligence; SEC Filings; US Census; U.S. Small Business Administration. Note: Small Business data as of 2024. Note – Deposits as of 6/30/2025 and includes all Commercial Banks, Savings Banks, Savings & Loan Associations, and Credit Unions Note – Population data as of 2025 |
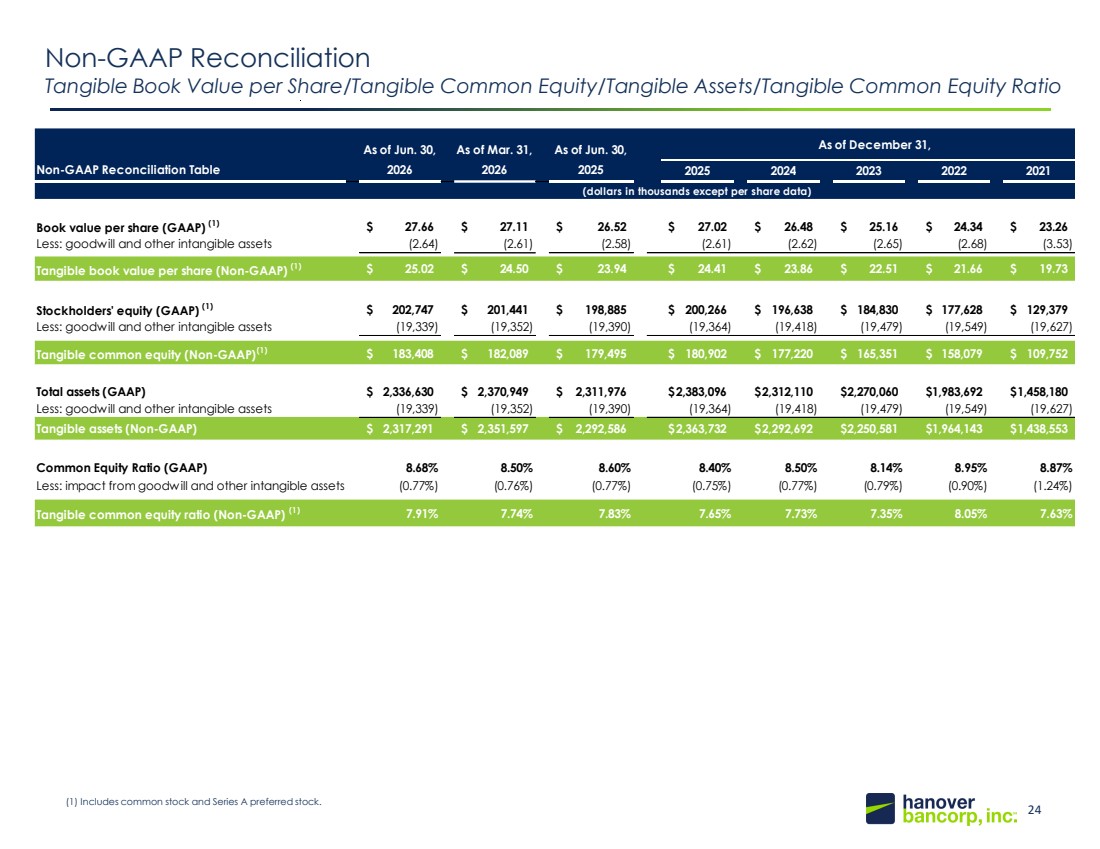
| 24 148, 201, 61 20, 49, 89 Non-GAAP Reconciliation Tangible Book Value per Share/Tangible Common Equity/Tangible Assets/Tangible Common Equity Ratio (1) Includes common stock and Series A preferred stock. As of Jun. 30, As of Mar. 31, As of Jun. 30, Non-GAAP Reconciliation Table 2026 2026 2025 2025 2024 2023 2022 2021 (dollars in thousands except per share data) Book value per share (GAAP) (1) $ 27.66 $ 27.11 $ 26.52 $ 27.02 $ 26.48 $ 25.16 $ 24.34 $ 23.26 Less: goodwill and other intangible assets (2.64) (2.61) (2.58) (2.61) (2.62) (2.65) (2.68) (3.53) Tangible book value per share (Non-GAAP) (1) $ 25.02 $ 24.50 $ 23.94 $ 24.41 $ 23.86 $ 22.51 $ 21.66 $ 19.73 Stockholders' equity (GAAP) (1) $ 202,747 $ 201,441 $ 198,885 $ 200,266 $ 196,638 $ 184,830 $ 177,628 $ 129,379 Less: goodwill and other intangible assets (19,339) (19,352) (19,390) (19,364) (19,418) (19,479) (19,549) (19,627) Tangible common equity (Non-GAAP)(1) $ 183,408 $ 182,089 $ 179,495 $ 180,902 $ 177,220 $ 165,351 $ 158,079 $ 109,752 Total assets (GAAP) $ 2,336,630 $ 2,370,949 $ 2,311,976 $2,383,096 $2,312,110 $2,270,060 $1,983,692 $1,458,180 Less: goodwill and other intangible assets (19,339) (19,352) (19,390) (19,364) (19,418) (19,479) (19,549) (19,627) Tangible assets (Non-GAAP) $ 2,317,291 $ 2,351,597 $ 2,292,586 $2,363,732 $2,292,692 $2,250,581 $1,964,143 $1,438,553 Common Equity Ratio (GAAP) 8.68% 8.50% 8.60% 8.40% 8.50% 8.14% 8.95% 8.87% Less: impact from goodwill and other intangible assets (0.77%) (0.76%) (0.77%) (0.75%) (0.77%) (0.79%) (0.90%) (1.24%) Tangible common equity ratio (Non-GAAP) (1) 7.91% 7.74% 7.83% 7.65% 7.73% 7.35% 8.05% 7.63% As of December 31, |
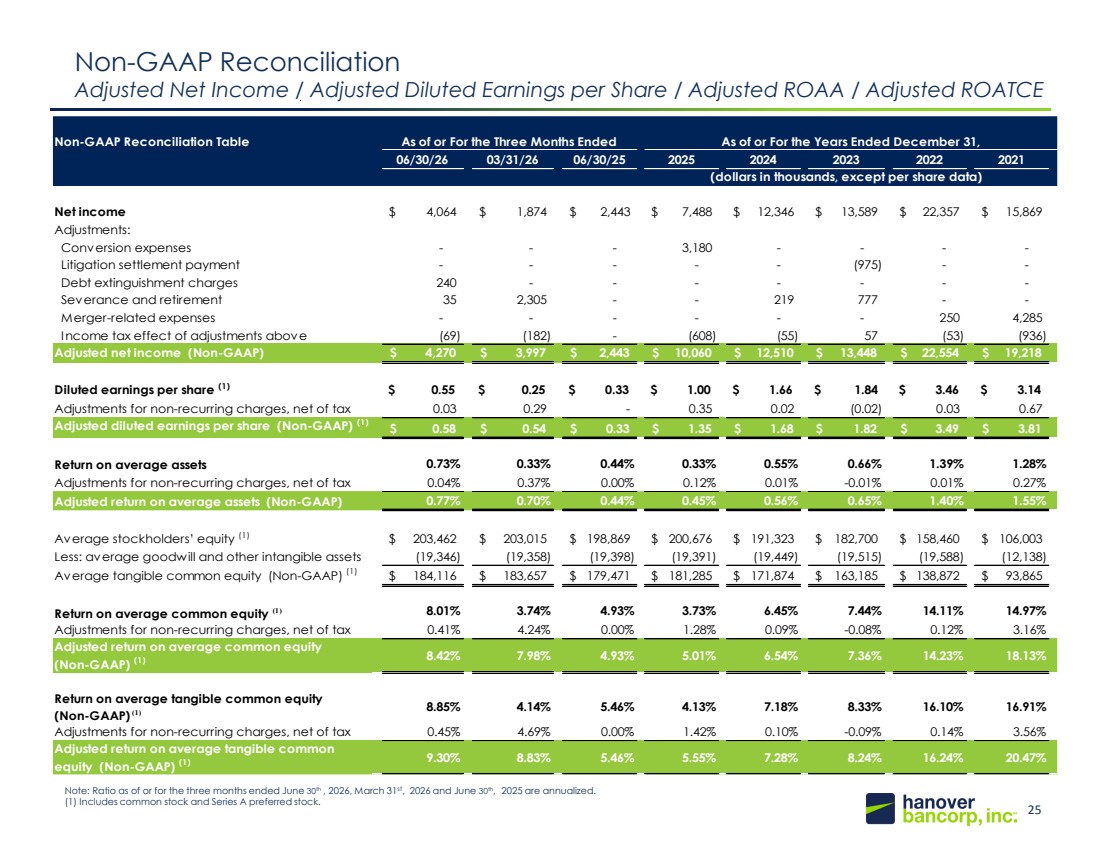
| 25 148, 201, 61 20, 49, 89 Non-GAAP Reconciliation Adjusted Net Income / Adjusted Diluted Earnings per Share / Adjusted ROAA / Adjusted ROATCE Note: Ratio as of or for the three months ended June 30th , 2026, March 31st, 2026 and June 30th, 2025 are annualized. (1) Includes common stock and Series A preferred stock. Non-GAAP Reconciliation Table 06/30/26 03/31/26 06/30/25 2025 2024 2023 2022 2021 Net income $ 4,064 $ 1,874 $ 2,443 $ 7,488 $ 12,346 $ 13,589 $ 22,357 $ 15,869 Adjustments: Conversion expenses - - - 3,180 - - - - Litigation settlement payment - - - - - (975) - - Debt extinguishment charges 240 - - - - - - - Severance and retirement 35 2,305 - - 219 777 - - Merger-related expenses - - - - - - 250 4,285 Income tax effect of adjustments above (69) (182) - (608) (55) 57 (53) (936) Adjusted net income (Non-GAAP) $ 4,270 $ 3,997 $ 2,443 $ 10,060 $ 12,510 $ 13,448 $ 22,554 $ 19,218 Diluted earnings per share (1) $ 0.55 $ 0.25 $ 0.33 $ 1.00 $ 1.66 $ 1.84 $ 3.46 $ 3.14 Adjustments for non-recurring charges, net of tax 0.03 0.29 - 0.35 0.02 (0.02) 0.03 0.67 Adjusted diluted earnings per share (Non-GAAP) (1) $ 0.58 $ 0.54 $ 0.33 $ 1.35 $ 1.68 $ 1.82 $ 3.49 $ 3.81 Return on average assets 0.73% 0.33% 0.44% 0.33% 0.55% 0.66% 1.39% 1.28% Adjustments for non-recurring charges, net of tax 0.04% 0.37% 0.00% 0.12% 0.01% -0.01% 0.01% 0.27% Adjusted return on average assets (Non-GAAP) 0.77% 0.70% 0.44% 0.45% 0.56% 0.65% 1.40% 1.55% Average stockholders’ equity (1) $ 203,462 $ 203,015 $ 198,869 $ 200,676 $ 191,323 $ 182,700 $ 158,460 $ 106,003 Less: average goodwill and other intangible assets (19,346) (19,358) (19,398) (19,391) (19,449) (19,515) (19,588) (12,138) Average tangible common equity (Non-GAAP) (1) $ 184,116 $ 183,657 $ 179,471 $ 181,285 $ 171,874 $ 163,185 $ 138,872 $ 93,865 Return on average common equity (1) 8.01% 3.74% 4.93% 3.73% 6.45% 7.44% 14.11% 14.97% Adjustments for non-recurring charges, net of tax 0.41% 4.24% 0.00% 1.28% 0.09% -0.08% 0.12% 3.16% Adjusted return on average common equity (Non-GAAP) (1) 8.42% 7.98% 4.93% 5.01% 6.54% 7.36% 14.23% 18.13% Return on average tangible common equity (Non-GAAP) (1) 8.85% 4.14% 5.46% 4.13% 7.18% 8.33% 16.10% 16.91% Adjustments for non-recurring charges, net of tax 0.45% 4.69% 0.00% 1.42% 0.10% -0.09% 0.14% 3.56% Adjusted return on average tangible common equity (Non-GAAP) (1) 9.30% 8.83% 5.46% 5.55% 7.28% 8.24% 16.24% 20.47% As of or For the Years Ended December 31, (dollars in thousands, except per share data) As of or For the Three Months Ended |
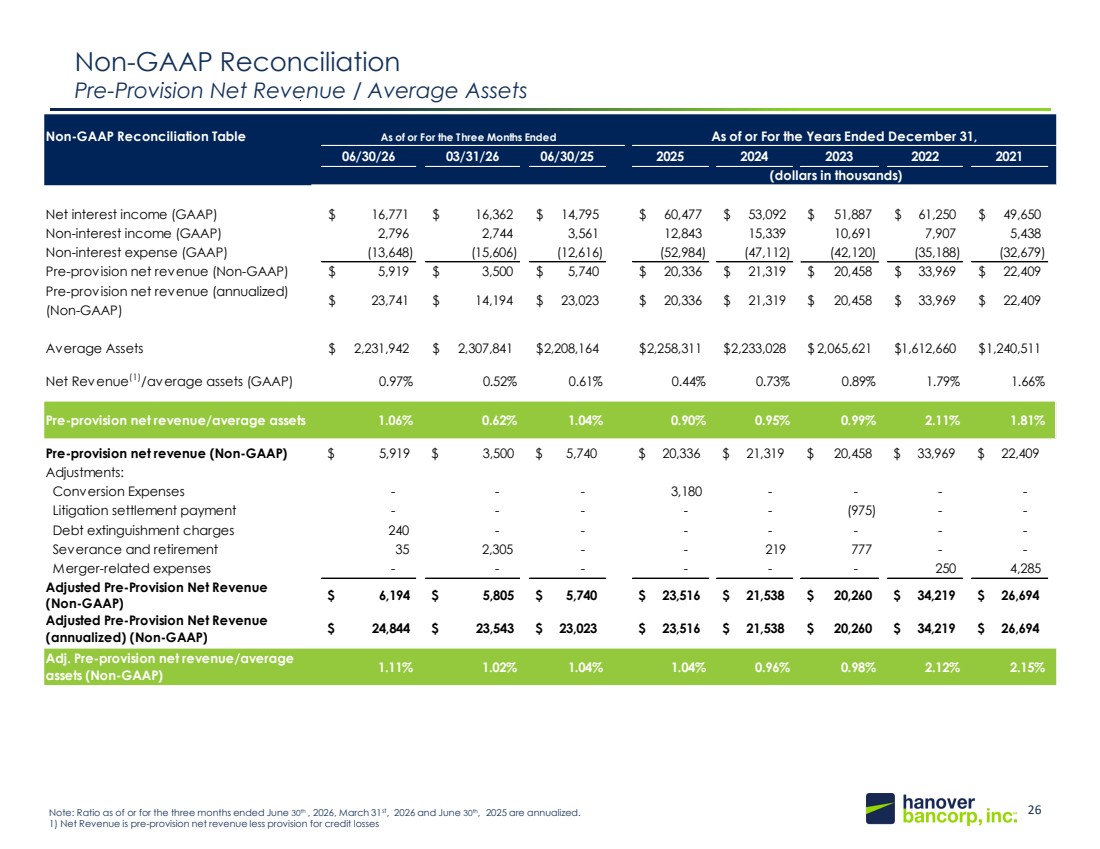
| 26 148, 201, 61 20, 49, 89 Non-GAAP Reconciliation Pre-Provision Net Revenue / Average Assets Note: Ratio as of or for the three months ended June 30th , 2026, March 31st, 2026 and June 30th, 2025 are annualized. 1) Net Revenue is pre-provision net revenue less provision for credit losses Non-GAAP Reconciliation Table 06/30/26 03/31/26 06/30/25 2025 2024 2023 2022 2021 Net interest income (GAAP) $ 16,771 $ 16,362 $ 14,795 $ 60,477 $ 53,092 $ 51,887 $ 61,250 $ 49,650 Non-interest income (GAAP) 2,796 2,744 3,561 12,843 15,339 10,691 7,907 5,438 Non-interest expense (GAAP) (13,648) (15,606) (12,616) (52,984) (47,112) (42,120) (35,188) (32,679) Pre-provision net revenue (Non-GAAP) $ 5,919 $ 3,500 $ 5,740 $ 20,336 $ 21,319 $ 20,458 $ 33,969 $ 22,409 Pre-provision net revenue (annualized) (Non-GAAP) $ 23,741 $ 14,194 $ 23,023 $ 20,336 $ 21,319 $ 20,458 $ 33,969 $ 22,409 Average Assets $ 2,231,942 $ 2,307,841 $2,208,164 $2,258,311 $2,233,028 $ 2,065,621 $1,612,660 $1,240,511 Net Revenue(1)/average assets (GAAP) 0.97% 0.52% 0.61% 0.44% 0.73% 0.89% 1.79% 1.66% Pre-provision net revenue/average assets 1.06% 0.62% 1.04% 0.90% 0.95% 0.99% 2.11% 1.81% Pre-provision net revenue (Non-GAAP) $ 5,919 $ 3,500 $ 5,740 $ 20,336 $ 21,319 $ 20,458 $ 33,969 $ 22,409 Adjustments: Conversion Expenses - - - 3,180 - - - - Litigation settlement payment - - - - - (975) - - Debt extinguishment charges 240 - - - - - - - Severance and retirement 35 2,305 - - 219 777 - - Merger-related expenses - - - - - - 250 4,285 Adjusted Pre-Provision Net Revenue (Non-GAAP) $ 6,194 $ 5,805 $ 5,740 $ 23,516 $ 21,538 $ 20,260 $ 34,219 $ 26,694 Adjusted Pre-Provision Net Revenue (annualized) (Non-GAAP) $ 24,844 $ 23,543 $ 23,023 $ 23,516 $ 21,538 $ 20,260 $ 34,219 $ 26,694 Adj. Pre-provision net revenue/average assets (Non-GAAP) 1.11% 1.02% 1.04% 1.04% 0.96% 0.98% 2.12% 2.15% As of or For the Years Ended December 31, (dollars in thousands) As of or For the Three Months Ended |
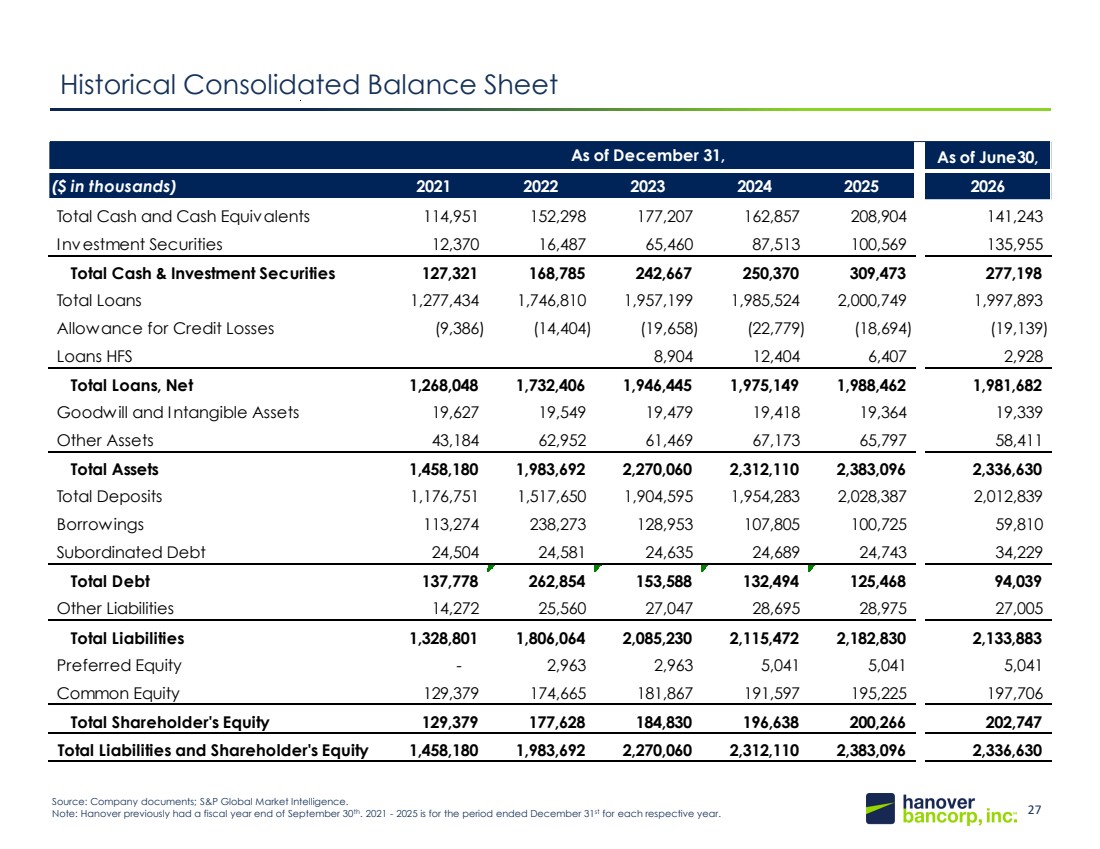
| 27 148, 201, 61 20, 49, 89 Historical Consolidated Balance Sheet December 31, ($ in thousands) 2021 2022 2023 2024 2025 Total Cash and Cash Equivalents 114,951 152,298 177,207 162,857 208,904 Investment Securities 12,370 16,487 65,460 87,513 100,569 Total Cash & Investment Securities 127,321 168,785 242,667 250,370 309,473 Total Loans 1,277,434 1,746,810 1,957,199 1,985,524 2,000,749 Allowance for Credit Losses 9,386 14,404 19,658 22,779 18,694 Loans HFS – – 8,904 12,404 6,407 Total Loans, Net 1,268,048 1,732,406 1,946,445 1,975,149 1,988,462 Goodwill and Intangible Assets 19,627 19,549 19,479 19,418 19,364 Other Assets 43,184 62,952 61,469 67,173 65,797 Total Assets 1,458,180 1,983,692 2,270,060 2,312,110 2,383,096 Total Deposits 1,176,751 1,517,650 1,904,595 1,954,283 2,028,387 Borrowings 113,274 250,336 139,412 116,830 111,292 Subordinated Debt 24,504 24,581 24,635 24,689 24,743 Total Debt 137,778 274,917 164,047 141,519 136,035 Total Other Liabilities 14,272 13,497 16,588 19,670 18,408 Total Liabilities 1,328,801 1,806,064 2,085,230 2,115,472 2,182,830 Preferred Equity – 2,963 2,963 5,041 5,041 Common Equity 129,379 174,665 181,867 191,597 195,225 Total Shareholder's Equity 129,379 177,628 184,830 196,638 200,266 Total Liabilities and Shareholder's Equity 1,458,180 1,983,692 2,270,060 2,312,110 2,383,096 Source: Company documents; S&P Global Market Intelligence. Note: Hanover previously had a fiscal year end of September 30th. 2021 - 2025 is for the period ended December 31st for each respective year. As of June30, ($ in thousands) 2021 2022 2023 2024 2025 2026 Total Cash and Cash Equivalents 114,951 152,298 177,207 162,857 208,904 141,243 Investment Securities 12,370 16,487 65,460 87,513 100,569 135,955 Total Cash & Investment Securities 127,321 168,785 242,667 250,370 309,473 277,198 Total Loans 1,277,434 1,746,810 1,957,199 1,985,524 2,000,749 1,997,893 Allowance for Credit Losses (9,386) (14,404) (19,658) (22,779) (18,694) (19,139) Loans HFS 8,904 12,404 6,407 2,928 Total Loans, Net 1,268,048 1,732,406 1,946,445 1,975,149 1,988,462 1,981,682 Goodwill and Intangible Assets 19,627 19,549 19,479 19,418 19,364 19,339 Other Assets 43,184 62,952 61,469 67,173 65,797 58,411 Total Assets 1,458,180 1,983,692 2,270,060 2,312,110 2,383,096 2,336,630 Total Deposits 1,176,751 1,517,650 1,904,595 1,954,283 2,028,387 2,012,839 Borrowings 113,274 238,273 128,953 107,805 100,725 59,810 Subordinated Debt 24,504 24,581 24,635 24,689 24,743 34,229 Total Debt 137,778 262,854 153,588 132,494 125,468 94,039 Other Liabilities 14,272 25,560 27,047 28,695 28,975 27,005 Total Liabilities 1,328,801 1,806,064 2,085,230 2,115,472 2,182,830 2,133,883 Preferred Equity - 2,963 2,963 5,041 5,041 5,041 Common Equity 129,379 174,665 181,867 191,597 195,225 197,706 Total Shareholder's Equity 129,379 177,628 184,830 196,638 200,266 202,747 Total Liabilities and Shareholder's Equity 1,458,180 1,983,692 2,270,060 2,312,110 2,383,096 2,336,630 As of December 31, |
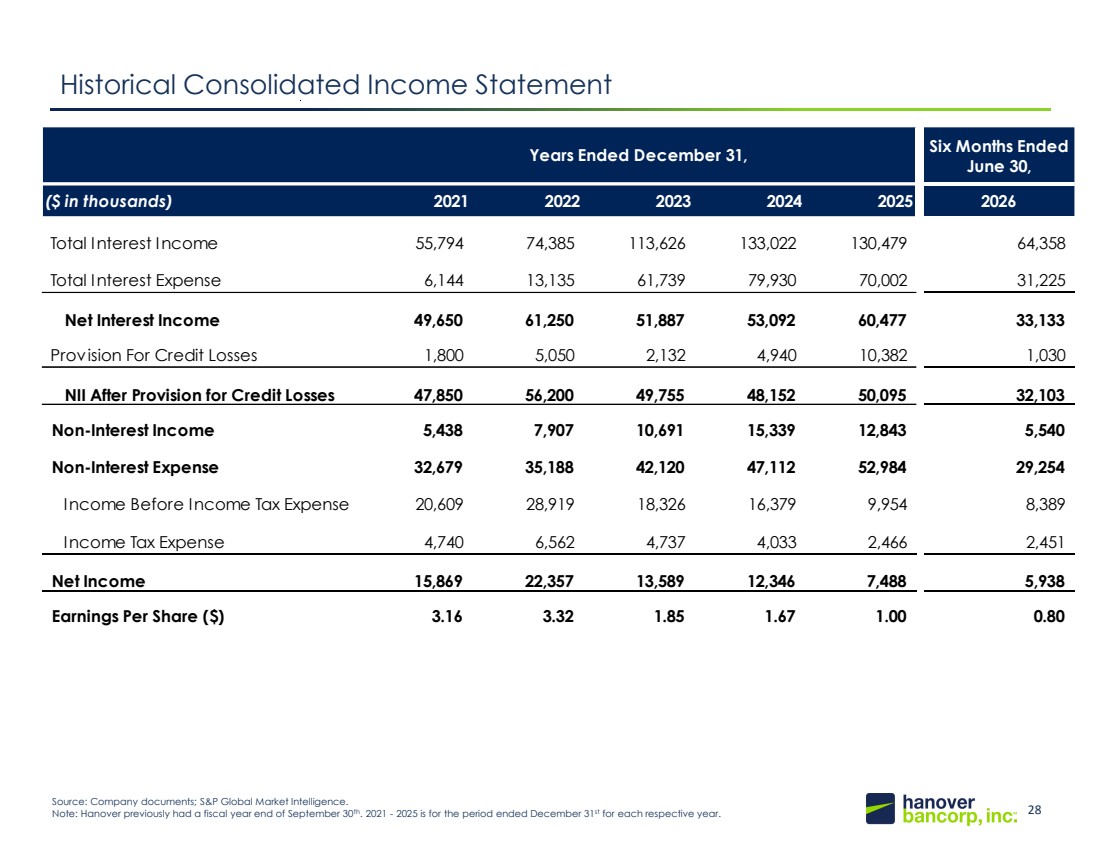
| 28 148, 201, 61 20, 49, 89 Historical Consolidated Income Statement Six Months Ended June 30, ($ in thousands) 2021 2022 2023 2024 2025 2026 Total Interest Income 55,794 74,385 113,626 133,022 130,479 64,358 Total Interest Expense 6,144 13,135 61,739 79,930 70,002 31,225 Net Interest Income 49,650 61,250 51,887 53,092 60,477 33,133 Provision For Credit Losses 1,800 5,050 2,132 4,940 10,382 1,030 NII After Provision for Credit Losses 47,850 56,200 49,755 48,152 50,095 32,103 Non-Interest Income 5,438 7,907 10,691 15,339 12,843 5,540 Non-Interest Expense 32,679 35,188 42,120 47,112 52,984 29,254 Income Before Income Tax Expense 20,609 28,919 18,326 16,379 9,954 8,389 Income Tax Expense 4,740 6,562 4,737 4,033 2,466 2,451 Net Income 15,869 22,357 13,589 12,346 7,488 5,938 Earnings Per Share ($) 3.16 3.32 1.85 1.67 1.00 0.80 Years Ended December 31, Source: Company documents; S&P Global Market Intelligence. Note: Hanover previously had a fiscal year end of September 30th. 2021 - 2025 is for the period ended December 31st for each respective year. |