
THE CHEMOURS COMPANY Investor Presentation September 2026
This presentation contains forward-looking statements, within the meaning of Section 27A of the Securities Act of 1933 and Section 21E of the Securities Exchange Act of 1934, which involve risks and uncertainties. Forward-looking statements provide current expectations of future events based on certain assumptions and include any statement that does not directly relate to a historical or current fact. The words "believe," "expect," "will," "anticipate," "plan," "estimate," "target," "project" and similar expressions, among others, generally identify "forward-looking statements," which speak only as of the date such statements were made. Forward-looking statements are based on certain assumptions and expectations of future events that may not be accurate or realized, such as guidance relying on models based upon management assumptions regarding future events that are inherently uncertain. These statements are not guarantees of future performance. Forward-looking statements also involve risks and uncertainties including the outcome or resolution of any pending or future environmental liabilities, the commencement, outcome or resolution of any regulatory inquiry, investigation or proceeding, the initiation, outcome or settlement of any litigation, our ability to maintain an effective internal control over financial reporting and disclosure controls and procedures, changes in environmental regulations in the U.S. or other jurisdictions that affect demand for or adoption of our products, changes in regulations in the U.S. or other jurisdictions that could impose tariffs or additional costs on products we either sell or need to purchase, anticipated future operating and financial performance for our segments individually and our company as a whole, business plans, prospects, targets, goals and commitments, capital investments and projects and target capital expenditures, efforts to resolve outstanding or potential litigation, including claims related to legacy PFAS liabilities, plans for dividends, sufficiency or longevity of intellectual property protection, cost reductions or savings targets, plans to increase profitability and growth, our ability to develop and commercialize new products or technologies and obtain necessary regulatory approvals, our ability to make acquisitions, integrate acquired businesses or assets into our operations, and achieve anticipated synergies or cost savings, among others, all of which are subject to substantial risks and uncertainties that could cause actual results to differ materially from those expressed or implied by such statements. These statements also may involve risks and uncertainties that are beyond Chemours' control. Matters outside our control, including general economic conditions, geopolitical conditions, changes in laws and regulations in the U.S. or other jurisdictions in which we operate, and global health events and weather events, among others, have affected or may affect our business and operations and may or may continue to hinder our ability to provide goods and services to customers, cause disruptions in our supply chains such as through strikes, labor disruptions or other events, adversely affect our business partners, significantly reduce the demand for our products, adversely affect the health and welfare of our personnel or cause other unpredictable events. Additionally, there may be other risks and uncertainties that Chemours is unable to identify at this time or that Chemours does not currently expect to have a material impact on its business. Factors that could cause or contribute to these differences include the risks, uncertainties and other factors discussed in our documents filed with or furnished to the U.S. Securities and Exchange Commission (“SEC”), including in our Quarterly Report on Form 10-Q for the quarter ended June 30, 2026 and our Annual Report on Form 10-K for the year ended December 31, 2025. Chemours assumes no obligation to revise or update any forward-looking statement for any reason, except as required by law. We prepare our financial statements in accordance with Generally Accepted Accounting Principles (GAAP). Within this presentation, we may make reference to Adjusted Net Income, Adjusted EPS, Adjusted EBITDA, Adjusted EBITDA Margin, Free Cash Flow, Free Cash Flow Conversion, Total Debt Principal, Net Debt and Net Leverage Ratio which do not have any standardized meaning as prescribed by GAAP and are considered non-GAAP financial measures. The Company includes these non-GAAP financial measures because management believes they are useful to investors in that they provide for greater transparency with respect to supplemental information used by management in its financial and operational decision making. Management uses Adjusted Net Income, Adjusted EPS, Adjusted EBITDA Margin, and Adjusted EBITDA, which adjust for (i) certain non-cash items, (ii) certain items we believe are not indicative of ongoing operating performance or (iii) certain nonrecurring, unusual or infrequent items to evaluate the Company's performance in order to have comparable financial results to analyze changes in our underlying business from period to period. Additionally, Free Cash Flow, Free Cash Flow Conversion, Total Debt Principal, Net Debt and Net Leverage Ratio are utilized as liquidity measures to assess the cash generation of our businesses and on-going liquidity position. These measures may not be comparable to similar measures presented by other companies and should not be viewed as a substitute for measures reported under GAAP. Accordingly, the Company believes the presentation of these non-GAAP financial measures, when used in conjunction with GAAP financial measures, is a useful financial analysis tool that can assist investors in assessing the Company's operating performance and underlying prospects. This analysis should not be considered in isolation or as a substitute for analysis of our results as reported under GAAP. This analysis, as well as the other information in this presentation, should be read in conjunction with the Company's financial statements and footnotes contained in the documents that the Company files with the SEC. The non-GAAP financial measures used by the Company in this presentation may be different from the methods used by other companies. The Company does not provide a reconciliation of certain forward-looking non-GAAP financial measures to the most directly comparable GAAP reported financial measures on a forward-looking basis because it is unable to predict with reasonable certainty the ultimate outcome of unusual gains and losses, potential future asset impairments and pending litigation without unreasonable effort. These items are uncertain, depend on various factors, and could have a material impact on GAAP reported results for the guidance period. For more information on the non-GAAP financial measures, please refer to the reconciliation tables beginning on page 31 of this presentation and materials posted to the Company's website at investors.chemours.com. This presentation has been prepared by the Company for information purposes only and is being furnished on a confidential basis solely for use by the recipient in making its own evaluation of the Company and its business, assets, financial condition and prospects. Safe Harbor Statement and Other Matters
3 I. Company Overview II. Strategic Progress III. Financial Update IV. Appendix Agenda

I. COMPANY OVERVIEW
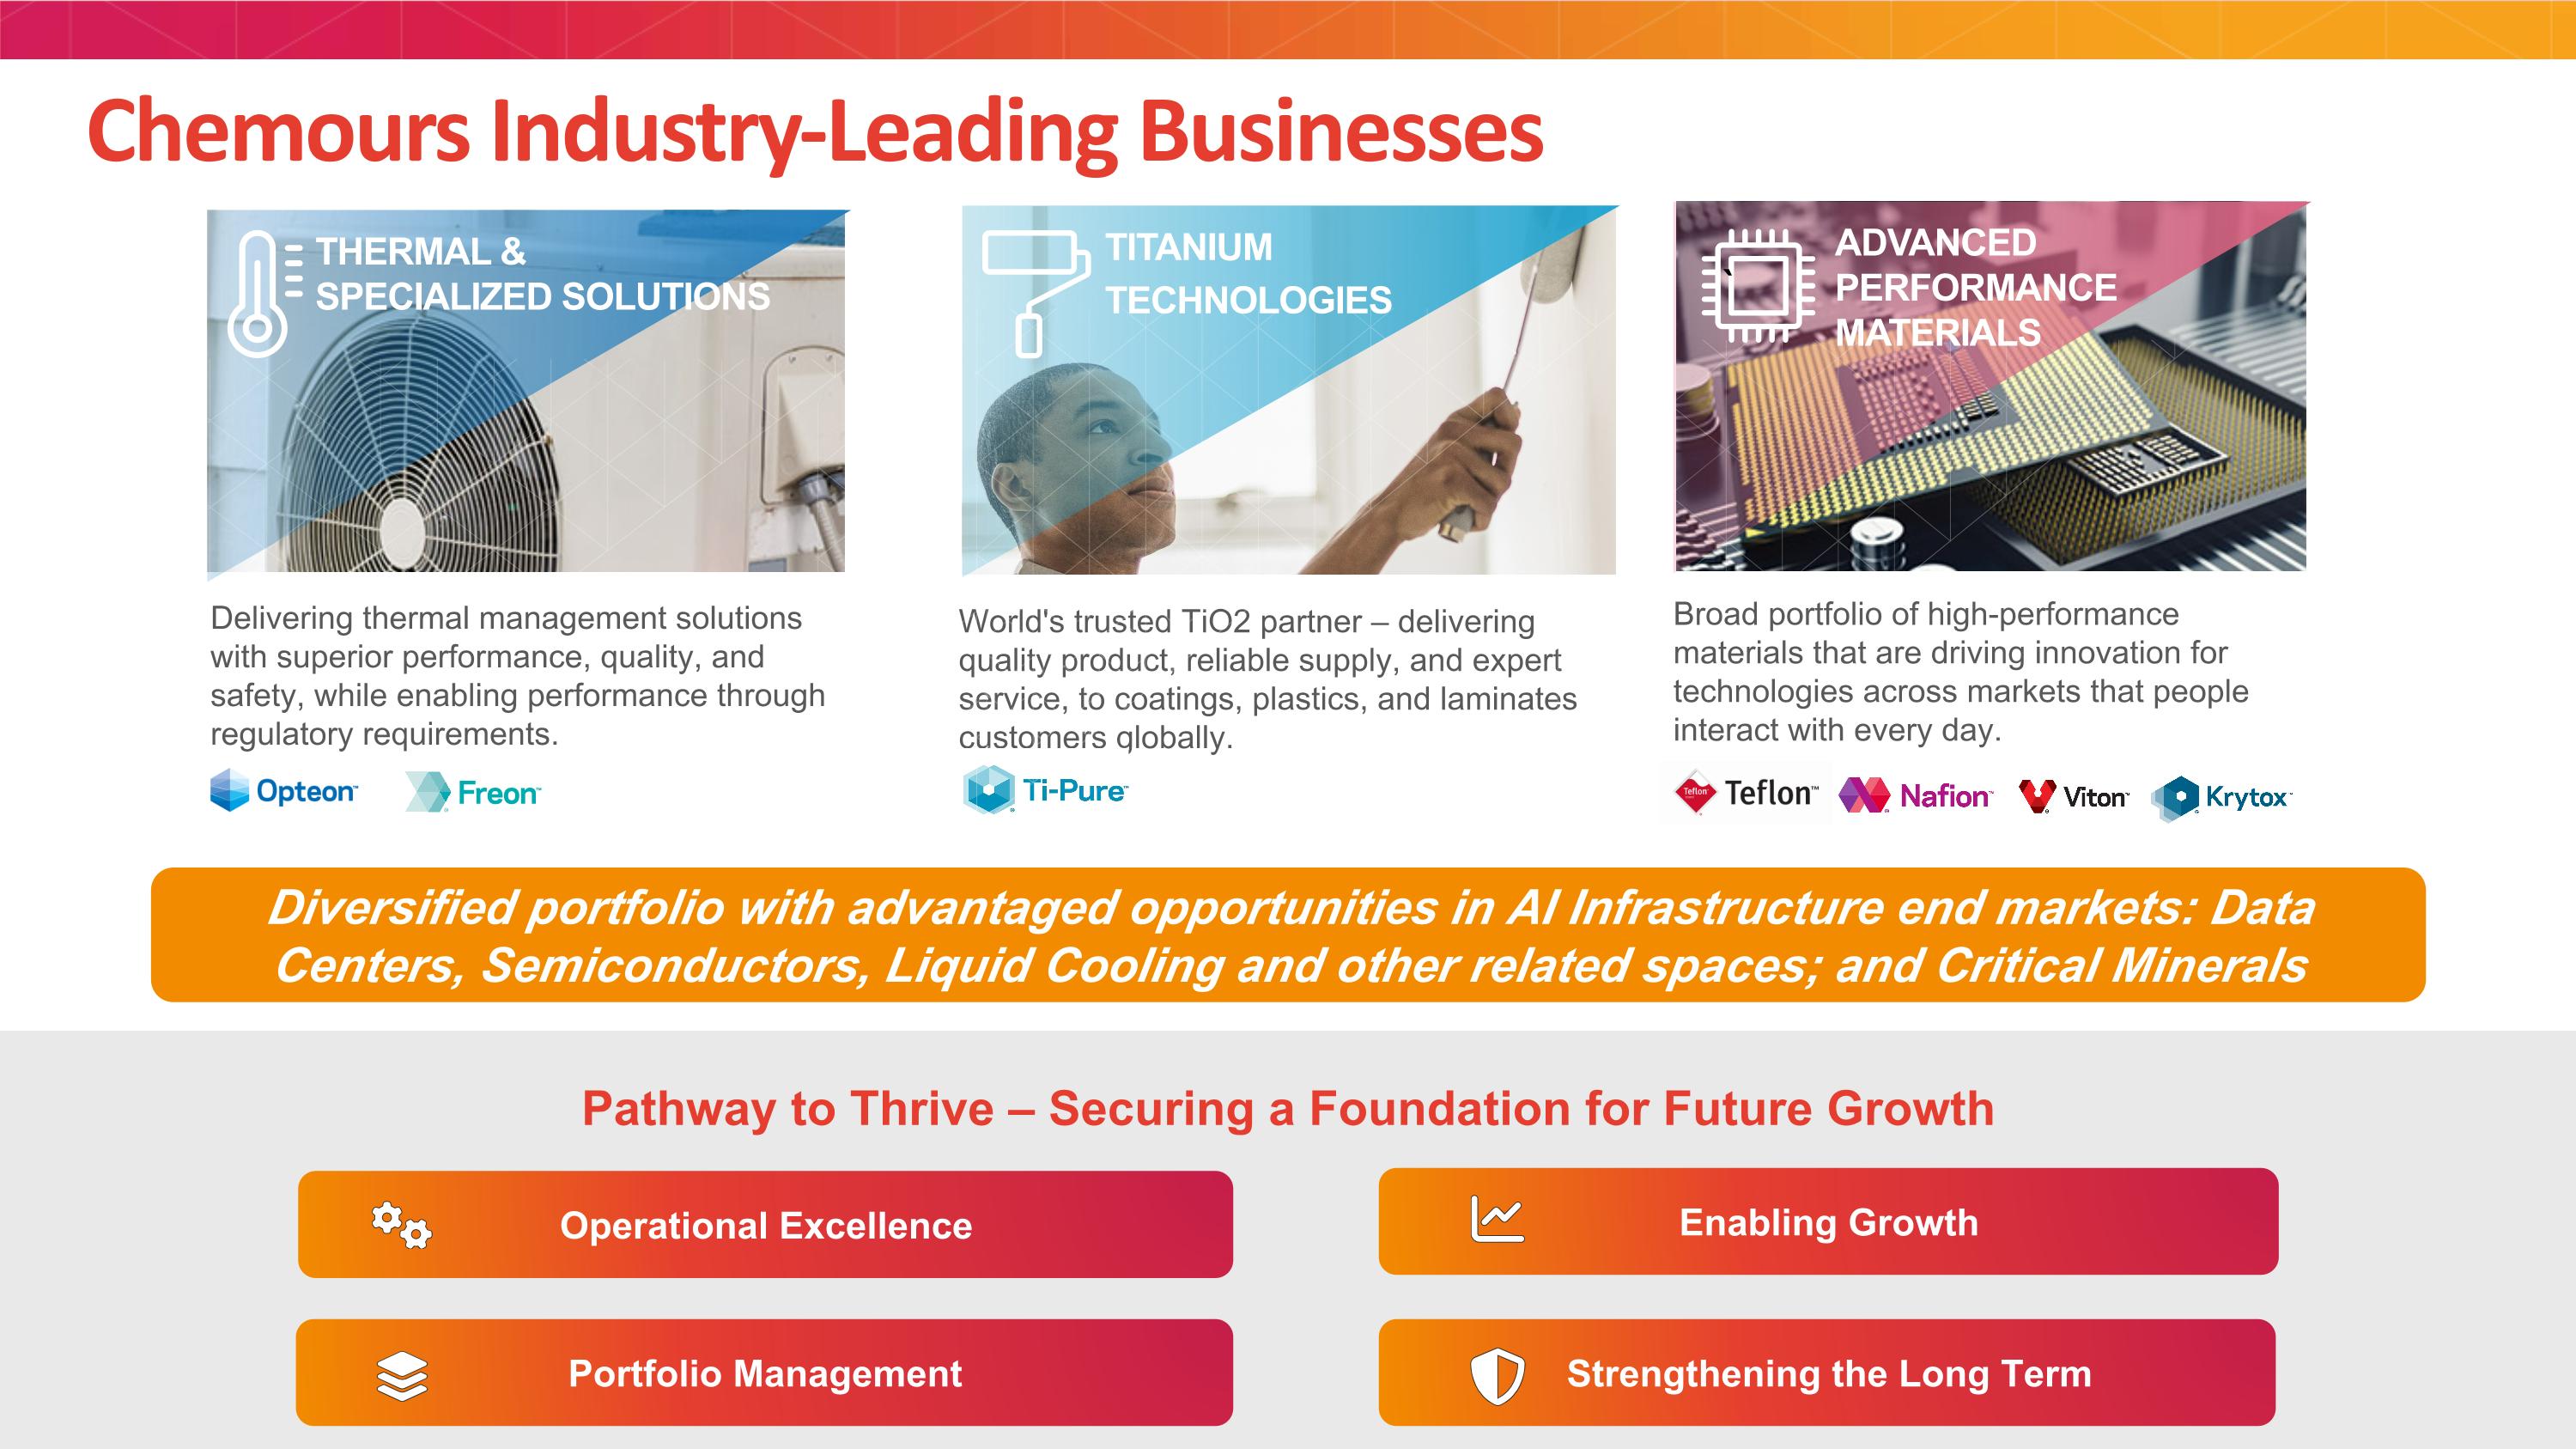
Chemours Industry-Leading Businesses World's trusted TiO2 partner – delivering quality product, reliable supply, and expert service, to coatings, plastics, and laminates customers globally. ADVANCED PERFORMANCE MATERIALS THERMAL & SPECIALIZED SOLUTIONS ` Delivering thermal management solutions with superior performance, quality, and safety, while enabling performance through regulatory requirements. Broad portfolio of high-performance materials that are driving innovation for technologies across markets that people interact with every day. TITANIUM TECHNOLOGIES Operational Excellence Pathway to Thrive – Securing a Foundation for Future Growth Portfolio Management Strengthening the Long Term Enabling Growth Diversified portfolio with advantaged opportunities in AI Infrastructure end markets: Data Centers, Semiconductors, Liquid Cooling and other related spaces; and Critical Minerals
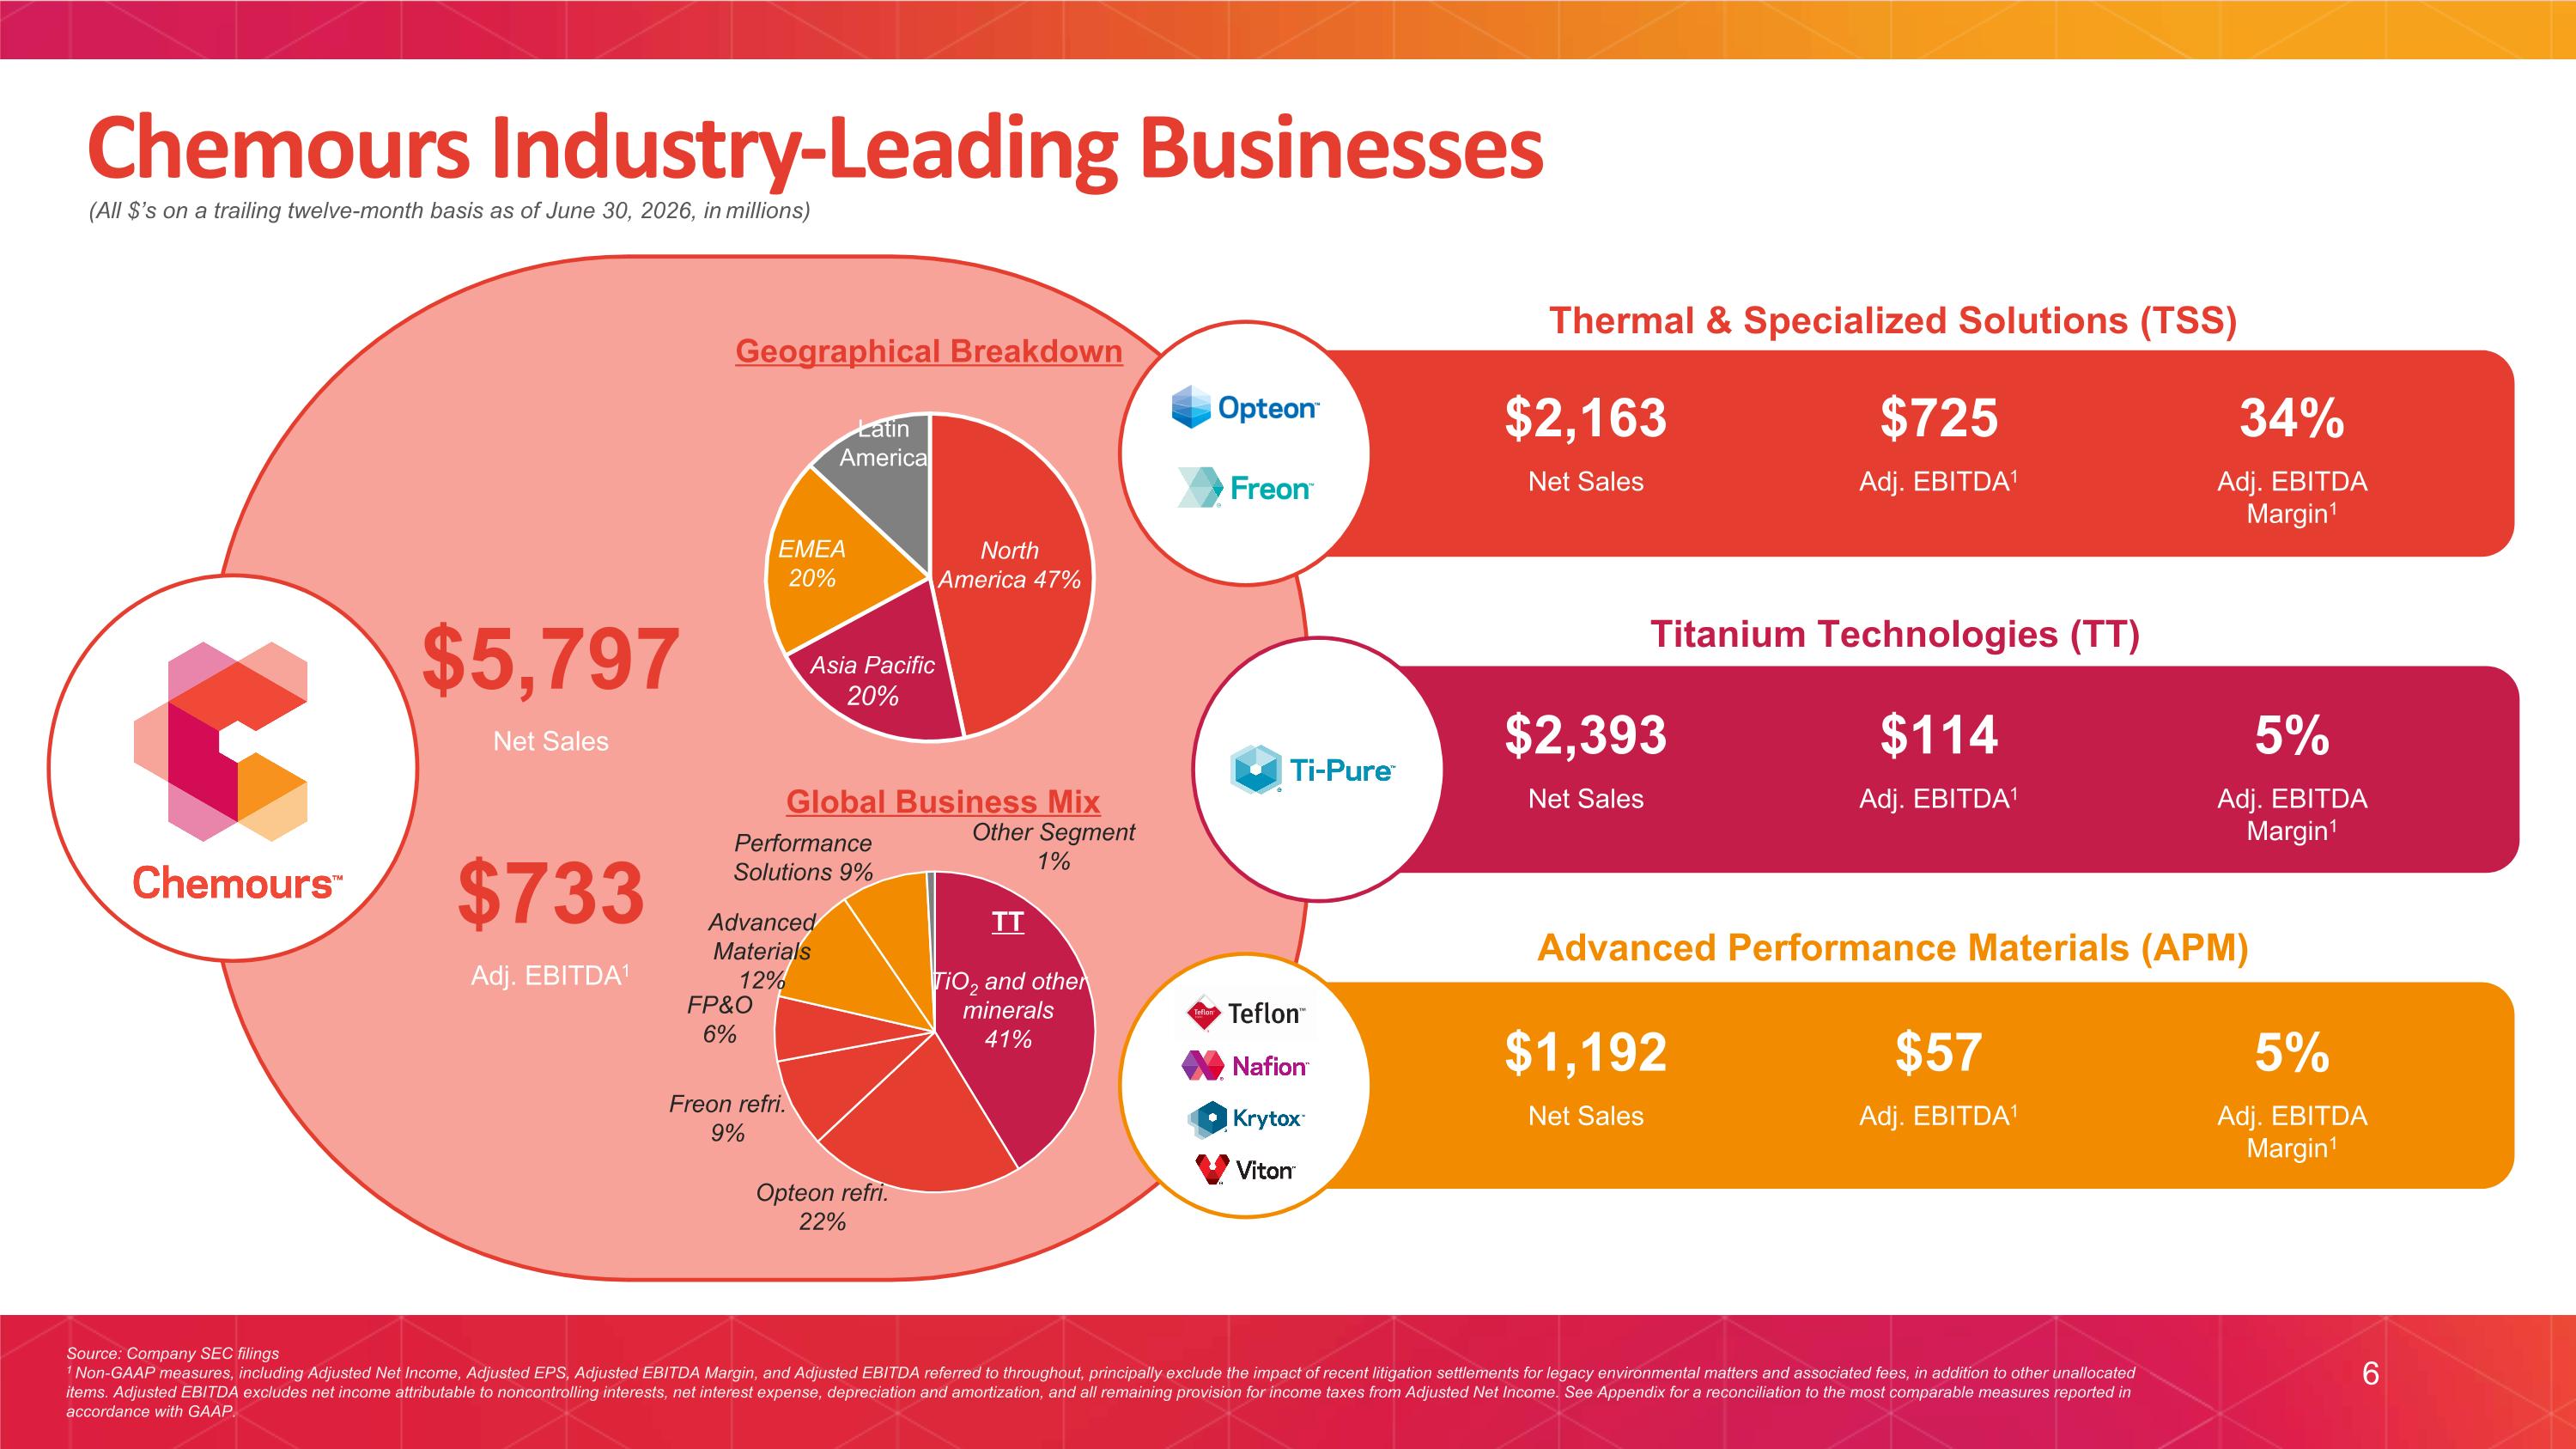
Source: Company SEC filings 1 Non-GAAP measures, including Adjusted Net Income, Adjusted EPS, Adjusted EBITDA Margin, and Adjusted EBITDA referred to throughout, principally exclude the impact of recent litigation settlements for legacy environmental matters and associated fees, in addition to other unallocated items. Adjusted EBITDA excludes net income attributable to noncontrolling interests, net interest expense, depreciation and amortization, and all remaining provision for income taxes from Adjusted Net Income. See Appendix for a reconciliation to the most comparable measures reported in accordance with GAAP. (All $’s on a trailing twelve-month basis as of June 30, 2026, in millions) 6 Chemours Industry-Leading Businesses Geographical Breakdown Global Business Mix Titanium Technologies (TT) Advanced Performance Materials (APM) Thermal & Specialized Solutions (TSS) $2,163 Net Sales $725 Adj. EBITDA1 34% Adj. EBITDA Margin1 $2,393 Net Sales $114 Adj. EBITDA1 5% Adj. EBITDA Margin1 $1,192 Net Sales $57 Adj. EBITDA1 5% Adj. EBITDA Margin1 $5,797 Net Sales $733 Adj. EBITDA1
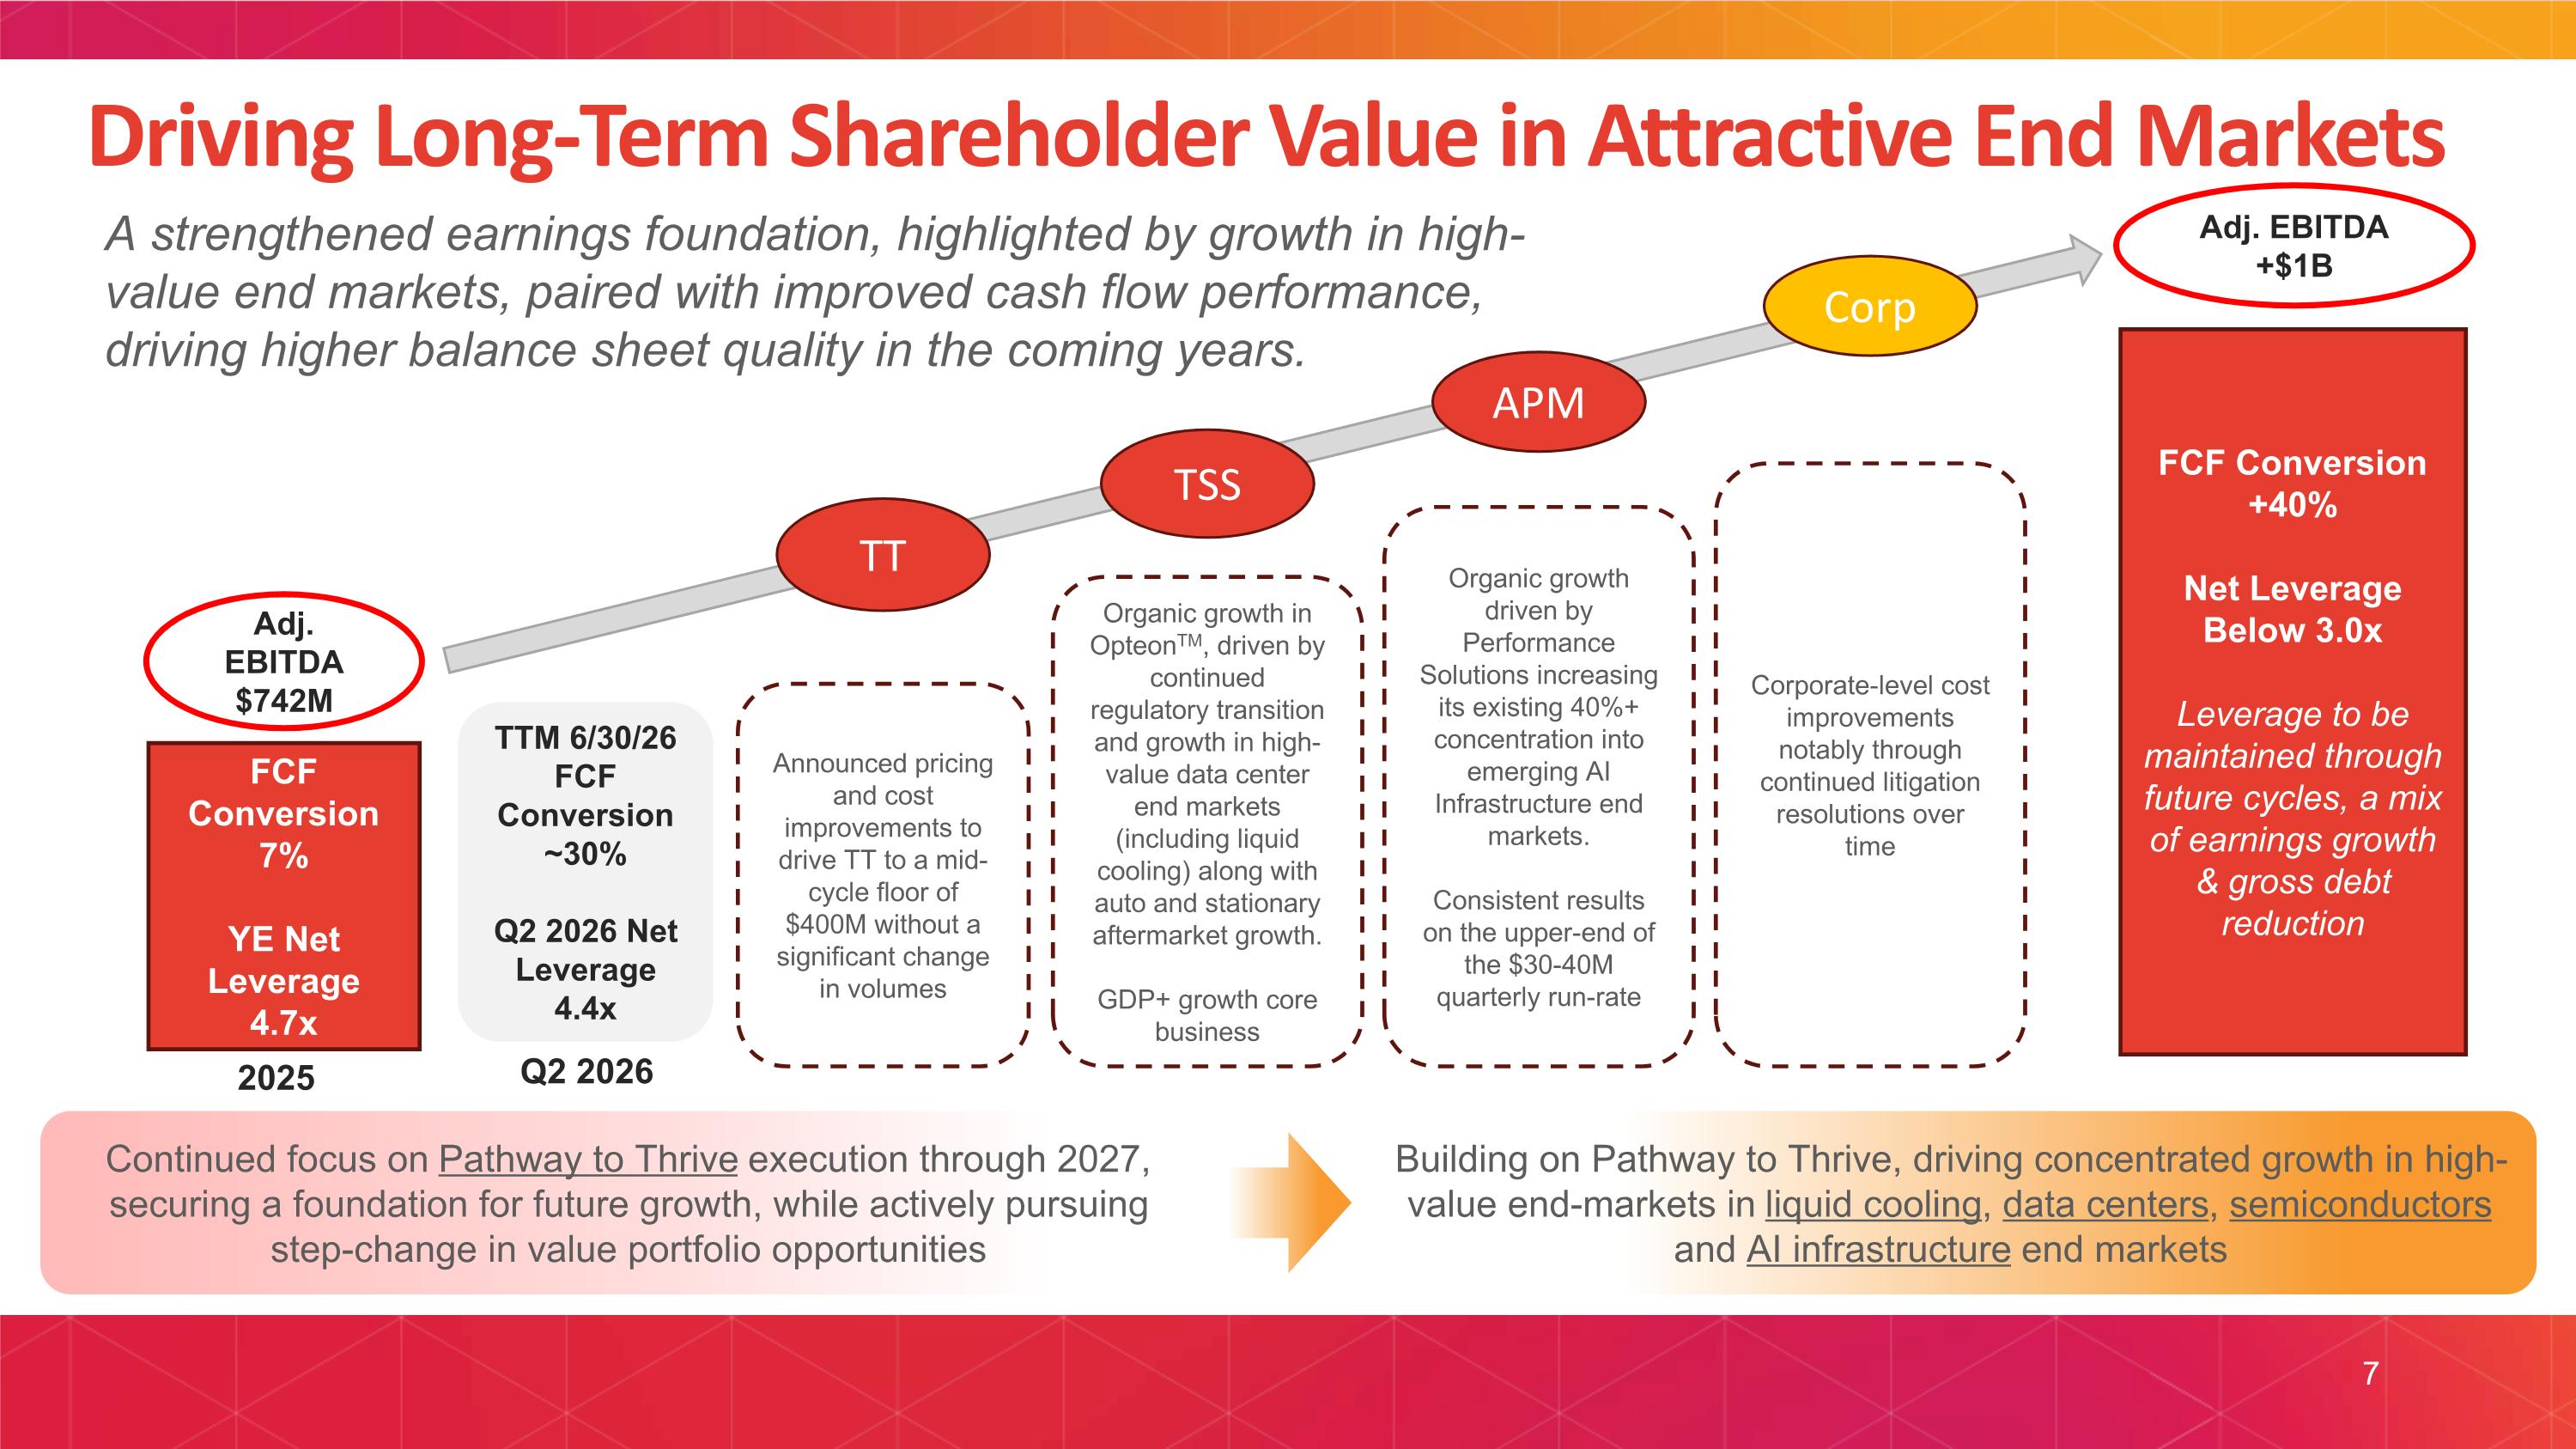
Driving Long-Term Shareholder Value in Attractive End Markets FCF Conversion 7% YE Net Leverage 4.7x FCF Conversion +40% Net Leverage Below 3.0x Leverage to be maintained through future cycles, a mix of earnings growth & gross debt reduction Continued focus on Pathway to Thrive execution through 2027, securing a foundation for future growth, while actively pursuing step-change in value portfolio opportunities Building on Pathway to Thrive, driving concentrated growth in high-value end-markets in liquid cooling, data centers, semiconductors and AI infrastructure end markets TT Announced pricing and cost improvements to drive TT to a mid-cycle floor of $400M without a significant change in volumes TSS Organic growth in OpteonTM, driven by continued regulatory transition and growth in high-value data center end markets (including liquid cooling) along with auto and stationary aftermarket growth. GDP+ growth core business APM Organic growth driven by Performance Solutions increasing its existing 40%+ concentration into emerging AI Infrastructure end markets. Consistent results on the upper-end of the $30-40M quarterly run-rate Corp Corporate-level cost improvements notably through continued litigation resolutions over time 2025 Adj. EBITDA $742M Adj. EBITDA +$1B A strengthened earnings foundation, highlighted by growth in high-value end markets, paired with improved cash flow performance, driving higher balance sheet quality in the coming years. TTM 6/30/26 FCF Conversion ~30% Q2 2026 Net Leverage 4.4x Q2 2026 7
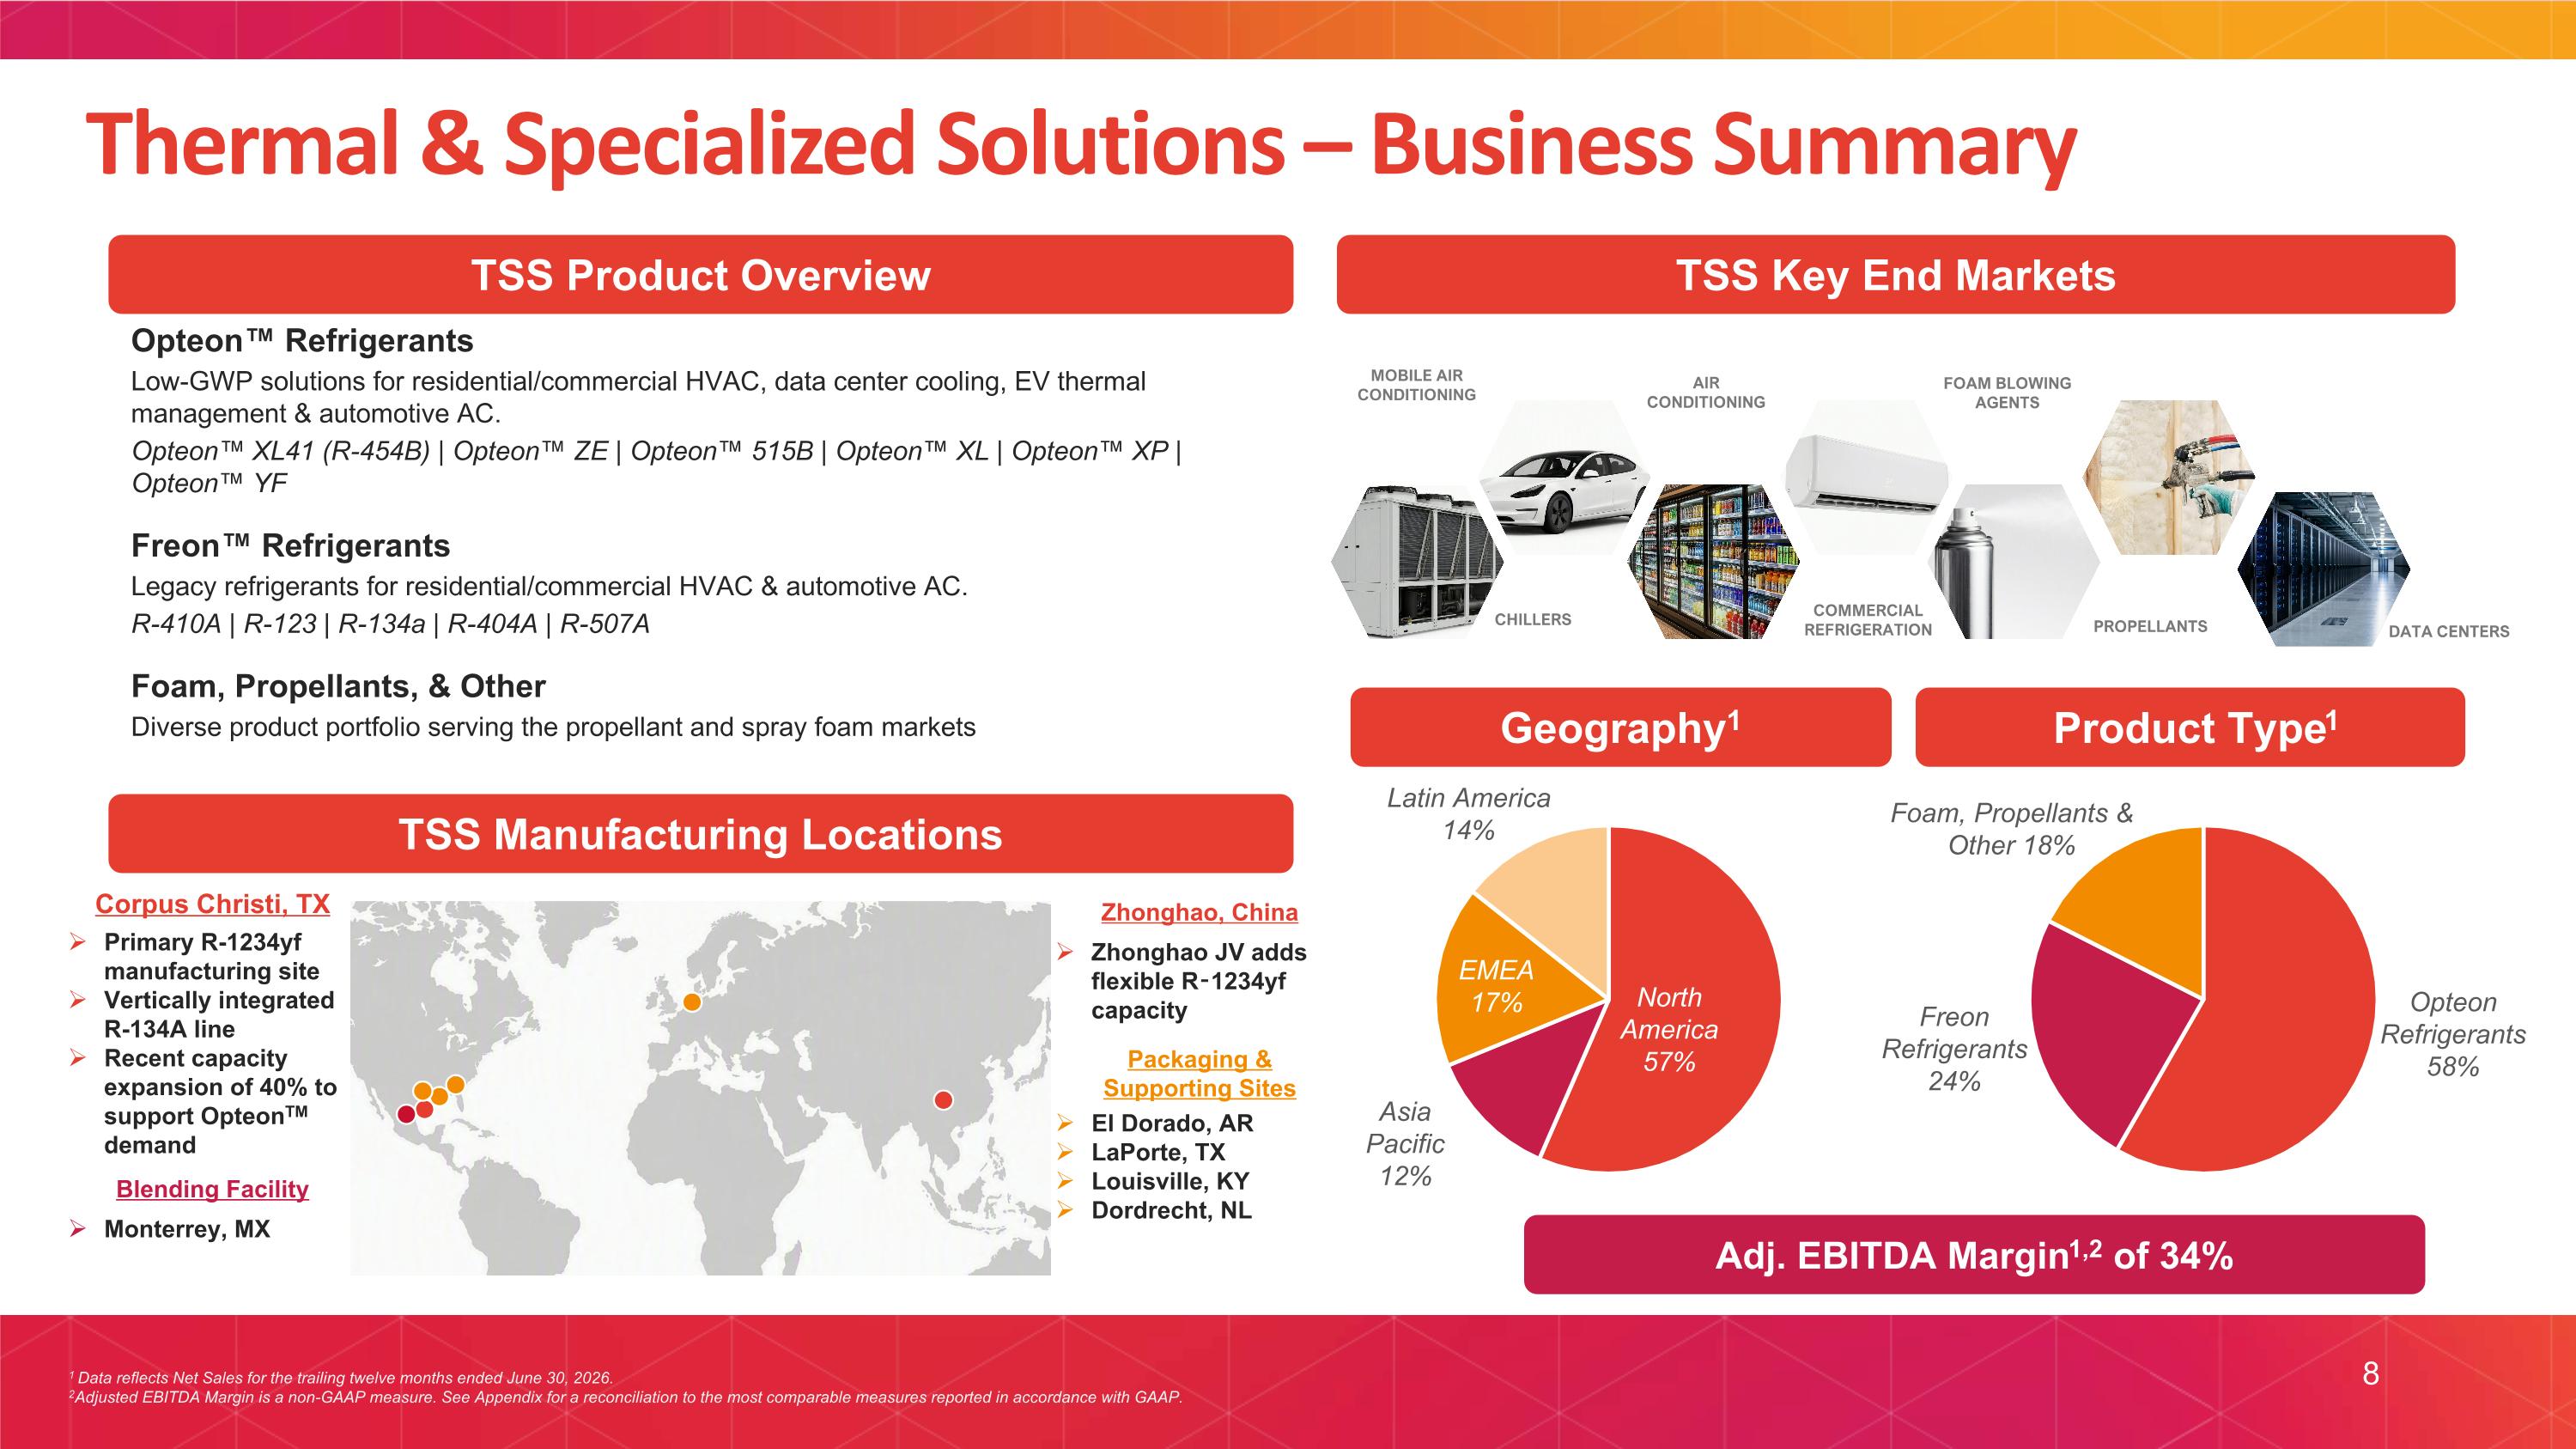
DATA CENTERS Opteon™ Refrigerants Low-GWP solutions for residential/commercial HVAC, data center cooling, EV thermal management & automotive AC. Opteon™ XL41 (R-454B) | Opteon™ ZE | Opteon™ 515B | Opteon™ XL | Opteon™ XP | Opteon™ YF Freon™ Refrigerants Legacy refrigerants for residential/commercial HVAC & automotive AC. R-410A | R-123 | R-134a | R-404A | R-507A Foam, Propellants, & Other Diverse product portfolio serving the propellant and spray foam markets TSS Key End Markets Product Type1 Geography1 Adj. EBITDA Margin1,2 of 34% TSS Product Overview 1 Data reflects Net Sales for the trailing twelve months ended June 30, 2026. 2Adjusted EBITDA Margin is a non-GAAP measure. See Appendix for a reconciliation to the most comparable measures reported in accordance with GAAP. 8 Thermal & Specialized Solutions – Business Summary Corpus Christi, TX Zhonghao, China TSS Manufacturing Locations Primary R-1234yf manufacturing site Vertically integrated R-134A line Recent capacity expansion of 40% to support OpteonTM demand Zhonghao JV adds flexible R‑1234yf capacity Packaging & Supporting Sites El Dorado, AR LaPorte, TX Louisville, KY Dordrecht, NL Blending Facility Monterrey, MX CHILLERS MOBILE AIR CONDITIONING AIR CONDITIONING FOAM BLOWING AGENTS COMMERCIAL REFRIGERATION PROPELLANTS
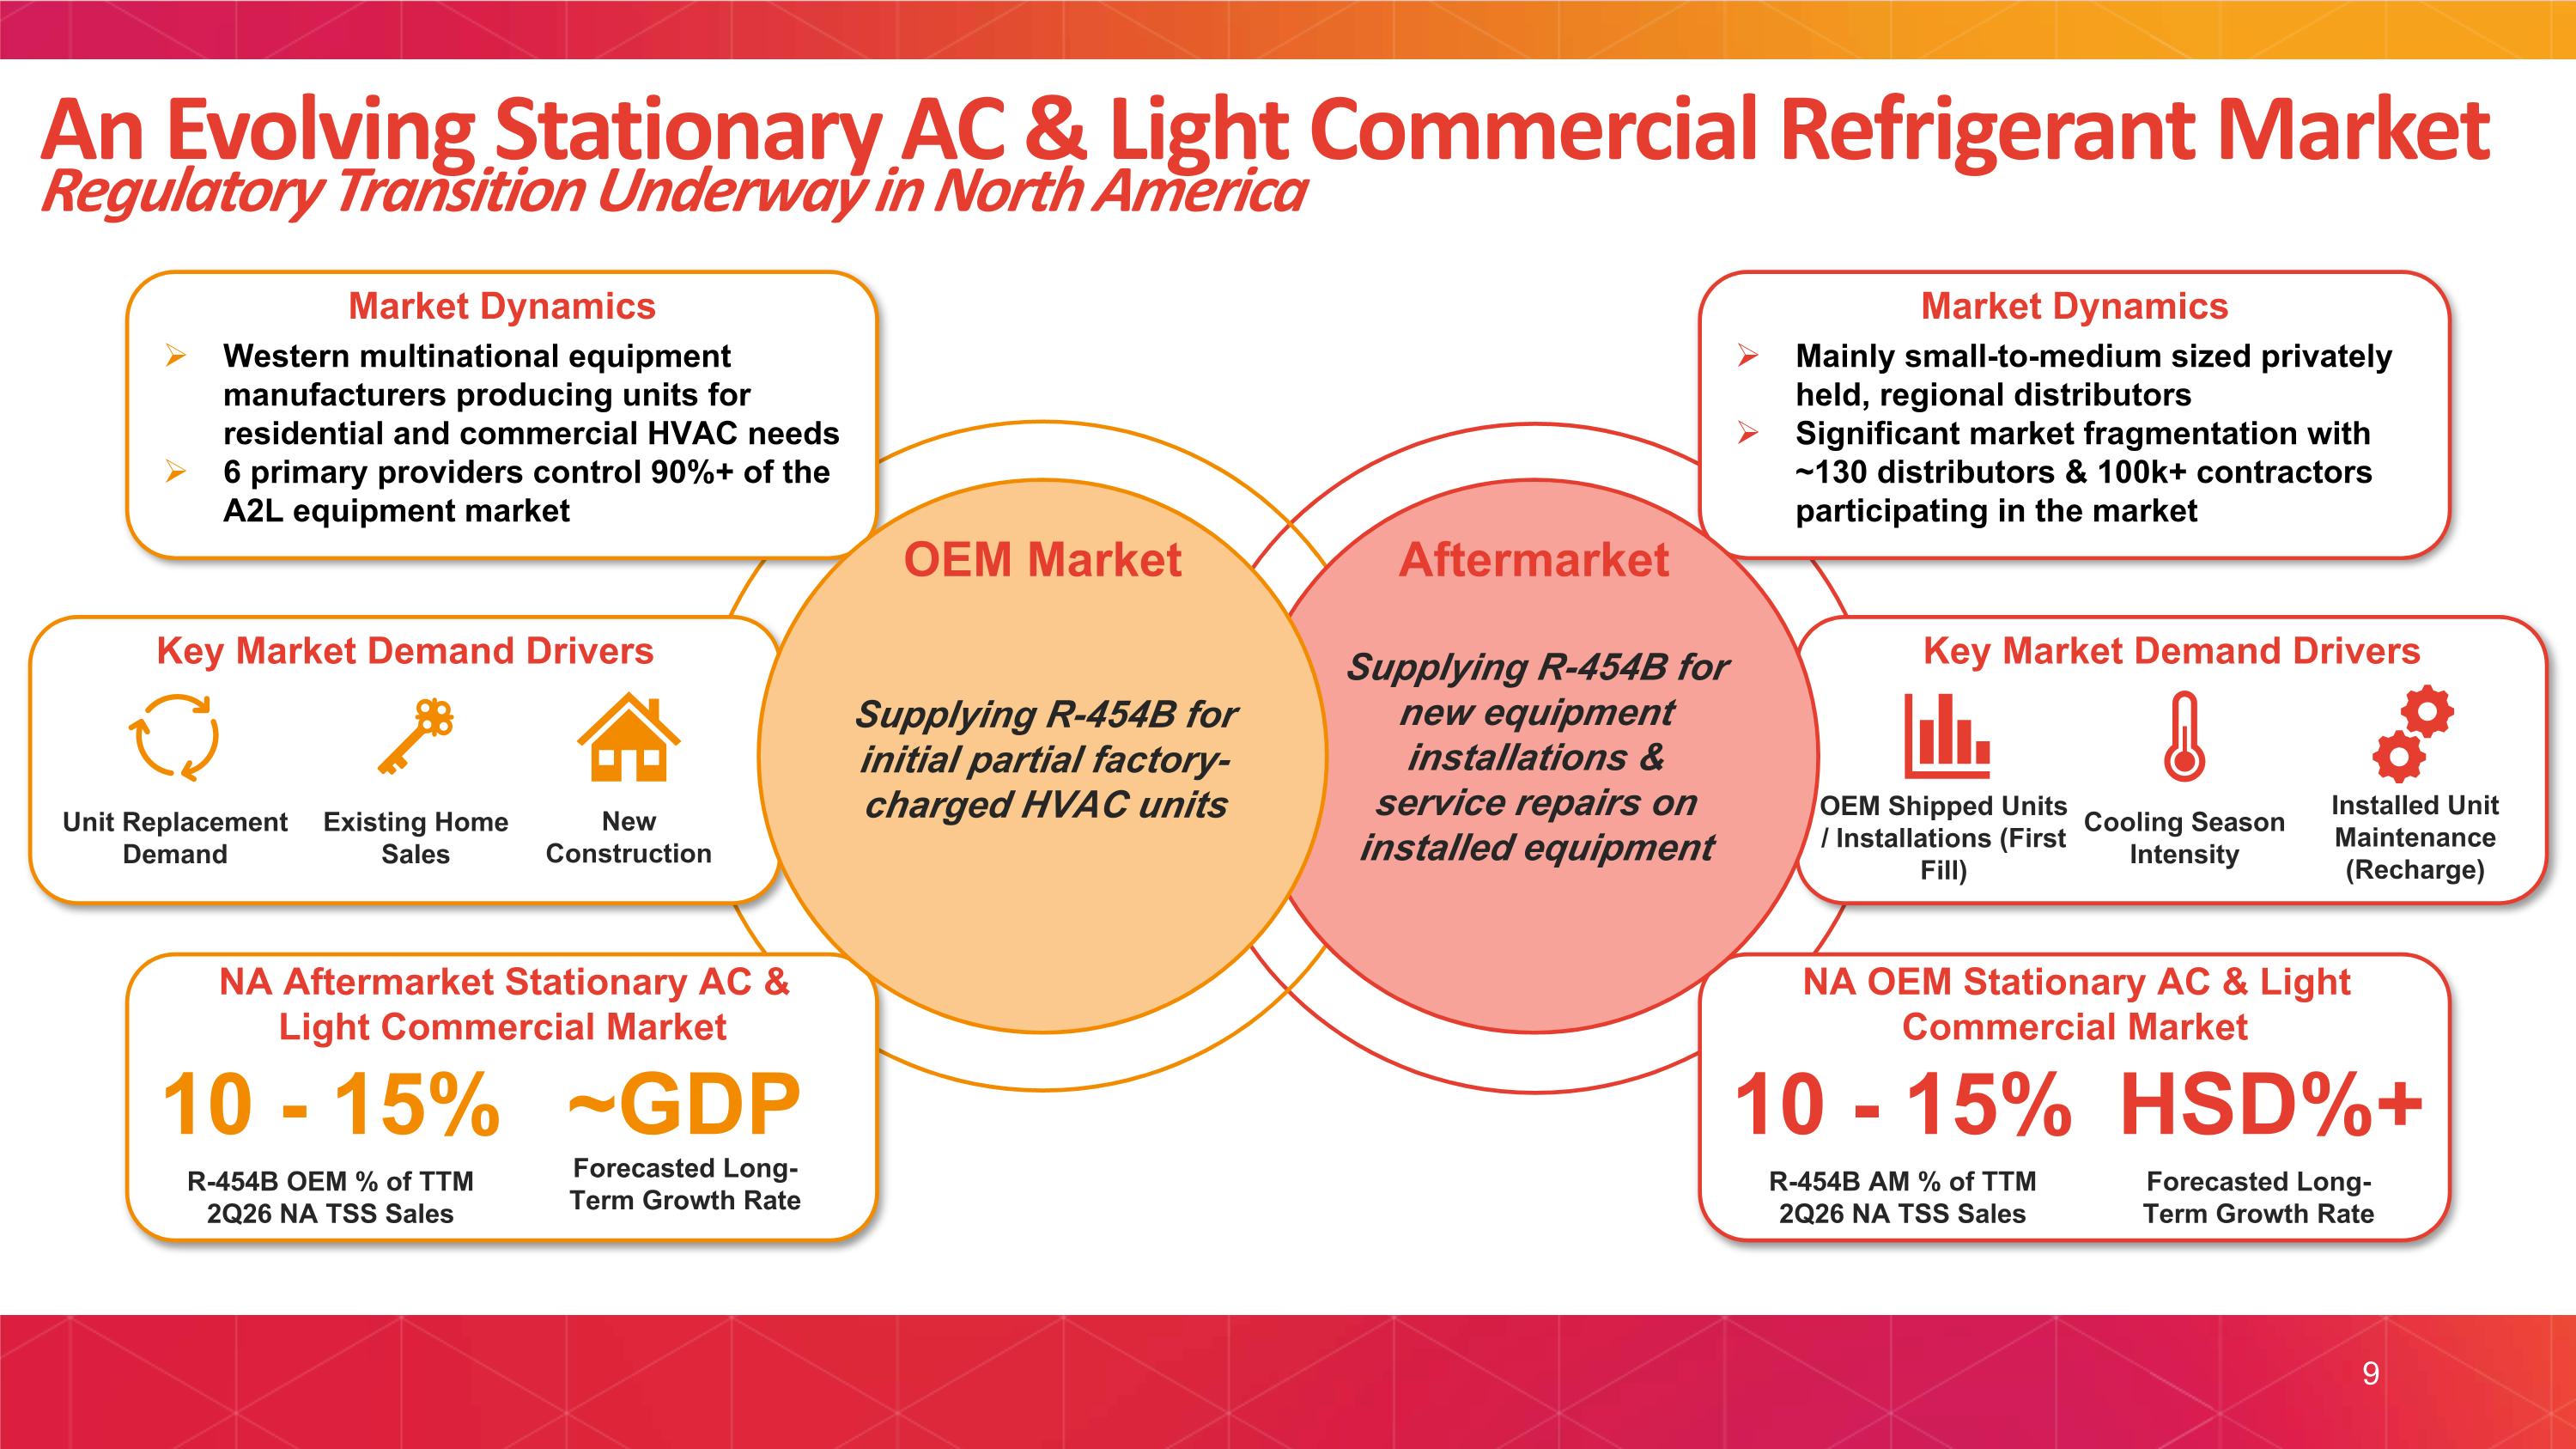
An Evolving Stationary AC & Light Commercial Refrigerant Market Regulatory Transition Underway in North America 9 Aftermarket Supplying R-454B for new equipment installations & service repairs on installed equipment Market Dynamics Key Market Demand Drivers Key Market Demand Drivers New Construction Existing Home Sales Unit Replacement Demand Installed Unit Maintenance (Recharge) Cooling Season Intensity OEM Shipped Units / Installations (First Fill) Forecasted Long-Term Growth Rate R-454B OEM % of TTM 2Q26 NA TSS Sales Forecasted Long-Term Growth Rate 10 - 15% R-454B AM % of TTM 2Q26 NA TSS Sales 10 - 15% ~GDP HSD%+ Market Dynamics Western multinational equipment manufacturers producing units for residential and commercial HVAC needs 6 primary providers control 90%+ of the A2L equipment market Mainly small-to-medium sized privately held, regional distributors Significant market fragmentation with ~130 distributors & 100k+ contractors participating in the market OEM Market Supplying R-454B for initial partial factory-charged HVAC units NA OEM Stationary AC & Light Commercial Market NA Aftermarket Stationary AC & Light Commercial Market
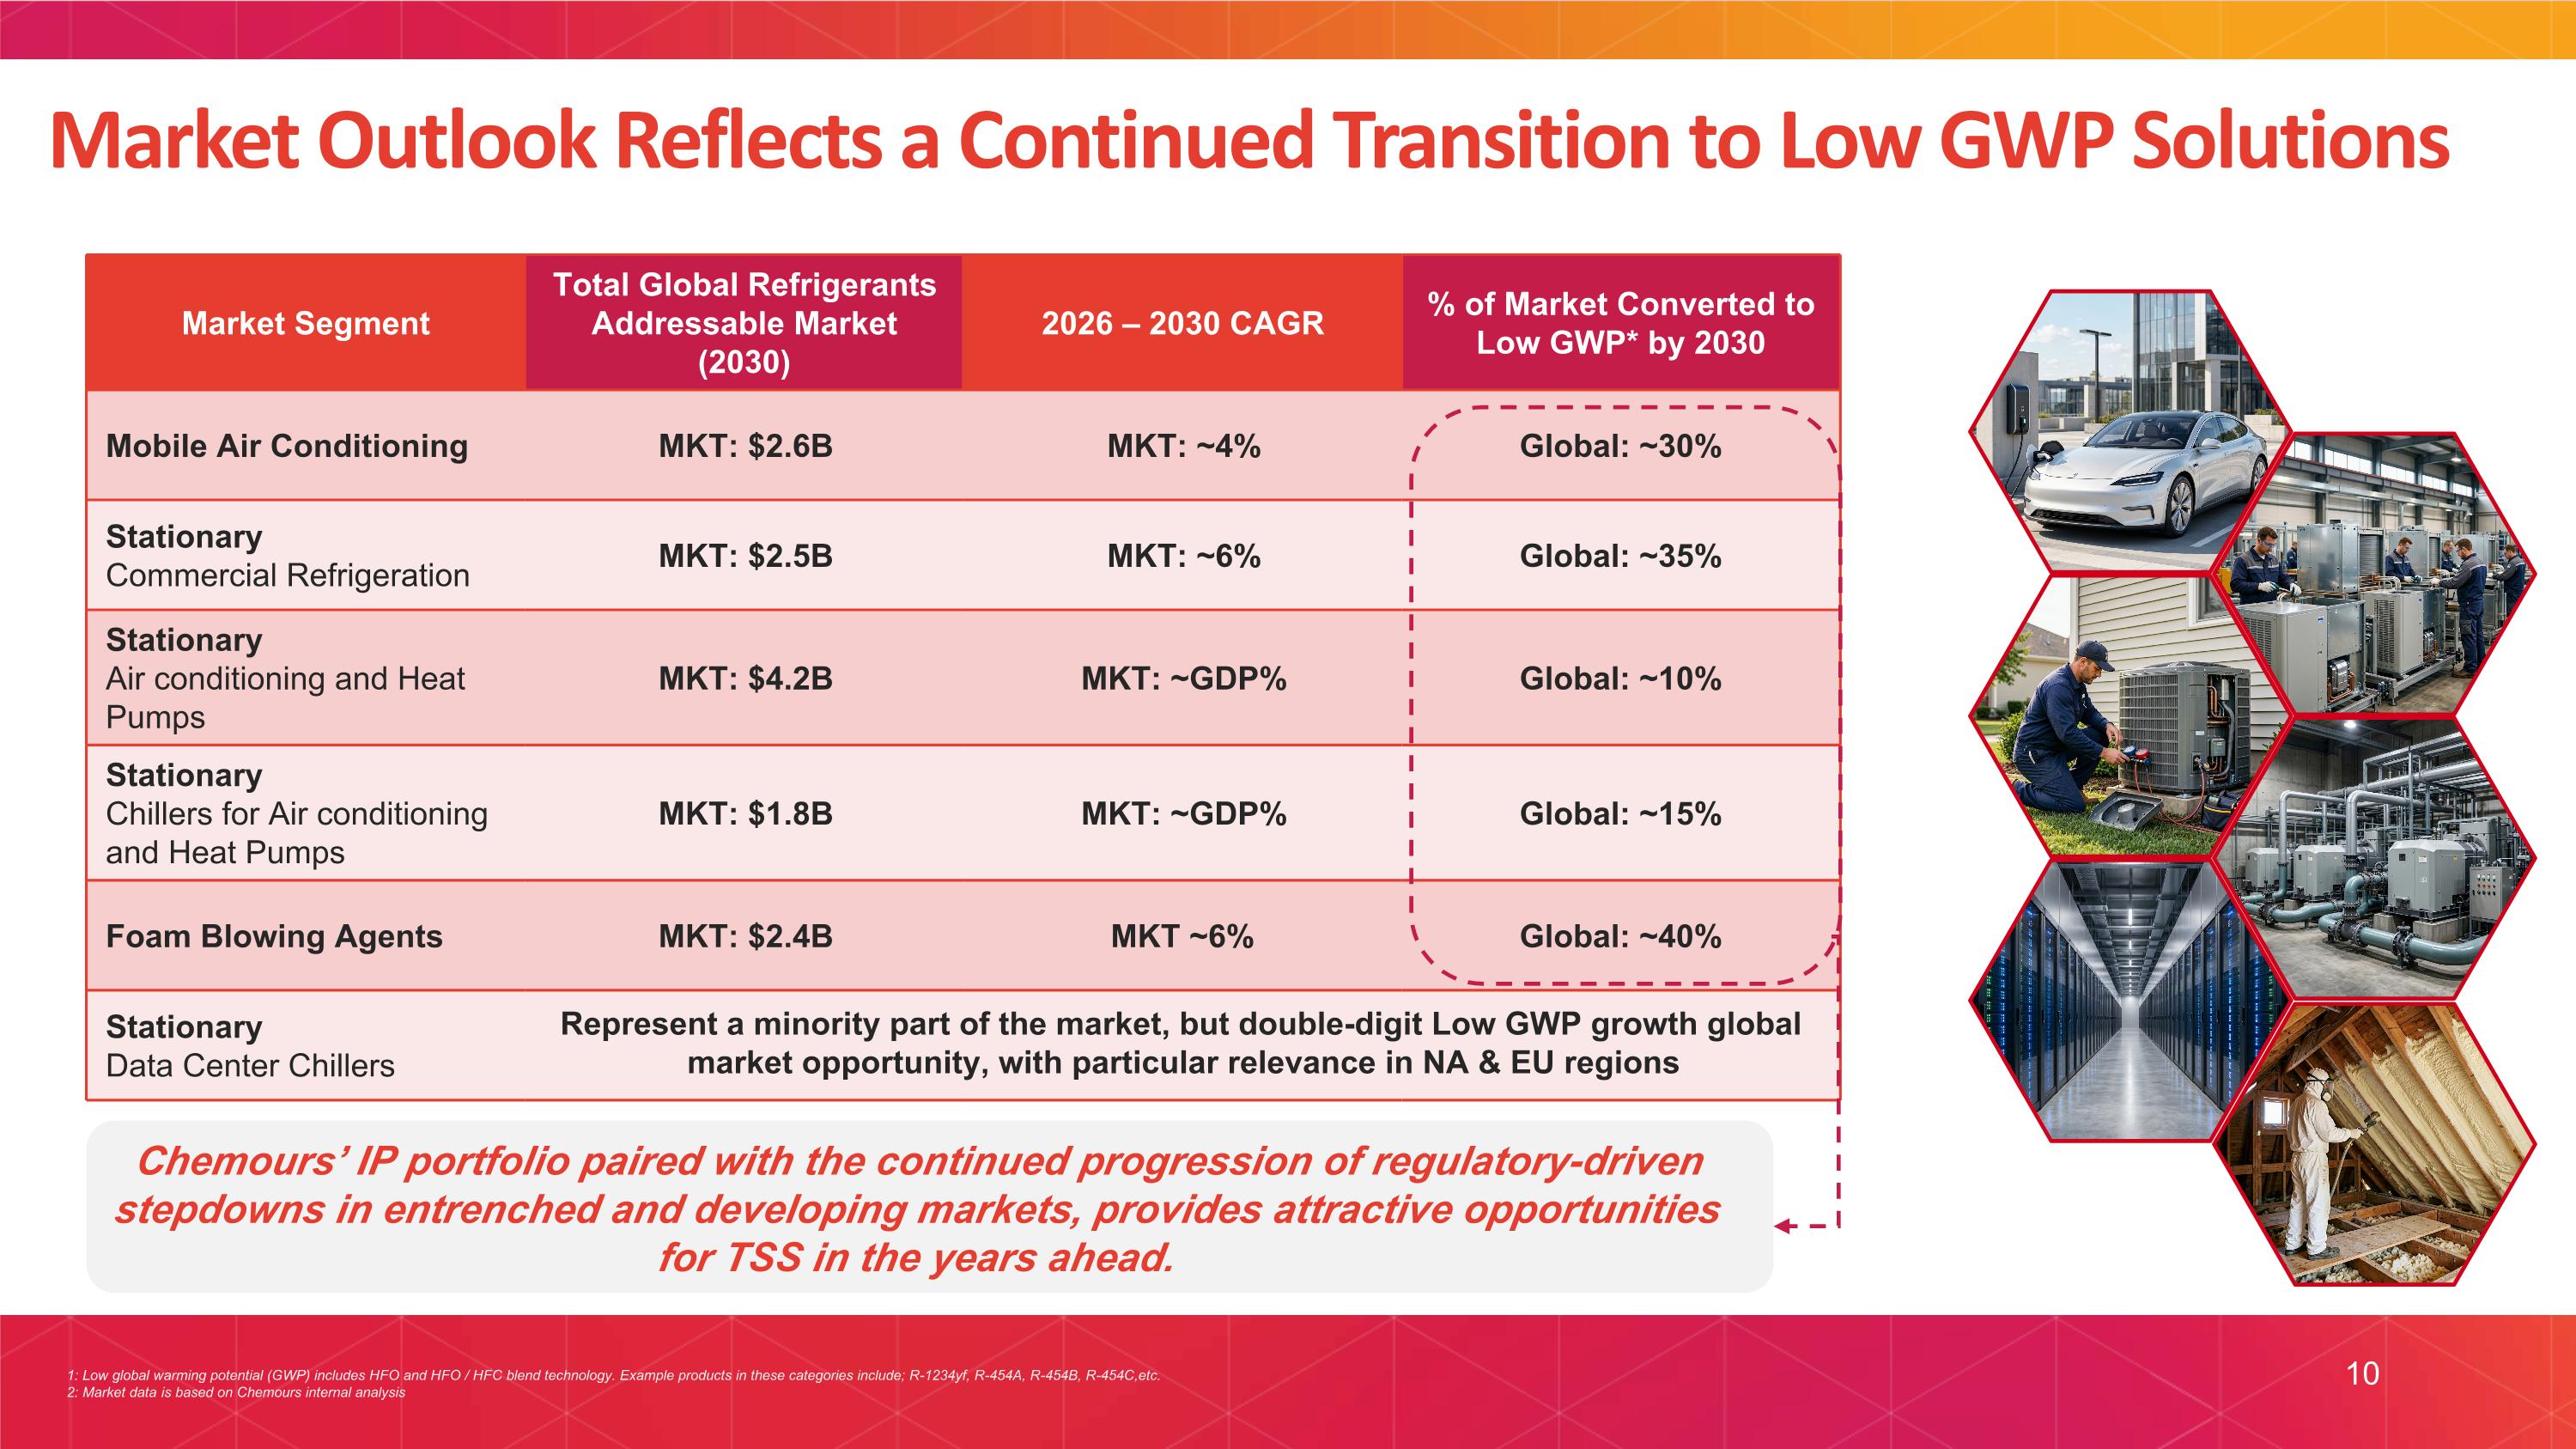
Market Segment Total Global Refrigerants Addressable Market (2030) 2026 – 2030 CAGR % of Market Converted to Low GWP* by 2030 Mobile Air Conditioning MKT: $2.6B MKT: ~4% Global: ~30% Stationary Commercial Refrigeration MKT: $2.5B MKT: ~6% Global: ~35% Stationary Air conditioning and Heat Pumps MKT: $4.2B MKT: ~GDP% Global: ~10% Stationary Chillers for Air conditioning and Heat Pumps MKT: $1.8B MKT: ~GDP% Global: ~15% Foam Blowing Agents MKT: $2.4B MKT ~6% Global: ~40% Stationary Data Center Chillers 1: Low global warming potential (GWP) includes HFO and HFO / HFC blend technology. Example products in these categories include; R-1234yf, R-454A, R-454B, R-454C,etc. 2: Market data is based on Chemours internal analysis Market Outlook Reflects a Continued Transition to Low GWP Solutions Represent a minority part of the market, but double-digit Low GWP growth global market opportunity, with particular relevance in NA & EU regions Chemours’ IP portfolio paired with the continued progression of regulatory-driven stepdowns in entrenched and developing markets, provides attractive opportunities for TSS in the years ahead. 10
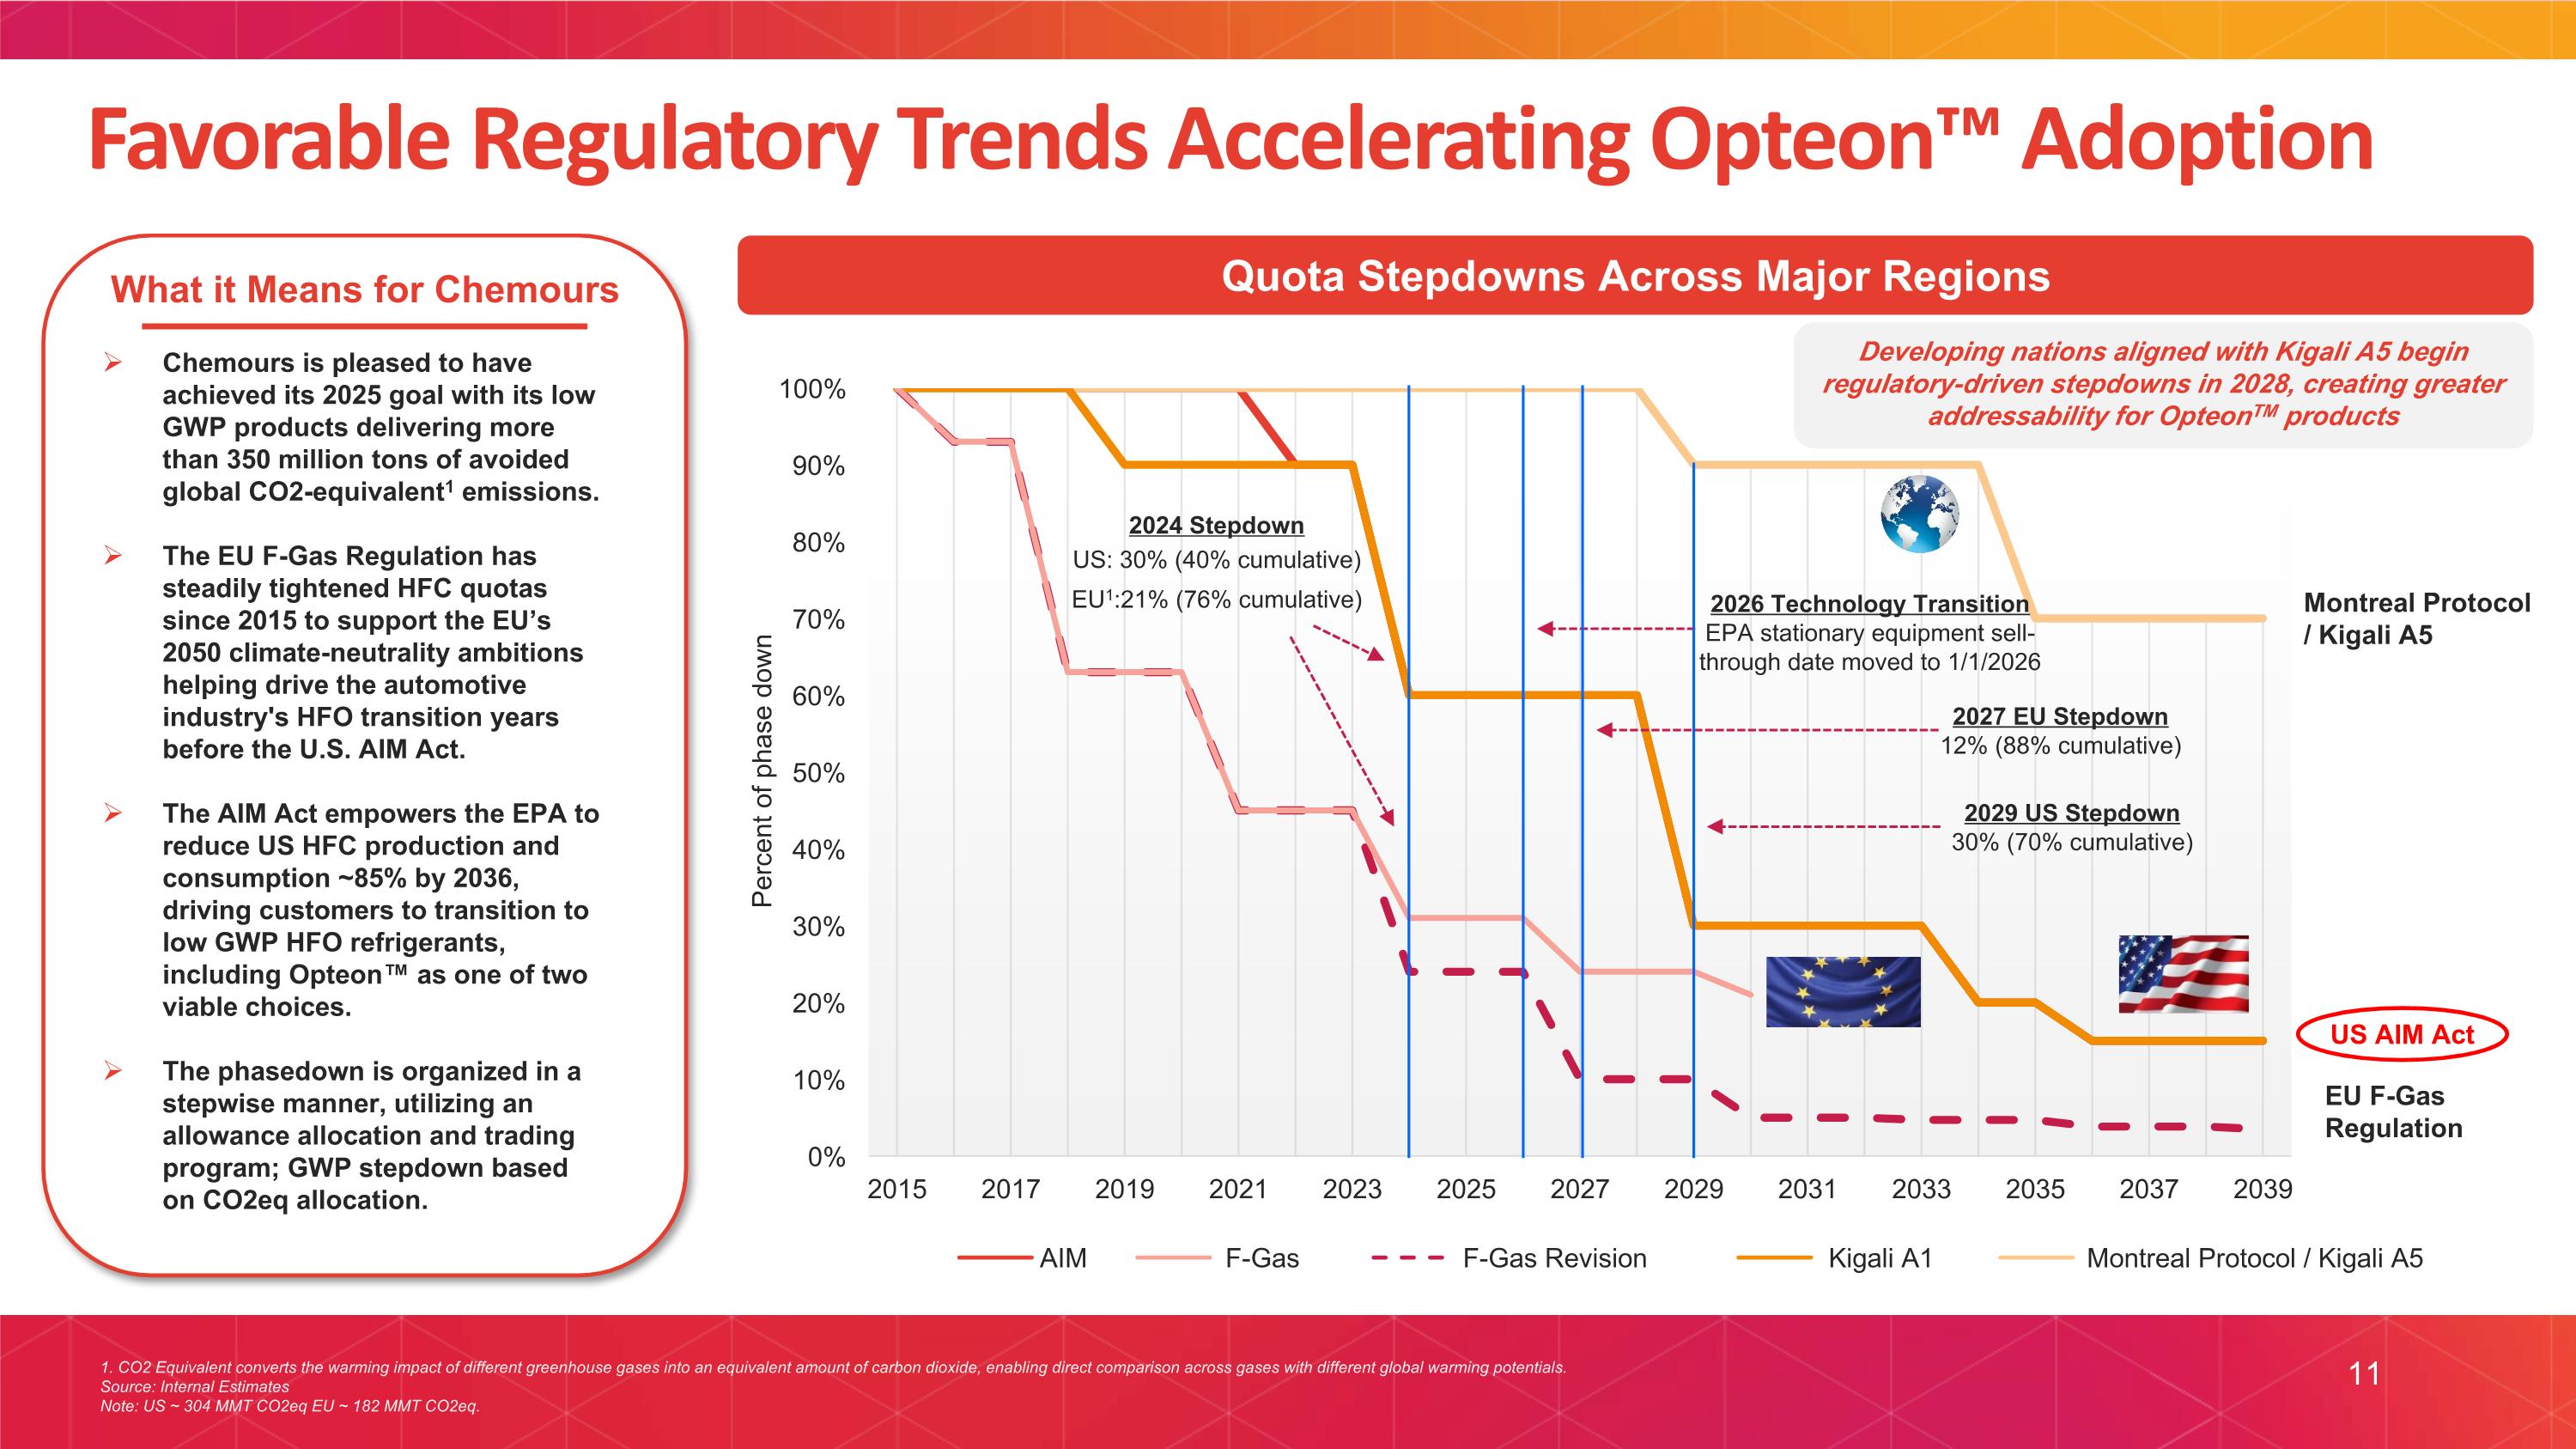
1. CO2 Equivalent converts the warming impact of different greenhouse gases into an equivalent amount of carbon dioxide, enabling direct comparison across gases with different global warming potentials. Source: Internal Estimates Note: US ~ 304 MMT CO2eq EU ~ 182 MMT CO2eq. AIM F-Gas Revision F-Gas Kigali A1 Montreal Protocol / Kigali A5 Montreal Protocol / Kigali A5 US AIM Act EU F-Gas Regulation 2024 Stepdown US: 30% (40% cumulative) EU1:21% (76% cumulative) 2026 Technology Transition EPA stationary equipment sell-through date moved to 1/1/2026 11 2027 EU Stepdown 12% (88% cumulative) 2029 US Stepdown 30% (70% cumulative) Favorable Regulatory Trends Accelerating Opteon™ Adoption What it Means for Chemours Chemours is pleased to have achieved its 2025 goal with its low GWP products delivering more than 350 million tons of avoided global CO2-equivalent1 emissions. The EU F-Gas Regulation has steadily tightened HFC quotas since 2015 to support the EU’s 2050 climate-neutrality ambitions helping drive the automotive industry's HFO transition years before the U.S. AIM Act. The AIM Act empowers the EPA to reduce US HFC production and consumption ~85% by 2036, driving customers to transition to low GWP HFO refrigerants, including Opteon™ as one of two viable choices. The phasedown is organized in a stepwise manner, utilizing an allowance allocation and trading program; GWP stepdown based on CO2eq allocation. Quota Stepdowns Across Major Regions Developing nations aligned with Kigali A5 begin regulatory-driven stepdowns in 2028, creating greater addressability for OpteonTM products
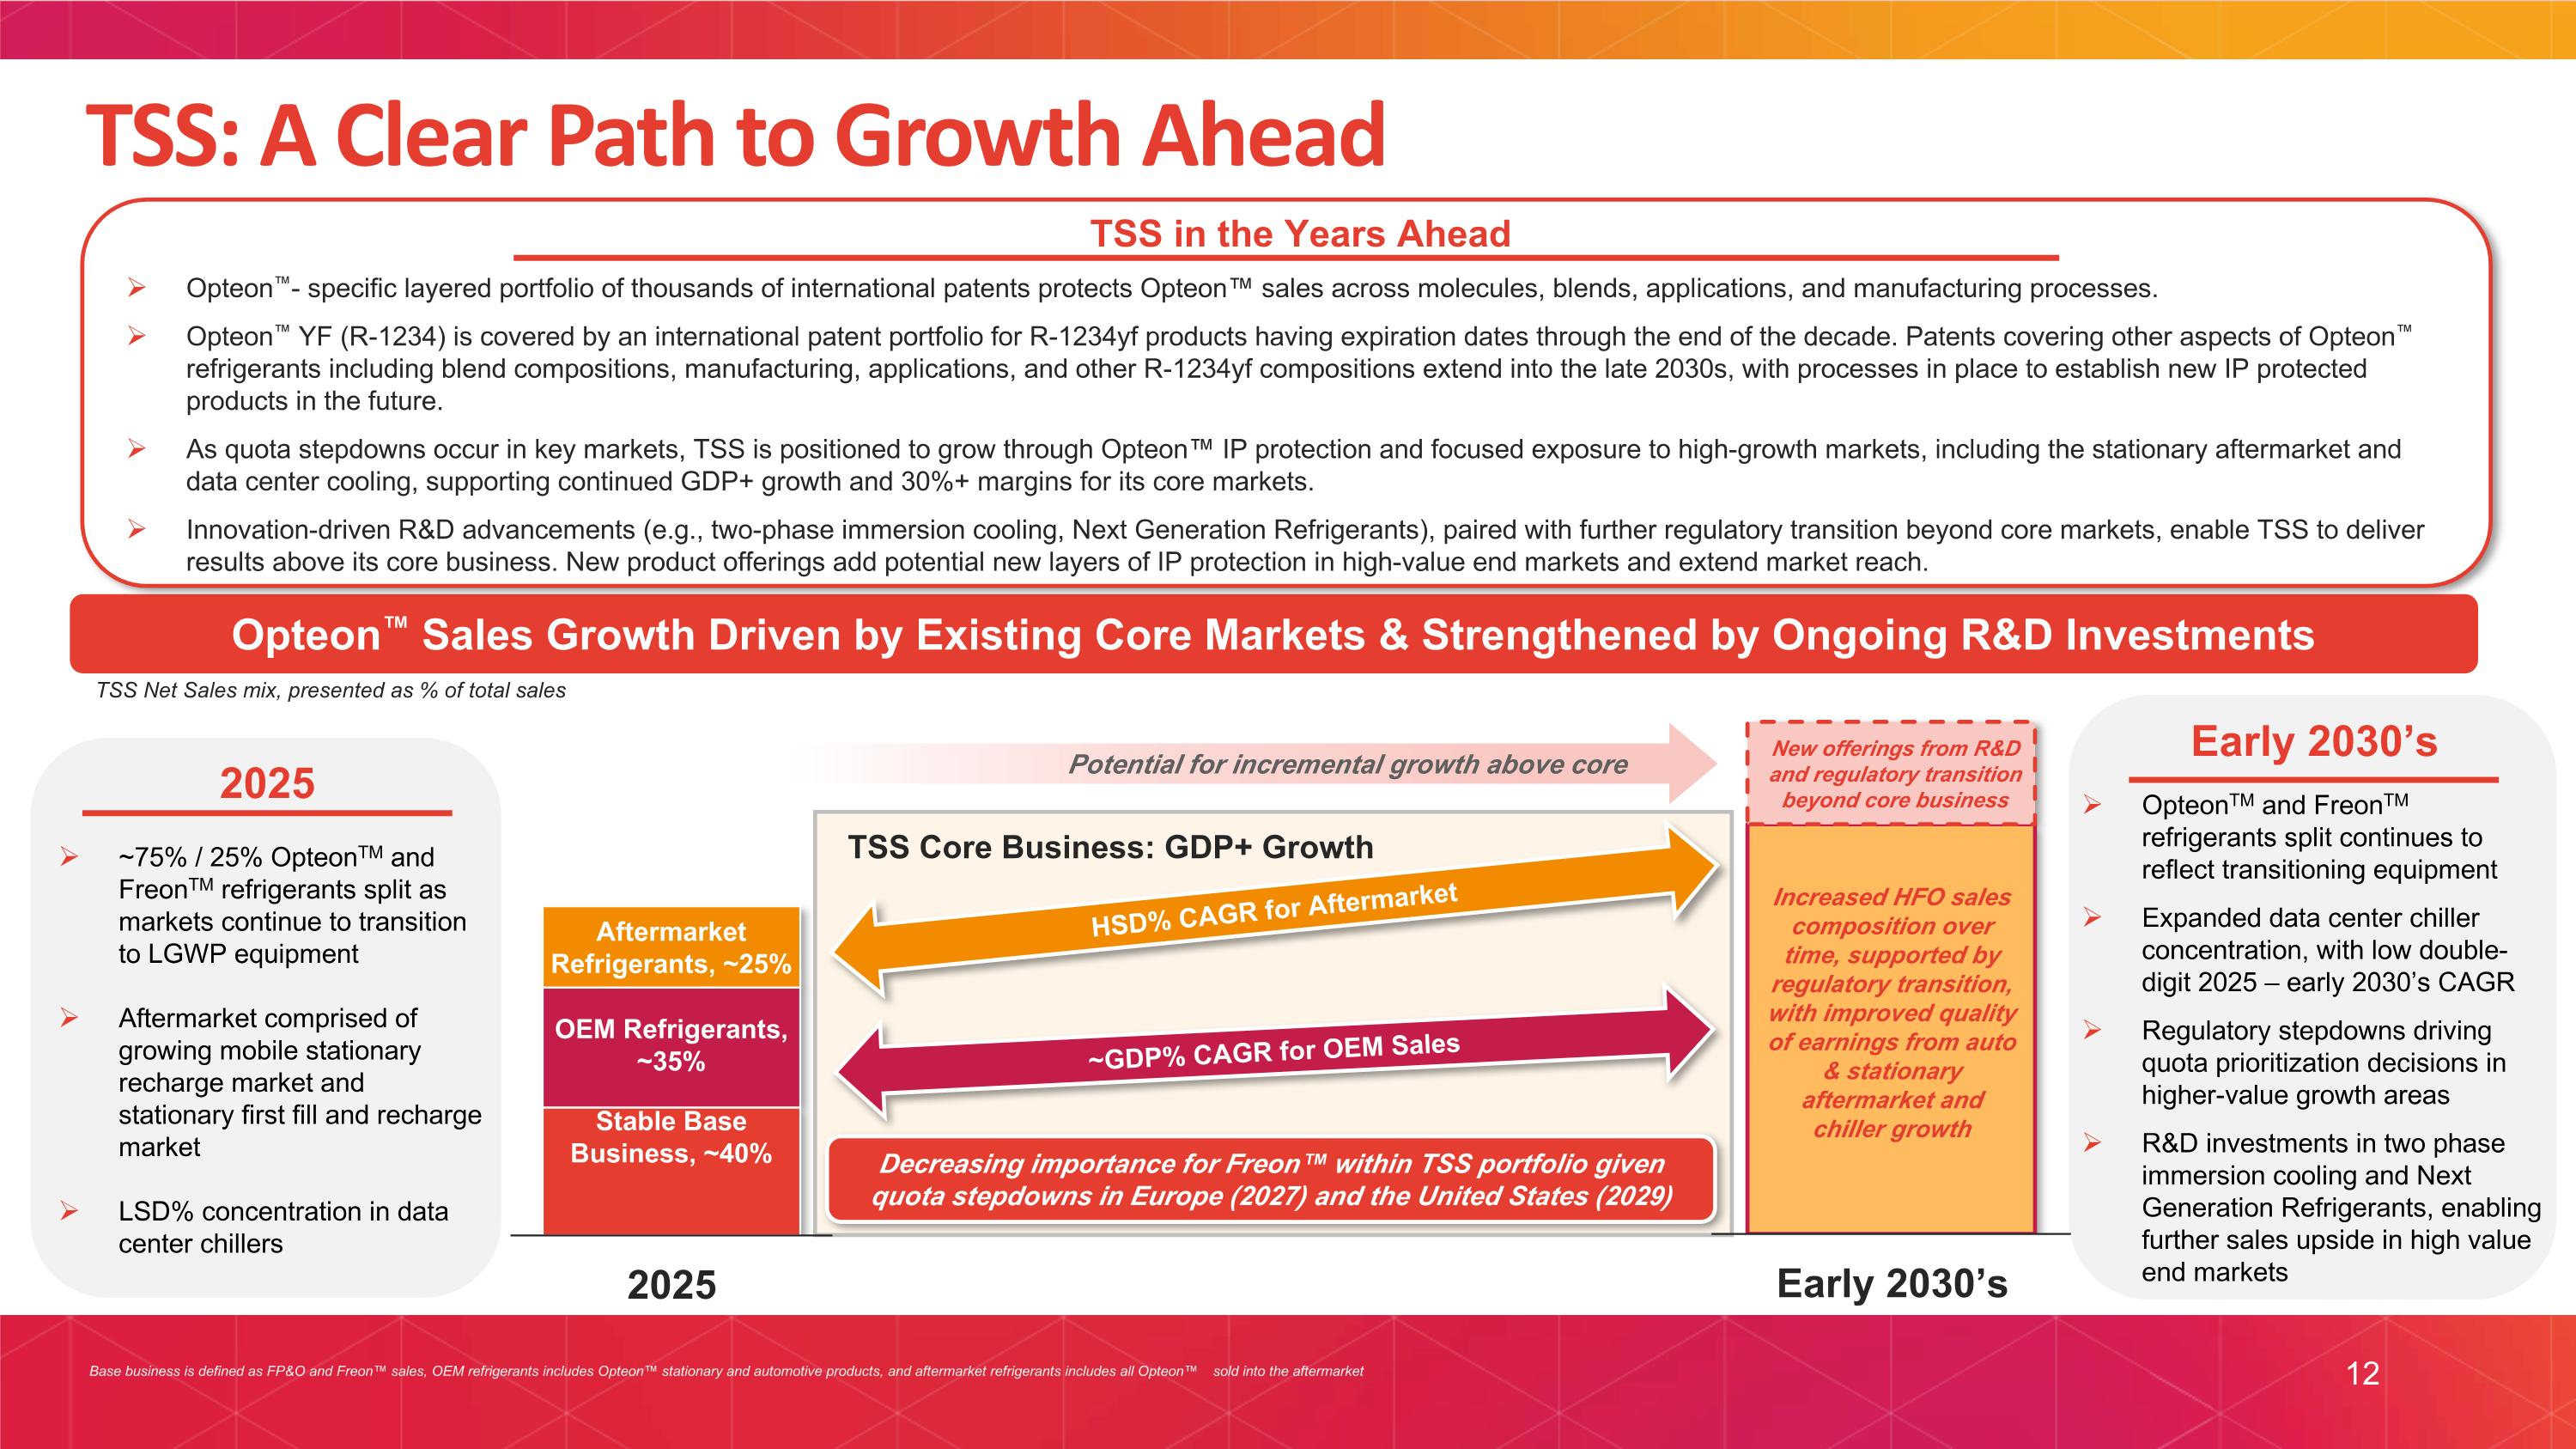
12 TSS: A Clear Path to Growth Ahead Opteon™ Sales Growth Driven by Existing Core Markets & Strengthened by Ongoing R&D Investments Opteon™- specific layered portfolio of thousands of international patents protects Opteon™ sales across molecules, blends, applications, and manufacturing processes. Opteon™ YF (R-1234) is covered by an international patent portfolio for R-1234yf products having expiration dates through the end of the decade. Patents covering other aspects of Opteon™ refrigerants including blend compositions, manufacturing, applications, and other R-1234yf compositions extend into the late 2030s, with processes in place to establish new IP protected products in the future. As quota stepdowns occur in key markets, TSS is positioned to grow through Opteon™ IP protection and focused exposure to high-growth markets, including the stationary aftermarket and data center cooling, supporting continued GDP+ growth and 30%+ margins for its core markets. Innovation-driven R&D advancements (e.g., two-phase immersion cooling, Next Generation Refrigerants), paired with further regulatory transition beyond core markets, enable TSS to deliver results above its core business. New product offerings add potential new layers of IP protection in high-value end markets and extend market reach. TSS in the Years Ahead Base business is defined as FP&O and Freon™ sales, OEM refrigerants includes Opteon™ stationary and automotive products, and aftermarket refrigerants includes all Opteon™ sold into the aftermarket TSS Net Sales mix, presented as % of total sales ~GDP% CAGR for OEM Sales Decreasing importance for Freon™ within TSS portfolio given quota stepdowns in Europe (2027) and the United States (2029) HSD% CAGR for Aftermarket ~75% / 25% OpteonTM and FreonTM refrigerants split as markets continue to transition to LGWP equipment Aftermarket comprised of growing mobile stationary recharge market and stationary first fill and recharge market LSD% concentration in data center chillers Early 2030’s 2025 OpteonTM and FreonTM refrigerants split continues to reflect transitioning equipment Expanded data center chiller concentration, with low double-digit 2025 – early 2030’s CAGR Regulatory stepdowns driving quota prioritization decisions in higher-value growth areas R&D investments in two phase immersion cooling and Next Generation Refrigerants, enabling further sales upside in high value end markets Increased HFO sales composition over time, supported by regulatory transition, with improved quality of earnings from auto & stationary aftermarket and chiller growth TSS Core Business: GDP+ Growth Potential for incremental growth above core New offerings from R&D and regulatory transition beyond core business
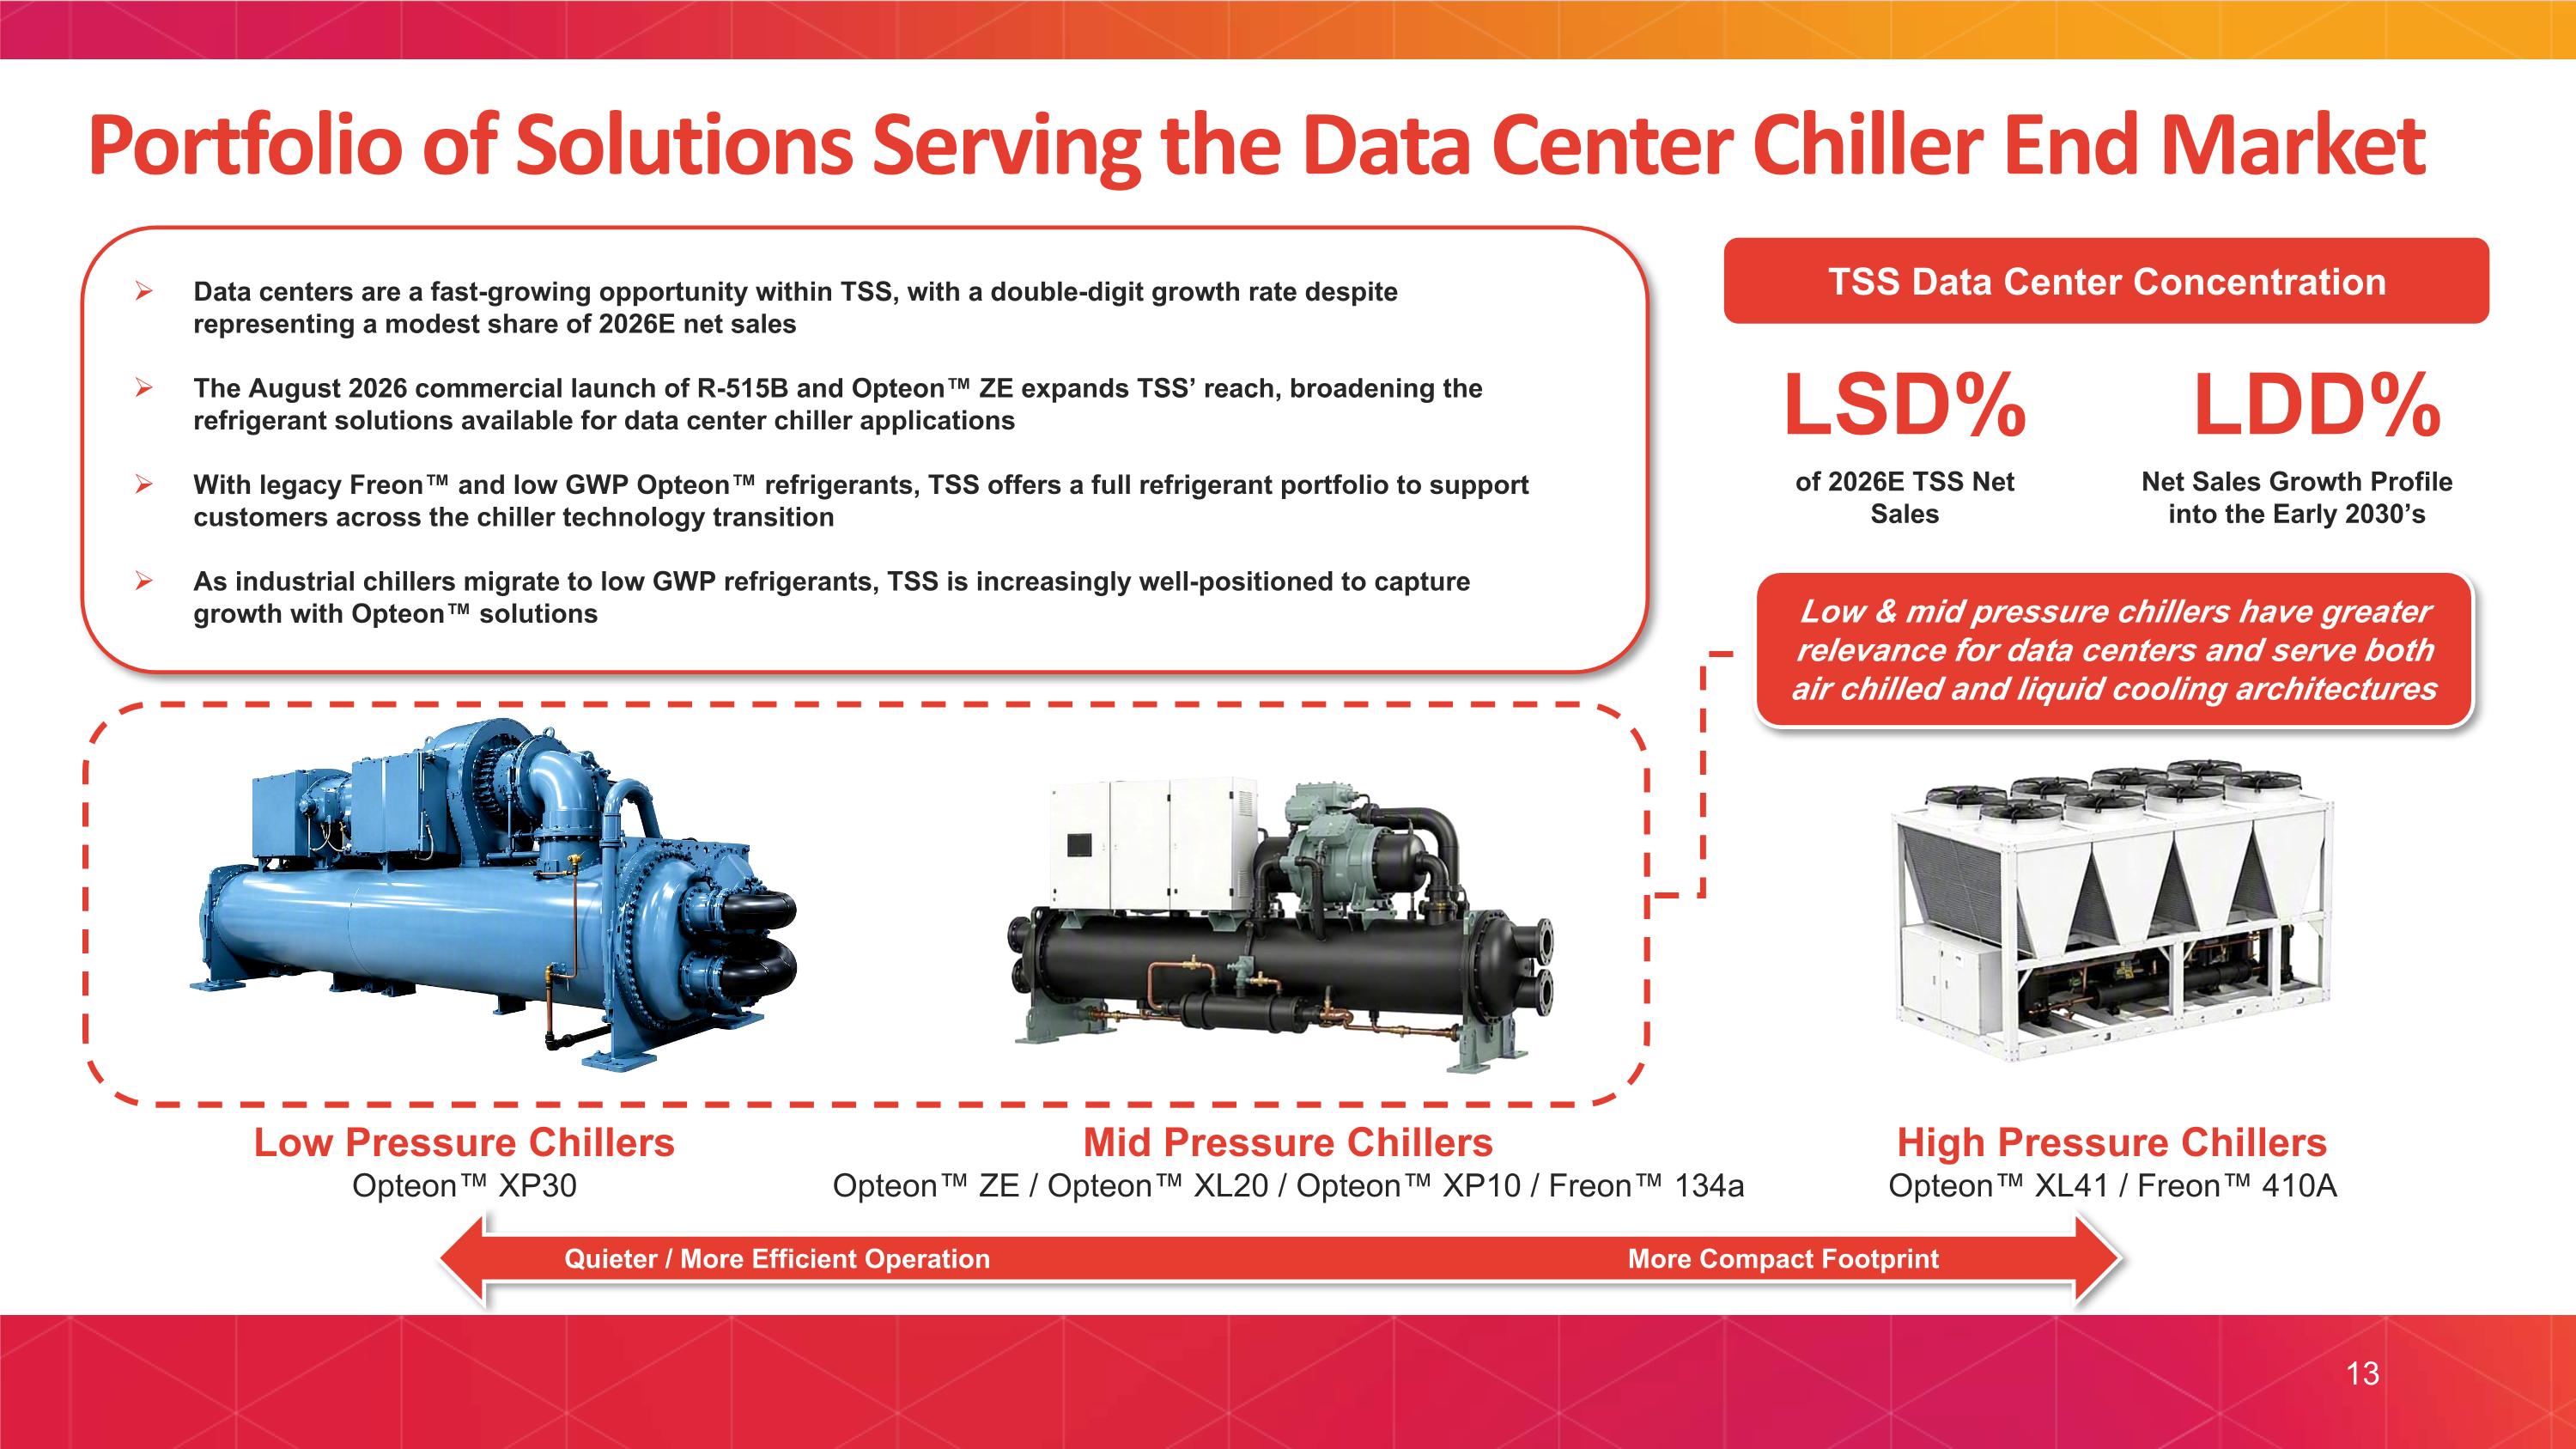
Portfolio of Solutions Serving the Data Center Chiller End Market 13 Low Pressure Chillers Opteon™ XP30 Mid Pressure Chillers Opteon™ ZE / Opteon™ XL20 / Opteon™ XP10 / Freon™ 134a High Pressure Chillers Opteon™ XL41 / Freon™ 410A Data centers are a fast-growing opportunity within TSS, with a double-digit growth rate despite representing a modest share of 2026E net sales The August 2026 commercial launch of R-515B and Opteon™ ZE expands TSS’ reach, broadening the refrigerant solutions available for data center chiller applications With legacy Freon™ and low GWP Opteon™ refrigerants, TSS offers a full refrigerant portfolio to support customers across the chiller technology transition As industrial chillers migrate to low GWP refrigerants, TSS is increasingly well-positioned to capture growth with Opteon™ solutions of 2026E TSS Net Sales LSD% Net Sales Growth Profile into the Early 2030’s LDD% TSS Data Center Concentration ` Low & mid pressure chillers have greater relevance for data centers and serve both air chilled and liquid cooling architectures Quieter / More Efficient Operation More Compact Footprint
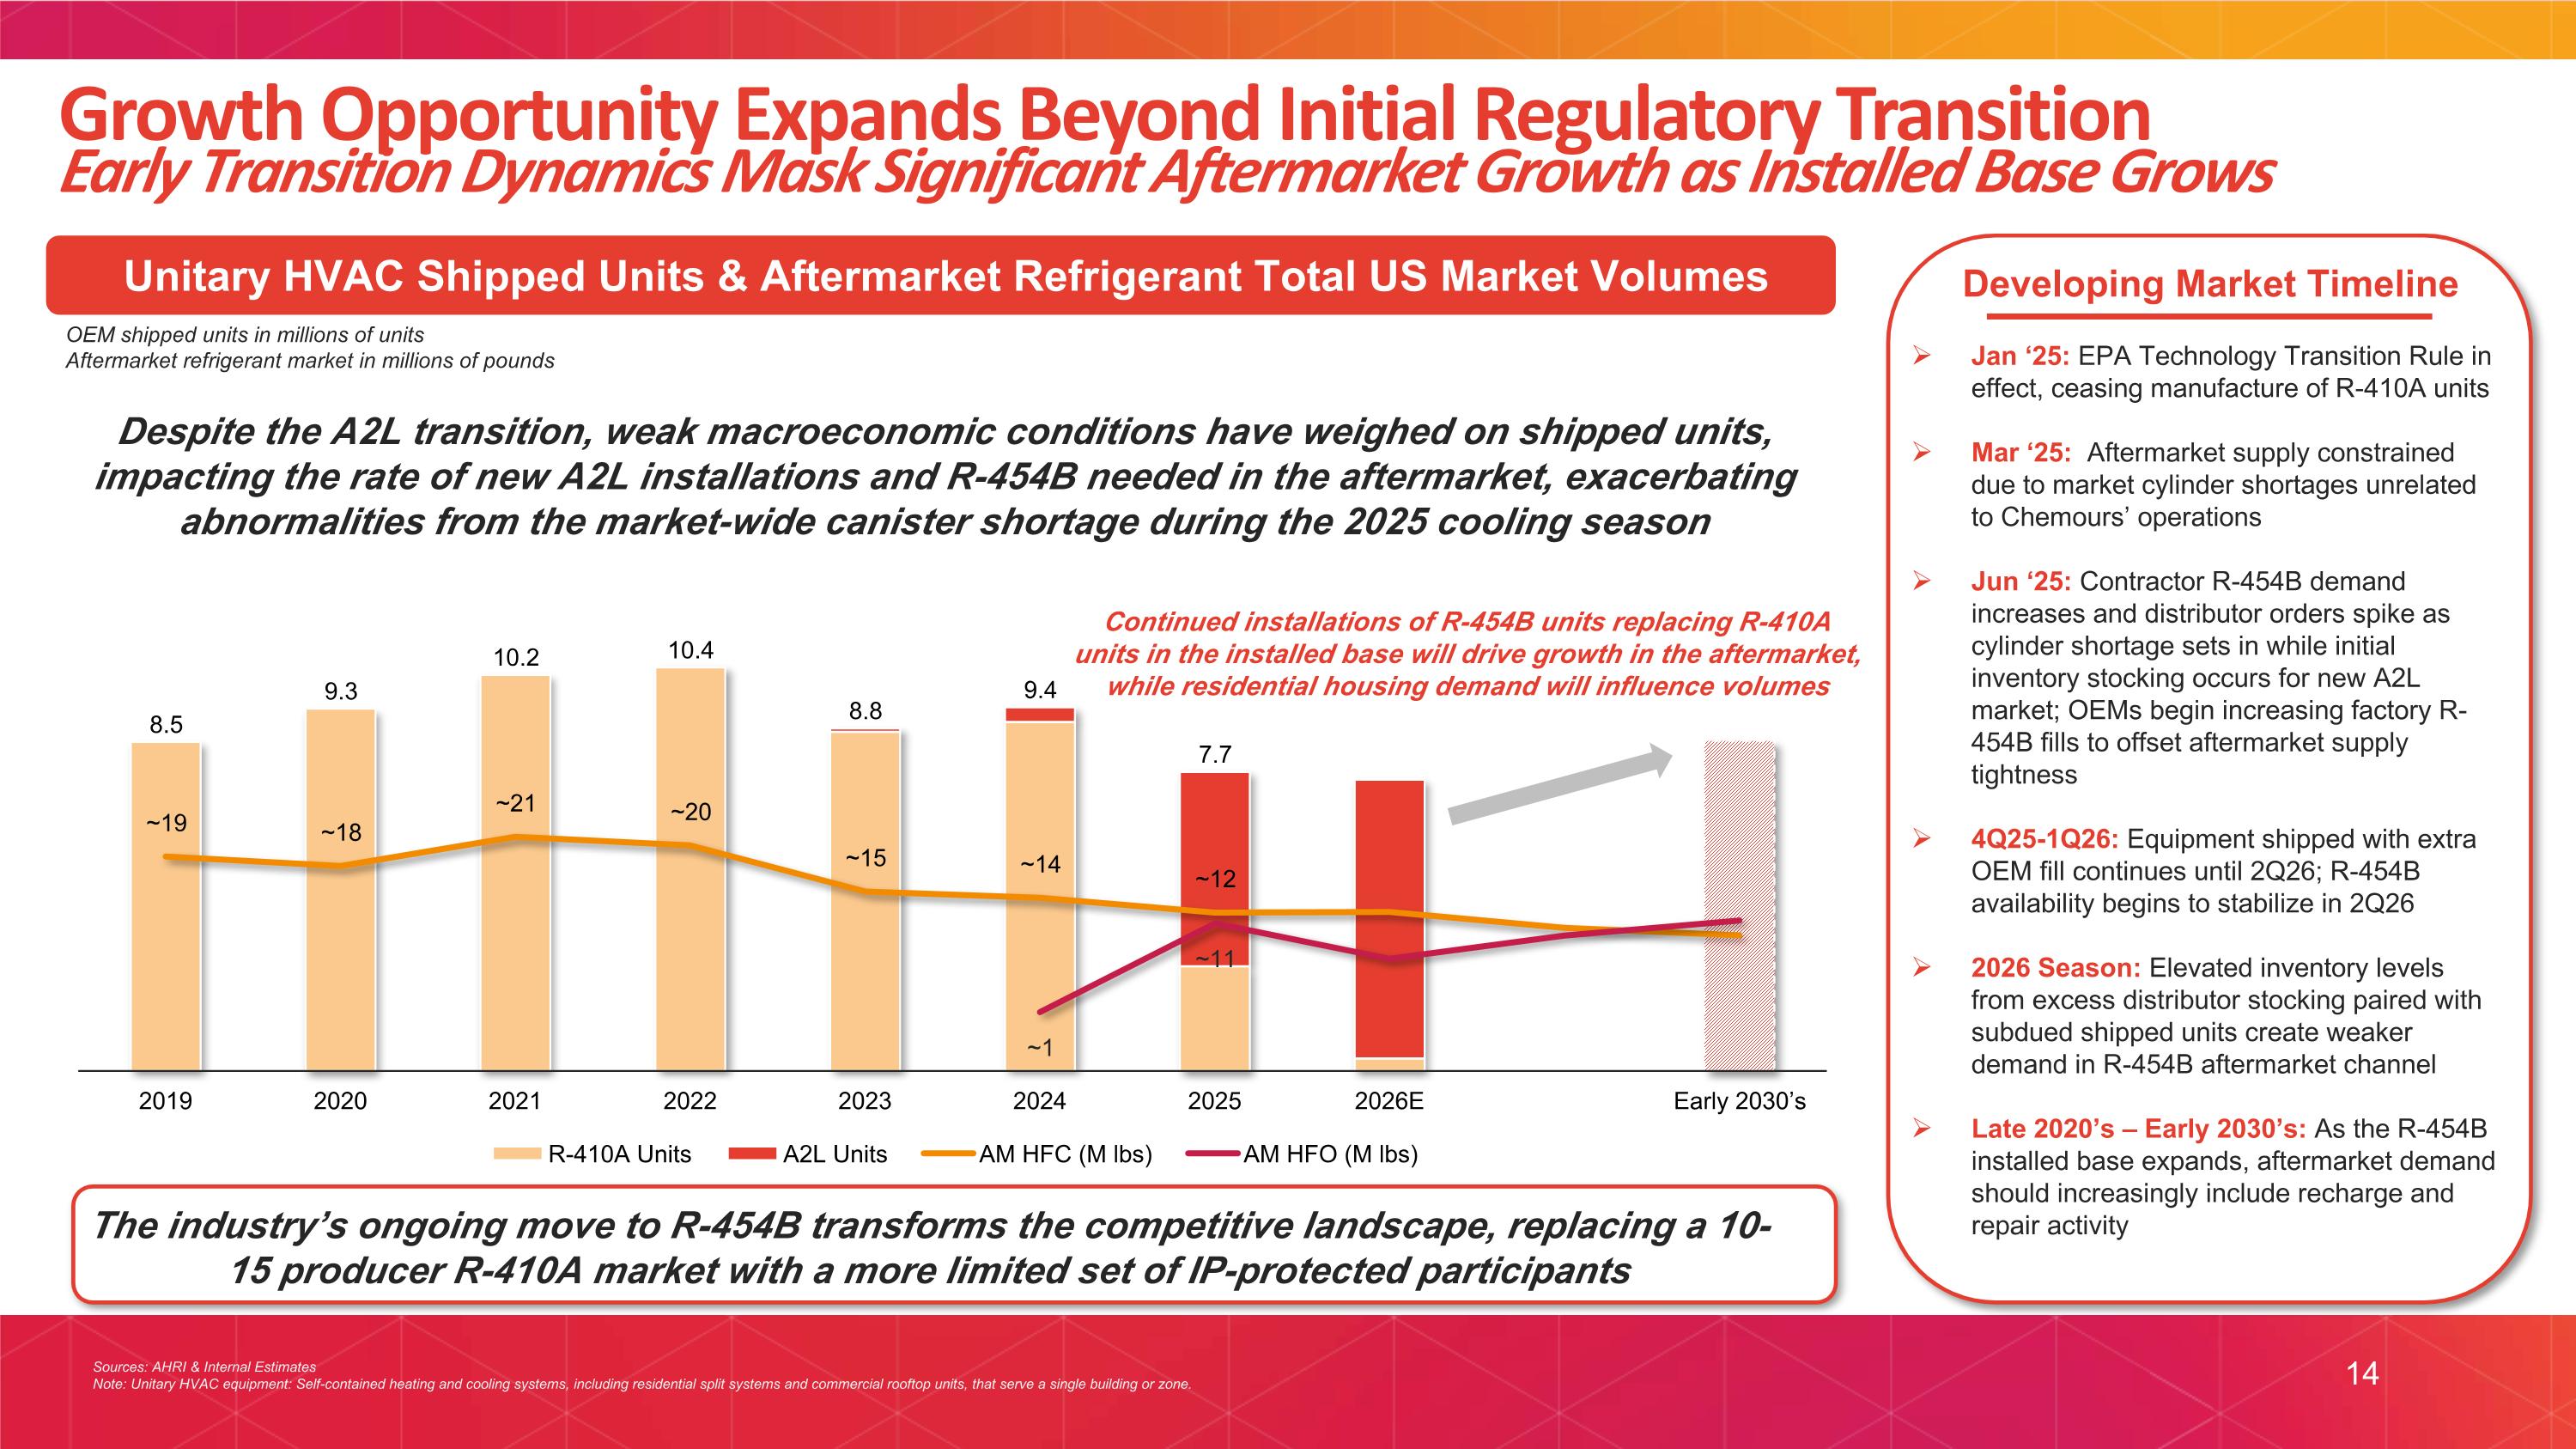
14 Growth Opportunity Expands Beyond Initial Regulatory Transition Early Transition Dynamics Mask Significant Aftermarket Growth as Installed Base Grows Developing Market Timeline Unitary HVAC Shipped Units & Aftermarket Refrigerant Total US Market Volumes OEM shipped units in millions of units Aftermarket refrigerant market in millions of pounds Sources: AHRI & Internal Estimates Note: Unitary HVAC equipment: Self-contained heating and cooling systems, including residential split systems and commercial rooftop units, that serve a single building or zone. Jan ‘25: EPA Technology Transition Rule in effect, ceasing manufacture of R-410A units Mar ‘25: Aftermarket supply constrained due to market cylinder shortages unrelated to Chemours’ operations Jun ‘25: Contractor R-454B demand increases and distributor orders spike as cylinder shortage sets in while initial inventory stocking occurs for new A2L market; OEMs begin increasing factory R-454B fills to offset aftermarket supply tightness 4Q25-1Q26: Equipment shipped with extra OEM fill continues until 2Q26; R-454B availability begins to stabilize in 2Q26 2026 Season: Elevated inventory levels from excess distributor stocking paired with subdued shipped units create weaker demand in R-454B aftermarket channel Late 2020’s – Early 2030’s: As the R-454B installed base expands, aftermarket demand should increasingly include recharge and repair activity Despite the A2L transition, weak macroeconomic conditions have weighed on shipped units, impacting the rate of new A2L installations and R-454B needed in the aftermarket, exacerbating abnormalities from the market-wide canister shortage during the 2025 cooling season The industry’s ongoing move to R-454B transforms the competitive landscape, replacing a 10-15 producer R-410A market with a more limited set of IP-protected participants Continued installations of R-454B units replacing R-410A units in the installed base will drive growth in the aftermarket, while residential housing demand will influence volumes
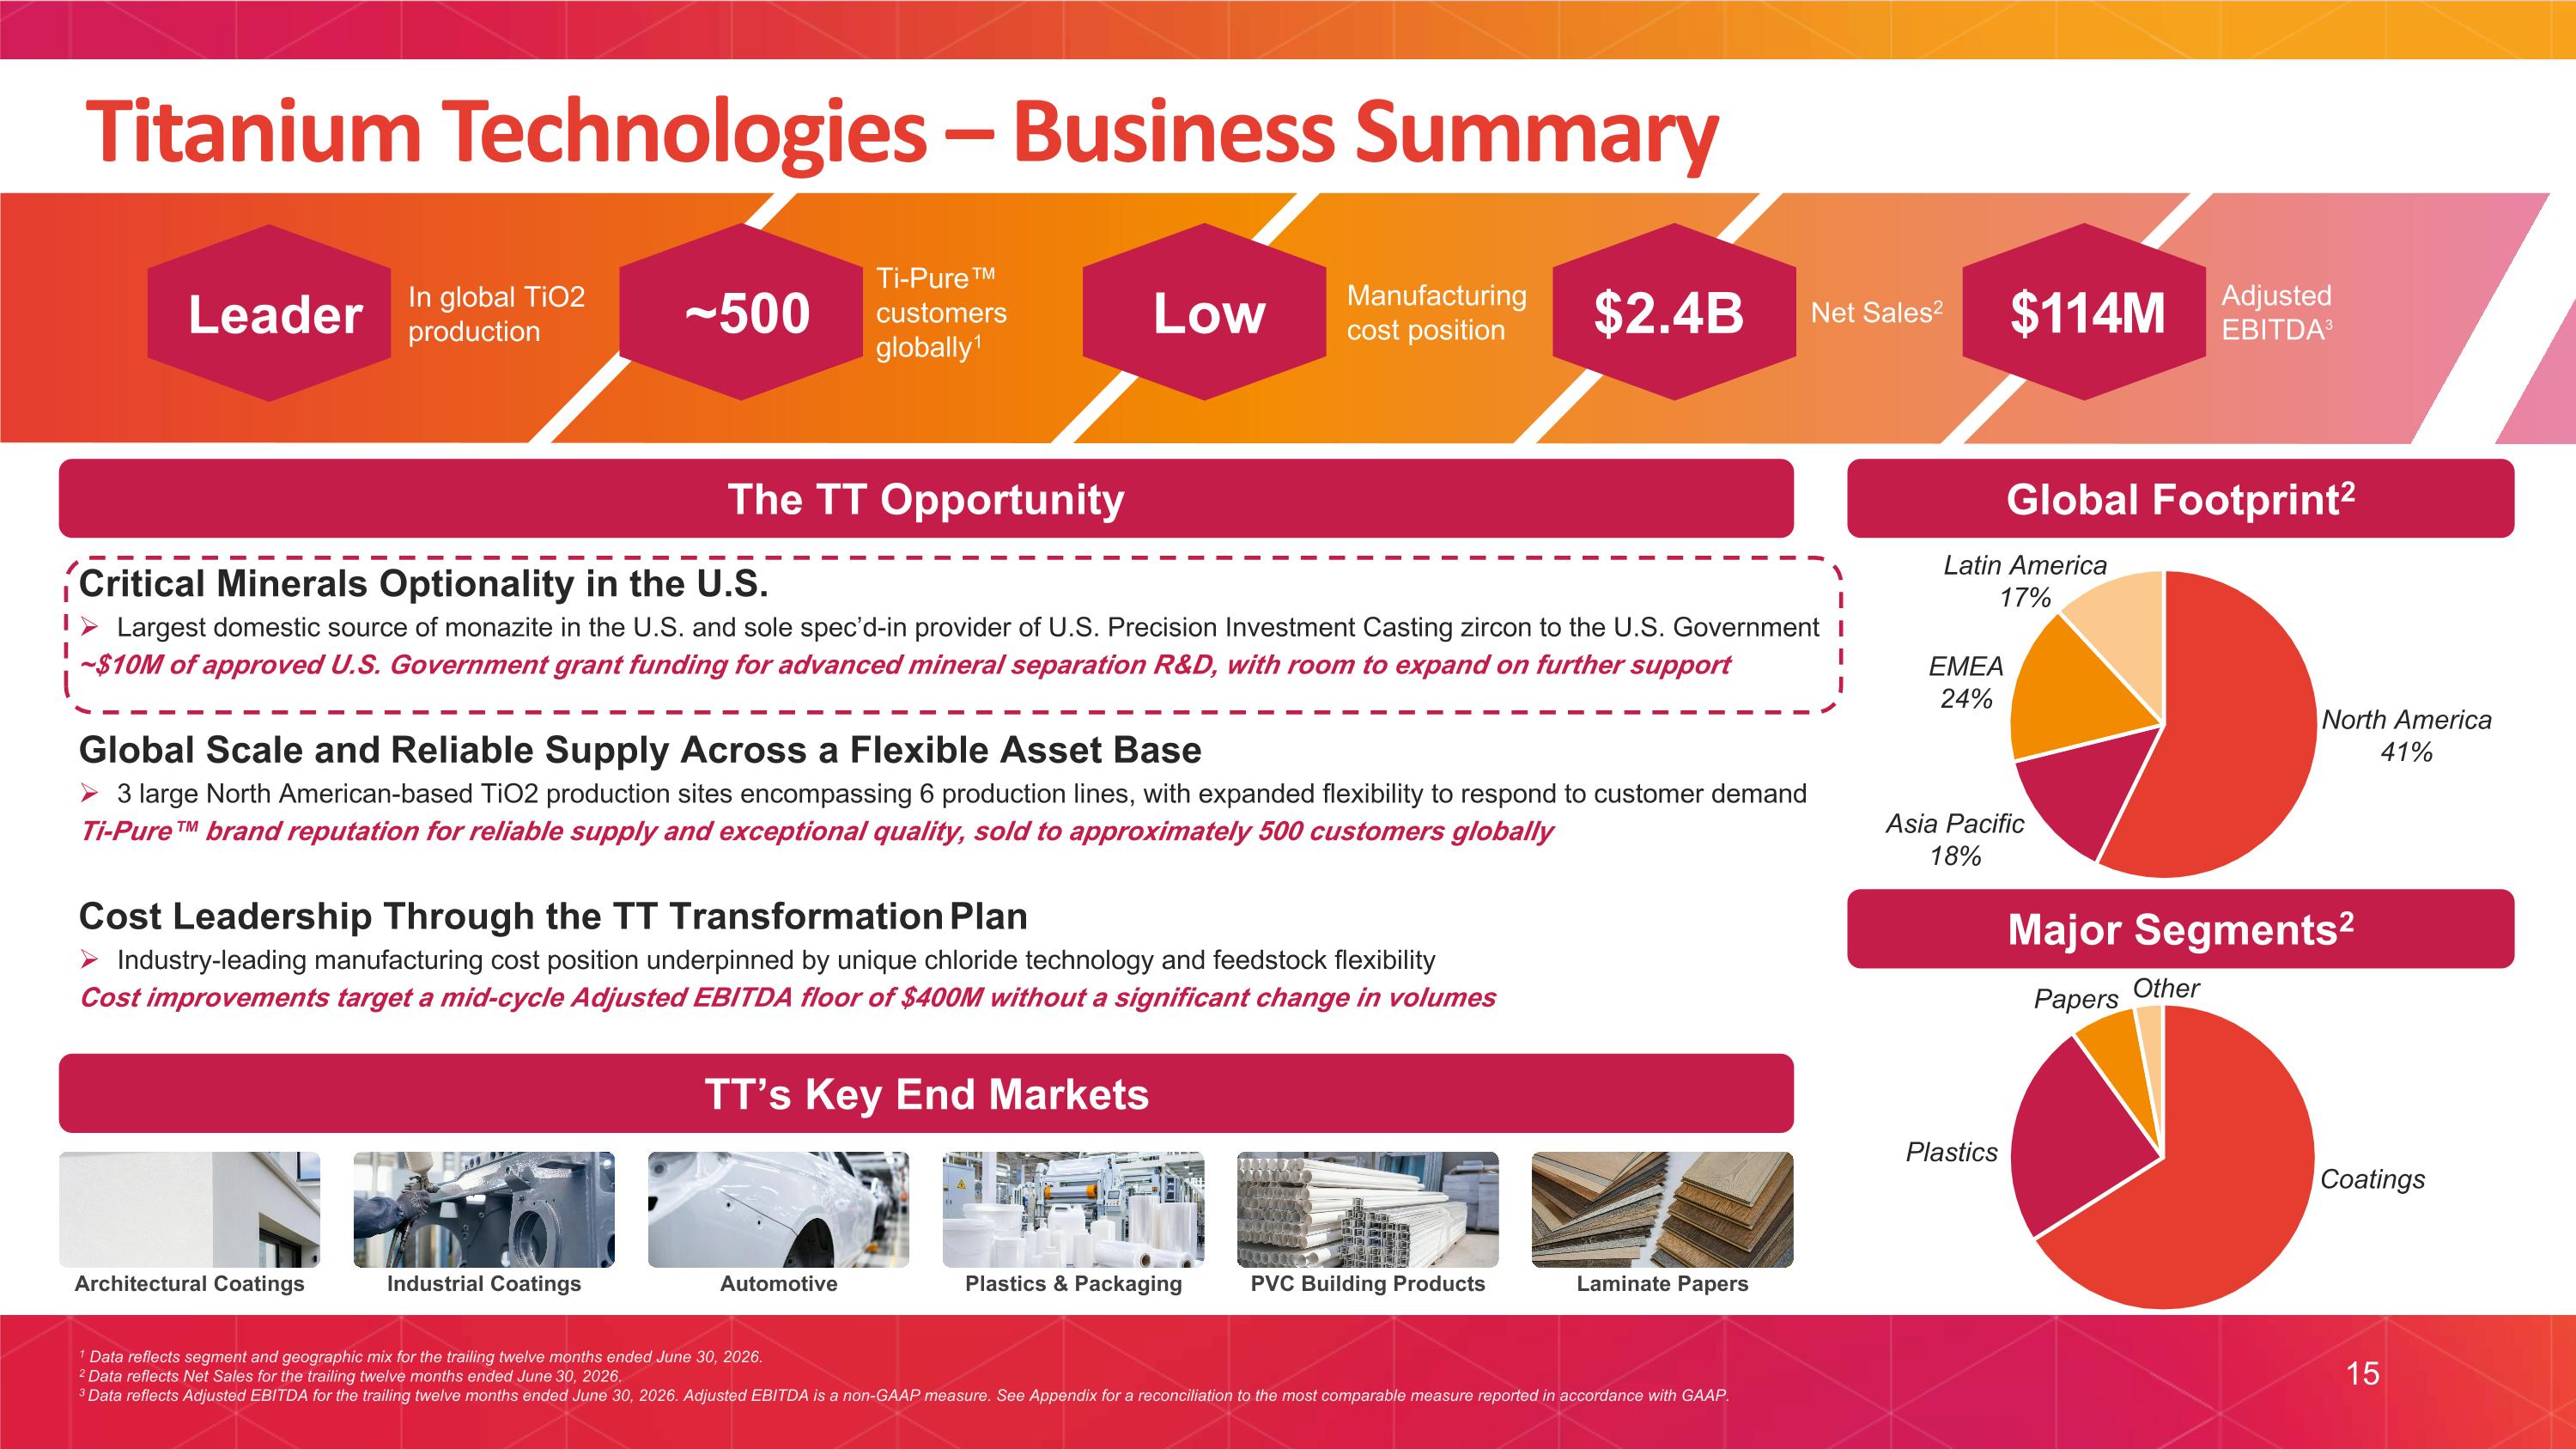
Leader In global TiO2 production ~500 Ti-Pure™ customers globally1 Low Manufacturing cost position $2.4B Net Sales2 $114M Adjusted EBITDA3 1 Data reflects segment and geographic mix for the trailing twelve months ended June 30, 2026. 2 Data reflects Net Sales for the trailing twelve months ended June 30, 2026. 3 Data reflects Adjusted EBITDA for the trailing twelve months ended June 30, 2026. Adjusted EBITDA is a non-GAAP measure. See Appendix for a reconciliation to the most comparable measure reported in accordance with GAAP. TT Opportunity 15 Titanium Technologies – Business Summary Global Footprint2 Major Segments2 The TT Opportunity Critical Minerals Optionality in the U.S. Largest domestic source of monazite in the U.S. and sole spec’d-in provider of U.S. Precision Investment Casting zircon to the U.S. Government ~$10M of approved U.S. Government grant funding for advanced mineral separation R&D, with room to expand on further support Global Scale and Reliable Supply Across a Flexible Asset Base 3 large North American-based TiO2 production sites encompassing 6 production lines, with expanded flexibility to respond to customer demand Ti-Pure™ brand reputation for reliable supply and exceptional quality, sold to approximately 500 customers globally Cost Leadership Through the TT Transformation Plan Industry-leading manufacturing cost position underpinned by unique chloride technology and feedstock flexibility Cost improvements target a mid-cycle Adjusted EBITDA floor of $400M without a significant change in volumes TT’s Key End Markets Architectural Coatings Industrial Coatings Automotive Plastics & Packaging PVC Building Products Laminate Papers
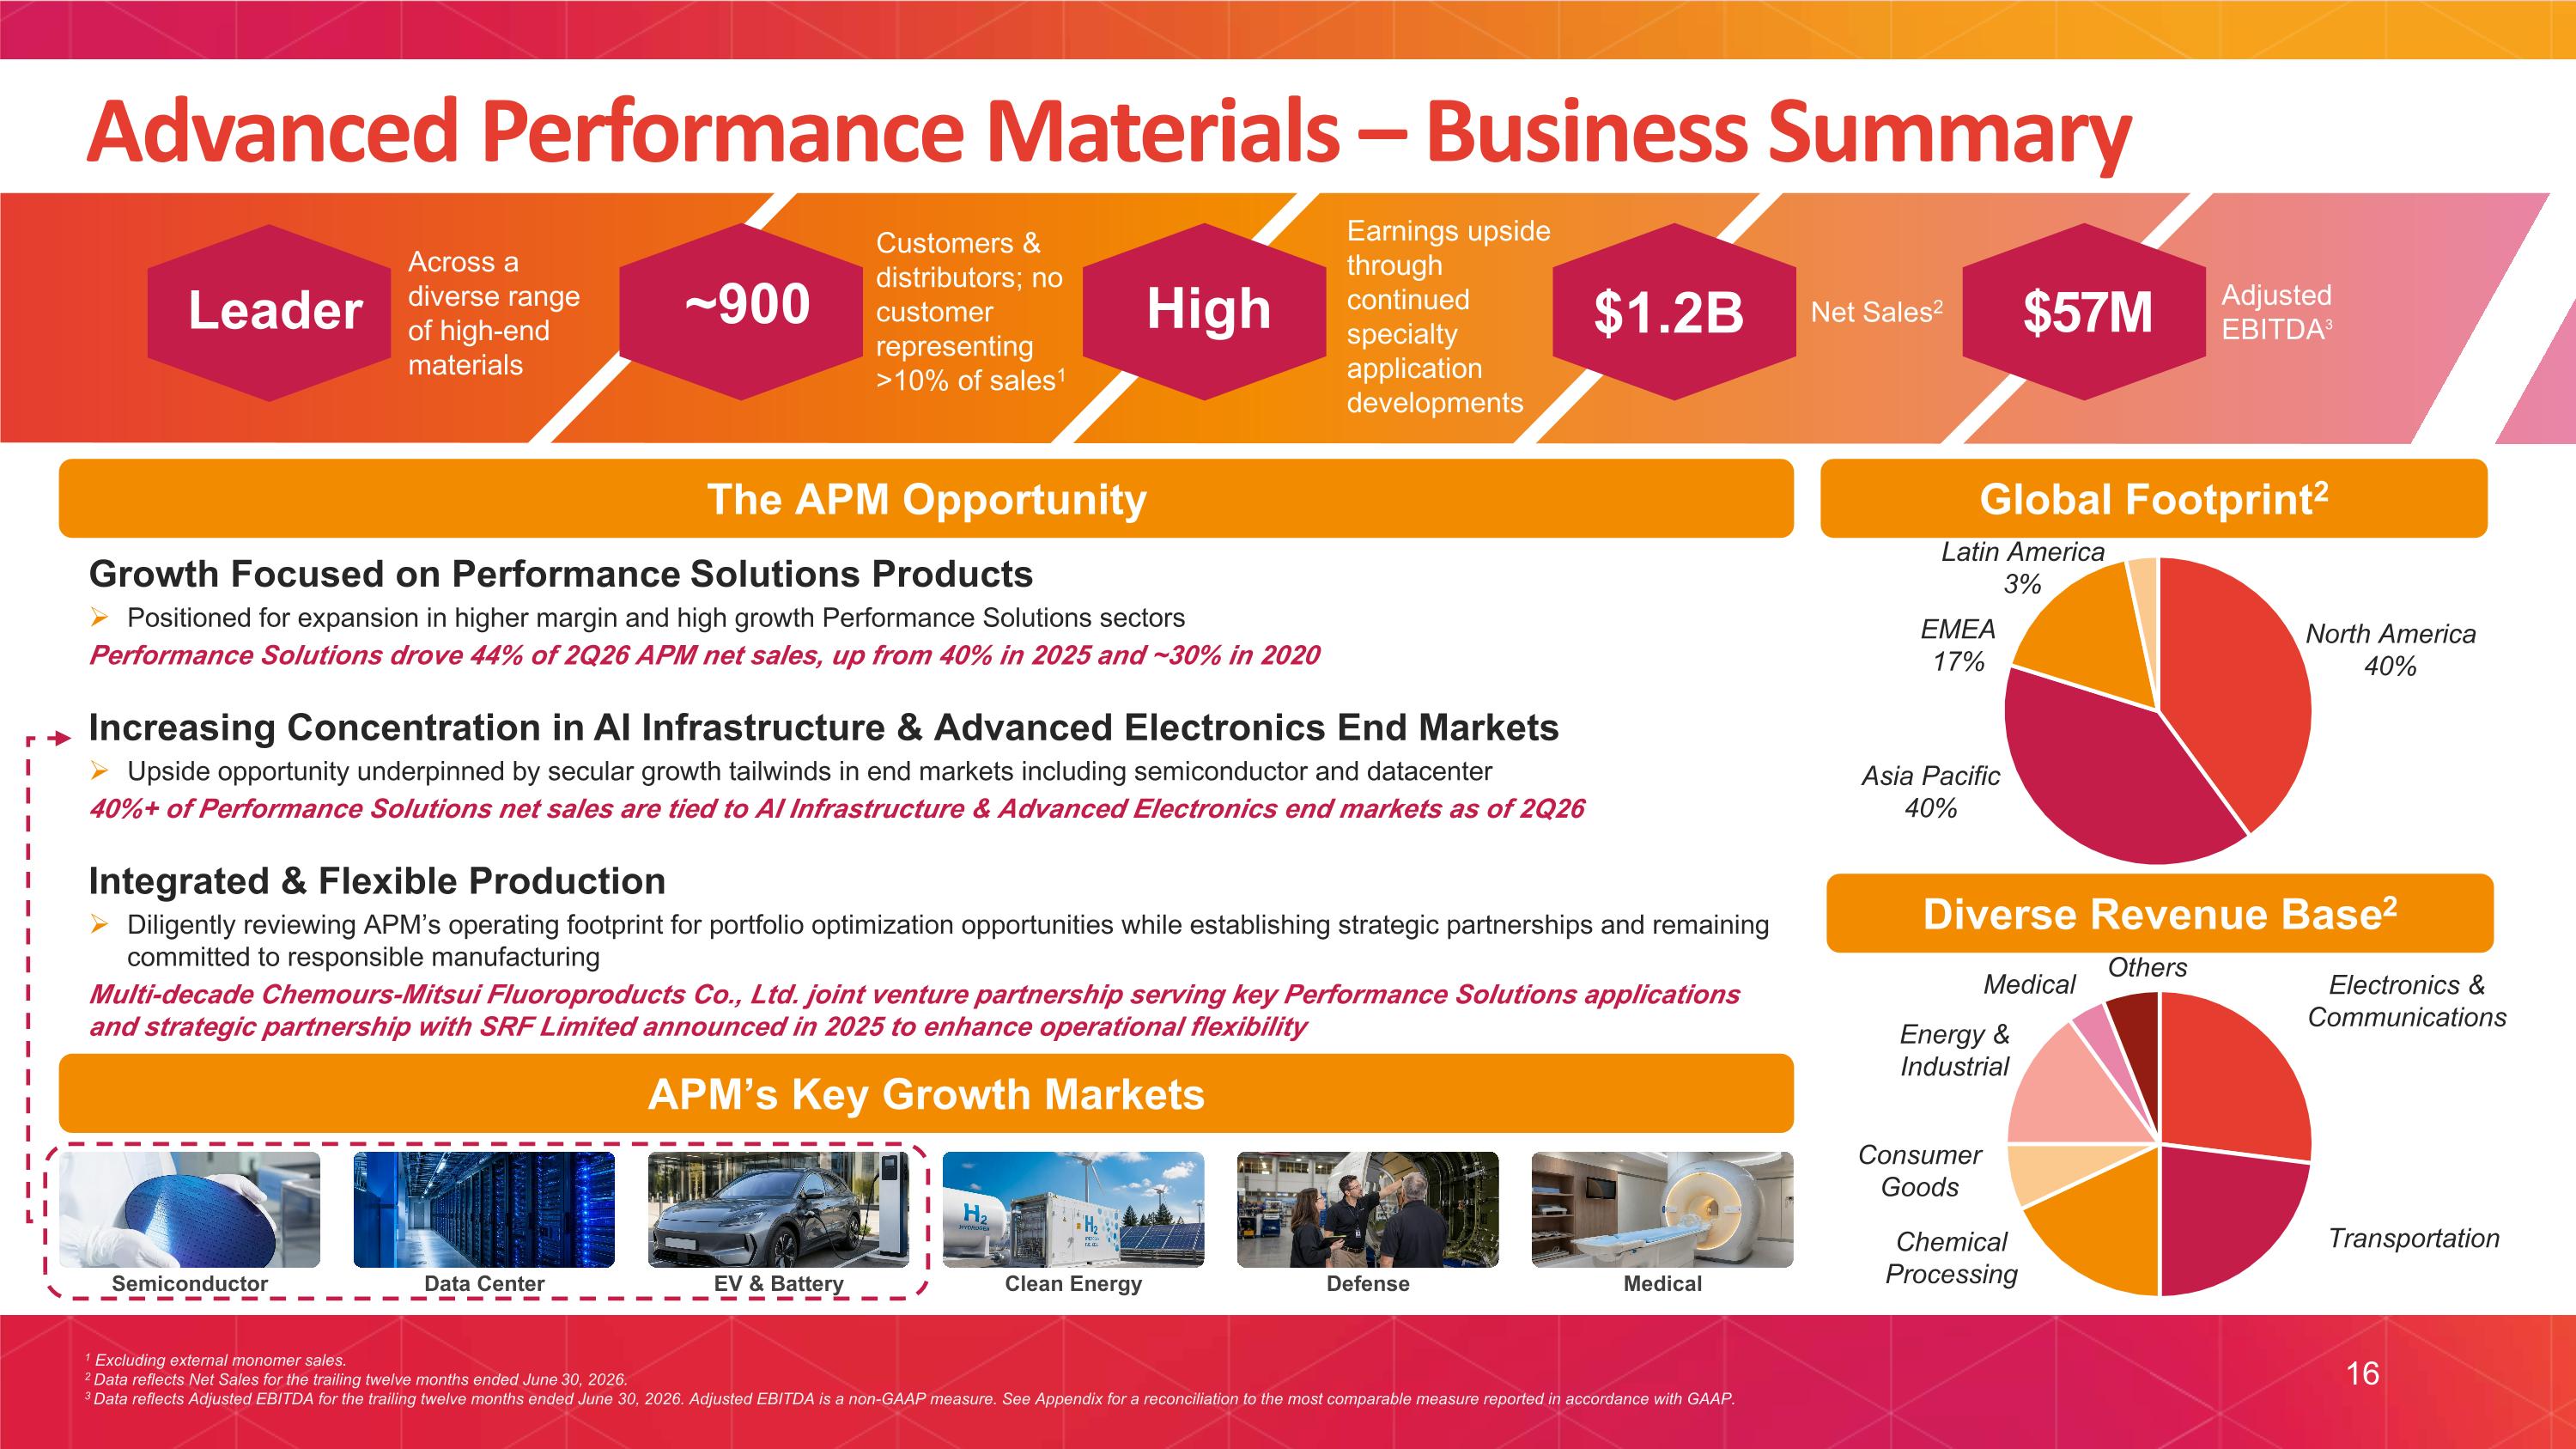
Leader Across a diverse range of high-end materials ~900 Customers & distributors; no customer representing >10% of sales1 High Earnings upside through continued specialty application developments $1.2B Net Sales2 $57M Adjusted EBITDA3 1 Excluding external monomer sales. 2 Data reflects Net Sales for the trailing twelve months ended June 30, 2026. 3 Data reflects Adjusted EBITDA for the trailing twelve months ended June 30, 2026. Adjusted EBITDA is a non-GAAP measure. See Appendix for a reconciliation to the most comparable measure reported in accordance with GAAP. APM Opportunity 16 Advanced Performance Materials – Business Summary Global Footprint2 Diverse Revenue Base2 The APM Opportunity Growth Focused on Performance Solutions Products Positioned for expansion in higher margin and high growth Performance Solutions sectors Performance Solutions drove 44% of 2Q26 APM net sales, up from 40% in 2025 and ~30% in 2020 Increasing Concentration in AI Infrastructure & Advanced Electronics End Markets Upside opportunity underpinned by secular growth tailwinds in end markets including semiconductor and datacenter 40%+ of Performance Solutions net sales are tied to AI Infrastructure & Advanced Electronics end markets as of 2Q26 Integrated & Flexible Production Diligently reviewing APM’s operating footprint for portfolio optimization opportunities while establishing strategic partnerships and remaining committed to responsible manufacturing Multi-decade Chemours-Mitsui Fluoroproducts Co., Ltd. joint venture partnership serving key Performance Solutions applications and strategic partnership with SRF Limited announced in 2025 to enhance operational flexibility APM’s Key Growth Markets Semiconductor Data Center EV & Battery Clean Energy Defense Medical

II. STRATEGIC PROGRESS PATHWAY TO THRIVE
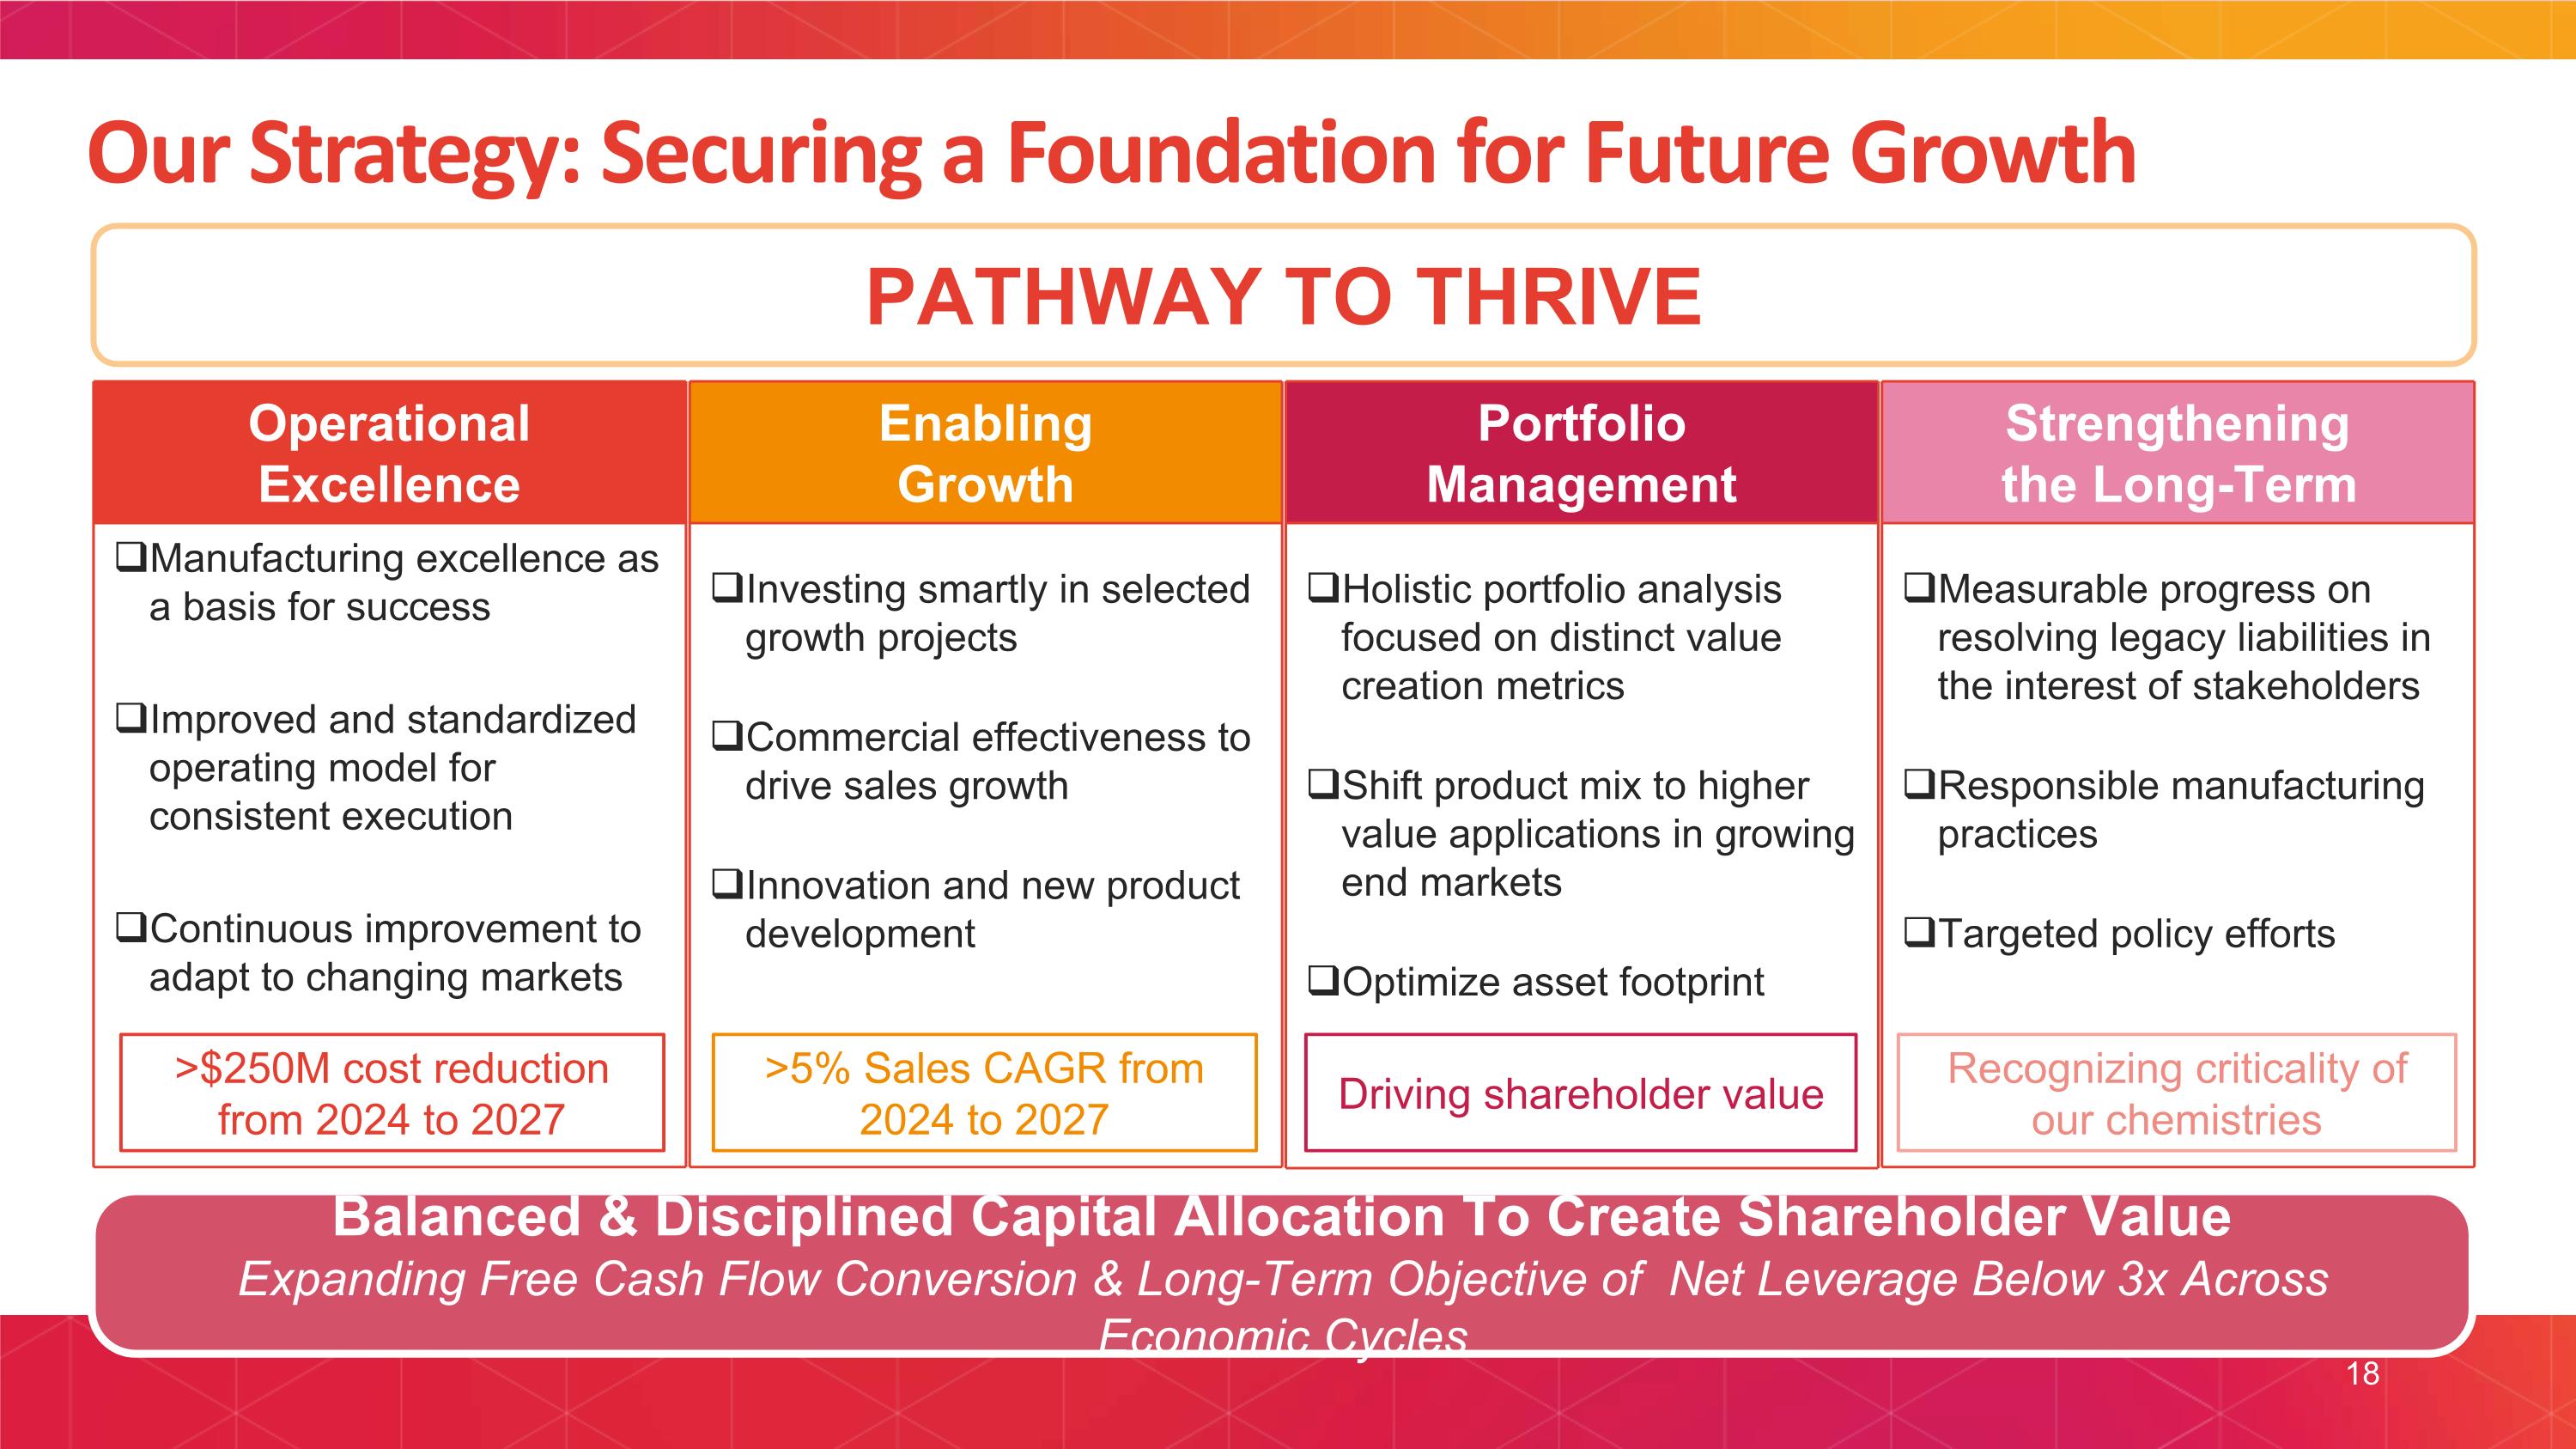
Our Strategy: Securing a Foundation for Future Growth PATHWAY TO THRIVE Balanced & Disciplined Capital Allocation To Create Shareholder Value Expanding Free Cash Flow Conversion & Long-Term Objective of Net Leverage Below 3x Across Economic Cycles Operational Excellence Manufacturing excellence as a basis for success Improved and standardized operating model for consistent execution Continuous improvement to adapt to changing markets Strengthening the Long-Term Measurable progress on resolving legacy liabilities in the interest of stakeholders Responsible manufacturing practices Targeted policy efforts Enabling Growth Investing smartly in selected growth projects Commercial effectiveness to drive sales growth Innovation and new product development Portfolio Management Holistic portfolio analysis focused on distinct value creation metrics Shift product mix to higher value applications in growing end markets Optimize asset footprint >$250M cost reduction from 2024 to 2027 Recognizing criticality of our chemistries Driving shareholder value >5% Sales CAGR from 2024 to 2027 18
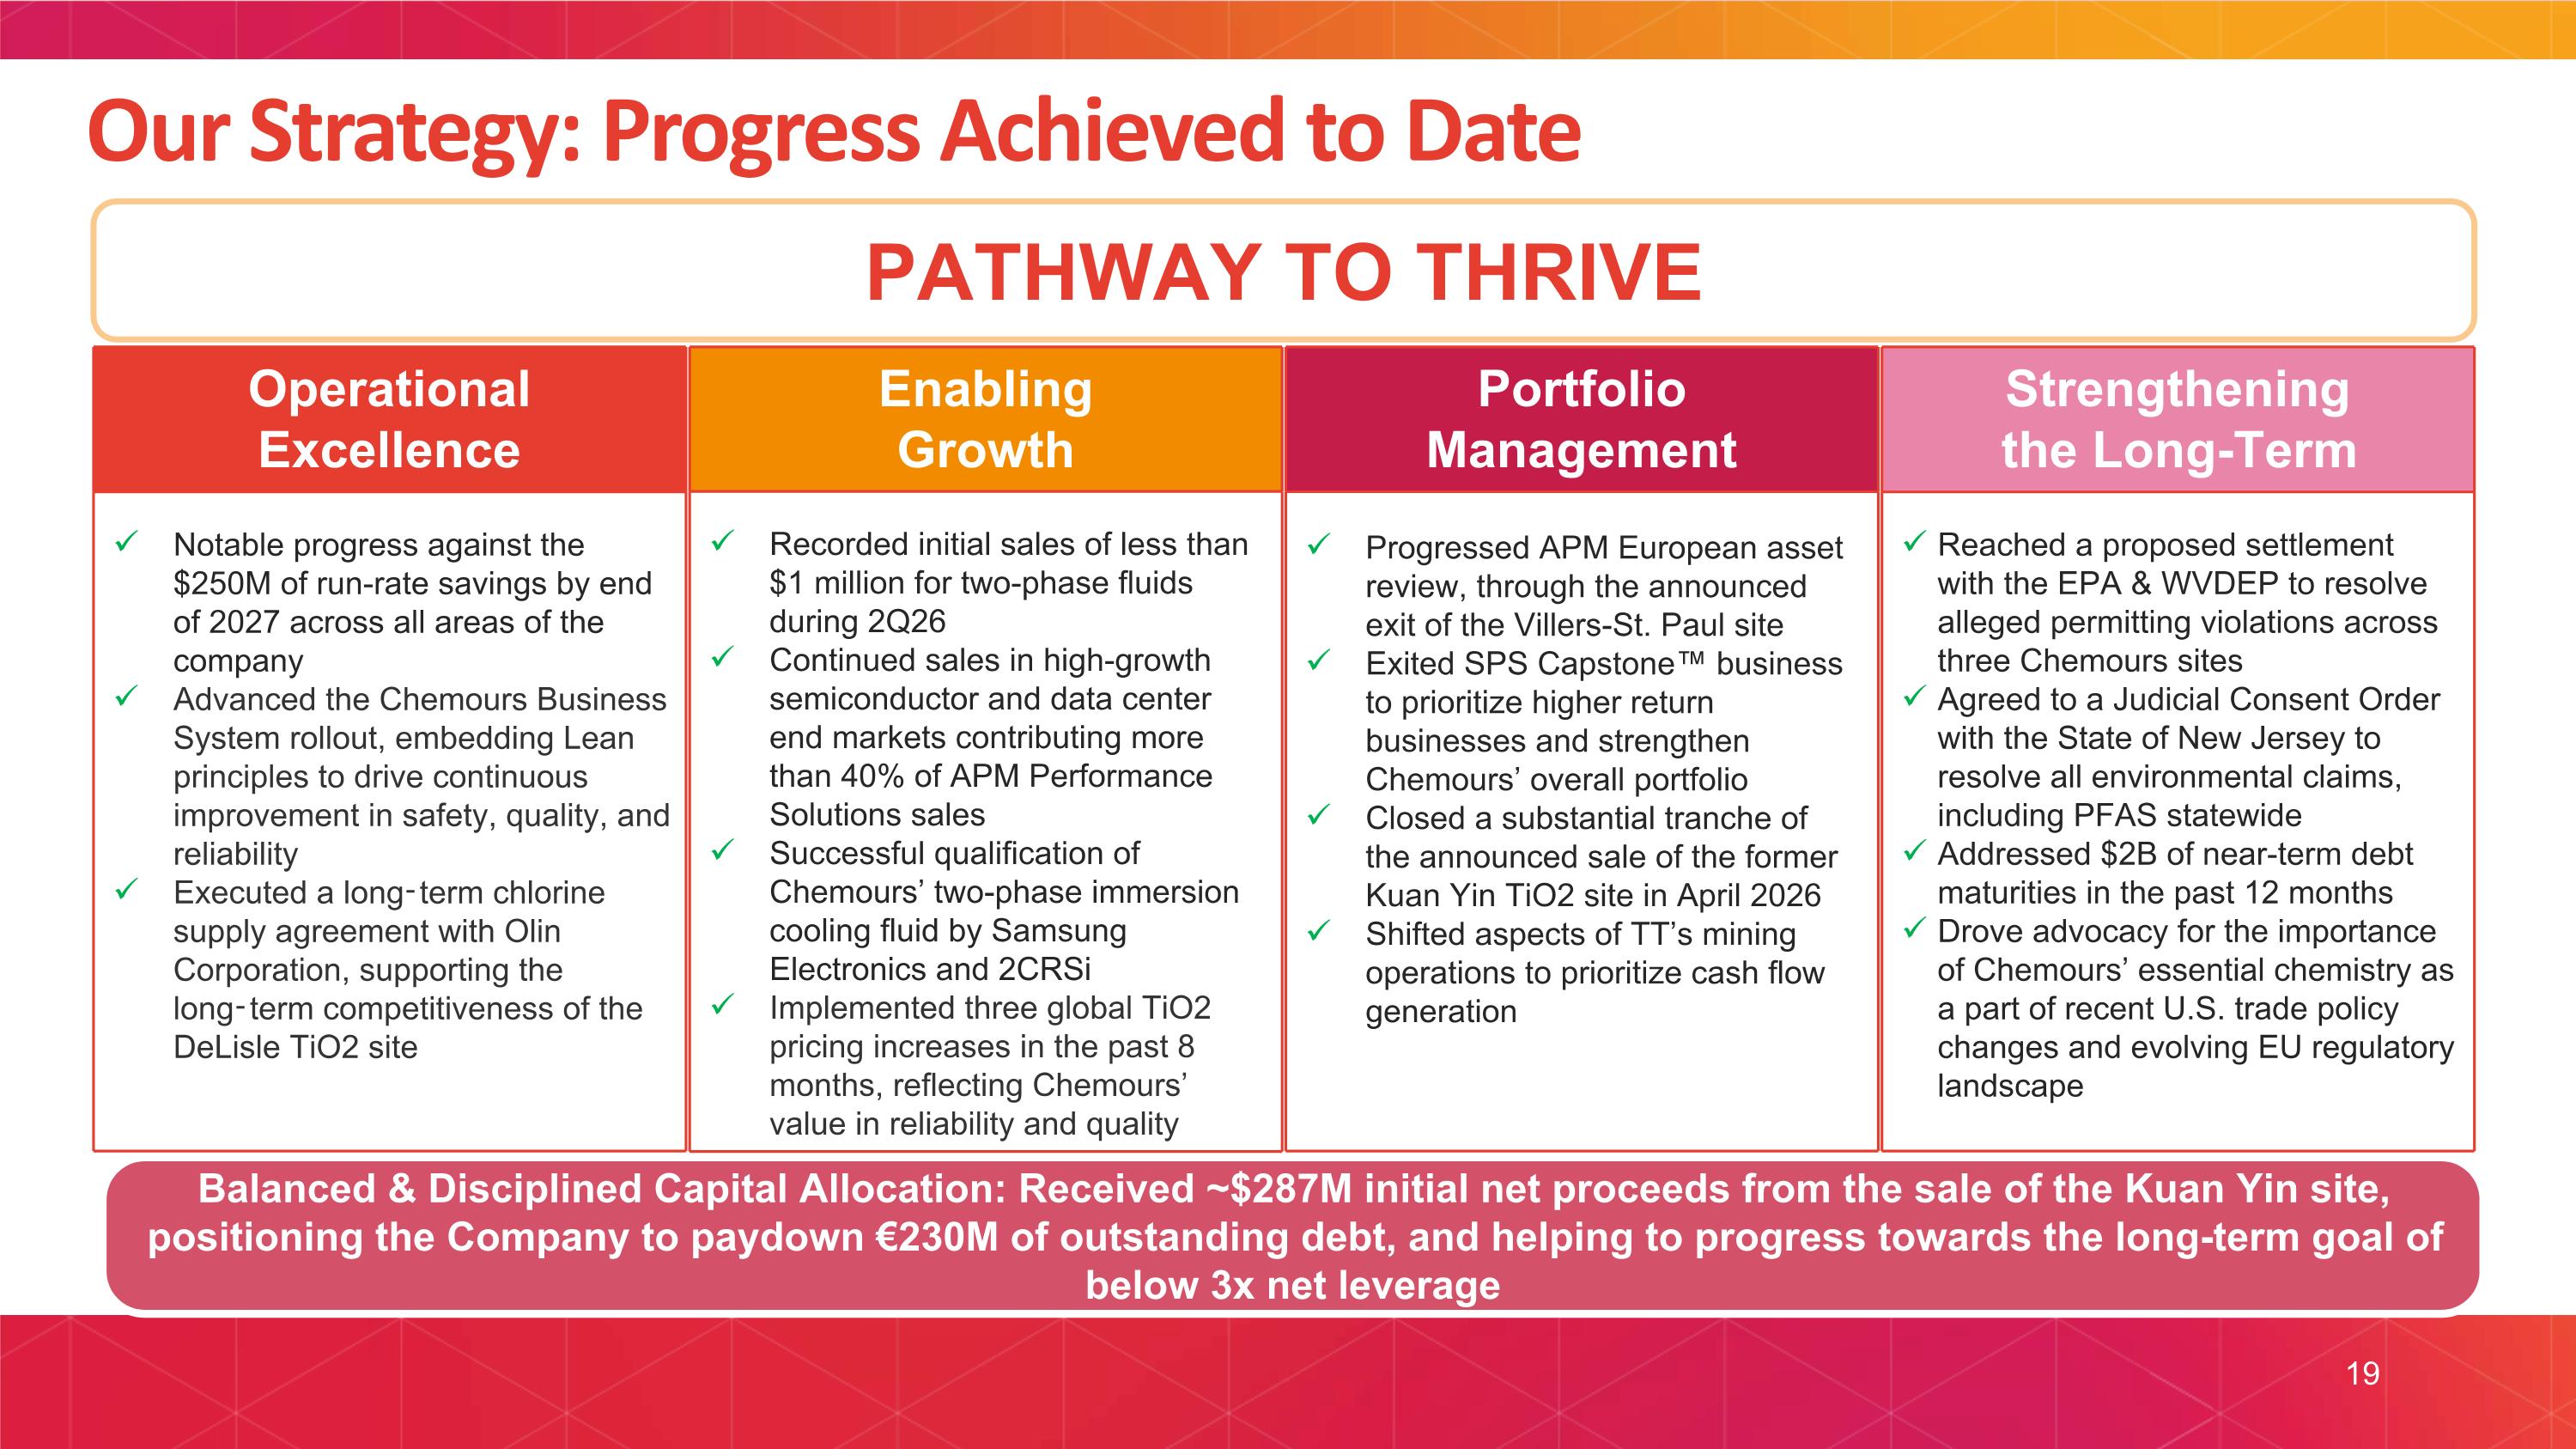
Our Strategy: Progress Achieved to Date PATHWAY TO THRIVE Balanced & Disciplined Capital Allocation: Received ~$287M initial net proceeds from the sale of the Kuan Yin site, positioning the Company to paydown €230M of outstanding debt, and helping to progress towards the long-term goal of below 3x net leverage Operational Excellence Notable progress against the $250M of run-rate savings by end of 2027 across all areas of the company Advanced the Chemours Business System rollout, embedding Lean principles to drive continuous improvement in safety, quality, and reliability Executed a long‑term chlorine supply agreement with Olin Corporation, supporting the long‑term competitiveness of the DeLisle TiO2 site Strengthening the Long-Term Reached a proposed settlement with the EPA & WVDEP to resolve alleged permitting violations across three Chemours sites Agreed to a Judicial Consent Order with the State of New Jersey to resolve all environmental claims, including PFAS statewide Addressed $2B of near-term debt maturities in the past 12 months Drove advocacy for the importance of Chemours’ essential chemistry as a part of recent U.S. trade policy changes and evolving EU regulatory landscape Enabling Growth Recorded initial sales of less than $1 million for two-phase fluids during 2Q26 Continued sales in high-growth semiconductor and data center end markets contributing more than 40% of APM Performance Solutions sales Successful qualification of Chemours’ two-phase immersion cooling fluid by Samsung Electronics and 2CRSi Implemented three global TiO2 pricing increases in the past 8 months, reflecting Chemours’ value in reliability and quality Portfolio Management Progressed APM European asset review, through the announced exit of the Villers-St. Paul site Exited SPS Capstone™ business to prioritize higher return businesses and strengthen Chemours’ overall portfolio Closed a substantial tranche of the announced sale of the former Kuan Yin TiO2 site in April 2026 Shifted aspects of TT’s mining operations to prioritize cash flow generation 19
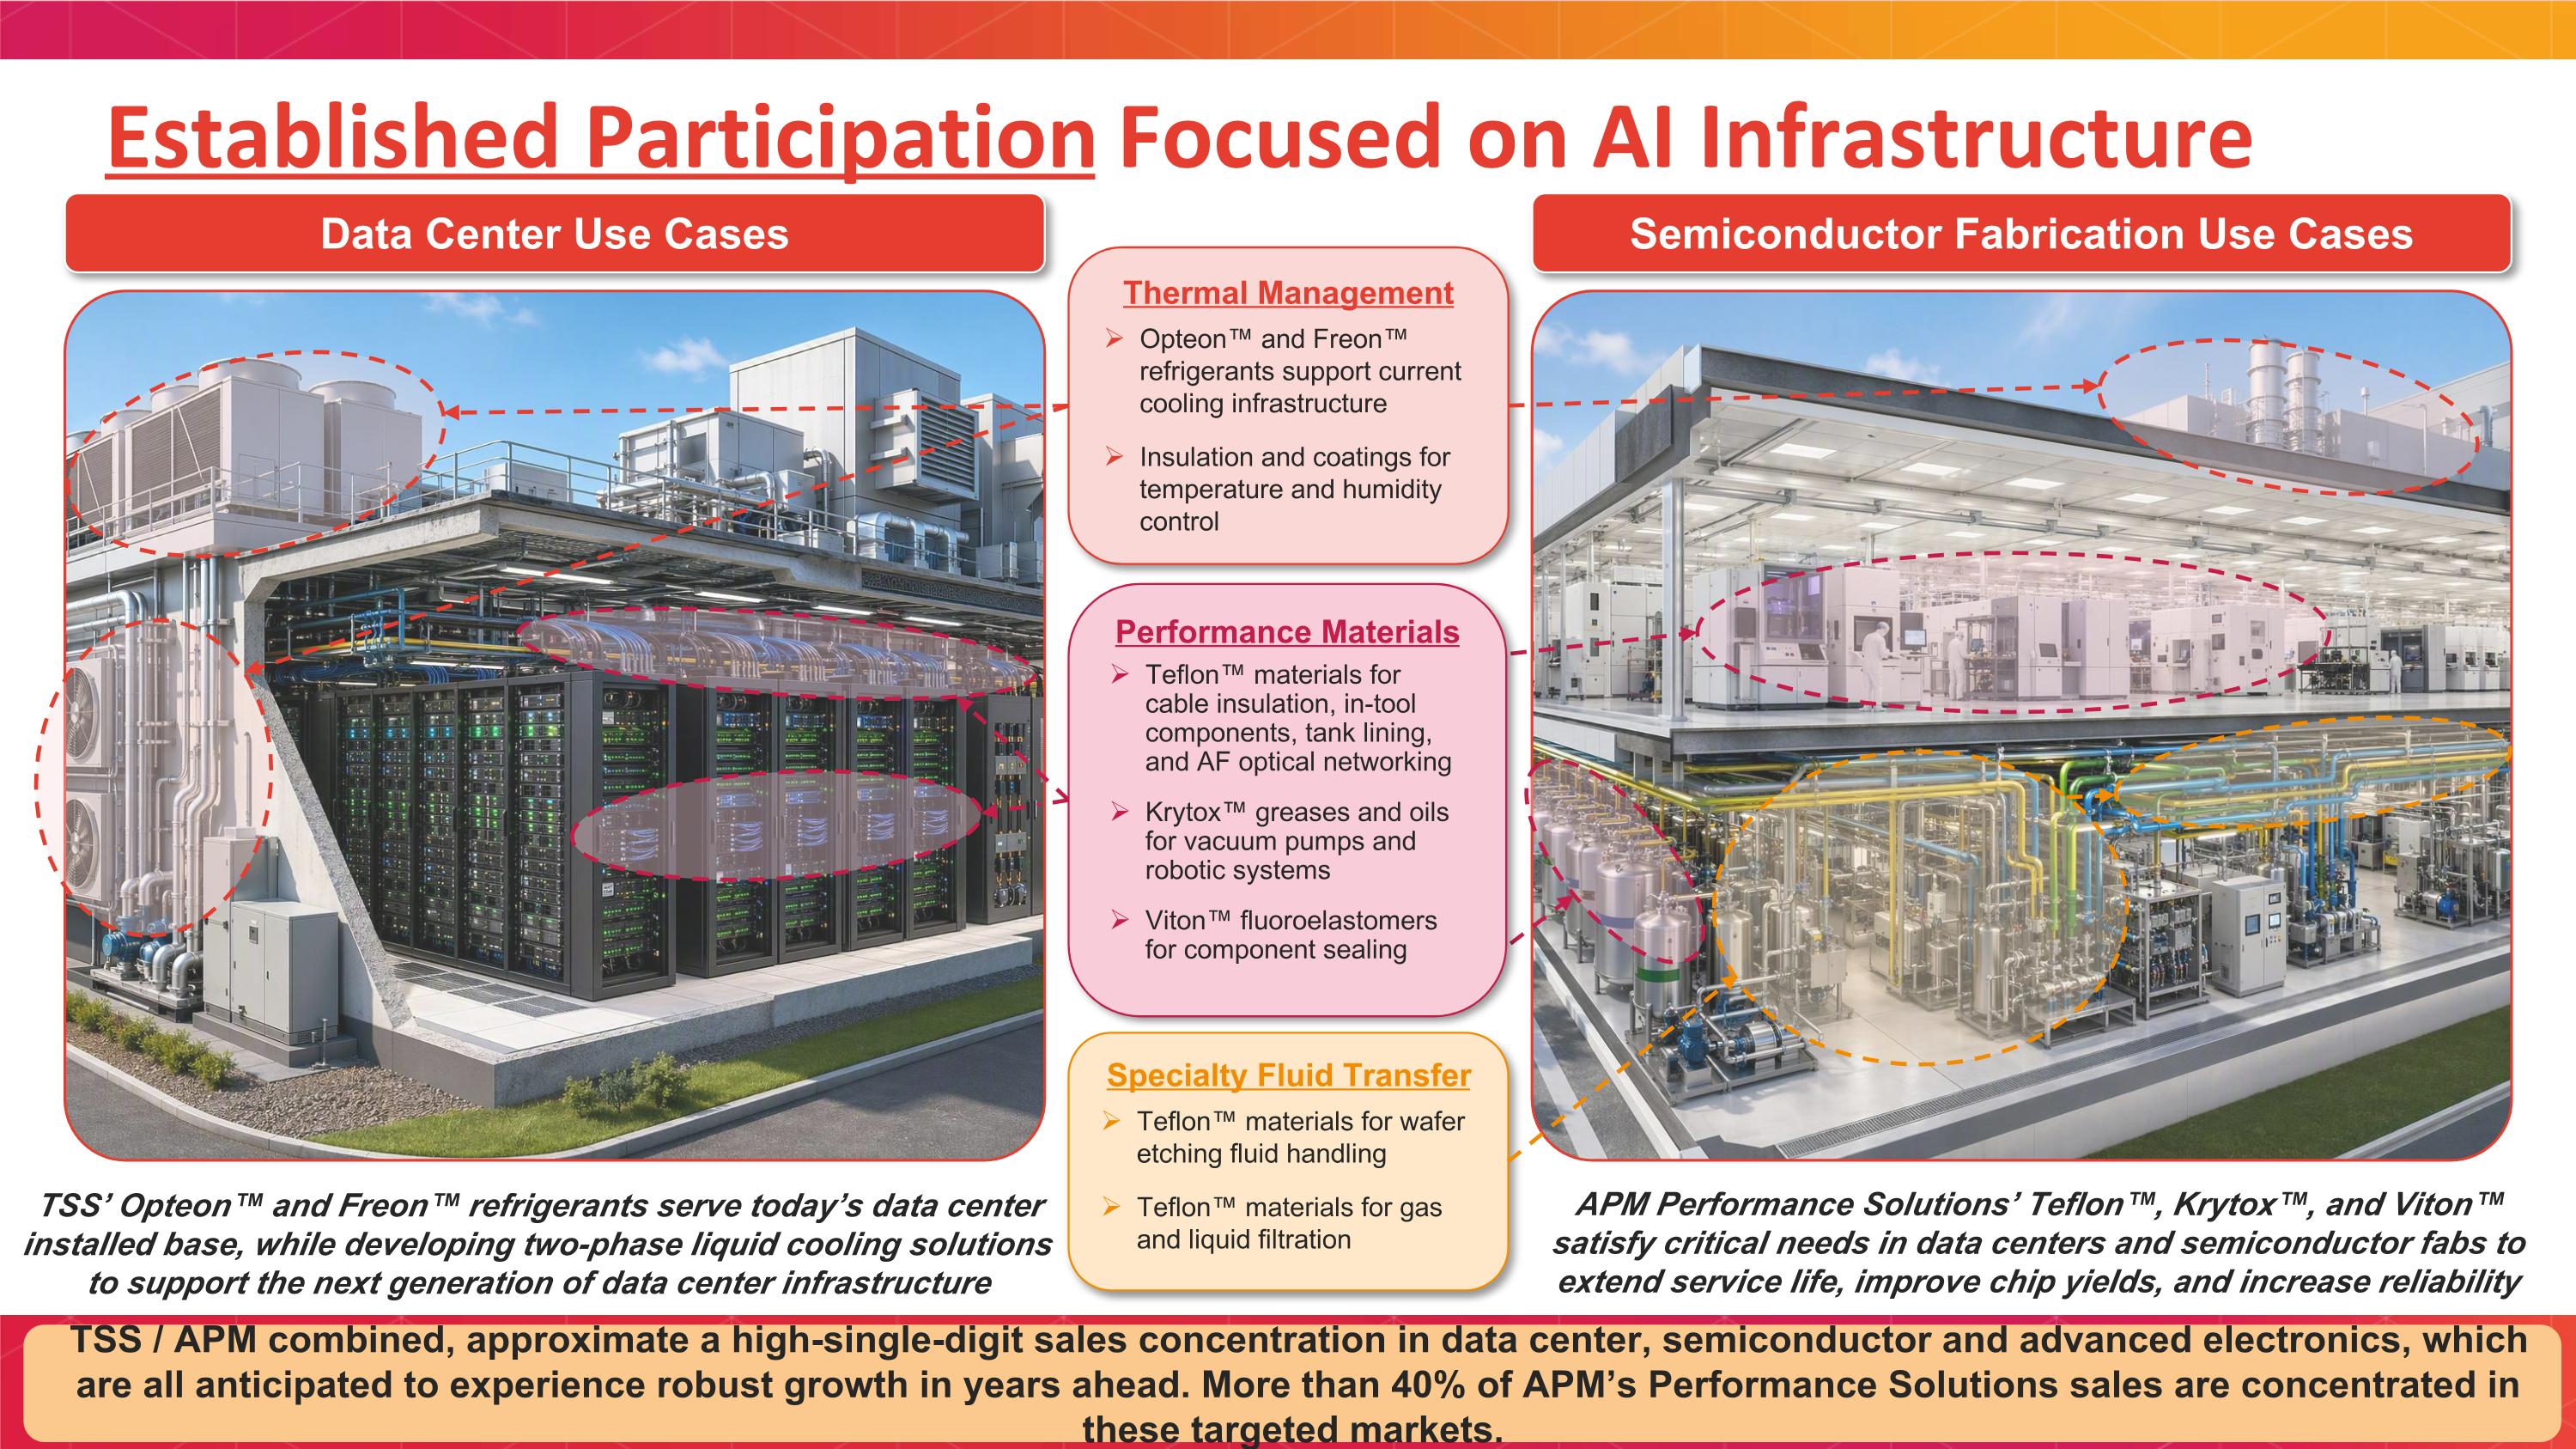
Established Participation Focused on AI Infrastructure Semiconductor Fabrication Use Cases Data Center Use Cases Thermal Management Opteon™ and Freon™ refrigerants support current cooling infrastructure Insulation and coatings for temperature and humidity control Specialty Fluid Transfer Teflon™ materials for wafer etching fluid handling Teflon™ materials for gas and liquid filtration Performance Materials Teflon™ materials for cable insulation, in-tool components, tank lining, and AF optical networking Krytox™ greases and oils for vacuum pumps and robotic systems Viton™ fluoroelastomers for component sealing TSS’ Opteon™ and Freon™ refrigerants serve today’s data center installed base, while developing two-phase liquid cooling solutions to support the next generation of data center infrastructure APM Performance Solutions’ Teflon™, Krytox™, and Viton™ satisfy critical needs in data centers and semiconductor fabs to extend service life, improve chip yields, and increase reliability TSS / APM combined, approximate a high-single-digit sales concentration in data center, semiconductor and advanced electronics, which are all anticipated to experience robust growth in years ahead. More than 40% of APM’s Performance Solutions sales are concentrated in these targeted markets.
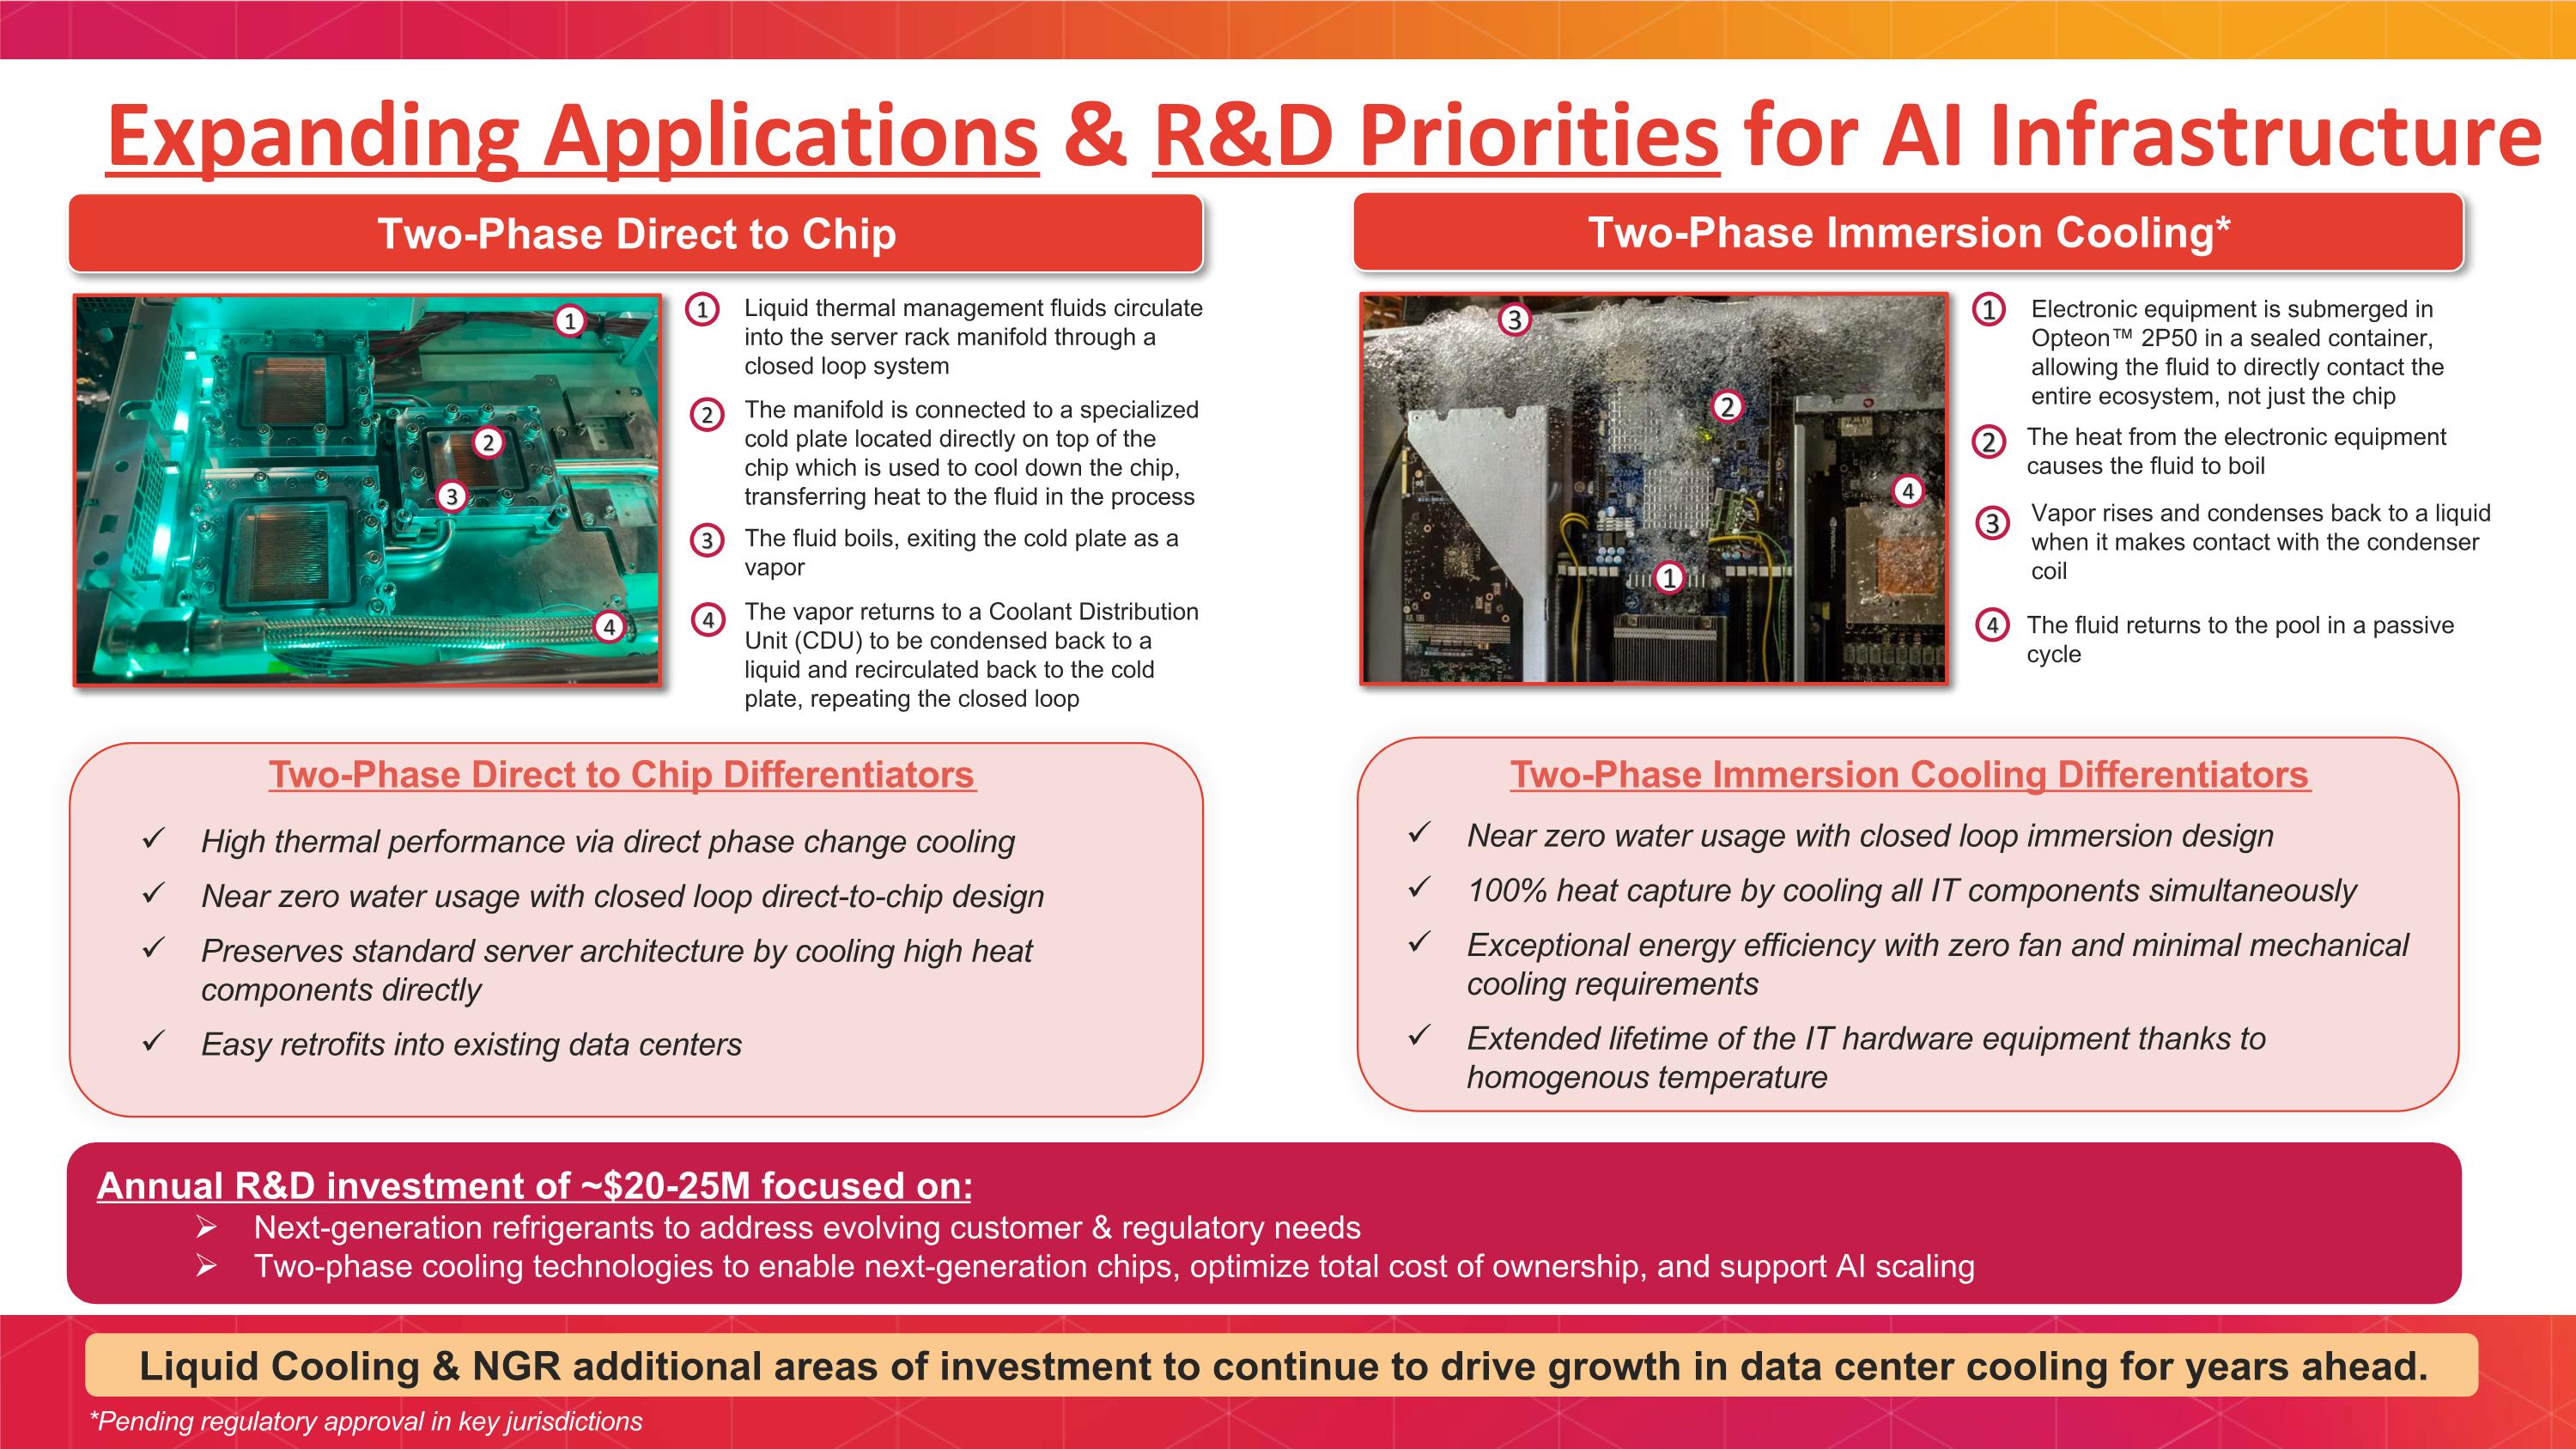
Expanding Applications & R&D Priorities for AI Infrastructure Two-Phase Immersion Cooling* Two-Phase Direct to Chip 1 3 2 4 Liquid thermal management fluids circulate into the server rack manifold through a closed loop system The fluid boils, exiting the cold plate as a vapor The manifold is connected to a specialized cold plate located directly on top of the chip which is used to cool down the chip, transferring heat to the fluid in the process The vapor returns to a Coolant Distribution Unit (CDU) to be condensed back to a liquid and recirculated back to the cold plate, repeating the closed loop Electronic equipment is submerged in Opteon™ 2P50 in a sealed container, allowing the fluid to directly contact the entire ecosystem, not just the chip 1 The heat from the electronic equipment causes the fluid to boil 2 3 Vapor rises and condenses back to a liquid when it makes contact with the condenser coil 4 The fluid returns to the pool in a passive cycle Annual R&D investment of ~$20-25M focused on: Next-generation refrigerants to address evolving customer & regulatory needs Two-phase cooling technologies to enable next-generation chips, optimize total cost of ownership, and support AI scaling 1 2 3 4 Two-Phase Immersion Cooling Differentiators Near zero water usage with closed loop immersion design 100% heat capture by cooling all IT components simultaneously Exceptional energy efficiency with zero fan and minimal mechanical cooling requirements Extended lifetime of the IT hardware equipment thanks to homogenous temperature Two-Phase Direct to Chip Differentiators High thermal performance via direct phase change cooling Near zero water usage with closed loop direct-to-chip design Preserves standard server architecture by cooling high heat components directly Easy retrofits into existing data centers 1 2 3 4 Liquid Cooling & NGR additional areas of investment to continue to drive growth in data center cooling for years ahead. *Pending regulatory approval in key jurisdictions
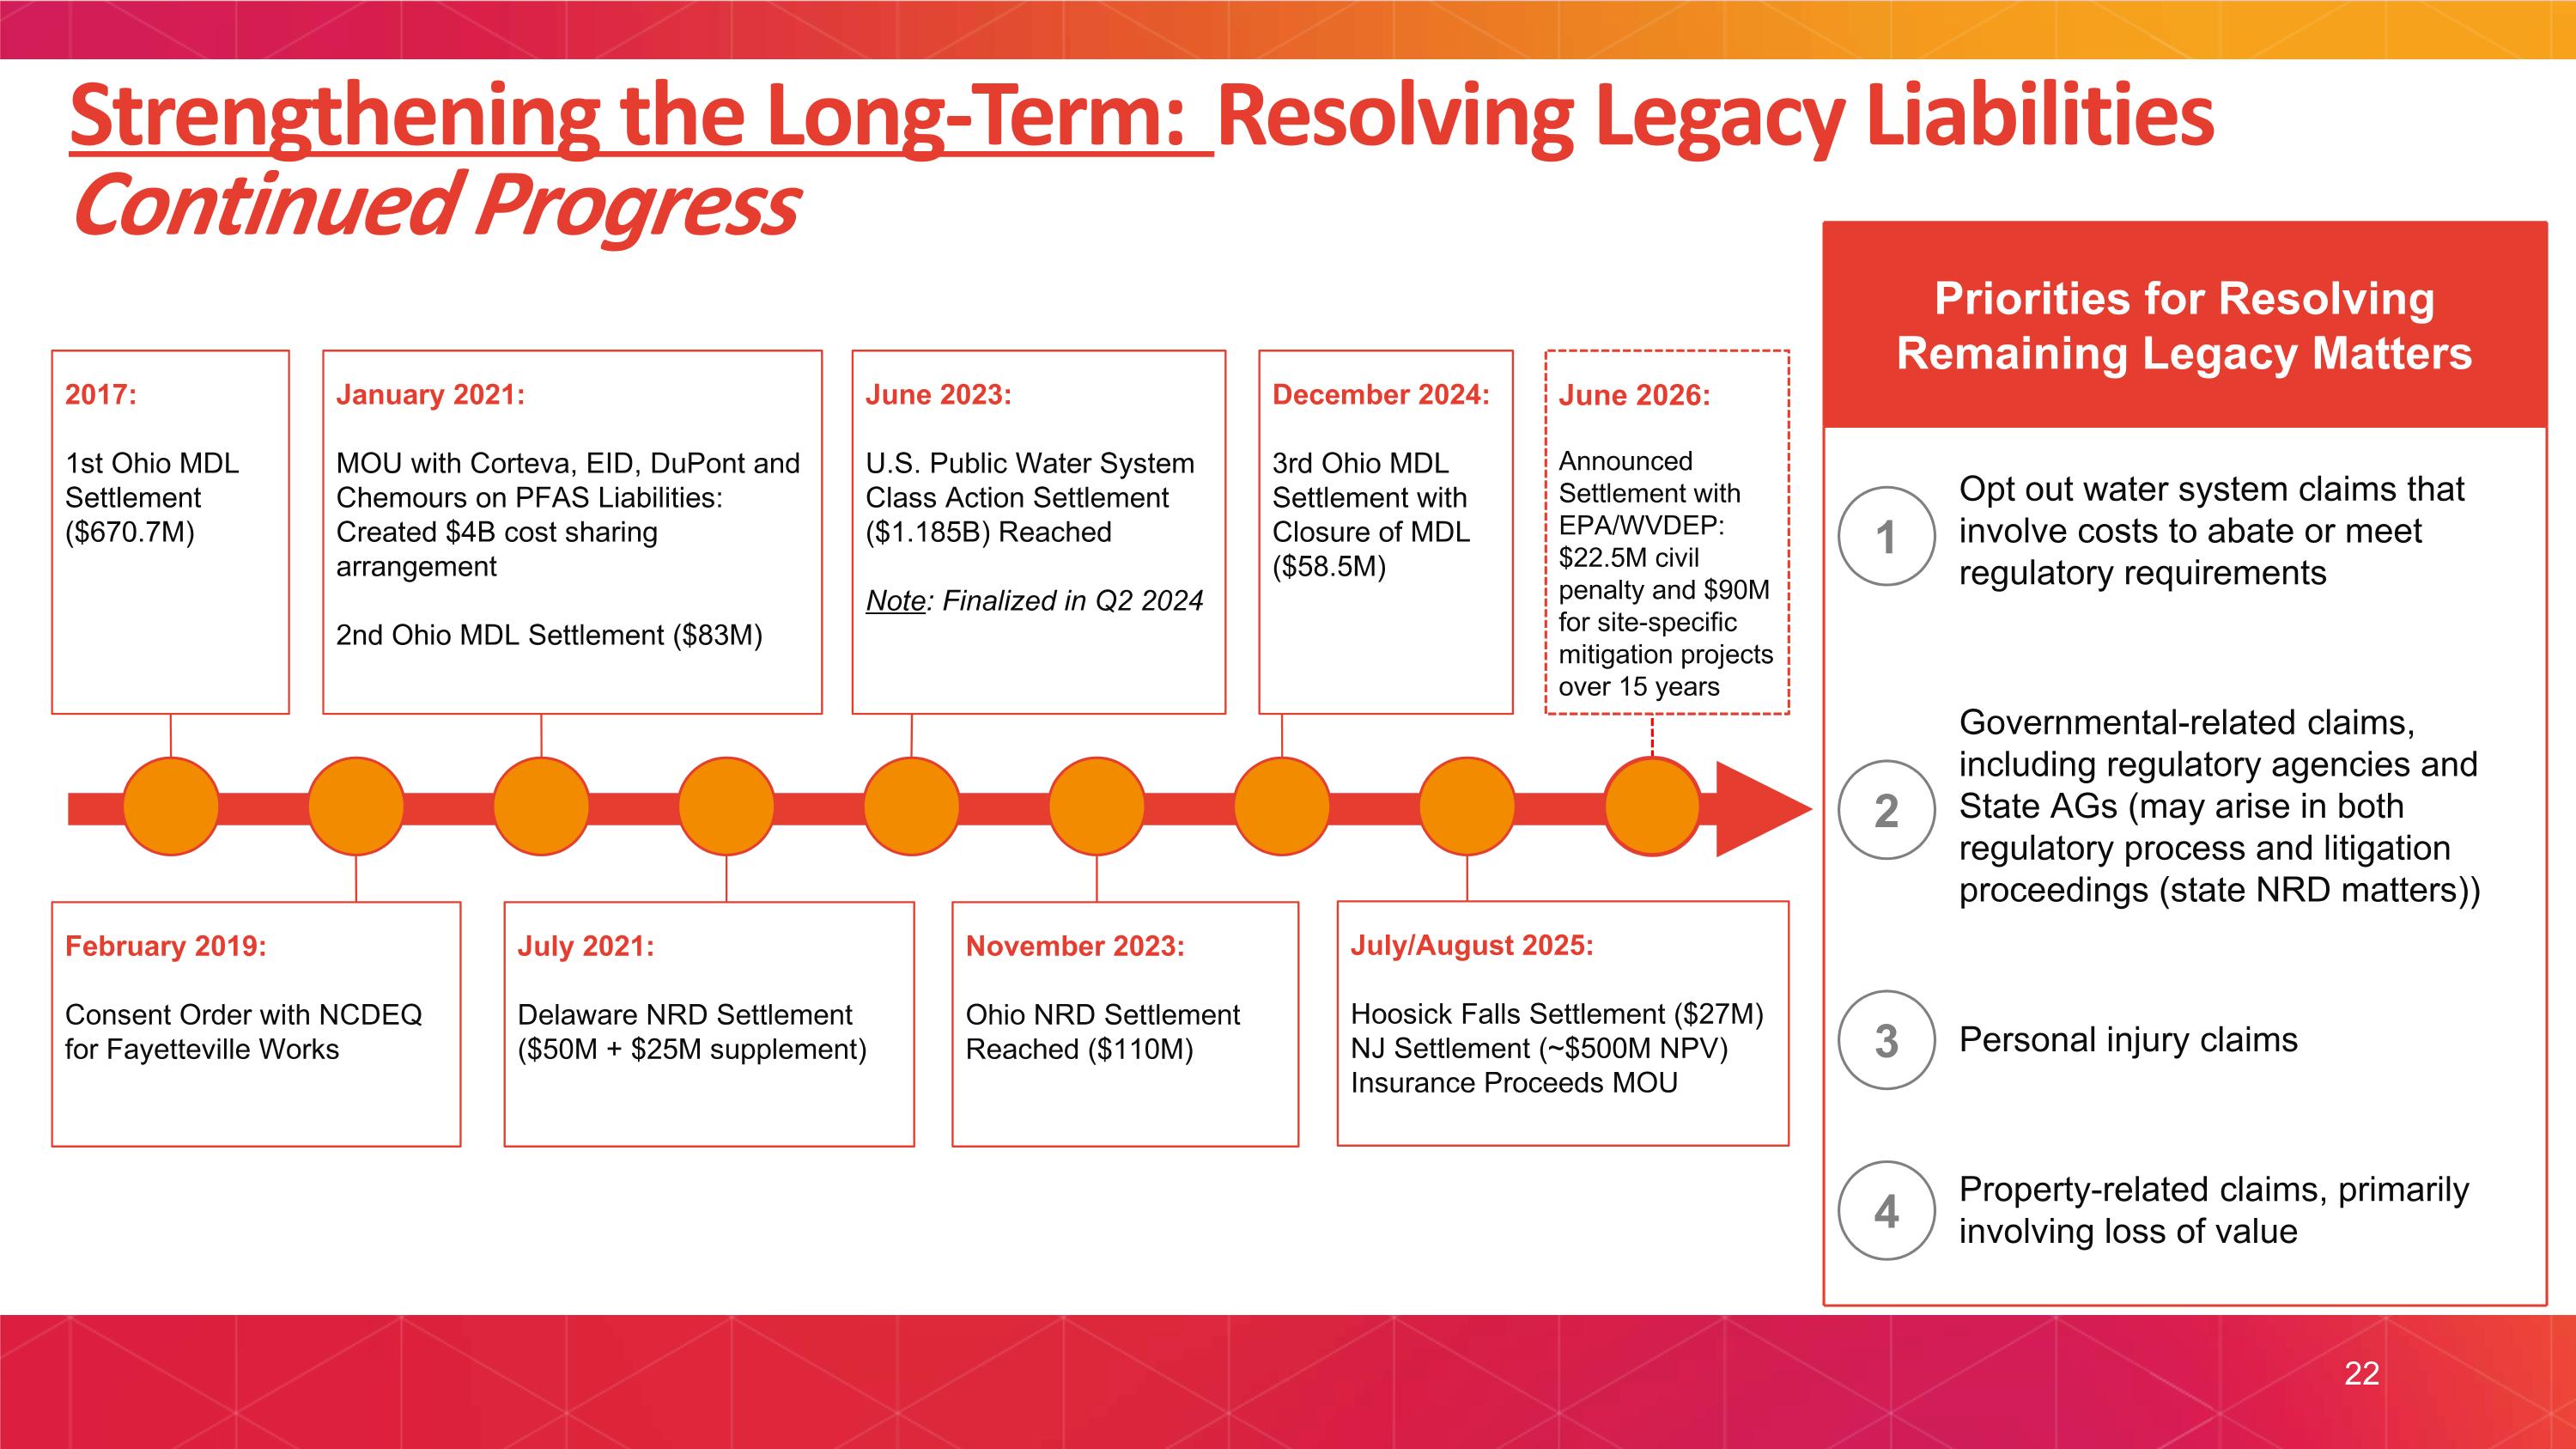
Strengthening the Long-Term: Resolving Legacy Liabilities Continued Progress 2017: 1st Ohio MDL Settlement ($670.7M) January 2021: MOU with Corteva, EID, DuPont and Chemours on PFAS Liabilities: Created $4B cost sharing arrangement 2nd Ohio MDL Settlement ($83M) February 2019: Consent Order with NCDEQ for Fayetteville Works July 2021: Delaware NRD Settlement ($50M + $25M supplement) June 2023: U.S. Public Water System Class Action Settlement ($1.185B) Reached Note: Finalized in Q2 2024 December 2024: 3rd Ohio MDL Settlement with Closure of MDL ($58.5M) November 2023: Ohio NRD Settlement Reached ($110M) Priorities for Resolving Remaining Legacy Matters Opt out water system claims that involve costs to abate or meet regulatory requirements Governmental-related claims, including regulatory agencies and State AGs (may arise in both regulatory process and litigation proceedings (state NRD matters)) Personal injury claims Property-related claims, primarily involving loss of value 1 2 3 4 July/August 2025: Hoosick Falls Settlement ($27M) NJ Settlement (~$500M NPV) Insurance Proceeds MOU June 2026: Announced Settlement with EPA/WVDEP: $22.5M civil penalty and $90M for site-specific mitigation projects over 15 years 22
III. FINANCIAL UPDATE
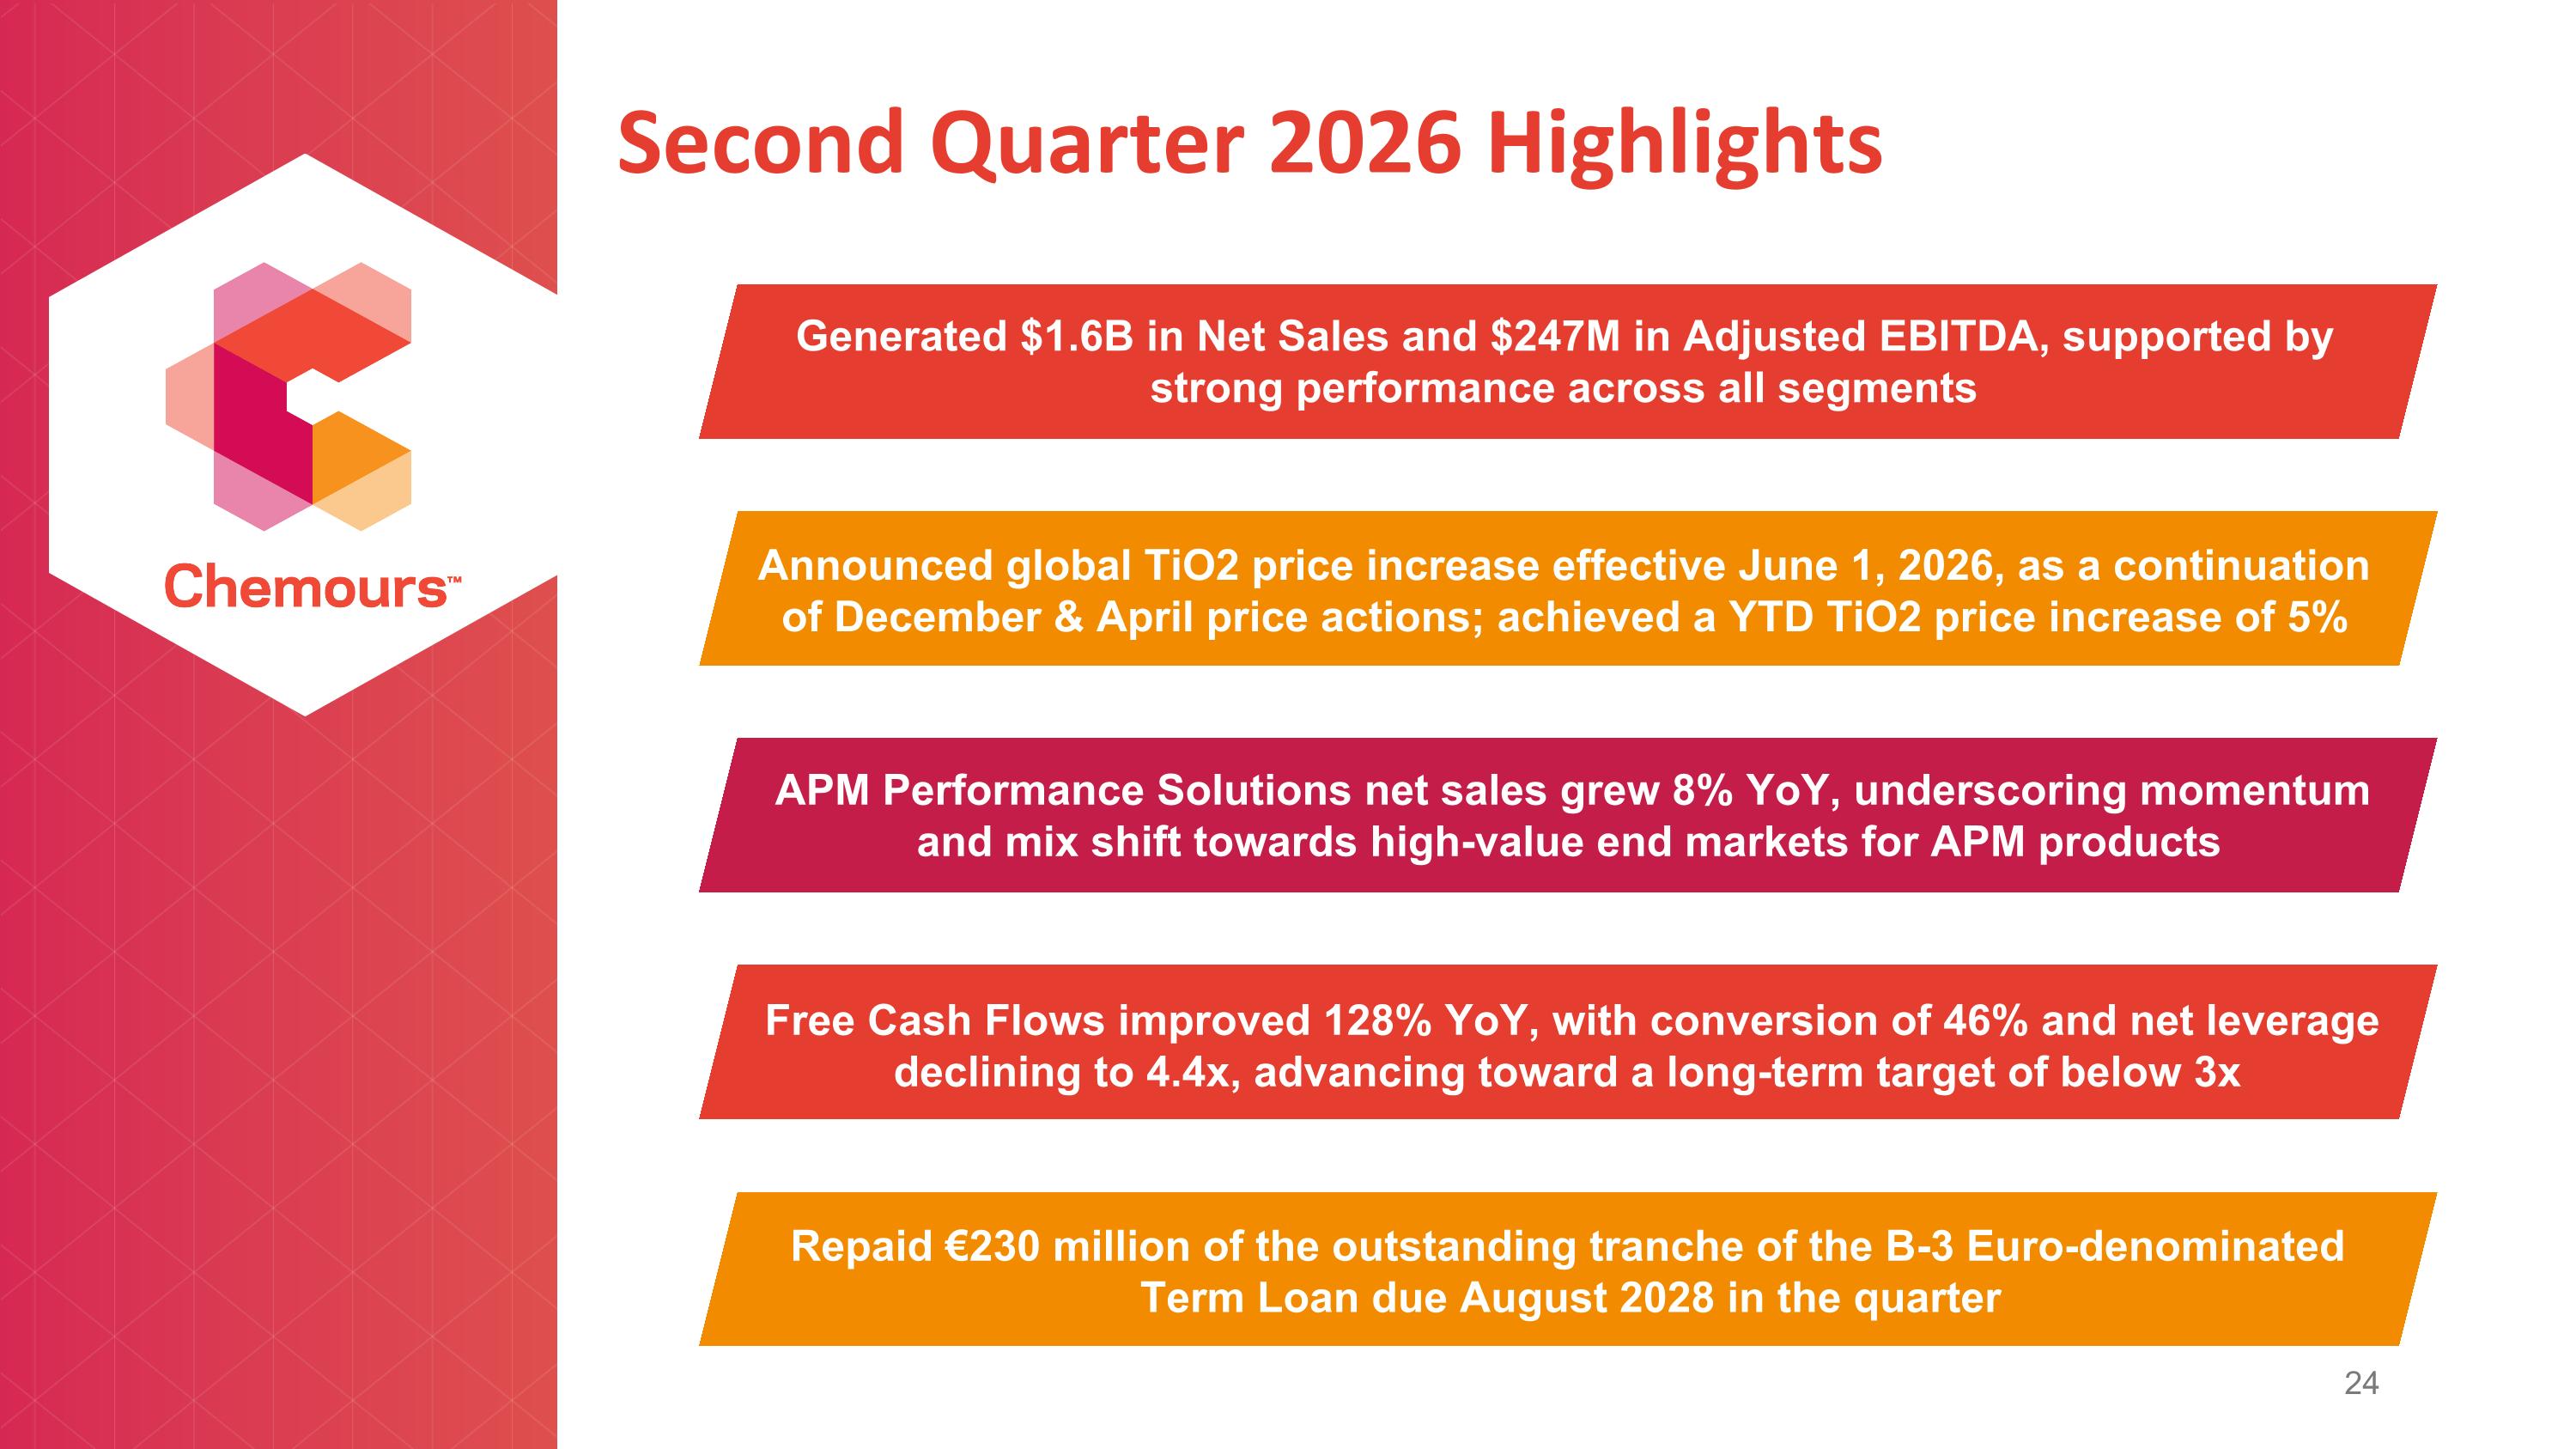
Second Quarter 2026 Highlights Generated $1.6B in Net Sales and $247M in Adjusted EBITDA, supported by strong performance across all segments Repaid €230 million of the outstanding tranche of the B-3 Euro-denominated Term Loan due August 2028 in the quarter APM Performance Solutions net sales grew 8% YoY, underscoring momentum and mix shift towards high-value end markets for APM products Announced global TiO2 price increase effective June 1, 2026, as a continuation of December & April price actions; achieved a YTD TiO2 price increase of 5% Free Cash Flows improved 128% YoY, with conversion of 46% and net leverage declining to 4.4x, advancing toward a long-term target of below 3x
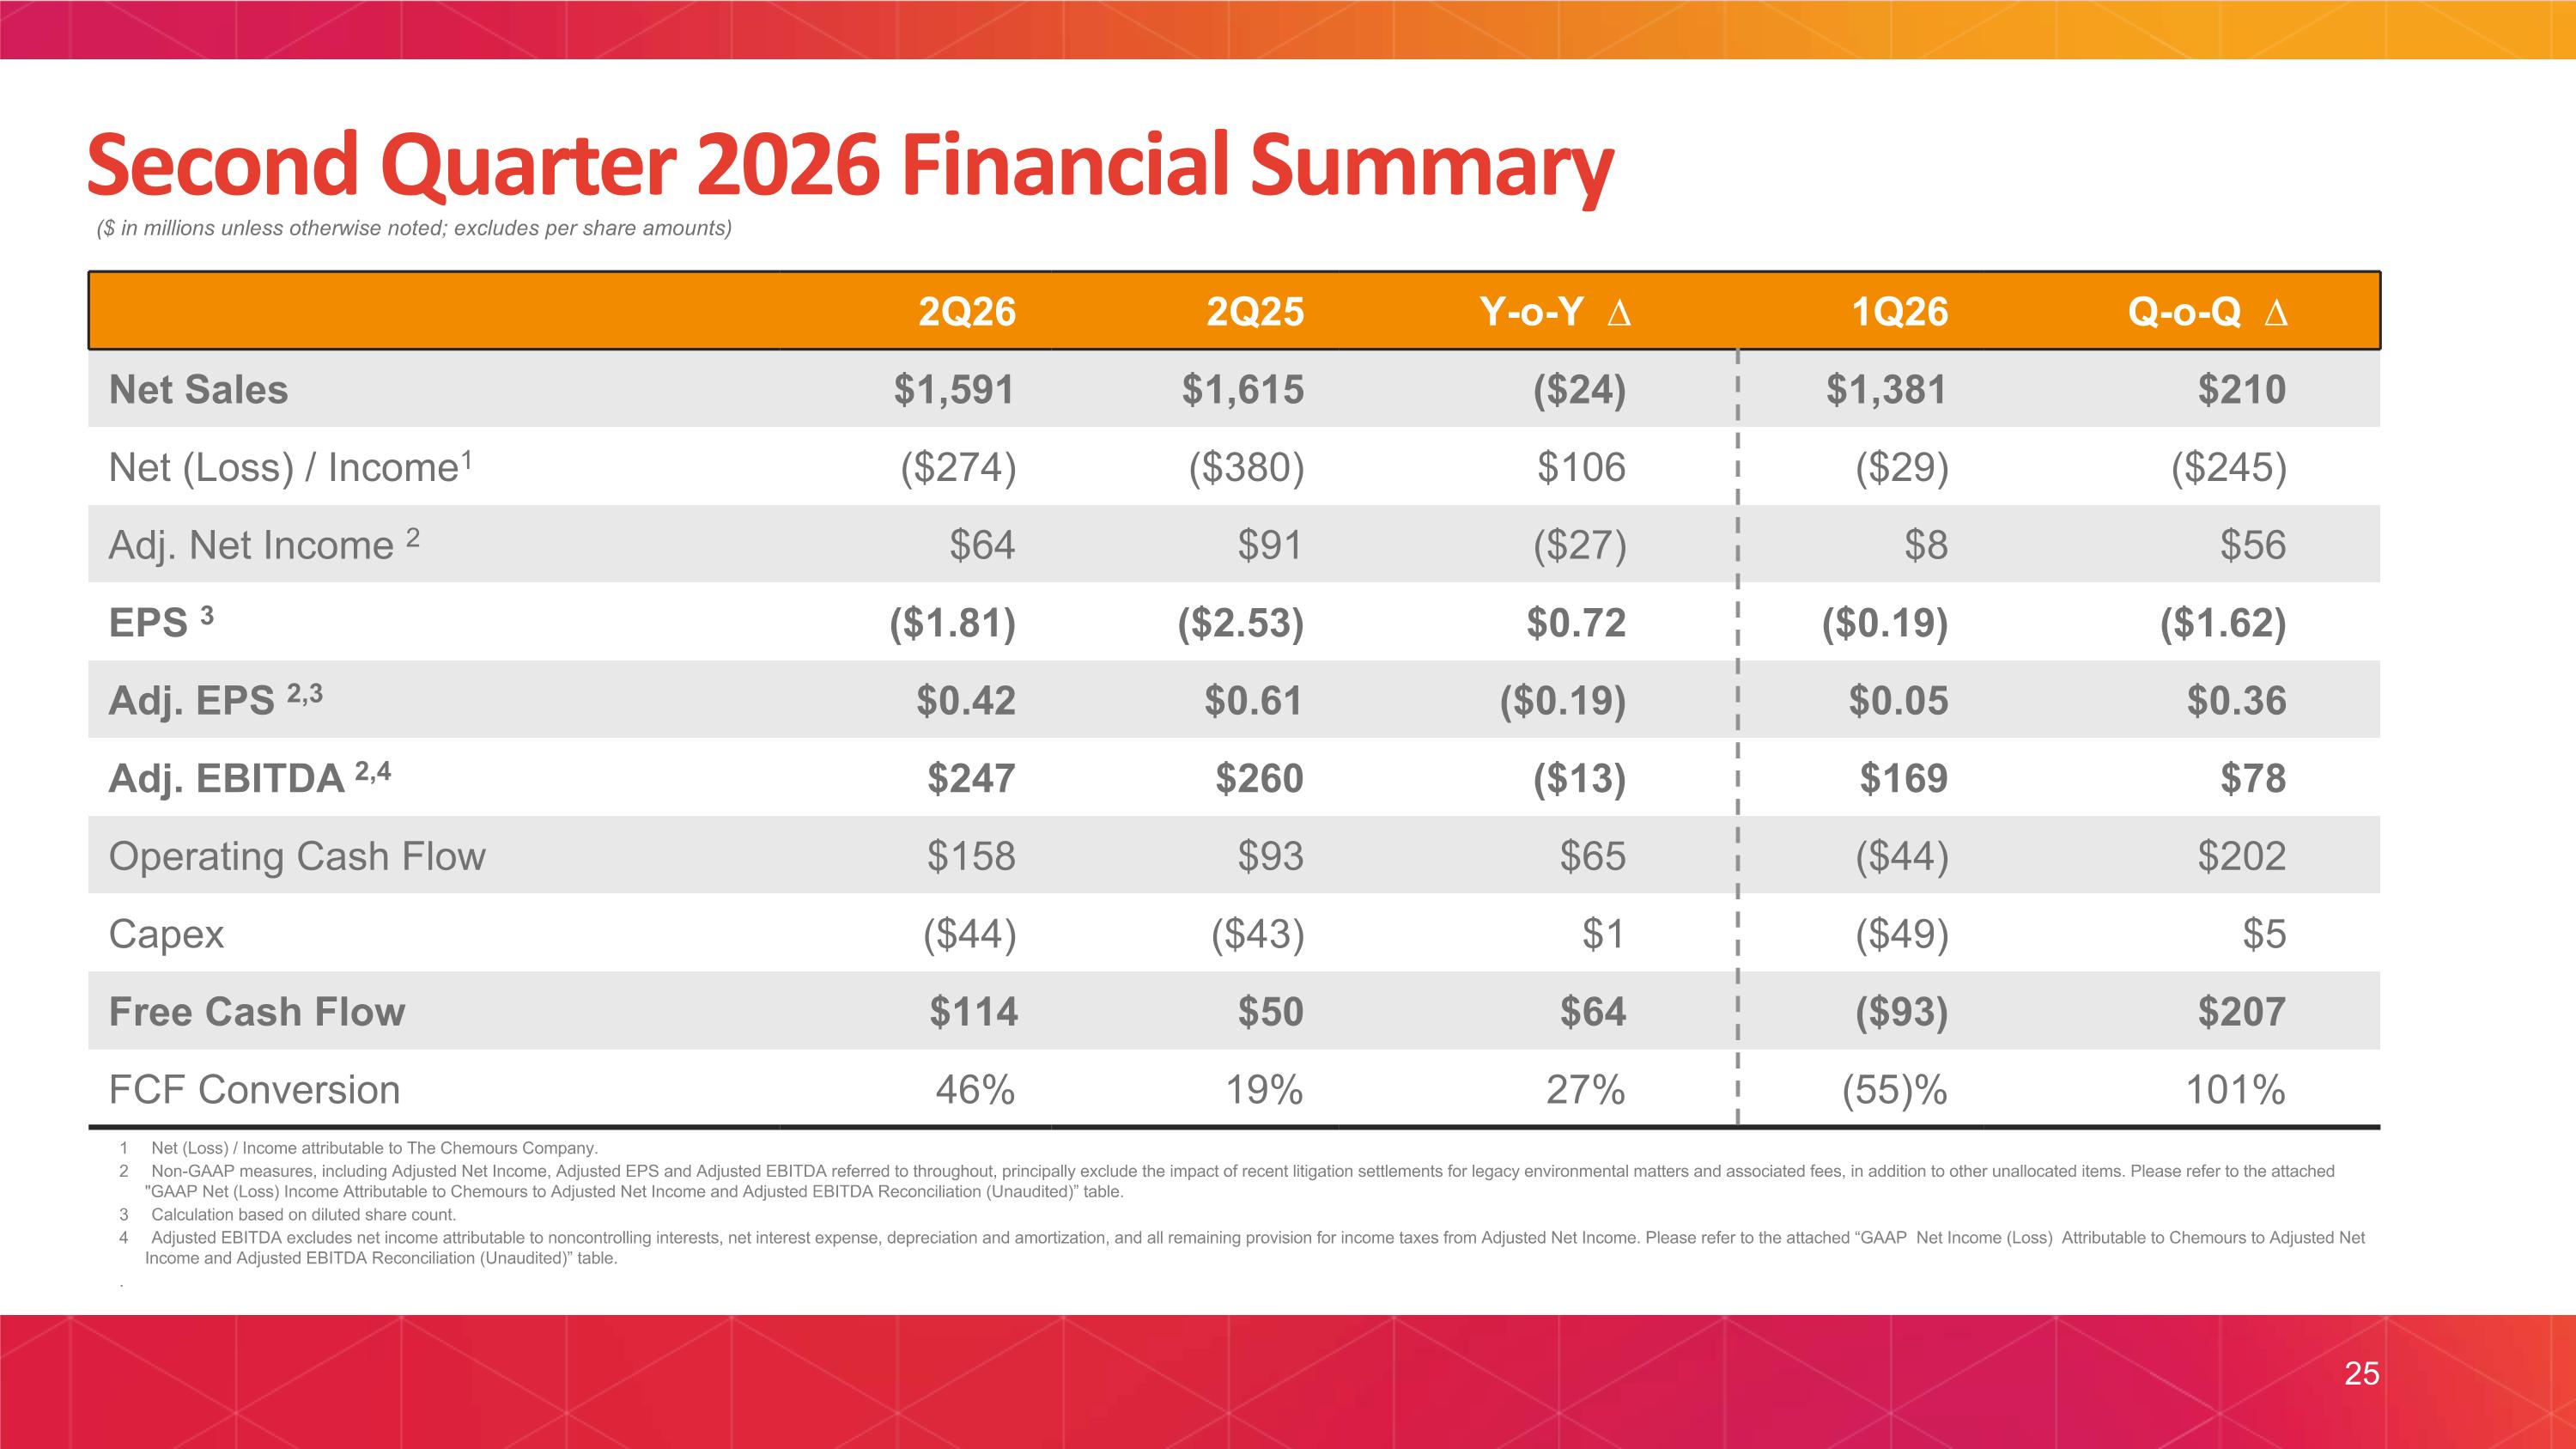
Second Quarter 2026 Financial Summary ($ in millions unless otherwise noted; excludes per share amounts) 2Q26 2Q25 Y-o-Y ∆ 1Q26 Q-o-Q ∆ Net Sales $1,591 $1,615 ($24) $1,381 $210 Net (Loss) / Income1 ($274) ($380) $106 ($29) ($245) Adj. Net Income 2 $64 $91 ($27) $8 $56 EPS 3 ($1.81) ($2.53) $0.72 ($0.19) ($1.62) Adj. EPS 2,3 $0.42 $0.61 ($0.19) $0.05 $0.36 Adj. EBITDA 2,4 $247 $260 ($13) $169 $78 Operating Cash Flow $158 $93 $65 ($44) $202 Capex ($44) ($43) $1 ($49) $5 Free Cash Flow $114 $50 $64 ($93) $207 FCF Conversion 46% 19% 27% (55)% 101% 1 Net (Loss) / Income attributable to The Chemours Company. 2 Non-GAAP measures, including Adjusted Net Income, Adjusted EPS and Adjusted EBITDA referred to throughout, principally exclude the impact of recent litigation settlements for legacy environmental matters and associated fees, in addition to other unallocated items. Please refer to the attached "GAAP Net (Loss) Income Attributable to Chemours to Adjusted Net Income and Adjusted EBITDA Reconciliation (Unaudited)” table. 3 Calculation based on diluted share count. 4 Adjusted EBITDA excludes net income attributable to noncontrolling interests, net interest expense, depreciation and amortization, and all remaining provision for income taxes from Adjusted Net Income. Please refer to the attached “GAAP Net Income (Loss) Attributable to Chemours to Adjusted Net Income and Adjusted EBITDA Reconciliation (Unaudited)” table. . 25
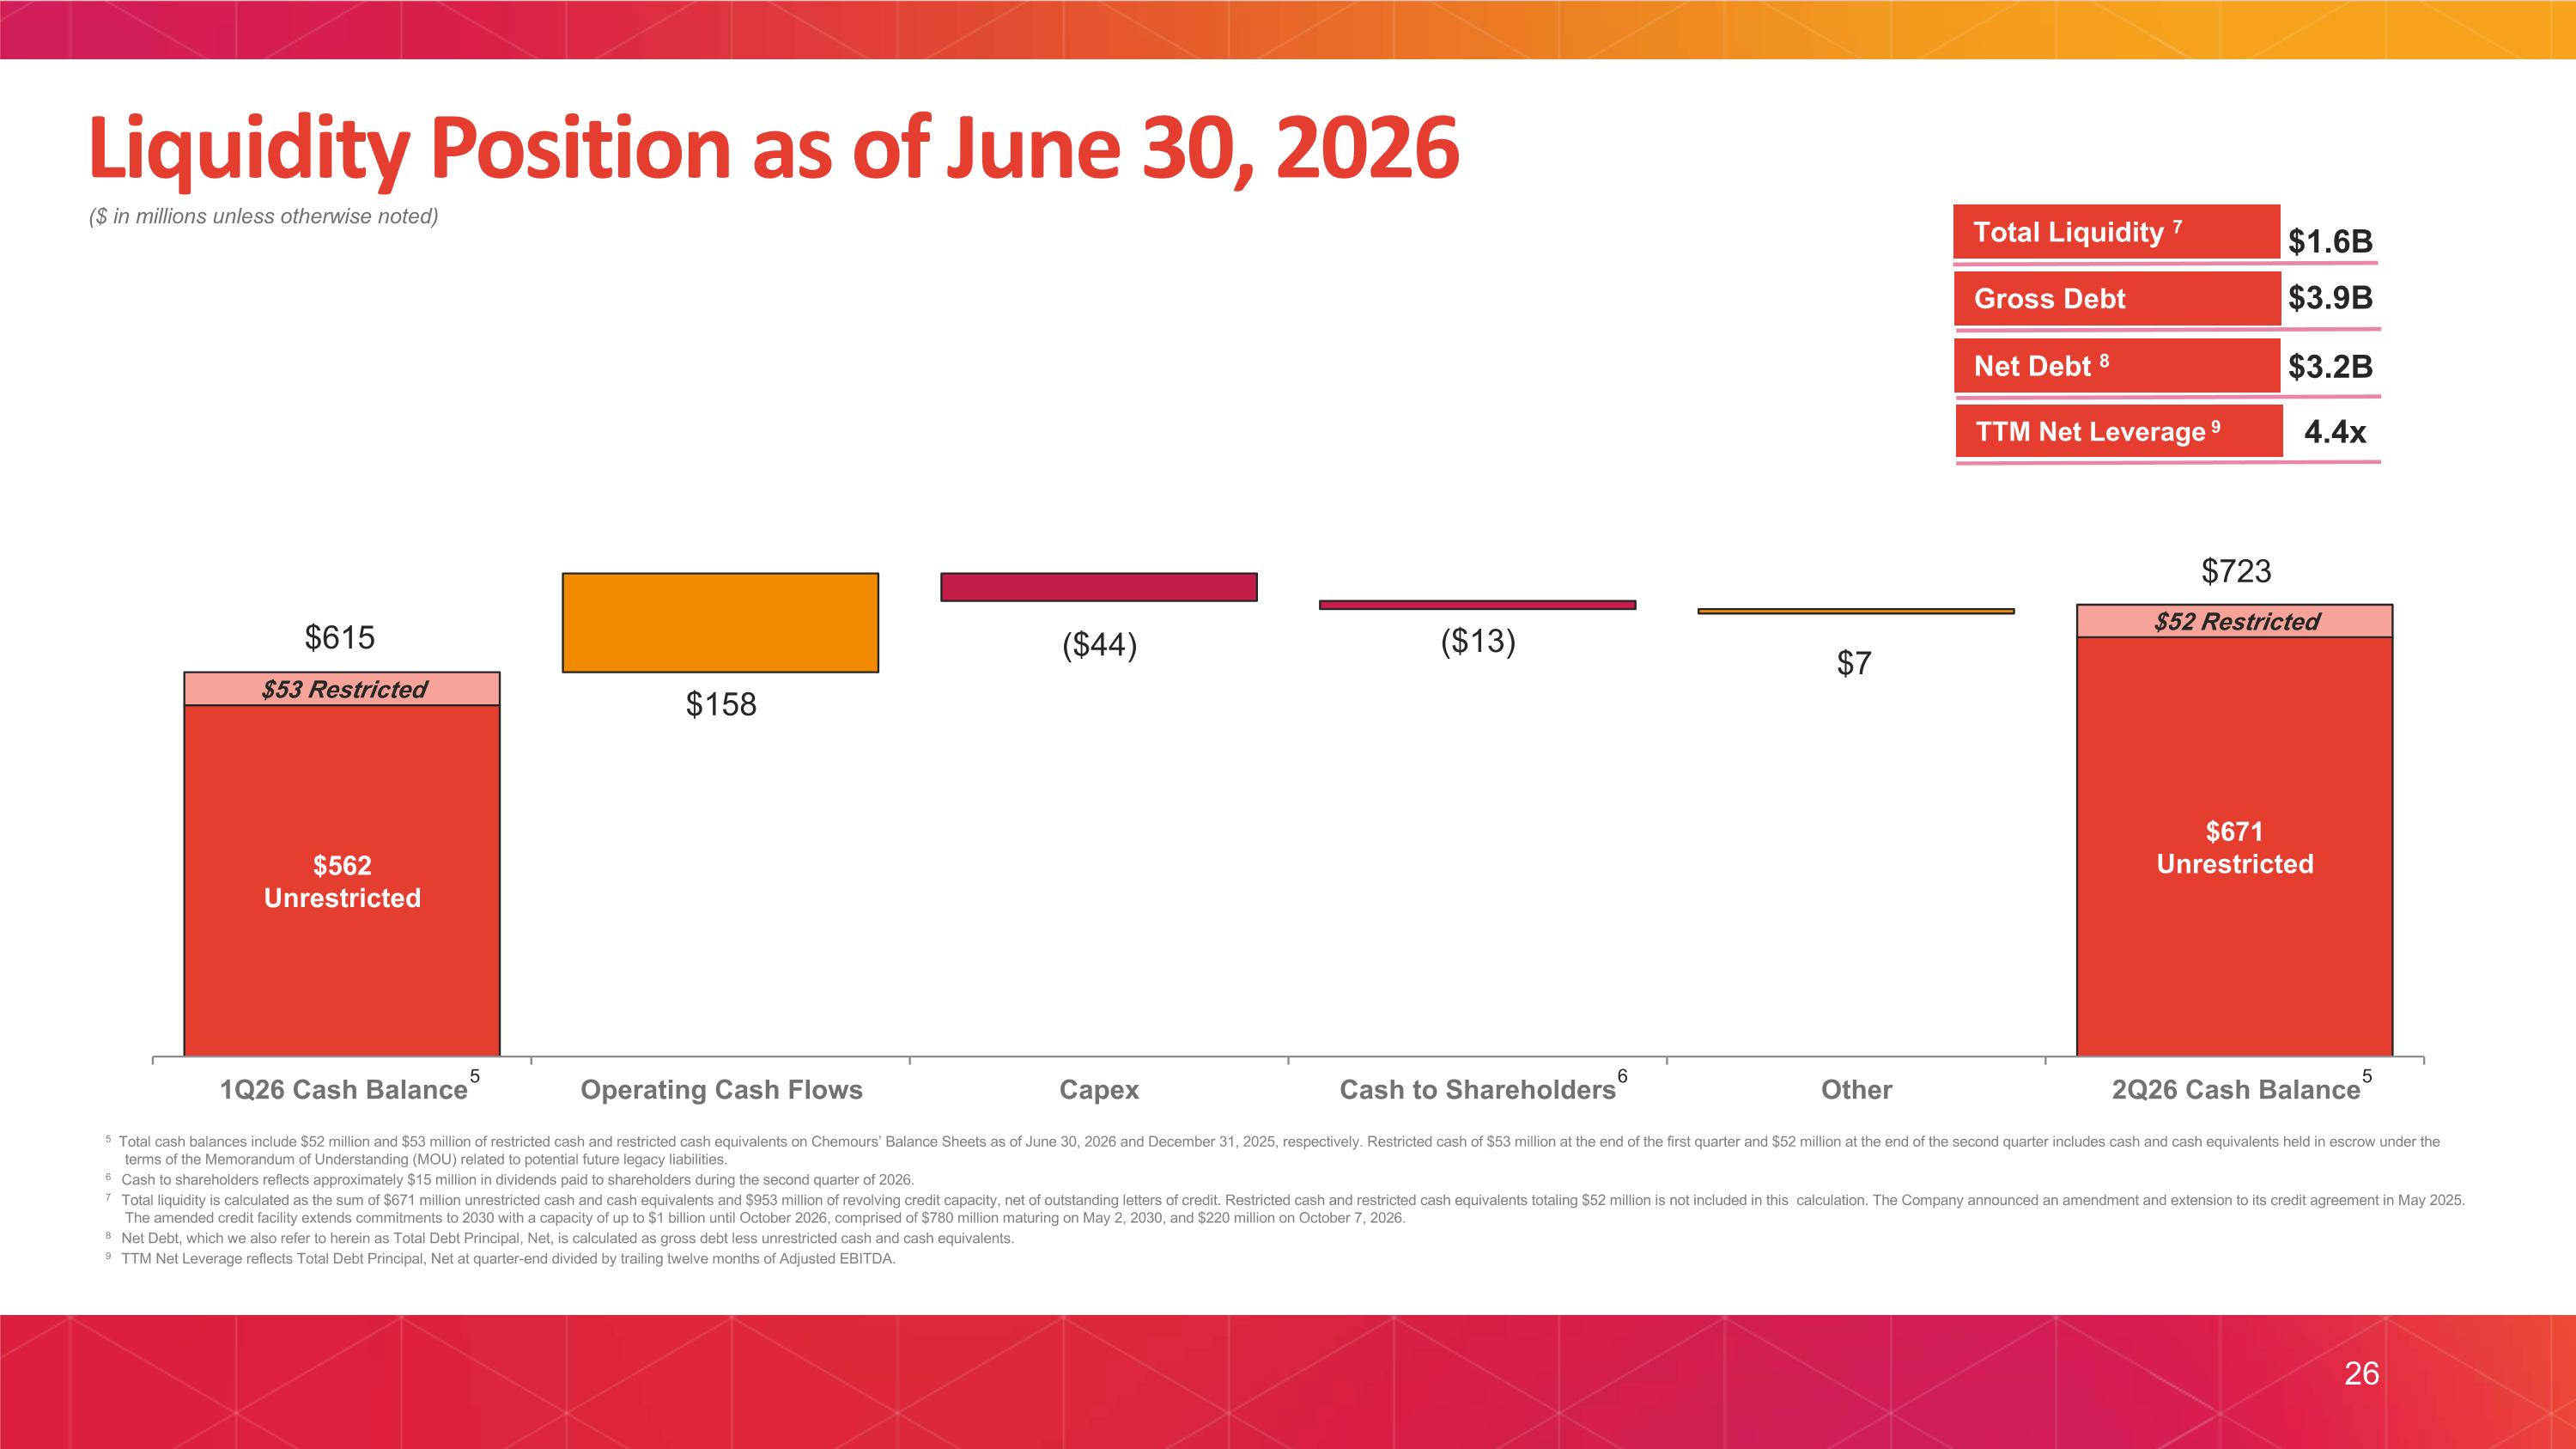
Liquidity Position as of June 30, 2026 ($ in millions unless otherwise noted) 5 $3.9B $3.2B 4.4x Gross Debt TTM Net Leverage 9 Net Debt 8 $1.6B Total Liquidity 7 5 6 5 Total cash balances include $52 million and $53 million of restricted cash and restricted cash equivalents on Chemours’ Balance Sheets as of June 30, 2026 and December 31, 2025, respectively. Restricted cash of $53 million at the end of the first quarter and $52 million at the end of the second quarter includes cash and cash equivalents held in escrow under the terms of the Memorandum of Understanding (MOU) related to potential future legacy liabilities. 6 Cash to shareholders reflects approximately $15 million in dividends paid to shareholders during the second quarter of 2026. 7 Total liquidity is calculated as the sum of $671 million unrestricted cash and cash equivalents and $953 million of revolving credit capacity, net of outstanding letters of credit. Restricted cash and restricted cash equivalents totaling $52 million is not included in this calculation. The Company announced an amendment and extension to its credit agreement in May 2025. The amended credit facility extends commitments to 2030 with a capacity of up to $1 billion until October 2026, comprised of $780 million maturing on May 2, 2030, and $220 million on October 7, 2026. 8 Net Debt, which we also refer to herein as Total Debt Principal, Net, is calculated as gross debt less unrestricted cash and cash equivalents. 9 TTM Net Leverage reflects Total Debt Principal, Net at quarter-end divided by trailing twelve months of Adjusted EBITDA. $615 $723 26

IV. APPENDIX
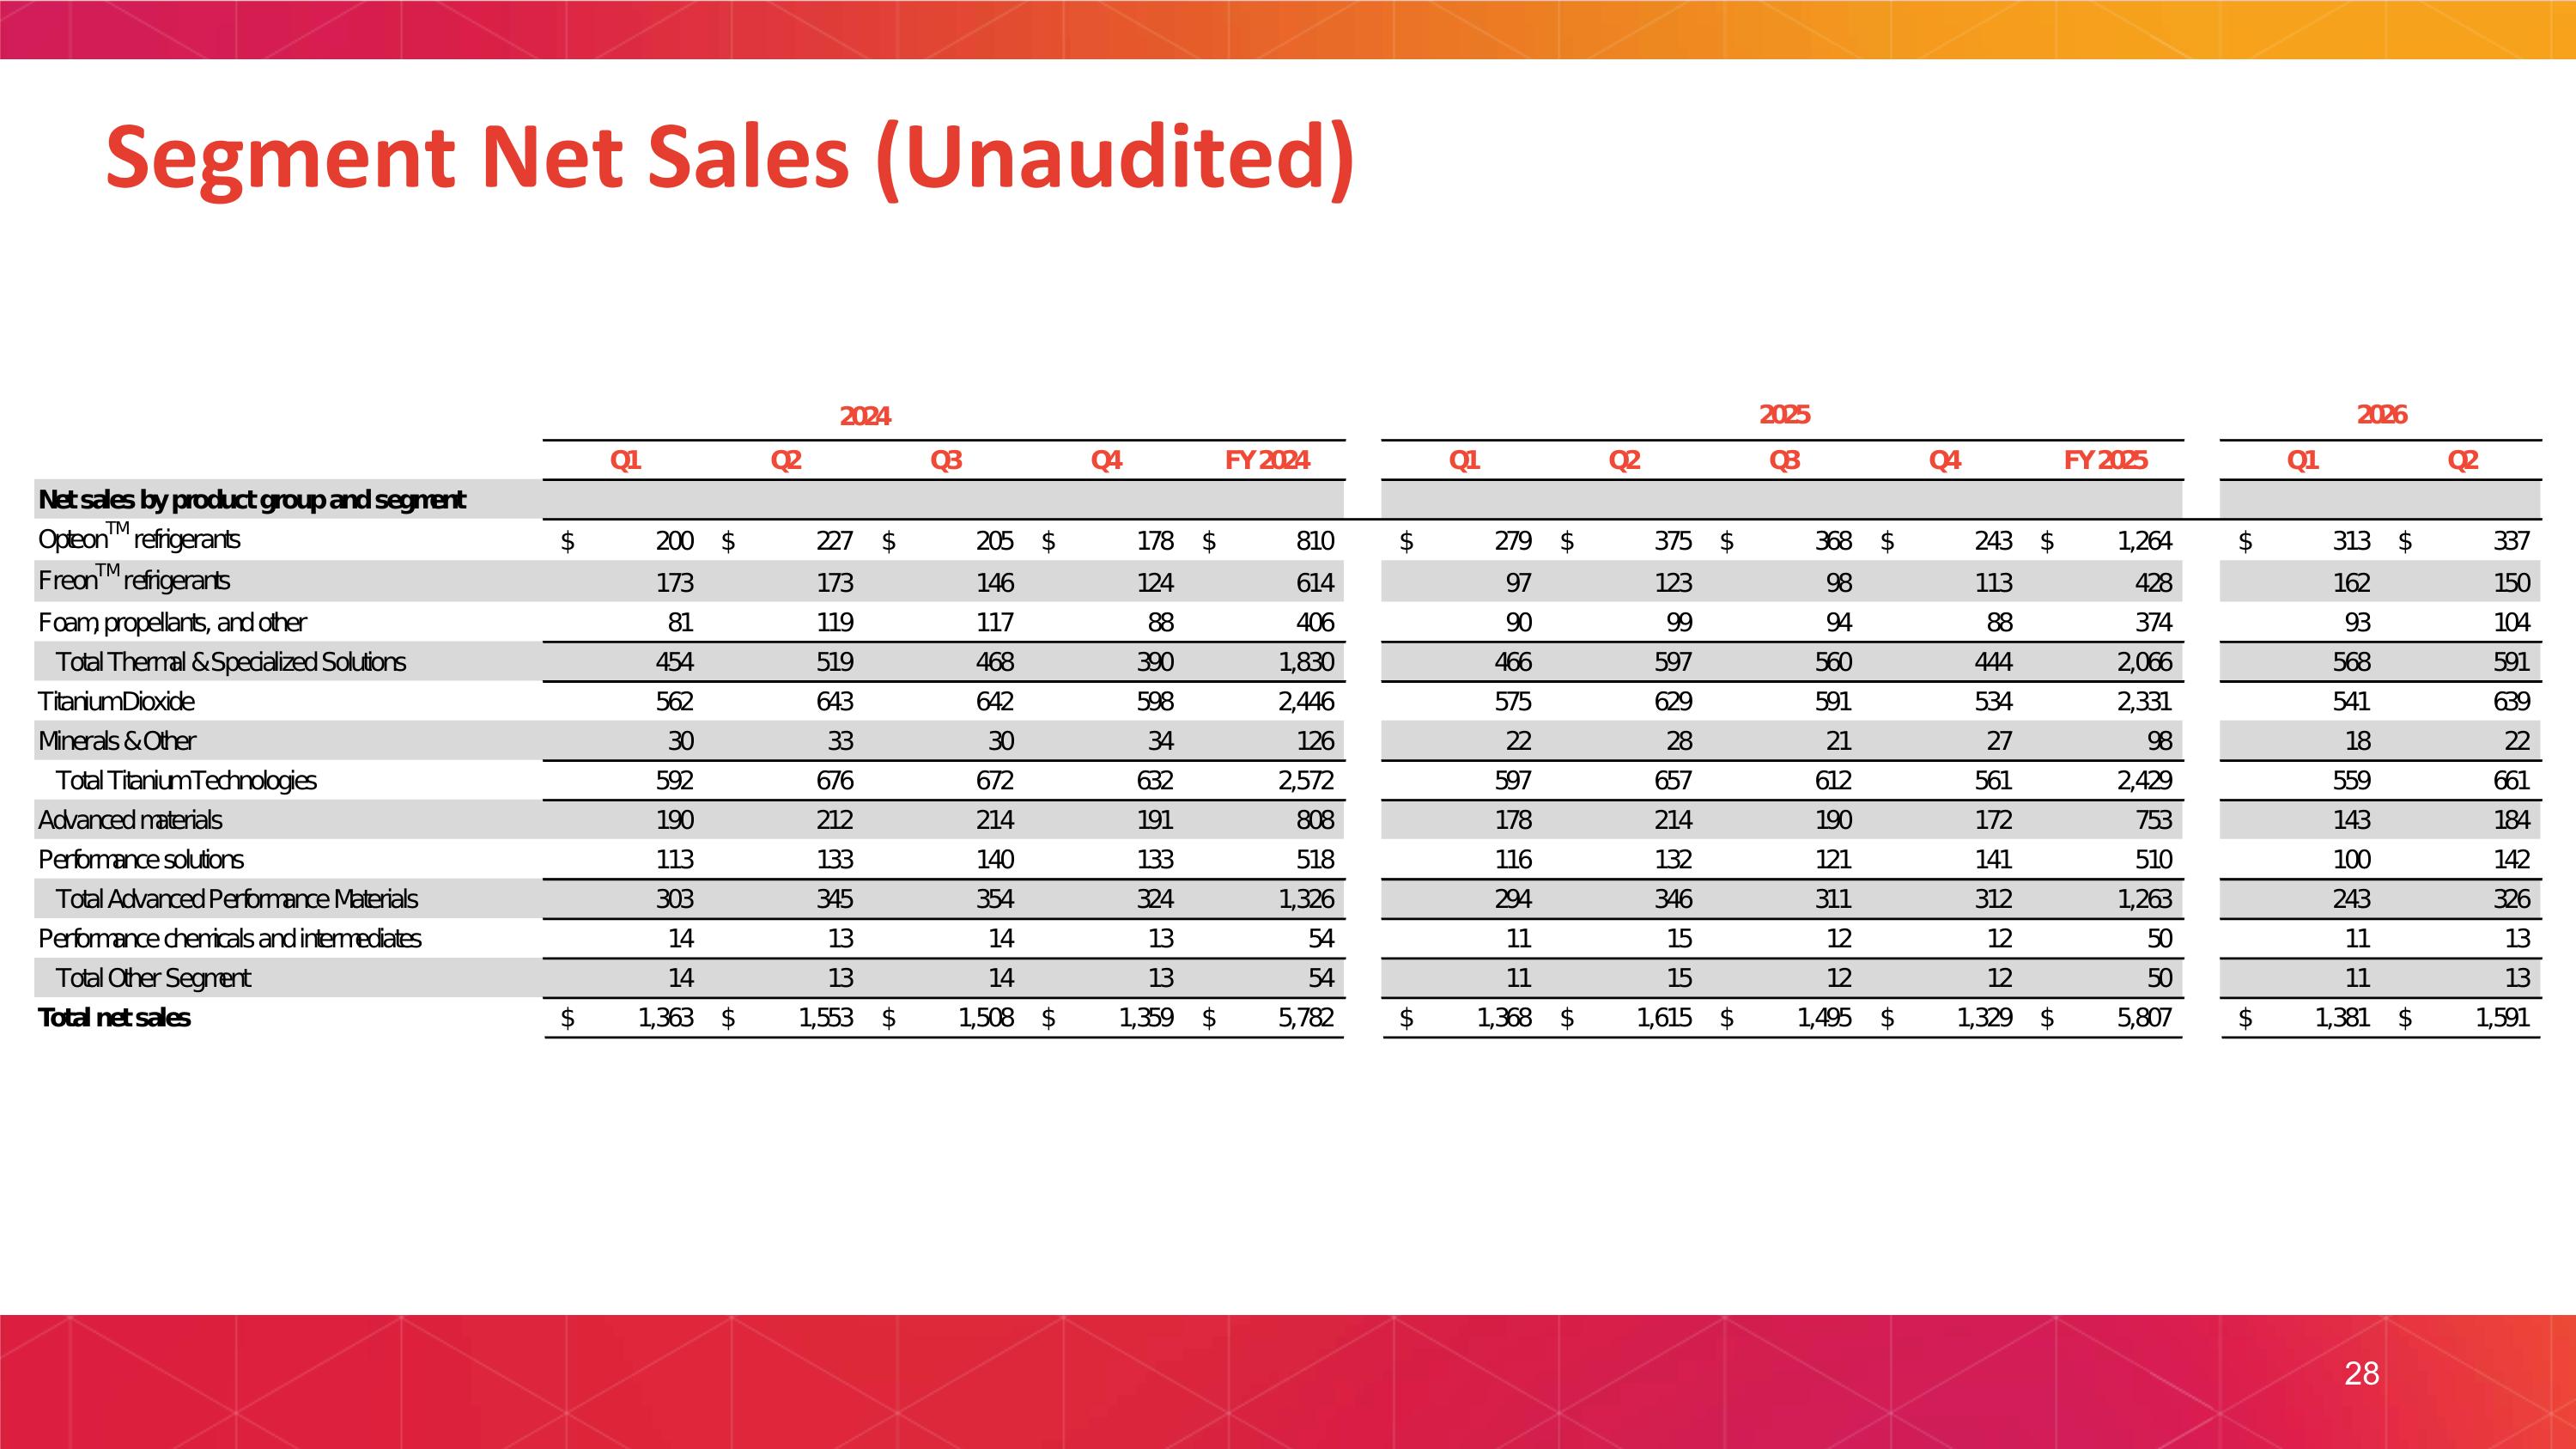
Segment Net Sales (Unaudited) 28
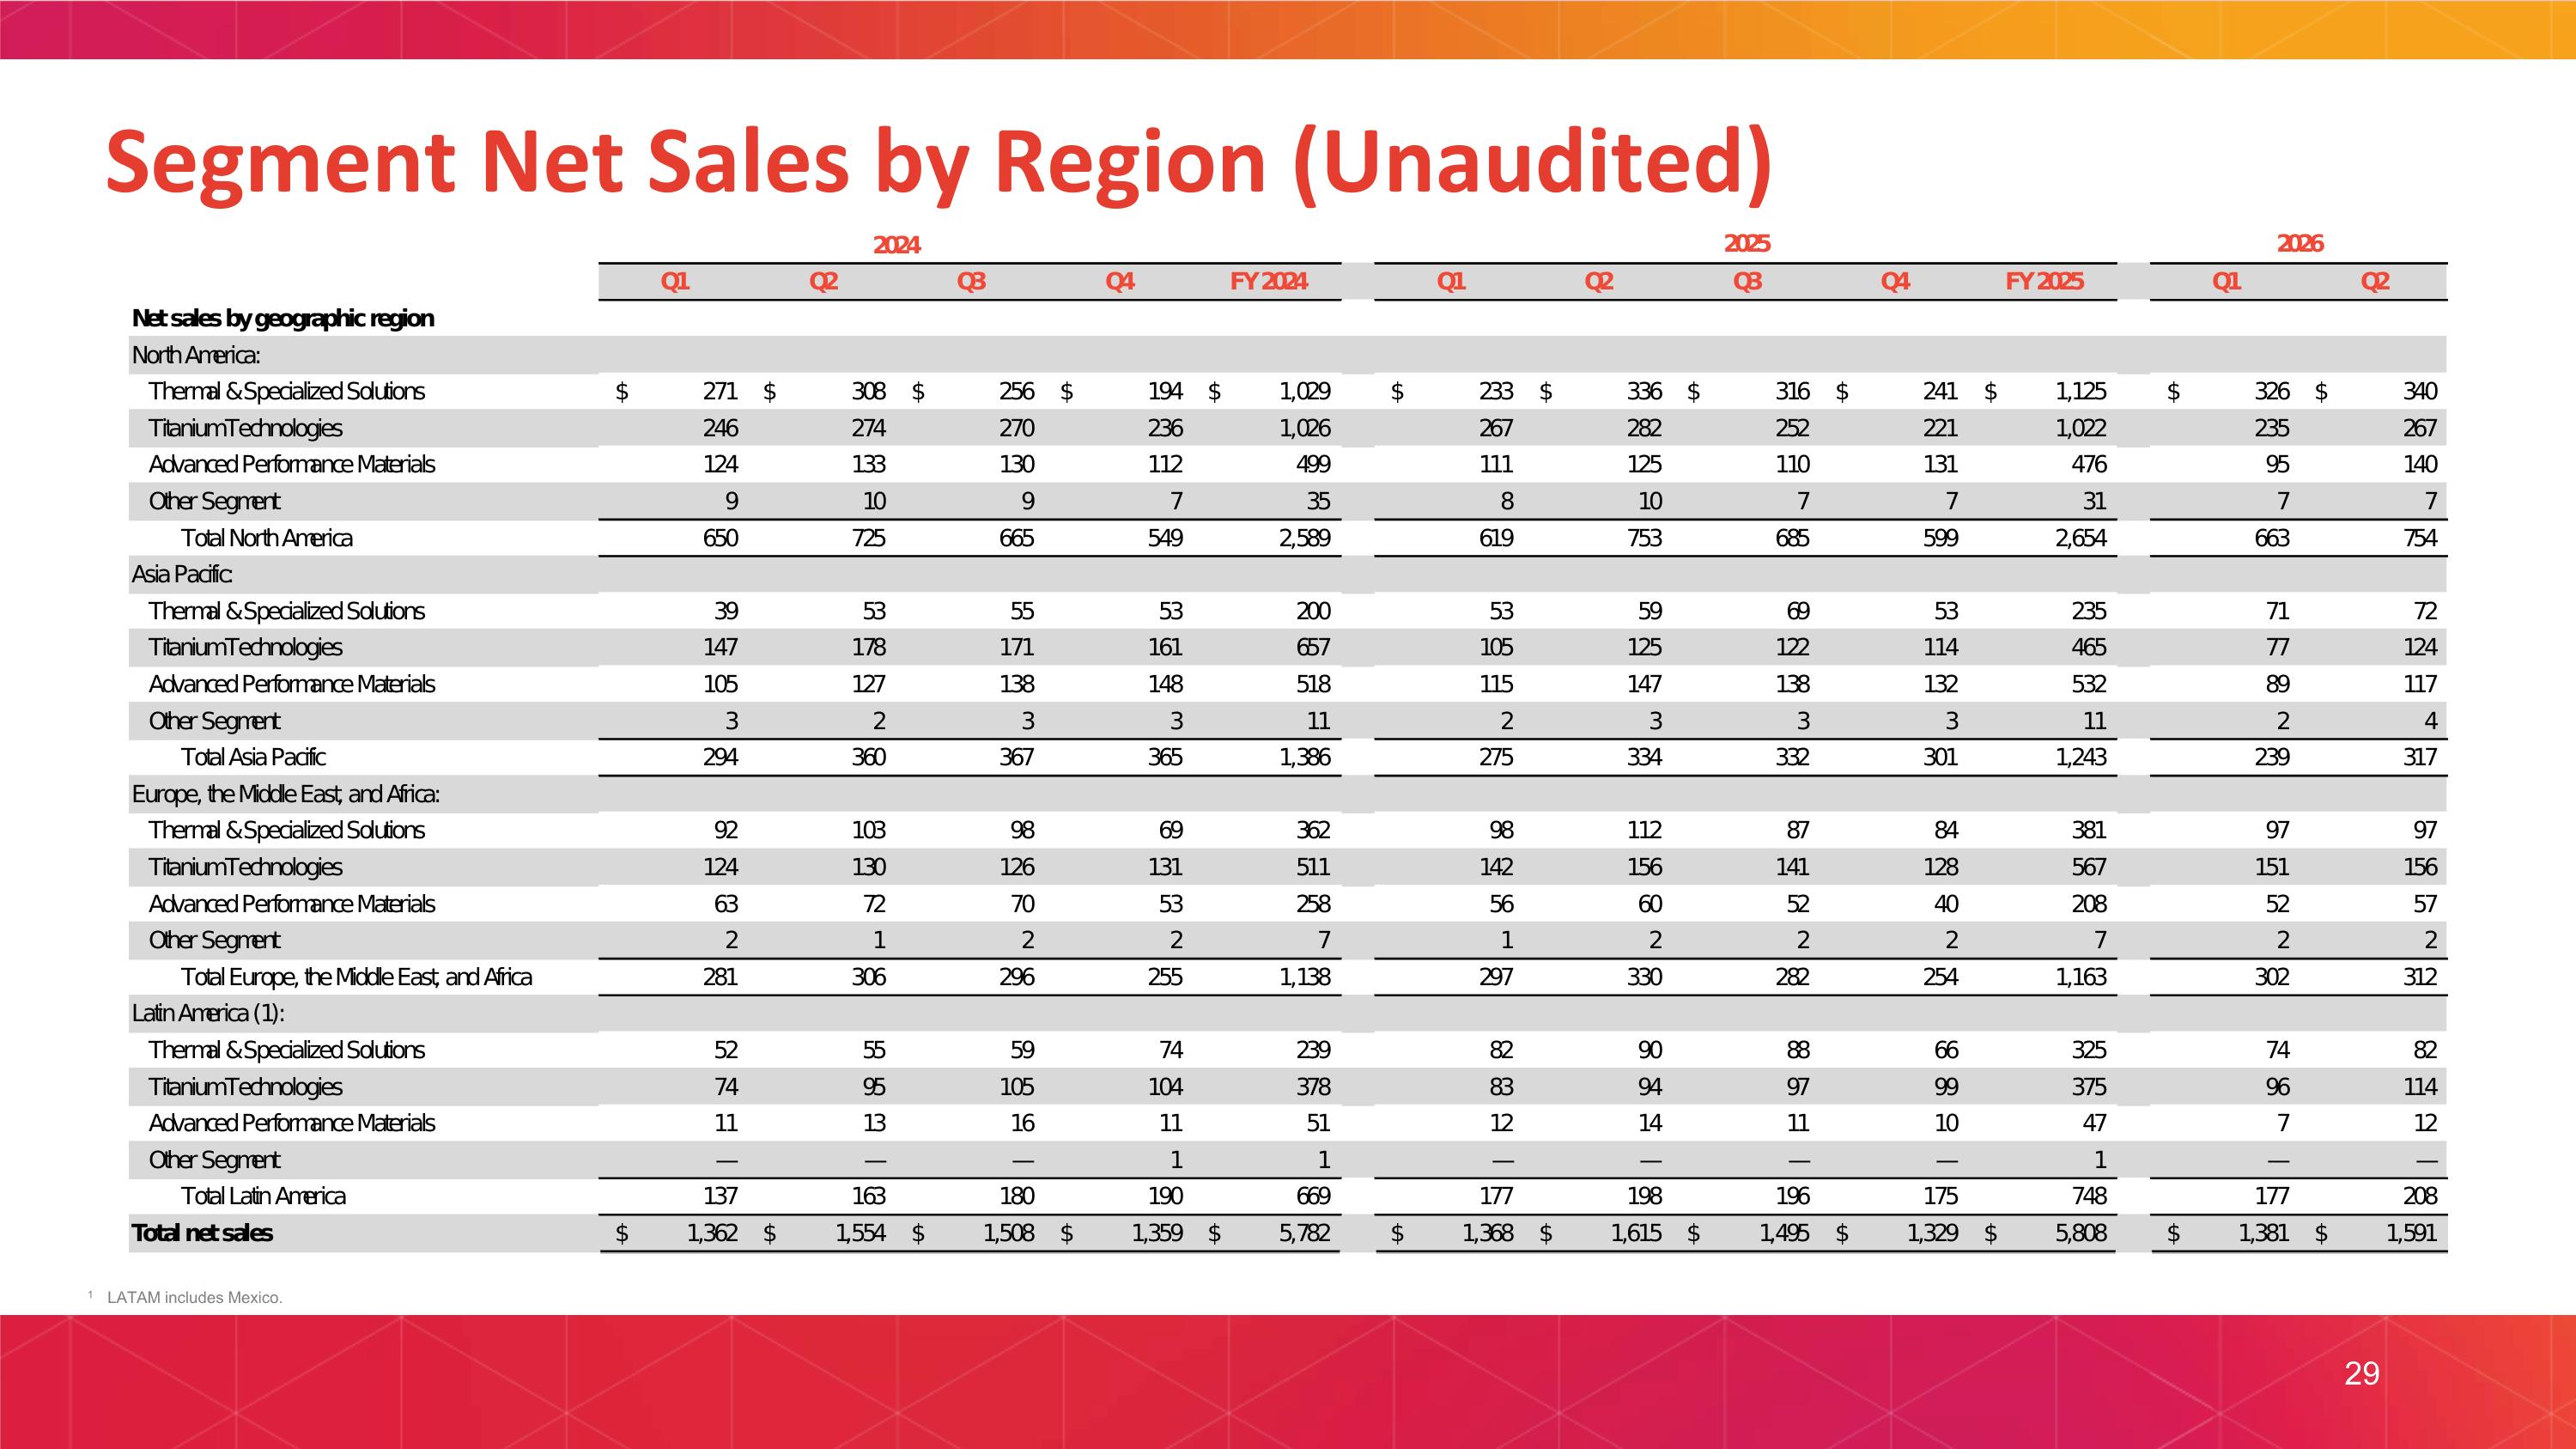
Segment Net Sales by Region (Unaudited) 1 LATAM includes Mexico. 29
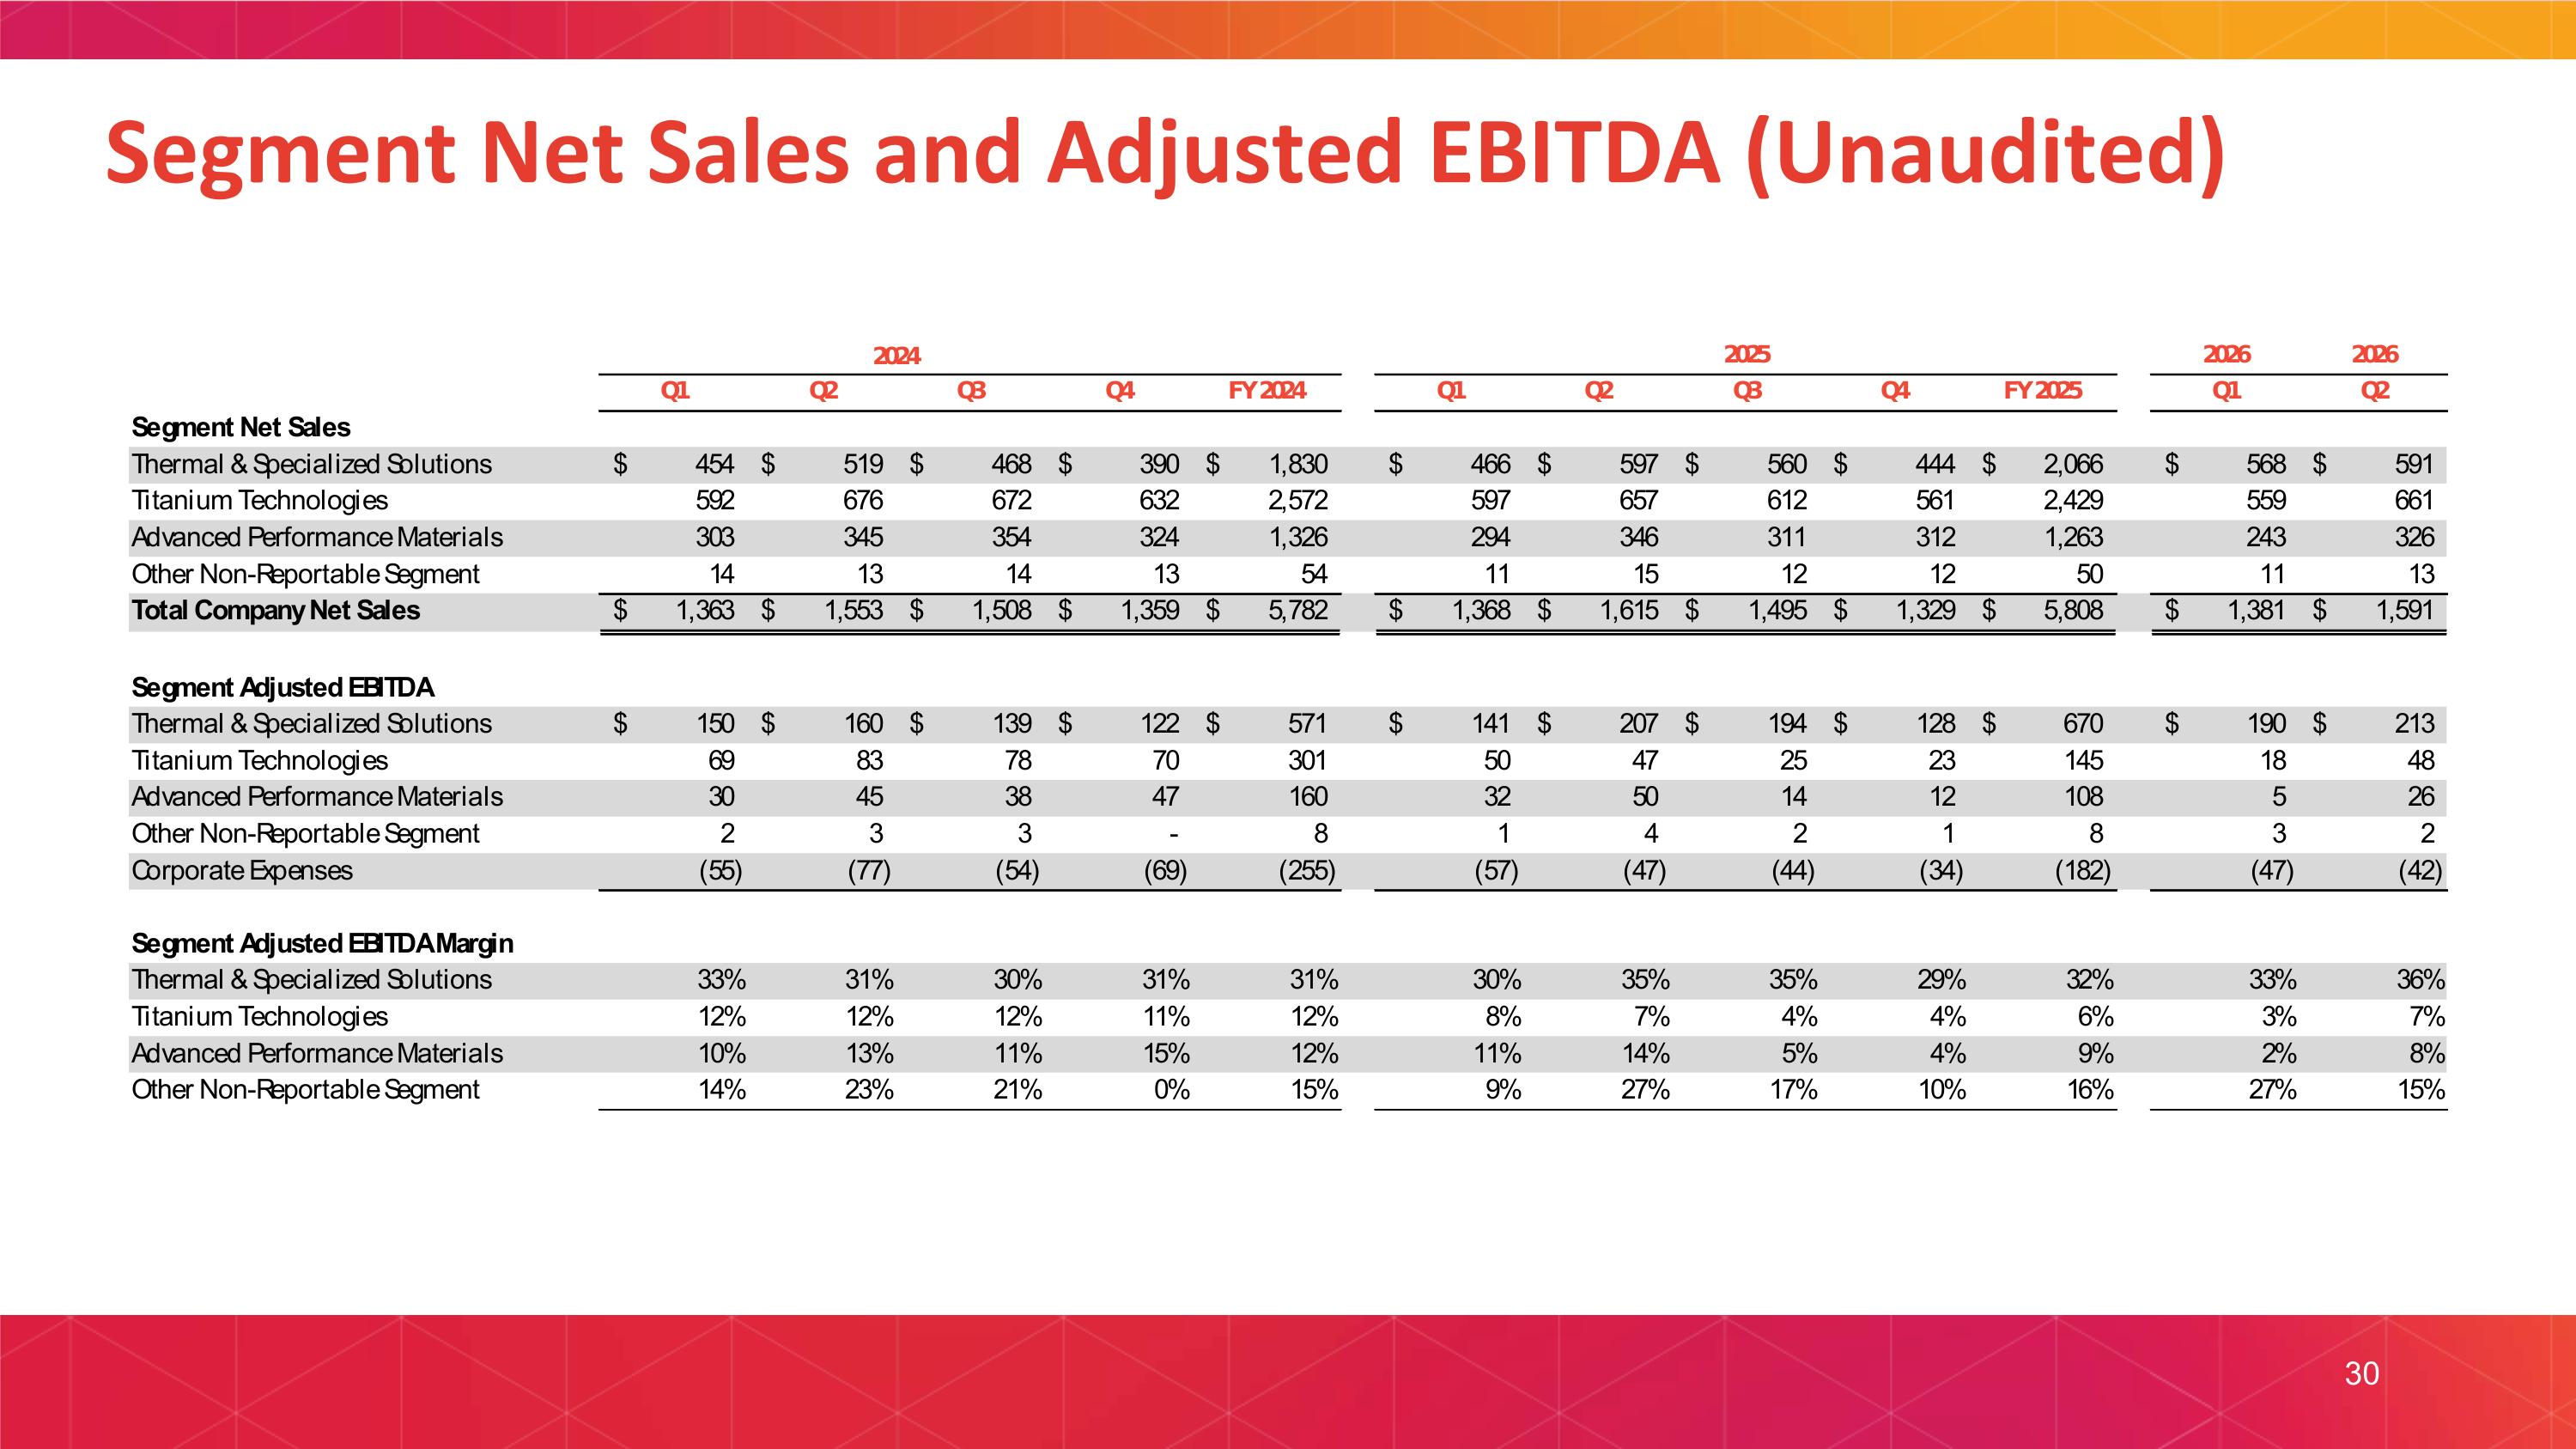
Segment Net Sales and Adjusted EBITDA (Unaudited) 30
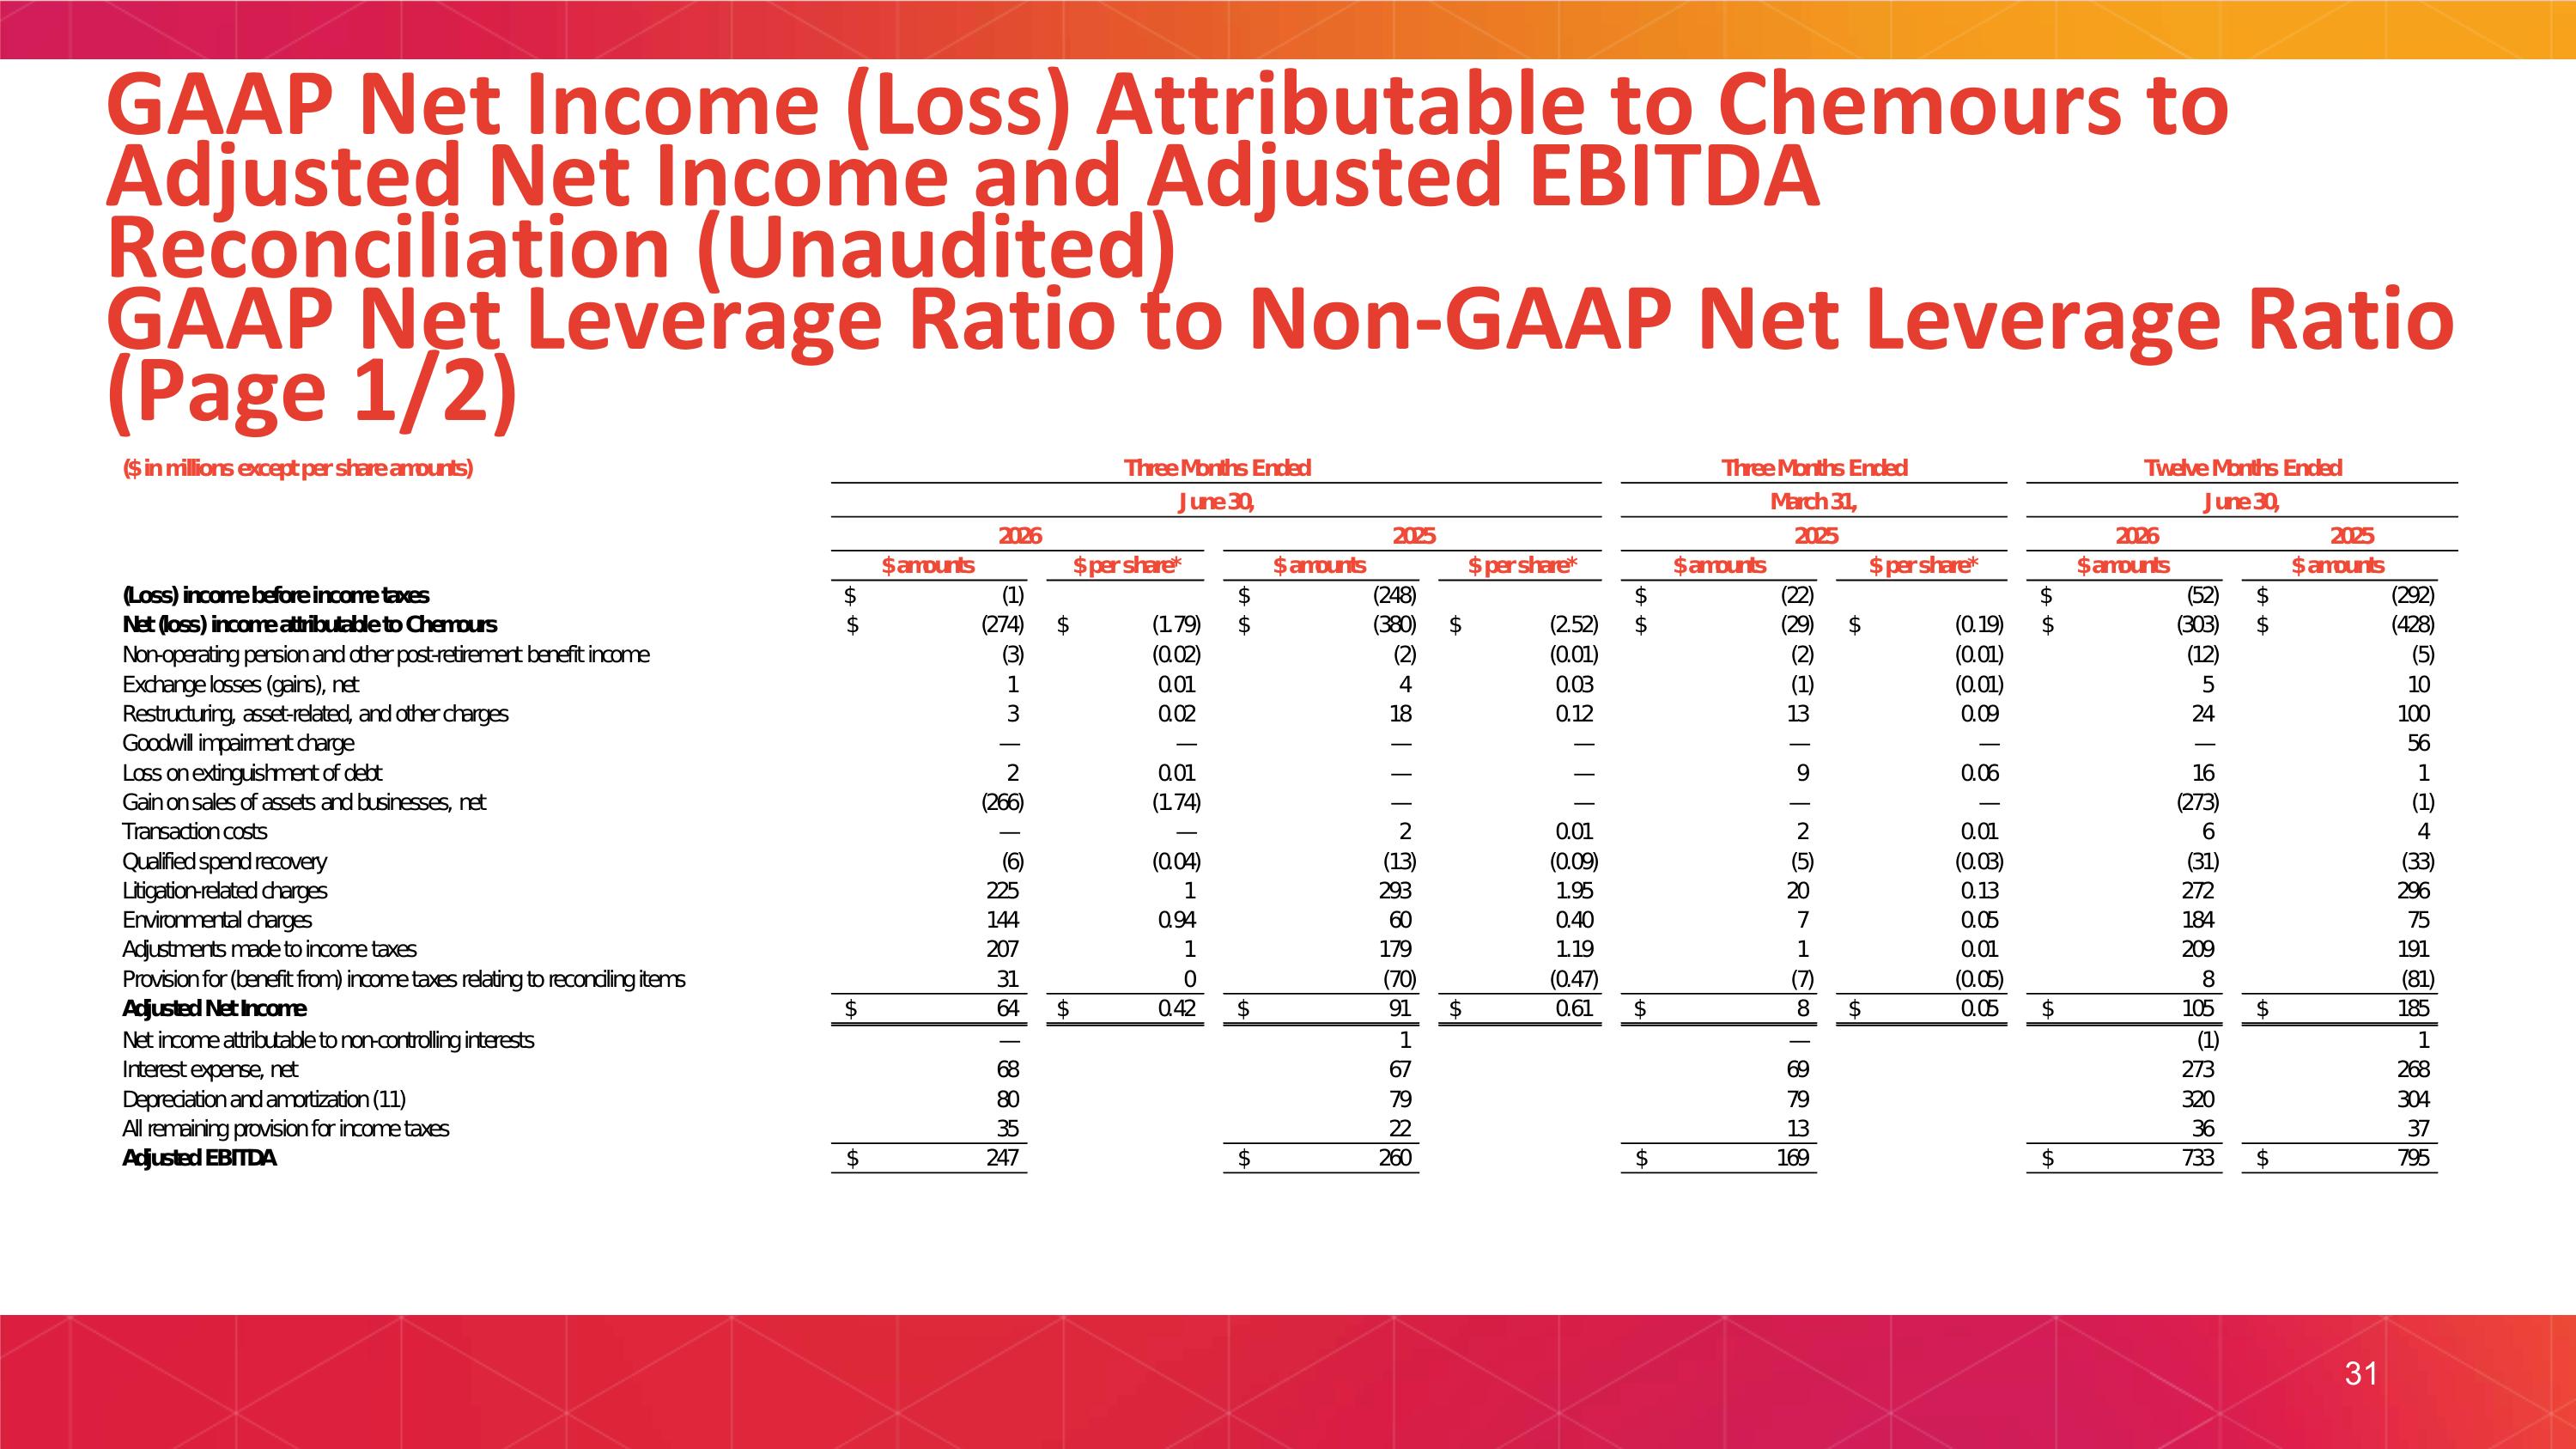
GAAP Net Income (Loss) Attributable to Chemours to Adjusted Net Income and Adjusted EBITDA Reconciliation (Unaudited) GAAP Net Leverage Ratio to Non-GAAP Net Leverage Ratio (Page 1/2) 31
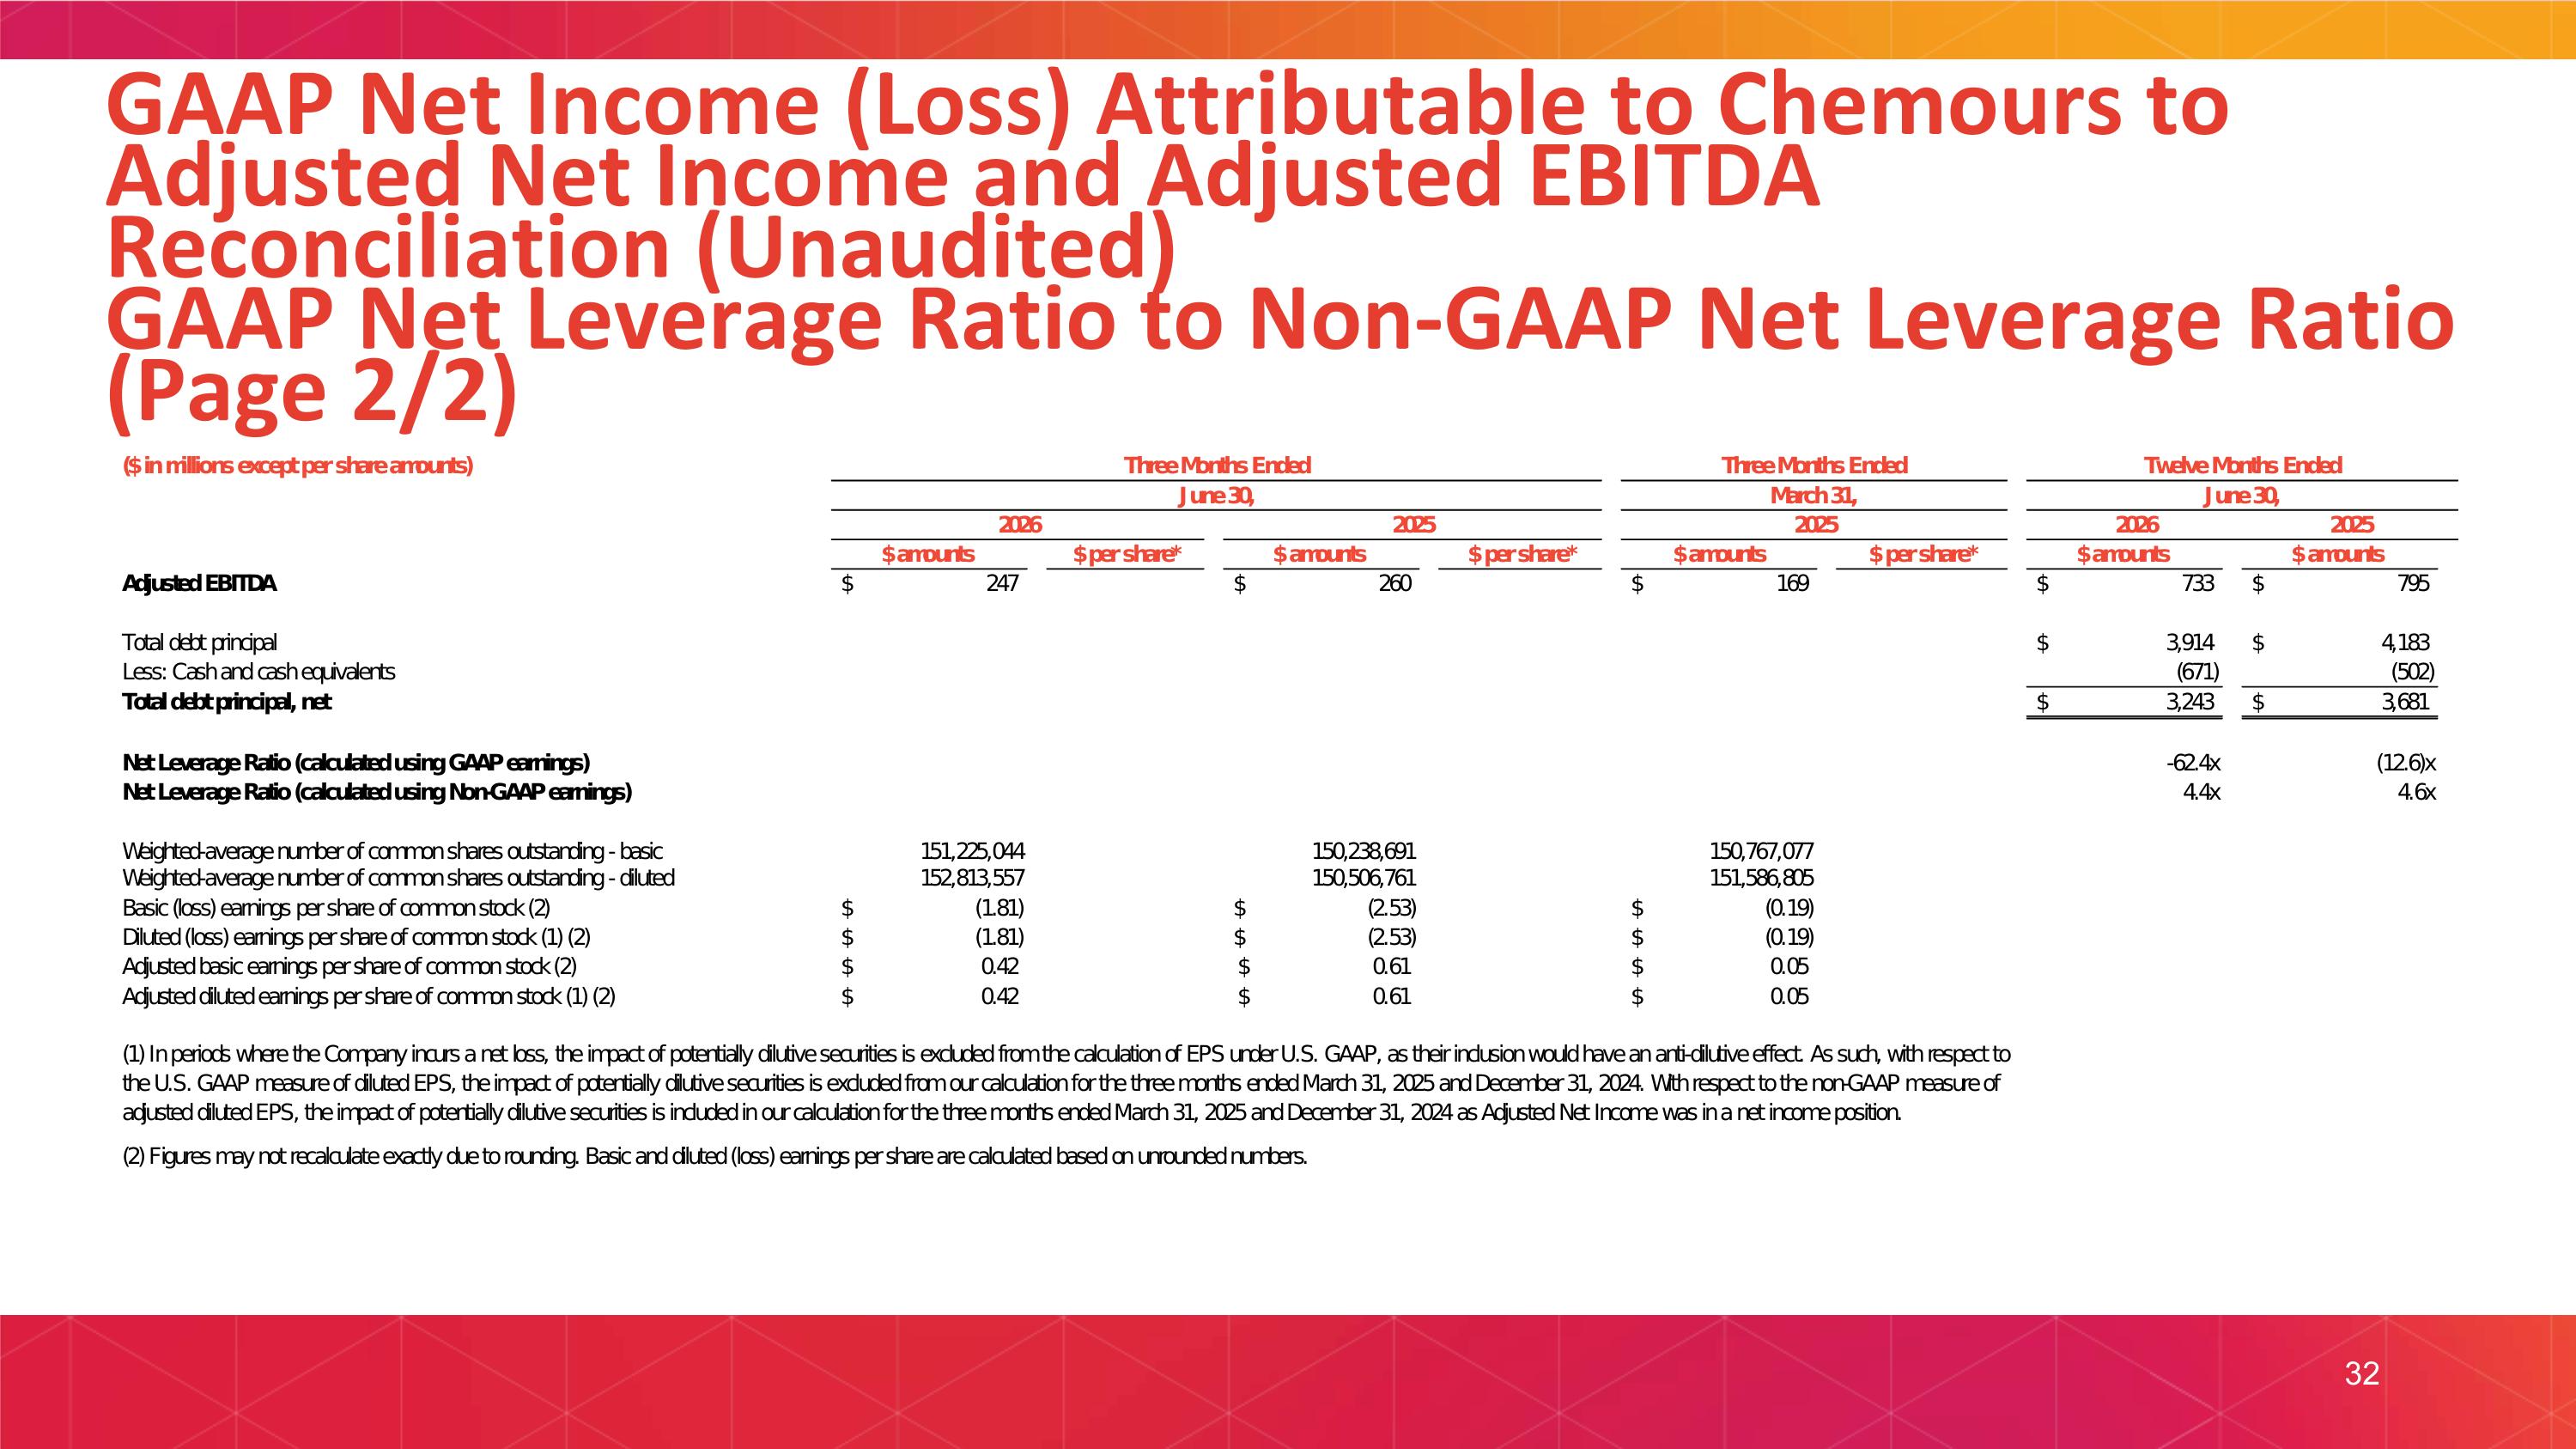
GAAP Net Income (Loss) Attributable to Chemours to Adjusted Net Income and Adjusted EBITDA Reconciliation (Unaudited) GAAP Net Leverage Ratio to Non-GAAP Net Leverage Ratio (Page 2/2) 32
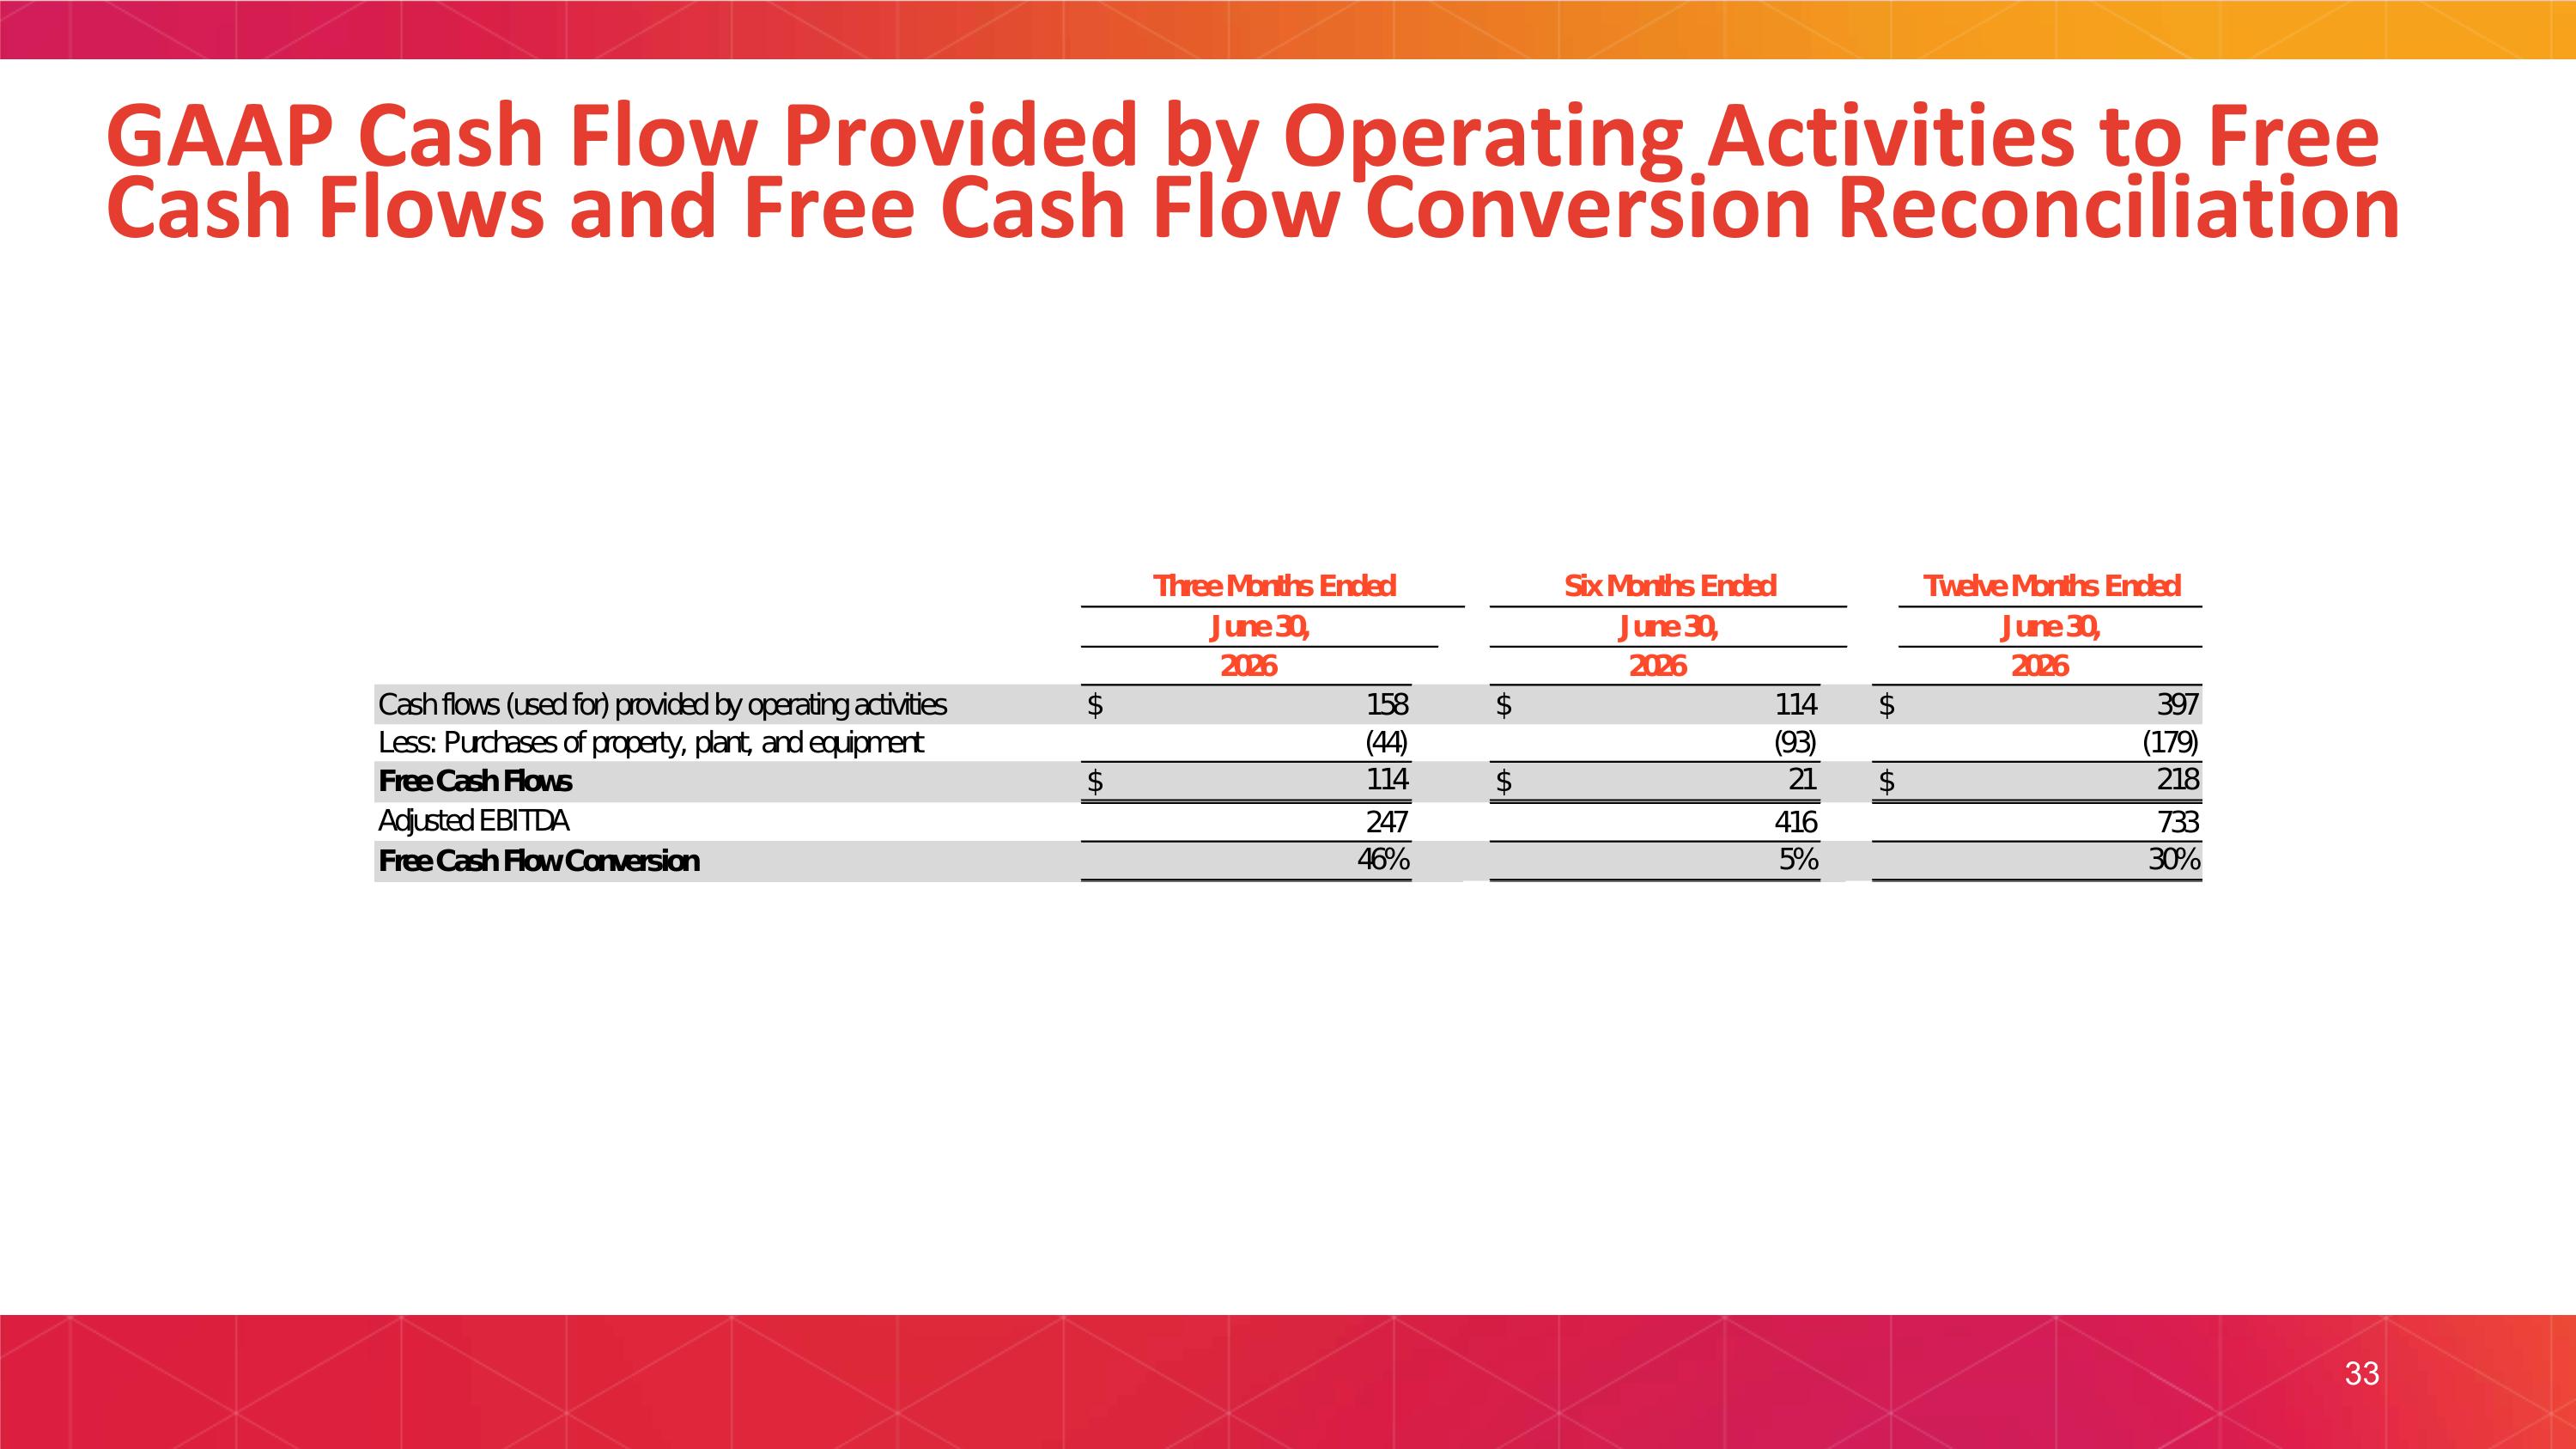
GAAP Cash Flow Provided by Operating Activities to Free Cash Flows and Free Cash Flow Conversion Reconciliation 33

® 2026 CHEMOURS. ALL RIGHTS RESERVED