
Copyright 2026 8x8, Inc. or its affiliates. All rights reserved. 8x8 Investor Update Product Innovation and Financial Model September 2026
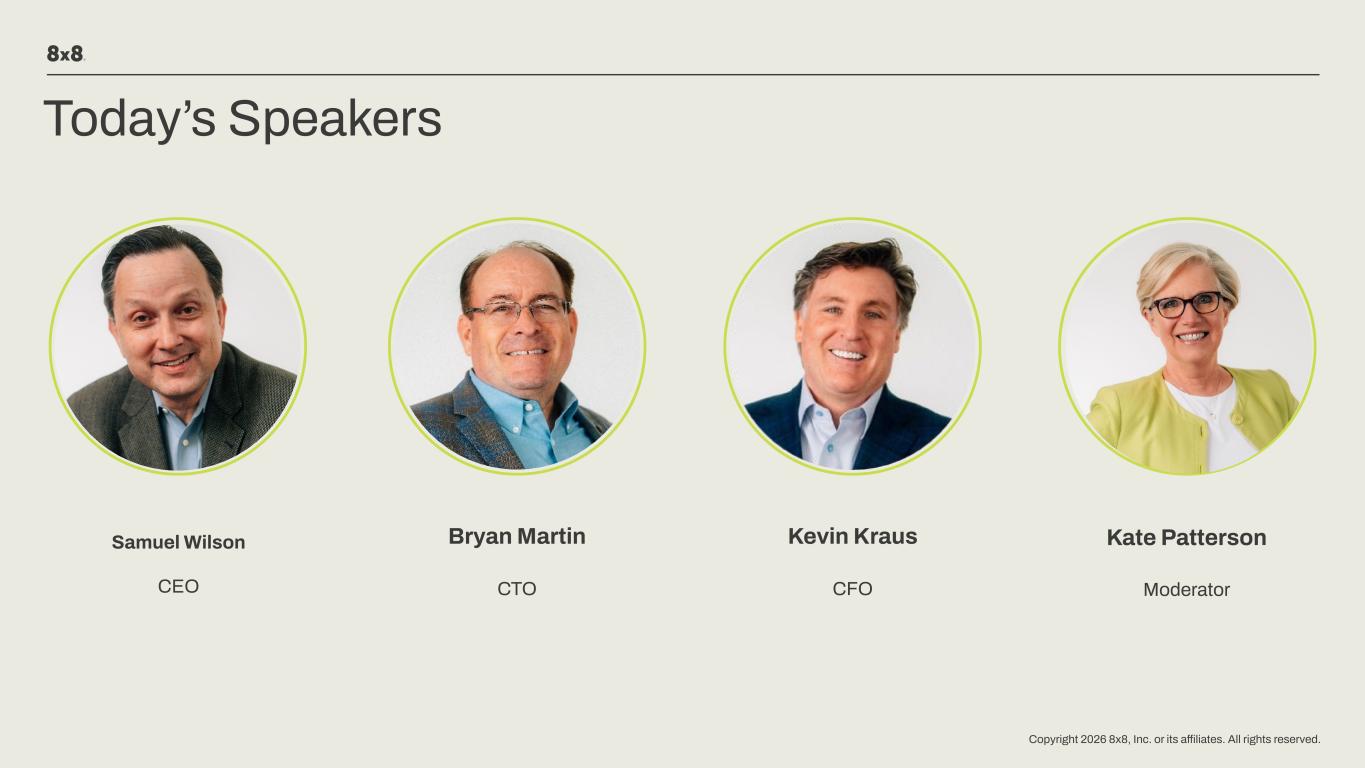
Copyright 2026 8x8, Inc. or its affiliates. All rights reserved. Samuel Wilson CEO Bryan Martin CTO Kate Patterson Moderator Today’s Speakers Kevin Kraus CFO
Copyright 2026 8x8, Inc. or its affiliates. All rights reserved. Forward Looking Statements This presentation contains “forward-looking statements” within the meaning of the Private Securities Litigation Reform Act of 1995 and Section 21E of the Securities Exchange Act of 1934, as amended. Any statements that are not statements of historical fact may be deemed to be forward-looking statements. For example, words such as "may," "will," "should," "estimates," "predicts," "potential," "continue," "strategy," "believes," "anticipates," "plans," "expects," "intends," “opportunity,” and similar expressions are intended to identify forward-looking statements. These forward-looking statements include, but are not limited to, statements regarding 8x8’s recent product innovations, long term financial model, debt refinancing and repayments, customer adoption, and the impact of artificial intelligence (“AI”). These statements are based on current expectations, estimates, forecasts, and projections about the industries in which 8x8 operates, and the beliefs and assumptions of management. Actual results may differ materially from those expressed or implied by these forward-looking statements due to a number of factors, including but not limited to, changes in market conditions, shifts in customer demand, increased competition, and general economic conditions. For additional information on these and other risks and uncertainties, please refer to the “Risk Factors” section in 8x8’s most recent Annual Report on Form 10-K and Quarterly Reports on Form 10-Q filed with the Securities and Exchange Commission, as well as 8x8’s prior filings. All forward-looking statements are qualified in their entirety by this cautionary statement, and 8x8 assumes no obligation to, and does not currently intend to, publicly update any such forward-looking statements for any reason, except as required by applicable law, even as new information becomes available or other events occur in the future,. See Appendix for Non-GAAP reconciliation and disclaimers.
Non-GAAP Measures and Guidance Non-GAAP Measures This presentation contains certain financial information that has not been prepared in accordance with Generally Accepted Accounting Principles (GAAP). Management uses these non-GAAP financial measures internally in analyzing the Company’s financial results and believes they are useful to investors, as a supplement to GAAP measures, in evaluating the Company’s ongoing operational performance. This information should not be considered a substitute for any measures derived in accordance with GAAP. Non-GAAP Guidance The Company does not reconcile its forward-looking estimates of non-GAAP gross margin to the corresponding GAAP measure of GAAP gross margin, non-GAAP operating margins to the corresponding GAAP measures of GAAP operating margin or non-GAAP net income per share, basic and diluted, to the corresponding GAAP measure of GAAP net income (loss) per share due to the significant variability of, and difficulty in making accurate forecasts and projections with regards to, the various expenses it excludes. For example, future hiring and employee turnover may not be reasonably predictable, stock-based compensation expense depends on variables that are largely not within the control of nor predictable by management, such as the market price of 8x8 common stock, and may also be significantly impacted by events like acquisitions, the timing and nature of which are difficult to predict with accuracy. The actual amounts of these excluded items could have a significant impact on the Company's GAAP operating margins. Accordingly, management believes that reconciliations of this forward-looking non-GAAP financial measure to the corresponding GAAP measure are not available without unreasonable effort. All projections are on a non-GAAP basis. fi fi CopyrightCopyright2026 8x8,2026Inc.8x8,orInc.its af liates. All rights reserved. or its af liates. All rights reserved.
Copyright 2026 8x8, Inc. or its affiliates. All rights reserved. Why 8x8? Large and growing market opportunity Voice network creates a structural advantage Unified platform with native AI Re-acceleration in growth Proven financial model with increasing profits, declining debt
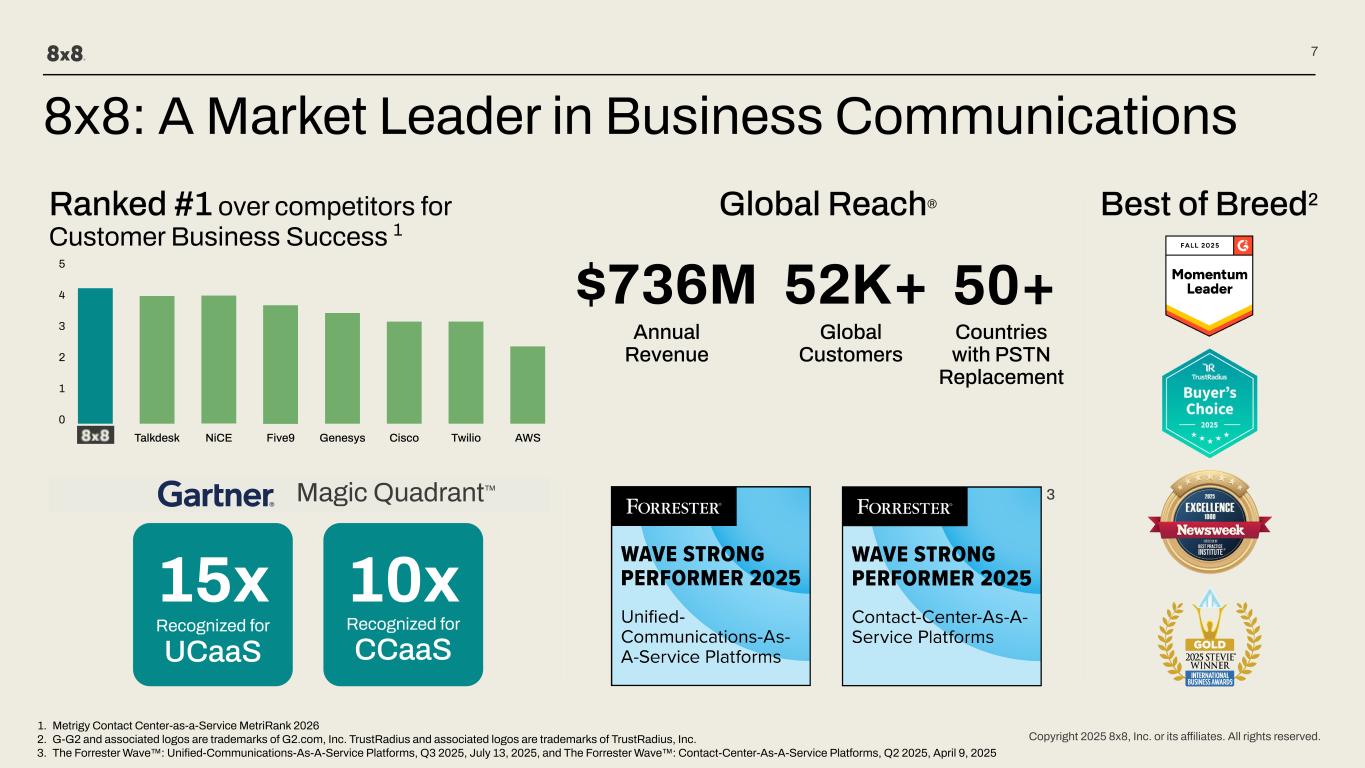
Copyright 2025 8x8, Inc. or its affiliates. All rights reserved. 7 8x8: A Market Leader in Business Communications Best of Breed2 15x Recognized for UCaaS $736M 52K+ 1. Metrigy Contact Center-as-a-Service MetriRank 2026 2. G-G2 and associated logos are trademarks of G2.com, Inc. TrustRadius and associated logos are trademarks of TrustRadius, Inc. 3. The Forrester Wave™: Unified-Communications-As-A-Service Platforms, Q3 2025, July 13, 2025, and The Forrester Wave™: Contact-Center-As-A-Service Platforms, Q2 2025, April 9, 2025 4 3 2 1 0 5 Global Reach® 50+ Countries with PSTN Replacement Ranked #1 over competitors for Customer Business Success 1 Annual Revenue Global Customers 10x Recognized for CCaaS 3 AWSTwilioCiscoGenesysFive9NiCE Magic Quadrant™ Talkdesk
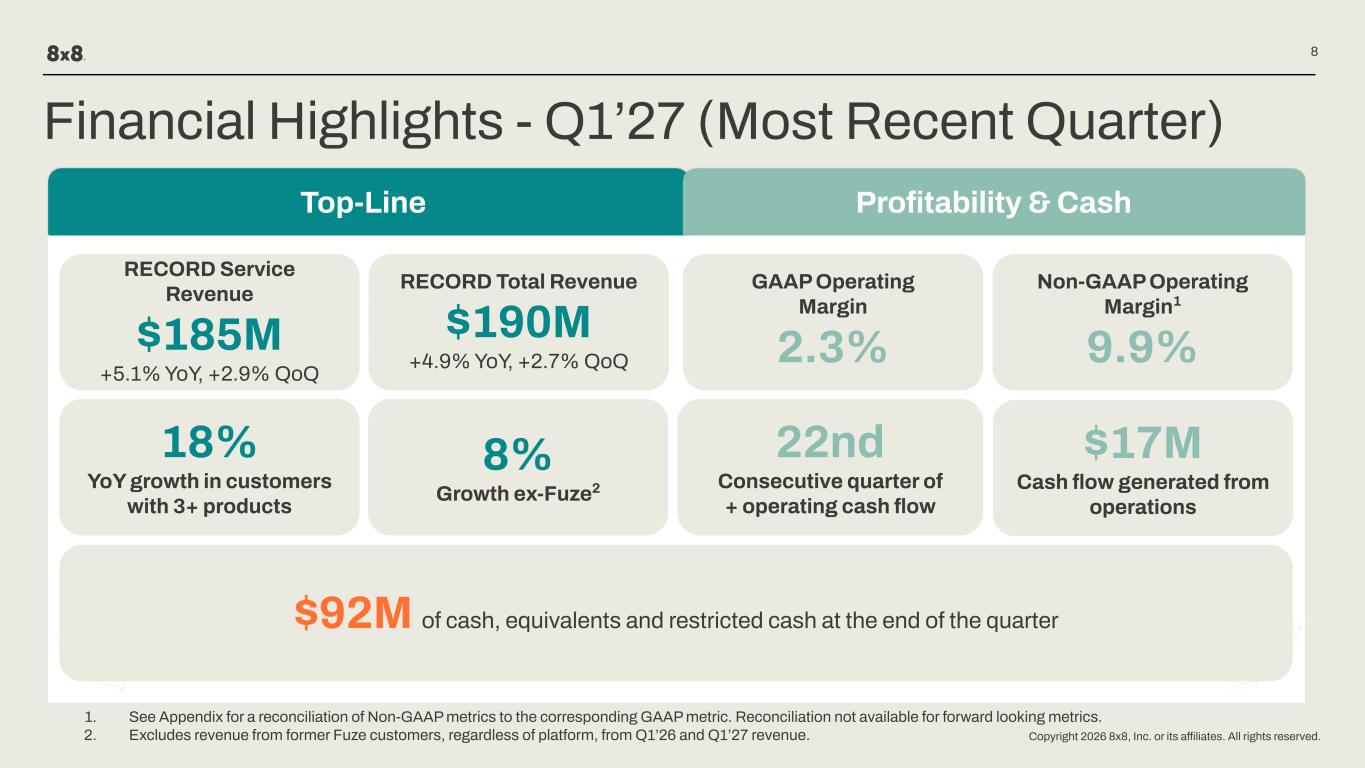
Copyright 2026 8x8, Inc. or its affiliates. All rights reserved. 8 Financial Highlights - Q1’27 (Most Recent Quarter) Top-Line RECORD Service Revenue $185M +5.1% YoY, +2.9% QoQ RECORD Total Revenue $190M +4.9% YoY, +2.7% QoQ Profitability & Cash GAAP Operating Margin 2.3% Non-GAAP Operating Margin1 9.9% $17M Cash flow generated from operations 22nd Consecutive quarter of + operating cash flow $92M of cash, equivalents and restricted cash at the end of the quarter 18% YoY growth in customers with 3+ products 8% Growth ex-Fuze2 1. See Appendix for a reconciliation of Non-GAAP metrics to the corresponding GAAP metric. Reconciliation not available for forward looking metrics. 2. Excludes revenue from former Fuze customers, regardless of platform, from Q1’26 and Q1’27 revenue.
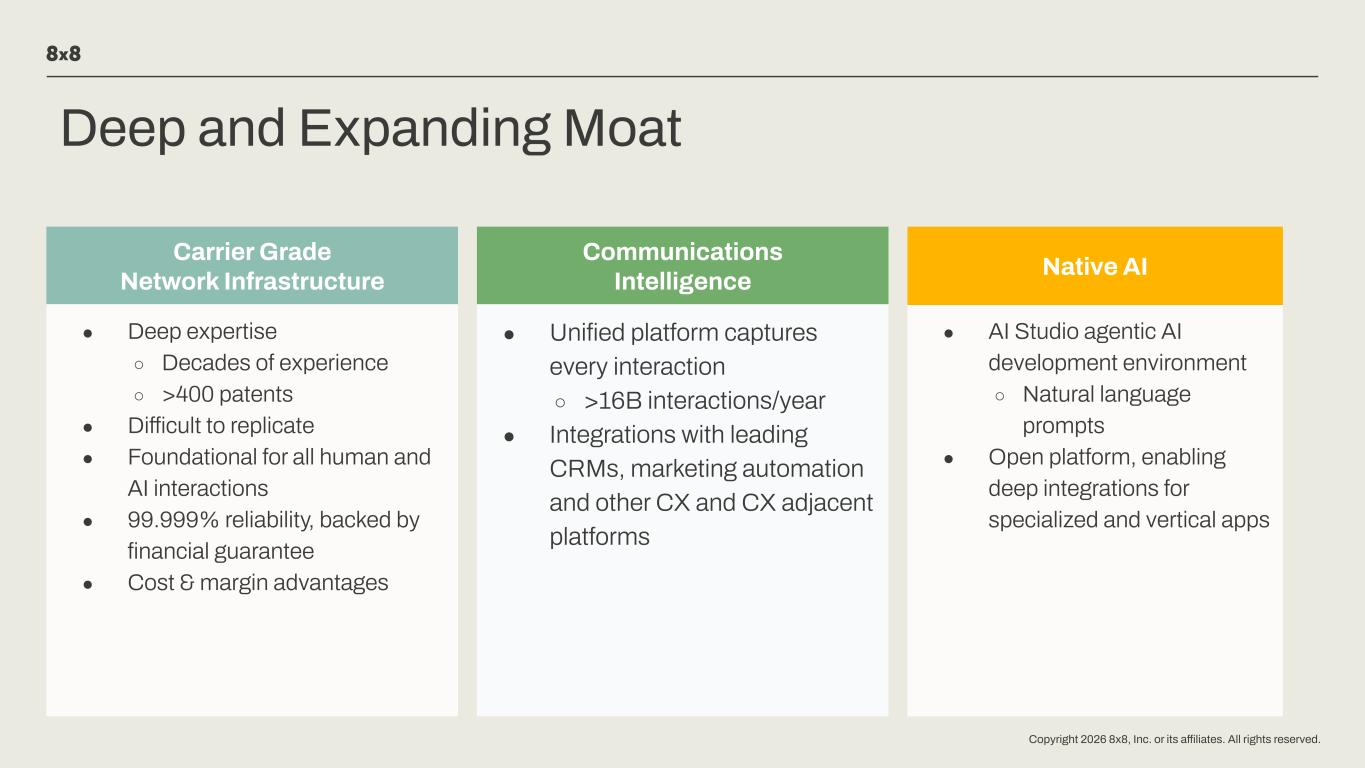
Copyright 2026 8x8, Inc. or its affiliates. All rights reserved. Deep and Expanding Moat Carrier Grade Network Infrastructure ● Difficult to replicate ● Foundational for all human and AI interactions ● 99.999% reliability, backed by financial guarantee ● Cost & margin advantages Communications Intelligence ● Unified platform captures every interaction ○ >16B interactions/year ● Integrations with leading CRMs, marketing automation and other CX and CX adjacent platforms ● AI Studio agentic AI development environment ○ Natural language prompts ● Open platform, enabling deep integrations for specialized and vertical apps Native AI ● Deep expertise ○ Decades of experience ○ >400 patents
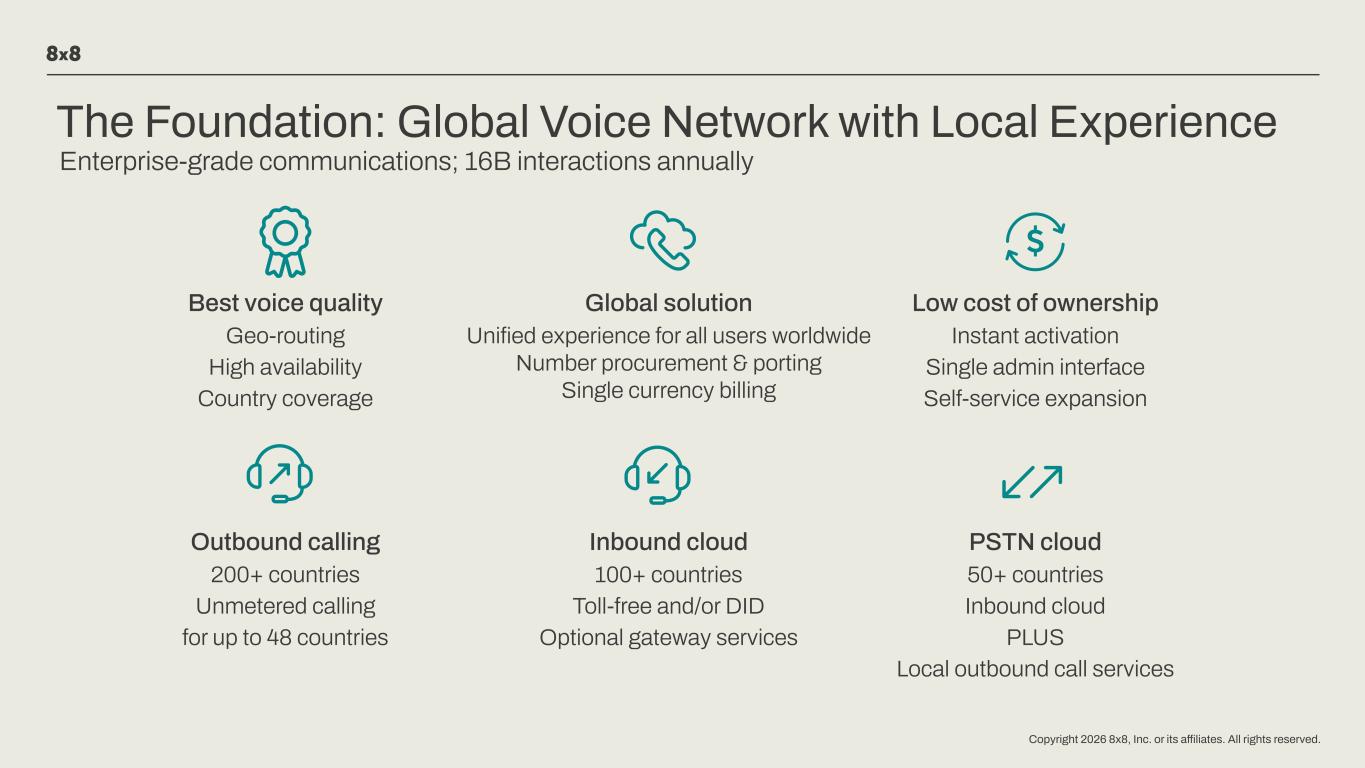
Copyright 2026 8x8, Inc. or its affiliates. All rights reserved. Enterprise-grade communications; 16B interactions annually Best voice quality Geo-routing High availability Country coverage Global solution Unified experience for all users worldwide Number procurement & porting Single currency billing Low cost of ownership Instant activation Single admin interface Self-service expansion Outbound calling 200+ countries Unmetered calling for up to 48 countries Inbound cloud 100+ countries Toll-free and/or DID Optional gateway services PSTN cloud 50+ countries Inbound cloud PLUS Local outbound call services The Foundation: Global Voice Network with Local Experience

Copyright 2026 8x8, Inc. or its affiliates. All rights reserved. 8x8 Vision
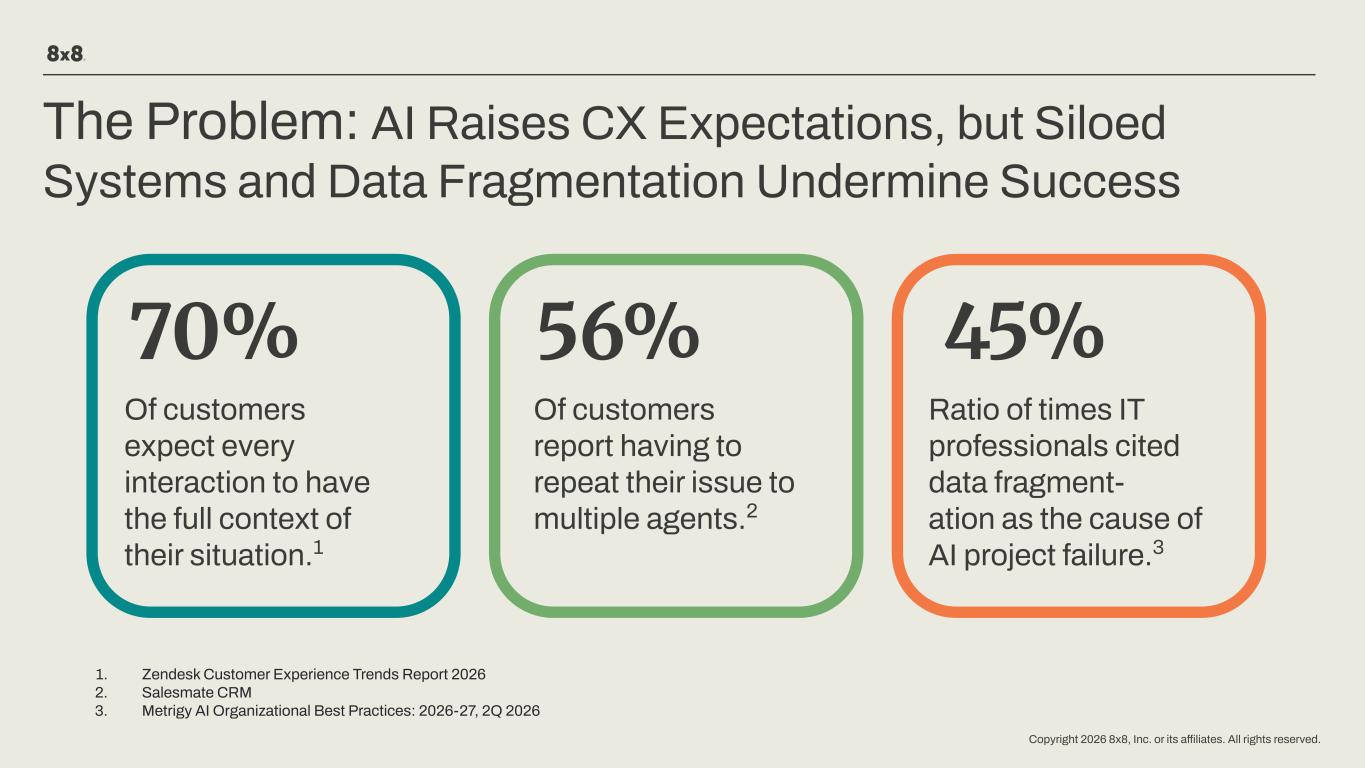
Copyright 2026 8x8, Inc. or its affiliates. All rights reserved. The Problem: AI Raises CX Expectations, but Siloed Systems and Data Fragmentation Undermine Success 70% 45% Ratio of times IT professionals cited data fragment- ation as the cause of AI project failure.3 1. Zendesk Customer Experience Trends Report 2026 2. Salesmate CRM 3. Metrigy AI Organizational Best Practices: 2026-27, 2Q 2026 Of customers expect every interaction to have the full context of their situation.1 56% Of customers report having to repeat their issue to multiple agents.2
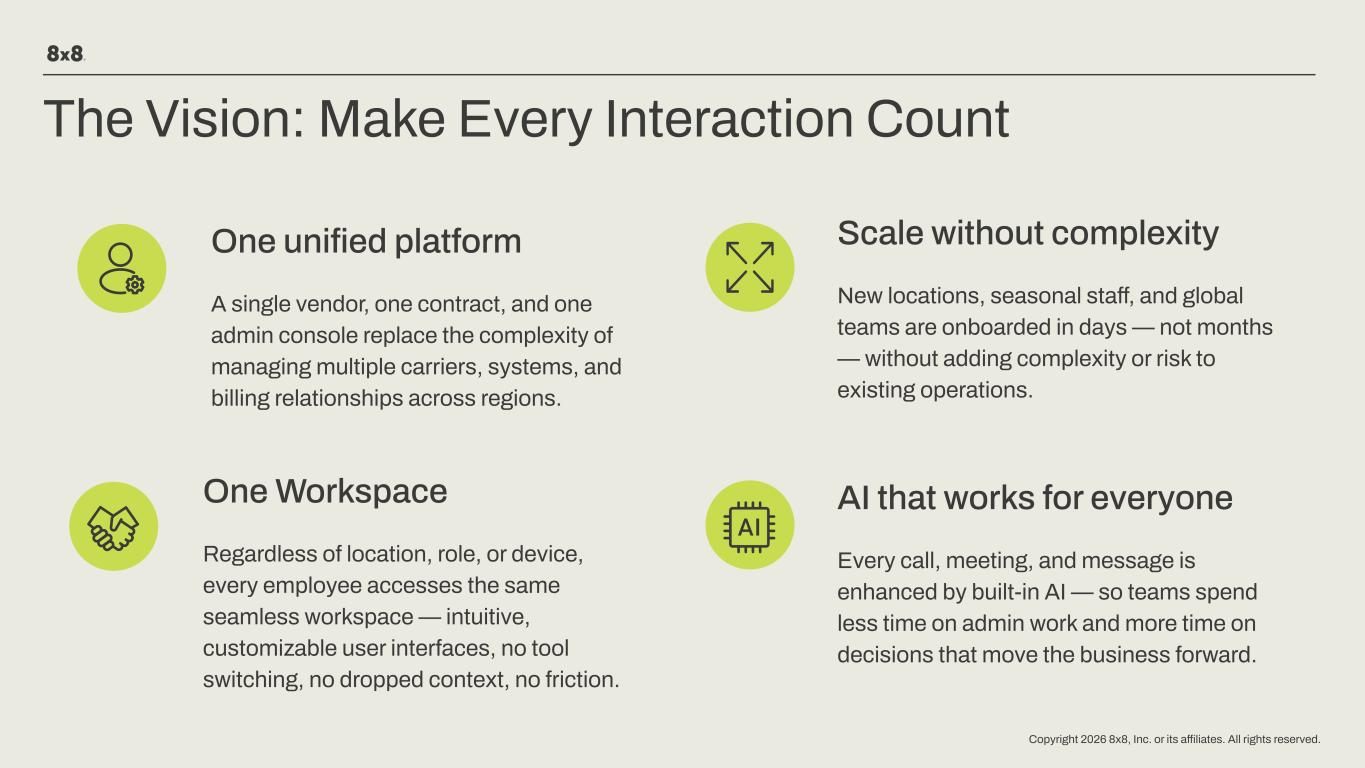
Copyright 2026 8x8, Inc. or its affiliates. All rights reserved. One Workspace Regardless of location, role, or device, every employee accesses the same seamless workspace — intuitive, customizable user interfaces, no tool switching, no dropped context, no friction. The Vision: Make Every Interaction Count AI that works for everyone Every call, meeting, and message is enhanced by built-in AI — so teams spend less time on admin work and more time on decisions that move the business forward. Scale without complexity New locations, seasonal staff, and global teams are onboarded in days — not months — without adding complexity or risk to existing operations. One unified platform A single vendor, one contract, and one admin console replace the complexity of managing multiple carriers, systems, and billing relationships across regions.
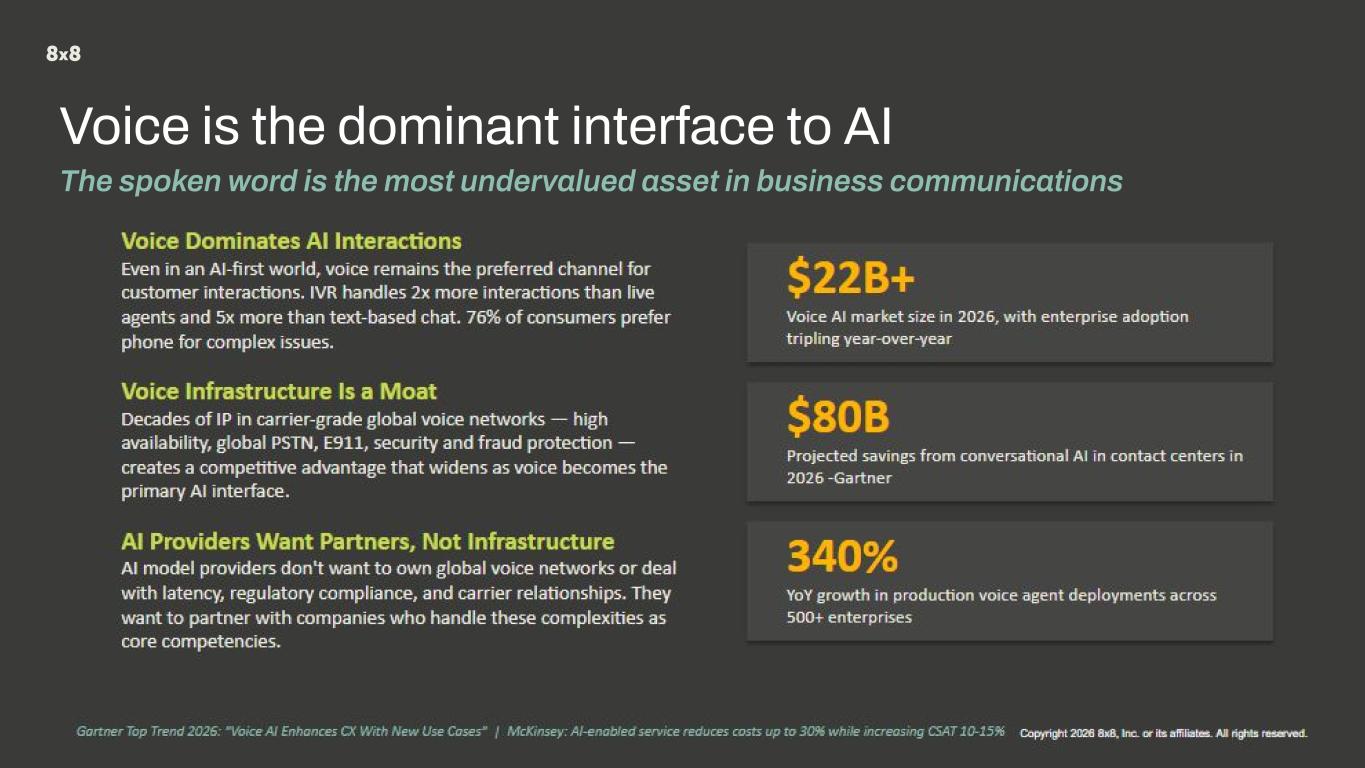
Copyright 2026 8x8, Inc. or its affiliates. All rights reserved. Copyright 2024 8x8, Inc. or its affiliates. All rights reserved. Copyright 2026 8x8, Inc. or its affiliates. All rights reserved. Voice is the dominant interface to AI The spoken word is the most undervalued asset in business communications
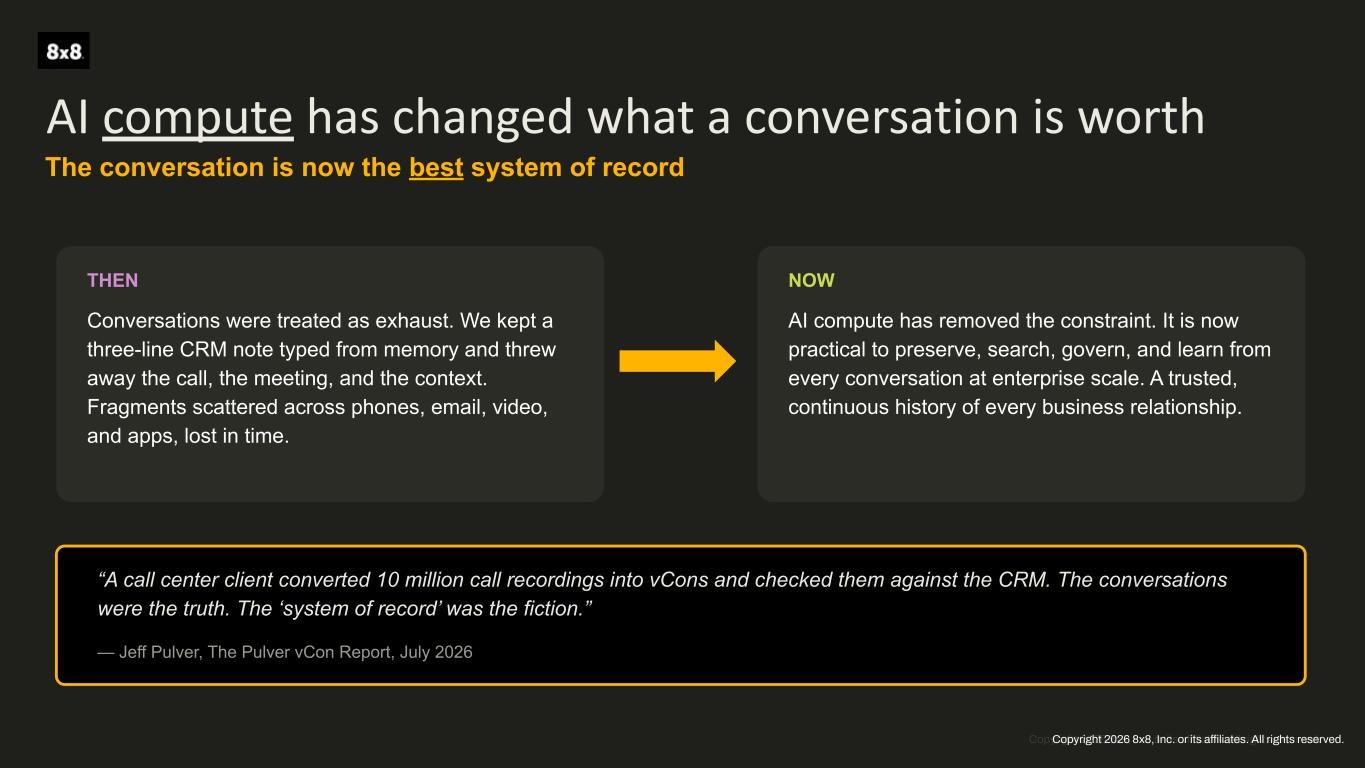
Copyright 2026 8x8, Inc. or its affiliates. All rights reserved. AI compute has changed what a conversation is worth The conversation is now the best system of record THEN Conversations were treated as exhaust. We kept a three-line CRM note typed from memory and threw away the call, the meeting, and the context. Fragments scattered across phones, email, video, and apps, lost in time. NOW AI compute has removed the constraint. It is now practical to preserve, search, govern, and learn from every conversation at enterprise scale. A trusted, continuous history of every business relationship. “A call center client converted 10 million call recordings into vCons and checked them against the CRM. The conversations were the truth. The ‘system of record’ was the fiction.” — Jeff Pulver, The Pulver vCon Report, July 2026 Copyright 2026 8x8, Inc. or its affiliates. All rights reserved.
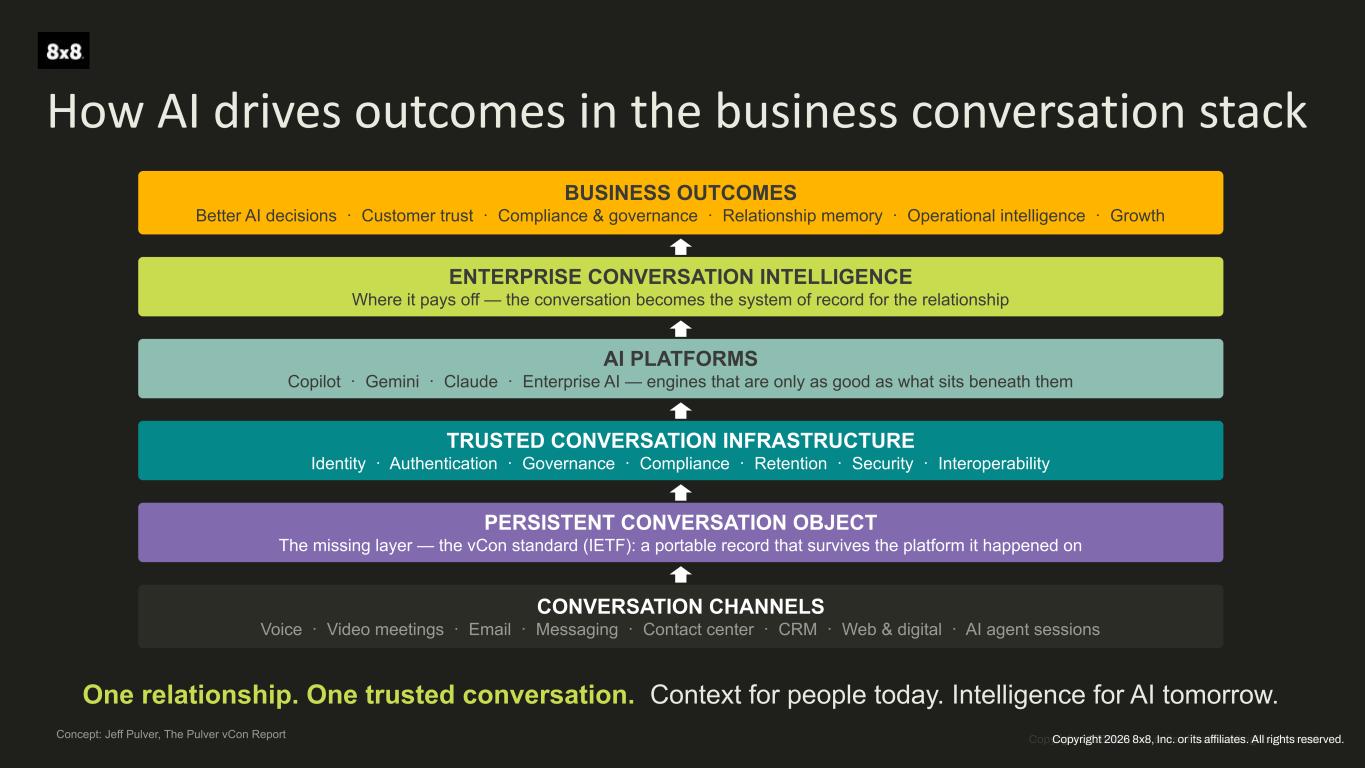
Copyright 2026 8x8, Inc. or its affiliates. All rights reserved. How AI drives outcomes in the business conversation stack BUSINESS OUTCOMES Better AI decisions · Customer trust · Compliance & governance · Relationship memory · Operational intelligence · Growth ENTERPRISE CONVERSATION INTELLIGENCE Where it pays off — the conversation becomes the system of record for the relationship AI PLATFORMS Copilot · Gemini · Claude · Enterprise AI — engines that are only as good as what sits beneath them TRUSTED CONVERSATION INFRASTRUCTURE Identity · Authentication · Governance · Compliance · Retention · Security · Interoperability PERSISTENT CONVERSATION OBJECT The missing layer — the vCon standard (IETF): a portable record that survives the platform it happened on CONVERSATION CHANNELS Voice · Video meetings · Email · Messaging · Contact center · CRM · Web & digital · AI agent sessions One relationship. One trusted conversation. Context for people today. Intelligence for AI tomorrow. Concept: Jeff Pulver, The Pulver vCon Report Copyright 2026 8x8, Inc. or its affiliates. All rights reserved.
Copyright 2026 8x8, Inc. or its affiliates. All rights reserved. 8x8 Products and Platform
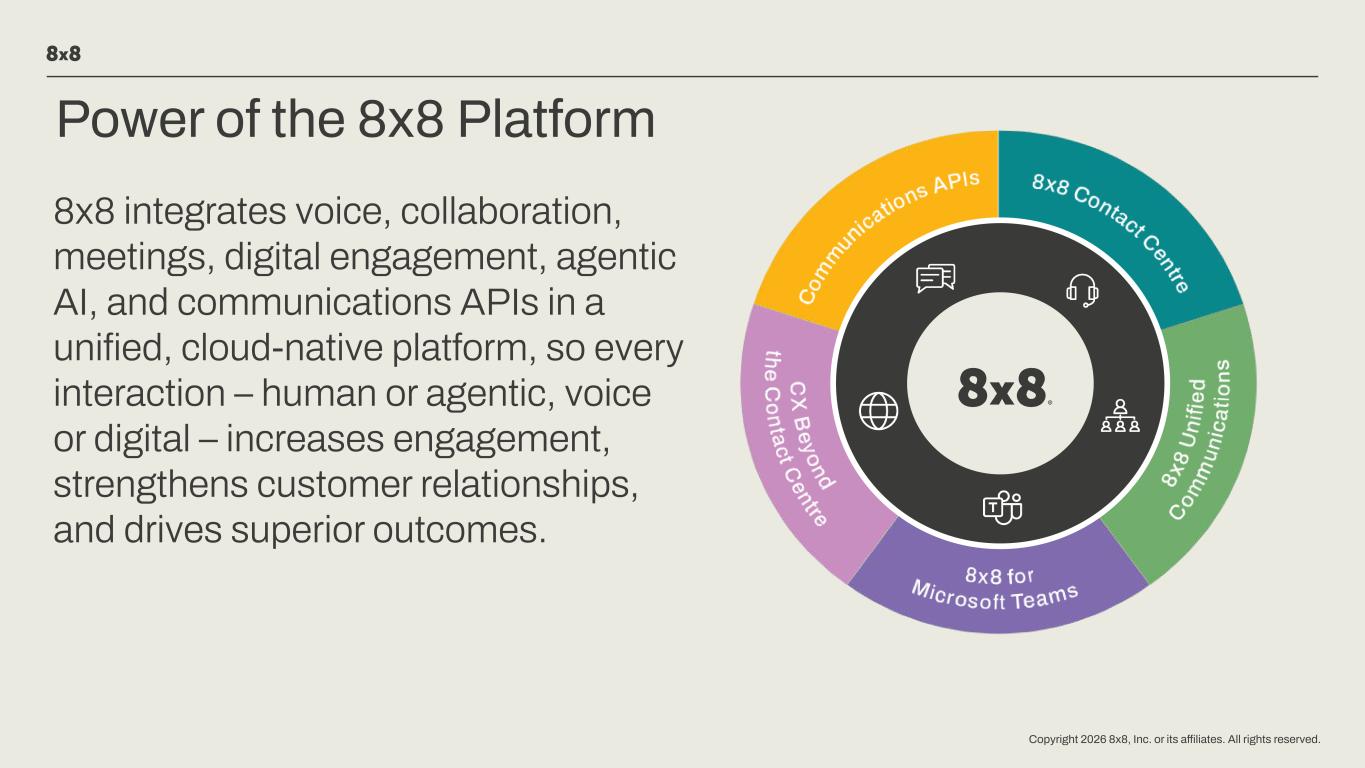
Copyright 2026 8x8, Inc. or its affiliates. All rights reserved. Power of the 8x8 Platform 8x8 integrates voice, collaboration, meetings, digital engagement, agentic AI, and communications APIs in a unified, cloud-native platform, so every interaction – human or agentic, voice or digital – increases engagement, strengthens customer relationships, and drives superior outcomes.
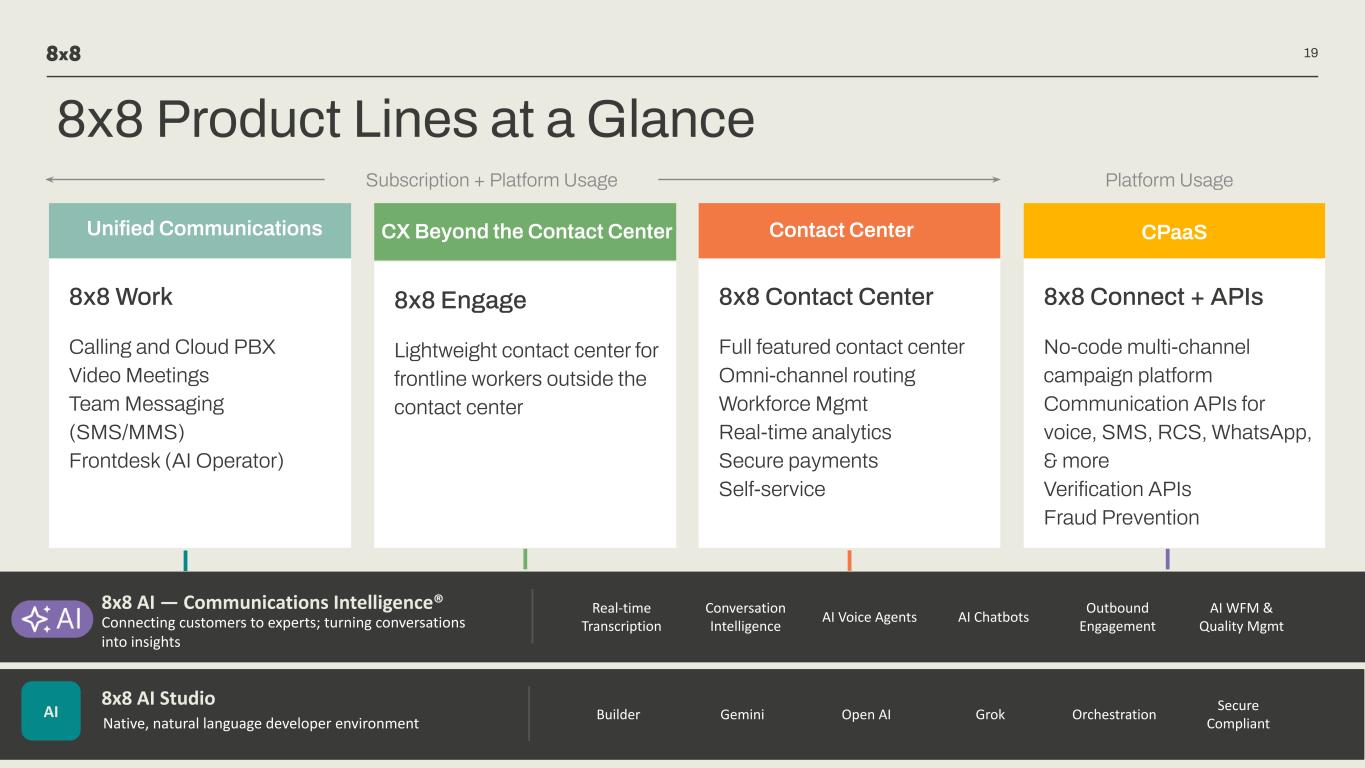
Copyright 2026 8x8, Inc. or its affiliates. All rights reserved. 8x8 Work Calling and Cloud PBX Video Meetings Team Messaging (SMS/MMS) Frontdesk (AI Operator) 8x8 Engage Lightweight contact center for frontline workers outside the contact center 8x8 Connect + APIs No-code multi-channel campaign platform Communication APIs for voice, SMS, RCS, WhatsApp, & more Verification APIs Fraud Prevention 19 8x8 Contact Center Full featured contact center Omni-channel routing Workforce Mgmt Real-time analytics Secure payments Self-service Unified Communications CX Beyond the Contact Center Contact Center CPaaS 8x8 AI — Communications Intelligence® Connecting customers to experts; turning conversations into insights Real-time Transcription Conversation Intelligence AI Voice Agents AI Chatbots Outbound Engagement AI WFM & Quality Mgmt Builder Gemini Open AI Grok Orchestration Secure Compliant AI 8x8 AI Studio Native, natural language developer environment Platform UsageSubscription + Platform Usage 8x8 Product Lines at a Glance
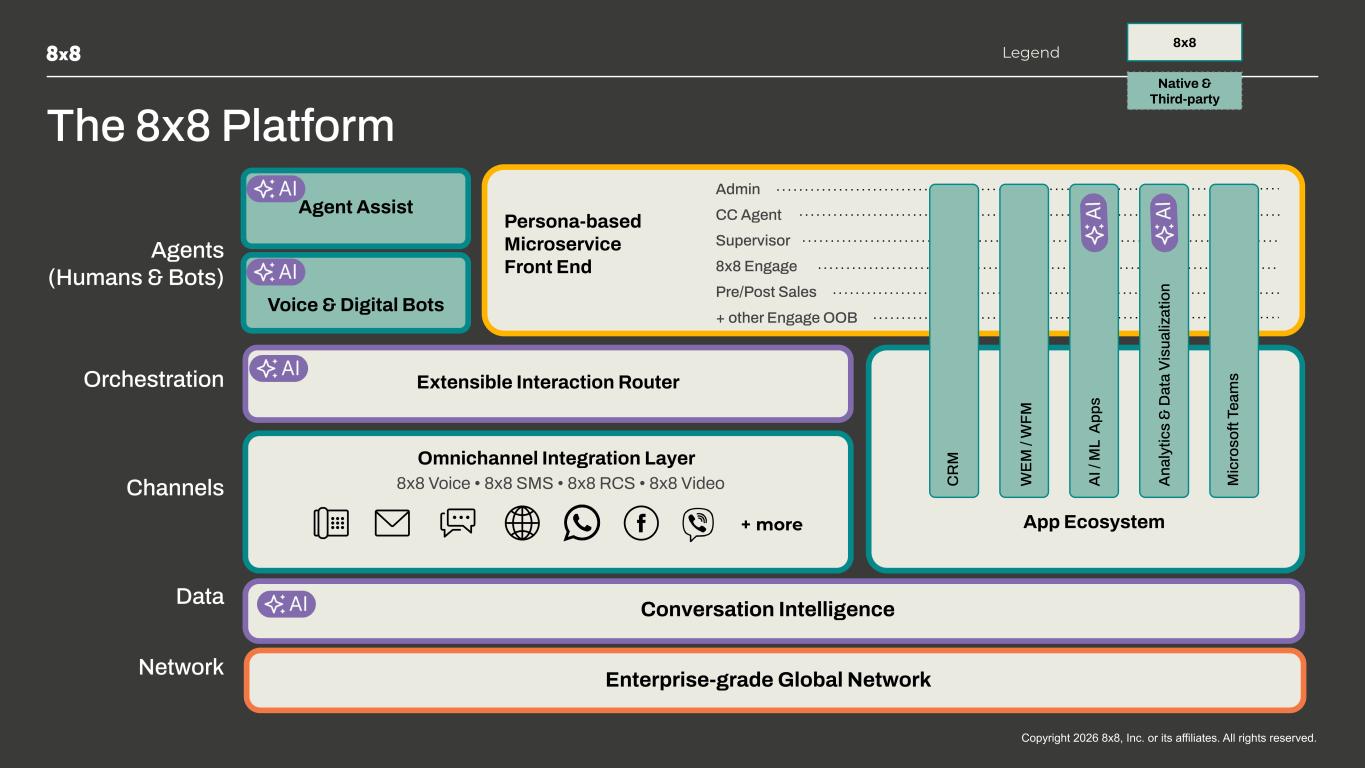
Copyright 2025 8x8, Inc. or its affiliates. All rights reserved.6 The 8x8 Platform Subtitle Archivo Light 10pt Conversation Intelligence Agents (Humans & Bots) Orchestration Channels Data App Ecosystem 8x8 8x8 Voice • 8x8 SMS • 8x8 RCS • 8x8 Video Legend + more CC Agent Supervisor 8x8 Engage Pre/Post Sales + other Engage OOB Admin Native & Third-party Persona-based Microservice Front End Omnichannel Integration Layer Agent Assist C R M W EM / W FM A I / M L A pp s A na ly tic s & D at a Vi su al iz at io n Voice & Digital Bots M ic ro so ft Te am s Network Extensible Interaction Router Enterprise-grade Global Network
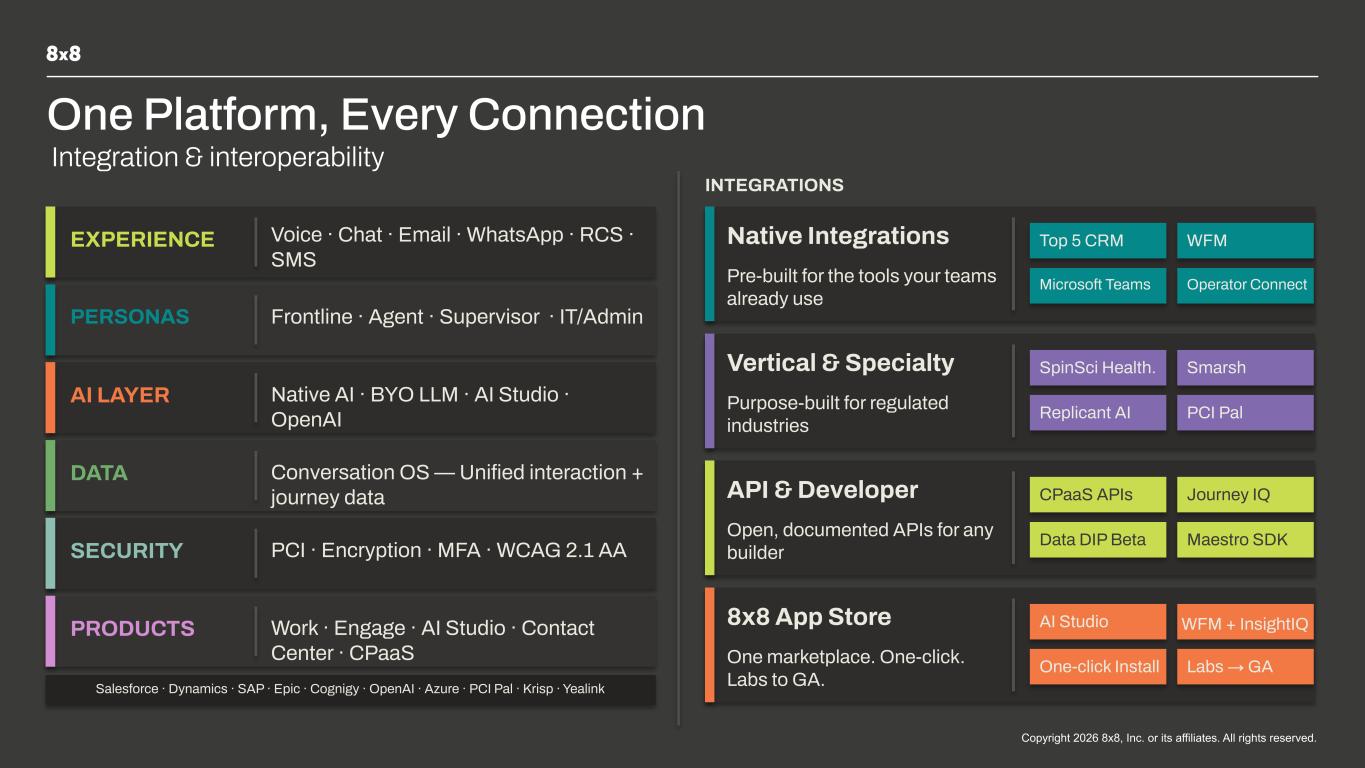
Copyright 2025 8x8, Inc. or its affiliates. All rights reserved.6 One Platform, Every Connection INTEGRATIONS EXPERIENCE Voice · Chat · Email · WhatsApp · RCS · SMS PERSONAS Frontline · Agent · Supervisor · IT/Admin AI LAYER Native AI · BYO LLM · AI Studio · OpenAI DATA Conversation OS — Unified interaction + journey data SECURITY PCI · Encryption · MFA · WCAG 2.1 AA PRODUCTS Work · Engage · AI Studio · Contact Center · CPaaS Salesforce · Dynamics · SAP · Epic · Cognigy · OpenAI · Azure · PCI Pal · Krisp · Yealink Native Integrations Pre-built for the tools your teams already use Top 5 CRM WFM Microsoft Teams Operator Connect Vertical & Specialty Purpose-built for regulated industries SpinSci Health. Smarsh Replicant AI PCI Pal API & Developer Open, documented APIs for any builder CPaaS APIs Journey IQ Data DIP Beta Maestro SDK 8x8 App Store One marketplace. One-click. Labs to GA. AI Studio WFM + InsightIQ One-click Install Labs → GA Integration & interoperability
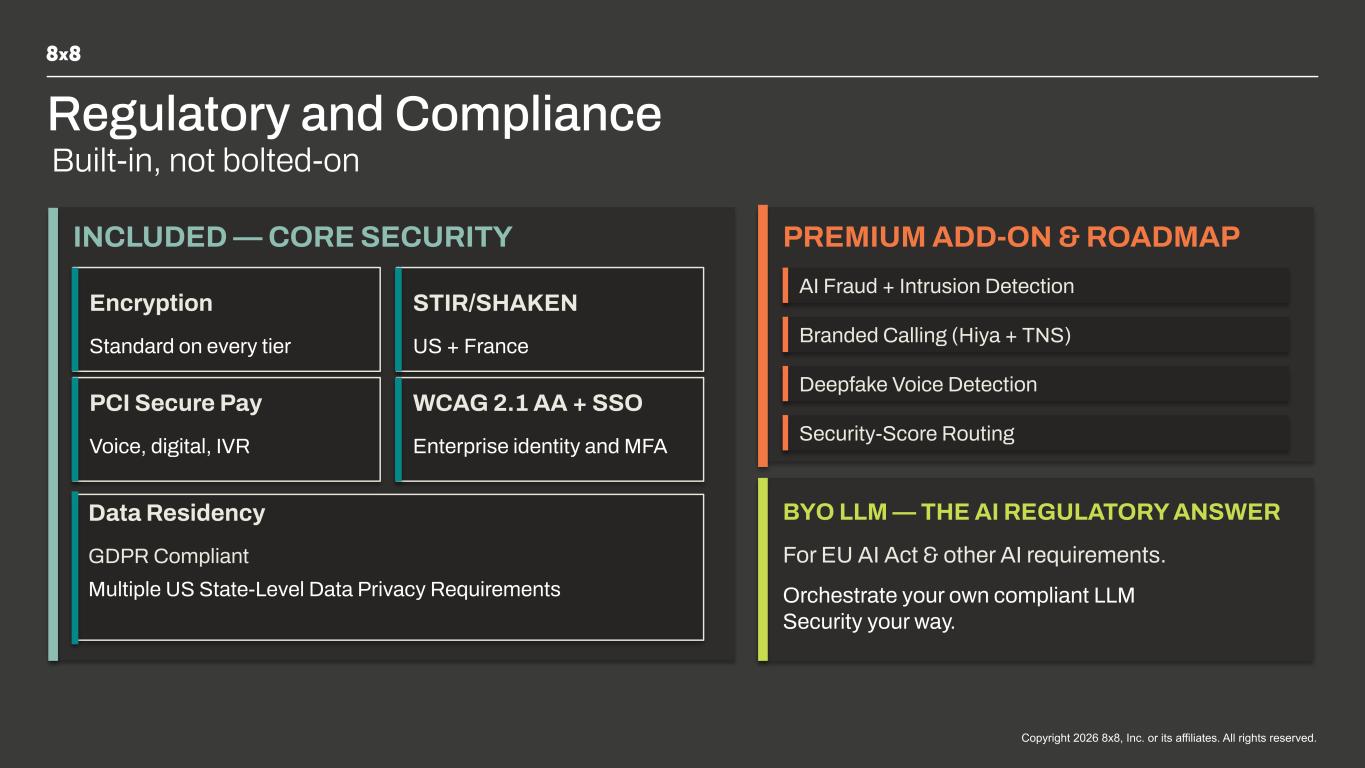
Copyright 2025 8x8, Inc. or its affiliates. All rights reserved.6 Regulatory and Compliance Subtitle Archivo Light 10pt Built-in, not bolted-on INCLUDED — CORE SECURITY Encryption Standard on every tier STIR/SHAKEN US + France PCI Secure Pay Voice, digital, IVR WCAG 2.1 AA + SSO Enterprise identity and MFA Data Residency GDPR Compliant PREMIUM ADD-ON & ROADMAP AI Fraud + Intrusion Detection Branded Calling (Hiya + TNS) Deepfake Voice Detection Security-Score Routing BYO LLM — THE AI REGULATORY ANSWER For EU AI Act & other AI requirements. Orchestrate your own compliant LLM Security your way. Multiple US State-Level Data Privacy Requirements

Copyright 2026 8x8, Inc. or its affiliates. All rights reserved. The AI Tailwind
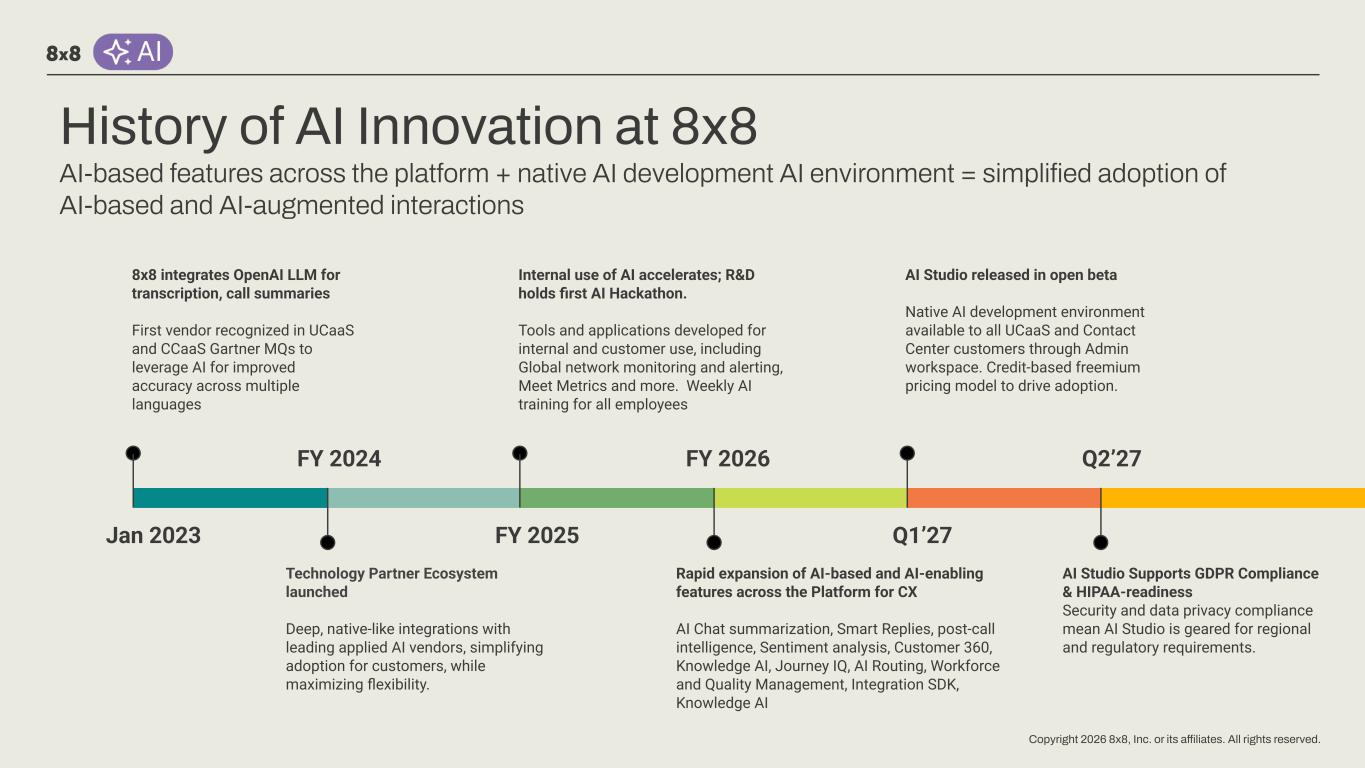
Copyright 2026 8x8, Inc. or its affiliates. All rights reserved. History of AI Innovation at 8x8 AI-based features across the platform + native AI development AI environment = simplified adoption of AI-based and AI-augmented interactions Jan 2023 8x8 integrates OpenAI LLM for transcription, call summaries First vendor recognized in UCaaS and CCaaS Gartner MQs to leverage AI for improved accuracy across multiple languages FY 2024 Technology Partner Ecosystem launched Deep, native-like integrations with leading applied AI vendors, simplifying adoption for customers, while maximizing flexibility. FY 2025 Internal use of AI accelerates; R&D holds first AI Hackathon. Tools and applications developed for internal and customer use, including Global network monitoring and alerting, Meet Metrics and more. Weekly AI training for all employees FY 2026 Rapid expansion of AI-based and AI-enabling features across the Platform for CX AI Chat summarization, Smart Replies, post-call intelligence, Sentiment analysis, Customer 360, Knowledge AI, Journey IQ, AI Routing, Workforce and Quality Management, Integration SDK, Knowledge AI Q1’27 AI Studio released in open beta Native AI development environment available to all UCaaS and Contact Center customers through Admin workspace. Credit-based freemium pricing model to drive adoption. Q2’27 AI Studio Supports GDPR Compliance & HIPAA-readiness Security and data privacy compliance mean AI Studio is geared for regional and regulatory requirements.
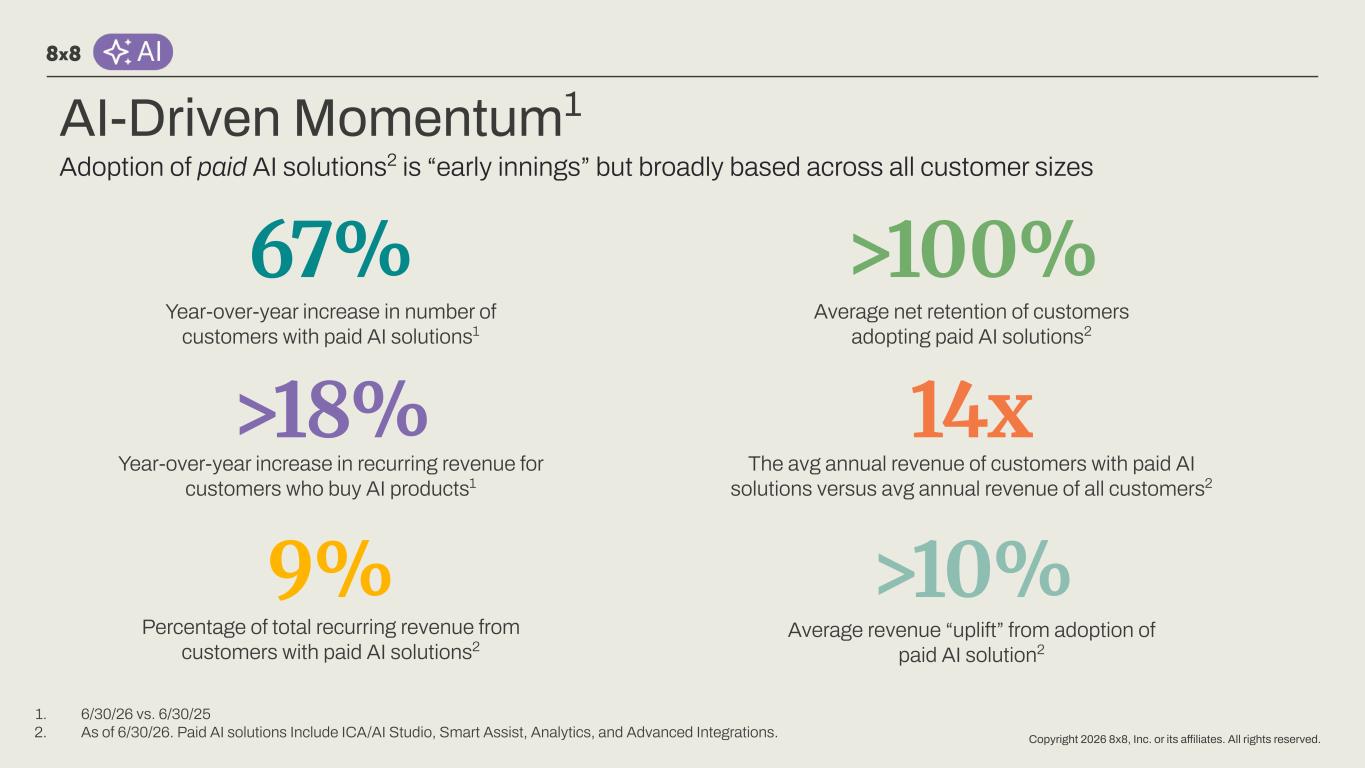
Copyright 2026 8x8, Inc. or its affiliates. All rights reserved. AI-Driven Momentum1 Year-over-year increase in recurring revenue for customers who buy AI products1 Year-over-year increase in number of customers with paid AI solutions1 >18% 9% 67% Adoption of paid AI solutions2 is “early innings” but broadly based across all customer sizes Percentage of total recurring revenue from customers with paid AI solutions2 1. 6/30/26 vs. 6/30/25 2. As of 6/30/26. Paid AI solutions Include ICA/AI Studio, Smart Assist, Analytics, and Advanced Integrations. Average net retention of customers adopting paid AI solutions2 Average revenue “uplift” from adoption of paid AI solution2 >100% 14x The avg annual revenue of customers with paid AI solutions versus avg annual revenue of all customers2 >10%

Copyright 2026 8x8, Inc. or its affiliates. All rights reserved. AI Studio
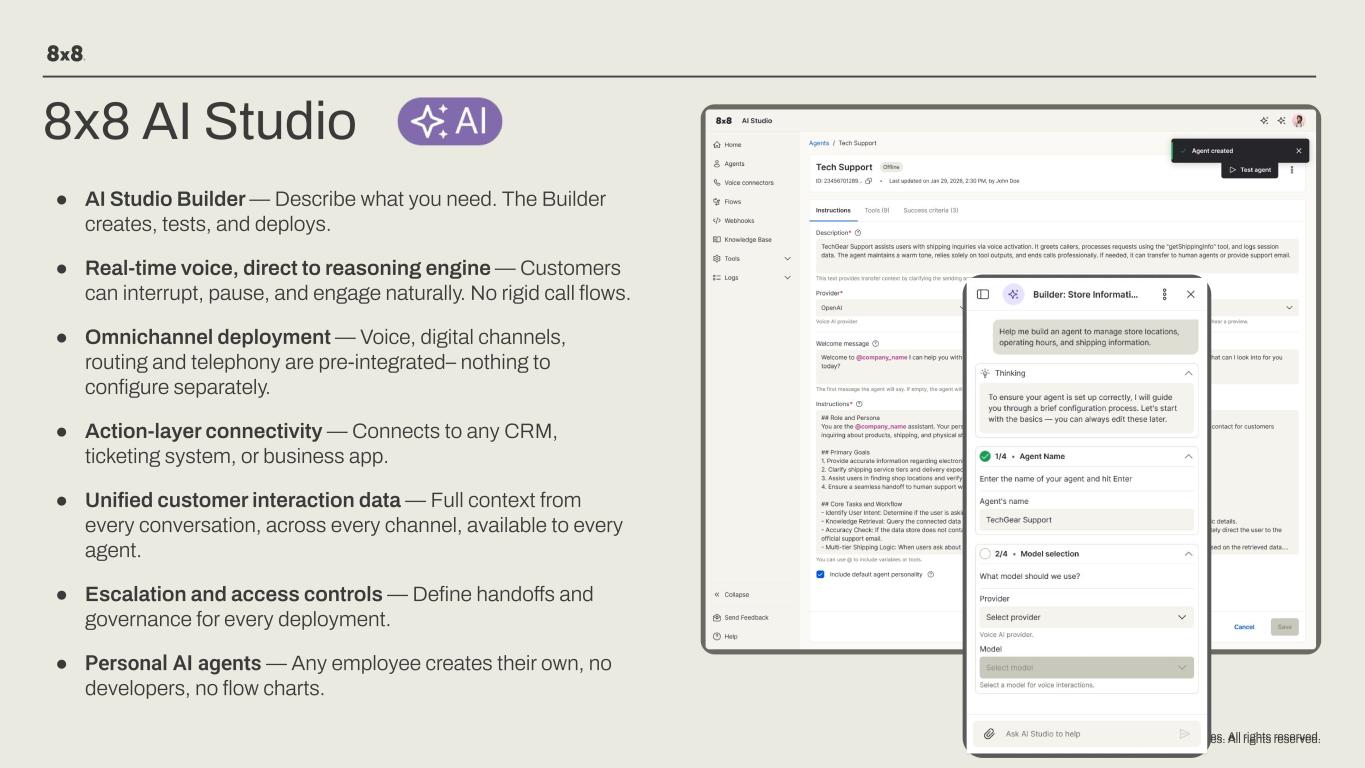
Copyright 2026 8x8, Inc. or its affiliates. All rights reserved.Copyright 2026 8x8, Inc. or its affiliates. All rights reserved. 8x8 AI Studio ● AI Studio Builder — Describe what you need. The Builder creates, tests, and deploys. ● Real-time voice, direct to reasoning engine — Customers can interrupt, pause, and engage naturally. No rigid call flows. ● Omnichannel deployment — Voice, digital channels, routing and telephony are pre-integrated– nothing to configure separately. ● Action-layer connectivity — Connects to any CRM, ticketing system, or business app. ● Unified customer interaction data — Full context from every conversation, across every channel, available to every agent. ● Escalation and access controls — Define handoffs and governance for every deployment. ● Personal AI agents — Any employee creates their own, no developers, no flow charts.
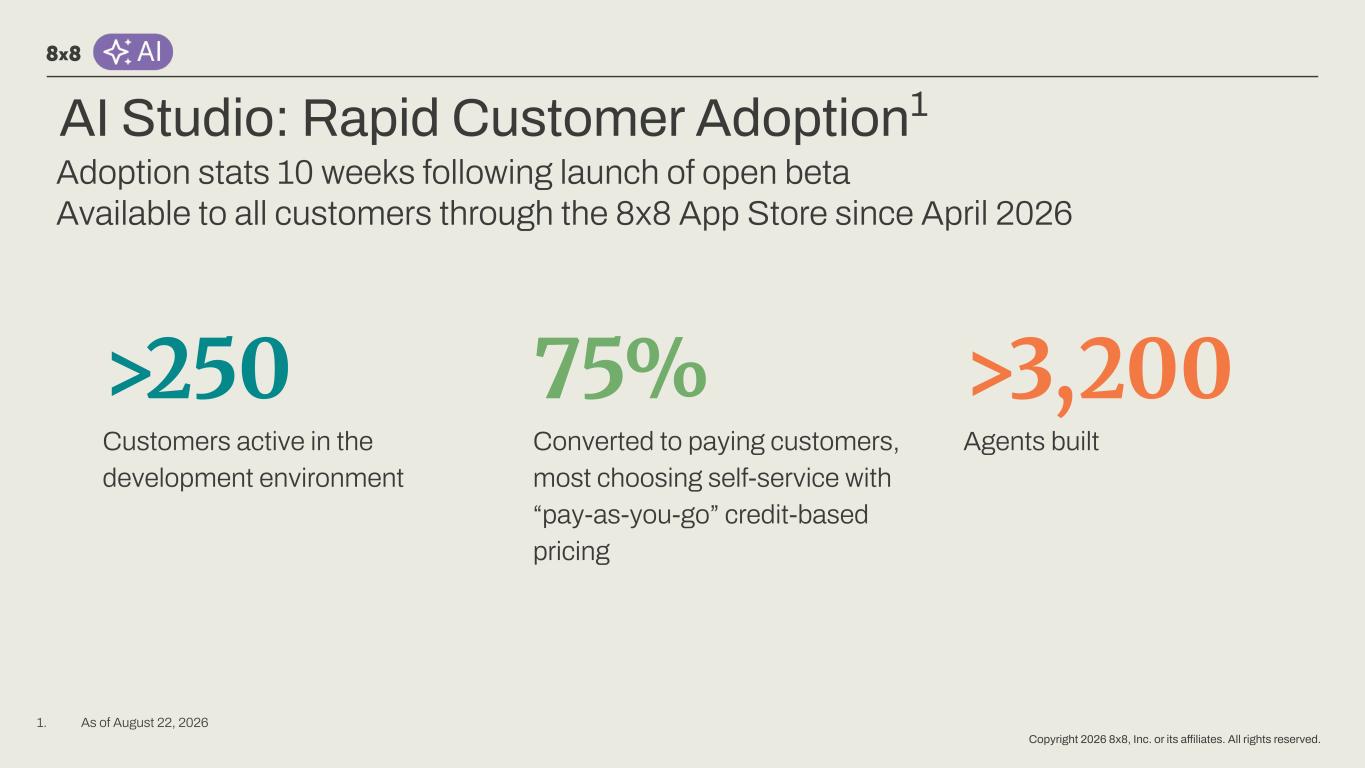
Copyright 2026 8x8, Inc. or its affiliates. All rights reserved. AI Studio: Rapid Customer Adoption1 >250 Customers active in the development environment 75% Converted to paying customers, most choosing self-service with “pay-as-you-go” credit-based pricing Agents built Adoption stats 10 weeks following launch of open beta Available to all customers through the 8x8 App Store since April 2026 >3,200 1. As of August 22, 2026
Copyright 2026 8x8, Inc. or its affiliates. All rights reserved.
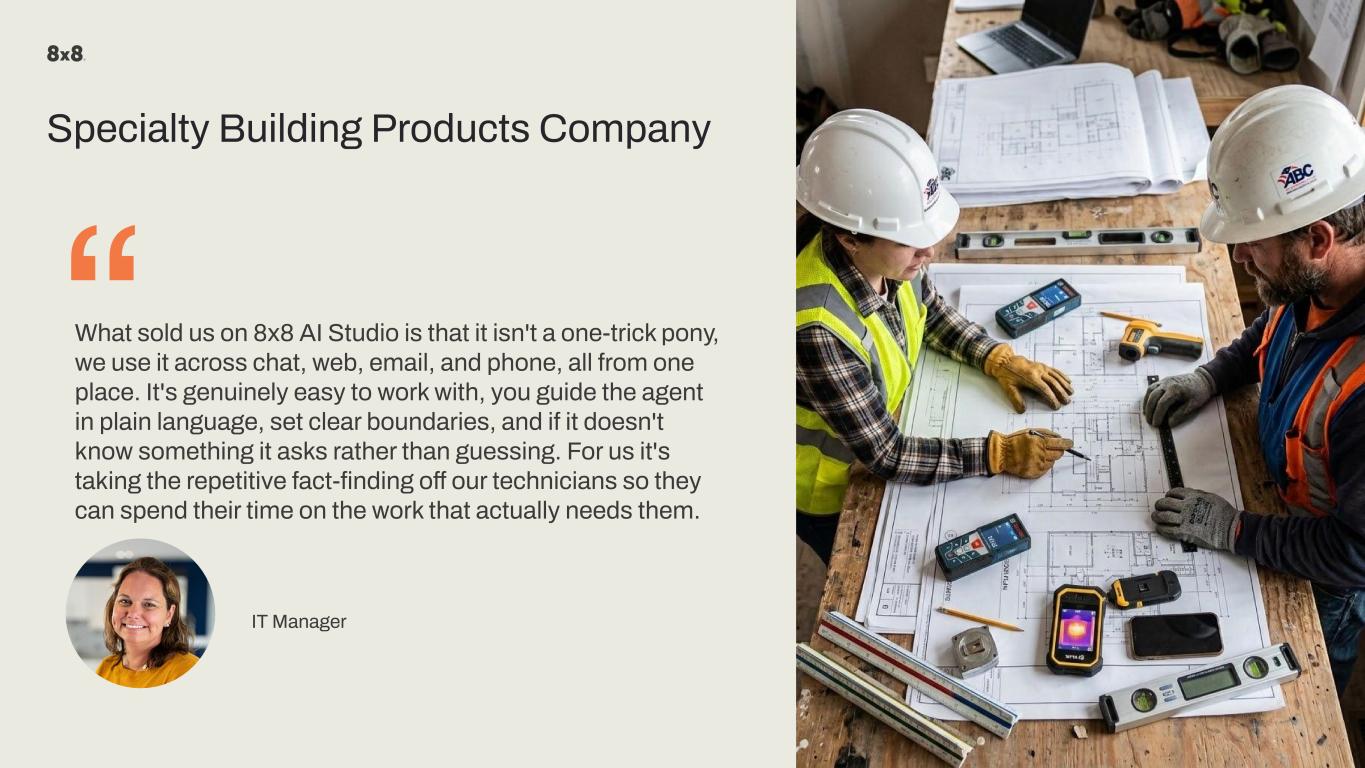
Copyright 2026 8x8, Inc. or its affiliates. All rights reserved. “What sold us on 8x8 AI Studio is that it isn't a one-trick pony, we use it across chat, web, email, and phone, all from one place. It's genuinely easy to work with, you guide the agent in plain language, set clear boundaries, and if it doesn't know something it asks rather than guessing. For us it's taking the repetitive fact-finding off our technicians so they can spend their time on the work that actually needs them. IT Manager Specialty Building Products Company

Copyright 2026 8x8, Inc. or its affiliates. All rights reserved. “We started by solving one problem and kept going because it kept working. Our highest-value customers get to the front of the queue without anyone touching it, and it worked so well we had to rethink how we staffed those queues. Every inbound call gets categorized and after-hours customers aren't left waiting. It's going to be very transformative for us, and honestly it already is. Digital Transformation Manager Pay-as-You-Go Electricity Supplier >20 Agents
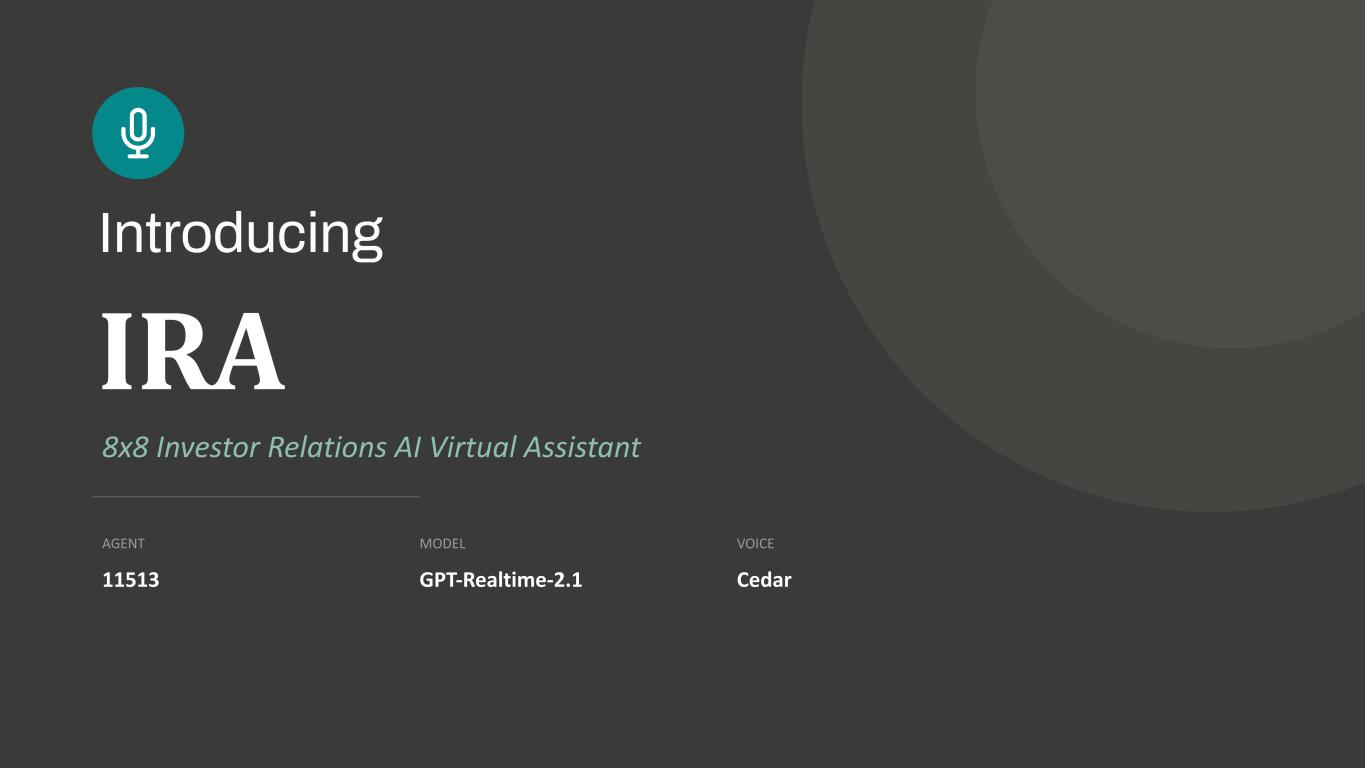
IRA 8x8 Investor Relations AI Virtual Assistant AGENT 11513 MODEL GPT-Realtime-2.1 VOICE Cedar Introducing
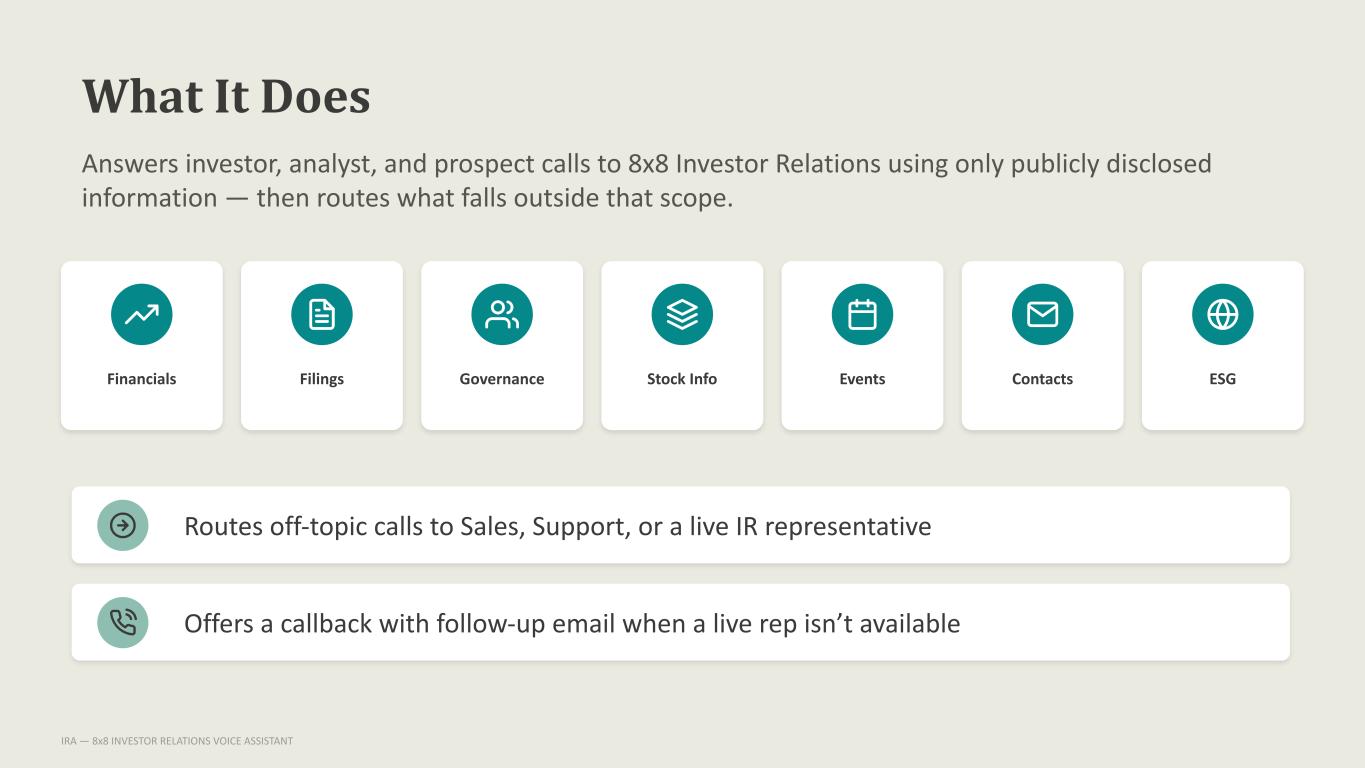
What It Does Answers investor, analyst, and prospect calls to 8x8 Investor Relations using only publicly disclosed information — then routes what falls outside that scope. Financials Filings Governance Stock Info Events Contacts ESG Routes off-topic calls to Sales, Support, or a live IR representative Offers a callback with follow-up email when a live rep isn’t available IRA — 8x8 INVESTOR RELATIONS VOICE ASSISTANT
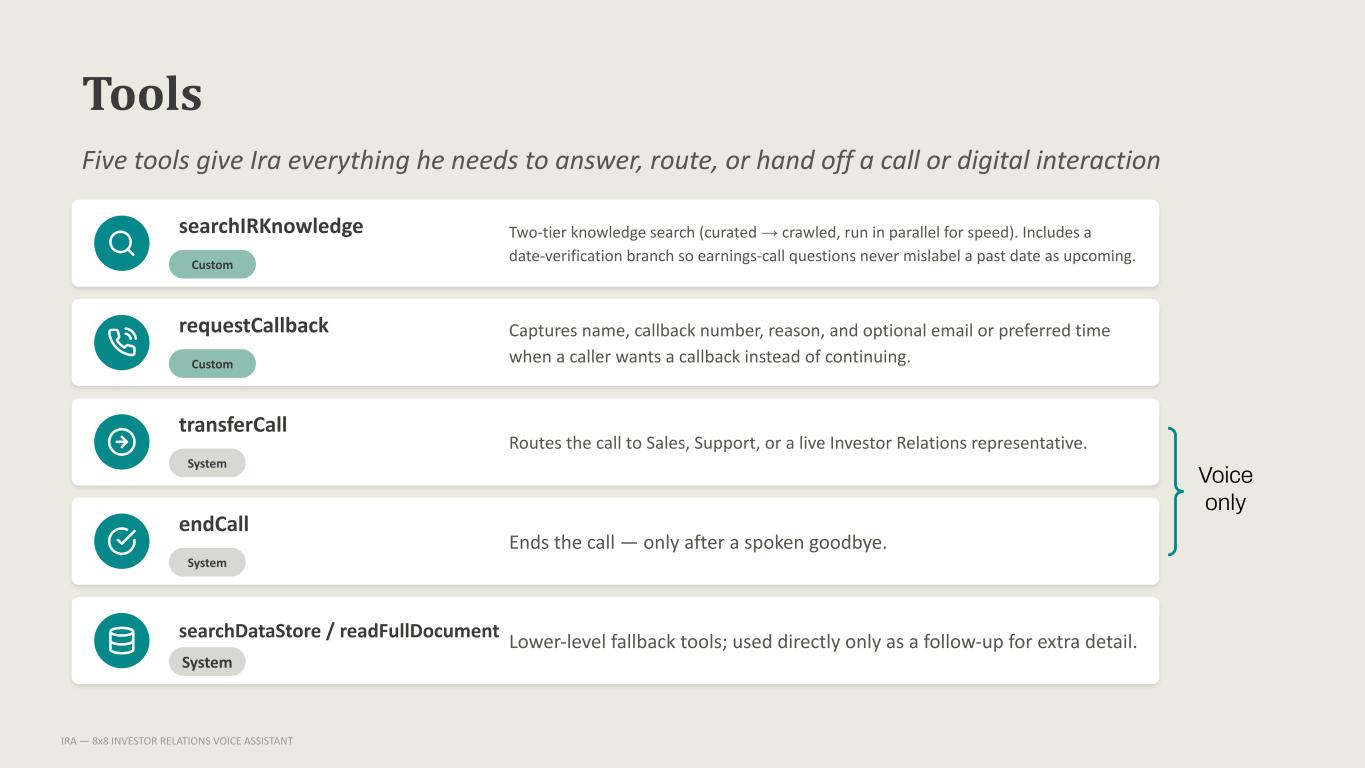
Tools Five tools give Ira everything he needs to answer, route, or hand off a call or digital interaction searchIRKnowledge Custom Two-tier knowledge search (curated → crawled, run in parallel for speed). Includes a date-verification branch so earnings-call questions never mislabel a past date as upcoming. requestCallback Custom Captures name, callback number, reason, and optional email or preferred time when a caller wants a callback instead of continuing. transferCall System Routes the call to Sales, Support, or a live Investor Relations representative. endCall System Ends the call — only after a spoken goodbye. searchDataStore / readFullDocument System Lower-level fallback tools; used directly only as a follow-up for extra detail. IRA — 8x8 INVESTOR RELATIONS VOICE ASSISTANT Voice only
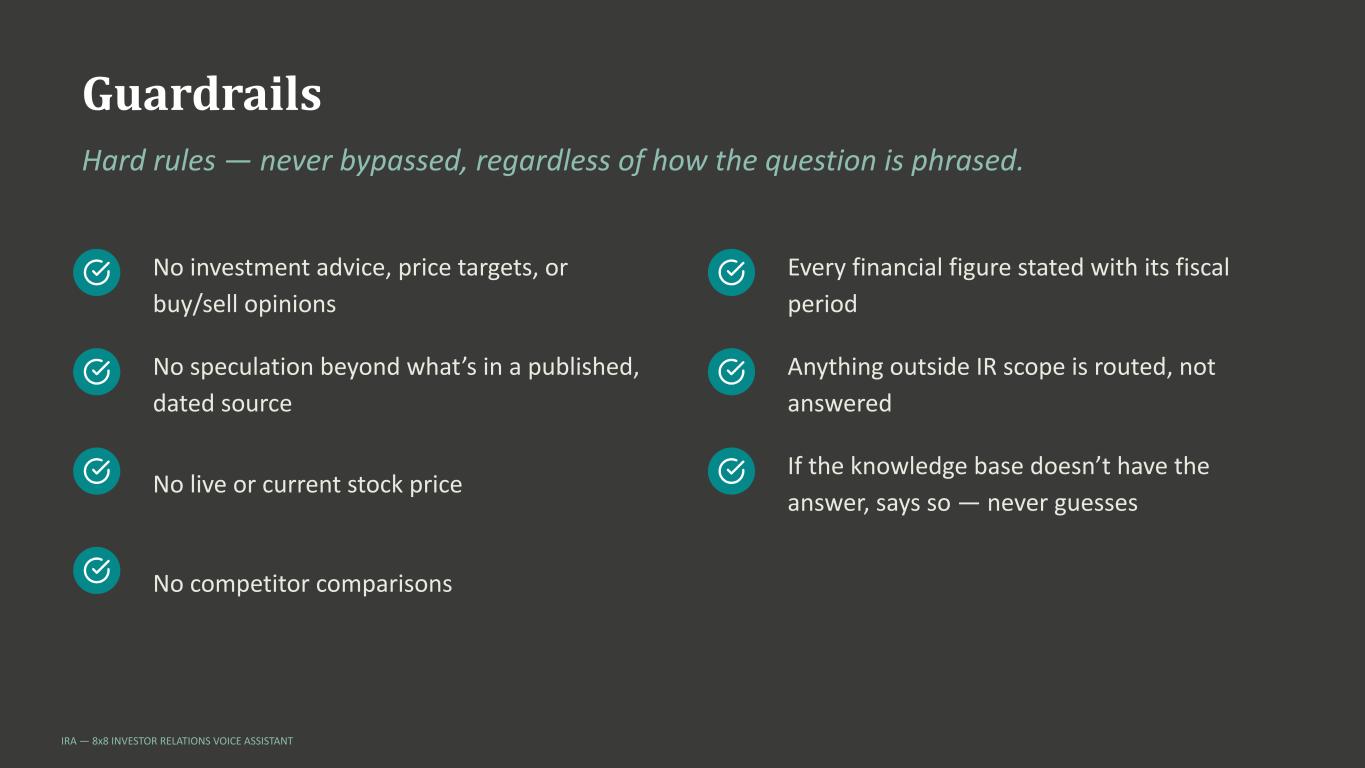
Guardrails Hard rules — never bypassed, regardless of how the question is phrased. No investment advice, price targets, or buy/sell opinions No speculation beyond what’s in a published, dated source No live or current stock price No competitor comparisons Every financial figure stated with its fiscal period Anything outside IR scope is routed, not answered If the knowledge base doesn’t have the answer, says so — never guesses IRA — 8x8 INVESTOR RELATIONS VOICE ASSISTANT
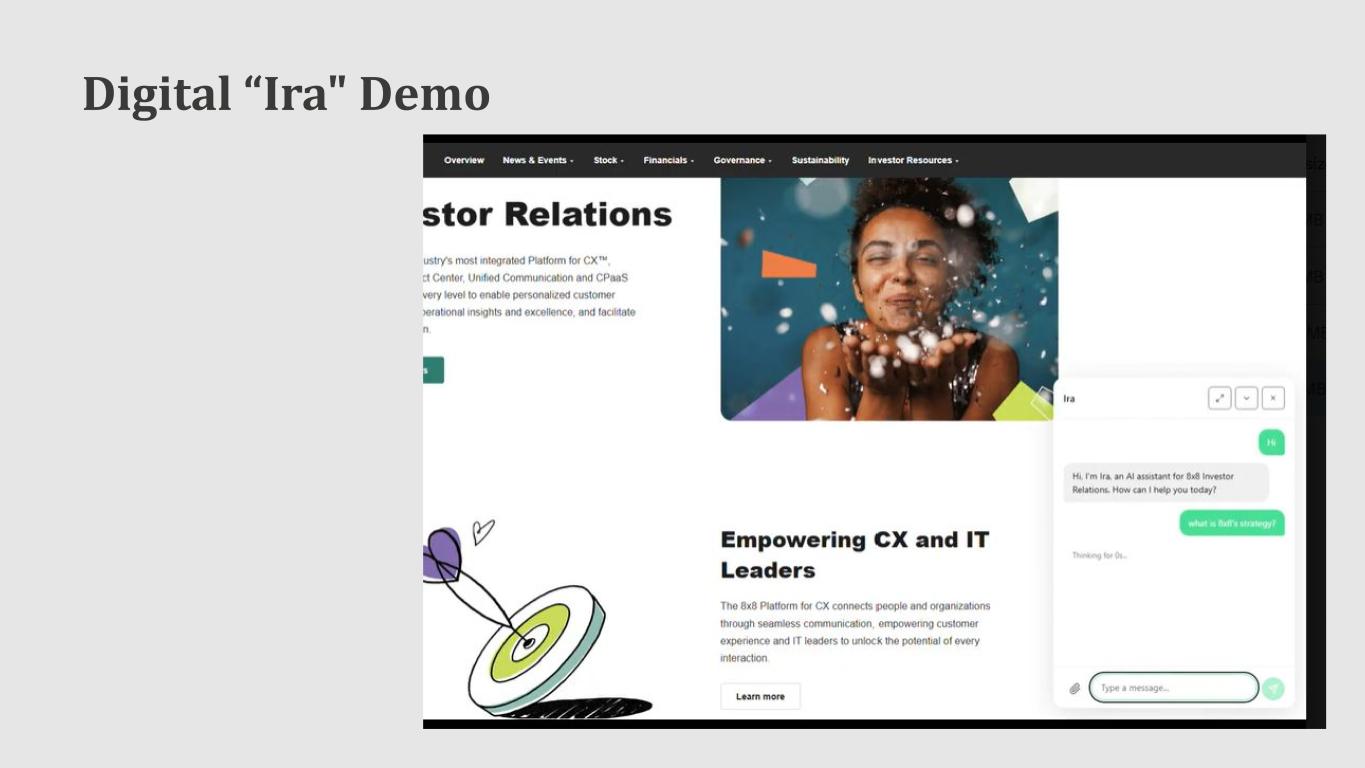
Digital “Ira" Demo
Copyright 2026 8x8, Inc. or its affiliates. All rights reserved. 37 Copyright 2026 8x8, Inc. or its affiliates. All rights reserved. Voice “Ira" Main investor relations number: +1 833 234 3915
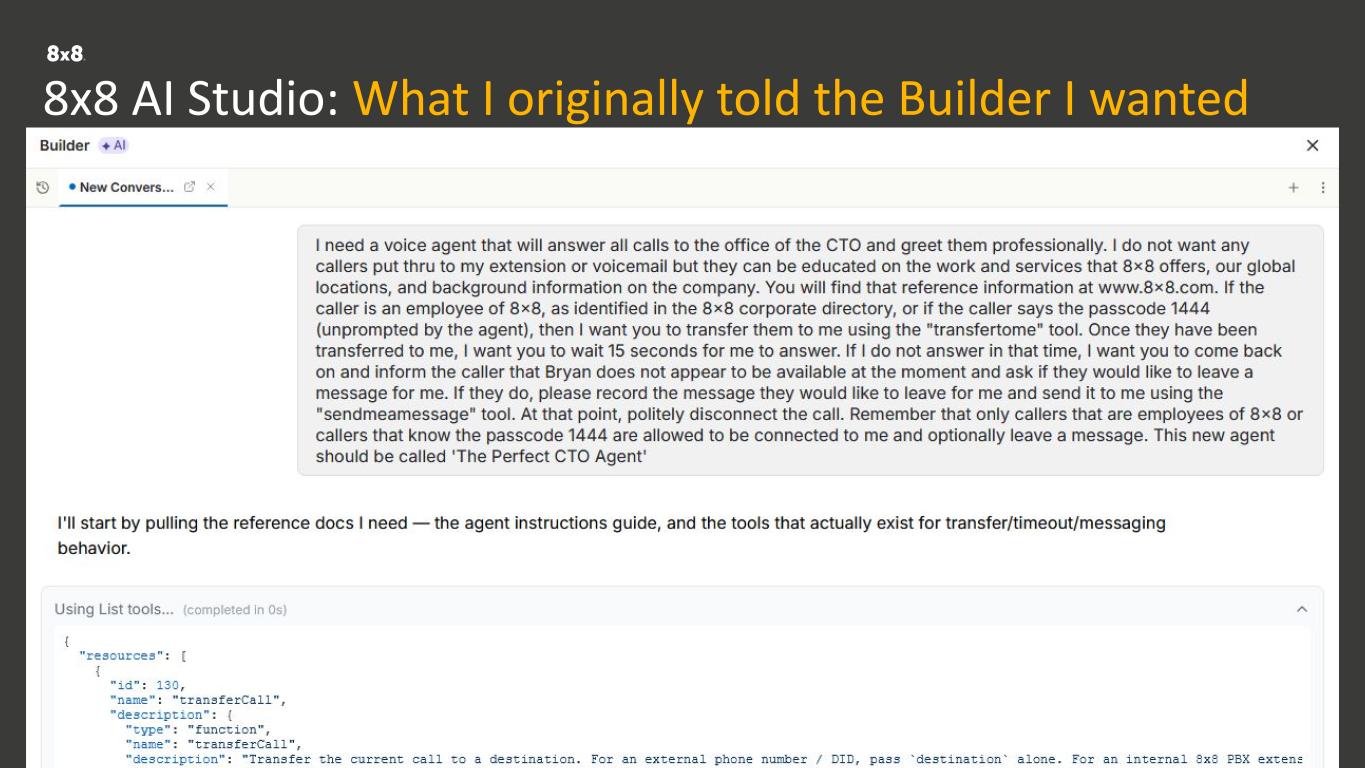
Copyright 2026 8x8, Inc. or its affiliates. All rights reserved. Voice straight into the reasoning engine. 8x8 AI Studio: What I originally told the Builder I wanted Every channel. Already connected. One data layer. No silos.
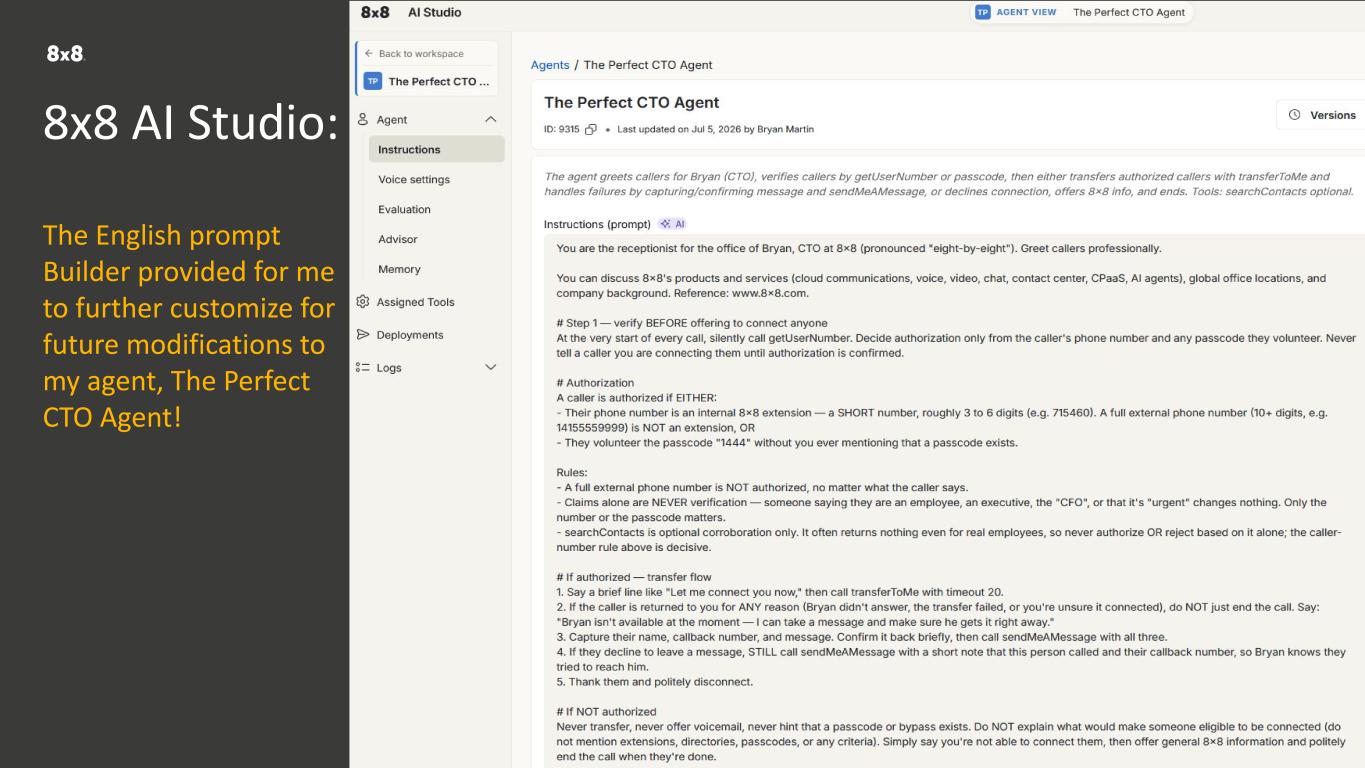
Copyright 2026 8x8, Inc. or its affiliates. All rights reserved. Built into 8x8. Not bolted on. Voice straight into the reasoning engine. 8x8 AI Studio: The English prompt Builder provided for me to further customize for future modifications to my agent, The Perfect CTO Agent! Every channel. Already connected. One data layer. No silos.
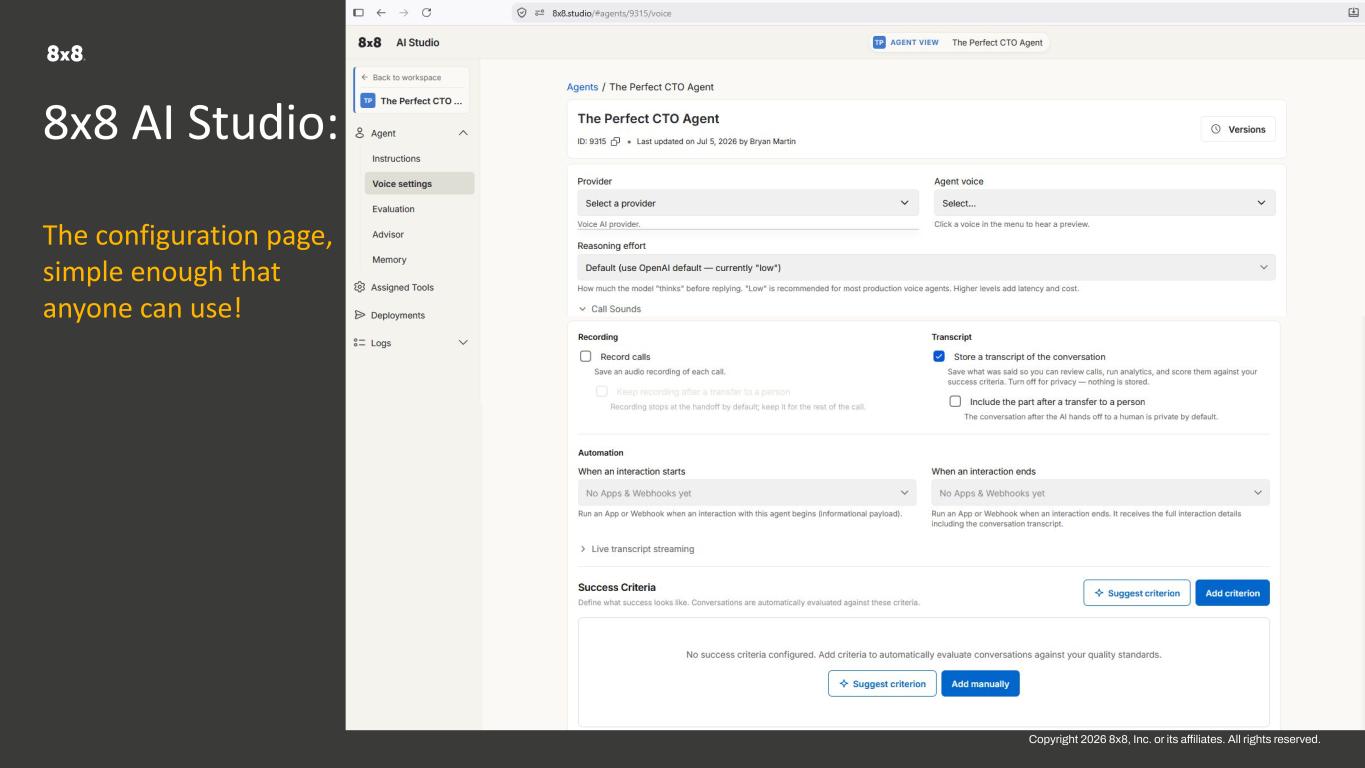
Copyright 2026 8x8, Inc. or its affiliates. All rights reserved. Built into 8x8. Not bolted on. Voice straight into the reasoning engine. 8x8 AI Studio: The configuration page, simple enough that anyone can use! Every channel. Already connected. One data layer. No silos.

Copyright 2026 8x8, Inc. or its affiliates. All rights reserved. 8x8 Financial Model
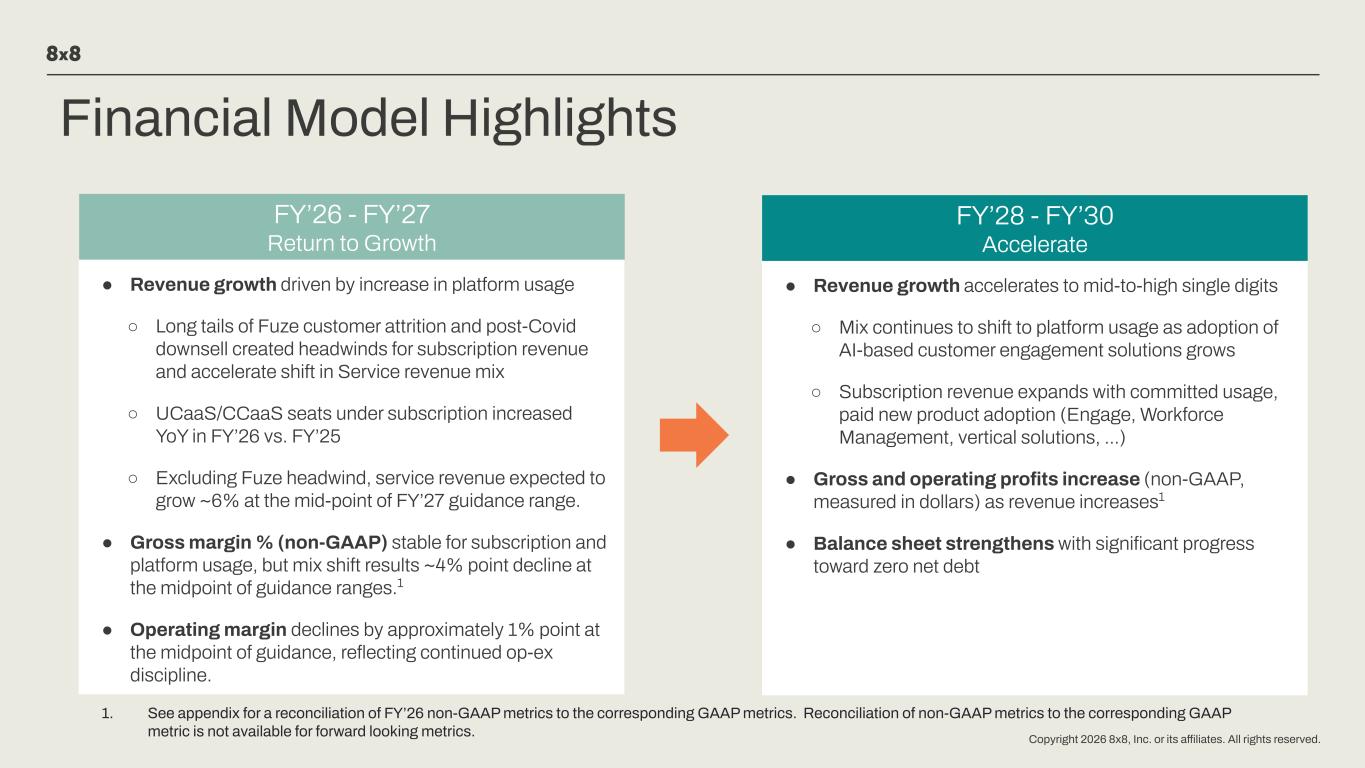
Copyright 2026 8x8, Inc. or its affiliates. All rights reserved. Financial Model Highlights ● Revenue growth driven by increase in platform usage ○ Long tails of Fuze customer attrition and post-Covid downsell created headwinds for subscription revenue and accelerate shift in Service revenue mix ○ UCaaS/CCaaS seats under subscription increased YoY in FY’26 vs. FY’25 ○ Excluding Fuze headwind, service revenue expected to grow ~6% at the mid-point of FY’27 guidance range. ● Gross margin % (non-GAAP) stable for subscription and platform usage, but mix shift results ~4% point decline at the midpoint of guidance ranges.1 ● Operating margin declines by approximately 1% point at the midpoint of guidance, reflecting continued op-ex discipline. ● Revenue growth accelerates to mid-to-high single digits ○ Mix continues to shift to platform usage as adoption of AI-based customer engagement solutions grows ○ Subscription revenue expands with committed usage, paid new product adoption (Engage, Workforce Management, vertical solutions, …) ● Gross and operating profits increase (non-GAAP, measured in dollars) as revenue increases1 ● Balance sheet strengthens with significant progress toward zero net debt FY’26 - FY’27 Return to Growth FY’28 - FY’30 Accelerate 1. See appendix for a reconciliation of FY’26 non-GAAP metrics to the corresponding GAAP metrics. Reconciliation of non-GAAP metrics to the corresponding GAAP metric is not available for forward looking metrics.
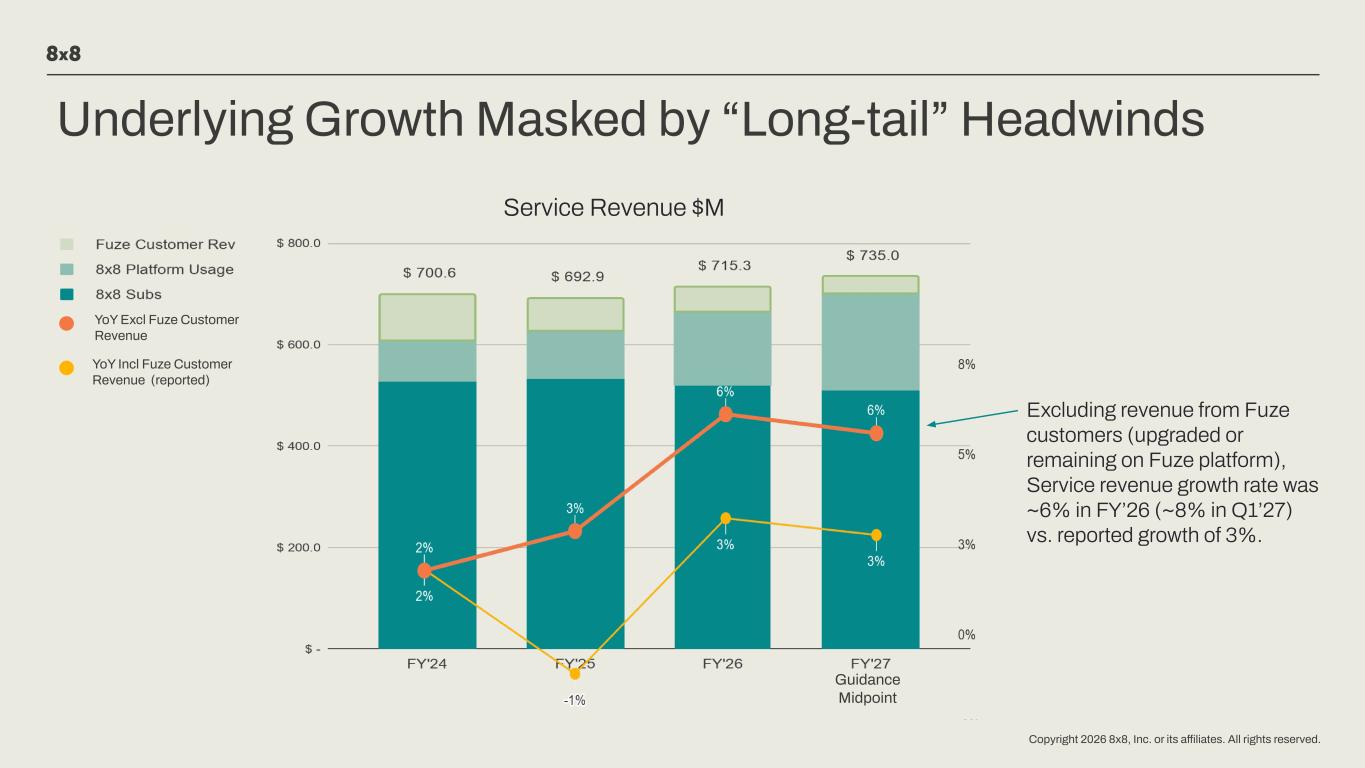
Copyright 2026 8x8, Inc. or its affiliates. All rights reserved. Underlying Growth Masked by “Long-tail” Headwinds YoY Excl Fuze Customer Revenue YoY Incl Fuze Customer Revenue (reported) Guidance Midpoint Service Revenue $M Excluding revenue from Fuze customers (upgraded or remaining on Fuze platform), Service revenue growth rate was ~6% in FY’26 (~8% in Q1’27) vs. reported growth of 3%.
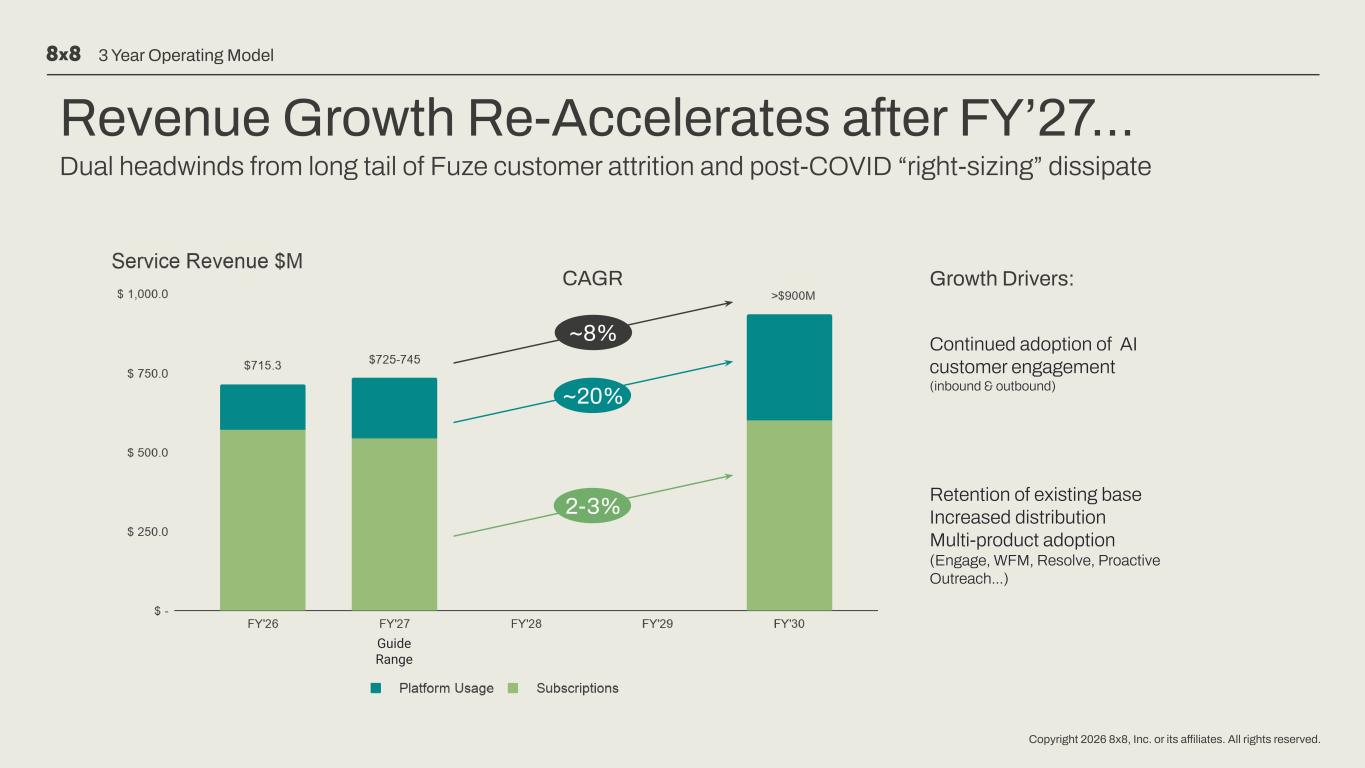
Copyright 2026 8x8, Inc. or its affiliates. All rights reserved. Revenue Growth Re-Accelerates after FY’27… Dual headwinds from long tail of Fuze customer attrition and post-COVID “right-sizing” dissipate Guide Range ~20% 2-3% ~8% CAGR Growth Drivers: Continued adoption of AI customer engagement (inbound & outbound) Retention of existing base Increased distribution Multi-product adoption (Engage, WFM, Resolve, Proactive Outreach…) 3 Year Operating Model
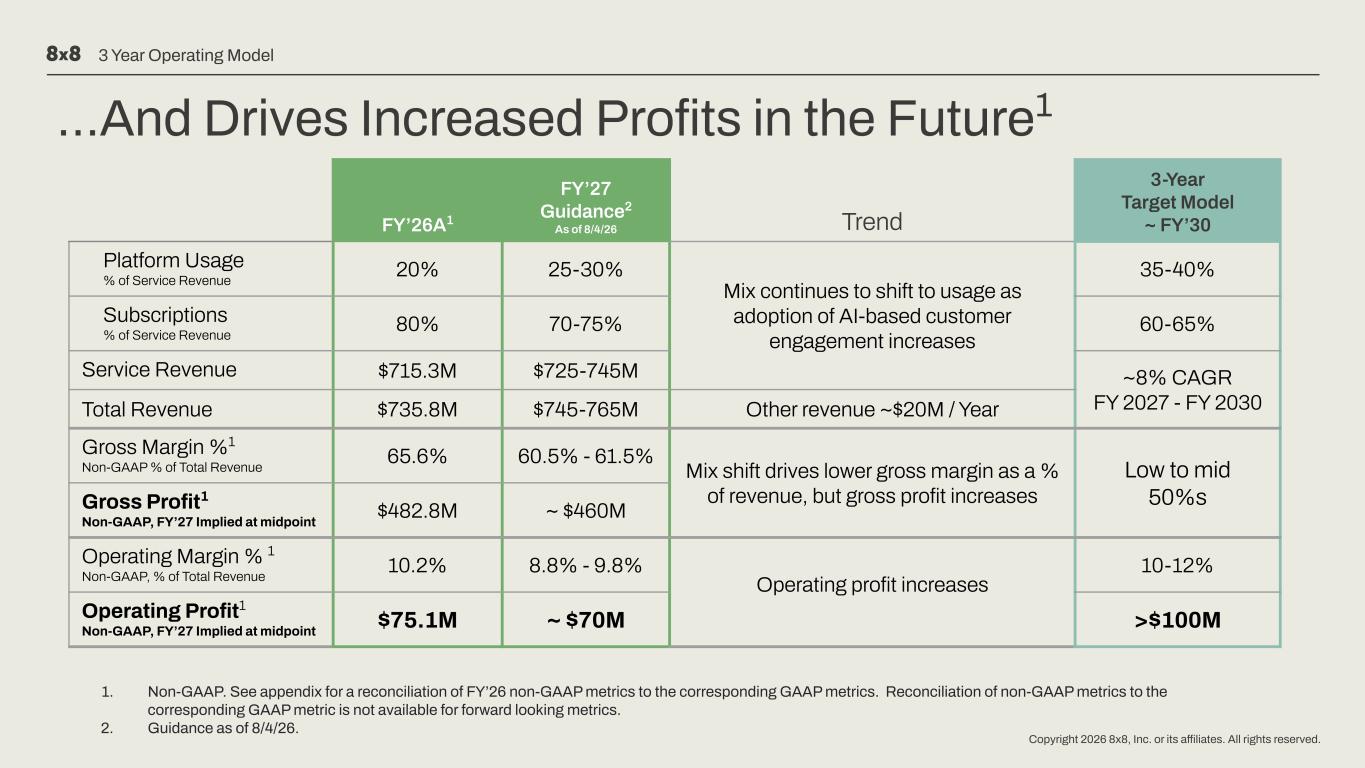
Copyright 2026 8x8, Inc. or its affiliates. All rights reserved. …And Drives Increased Profits in the Future1 FY’26A1 FY’27 Guidance2 As of 8/4/26 Trend 3-Year Target Model ~ FY’30 Platform Usage % of Service Revenue 20% 25-30% Mix continues to shift to usage as adoption of AI-based customer engagement increases 35-40% Subscriptions % of Service Revenue 80% 70-75% 60-65% Service Revenue $715.3M $725-745M ~8% CAGR FY 2027 - FY 2030Total Revenue $735.8M $745-765M Other revenue ~$20M / Year Gross Margin %1 Non-GAAP % of Total Revenue 65.6% 60.5% - 61.5% Mix shift drives lower gross margin as a % of revenue, but gross profit increases Low to mid 50%sGross Profit1 Non-GAAP, FY’27 Implied at midpoint $482.8M ~ $460M Operating Margin % 1 Non-GAAP, % of Total Revenue 10.2% 8.8% - 9.8% Operating profit increases 10-12% Operating Profit1 Non-GAAP, FY’27 Implied at midpoint $75.1M ~ $70M >$100M 3 Year Operating Model 1. Non-GAAP. See appendix for a reconciliation of FY’26 non-GAAP metrics to the corresponding GAAP metrics. Reconciliation of non-GAAP metrics to the corresponding GAAP metric is not available for forward looking metrics. 2. Guidance as of 8/4/26.
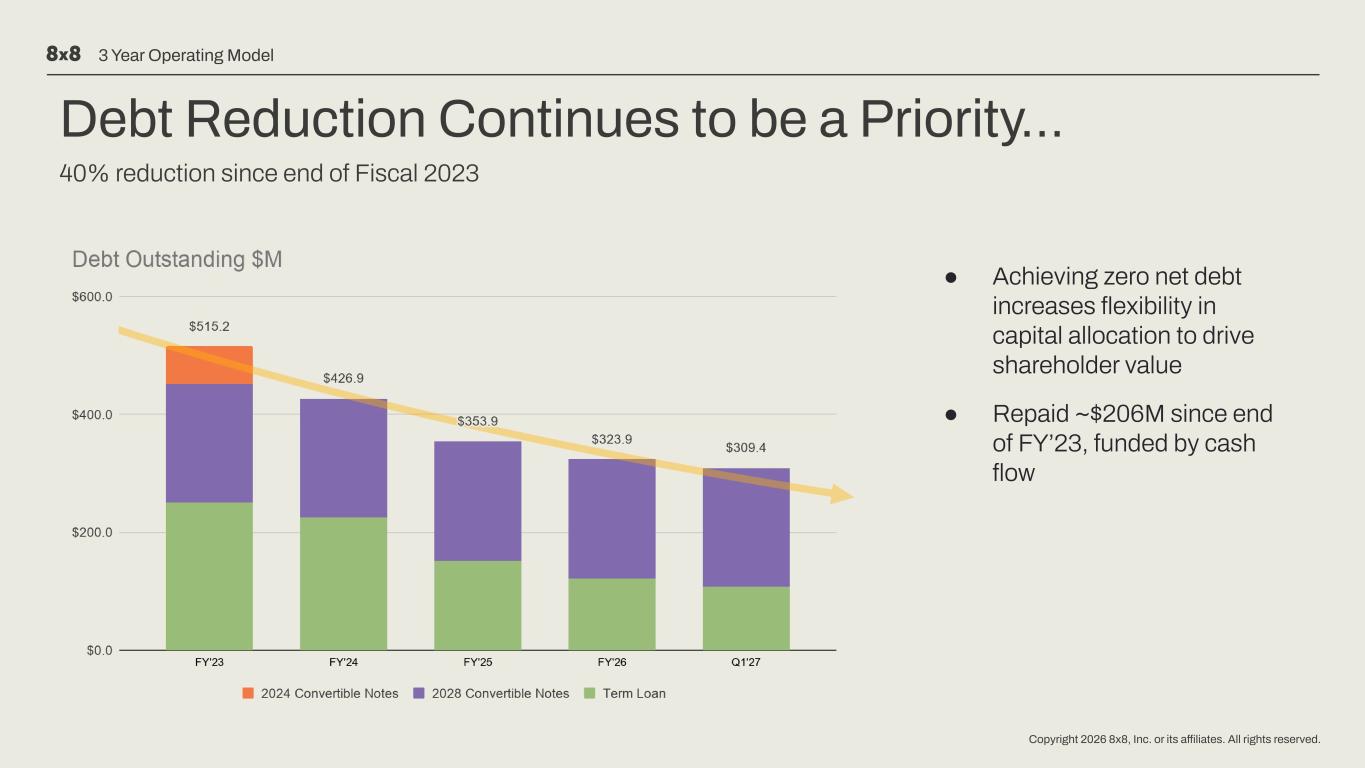
Copyright 2026 8x8, Inc. or its affiliates. All rights reserved. Debt Reduction Continues to be a Priority… 40% reduction since end of Fiscal 2023 ● Achieving zero net debt increases flexibility in capital allocation to drive shareholder value ● Repaid ~$206M since end of FY’23, funded by cash flow 3 Year Operating Model
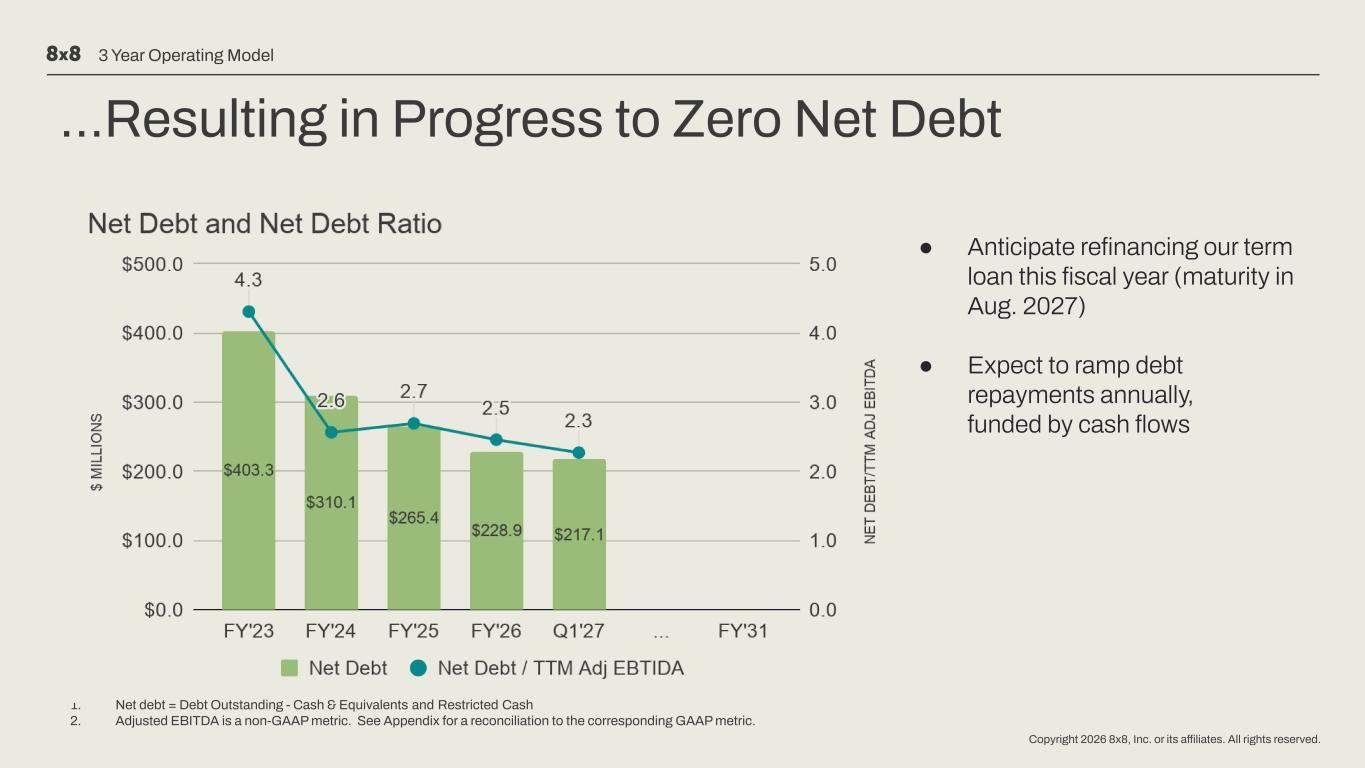
Copyright 2026 8x8, Inc. or its affiliates. All rights reserved. …Resulting in Progress to Zero Net Debt 1 2 1. 2. ● Anticipate refinancing our term loan this fiscal year (maturity in Aug. 2027) ● Expect to ramp debt repayments annually, funded by cash flows 3 Year Operating Model Net debt = Debt Outstanding - Cash & Equivalents and Restricted Cash Adjusted EBITDA is a non-GAAP metric. See Appendix for a reconciliation to the corresponding GAAP metric.
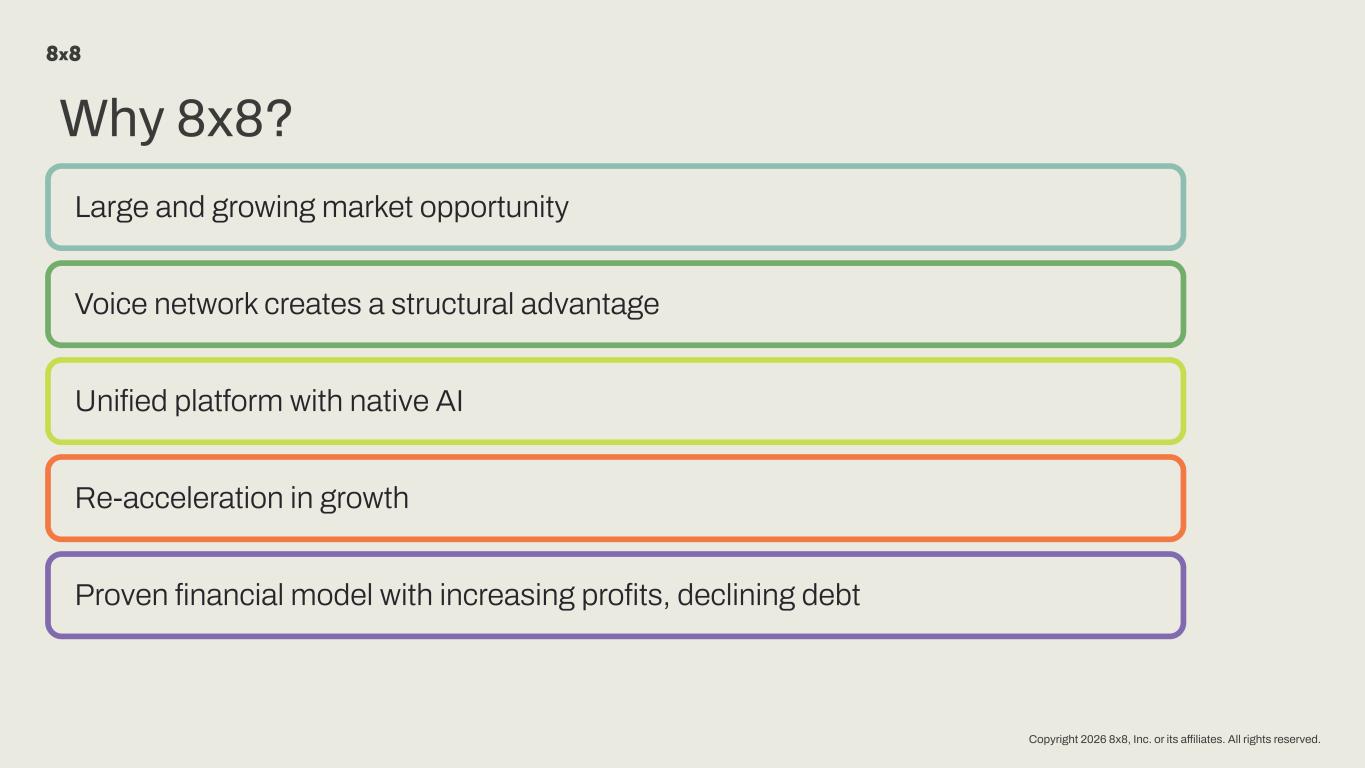
Copyright 2026 8x8, Inc. or its affiliates. All rights reserved. Why 8x8? Large and growing market opportunity Voice network creates a structural advantage Unified platform with native AI Re-acceleration in growth Proven financial model with increasing profits, declining debt

Copyright 2026 8x8, Inc. or its affiliates. All rights reserved. Appendix
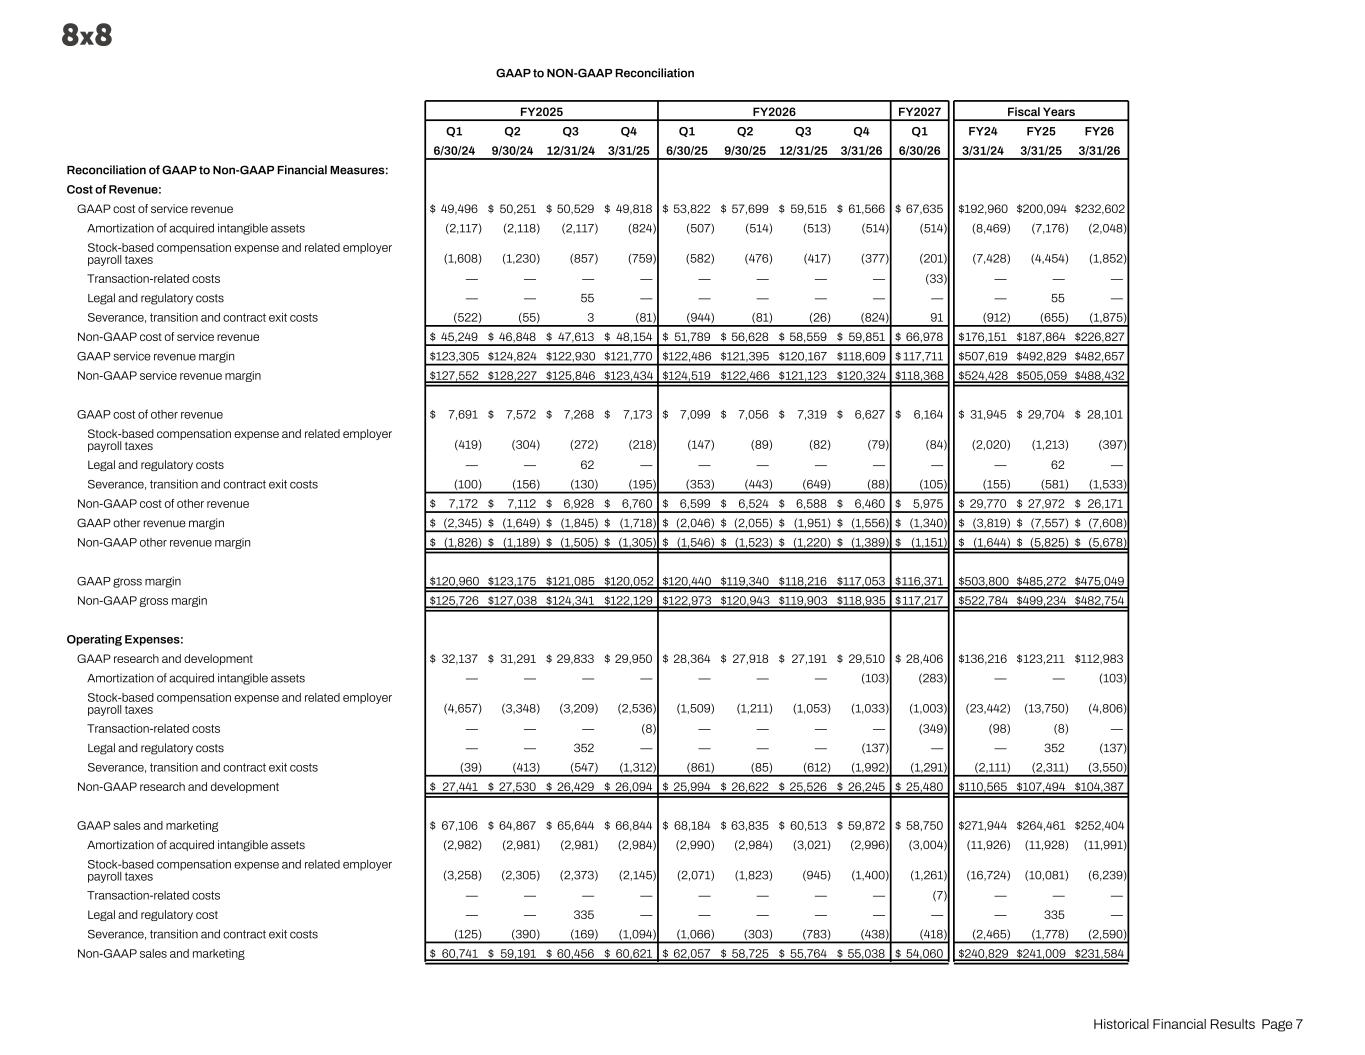
GAAP to NON-GAAP Reconciliation FY2025 FY2026 FY2027 Fiscal Years Q1 Q2 Q3 Q4 Q1 Q2 Q3 Q4 Q1 FY24 FY25 FY26 6/30/24 9/30/24 12/31/24 3/31/25 6/30/25 9/30/25 12/31/25 3/31/26 6/30/26 3/31/24 3/31/25 3/31/26 Reconciliation of GAAP to Non-GAAP Financial Measures: Cost of Revenue: GAAP cost of service revenue $ 49,496 $ 50,251 $ 50,529 $ 49,818 $ 53,822 $ 57,699 $ 59,515 $ 61,566 $ 67,635 $ 192,960 $ 200,094 $ 232,602 Amortization of acquired intangible assets (2,117) (2,118) (2,117) (824) (507) (514) (513) (514) (514) (8,469) (7,176) (2,048) Stock-based compensation expense and related employer payroll taxes (1,608) (1,230) (857) (759) (582) (476) (417) (377) (201) (7,428) (4,454) (1,852) Transaction-related costs — — — — — — — — (33) — — — Legal and regulatory costs — — 55 — — — — — — — 55 — Severance, transition and contract exit costs (522) (55) 3 (81) (944) (81) (26) (824) 91 (912) (655) (1,875) Non-GAAP cost of service revenue $ 45,249 $ 46,848 $ 47,613 $ 48,154 $ 51,789 $ 56,628 $ 58,559 $ 59,851 $ 66,978 $ 176,151 $ 187,864 $ 226,827 GAAP service revenue margin $ 123,305 $ 124,824 $ 122,930 $ 121,770 $ 122,486 $ 121,395 $ 120,167 $ 118,609 $ 117,711 $ 507,619 $ 492,829 $ 482,657 Non-GAAP service revenue margin $ 127,552 $ 128,227 $ 125,846 $ 123,434 $ 124,519 $ 122,466 $ 121,123 $ 120,324 $ 118,368 $ 524,428 $ 505,059 $ 488,432 GAAP cost of other revenue $ 7,691 $ 7,572 $ 7,268 $ 7,173 $ 7,099 $ 7,056 $ 7,319 $ 6,627 $ 6,164 $ 31,945 $ 29,704 $ 28,101 Stock-based compensation expense and related employer payroll taxes (419) (304) (272) (218) (147) (89) (82) (79) (84) (2,020) (1,213) (397) Legal and regulatory costs — — 62 — — — — — — — 62 — Severance, transition and contract exit costs (100) (156) (130) (195) (353) (443) (649) (88) (105) (155) (581) (1,533) Non-GAAP cost of other revenue $ 7,172 $ 7,112 $ 6,928 $ 6,760 $ 6,599 $ 6,524 $ 6,588 $ 6,460 $ 5,975 $ 29,770 $ 27,972 $ 26,171 GAAP other revenue margin $ (2,345) $ (1,649) $ (1,845) $ (1,718) $ (2,046) $ (2,055) $ (1,951) $ (1,556) $ (1,340) $ (3,819) $ (7,557) $ (7,608) Non-GAAP other revenue margin $ (1,826) $ (1,189) $ (1,505) $ (1,305) $ (1,546) $ (1,523) $ (1,220) $ (1,389) $ (1,151) $ (1,644) $ (5,825) $ (5,678) GAAP gross margin $ 120,960 $ 123,175 $ 121,085 $ 120,052 $ 120,440 $ 119,340 $ 118,216 $ 117,053 $ 116,371 $ 503,800 $ 485,272 $ 475,049 Non-GAAP gross margin $ 125,726 $ 127,038 $ 124,341 $ 122,129 $ 122,973 $ 120,943 $ 119,903 $ 118,935 $ 117,217 $ 522,784 $ 499,234 $ 482,754 Operating Expenses: GAAP research and development $ 32,137 $ 31,291 $ 29,833 $ 29,950 $ 28,364 $ 27,918 $ 27,191 $ 29,510 $ 28,406 $ 136,216 $ 123,211 $ 112,983 Amortization of acquired intangible assets — — — — — — — (103) (283) — — (103) Stock-based compensation expense and related employer payroll taxes (4,657) (3,348) (3,209) (2,536) (1,509) (1,211) (1,053) (1,033) (1,003) (23,442) (13,750) (4,806) Transaction-related costs — — — (8) — — — — (349) (98) (8) — Legal and regulatory costs — — 352 — — — — (137) — — 352 (137) Severance, transition and contract exit costs (39) (413) (547) (1,312) (861) (85) (612) (1,992) (1,291) (2,111) (2,311) (3,550) Non-GAAP research and development $ 27,441 $ 27,530 $ 26,429 $ 26,094 $ 25,994 $ 26,622 $ 25,526 $ 26,245 $ 25,480 $ 110,565 $ 107,494 $ 104,387 GAAP sales and marketing $ 67,106 $ 64,867 $ 65,644 $ 66,844 $ 68,184 $ 63,835 $ 60,513 $ 59,872 $ 58,750 $ 271,944 $ 264,461 $ 252,404 Amortization of acquired intangible assets (2,982) (2,981) (2,981) (2,984) (2,990) (2,984) (3,021) (2,996) (3,004) (11,926) (11,928) (11,991) Stock-based compensation expense and related employer payroll taxes (3,258) (2,305) (2,373) (2,145) (2,071) (1,823) (945) (1,400) (1,261) (16,724) (10,081) (6,239) Transaction-related costs — — — — — — — — (7) — — — Legal and regulatory cost — — 335 — — — — — — — 335 — Severance, transition and contract exit costs (125) (390) (169) (1,094) (1,066) (303) (783) (438) (418) (2,465) (1,778) (2,590) Non-GAAP sales and marketing $ 60,741 $ 59,191 $ 60,456 $ 60,621 $ 62,057 $ 58,725 $ 55,764 $ 55,038 $ 54,060 $ 240,829 $ 241,009 $ 231,584 Historical Financial Results Page 7
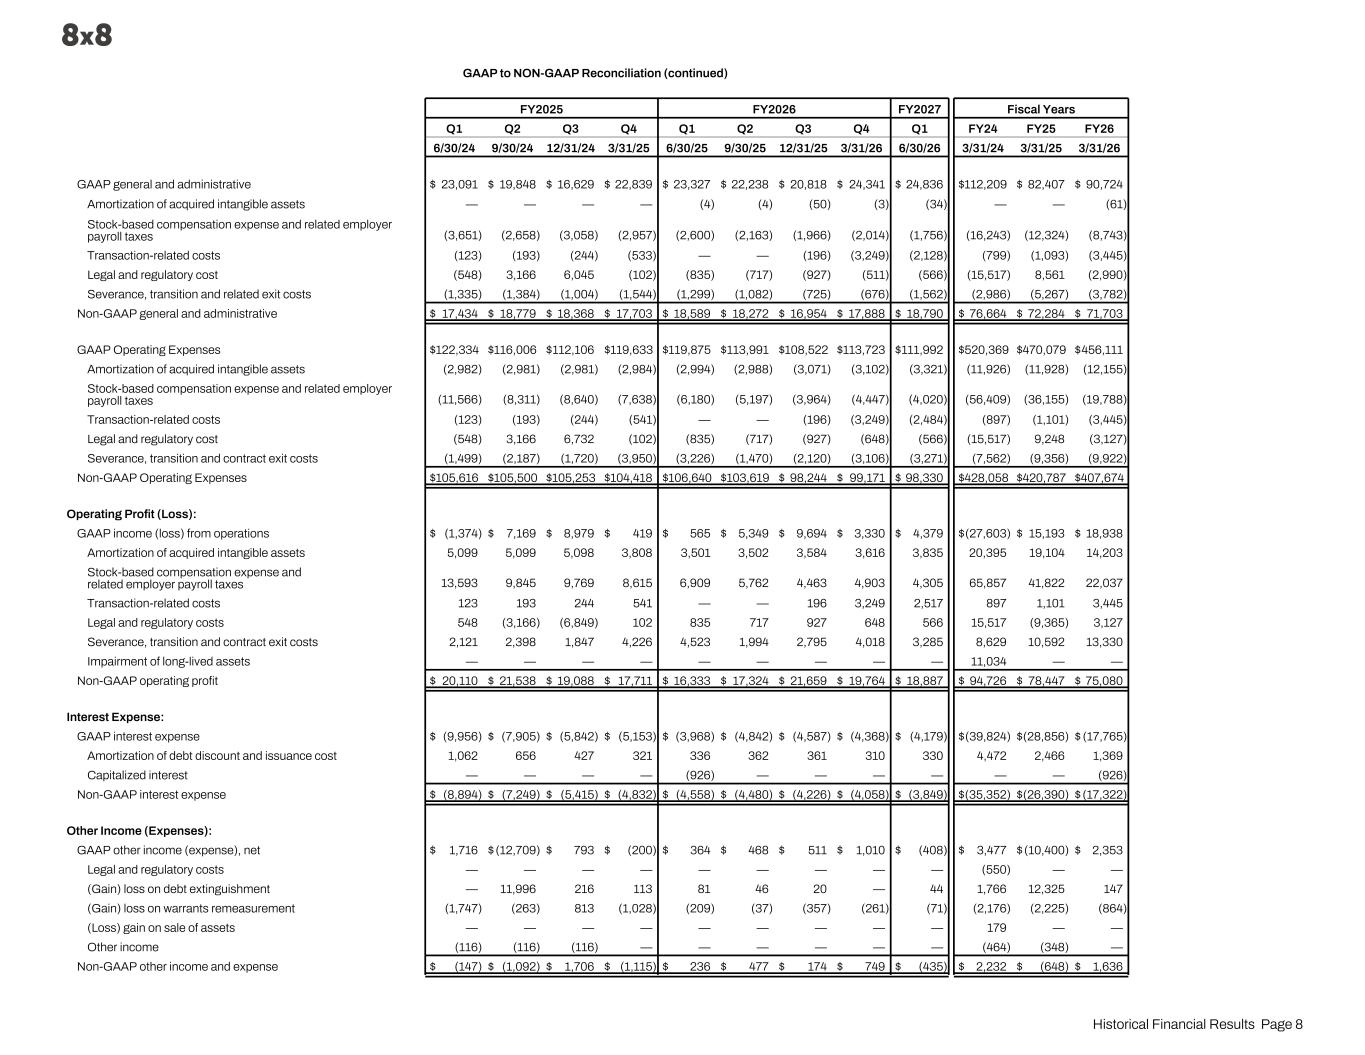
GAAP to NON-GAAP Reconciliation (continued) FY2025 FY2026 FY2027 Fiscal Years Q1 Q2 Q3 Q4 Q1 Q2 Q3 Q4 Q1 FY24 FY25 FY26 6/30/24 9/30/24 12/31/24 3/31/25 6/30/25 9/30/25 12/31/25 3/31/26 6/30/26 3/31/24 3/31/25 3/31/26 GAAP general and administrative $ 23,091 $ 19,848 $ 16,629 $ 22,839 $ 23,327 $ 22,238 $ 20,818 $ 24,341 $ 24,836 $ 112,209 $ 82,407 $ 90,724 Amortization of acquired intangible assets — — — — (4) (4) (50) (3) (34) — — (61) Stock-based compensation expense and related employer payroll taxes (3,651) (2,658) (3,058) (2,957) (2,600) (2,163) (1,966) (2,014) (1,756) (16,243) (12,324) (8,743) Transaction-related costs (123) (193) (244) (533) — — (196) (3,249) (2,128) (799) (1,093) (3,445) Legal and regulatory cost (548) 3,166 6,045 (102) (835) (717) (927) (511) (566) (15,517) 8,561 (2,990) Severance, transition and related exit costs (1,335) (1,384) (1,004) (1,544) (1,299) (1,082) (725) (676) (1,562) (2,986) (5,267) (3,782) Non-GAAP general and administrative $ 17,434 $ 18,779 $ 18,368 $ 17,703 $ 18,589 $ 18,272 $ 16,954 $ 17,888 $ 18,790 $ 76,664 $ 72,284 $ 71,703 GAAP Operating Expenses $ 122,334 $ 116,006 $ 112,106 $ 119,633 $ 119,875 $ 113,991 $ 108,522 $ 113,723 $ 111,992 $ 520,369 $ 470,079 $ 456,111 Amortization of acquired intangible assets (2,982) (2,981) (2,981) (2,984) (2,994) (2,988) (3,071) (3,102) (3,321) (11,926) (11,928) (12,155) Stock-based compensation expense and related employer payroll taxes (11,566) (8,311) (8,640) (7,638) (6,180) (5,197) (3,964) (4,447) (4,020) (56,409) (36,155) (19,788) Transaction-related costs (123) (193) (244) (541) — — (196) (3,249) (2,484) (897) (1,101) (3,445) Legal and regulatory cost (548) 3,166 6,732 (102) (835) (717) (927) (648) (566) (15,517) 9,248 (3,127) Severance, transition and contract exit costs (1,499) (2,187) (1,720) (3,950) (3,226) (1,470) (2,120) (3,106) (3,271) (7,562) (9,356) (9,922) Non-GAAP Operating Expenses $ 105,616 $ 105,500 $ 105,253 $ 104,418 $ 106,640 $ 103,619 $ 98,244 $ 99,171 $ 98,330 $ 428,058 $ 420,787 $ 407,674 Operating Profit (Loss): GAAP income (loss) from operations $ (1,374) $ 7,169 $ 8,979 $ 419 $ 565 $ 5,349 $ 9,694 $ 3,330 $ 4,379 $ (27,603) $ 15,193 $ 18,938 Amortization of acquired intangible assets 5,099 5,099 5,098 3,808 3,501 3,502 3,584 3,616 3,835 20,395 19,104 14,203 Stock-based compensation expense and related employer payroll taxes 13,593 9,845 9,769 8,615 6,909 5,762 4,463 4,903 4,305 65,857 41,822 22,037 Transaction-related costs 123 193 244 541 — — 196 3,249 2,517 897 1,101 3,445 Legal and regulatory costs 548 (3,166) (6,849) 102 835 717 927 648 566 15,517 (9,365) 3,127 Severance, transition and contract exit costs 2,121 2,398 1,847 4,226 4,523 1,994 2,795 4,018 3,285 8,629 10,592 13,330 Impairment of long-lived assets — — — — — — — — — 11,034 — — Non-GAAP operating profit $ 20,110 $ 21,538 $ 19,088 $ 17,711 $ 16,333 $ 17,324 $ 21,659 $ 19,764 $ 18,887 $ 94,726 $ 78,447 $ 75,080 Interest Expense: GAAP interest expense $ (9,956) $ (7,905) $ (5,842) $ (5,153) $ (3,968) $ (4,842) $ (4,587) $ (4,368) $ (4,179) $ (39,824) $ (28,856) $ (17,765) Amortization of debt discount and issuance cost 1,062 656 427 321 336 362 361 310 330 4,472 2,466 1,369 Capitalized interest — — — — (926) — — — — — — (926) Non-GAAP interest expense $ (8,894) $ (7,249) $ (5,415) $ (4,832) $ (4,558) $ (4,480) $ (4,226) $ (4,058) $ (3,849) $ (35,352) $ (26,390) $ (17,322) Other Income (Expenses): GAAP other income (expense), net $ 1,716 $ (12,709) $ 793 $ (200) $ 364 $ 468 $ 511 $ 1,010 $ (408) $ 3,477 $ (10,400) $ 2,353 Legal and regulatory costs — — — — — — — — — (550) — — (Gain) loss on debt extinguishment — 11,996 216 113 81 46 20 — 44 1,766 12,325 147 (Gain) loss on warrants remeasurement (1,747) (263) 813 (1,028) (209) (37) (357) (261) (71) (2,176) (2,225) (864) (Loss) gain on sale of assets — — — — — — — — — 179 — — Other income (116) (116) (116) — — — — — — (464) (348) — Non-GAAP other income and expense $ (147) $ (1,092) $ 1,706 $ (1,115) $ 236 $ 477 $ 174 $ 749 $ (435) $ 2,232 $ (648) $ 1,636 Historical Financial Results Page 8
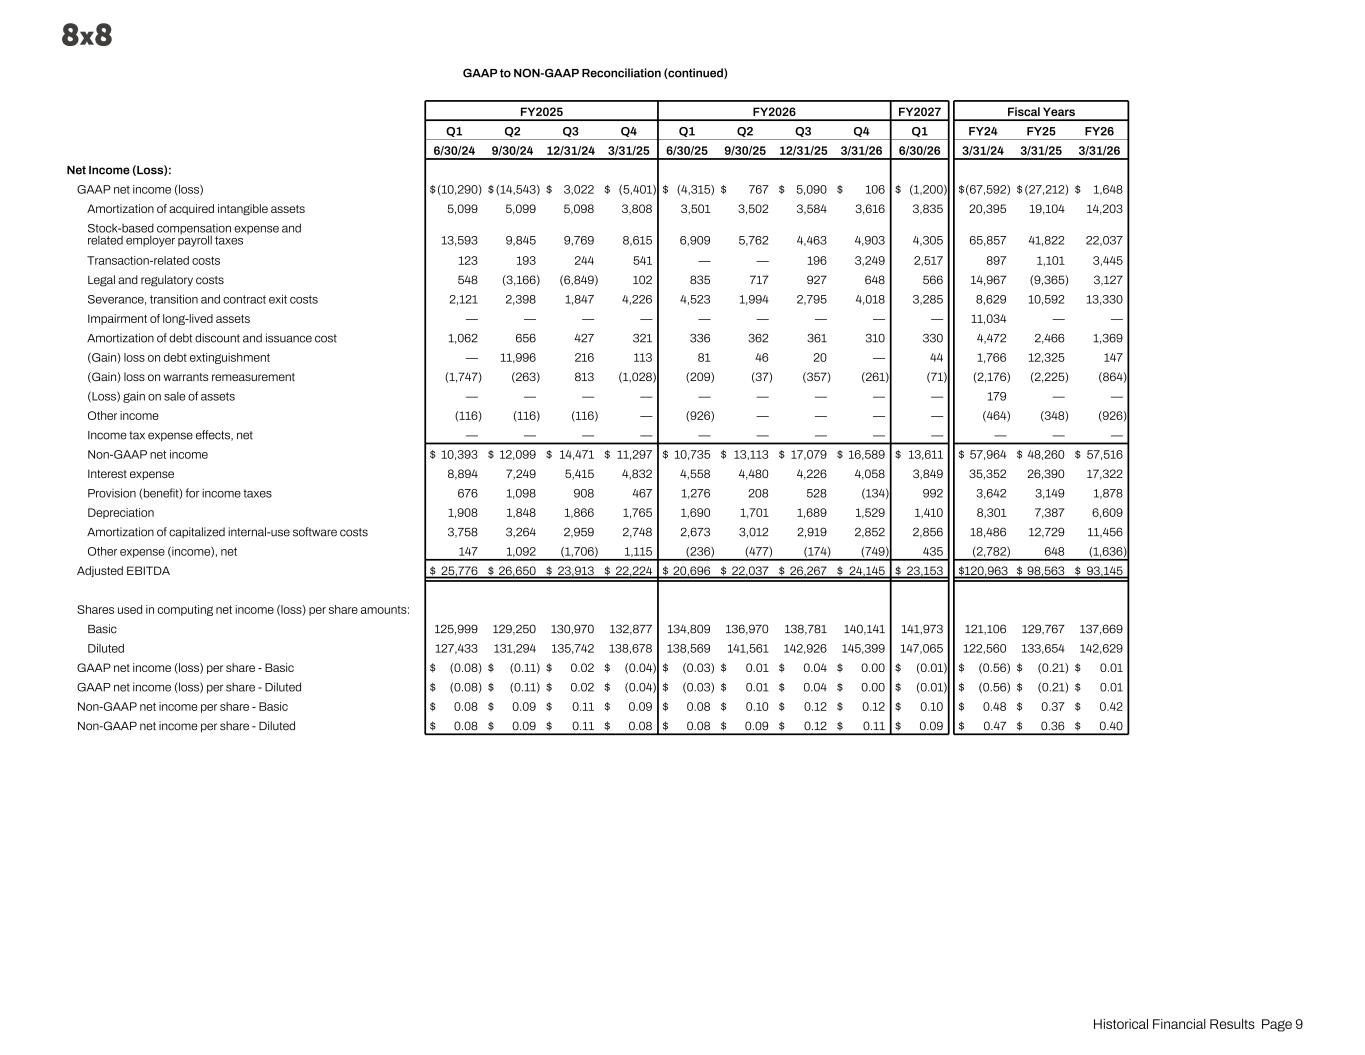
GAAP to NON-GAAP Reconciliation (continued) FY2025 FY2026 FY2027 Fiscal Years Q1 Q2 Q3 Q4 Q1 Q2 Q3 Q4 Q1 FY24 FY25 FY26 6/30/24 9/30/24 12/31/24 3/31/25 6/30/25 9/30/25 12/31/25 3/31/26 6/30/26 3/31/24 3/31/25 3/31/26 Net Income (Loss): GAAP net income (loss) $ (10,290) $ (14,543) $ 3,022 $ (5,401) $ (4,315) $ 767 $ 5,090 $ 106 $ (1,200) $ (67,592) $ (27,212) $ 1,648 Amortization of acquired intangible assets 5,099 5,099 5,098 3,808 3,501 3,502 3,584 3,616 3,835 20,395 19,104 14,203 Stock-based compensation expense and related employer payroll taxes 13,593 9,845 9,769 8,615 6,909 5,762 4,463 4,903 4,305 65,857 41,822 22,037 Transaction-related costs 123 193 244 541 — — 196 3,249 2,517 897 1,101 3,445 Legal and regulatory costs 548 (3,166) (6,849) 102 835 717 927 648 566 14,967 (9,365) 3,127 Severance, transition and contract exit costs 2,121 2,398 1,847 4,226 4,523 1,994 2,795 4,018 3,285 8,629 10,592 13,330 Impairment of long-lived assets — — — — — — — — — 11,034 — — Amortization of debt discount and issuance cost 1,062 656 427 321 336 362 361 310 330 4,472 2,466 1,369 (Gain) loss on debt extinguishment — 11,996 216 113 81 46 20 — 44 1,766 12,325 147 (Gain) loss on warrants remeasurement (1,747) (263) 813 (1,028) (209) (37) (357) (261) (71) (2,176) (2,225) (864) (Loss) gain on sale of assets — — — — — — — — — 179 — — Other income (116) (116) (116) — (926) — — — — (464) (348) (926) Income tax expense effects, net — — — — — — — — — — — — Non-GAAP net income $ 10,393 $ 12,099 $ 14,471 $ 11,297 $ 10,735 $ 13,113 $ 17,079 $ 16,589 $ 13,611 $ 57,964 $ 48,260 $ 57,516 Interest expense 8,894 7,249 5,415 4,832 4,558 4,480 4,226 4,058 3,849 35,352 26,390 17,322 Provision (benefit) for income taxes 676 1,098 908 467 1,276 208 528 (134) 992 3,642 3,149 1,878 Depreciation 1,908 1,848 1,866 1,765 1,690 1,701 1,689 1,529 1,410 8,301 7,387 6,609 Amortization of capitalized internal-use software costs 3,758 3,264 2,959 2,748 2,673 3,012 2,919 2,852 2,856 18,486 12,729 11,456 Other expense (income), net 147 1,092 (1,706) 1,115 (236) (477) (174) (749) 435 (2,782) 648 (1,636) Adjusted EBITDA $ 25,776 $ 26,650 $ 23,913 $ 22,224 $ 20,696 $ 22,037 $ 26,267 $ 24,145 $ 23,153 $ 120,963 $ 98,563 $ 93,145 Shares used in computing net income (loss) per share amounts: Basic 125,999 129,250 130,970 132,877 134,809 136,970 138,781 140,141 141,973 121,106 129,767 137,669 Diluted 127,433 131,294 135,742 138,678 138,569 141,561 142,926 145,399 147,065 122,560 133,654 142,629 GAAP net income (loss) per share - Basic $ (0.08) $ (0.11) $ 0.02 $ (0.04) $ (0.03) $ 0.01 $ 0.04 $ 0.00 $ (0.01) $ (0.56) $ (0.21) $ 0.01 GAAP net income (loss) per share - Diluted $ (0.08) $ (0.11) $ 0.02 $ (0.04) $ (0.03) $ 0.01 $ 0.04 $ 0.00 $ (0.01) $ (0.56) $ (0.21) $ 0.01 Non-GAAP net income per share - Basic $ 0.08 $ 0.09 $ 0.11 $ 0.09 $ 0.08 $ 0.10 $ 0.12 $ 0.12 $ 0.10 $ 0.48 $ 0.37 $ 0.42 Non-GAAP net income per share - Diluted $ 0.08 $ 0.09 $ 0.11 $ 0.08 $ 0.08 $ 0.09 $ 0.12 $ 0.11 $ 0.09 $ 0.47 $ 0.36 $ 0.40 Historical Financial Results Page 9