LEVEL Clinical Trial Results September 09, 2026 Exhibit 99.1
Forward-Looking Statements Disclaimers Except for historical information, all of the statements, expectations and assumptions contained in this presentation are forward-looking statements. These forward-looking statements may include information concerning our clinical data, our regulatory plans, our future trial designs, and our possible or projected future business operations. Actual results might differ materially from those explicit or implicit in the forward-looking statements. Important factors that could cause actual results to differ materially include: risks of our clinical trials, including, but not limited to, the results of such trials, and the design, timing, delays, costs, location, initiation, and enrollment of any future trials; any delays in regulatory review and approval of product candidates in development; risks regarding the formulation, production, marketing, customer acceptance and clinical utility of our product candidates; risks related to our business strategy, including the prioritization and development of product candidates; reliance on third parties, including Orion Corporation, our manufacturers and CROs; our estimates regarding the potential market opportunity for our product candidates; cash usage and runway may not be within management’s expected ranges; the potential advantages of our product candidates; our competitive position; our ability to maintain our culture and recruit, integrate and retain qualified personnel and advisors, including our executives and members of our Board of Directors; risks associated with our cash needs; intellectual property risks; volatility and uncertainty in the global economy and financial markets in light of unexpected changes in tariffs and the possibility of pandemics, global financial and geopolitical uncertainties, including in the Middle East and the Russian invasion of and war against the country of Ukraine; changes in legal, regulatory and legislative environments in the markets in which we operate and the impact of these changes on our ability to obtain regulatory approval for our products; and other risks and uncertainties set forth from time to time in our SEC filings. Tenax Therapeutics assumes no obligation and does not intend to update these forward-looking statements except as required by law.

LEVEL Results Update Topline results made public: 10 August 2026 Comprehensive results update: 09 September 2026
PH-HFpEF is a complex disease, combining the excessive volume overload (or preload) of the left ventricle with the increased PA pressure (or afterload) of the right ventricle. This challenging combination of targets explains why a treatment for PH-HFpEF has been so elusive. An ideal therapy would target the volume overload and pulmonary hypertension together. In LEVEL, levosimendan demonstrated improvements in both overload types, across the study population: the magnitude of NT-proBNP reductions, and the lowering of pressures on both sides of the heart, we believe, suggest both ventricles are being supported. In LEVEL the primary endpoint did not reach statistical significance, but the trial results are an invaluable guide to the PH-HFpEF patients who will respond with 6MWD improvements: Site-specific venodilatory effect of TNX-103 on the splanchnic circulation dramatically lowers filling pressures, measured by unprecedented 49% reduction in cardiac wall stress (NT-proBNP) This reduction in heart stress contributes to changes on the pulmonary arterial side, observed in this 12-week blinded assessment: pulmonary arterial pressure decline of 3.5 mmHg (RVSP). Lowering pulmonary pressure is a key target for any PH therapy Inotropic support to the right ventricle is seen in several echocardiographic parameters These effects translate to exercise improvement in LEVEL patients with greater exercise impairment at baseline PH-HFpEF is a bi-ventricular disease; TNX-103’s bi-ventricular effect is observed in its dramatic impact on NT-proBNP, associated with lowering preload on LV and RV, reduced CVP and PA pressure, and improving LV and RV function. We believe treatment effect in patients with greater disease is not a chance finding: multiple analyses shared in this presentation support this. LEVEL Results Confirm Biological Thesis K-ATP CHANNEL ACTIVATION REDUCES PRELOAD, ASSISTING BOTH VENTRICLES IN A DIFFICULT-TO-TREAT DISEASE
Key Scientific Updates following receipt of the full statistical analysis & ESC Late Breaker (both week of 24 Aug): Efficacy: < Median Baseline 6MWD population and 6MWD results comparable to HELP, both with >25m ∆6MWD Efficacy: NT-proBNP at baseline associated with exercise improvement Efficacy: RVSP reduction greatest in patients with more exercise impairment at baseline Efficacy: Improved LV and RV pressure/function observed across echo parameters (publication forthcoming) Safety: Raw data comparison of TE by baseline 6MWD reveals positive TNX-103 effect across quartiles Safety: Treatment emergent AEs are similar in populations < and ≥ median baseline walk LEVEL Results Highlights INSIGHTS FROM LEVEL ARE BEING USED TO STRATEGICALLY RESHAPE LEVEL-2, DE-RISKING THE LEVOSIMENDAN DEVELOPMENT PROGRAM
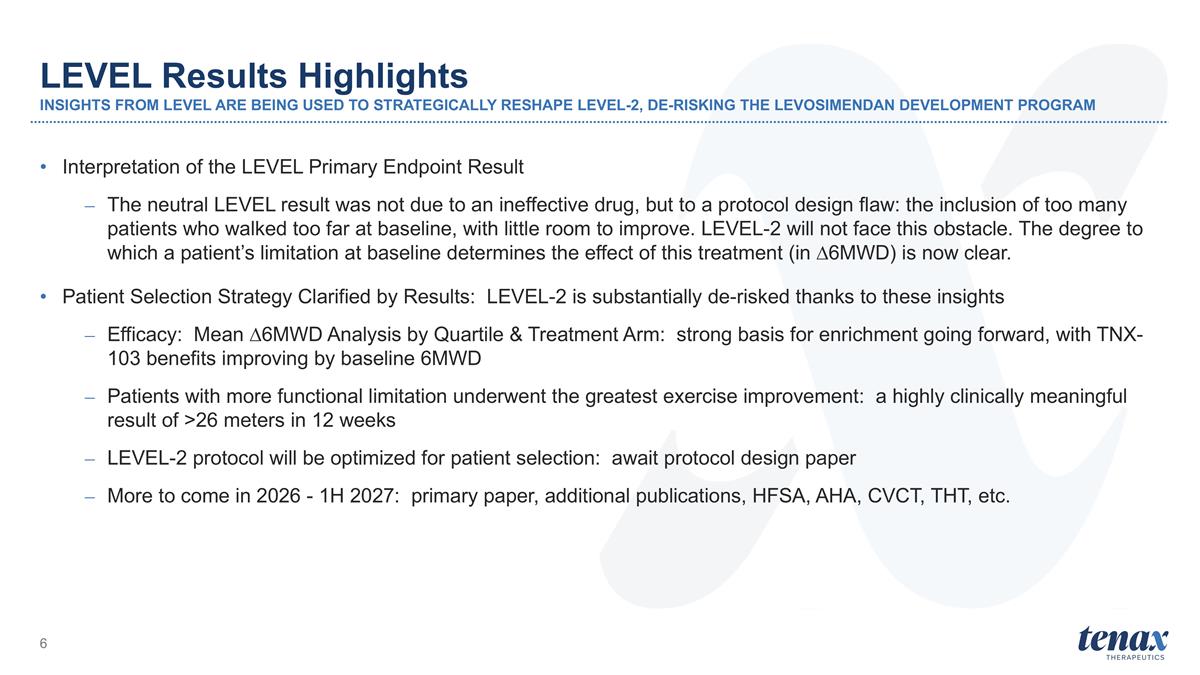
Interpretation of the LEVEL Primary Endpoint Result The neutral LEVEL result was not due to an ineffective drug, but to a protocol design flaw: the inclusion of too many patients who walked too far at baseline, with little room to improve. LEVEL-2 will not face this obstacle. The degree to which a patient’s limitation at baseline determines the effect of this treatment (in ∆6MWD) is now clear. Patient Selection Strategy Clarified by Results: LEVEL-2 is substantially de-risked thanks to these insights Efficacy: Mean ∆6MWD Analysis by Quartile & Treatment Arm: strong basis for enrichment going forward, with TNX-103 benefits improving by baseline 6MWD Patients with more functional limitation underwent the greatest exercise improvement: a highly clinically meaningful result of >26 meters in 12 weeks LEVEL-2 protocol will be optimized for patient selection: await protocol design paper More to come in 2026 - 1H 2027: primary paper, additional publications, HFSA, AHA, CVCT, THT, etc. LEVEL Results Highlights INSIGHTS FROM LEVEL ARE BEING USED TO STRATEGICALLY RESHAPE LEVEL-2, DE-RISKING THE LEVOSIMENDAN DEVELOPMENT PROGRAM

LEVEL Study Recap
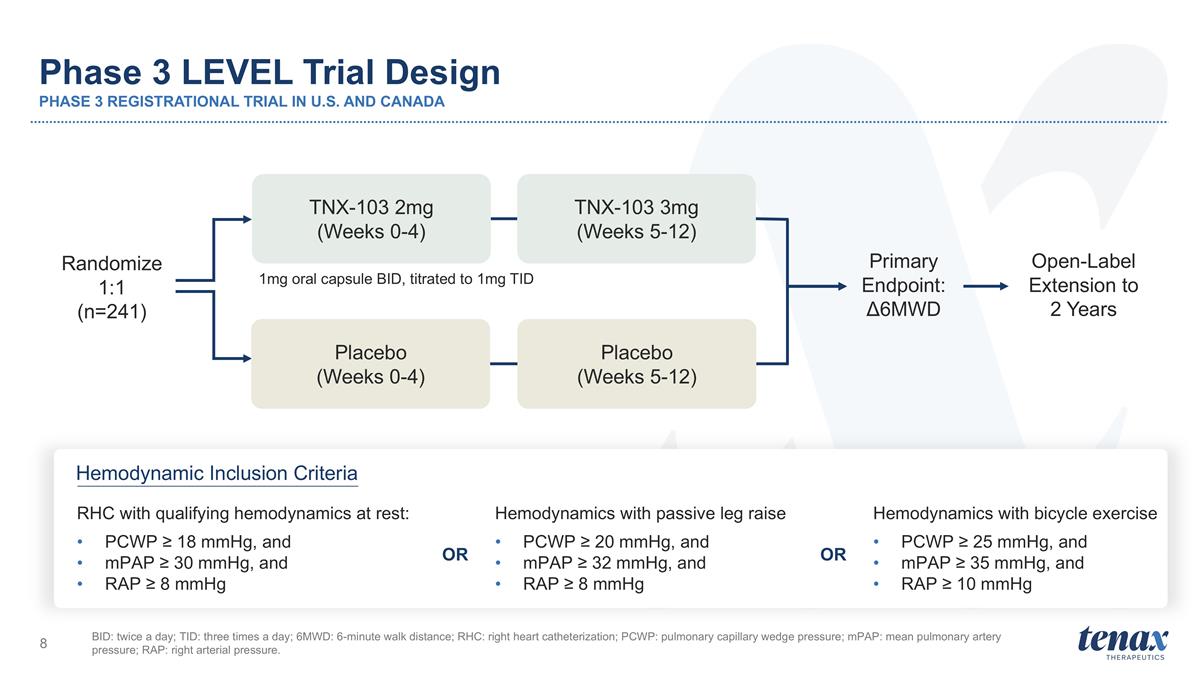
Phase 3 LEVEL Trial Design PHASE 3 REGISTRATIONAL TRIAL IN U.S. AND CANADA BID: twice a day; TID: three times a day; 6MWD: 6-minute walk distance; RHC: right heart catheterization; PCWP: pulmonary capillary wedge pressure; mPAP: mean pulmonary artery pressure; RAP: right arterial pressure. 1mg oral capsule BID, titrated to 1mg TID Open-Label Extension to 2 Years TNX-103 2mg (Weeks 0-4) TNX-103 3mg (Weeks 5-12) Placebo (Weeks 0-4) Placebo (Weeks 5-12) Primary Endpoint: Δ6MWD Hemodynamic Inclusion Criteria Randomize 1:1 (n=241) RHC with qualifying hemodynamics at rest: PCWP ≥ 18 mmHg, and mPAP ≥ 30 mmHg, and RAP ≥ 8 mmHg Hemodynamics with passive leg raise PCWP ≥ 20 mmHg, and mPAP ≥ 32 mmHg, and RAP ≥ 8 mmHg Hemodynamics with bicycle exercise PCWP ≥ 25 mmHg, and mPAP ≥ 35 mmHg, and RAP ≥ 10 mmHg OR OR
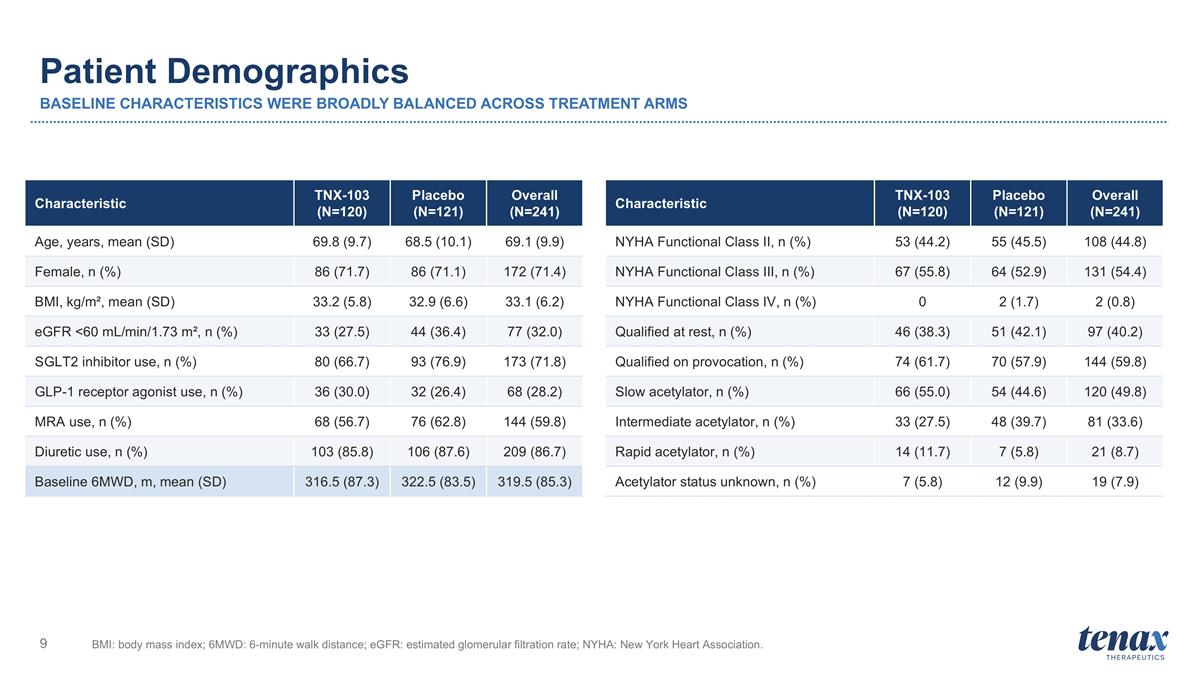
Patient Demographics BASELINE CHARACTERISTICS WERE BROADLY BALANCED ACROSS TREATMENT ARMS BMI: body mass index; 6MWD: 6-minute walk distance; eGFR: estimated glomerular filtration rate; NYHA: New York Heart Association. Characteristic TNX-103 (N=120) Placebo (N=121) Overall (N=241) Age, years, mean (SD) 69.8 (9.7) 68.5 (10.1) 69.1 (9.9) Female, n (%) 86 (71.7) 86 (71.1) 172 (71.4) BMI, kg/m², mean (SD) 33.2 (5.8) 32.9 (6.6) 33.1 (6.2) eGFR <60 mL/min/1.73 m², n (%) 33 (27.5) 44 (36.4) 77 (32.0) SGLT2 inhibitor use, n (%) 80 (66.7) 93 (76.9) 173 (71.8) GLP-1 receptor agonist use, n (%) 36 (30.0) 32 (26.4) 68 (28.2) MRA use, n (%) 68 (56.7) 76 (62.8) 144 (59.8) Diuretic use, n (%) 103 (85.8) 106 (87.6) 209 (86.7) Baseline 6MWD, m, mean (SD) 316.5 (87.3) 322.5 (83.5) 319.5 (85.3) Characteristic TNX-103 (N=120) Placebo (N=121) Overall (N=241) NYHA Functional Class II, n (%) 53 (44.2) 55 (45.5) 108 (44.8) NYHA Functional Class III, n (%) 67 (55.8) 64 (52.9) 131 (54.4) NYHA Functional Class IV, n (%) 0 2 (1.7) 2 (0.8) Qualified at rest, n (%) 46 (38.3) 51 (42.1) 97 (40.2) Qualified on provocation, n (%) 74 (61.7) 70 (57.9) 144 (59.8) Slow acetylator, n (%) 66 (55.0) 54 (44.6) 120 (49.8) Intermediate acetylator, n (%) 33 (27.5) 48 (39.7) 81 (33.6) Rapid acetylator, n (%) 14 (11.7) 7 (5.8) 21 (8.7) Acetylator status unknown, n (%) 7 (5.8) 12 (9.9) 19 (7.9)
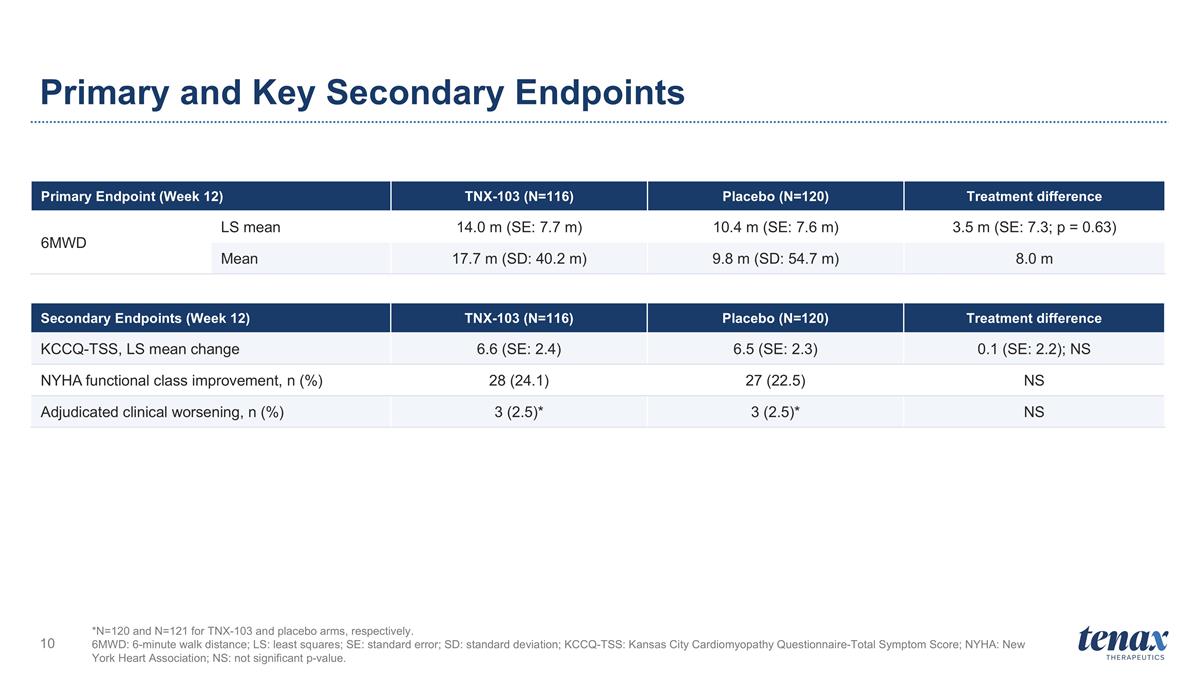
Primary and Key Secondary Endpoints *N=120 and N=121 for TNX-103 and placebo arms, respectively. 6MWD: 6-minute walk distance; LS: least squares; SE: standard error; SD: standard deviation; KCCQ-TSS: Kansas City Cardiomyopathy Questionnaire-Total Symptom Score; NYHA: New York Heart Association; NS: not significant p-value. Primary Endpoint (Week 12) TNX-103 (N=116) Placebo (N=120) Treatment difference 6MWD LS mean 14.0 m (SE: 7.7 m) 10.4 m (SE: 7.6 m) 3.5 m (SE: 7.3; p = 0.63) Mean 17.7 m (SD: 40.2 m) 9.8 m (SD: 54.7 m) 8.0 m Secondary Endpoints (Week 12) TNX-103 (N=116) Placebo (N=120) Treatment difference KCCQ-TSS, LS mean change 6.6 (SE: 2.4) 6.5 (SE: 2.3) 0.1 (SE: 2.2); NS NYHA functional class improvement, n (%) 28 (24.1) 27 (22.5) NS Adjudicated clinical worsening, n (%) 3 (2.5)* 3 (2.5)* NS
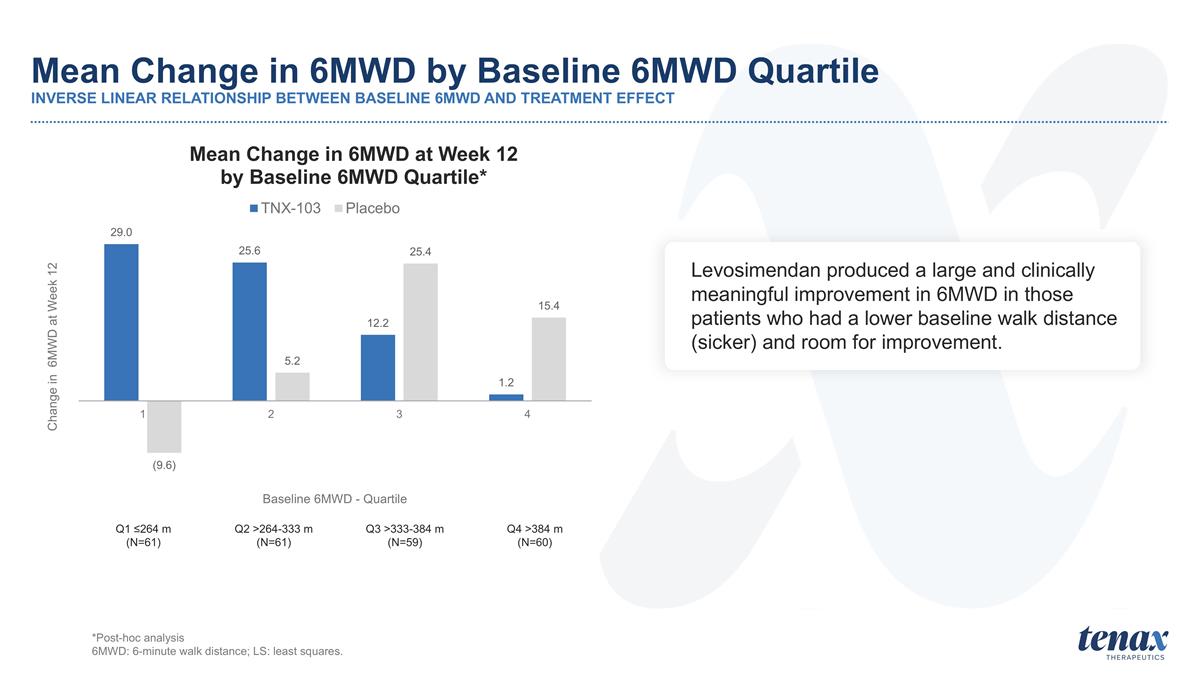
Mean Change in 6MWD by Baseline 6MWD Quartile INVERSE LINEAR RELATIONSHIP BETWEEN BASELINE 6MWD AND TREATMENT EFFECT Q1 ≤264 m (N=61) Q2 >264-333 m (N=61) Q3 >333-384 m (N=59) Q4 >384 m (N=60) *Post-hoc analysis 6MWD: 6-minute walk distance; LS: least squares. Levosimendan produced a large and clinically meaningful improvement in 6MWD in those patients who had a lower baseline walk distance (sicker) and room for improvement.
Baseline 6MWD was the Strongest Predictor of Clinical Response
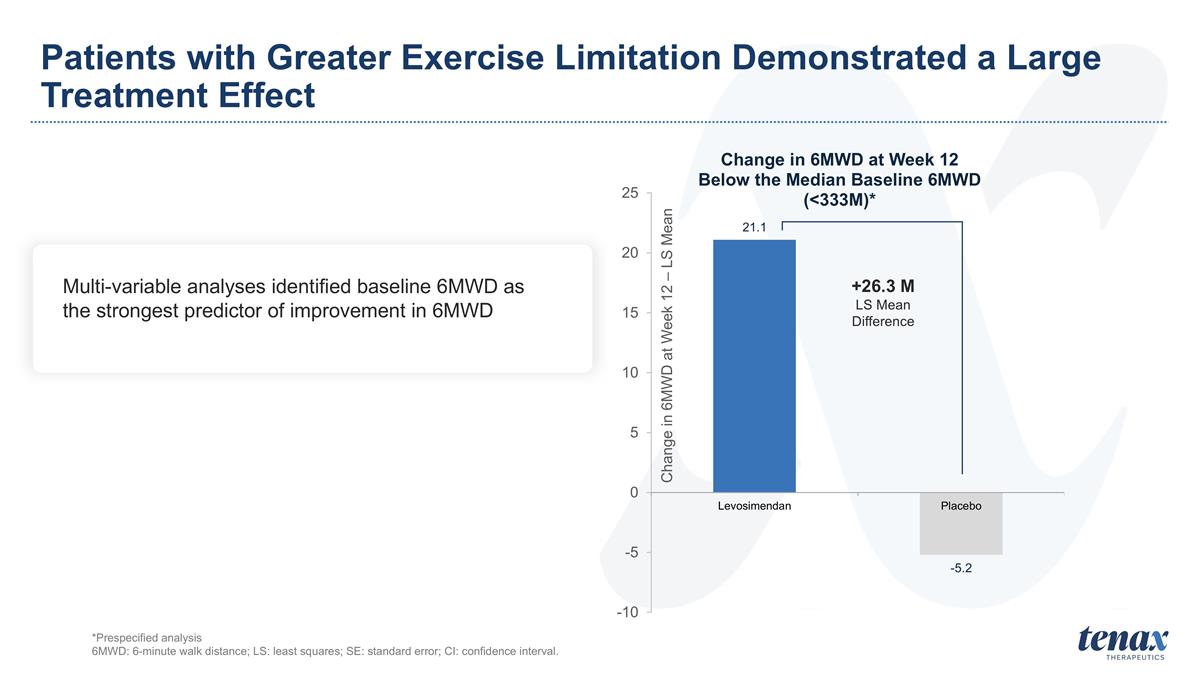
Patients with Greater Exercise Limitation Demonstrated a Large Treatment Effect +26.3 M LS Mean Difference *Prespecified analysis 6MWD: 6-minute walk distance; LS: least squares; SE: standard error; CI: confidence interval. Multi-variable analyses identified baseline 6MWD as the strongest predictor of improvement in 6MWD
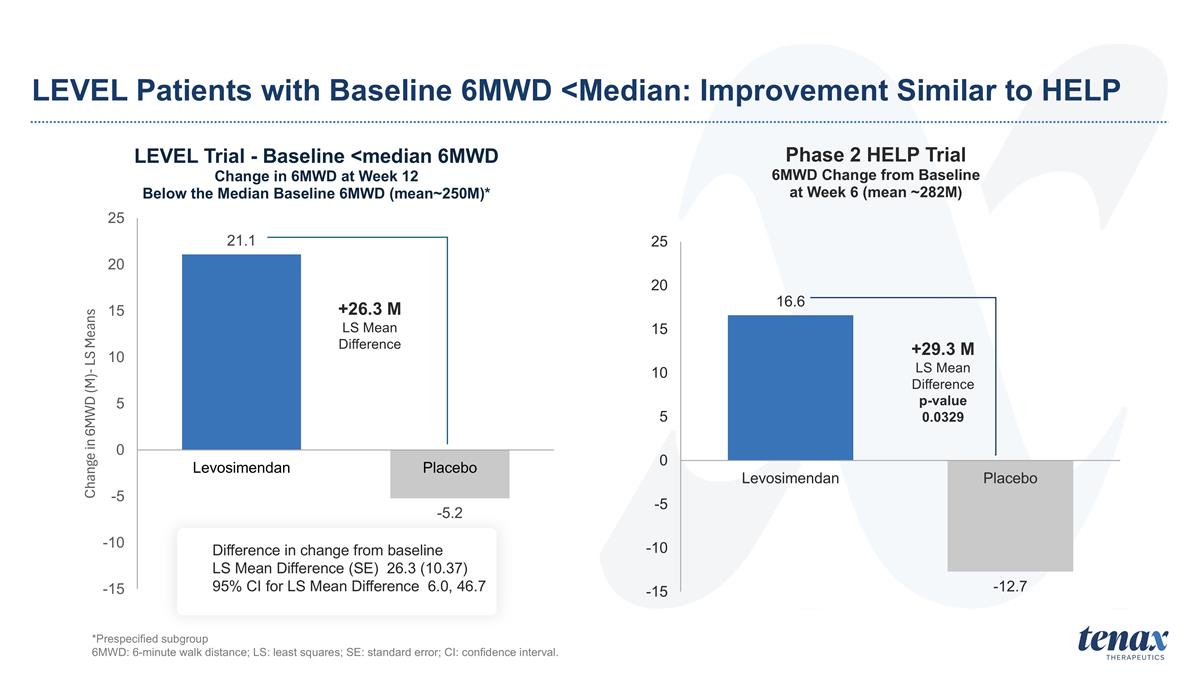
LEVEL Patients with Baseline 6MWD <Median: Improvement Similar to HELP +26.3 M LS Mean Difference +29.3 M LS Mean Difference p-value 0.0329 *Prespecified subgroup 6MWD: 6-minute walk distance; LS: least squares; SE: standard error; CI: confidence interval. Difference in change from baseline LS Mean Difference (SE) 26.3 (10.37) 95% CI for LS Mean Difference 6.0, 46.7
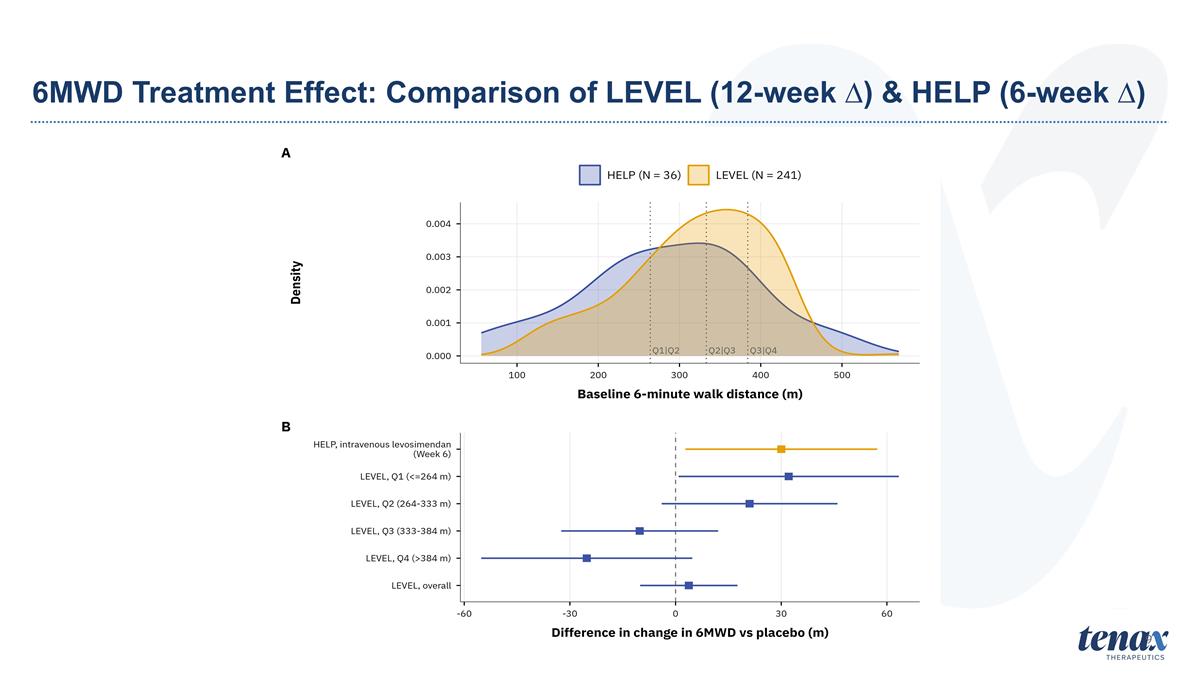
6MWD Treatment Effect: Comparison of LEVEL (12-week ∆) & HELP (6-week ∆) 9
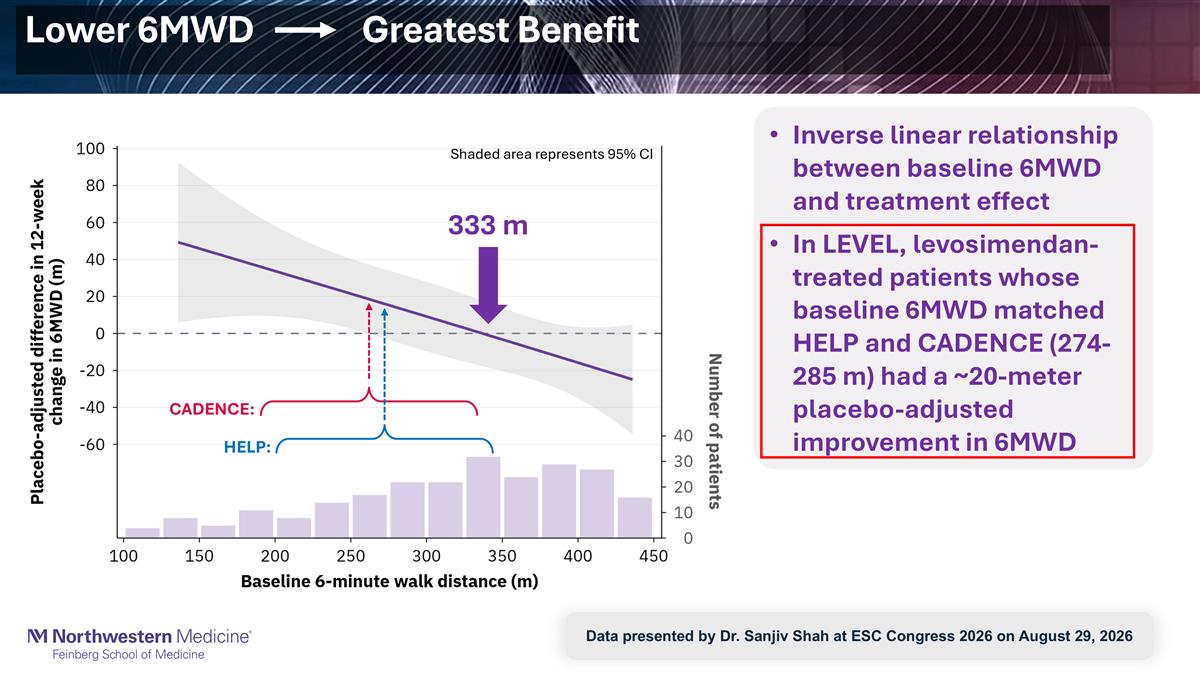
Lower 6MWD Greatest Benefit Inverse linear relationship between baseline 6MWD and treatment effect In LEVEL, levosimendan-treated patients whose baseline 6MWD matched HELP and CADENCE (274-285 m) had a ~20-meter placebo-adjusted improvement in 6MWD 333 m CADENCE: HELP: Shaded area represents 95% CI Data presented by Dr. Sanjiv Shah at ESC Congress 2026 on August 29, 2026
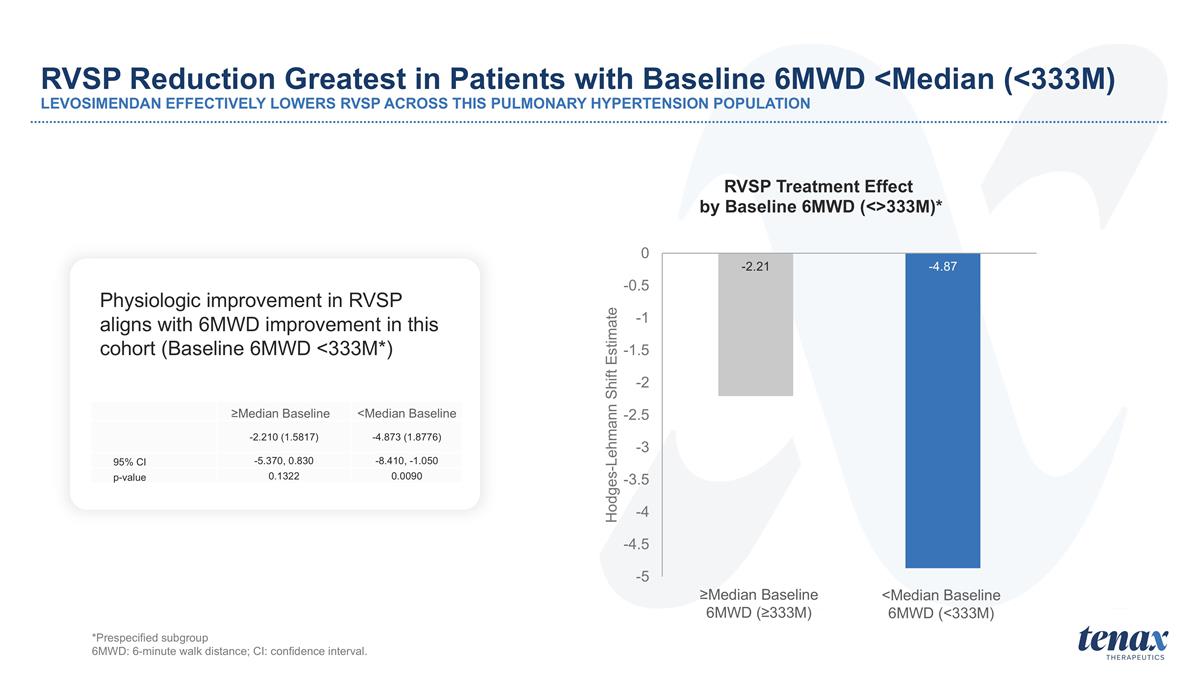
RVSP Reduction Greatest in Patients with Baseline 6MWD <Median (<333M) LEVOSIMENDAN EFFECTIVELY LOWERS RVSP ACROSS THIS PULMONARY HYPERTENSION POPULATION *Prespecified subgroup 6MWD: 6-minute walk distance; CI: confidence interval. Physiologic improvement in RVSP aligns with 6MWD improvement in this cohort (Baseline 6MWD <333M*) ≥Median Baseline 6MWD (≥333M) <Median Baseline 6MWD (<333M) ≥Median Baseline <Median Baseline -2.210 (1.5817) -4.873 (1.8776) 95% CI -5.370, 0.830 -8.410, -1.050 p-value 0.1322 0.0090
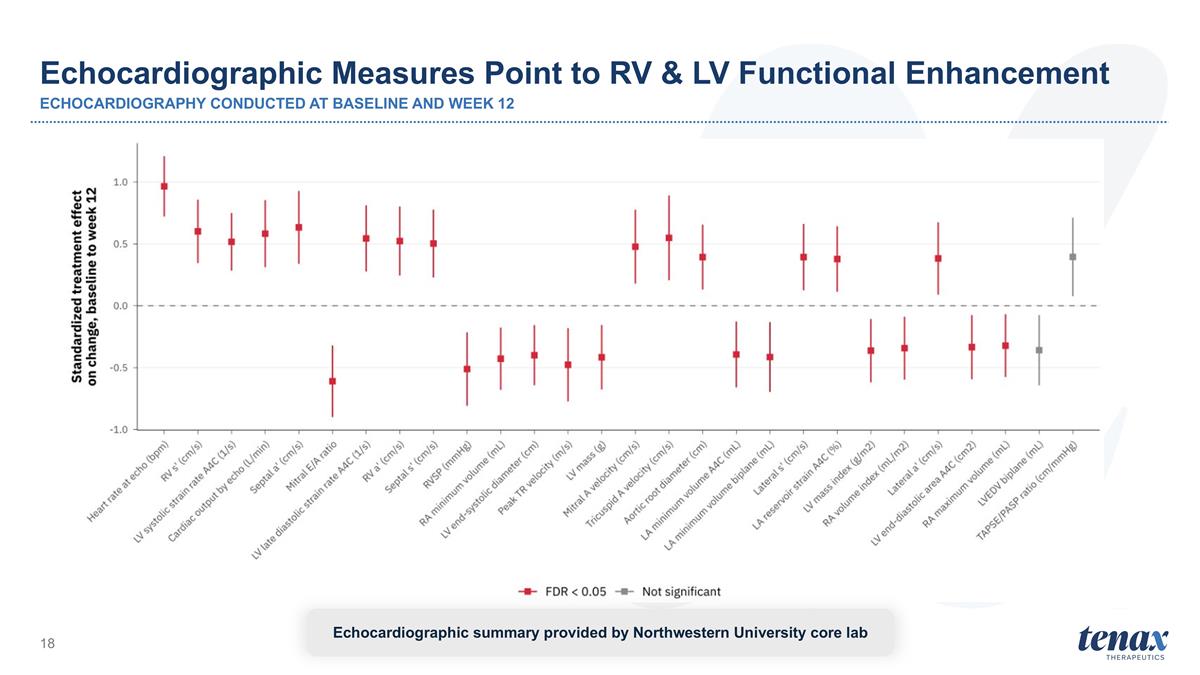
Echocardiographic summary provided by Northwestern University core lab Echocardiographic Measures Point to RV & LV Functional Enhancement ECHOCARDIOGRAPHY CONDUCTED AT BASELINE AND WEEK 12
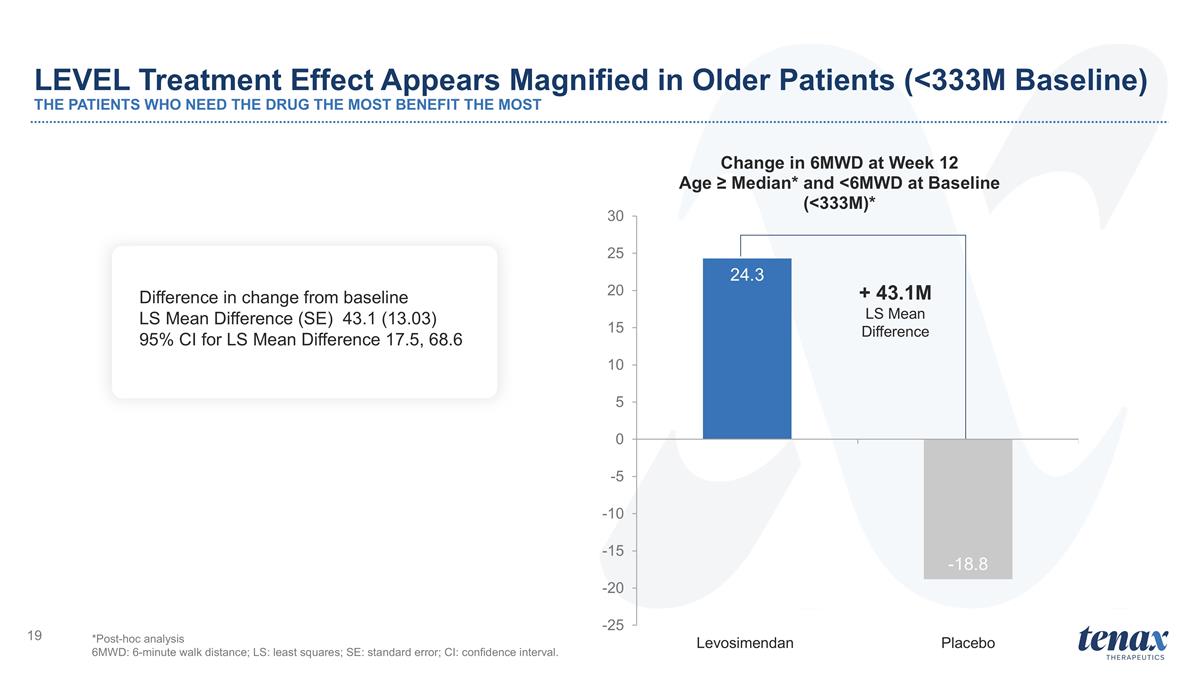
LEVEL Treatment Effect Appears Magnified in Older Patients (<333M Baseline) THE PATIENTS WHO NEED THE DRUG THE MOST BENEFIT THE MOST + 43.1M LS Mean Difference *Post-hoc analysis 6MWD: 6-minute walk distance; LS: least squares; SE: standard error; CI: confidence interval. Difference in change from baseline LS Mean Difference (SE) 43.1 (13.03) 95% CI for LS Mean Difference 17.5, 68.6
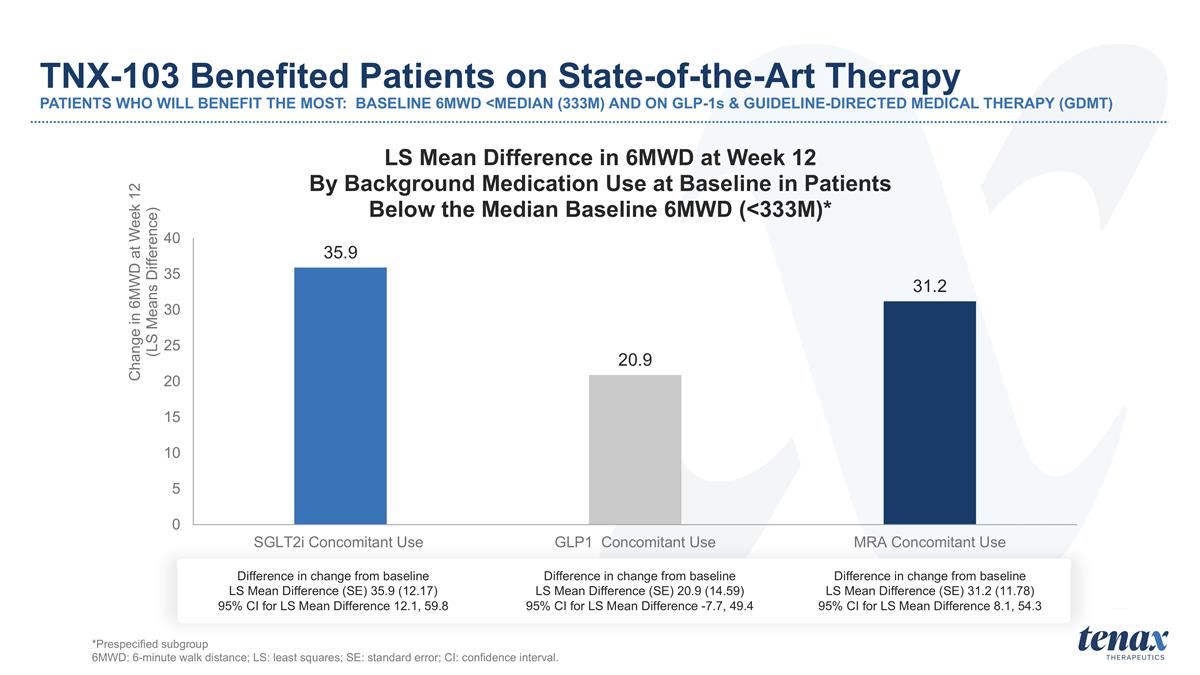
TNX-103 Benefited Patients on State-of-the-Art Therapy PATIENTS WHO WILL BENEFIT THE MOST: BASELINE 6MWD <MEDIAN (333M) AND ON GLP-1s & GUIDELINE-DIRECTED MEDICAL THERAPY (GDMT) Difference in change from baseline LS Mean Difference (SE) 35.9 (12.17) 95% CI for LS Mean Difference 12.1, 59.8 Difference in change from baseline LS Mean Difference (SE) 20.9 (14.59) 95% CI for LS Mean Difference -7.7, 49.4 Difference in change from baseline LS Mean Difference (SE) 31.2 (11.78) 95% CI for LS Mean Difference 8.1, 54.3 *Prespecified subgroup 6MWD: 6-minute walk distance; LS: least squares; SE: standard error; CI: confidence interval.
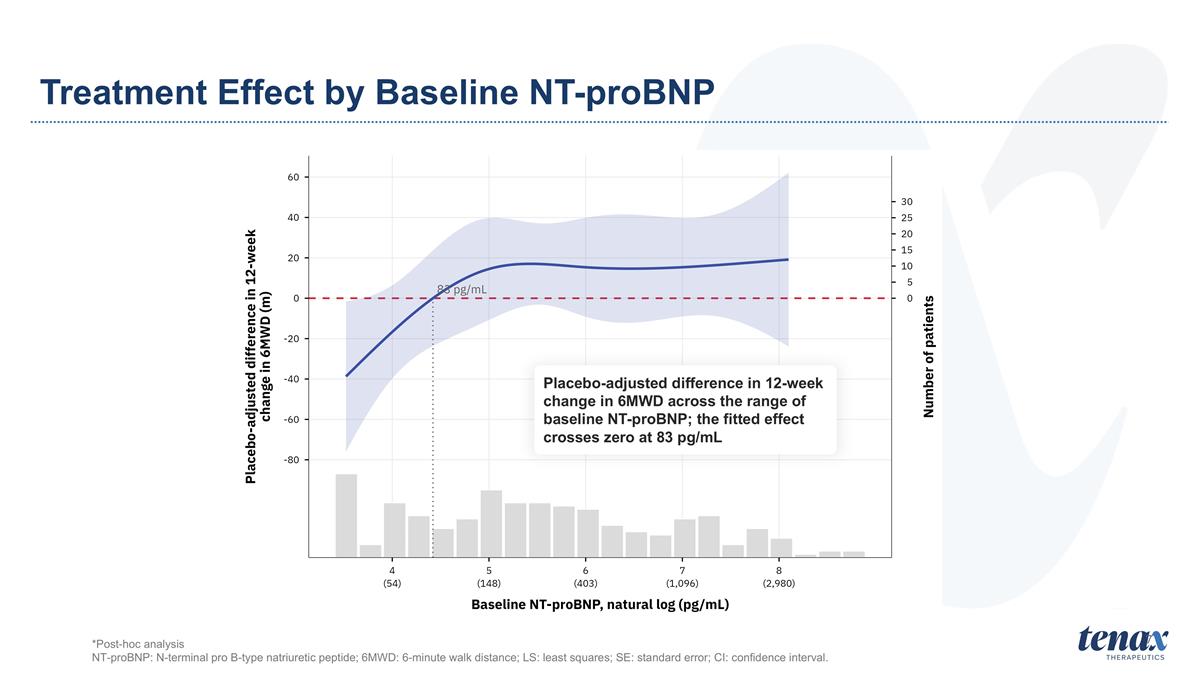
7 Treatment Effect by Baseline NT-proBNP Placebo-adjusted difference in 12-week change in 6MWD across the range of baseline NT-proBNP; the fitted effect crosses zero at 83 pg/mL *Post-hoc analysis NT-proBNP: N-terminal pro B-type natriuretic peptide; 6MWD: 6-minute walk distance; LS: least squares; SE: standard error; CI: confidence interval.
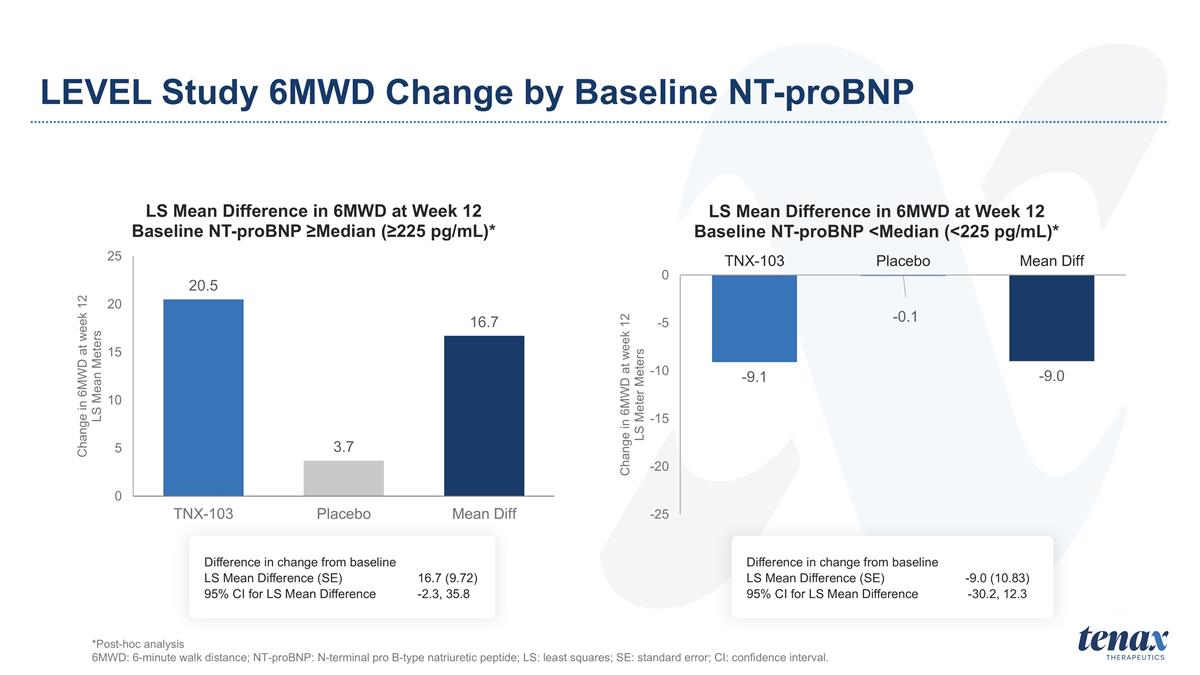
LEVEL Study 6MWD Change by Baseline NT-proBNP *Post-hoc analysis 6MWD: 6-minute walk distance; NT-proBNP: N-terminal pro B-type natriuretic peptide; LS: least squares; SE: standard error; CI: confidence interval. Difference in change from baseline LS Mean Difference (SE) 16.7 (9.72) 95% CI for LS Mean Difference -2.3, 35.8 Difference in change from baseline LS Mean Difference (SE) -9.0 (10.83) 95% CI for LS Mean Difference -30.2, 12.3
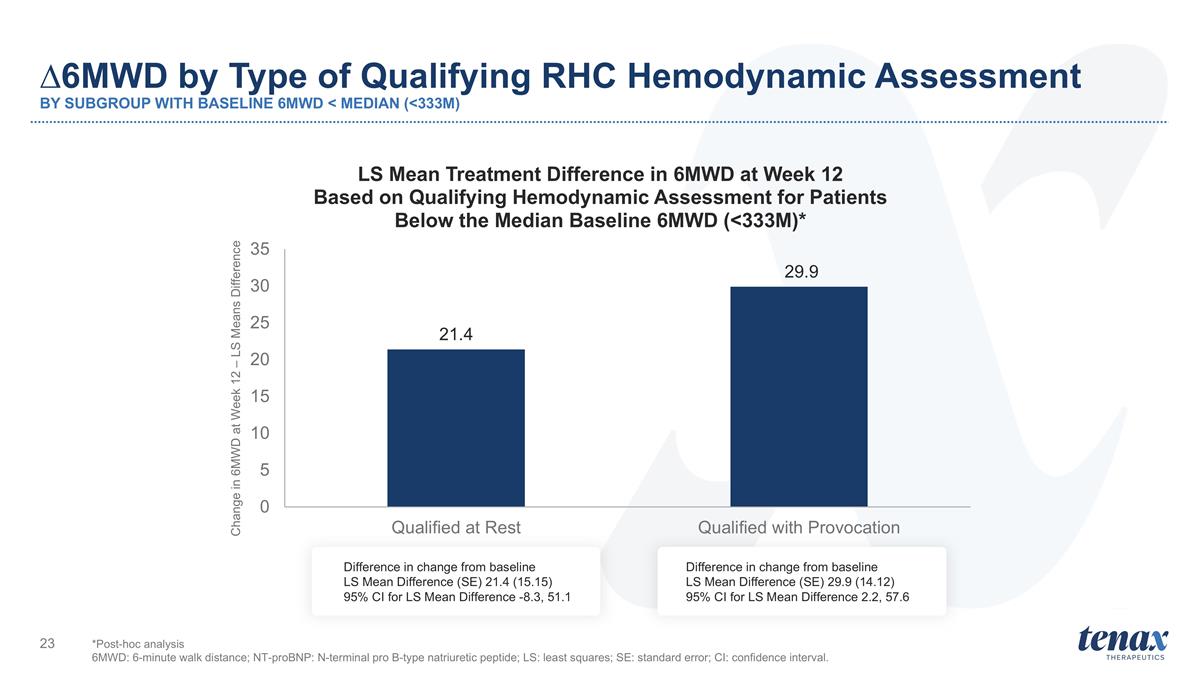
∆6MWD by Type of Qualifying RHC Hemodynamic Assessment BY SUBGROUP WITH BASELINE 6MWD < MEDIAN (<333M) Difference in change from baseline LS Mean Difference (SE) 29.9 (14.12) 95% CI for LS Mean Difference 2.2, 57.6 Difference in change from baseline LS Mean Difference (SE) 21.4 (15.15) 95% CI for LS Mean Difference -8.3, 51.1 *Post-hoc analysis 6MWD: 6-minute walk distance; NT-proBNP: N-terminal pro B-type natriuretic peptide; LS: least squares; SE: standard error; CI: confidence interval.
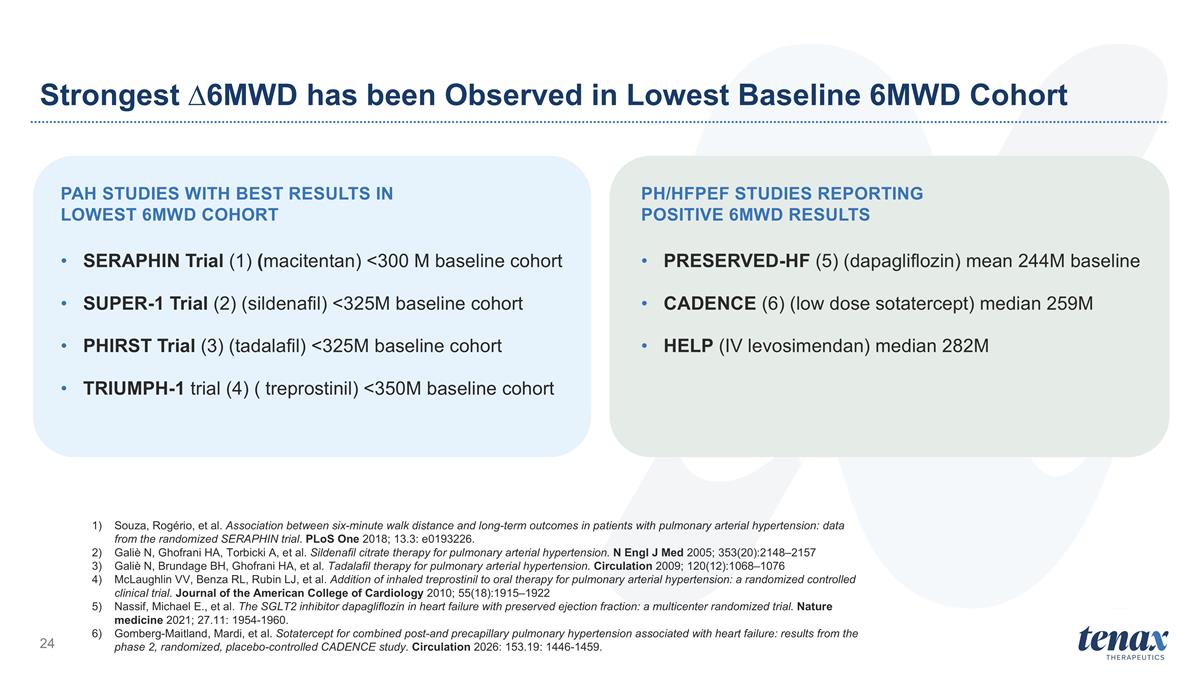
PAH Studies with Best Results in Lowest 6MWD Cohort SERAPHIN Trial (1) (macitentan) <300 M baseline cohort SUPER-1 Trial (2) (sildenafil) <325M baseline cohort PHIRST Trial (3) (tadalafil) <325M baseline cohort TRIUMPH-1 trial (4) ( treprostinil) <350M baseline cohort PH/HFPEF Studies Reporting Positive 6MWD Results PRESERVED-HF (5) (dapagliflozin) mean 244M baseline CADENCE (6) (low dose sotatercept) median 259M HELP (IV levosimendan) median 282M Souza, Rogério, et al. Association between six-minute walk distance and long-term outcomes in patients with pulmonary arterial hypertension: data from the randomized SERAPHIN trial. PLoS One 2018; 13.3: e0193226. Galiè N, Ghofrani HA, Torbicki A, et al. Sildenafil citrate therapy for pulmonary arterial hypertension. N Engl J Med 2005; 353(20):2148–2157 Galiè N, Brundage BH, Ghofrani HA, et al. Tadalafil therapy for pulmonary arterial hypertension. Circulation 2009; 120(12):1068–1076 McLaughlin VV, Benza RL, Rubin LJ, et al. Addition of inhaled treprostinil to oral therapy for pulmonary arterial hypertension: a randomized controlled clinical trial. Journal of the American College of Cardiology 2010; 55(18):1915–1922 Nassif, Michael E., et al. The SGLT2 inhibitor dapagliflozin in heart failure with preserved ejection fraction: a multicenter randomized trial. Nature medicine 2021; 27.11: 1954-1960. Gomberg-Maitland, Mardi, et al. Sotatercept for combined post-and precapillary pulmonary hypertension associated with heart failure: results from the phase 2, randomized, placebo-controlled CADENCE study. Circulation 2026: 153.19: 1446-1459. Strongest ∆6MWD has been Observed in Lowest Baseline 6MWD Cohort
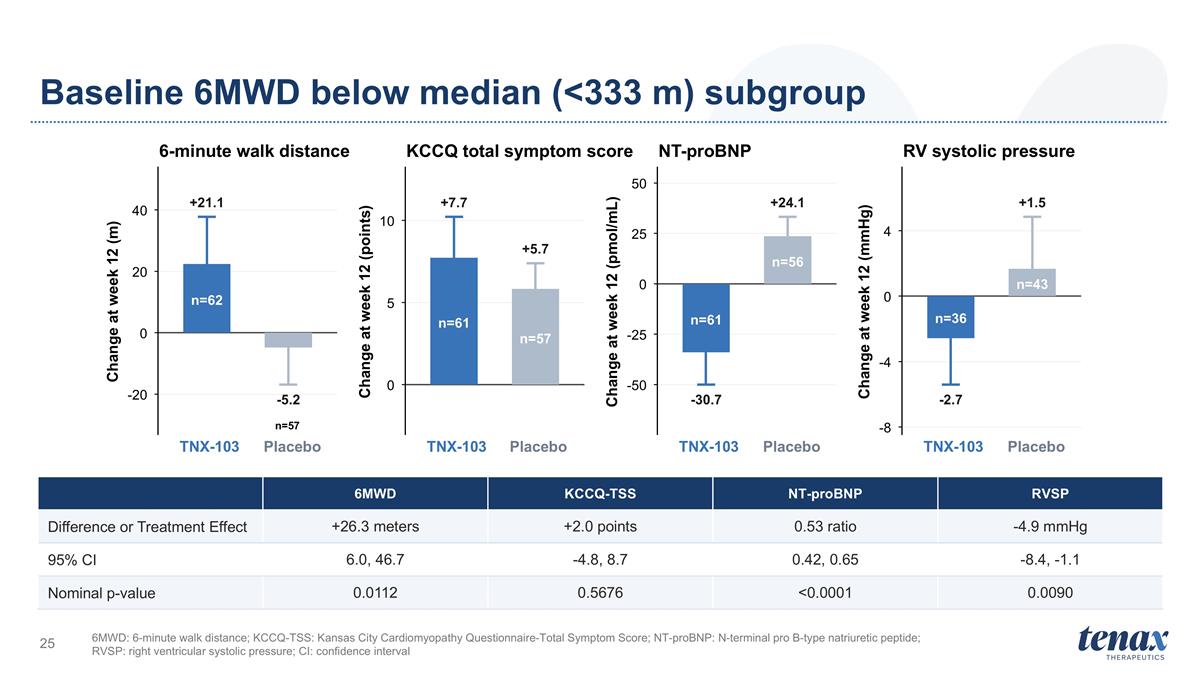
Baseline 6MWD below median (<333 m) subgroup 6MWD: 6-minute walk distance; KCCQ-TSS: Kansas City Cardiomyopathy Questionnaire-Total Symptom Score; NT-proBNP: N-terminal pro B-type natriuretic peptide; RVSP: right ventricular systolic pressure; CI: confidence interval +21.1 -5.2 n=62 n=57 -20 0 20 40 TNX-103 Placebo Change at week 12 (m) 6-minute walk distance +7.7 +5.7 n=61 n=57 0 5 10 TNX-103 Placebo Change at week 12 (points) KCCQ total symptom score -30.7 +24.1 n=61 n=56 -50 -25 0 25 50 TNX-103 Placebo Change at week 12 (pmol/mL) NT-proBNP -2.7 +1.5 n=36 n=43 -8 -4 0 4 TNX-103 Placebo Change at week 12 (mmHg) RV systolic pressure 6MWD KCCQ-TSS NT-proBNP RVSP Difference or Treatment Effect +26.3 meters +2.0 points 0.53 ratio -4.9 mmHg 95% CI 6.0, 46.7 -4.8, 8.7 0.42, 0.65 -8.4, -1.1 Nominal p-value 0.0112 0.5676 <0.0001 0.0090
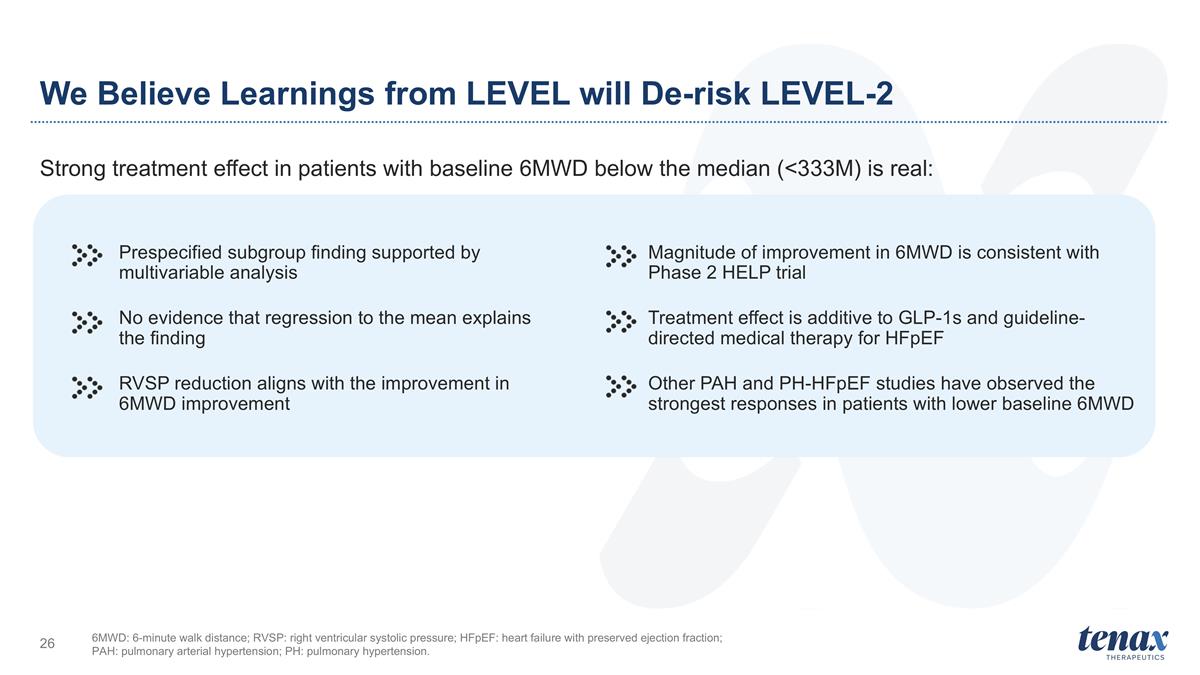
We Believe Learnings from LEVEL will De-risk LEVEL-2 Strong treatment effect in patients with baseline 6MWD below the median (<333M) is real: Prespecified subgroup finding supported by multivariable analysis No evidence that regression to the mean explains the finding RVSP reduction aligns with the improvement in 6MWD improvement Magnitude of improvement in 6MWD is consistent with Phase 2 HELP trial Treatment effect is additive to GLP-1s and guideline-directed medical therapy for HFpEF Other PAH and PH-HFpEF studies have observed the strongest responses in patients with lower baseline 6MWD 6MWD: 6-minute walk distance; RVSP: right ventricular systolic pressure; HFpEF: heart failure with preserved ejection fraction; PAH: pulmonary arterial hypertension; PH: pulmonary hypertension.

Safety Profile Supports Continued Development
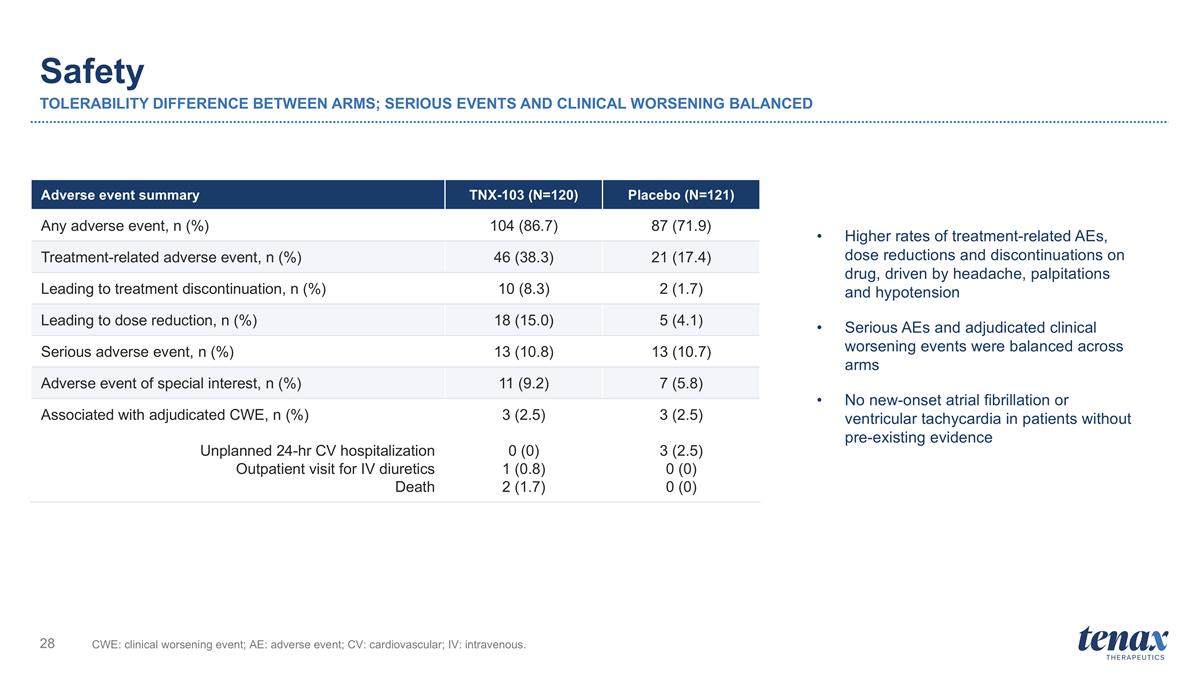
Safety TOLERABILITY DIFFERENCE BETWEEN ARMS; SERIOUS EVENTS AND CLINICAL WORSENING BALANCED CWE: clinical worsening event; AE: adverse event; CV: cardiovascular; IV: intravenous. Adverse event summary TNX-103 (N=120) Placebo (N=121) Any adverse event, n (%) 104 (86.7) 87 (71.9) Treatment-related adverse event, n (%) 46 (38.3) 21 (17.4) Leading to treatment discontinuation, n (%) 10 (8.3) 2 (1.7) Leading to dose reduction, n (%) 18 (15.0) 5 (4.1) Serious adverse event, n (%) 13 (10.8) 13 (10.7) Adverse event of special interest, n (%) 11 (9.2) 7 (5.8) Associated with adjudicated CWE, n (%) Unplanned 24-hr CV hospitalization Outpatient visit for IV diuretics Death 3 (2.5) 0 (0) 1 (0.8) 2 (1.7) 3 (2.5) 3 (2.5) 0 (0) 0 (0) Higher rates of treatment-related AEs, dose reductions and discontinuations on drug, driven by headache, palpitations and hypotension Serious AEs and adjudicated clinical worsening events were balanced across arms No new-onset atrial fibrillation or ventricular tachycardia in patients without pre-existing evidence
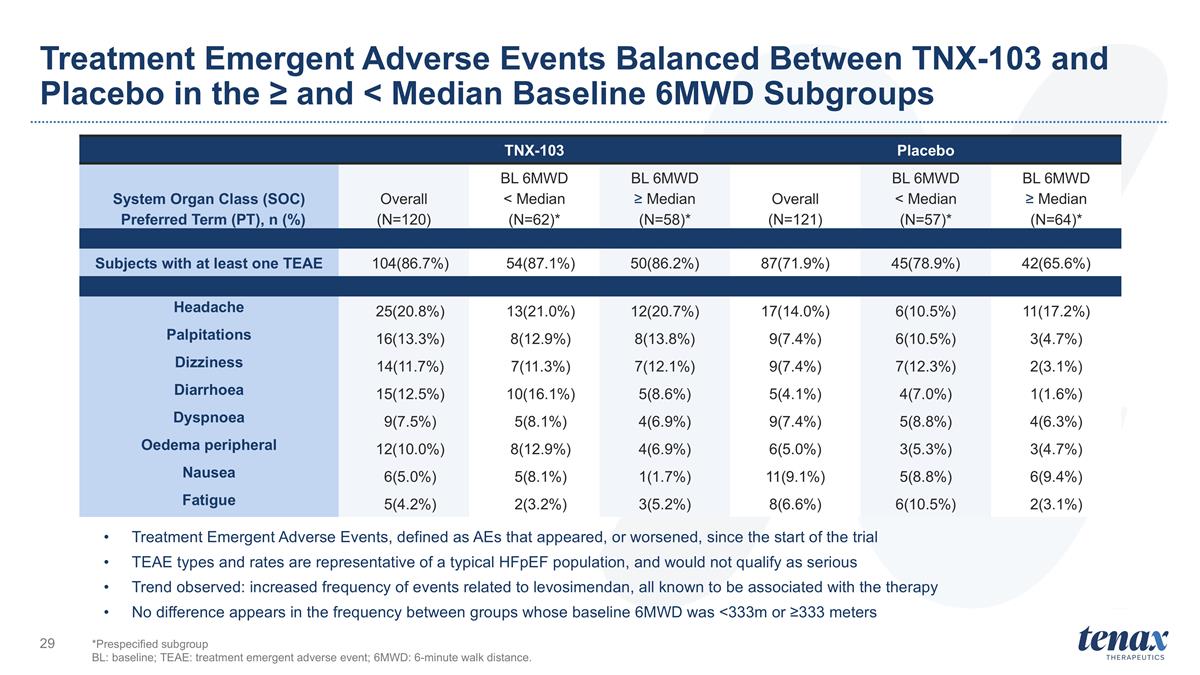
Treatment Emergent Adverse Events Balanced Between TNX-103 and Placebo in the ≥ and < Median Baseline 6MWD Subgroups TNX-103 Placebo System Organ Class (SOC) Preferred Term (PT), n (%) Overall (N=120) BL 6MWD < Median (N=62)* BL 6MWD ≥ Median (N=58)* Overall (N=121) BL 6MWD < Median (N=57)* BL 6MWD ≥ Median (N=64)* Subjects with at least one TEAE 104(86.7%) 54(87.1%) 50(86.2%) 87(71.9%) 45(78.9%) 42(65.6%) Headache 25(20.8%) 13(21.0%) 12(20.7%) 17(14.0%) 6(10.5%) 11(17.2%) Palpitations 16(13.3%) 8(12.9%) 8(13.8%) 9(7.4%) 6(10.5%) 3(4.7%) Dizziness 14(11.7%) 7(11.3%) 7(12.1%) 9(7.4%) 7(12.3%) 2(3.1%) Diarrhoea 15(12.5%) 10(16.1%) 5(8.6%) 5(4.1%) 4(7.0%) 1(1.6%) Dyspnoea 9(7.5%) 5(8.1%) 4(6.9%) 9(7.4%) 5(8.8%) 4(6.3%) Oedema peripheral 12(10.0%) 8(12.9%) 4(6.9%) 6(5.0%) 3(5.3%) 3(4.7%) Nausea 6(5.0%) 5(8.1%) 1(1.7%) 11(9.1%) 5(8.8%) 6(9.4%) Fatigue 5(4.2%) 2(3.2%) 3(5.2%) 8(6.6%) 6(10.5%) 2(3.1%) *Prespecified subgroup BL: baseline; TEAE: treatment emergent adverse event; 6MWD: 6-minute walk distance. Treatment Emergent Adverse Events, defined as AEs that appeared, or worsened, since the start of the trial TEAE types and rates are representative of a typical HFpEF population, and would not qualify as serious Trend observed: increased frequency of events related to levosimendan, all known to be associated with the therapy No difference appears in the frequency between groups whose baseline 6MWD was <333m or ≥333 meters
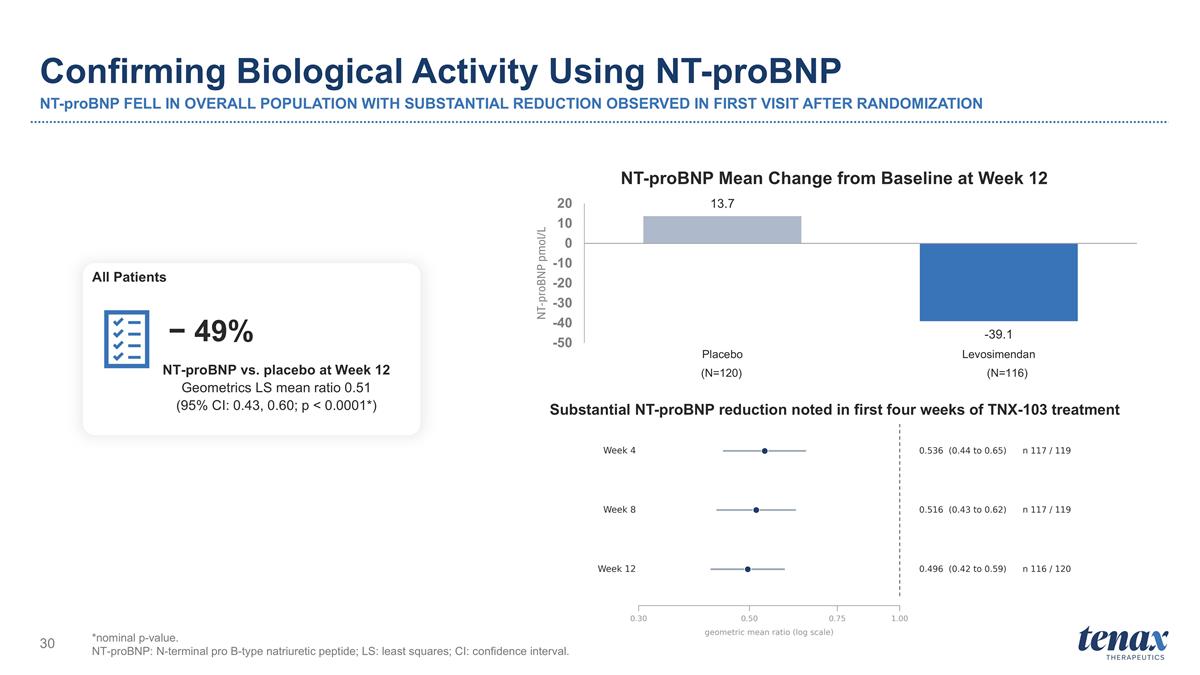
Confirming Biological Activity Using NT-proBNP NT-proBNP FELL IN OVERALL POPULATION WITH SUBSTANTIAL REDUCTION OBSERVED IN FIRST VISIT AFTER RANDOMIZATION *nominal p-value. NT-proBNP: N-terminal pro B-type natriuretic peptide; LS: least squares; CI: confidence interval. NT-proBNP vs. placebo at Week 12 Geometrics LS mean ratio 0.51 (95% CI: 0.43, 0.60; p < 0.0001*) − 49% All Patients (N=120) (N=116) Substantial NT-proBNP reduction noted in first four weeks of TNX-103 treatment
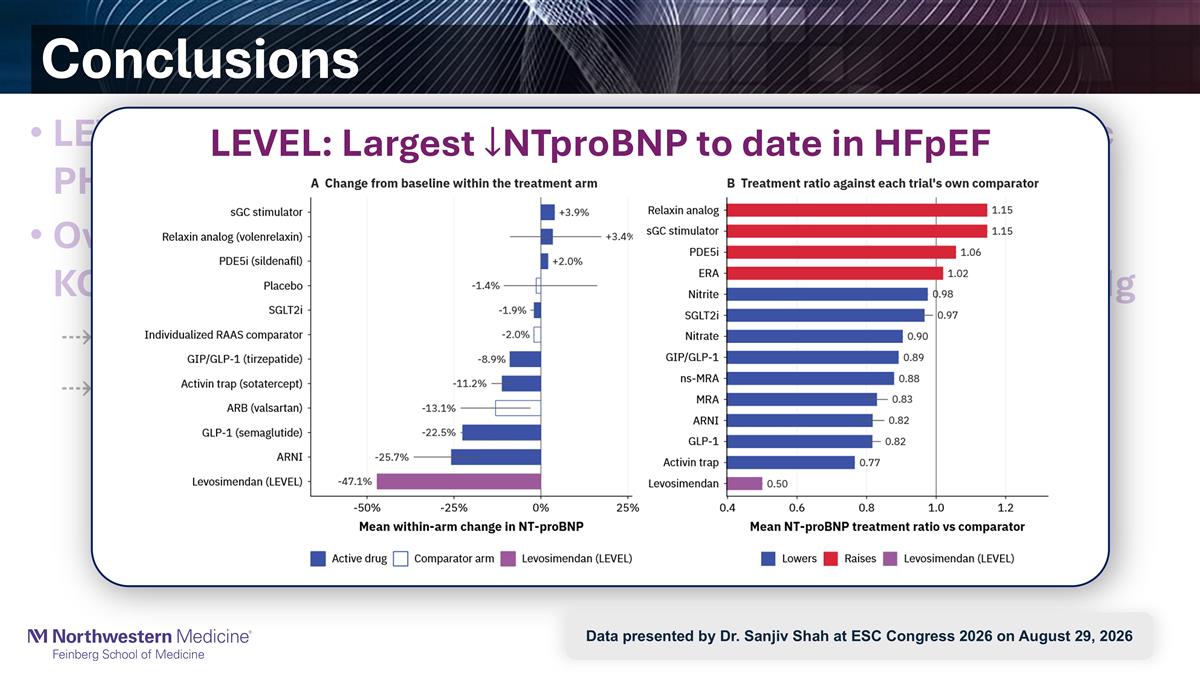
Conclusions LEVEL enrolled a broad range of patients with symptomatic PH-HFpEF, with PA pressures by invasive hemodynamics Over 12 weeks, levosimendan did not improve 6MWD or KCCQ-TSS, but NTproBNP by ~50% and RVSP by 3.5 mmHg Largest reduction in NTproBNP to date in a HFpEF RCT Magnitude of NTproBNP and PA pressure: Predicted to be associated with HF events LEVEL: Largest NTproBNP to date in HFpEF Data presented by Dr. Sanjiv Shah at ESC Congress 2026 on August 29, 2026
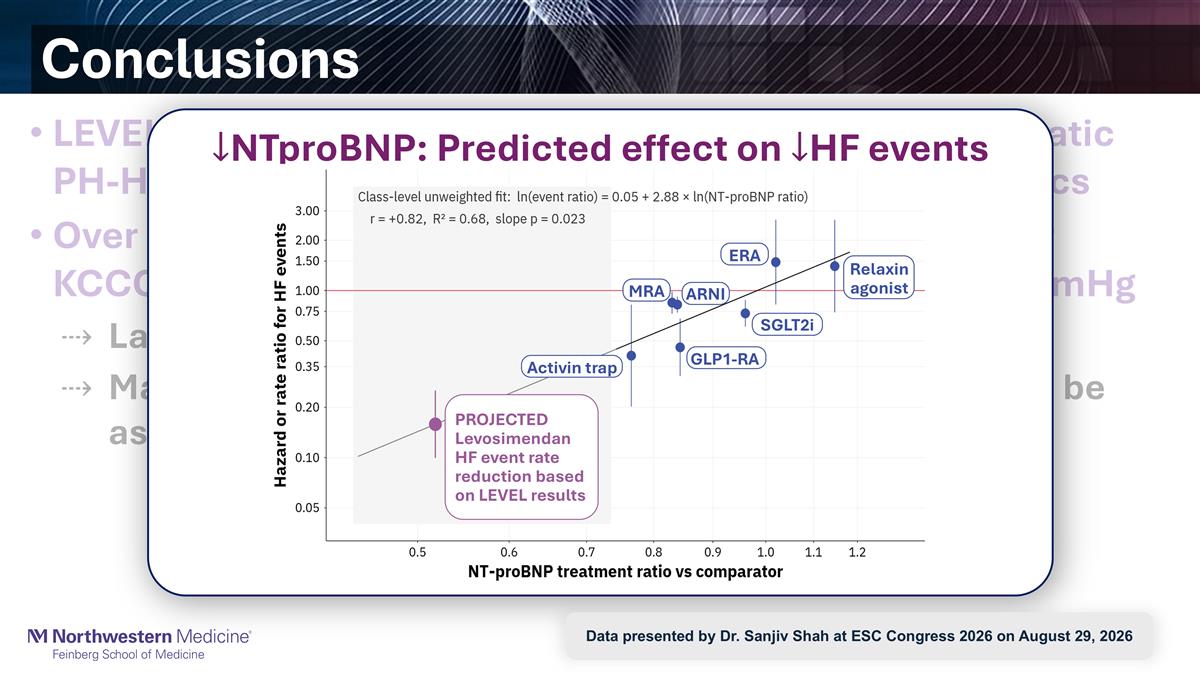
Conclusions LEVEL enrolled a broad range of patients with symptomatic PH-HFpEF, with PA pressures by invasive hemodynamics Over 12 weeks, levosimendan did not improve 6MWD or KCCQ-TSS, but NTproBNP by ~50% and RVSP by 3.5 mmHg Largest reduction in NTproBNP to date in a HFpEF RCT Magnitude of NTproBNP and PA pressure: Predicted to be associated with HF events NTproBNP: Predicted effect on HF events Activin trap SGLT2i Relaxin agonist MRA PROJECTED Levosimendan HF event rate reduction based on LEVEL results GLP1-RA ARNI ERA Data presented by Dr. Sanjiv Shah at ESC Congress 2026 on August 29, 2026

Next Steps for Tenax
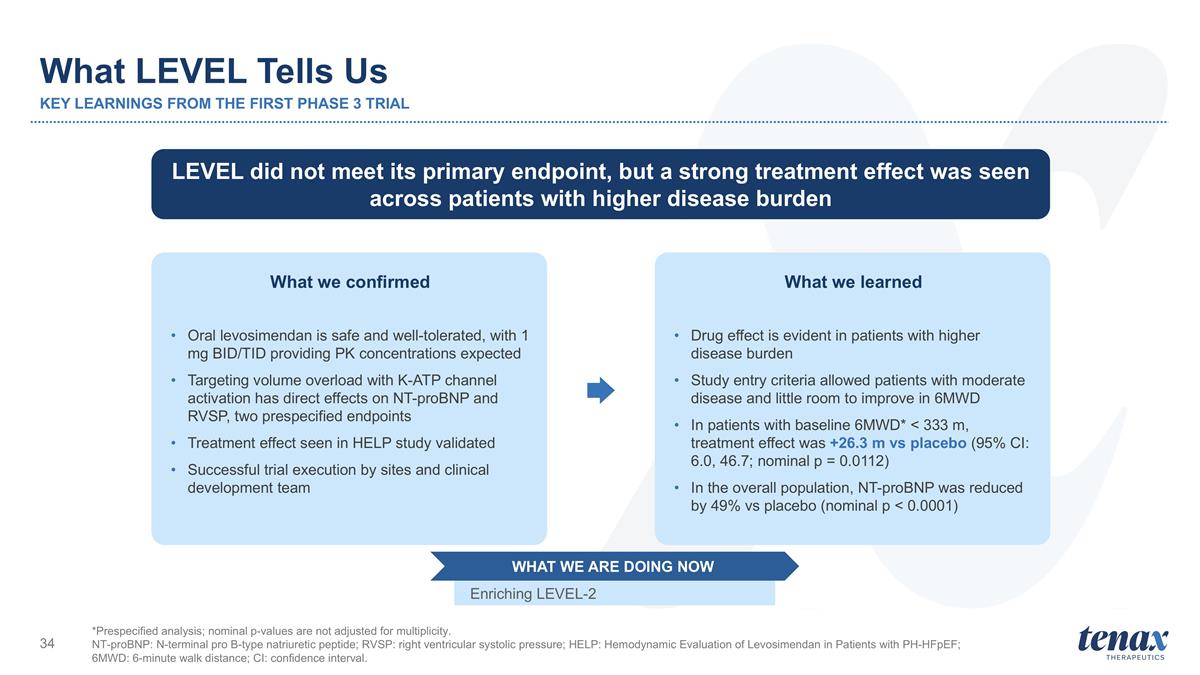
What LEVEL Tells Us KEY LEARNINGS FROM THE FIRST PHASE 3 TRIAL *Prespecified analysis; nominal p-values are not adjusted for multiplicity. NT-proBNP: N-terminal pro B-type natriuretic peptide; RVSP: right ventricular systolic pressure; HELP: Hemodynamic Evaluation of Levosimendan in Patients with PH-HFpEF; 6MWD: 6-minute walk distance; CI: confidence interval. LEVEL did not meet its primary endpoint, but a strong treatment effect was seen across patients with higher disease burden What we confirmed Oral levosimendan is safe and well-tolerated, with 1 mg BID/TID providing PK concentrations expected Targeting volume overload with K-ATP channel activation has direct effects on NT-proBNP and RVSP, two prespecified endpoints Treatment effect seen in HELP study validated Successful trial execution by sites and clinical development team What we learned Drug effect is evident in patients with higher disease burden Study entry criteria allowed patients with moderate disease and little room to improve in 6MWD In patients with baseline 6MWD* < 333 m, treatment effect was +26.3 m vs placebo (95% CI: 6.0, 46.7; nominal p = 0.0112) In the overall population, NT-proBNP was reduced by 49% vs placebo (nominal p < 0.0001) Enriching LEVEL-2 WHAT WE ARE DOING NOW

Backup - Slides
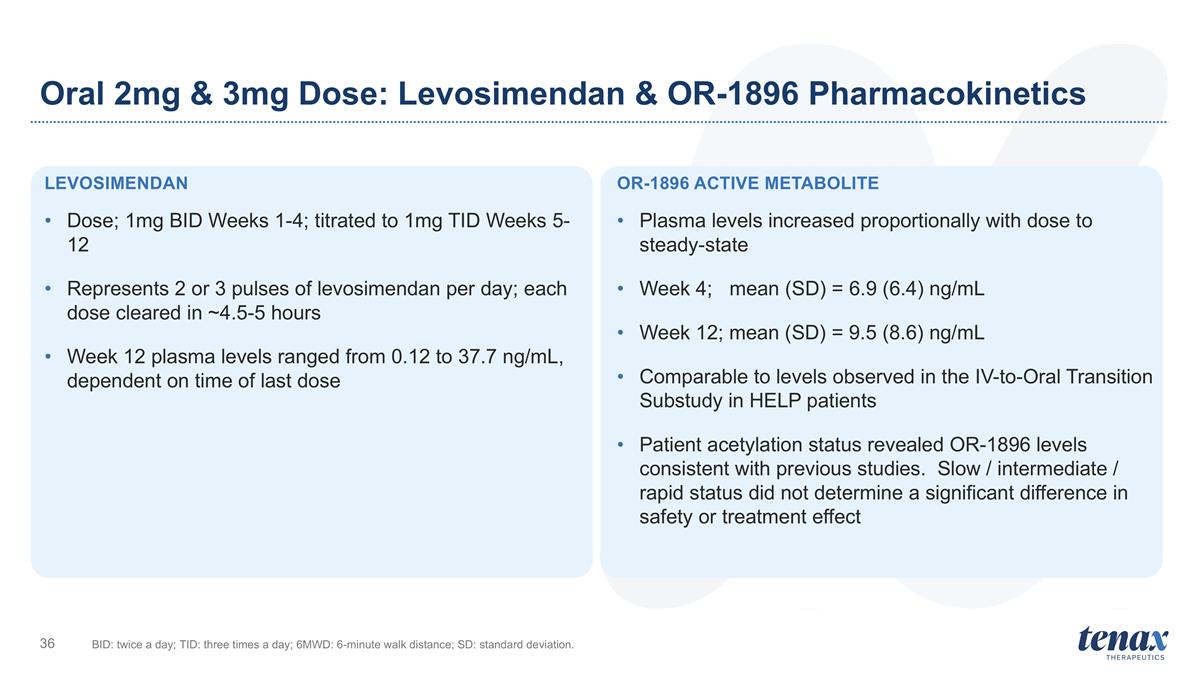
Levosimendan Dose; 1mg BID Weeks 1-4; titrated to 1mg TID Weeks 5-12 Represents 2 or 3 pulses of levosimendan per day; each dose cleared in ~4.5-5 hours Week 12 plasma levels ranged from 0.12 to 37.7 ng/mL, dependent on time of last dose OR-1896 Active Metabolite Plasma levels increased proportionally with dose to steady-state Week 4; mean (SD) = 6.9 (6.4) ng/mL Week 12; mean (SD) = 9.5 (8.6) ng/mL Comparable to levels observed in the IV-to-Oral Transition Substudy in HELP patients Patient acetylation status revealed OR-1896 levels consistent with previous studies. Slow / intermediate / rapid status did not determine a significant difference in safety or treatment effect Oral 2mg & 3mg Dose: Levosimendan & OR-1896 Pharmacokinetics BID: twice a day; TID: three times a day; 6MWD: 6-minute walk distance; SD: standard deviation.
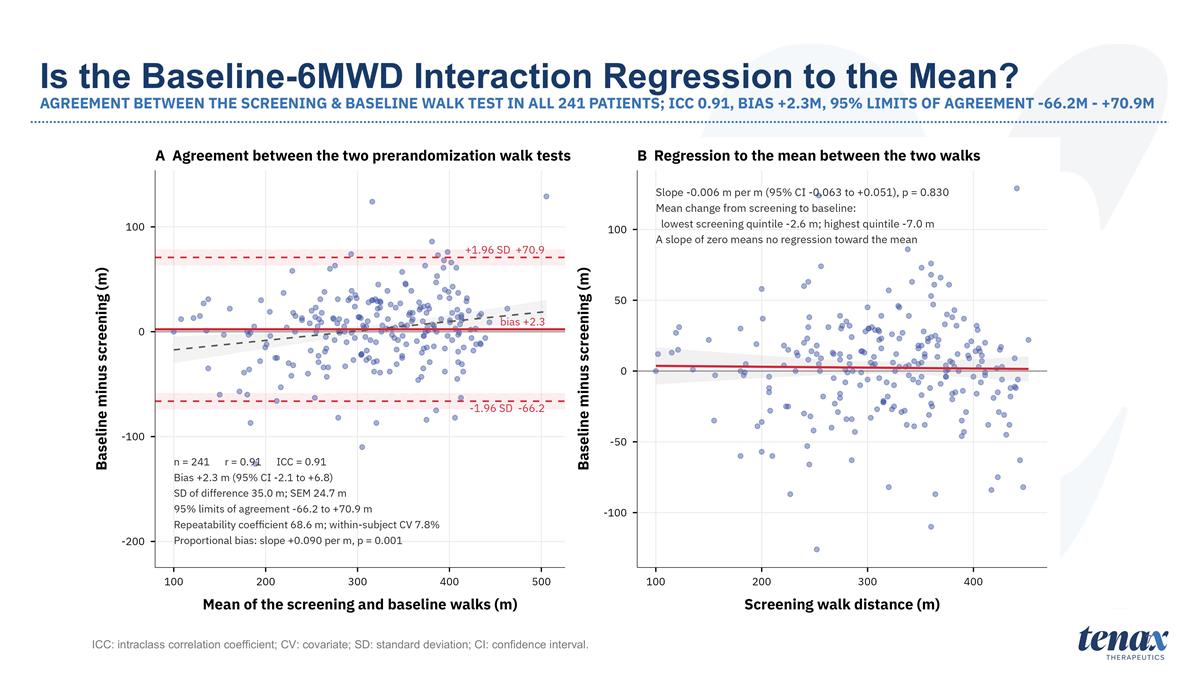
7 ICC: intraclass correlation coefficient; CV: covariate; SD: standard deviation; CI: confidence interval. Is the Baseline-6MWD Interaction Regression to the Mean? AGREEMENT BETWEEN THE SCREENING & BASELINE WALK TEST IN ALL 241 PATIENTS; ICC 0.91, BIAS +2.3M, 95% LIMITS OF AGREEMENT -66.2M - +70.9M
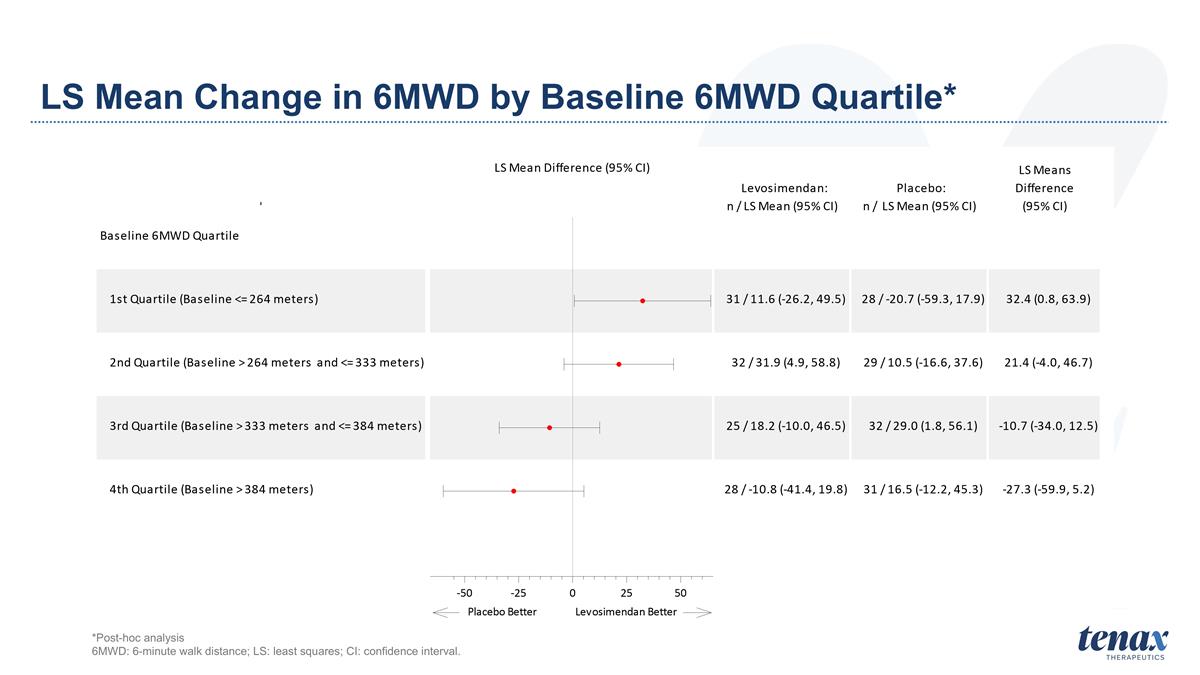
LS Mean Change in 6MWD by Baseline 6MWD Quartile* *Post-hoc analysis 6MWD: 6-minute walk distance; LS: least squares; CI: confidence interval.
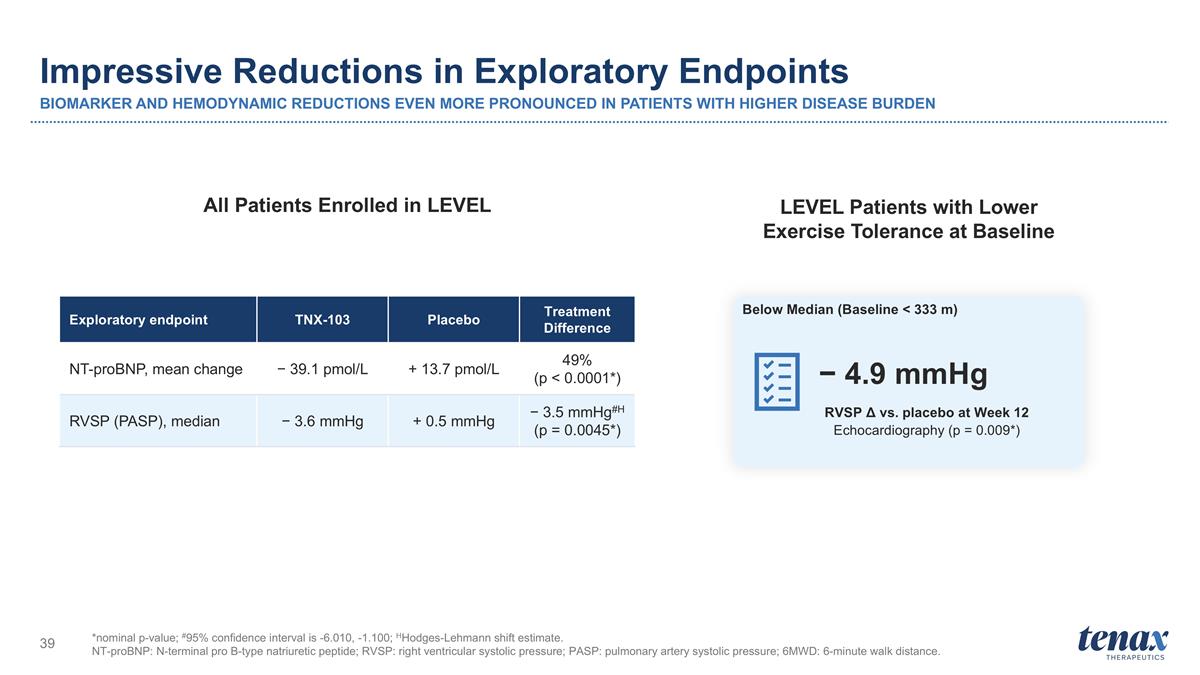
Impressive Reductions in Exploratory Endpoints BIOMARKER AND HEMODYNAMIC REDUCTIONS EVEN MORE PRONOUNCED IN PATIENTS WITH HIGHER DISEASE BURDEN *nominal p-value; #95% confidence interval is -6.010, -1.100; HHodges-Lehmann shift estimate. NT-proBNP: N-terminal pro B-type natriuretic peptide; RVSP: right ventricular systolic pressure; PASP: pulmonary artery systolic pressure; 6MWD: 6-minute walk distance. Exploratory endpoint TNX-103 Placebo Treatment Difference NT-proBNP, mean change − 39.1 pmol/L + 13.7 pmol/L 49% (p < 0.0001*) RVSP (PASP), median − 3.6 mmHg + 0.5 mmHg − 3.5 mmHg#H (p = 0.0045*) RVSP Δ vs. placebo at Week 12 Echocardiography (p = 0.009*) − 4.9 mmHg All Patients Enrolled in LEVEL LEVEL Patients with Lower Exercise Tolerance at Baseline Below Median (Baseline < 333 m)
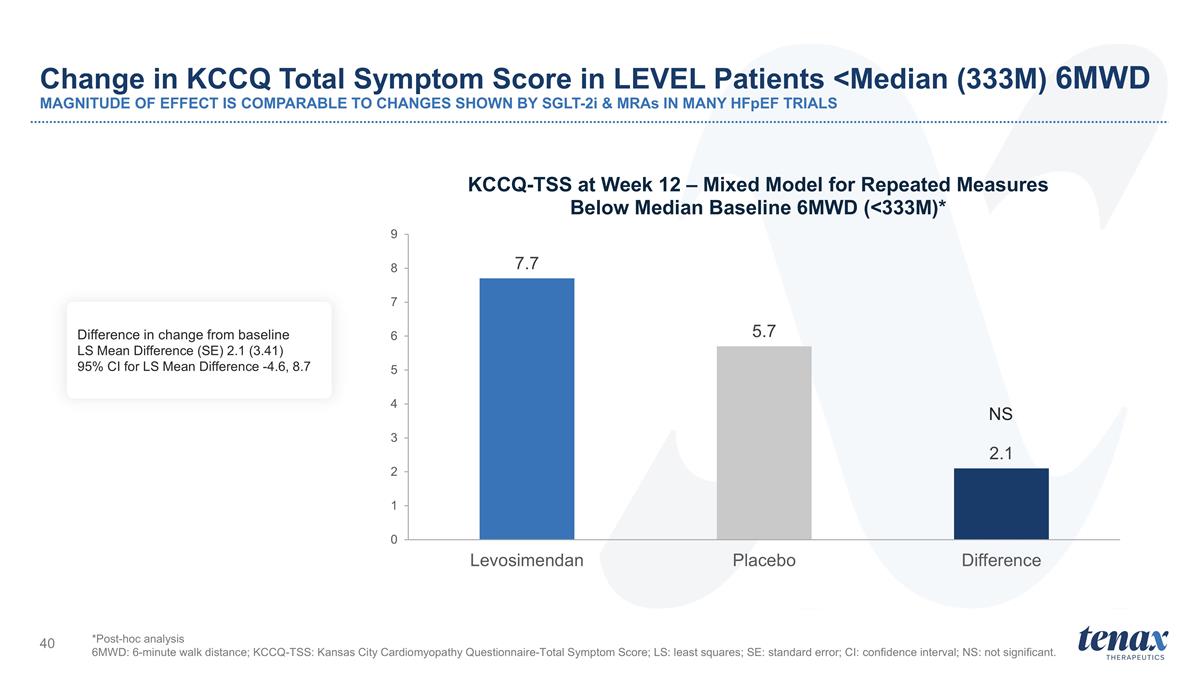
Change in KCCQ Total Symptom Score in LEVEL Patients <Median (333M) 6MWD MAGNITUDE OF EFFECT IS COMPARABLE TO CHANGES SHOWN BY SGLT-2i & MRAs IN MANY HFpEF TRIALS NS *Post-hoc analysis 6MWD: 6-minute walk distance; KCCQ-TSS: Kansas City Cardiomyopathy Questionnaire-Total Symptom Score; LS: least squares; SE: standard error; CI: confidence interval; NS: not significant. Difference in change from baseline LS Mean Difference (SE) 2.1 (3.41) 95% CI for LS Mean Difference -4.6, 8.7
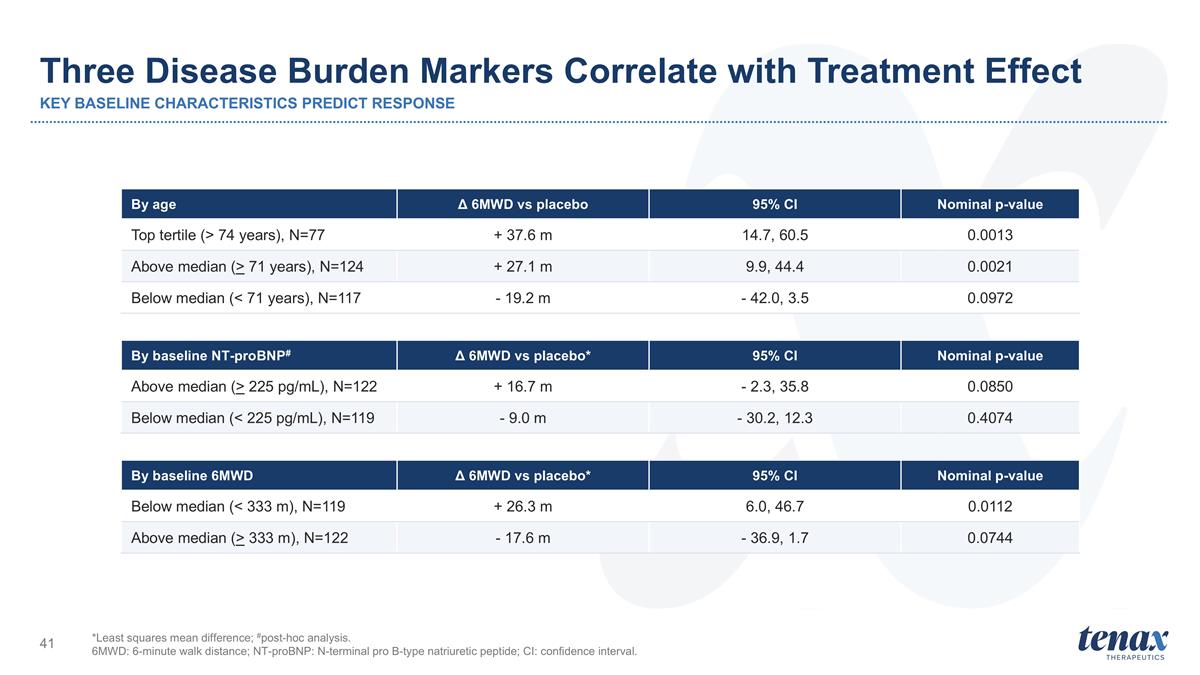
Three Disease Burden Markers Correlate with Treatment Effect KEY BASELINE CHARACTERISTICS PREDICT RESPONSE By age Δ 6MWD vs placebo 95% CI Nominal p-value Top tertile (> 74 years), N=77 + 37.6 m 14.7, 60.5 0.0013 Above median (> 71 years), N=124 + 27.1 m 9.9, 44.4 0.0021 Below median (< 71 years), N=117 - 19.2 m - 42.0, 3.5 0.0972 *Least squares mean difference; #post-hoc analysis. 6MWD: 6-minute walk distance; NT-proBNP: N-terminal pro B-type natriuretic peptide; CI: confidence interval. By baseline NT-proBNP# Δ 6MWD vs placebo* 95% CI Nominal p-value Above median (> 225 pg/mL), N=122 + 16.7 m - 2.3, 35.8 0.0850 Below median (< 225 pg/mL), N=119 - 9.0 m - 30.2, 12.3 0.4074 By baseline 6MWD Δ 6MWD vs placebo* 95% CI Nominal p-value Below median (< 333 m), N=119 + 26.3 m 6.0, 46.7 0.0112 Above median (> 333 m), N=122 - 17.6 m - 36.9, 1.7 0.0744