
Earnings Presentation Q2 2027
Disclaimer Cautionary Note Regarding Forward-Looking Statements This presentation contains forward-looking statements that involve substantial risks and uncertainties. All statements contained in this presentation other than statements of historical fact, including statements regarding our future operating results and financial condition, our business strategy and plans, market growth, and our objectives for future operations, are forward-looking statements. The words “believe,” “may,” “will,” “potentially,” “estimate,” “continue,” “anticipate,” “intend,” “could,” “would,” “project,” “target,” “plan,” “expect,” and similar expressions are intended to identify forward-looking statements. These forward-looking statements are made as of the date they were first issued and are based on information available to Wealthfront together with Wealthfront’s expectations, estimates, forecasts, projections, beliefs, and assumptions as of such date. Forward-looking statements are subject to a number of risks and uncertainties, many of which involve factors or circumstances that are beyond Wealthfront’s control. Wealthfront’s actual results could differ materially from those stated or implied in forward-looking statements due to a number of factors. Further information on potential risks that could affect actual results is included in Wealthfront’s most recent filings with the Securities and Exchange Commission (the “SEC”), including in our Annual Report on Form 10-K for the fiscal year ended January 31, 2026 filed with the SEC on April 24, 2026 and our most recent Quarterly Report on Form 10-Q, copies of which may be obtained by visiting Wealthfront’s Investor Relations website at https://ir.wealthfront.com or the SEC's website at https://www.sec.gov. Past performance is not necessarily indicative of future results. Wealthfront undertakes no intention or obligation to update or revise any forward-looking statements, whether as a result of new information, future events or otherwise, except as required by law. Forward-looking statements should not be relied upon as representing Wealthfront’s views as of any date subsequent to the date of this presentation. Additional Information We announce material information to the public through filings with the SEC, the investor relations page on our website (ir.wealthfront.com), press releases, public conference calls, public webcasts, and our social media accounts on X and LinkedIn in order to achieve broad, non-exclusionary distribution of information to the public and for complying with our disclosure obligations under Regulation FD. The content of our websites and information that we may post on or provide to online and social media channels, including those mentioned above, and information that can be accessed through our websites or these online and social media channels are not incorporated by reference into this presentation or in any report or document we file with the SEC, and any references to our websites or these online and social media channels are intended to be inactive textual references only. Non-GAAP Financial Measures We collect and analyze operating and financial data to evaluate the health of our business, allocate our resources, and assess our performance. In addition to total revenue, net income and other results under GAAP, we utilize non-GAAP calculations of adjusted earnings before interest, taxes, depreciation, and amortization (“Adjusted EBITDA”). Adjusted EBITDA is defined as net income, excluding: (i) interest expenses, (ii) provision for (benefit from) income taxes, (iii) depreciation and amortization, (iv) stock-based compensation expense, (v) change in fair value of the convertible note, warrant liabilities, and SAFEs, and (vi) nonrecurring expenses, if any. The above items are excluded from our Adjusted EBITDA measure because these items are non-cash in nature, or because the amount and timing of these items is unpredictable, are not driven by core results of operations and render comparisons with prior periods and competitors less meaningful. We define Adjusted EBITDA Margin as Adjusted EBITDA divided by revenue. We believe Adjusted EBITDA and Adjusted EBITDA Margin provide useful information to investors and others in understanding and evaluating our results of operations, as well as providing a useful measure for period-to-period comparisons of our business performance. Moreover, we have included Adjusted EBITDA and Adjusted EBITDA Margin in this presentation because they are key measurements used by our management internally to make operating decisions, including those related to operating expenses, evaluate performance, identify trends affecting our business and perform strategic planning and annual budgeting. Adjusted Free Cash Flow reflects net cash provided from operating activities, less (i) purchases of property, software, and equipment and (ii) capitalized internally developed software, plus (i) the change in temporary client funding receivables, which include (a) the change in direct deposit receivables and (b) the change in instant withdrawal receivables. We believe Adjusted Free Cash Flow allows investors to evaluate the cash generated from our underlying operations in a manner similar to the method used by management. However, the utility of Adjusted Free Cash Flow as a measure of our liquidity is limited as it does not represent the total increase or decrease in our cash balance for a given period. Adjusted Free Cash Flow Conversion reflects Adjusted Free Cash Flow divided by Adjusted EBITDA. Adjusted Operating Expenses reflect GAAP expenses, less (i) stock-based compensation expense and (ii) nonrecurring expenses, if any. The above items are excluded from our Adjusted Operating Expenses because these items are non-cash in nature, or because the amount and timing of these items is unpredictable, are not driven by core results of operations and render comparisons with prior periods and competitors less meaningful. Please refer to the Appendix for a reconciliation of each non-GAAP financial measure presented herein to the most directly comparable financial measure stated in accordance with GAAP. 02
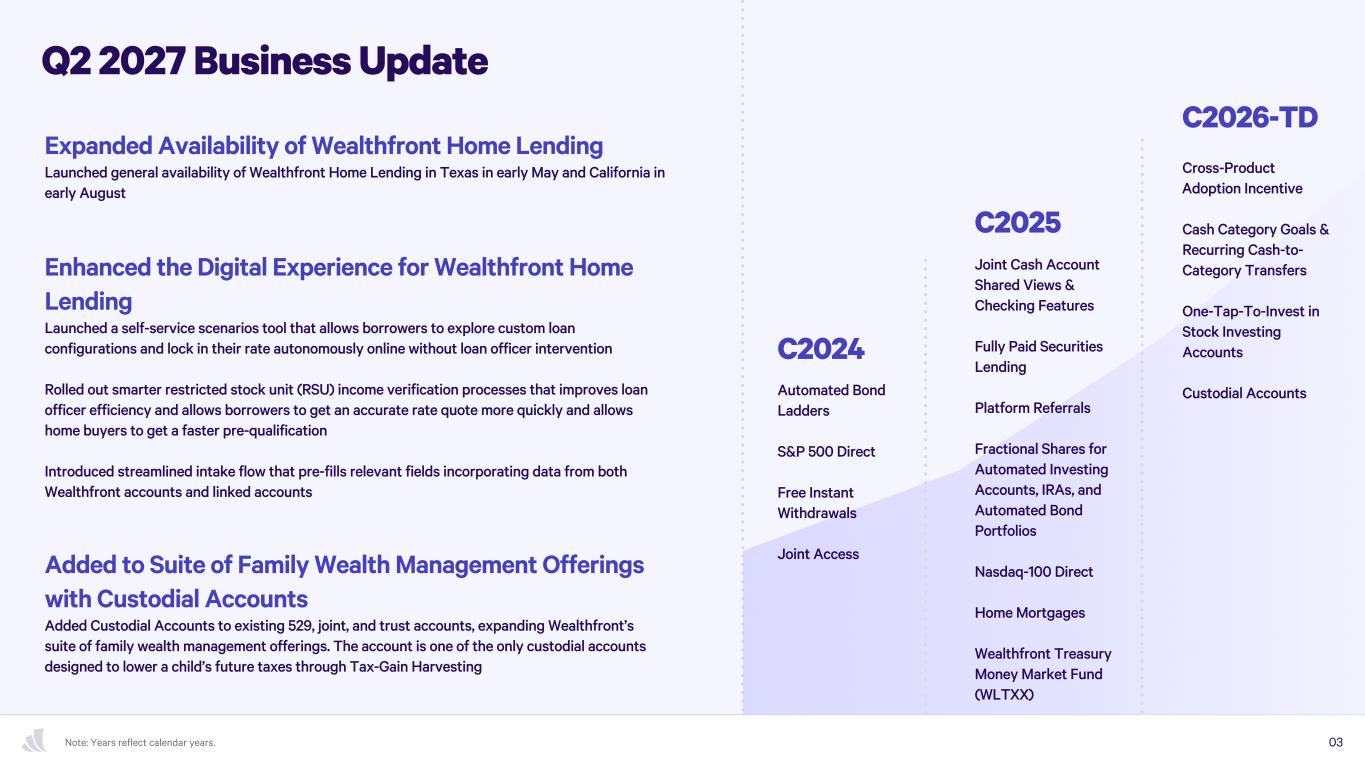
Q2 2027 Business Update 03Note: Years reflect calendar years. Enhanced the Digital Experience for Wealthfront Home Lending Launched a self-service scenarios tool that allows borrowers to explore custom loan configurations and lock in their rate autonomously online without loan officer intervention Rolled out smarter restricted stock unit (RSU) income verification processes that improves loan officer efficiency and allows borrowers to get an accurate rate quote more quickly and allows home buyers to get a faster pre-qualification Introduced streamlined intake flow that pre-fills relevant fields incorporating data from both Wealthfront accounts and linked accounts Expanded Availability of Wealthfront Home Lending Launched general availability of Wealthfront Home Lending in Texas in early May and California in early August Added to Suite of Family Wealth Management Offerings with Custodial Accounts Added Custodial Accounts to existing 529, joint, and trust accounts, expanding Wealthfront’s suite of family wealth management offerings. The account is one of the only custodial accounts designed to lower a child’s future taxes through Tax-Gain Harvesting C2024 C2025 C2026-TD Automated Bond Ladders S&P 500 Direct Free Instant Withdrawals Joint Access Joint Cash Account Shared Views & Checking Features Fully Paid Securities Lending Platform Referrals Fractional Shares for Automated Investing Accounts, IRAs, and Automated Bond Portfolios Nasdaq-100 Direct Home Mortgages Wealthfront Treasury Money Market Fund (WLTXX) Cross-Product Adoption Incentive Cash Category Goals & Recurring Cash-to- Category Transfers One-Tap-To-Invest in Stock Investing Accounts Custodial Accounts
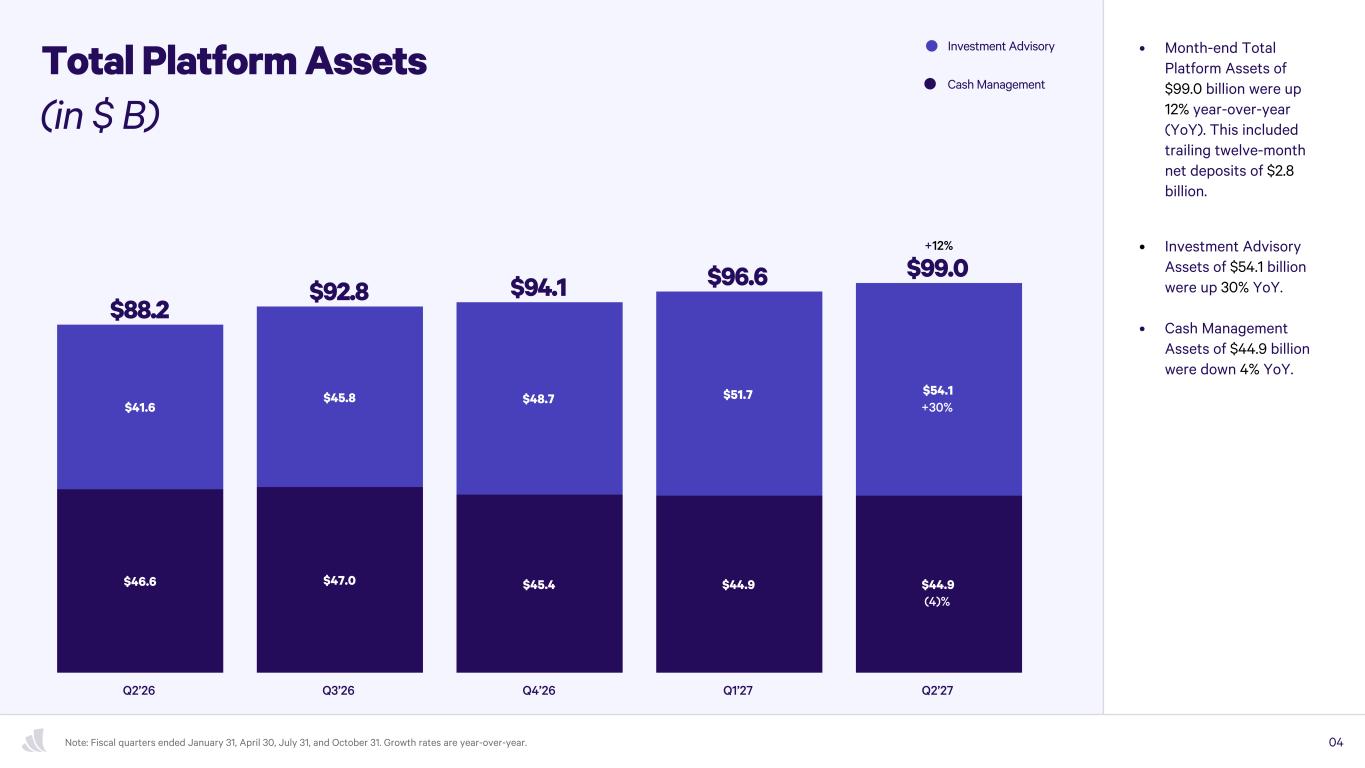
Total Platform Assets (in $ B) $88.2 $92.8 $94.1 $96.6 $99.0 $46.6 $47.0 $45.4 $44.9 $44.9 $41.6 $45.8 $48.7 $51.7 $54.1 Q2’26 Q3’26 Q4’26 Q1’27 Q2’27 • Month-end Total Platform Assets of $99.0 billion were up 12% year-over-year (YoY). This included trailing twelve-month net deposits of $2.8 billion. • Investment Advisory Assets of $54.1 billion were up 30% YoY. • Cash Management Assets of $44.9 billion were down 4% YoY. 04Note: Fiscal quarters ended January 31, April 30, July 31, and October 31. Growth rates are year-over-year. Investment Advisory Cash Management +30% (4)% +12%
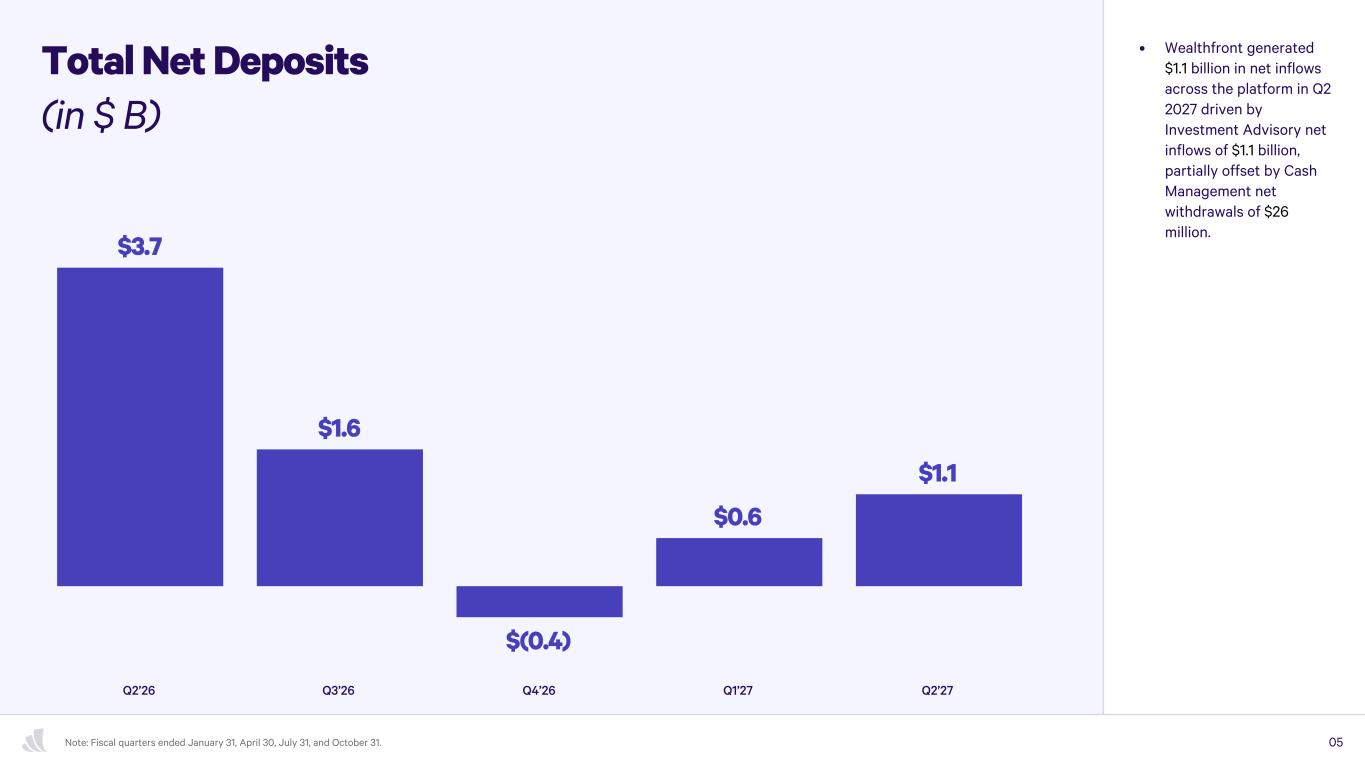
Total Net Deposits (in $ B) $3.7 $1.6 $0.6 $1.1 $(0.4) Q2’26 Q3’26 Q4’26 Q1’27 Q2’27 • Wealthfront generated $1.1 billion in net inflows across the platform in Q2 2027 driven by Investment Advisory net inflows of $1.1 billion, partially offset by Cash Management net withdrawals of $26 million. 05Note: Fiscal quarters ended January 31, April 30, July 31, and October 31.
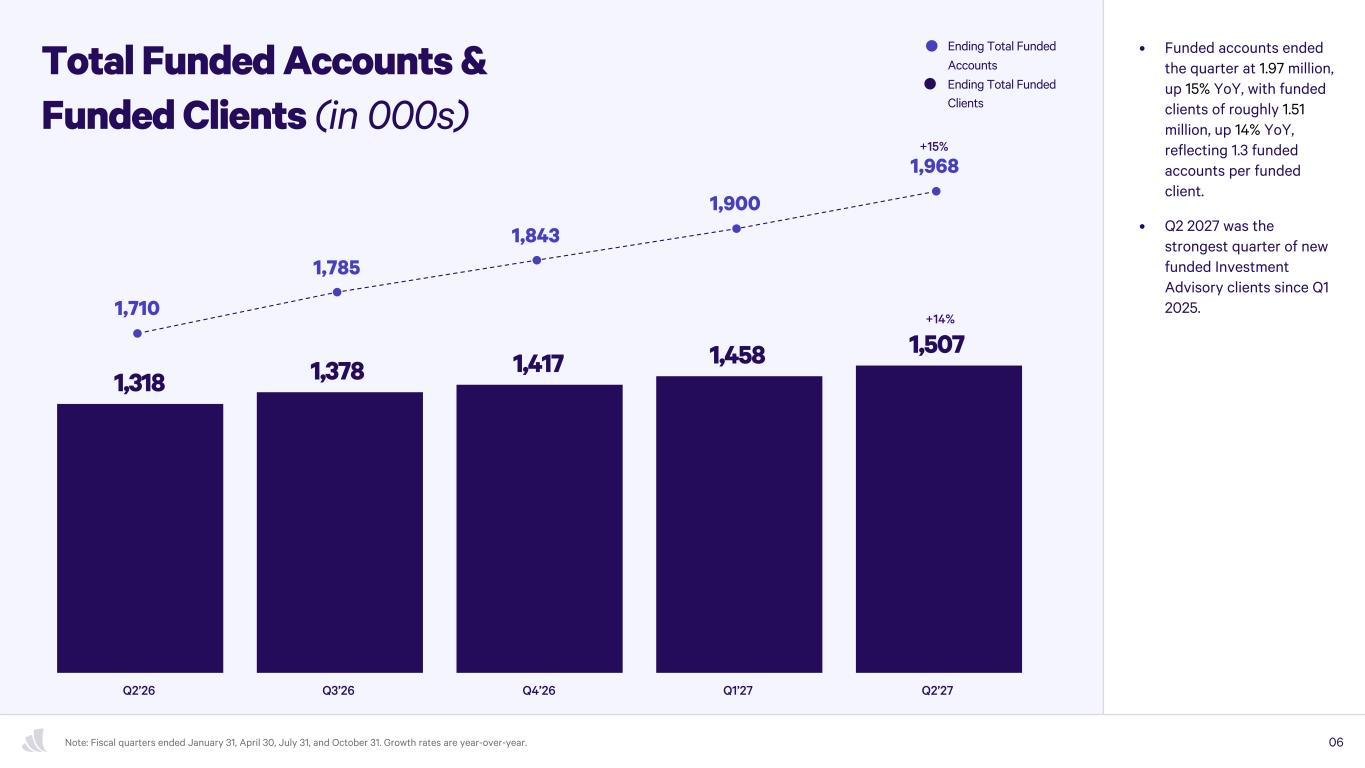
1,710 1,785 1,843 1,900 1,968 Total Funded Accounts & Funded Clients (in 000s) +14% 1,318 1,378 1,417 1,458 1,507 Q2’26 Q3’26 Q4’26 Q1’27 Q2’27 • Funded accounts ended the quarter at 1.97 million, up 15% YoY, with funded clients of roughly 1.51 million, up 14% YoY, reflecting 1.3 funded accounts per funded client. • Q2 2027 was the strongest quarter of new funded Investment Advisory clients since Q1 2025. 06Note: Fiscal quarters ended January 31, April 30, July 31, and October 31. Growth rates are year-over-year. Ending Total Funded Clients Ending Total Funded +15% Accounts
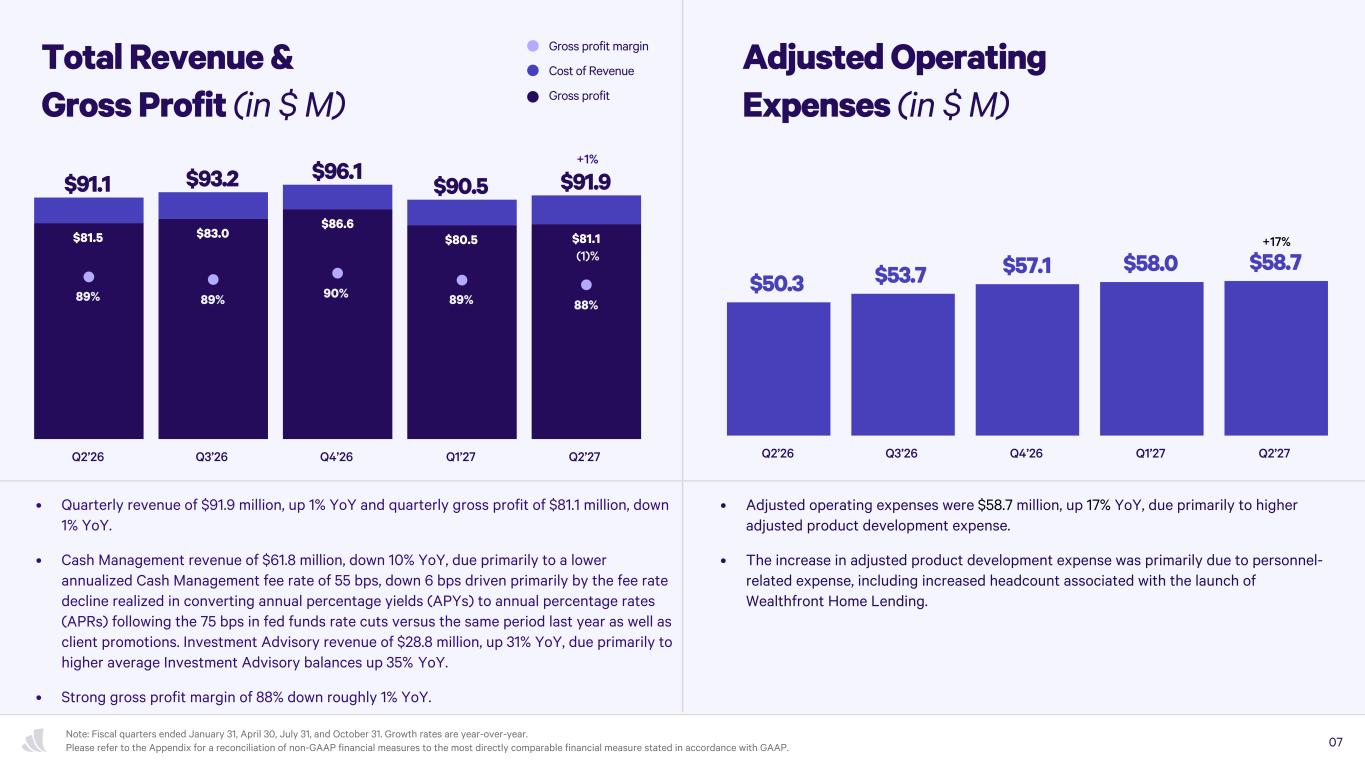
$91.1 $93.2 $96.1 $90.5 $91.9 $81.5 $83.0 $86.6 $80.5 $81.1 89% 89% 90% 89% 88% Q2’26 Q3’26 Q4’26 Q1’27 Q2’27 Total Revenue & Gross Profit (in $ M) Gross profit margin Cost of Revenue Gross profit +1% Adjusted Operating Expenses (in $ M) $50.3 $53.7 $57.1 $58.0 $58.7 Q2’26 Q3’26 Q4’26 Q1’27 Q2’27 • Quarterly revenue of $91.9 million, up 1% YoY and quarterly gross profit of $81.1 million, down 1% YoY. • Cash Management revenue of $61.8 million, down 10% YoY, due primarily to a lower annualized Cash Management fee rate of 55 bps, down 6 bps driven primarily by the fee rate decline realized in converting annual percentage yields (APYs) to annual percentage rates (APRs) following the 75 bps in fed funds rate cuts versus the same period last year as well as client promotions. Investment Advisory revenue of $28.8 million, up 31% YoY, due primarily to higher average Investment Advisory balances up 35% YoY. • Strong gross profit margin of 88% down roughly 1% YoY. • Adjusted operating expenses were $58.7 million, up 17% YoY, due primarily to higher adjusted product development expense. • The increase in adjusted product development expense was primarily due to personnel- related expense, including increased headcount associated with the launch of Wealthfront Home Lending. +17% 07 (1)% Note: Fiscal quarters ended January 31, April 30, July 31, and October 31. Growth rates are year-over-year. Please refer to the Appendix for a reconciliation of non-GAAP financial measures to the most directly comparable financial measure stated in accordance with GAAP.
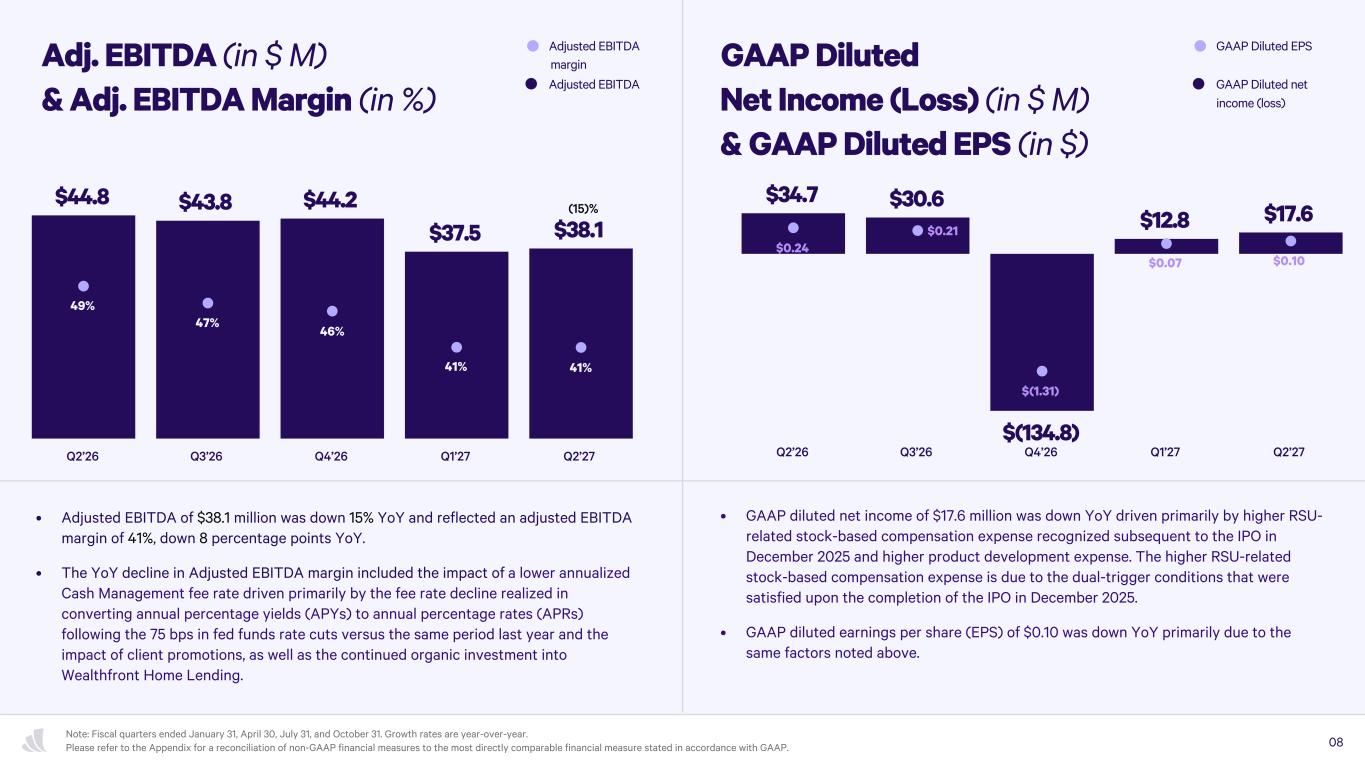
Adj. EBITDA (in $ M) & Adj. EBITDA Margin (in %) Adjusted EBITDA (15)% GAAP Diluted Net Income (Loss) (in $ M) & GAAP Diluted EPS (in $) • Adjusted EBITDA of $38.1 million was down 15% YoY and reflected an adjusted EBITDA margin of 41%, down 8 percentage points YoY. • The YoY decline in Adjusted EBITDA margin included the impact of a lower annualized Cash Management fee rate driven primarily by the fee rate decline realized in converting annual percentage yields (APYs) to annual percentage rates (APRs) following the 75 bps in fed funds rate cuts versus the same period last year and the impact of client promotions, as well as the continued organic investment into Wealthfront Home Lending. $44.8 $43.8 $44.2 $37.5 $38.1 49% 47% 46% 41% 41% Q2’26 Q3’26 Q4’26 Q1’27 Q2’27 • GAAP diluted net income of $17.6 million was down YoY driven primarily by higher RSU- related stock-based compensation expense recognized subsequent to the IPO in December 2025 and higher product development expense. The higher RSU-related stock-based compensation expense is due to the dual-trigger conditions that were satisfied upon the completion of the IPO in December 2025. • GAAP diluted earnings per share (EPS) of $0.10 was down YoY primarily due to the same factors noted above. 08 Note: Fiscal quarters ended January 31, April 30, July 31, and October 31. Growth rates are year-over-year. Please refer to the Appendix for a reconciliation of non-GAAP financial measures to the most directly comparable financial measure stated in accordance with GAAP. margin Adjusted EBITDA $34.7 $30.6 $12.8 $17.6 $(134.8) $0.24 $0.21 $(1.31) $0.07 $0.10 Q2’26 Q3’26 Q4’26 Q1’27 Q2’27 GAAP Diluted EPS income (loss) GAAP Diluted net
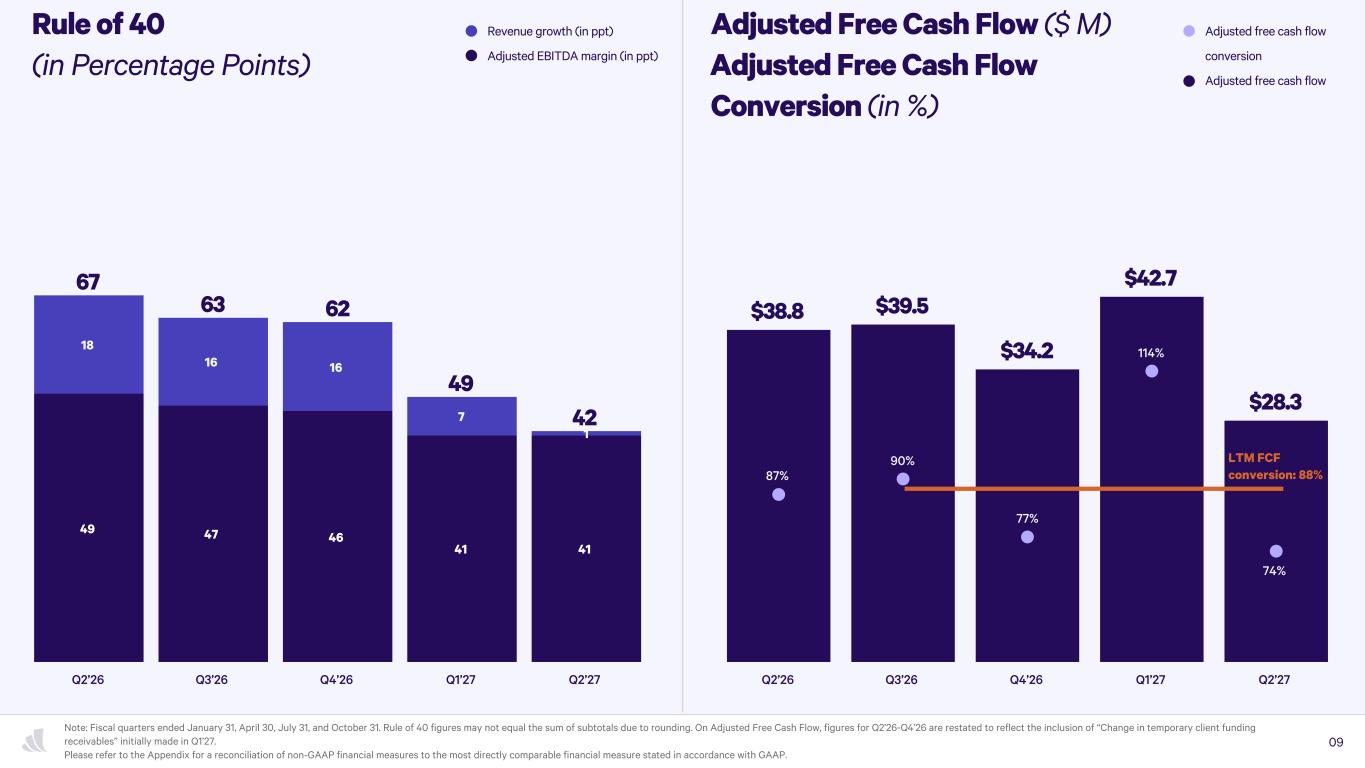
67 63 62 49 42 49 47 46 41 41 18 16 16 7 1 Q2’26 Q3’26 Q4’26 Q1’27 Q2’27 Rule of 40 (in Percentage Points) Revenue growth (in ppt) Adjusted EBITDA margin (in ppt) Adjusted Free Cash Flow ($ M) Adjusted Free Cash Flow Conversion (in %) $38.8 $39.5 $34.2 $42.7 $28.3 87% 90% 77% 114% 74% Q2’26 Q3’26 Q4’26 Q1’27 Q2’27 09 Note: Fiscal quarters ended January 31, April 30, July 31, and October 31. Rule of 40 figures may not equal the sum of subtotals due to rounding. On Adjusted Free Cash Flow, figures for Q2’26-Q4’26 are restated to reflect the inclusion of “Change in temporary client funding receivables” initially made in Q1’27. Please refer to the Appendix for a reconciliation of non-GAAP financial measures to the most directly comparable financial measure stated in accordance with GAAP. Adjusted free cash flow conversion Adjusted free cash flow LTM FCF conversion: 88%
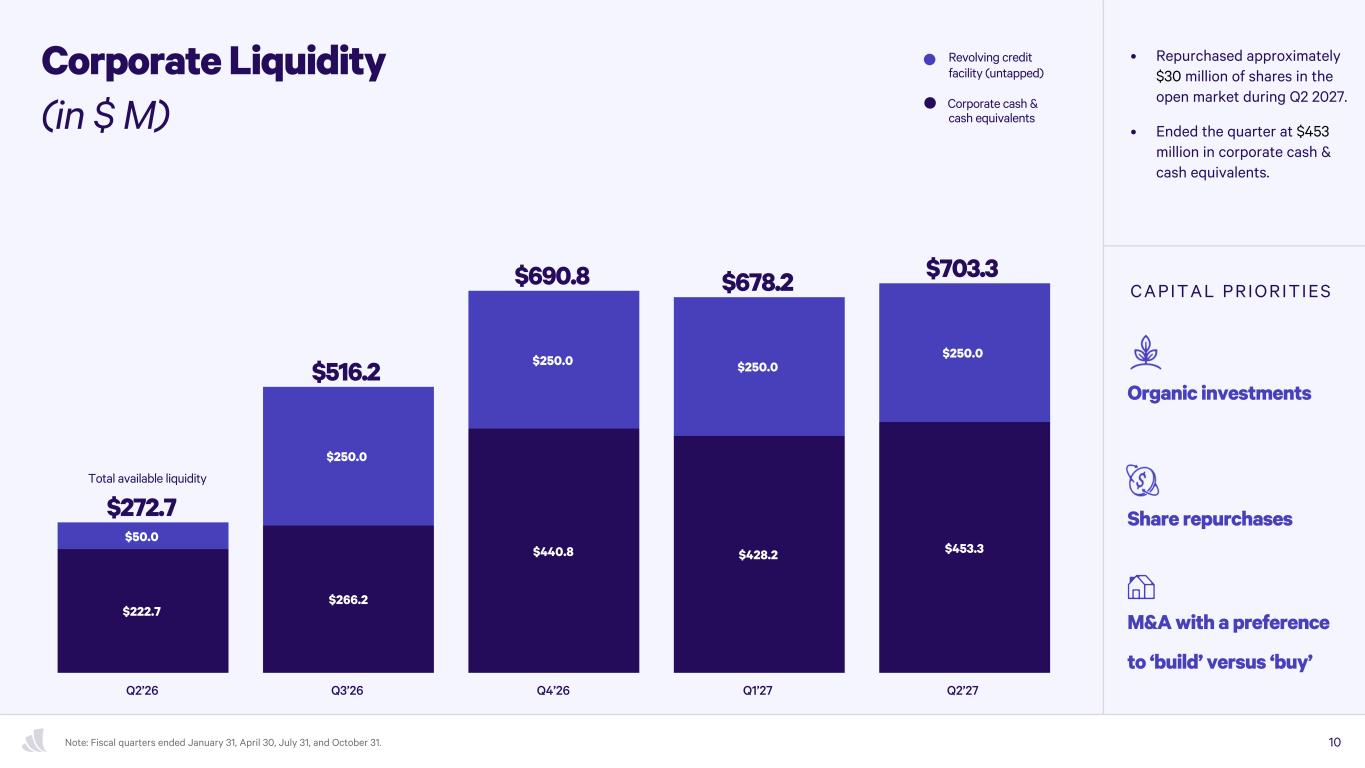
Corporate Liquidity (in $ M) $272.7 $516.2 $690.8 $678.2 $703.3 $222.7 $266.2 $440.8 $428.2 $453.3 $50.0 $250.0 $250.0 $250.0 $250.0 Q2’26 Q3’26 Q4’26 Q1’27 Q2’27 10Note: Fiscal quarters ended January 31, April 30, July 31, and October 31. Corporate cash & cash equivalents Revolving credit facility (untapped) CAPITAL PRIORITIES Organic investments Total available liquidity Share repurchases M&A with a preference to ‘build’ versus ‘buy’ • Repurchased approximately $30 million of shares in the open market during Q2 2027. • Ended the quarter at $453 million in corporate cash & cash equivalents.

Appendix
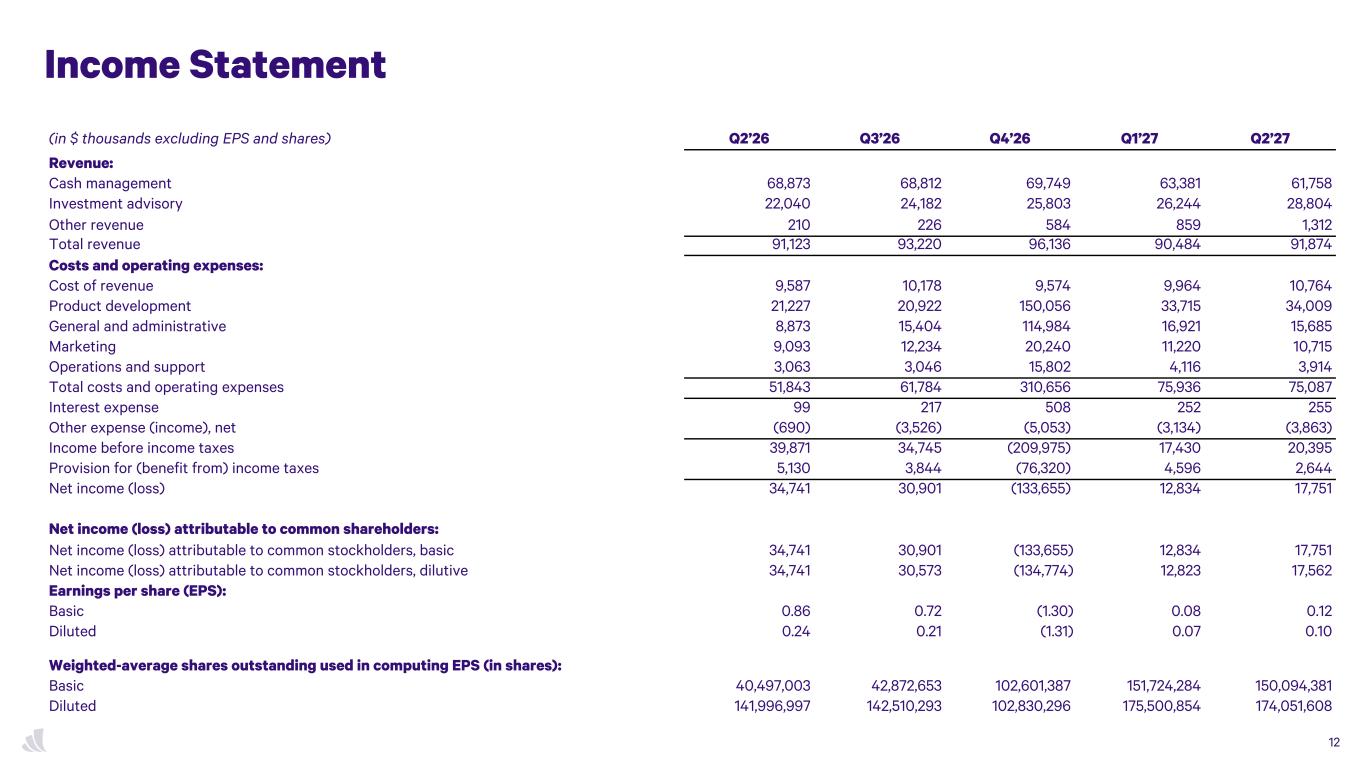
(in $ thousands excluding EPS and shares) Q2’26 Q3’26 Q4’26 Q1’27 Q2’27 Revenue: Cash management 68,873 68,812 69,749 63,381 61,758 Investment advisory 22,040 24,182 25,803 26,244 28,804 Other revenue 210 226 584 859 1,312 Total revenue 91,123 93,220 96,136 90,484 91,874 Costs and operating expenses: Cost of revenue 9,587 10,178 9,574 9,964 10,764 Product development 21,227 20,922 150,056 33,715 34,009 General and administrative 8,873 15,404 114,984 16,921 15,685 Marketing 9,093 12,234 20,240 11,220 10,715 Operations and support 3,063 3,046 15,802 4,116 3,914 Total costs and operating expenses 51,843 61,784 310,656 75,936 75,087 Interest expense 99 217 508 252 255 Other expense (income), net (690) (3,526) (5,053) (3,134) (3,863) Income before income taxes 39,871 34,745 (209,975) 17,430 20,395 Provision for (benefit from) income taxes 5,130 3,844 (76,320) 4,596 2,644 Net income (loss) 34,741 30,901 (133,655) 12,834 17,751 Net income (loss) attributable to common shareholders: Net income (loss) attributable to common stockholders, basic 34,741 30,901 (133,655) 12,834 17,751 Net income (loss) attributable to common stockholders, dilutive 34,741 30,573 (134,774) 12,823 17,562 Earnings per share (EPS): Basic 0.86 0.72 (1.30) 0.08 0.12 Diluted 0.24 0.21 (1.31) 0.07 0.10 Weighted-average shares outstanding used in computing EPS (in shares): Basic 40,497,003 42,872,653 102,601,387 151,724,284 150,094,381 Diluted 141,996,997 142,510,293 102,830,296 175,500,854 174,051,608 Income Statement 12
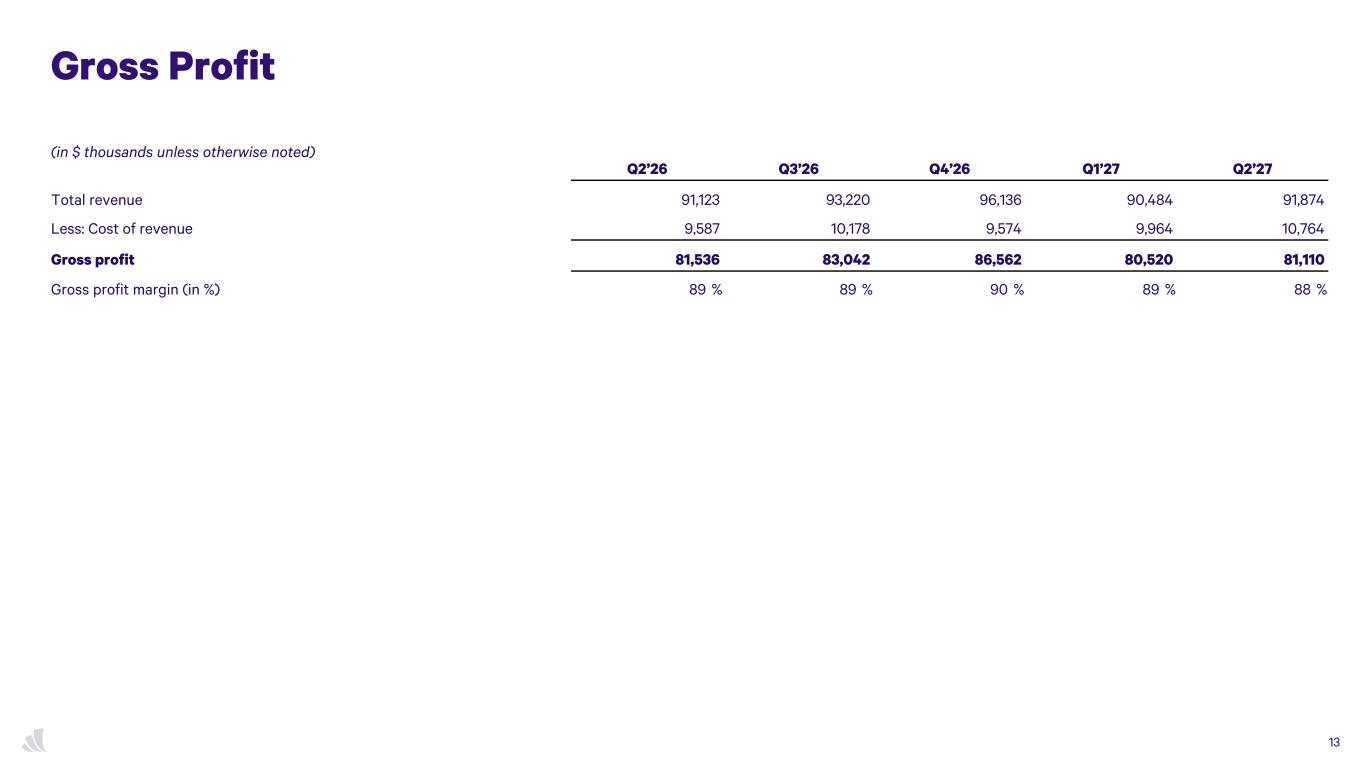
(in $ thousands unless otherwise noted) Q2’26 Q3’26 Q4’26 Q1’27 Q2’27 Total revenue 91,123 93,220 96,136 90,484 91,874 Less: Cost of revenue 9,587 10,178 9,574 9,964 10,764 Gross profit 81,536 83,042 86,562 80,520 81,110 Gross profit margin (in %) 89 % 89 % 90 % 89 % 88 % Gross Profit 13
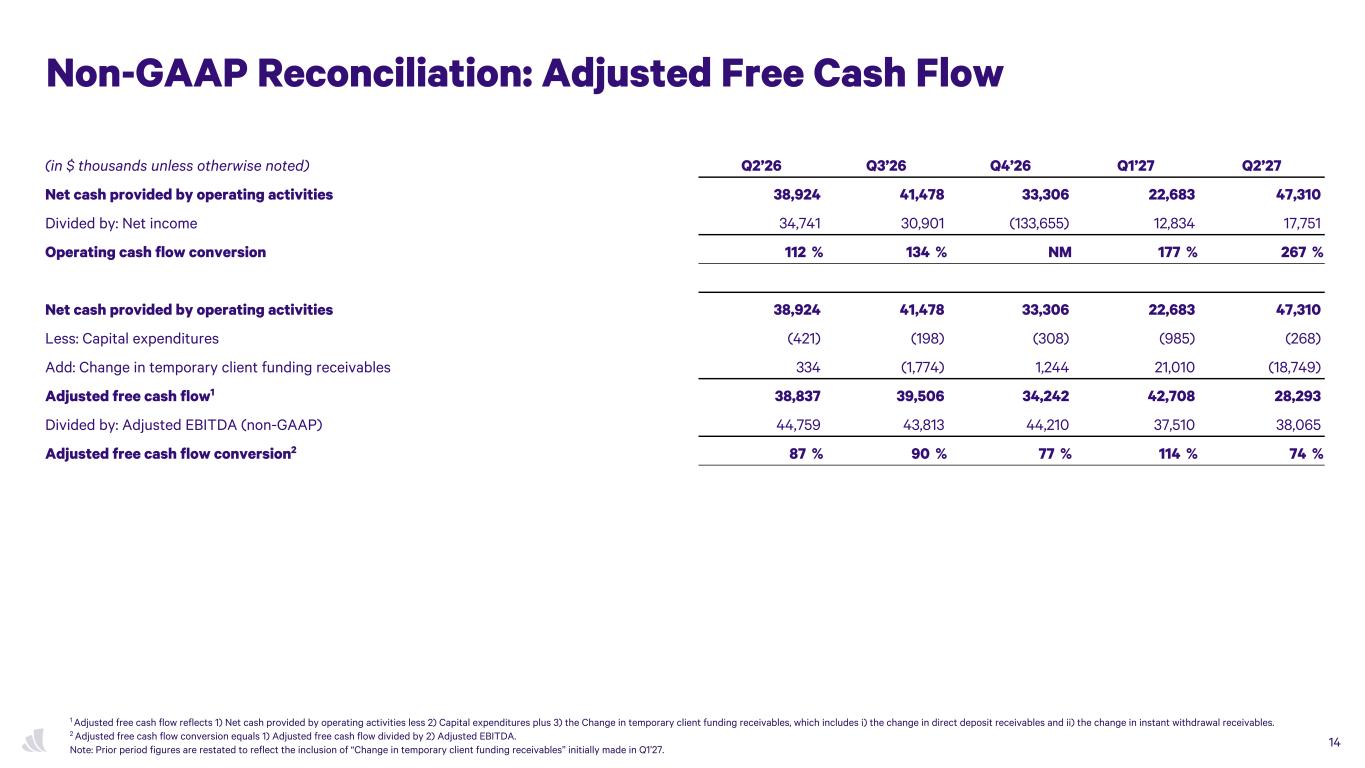
(in $ thousands unless otherwise noted) Q2’26 Q3’26 Q4’26 Q1’27 Q2’27 Net cash provided by operating activities 38,924 41,478 33,306 22,683 47,310 Divided by: Net income 34,741 30,901 (133,655) 12,834 17,751 Operating cash flow conversion 112 % 134 % NM 177 % 267 % Net cash provided by operating activities 38,924 41,478 33,306 22,683 47,310 Less: Capital expenditures (421) (198) (308) (985) (268) Add: Change in temporary client funding receivables 334 (1,774) 1,244 21,010 (18,749) Adjusted free cash flow1 38,837 39,506 34,242 42,708 28,293 Divided by: Adjusted EBITDA (non-GAAP) 44,759 43,813 44,210 37,510 38,065 Adjusted free cash flow conversion2 87 % 90 % 77 % 114 % 74 % Non-GAAP Reconciliation: Adjusted Free Cash Flow 15 1 Adjusted free cash flow reflects 1) Net cash provided by operating activities less 2) Capital expenditures plus 3) the Change in temporary client funding receivables, which includes i) the change in direct deposit receivables and ii) the change in instant withdrawal receivables. 2 Adjusted free cash flow conversion equals 1) Adjusted free cash flow divided by 2) Adjusted EBITDA. Note: Prior period figures are restated to reflect the inclusion of “Change in temporary client funding receivables” initially made in Q1’27. 14
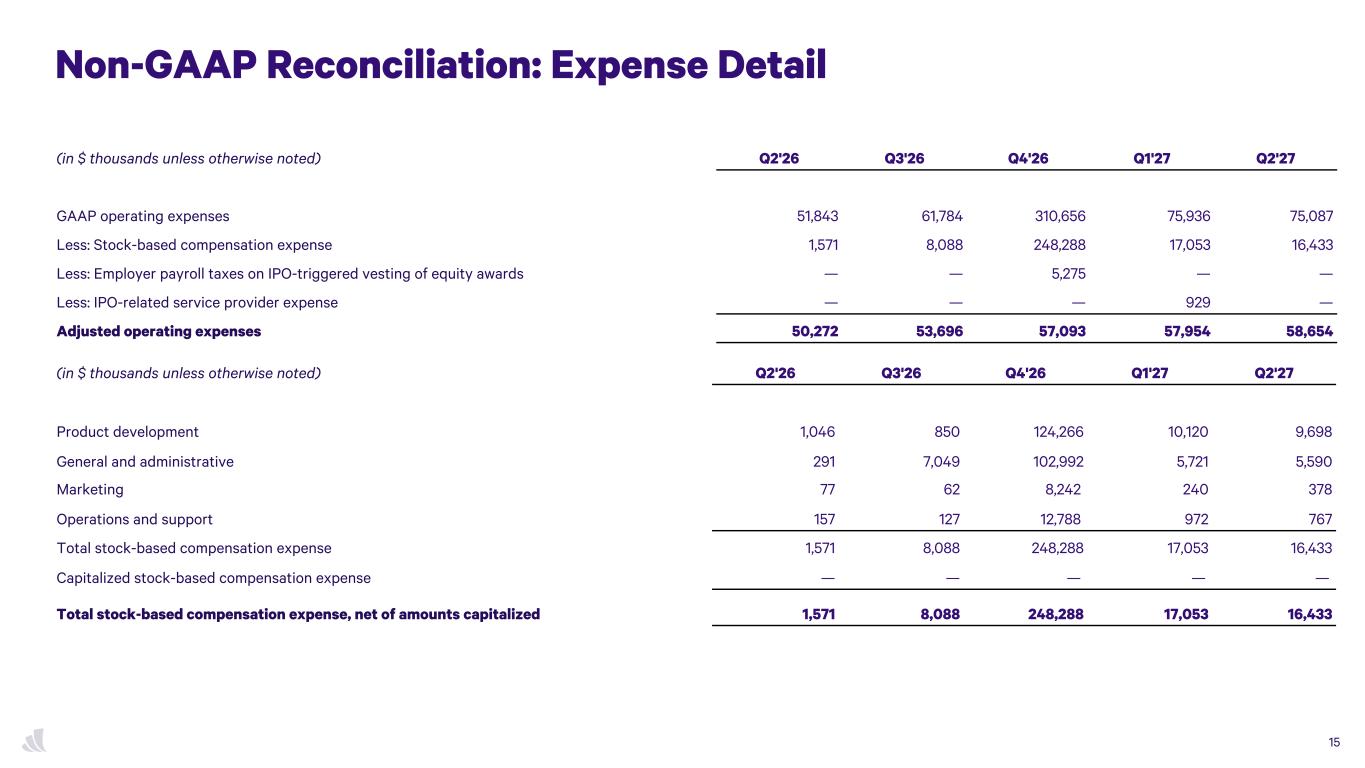
(in $ thousands unless otherwise noted) Q2'26 Q3'26 Q4'26 Q1'27 Q2'27 Product development 1,046 850 124,266 10,120 9,698 General and administrative 291 7,049 102,992 5,721 5,590 Marketing 77 62 8,242 240 378 Operations and support 157 127 12,788 972 767 Total stock-based compensation expense 1,571 8,088 248,288 17,053 16,433 Capitalized stock-based compensation expense — — — — — Total stock-based compensation expense, net of amounts capitalized 1,571 8,088 248,288 17,053 16,433 Non-GAAP Reconciliation: Expense Detail (in $ thousands unless otherwise noted) Q2'26 Q3'26 Q4'26 Q1'27 Q2'27 GAAP operating expenses 51,843 61,784 310,656 75,936 75,087 Less: Stock-based compensation expense 1,571 8,088 248,288 17,053 16,433 Less: Employer payroll taxes on IPO-triggered vesting of equity awards — — 5,275 — — Less: IPO-related service provider expense — — — 929 — Adjusted operating expenses 50,272 53,696 57,093 57,954 58,654 15
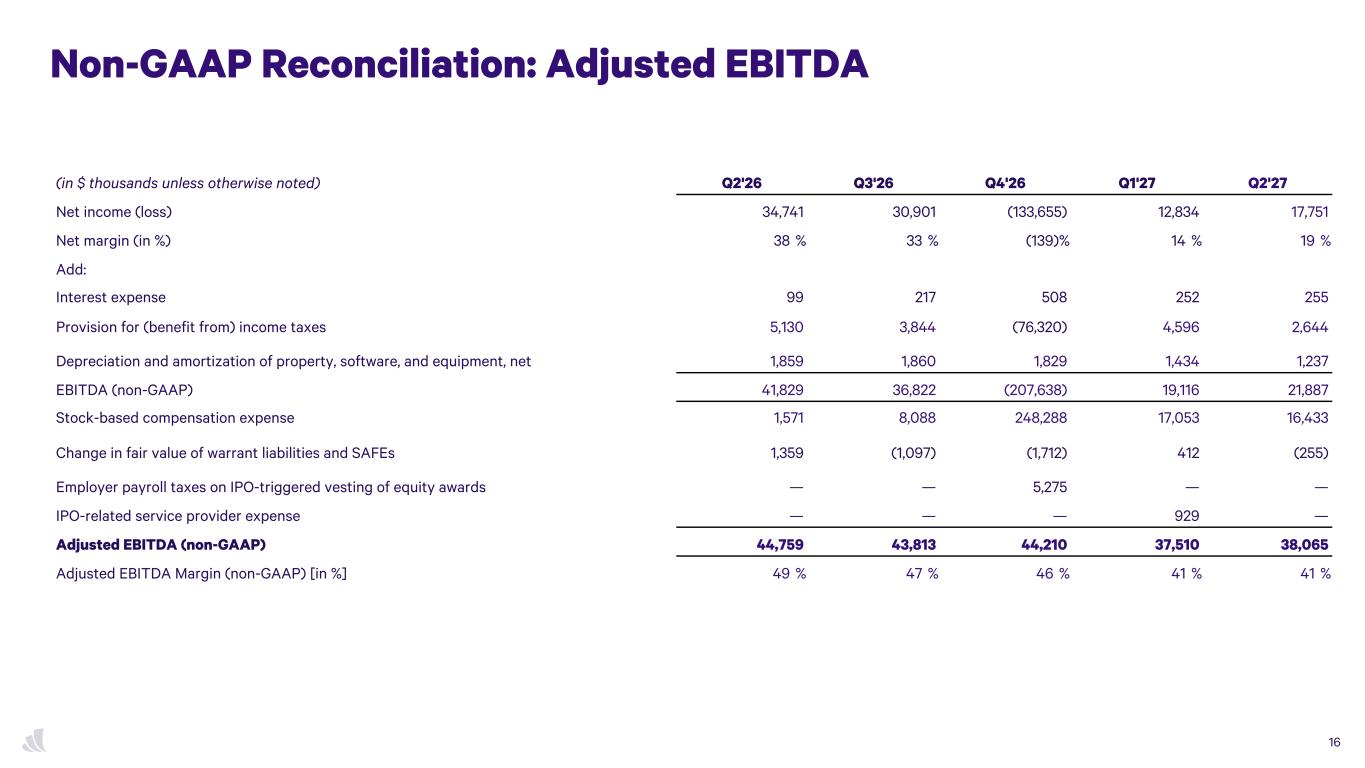
(in $ thousands unless otherwise noted) Q2'26 Q3'26 Q4'26 Q1'27 Q2'27 Net income (loss) 34,741 30,901 (133,655) 12,834 17,751 Net margin (in %) 38 % 33 % (139) % 14 % 19 % Add: Interest expense 99 217 508 252 255 Provision for (benefit from) income taxes 5,130 3,844 (76,320) 4,596 2,644 Depreciation and amortization of property, software, and equipment, net 1,859 1,860 1,829 1,434 1,237 EBITDA (non-GAAP) 41,829 36,822 (207,638) 19,116 21,887 Stock-based compensation expense 1,571 8,088 248,288 17,053 16,433 Change in fair value of warrant liabilities and SAFEs 1,359 (1,097) (1,712) 412 (255) Employer payroll taxes on IPO-triggered vesting of equity awards — — 5,275 — — IPO-related service provider expense — — — 929 — Adjusted EBITDA (non-GAAP) 44,759 43,813 44,210 37,510 38,065 Adjusted EBITDA Margin (non-GAAP) [in %] 49 % 47 % 46 % 41 % 41 % Non-GAAP Reconciliation: Adjusted EBITDA 16
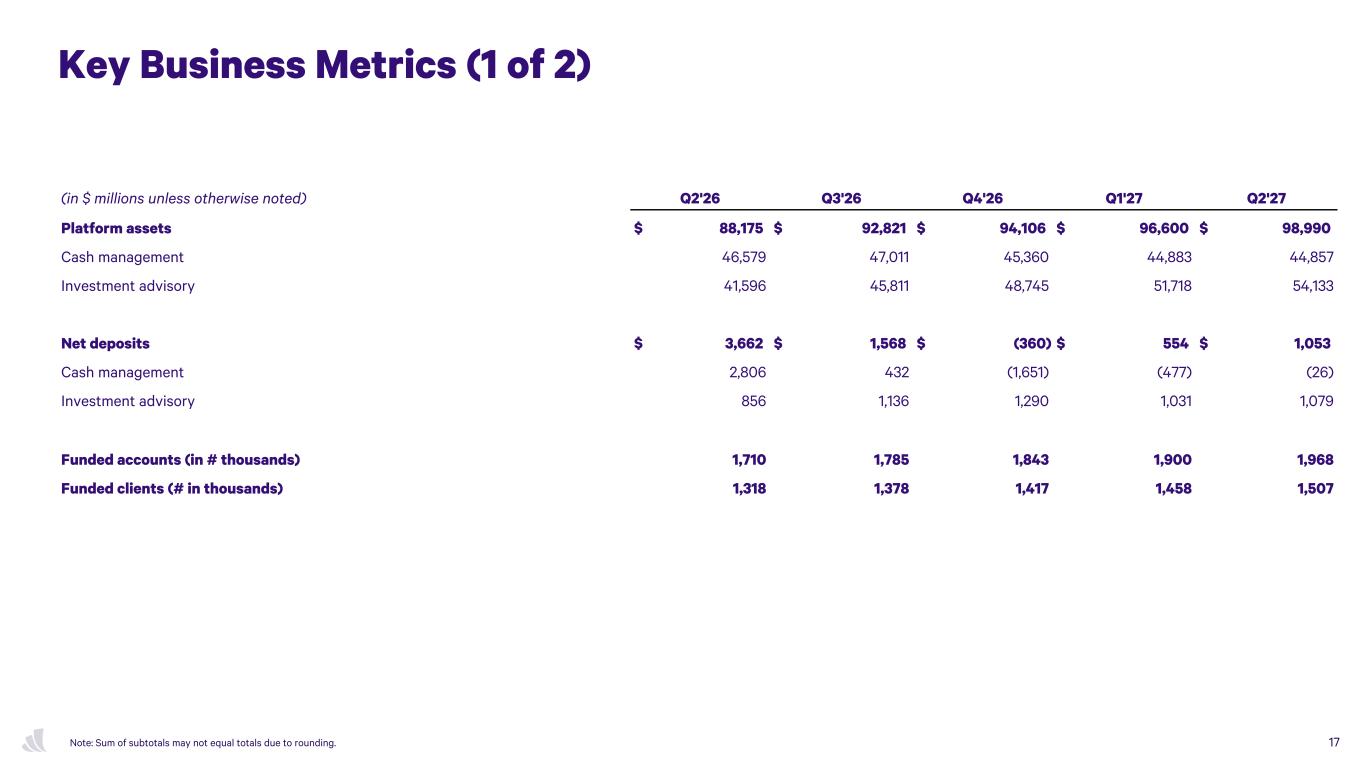
(in $ millions unless otherwise noted) Q2'26 Q3'26 Q4'26 Q1'27 Q2'27 Platform assets $ 88,175 $ 92,821 $ 94,106 $ 96,600 $ 98,990 Cash management 46,579 47,011 45,360 44,883 44,857 Investment advisory 41,596 45,811 48,745 51,718 54,133 Net deposits $ 3,662 $ 1,568 $ (360) $ 554 $ 1,053 Cash management 2,806 432 (1,651) (477) (26) Investment advisory 856 1,136 1,290 1,031 1,079 Funded accounts (in # thousands) 1,710 1,785 1,843 1,900 1,968 Funded clients (# in thousands) 1,318 1,378 1,417 1,458 1,507 Key Business Metrics (1 of 2) 17Note: Sum of subtotals may not equal totals due to rounding.
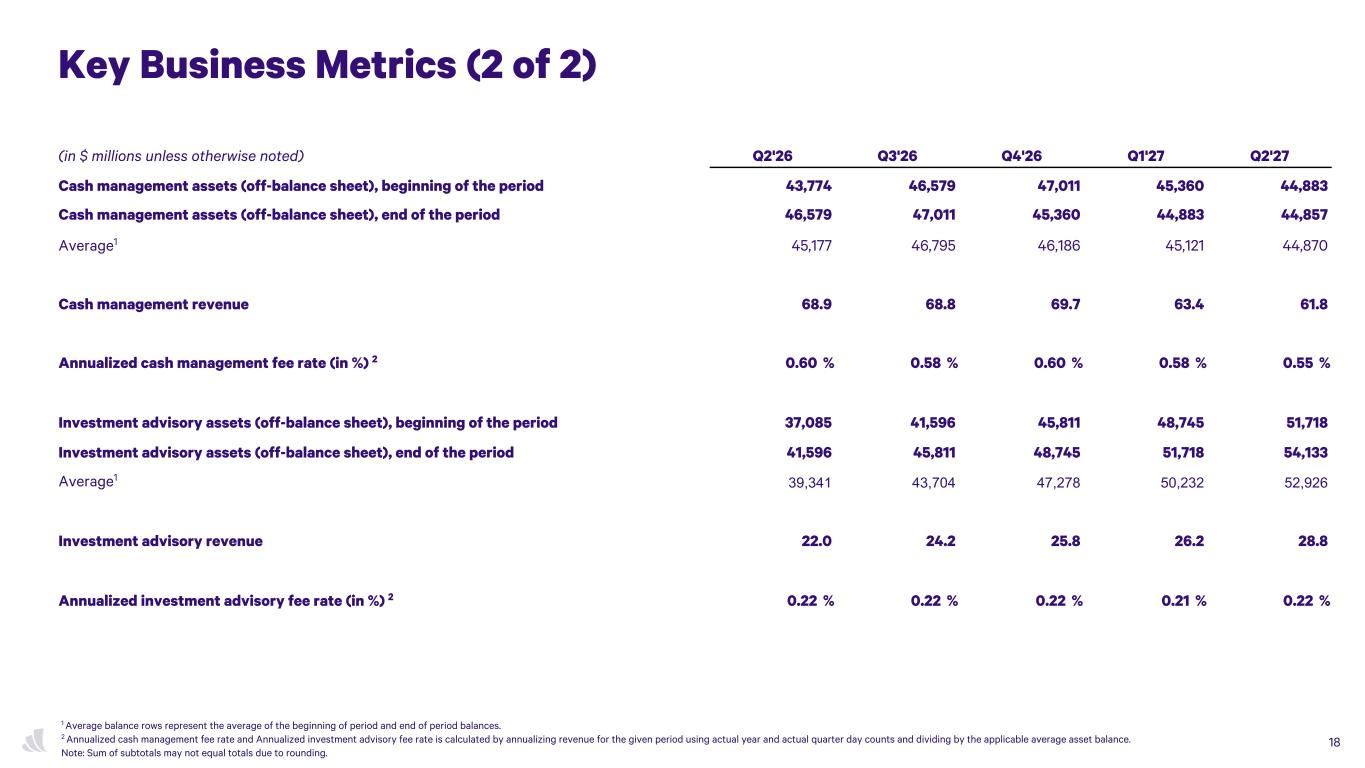
(in $ millions unless otherwise noted) Q2'26 Q3'26 Q4'26 Q1'27 Q2'27 Cash management assets (off-balance sheet), beginning of the period 43,774 46,579 47,011 45,360 44,883 Cash management assets (off-balance sheet), end of the period 46,579 47,011 45,360 44,883 44,857 Average1 45,177 46,795 46,186 45,121 44,870 Cash management revenue 68.9 68.8 69.7 63.4 61.8 Annualized cash management fee rate (in %) 2 0.60 % 0.58 % 0.60 % 0.58 % 0.55 % Investment advisory assets (off-balance sheet), beginning of the period 37,085 41,596 45,811 48,745 51,718 Investment advisory assets (off-balance sheet), end of the period 41,596 45,811 48,745 51,718 54,133 Average1 39,341 43,704 47,278 50,232 52,926 Investment advisory revenue 22.0 24.2 25.8 26.2 28.8 Annualized investment advisory fee rate (in %) 2 0.22 % 0.22 % 0.22 % 0.21 % 0.22 % Key Business Metrics (2 of 2) 1 Average balance rows represent the average of the beginning of period and end of period balances. 2 Annualized cash management fee rate and Annualized investment advisory fee rate is calculated by annualizing revenue for the given period using actual year and actual quarter day counts and dividing by the applicable average asset balance. Note: Sum of subtotals may not equal totals due to rounding. Note: Sum of subtotals may not equal totals due to rounding.Note: Sum of subtotals may not equal totals due to rounding. 18
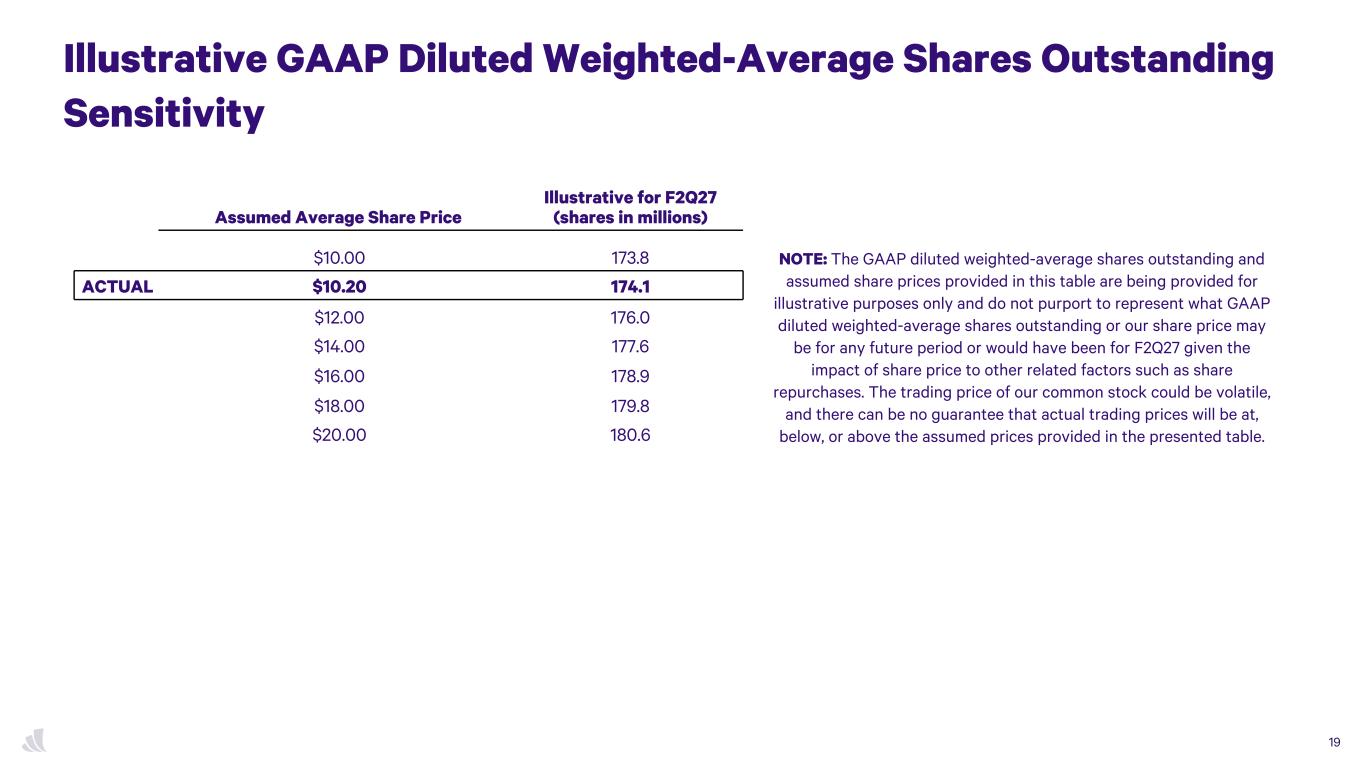
Illustrative GAAP Diluted Weighted-Average Shares Outstanding Sensitivity Assumed Average Share Price Illustrative for F2Q27 (shares in millions) $10.00 173.8 ACTUAL $10.20 174.1 $12.00 176.0 $14.00 177.6 $16.00 178.9 $18.00 179.8 $20.00 180.6 19 NOTE: The GAAP diluted weighted-average shares outstanding and assumed share prices provided in this table are being provided for illustrative purposes only and do not purport to represent what GAAP diluted weighted-average shares outstanding or our share price may be for any future period or would have been for F2Q27 given the impact of share price to other related factors such as share repurchases. The trading price of our common stock could be volatile, and there can be no guarantee that actual trading prices will be at, below, or above the assumed prices provided in the presented table.
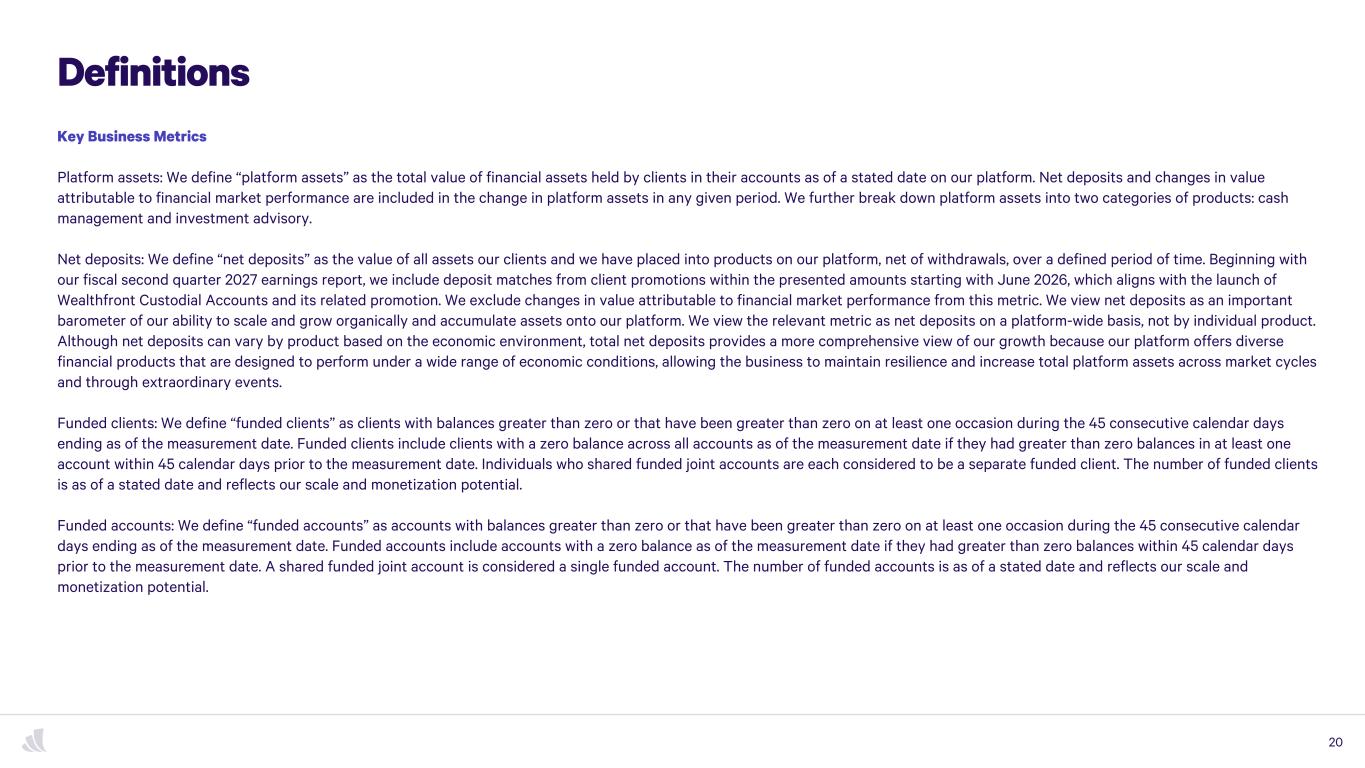
Definitions Key Business Metrics Platform assets: We define “platform assets” as the total value of financial assets held by clients in their accounts as of a stated date on our platform. Net deposits and changes in value attributable to financial market performance are included in the change in platform assets in any given period. We further break down platform assets into two categories of products: cash management and investment advisory. Net deposits: We define “net deposits” as the value of all assets our clients and we have placed into products on our platform, net of withdrawals, over a defined period of time. Beginning with our fiscal second quarter 2027 earnings report, we include deposit matches from client promotions within the presented amounts starting with June 2026, which aligns with the launch of Wealthfront Custodial Accounts and its related promotion. We exclude changes in value attributable to financial market performance from this metric. We view net deposits as an important barometer of our ability to scale and grow organically and accumulate assets onto our platform. We view the relevant metric as net deposits on a platform-wide basis, not by individual product. Although net deposits can vary by product based on the economic environment, total net deposits provides a more comprehensive view of our growth because our platform offers diverse financial products that are designed to perform under a wide range of economic conditions, allowing the business to maintain resilience and increase total platform assets across market cycles and through extraordinary events. Funded clients: We define “funded clients” as clients with balances greater than zero or that have been greater than zero on at least one occasion during the 45 consecutive calendar days ending as of the measurement date. Funded clients include clients with a zero balance across all accounts as of the measurement date if they had greater than zero balances in at least one account within 45 calendar days prior to the measurement date. Individuals who shared funded joint accounts are each considered to be a separate funded client. The number of funded clients is as of a stated date and reflects our scale and monetization potential. Funded accounts: We define “funded accounts” as accounts with balances greater than zero or that have been greater than zero on at least one occasion during the 45 consecutive calendar days ending as of the measurement date. Funded accounts include accounts with a zero balance as of the measurement date if they had greater than zero balances within 45 calendar days prior to the measurement date. A shared funded joint account is considered a single funded account. The number of funded accounts is as of a stated date and reflects our scale and monetization potential. 20