ASX:ELV • NASDAQ:ELVR Elevra Lithium Providing a Secure and Reliable Supply of
Lithium in North America SEPTEMBER 2026
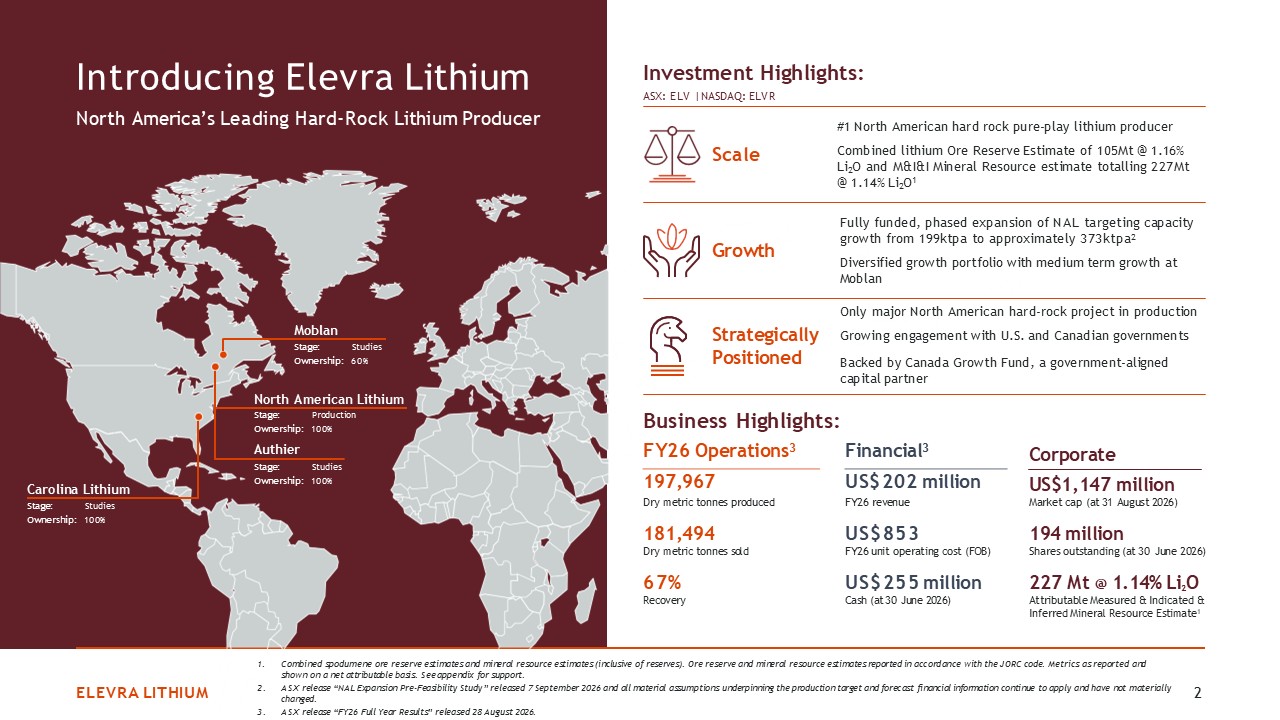
ELEVRA LITHIUM 2 Introducing Elevra Lithium North America’s Leading Hard-Rock
Lithium Producer Business Highlights: FY26 Operations3 197,967 Dry metric tonnes produced 181,494 Dry metric tonnes sold 67% Recovery Financial3 US$202 million FY26 revenue US$853 FY26 unit operating cost (FOB) US$255 million Cash
(at 30 June 2026) Corporate US$1,147 million Market cap (at 31 August 2026) 194 million Shares outstanding (at 30 June 2026) 227 Mt @ 1.14% Li2O Attributable Measured & Indicated & Inferred Mineral Resource Estimate1 Investment
Highlights: ASX: ELV | NASDAQ: ELVR #1 North American hard rock pure-play lithium producer Combined lithium Ore Reserve Estimate of 105Mt @ 1.16% Li2O and M&I&I Mineral Resource estimate totalling 227Mt @ 1.14%
Li2O1 Scale Growth Strategically Positioned Fully funded, phased expansion of NAL targeting capacity growth from 199ktpa to approximately 373ktpa2 Diversified growth portfolio with medium term growth at Moblan Only major North American
hard-rock project in production Growing engagement with U.S. and Canadian governments Backed by Canada Growth Fund, a government-aligned capital partner North American Lithium Stage: Production Ownership: 100% Authier Stage:
Studies Ownership: 100% Moblan Stage: Studies Ownership: 60% Carolina Lithium Stage: Studies Ownership: 100% Combined spodumene ore reserve estimates and mineral resource estimates (inclusive of reserves). Ore reserve and mineral
resource estimates reported in accordance with the JORC code. Metrics as reported and shown on a net attributable basis. See appendix for support. ASX release “NAL Expansion Pre-Feasibility Study” released 7 September 2026 and all material
assumptions underpinning the production target and forecast financial information continue to apply and have not materially changed. ASX release “FY26 Full Year Results” released 28 August 2026.
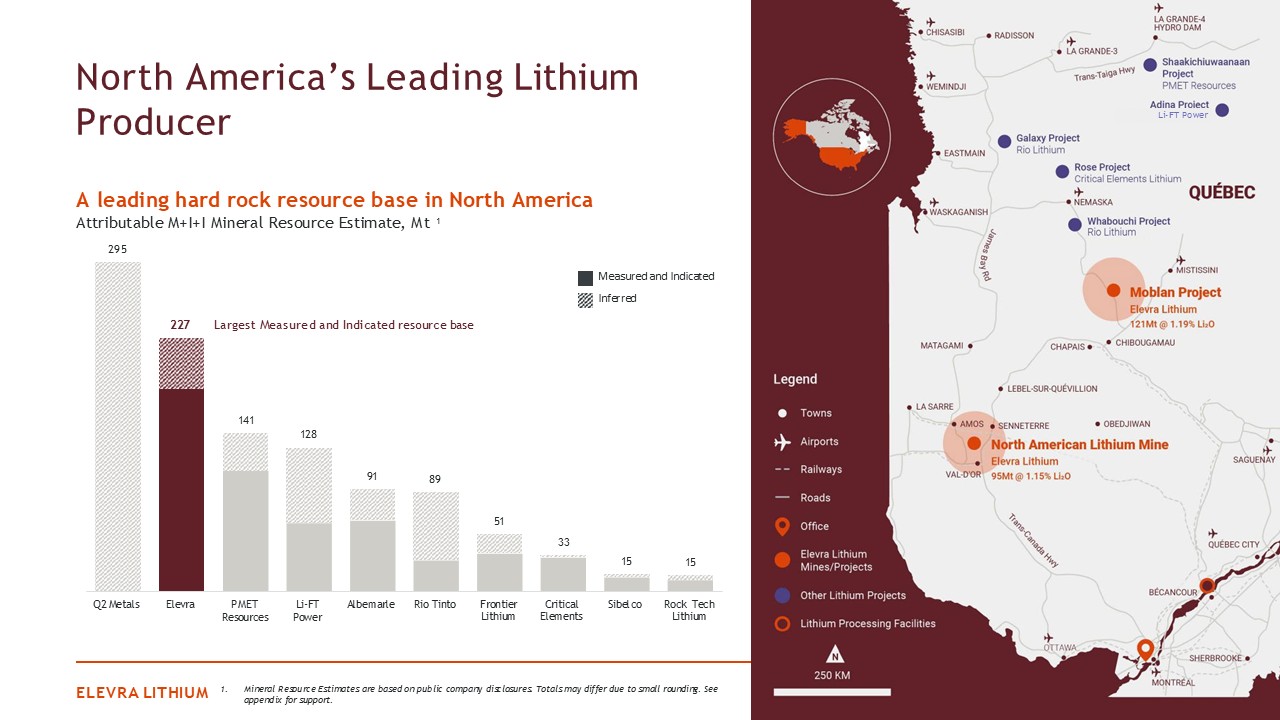
North America’s Leading Lithium Producer 1. Mineral Resource Estimates are based
on public company disclosures. Totals may differ due to small rounding. See appendix for support. ELEVRA LITHIUM 3 141 128 91 89 51 33 15 15 Q2 Metals Elevra PMET Resources Li-FT Power Albemarle Rio Tinto Frontier
Lithium Critical Elements Sibelco Rock Tech Lithium Measured and Indicated Inferred A leading hard rock resource base in North America Attributable M+I+I Mineral Resource Estimate, Mt 1 295 227 Largest Measured and Indicated resource
base Li-FT Power
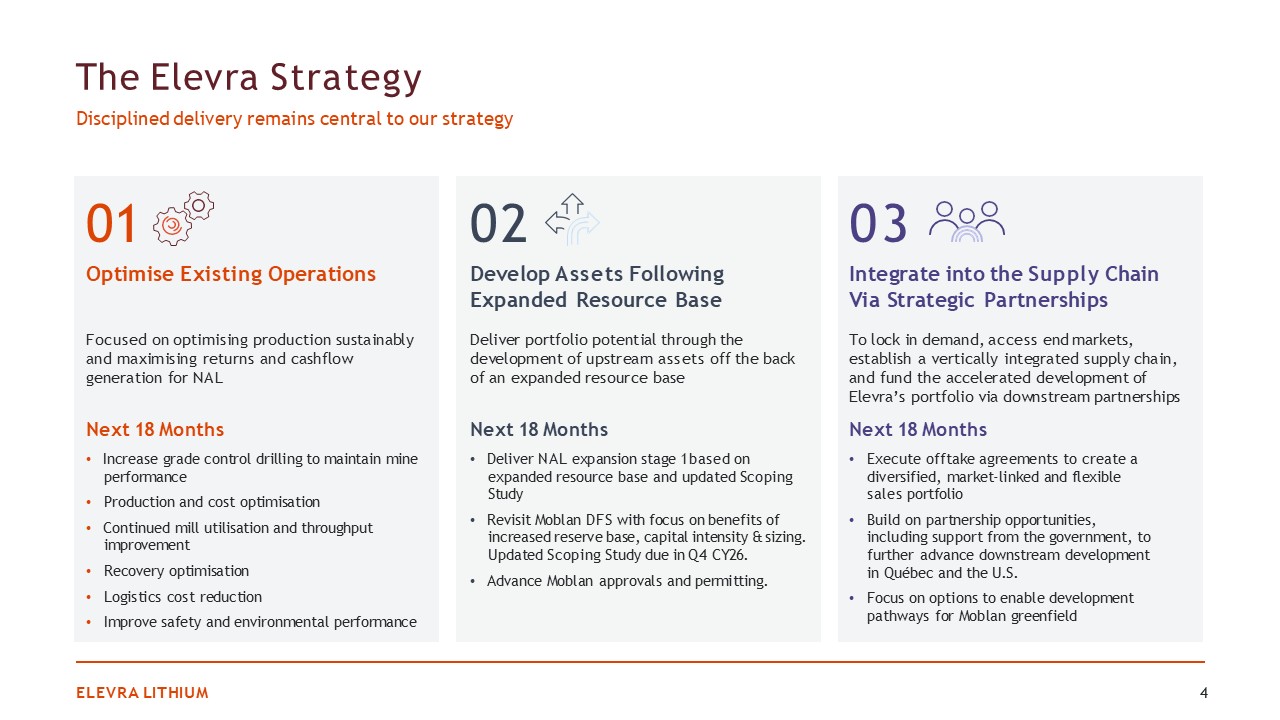
01 Optimise Existing Operations Focused on optimising production sustainably and
maximising returns and cashflow generation for NAL Next 18 Months Increase grade control drilling to maintain mine performance Production and cost optimisation Continued mill utilisation and throughput improvement Recovery
optimisation Logistics cost reduction Improve safety and environmental performance The Elevra Strategy Disciplined delivery remains central to our strategy ELEVRA LITHIUM 4 03 Integrate into the Supply Chain Via Strategic
Partnerships To lock in demand, access end markets, establish a vertically integrated supply chain, and fund the accelerated development of Elevra’s portfolio via downstream partnerships Next 18 Months Execute offtake agreements to create a
diversified, market-linked and flexible sales portfolio Build on partnership opportunities, including support from the government, to further advance downstream development in Québec and the U.S. Focus on options to enable development
pathways for Moblan greenfield 02 Develop Assets Following Expanded Resource Base Deliver portfolio potential through the development of upstream assets off the back of an expanded resource base Next 18 Months Deliver NAL expansion stage 1
based on expanded resource base and updated Scoping Study Revisit Moblan DFS with focus on benefits of increased reserve base, capital intensity & sizing. Updated Scoping Study due in Q4 CY26. Advance Moblan approvals and permitting.
Operational Performance
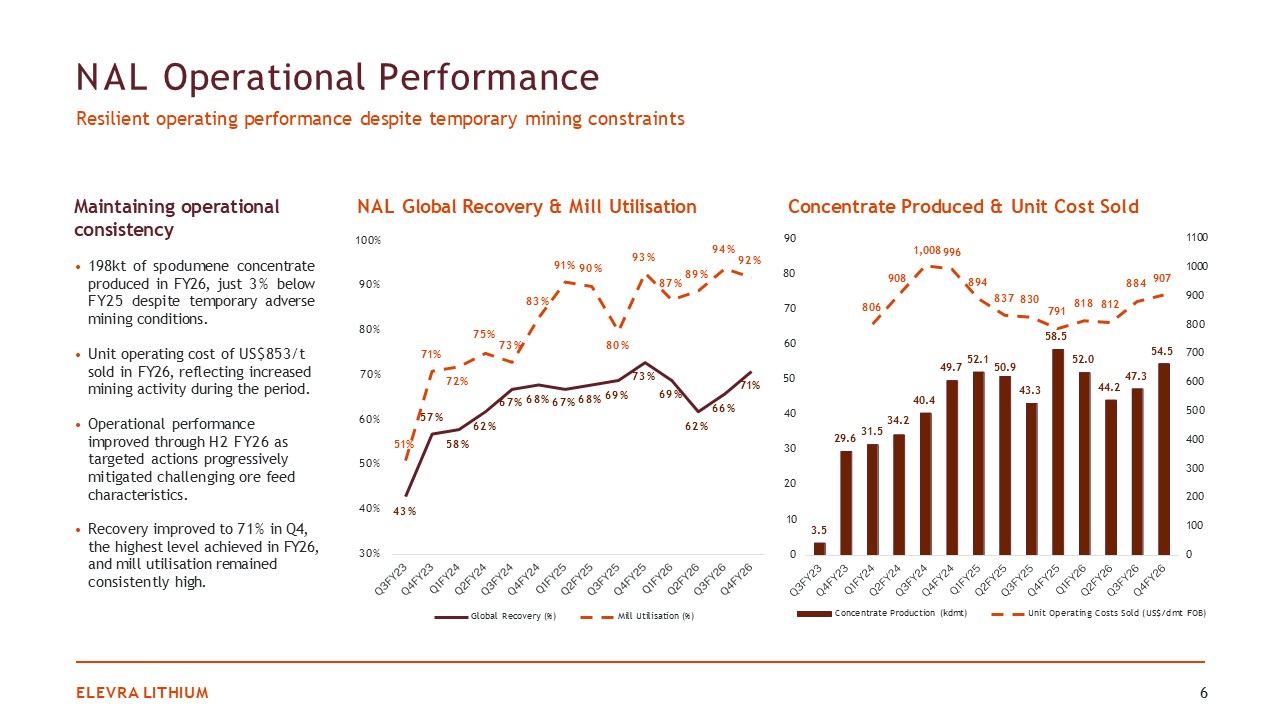
NAL Operational Performance Resilient operating performance despite temporary
mining constraints ELEVRA LITHIUM 6 43% 57% 58% 62% 67% 68% 67% 68% 69% 73% 69% 62% 66% 71% 51% 71% 72% 75% 73% 83% 91% 90% 80% 87% 89% 94% 92% NAL Global Recovery & Mill
Utilisation 100% 93% 30% 40% 50% 60% 70% 80% 90% Global Recovery (%) Mill Utilisation (%) 3.5 29.6 34.2 31.5 40.4 49.7 52.1 50.9 43.3 58.5 52.0 44.2 47.3 54.5 806 894 837 830 791 818 812 908 884 907 Concentrate
Produced & Unit Cost Sold 90 1,008 996 80 0 100 200 300 400 500 600 700 800 900 1000 1100 0 10 20 30 40 50 60 70 Concentrate Production (kdmt) Unit Operating Costs Sold (US$/dmt FOB) Maintaining operational
consistency 198kt of spodumene concentrate produced in FY26, just 3% below FY25 despite temporary adverse mining conditions. Unit operating cost of US$853/t sold in FY26, reflecting increased mining activity during the period. Operational
performance improved through H2 FY26 as targeted actions progressively mitigated challenging ore feed characteristics. Recovery improved to 71% in Q4, the highest level achieved in FY26, and mill utilisation remained consistently high.
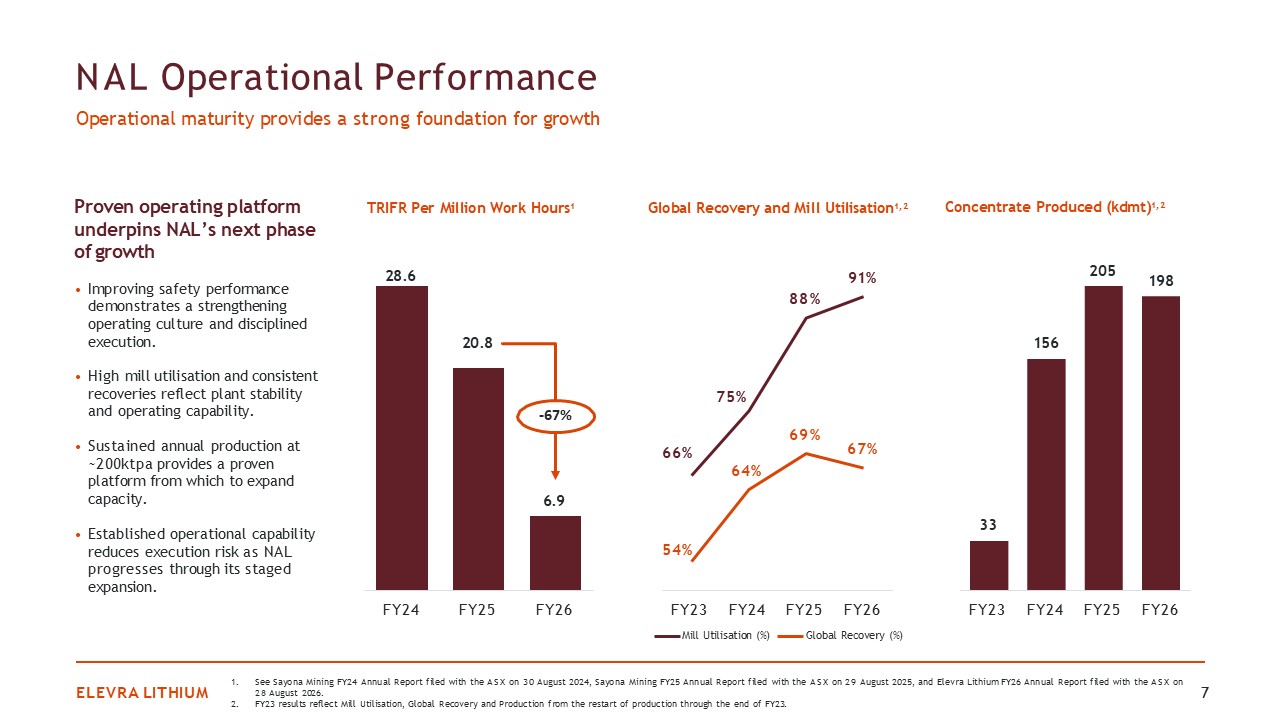
28.6 20.8 6.9 FY24 FY25 FY26 NAL Operational Performance Operational
maturity provides a strong foundation for growth ELEVRA LITHIUM 7 -67% See Sayona Mining FY24 Annual Report filed with the ASX on 30 August 2024, Sayona Mining FY25 Annual Report filed with the ASX on 29 August 2025, and Elevra Lithium FY26
Annual Report filed with the ASX on 28 August 2026. FY23 results reflect Mill Utilisation, Global Recovery and Production from the restart of production through the end of FY23. TRIFR Per Million Work
Hours1 33 156 205 198 FY23 FY24 FY25 FY26 66% 75% 88% 91% 54% 64% 69% 67% FY23 FY24 Mill Utilisation (%) FY25 FY26 Global Recovery (%) Global Recovery and Mill Utilisation1,2 Concentrate Produced (kdmt)1,2 Proven
operating platform underpins NAL’s next phase of growth Improving safety performance demonstrates a strengthening operating culture and disciplined execution. High mill utilisation and consistent recoveries reflect plant stability and
operating capability. Sustained annual production at ~200ktpa provides a proven platform from which to expand capacity. Established operational capability reduces execution risk as NAL progresses through its staged expansion.

Growth Projects
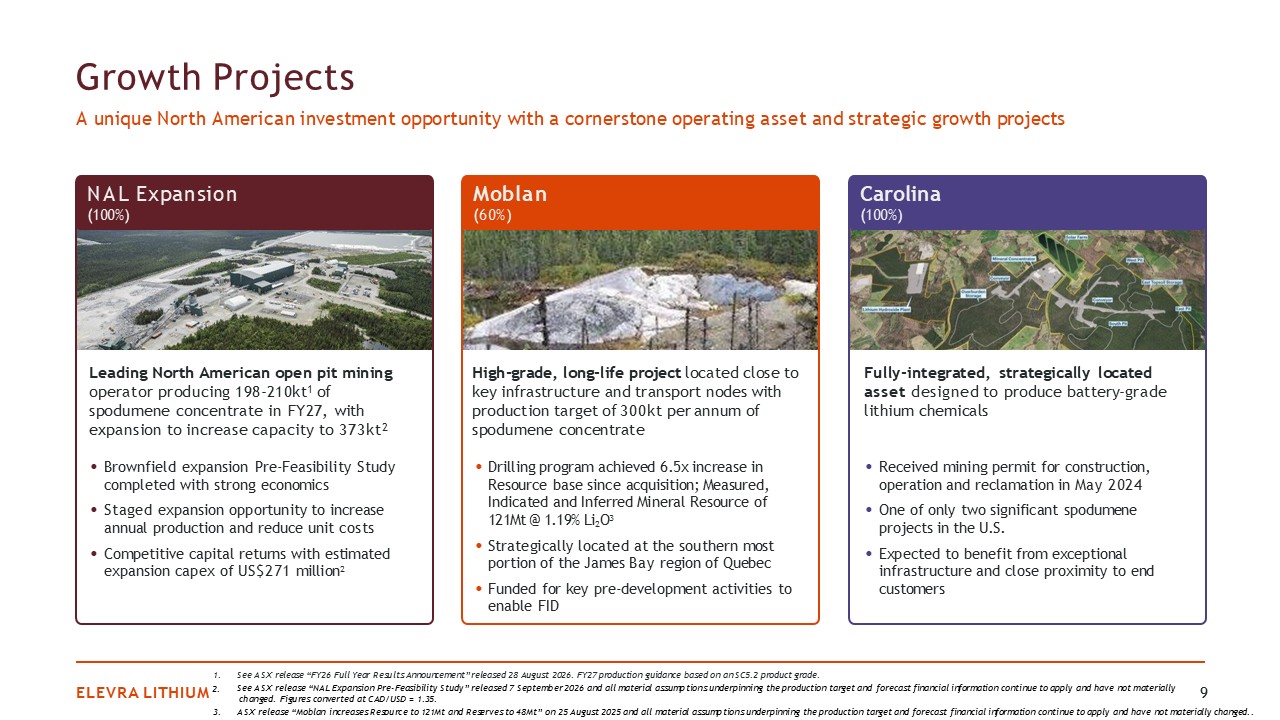
Growth Projects A unique North American investment opportunity with a cornerstone
operating asset and strategic growth projects 9 See ASX release “FY26 Full Year Results Announcement” released 28 August 2026. FY27 production guidance based on an SC5.2 product grade. See ASX release “NAL Expansion Pre-Feasibility Study”
released 7 September 2026 and all material assumptions underpinning the production target and forecast financial information continue to apply and have not materially changed. Figures converted at CAD/USD = 1.35. 1. ELEVRA LITHIUM 2. 3. ASX
release “Moblan increases Resource to 121Mt and Reserves to 48Mt” on 25 August 2025 and all material assumptions underpinning the production target and forecast financial information continue to apply and have not materially changed.. NAL
Expansion (100%) Leading North American open pit mining operator producing 198-210kt1 of spodumene concentrate in FY27, with expansion to increase capacity to 373kt2 Brownfield expansion Pre-Feasibility Study completed with strong
economics Staged expansion opportunity to increase annual production and reduce unit costs Competitive capital returns with estimated expansion capex of US$271 million2 Moblan (60%) High-grade, long-life project located close to key
infrastructure and transport nodes with production target of 300kt per annum of spodumene concentrate Drilling program achieved 6.5x increase in Resource base since acquisition; Measured, Indicated and Inferred Mineral Resource of 121Mt @
1.19% Li2O3 Strategically located at the southern most portion of the James Bay region of Quebec Funded for key pre-development activities to enable FID Fully-integrated, strategically located asset designed to produce battery-grade lithium
chemicals Carolina (100%) Received mining permit for construction, operation and reclamation in May 2024 One of only two significant spodumene projects in the U.S. Expected to benefit from exceptional infrastructure and close proximity to
end customers
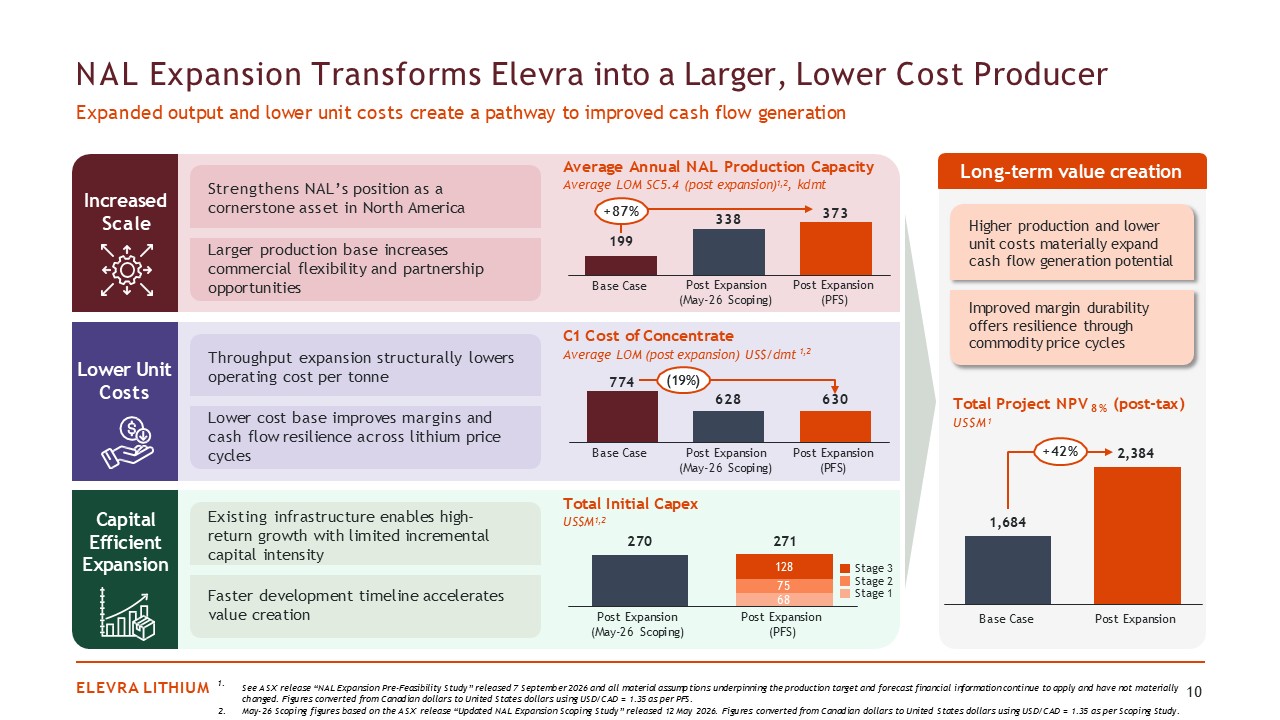
Lower Unit Costs Increased Scale Capital Efficient Expansion Strengthens NAL’s
position as a cornerstone asset in North America Larger production base increases commercial flexibility and partnership opportunities Throughput expansion structurally lowers operating cost per tonne Lower cost base improves margins and
cash flow resilience across lithium price cycles Existing infrastructure enables high-return growth with limited incremental capital intensity Faster development timeline accelerates value creation NAL Expansion Transforms Elevra into a
Larger, Lower Cost Producer Expanded output and lower unit costs create a pathway to improved cash flow generation See ASX release “NAL Expansion Pre-Feasibility Study” released 7 September 2026 and all material assumptions underpinning the
production target and forecast financial information continue to apply and have not materially 10 ELEVRA LITHIUM 1. changed. Figures converted from Canadian dollars to United States dollars using USD/CAD = 1.35 as per PFS. 2. May-26 Scoping
figures based on the ASX release “Updated NAL Expansion Scoping Study” released 12 May 2026. Figures converted from Canadian dollars to United States dollars using USD/CAD = 1.35 as per Scoping Study. Higher production and lower unit costs
materially expand cash flow generation potential Improved margin durability offers resilience through commodity price cycles 1,684 2,384 Base Case Post Expansion Total Project NPV 8% (post-tax) US$M1 +42% Average Annual NAL
Production Capacity Average LOM SC5.4 (post expansion)1,2, kdmt C1 Cost of Concentrate Average LOM (post expansion) US$/dmt 1,2 Long-term value creation 68 75 Total Initial Capex US$M1,2 270 128 271 Post Expansion (May-26
Scoping) Post Expansion (PFS) 199 338 373 Base Case Post Expansion (May-26 Scoping) Post Expansion (PFS) +87% 774 628 630 Base Case Post Expansion Post Expansion (May-26 Scoping) (PFS) (19%) Stage 3 Stage 2 Stage 1
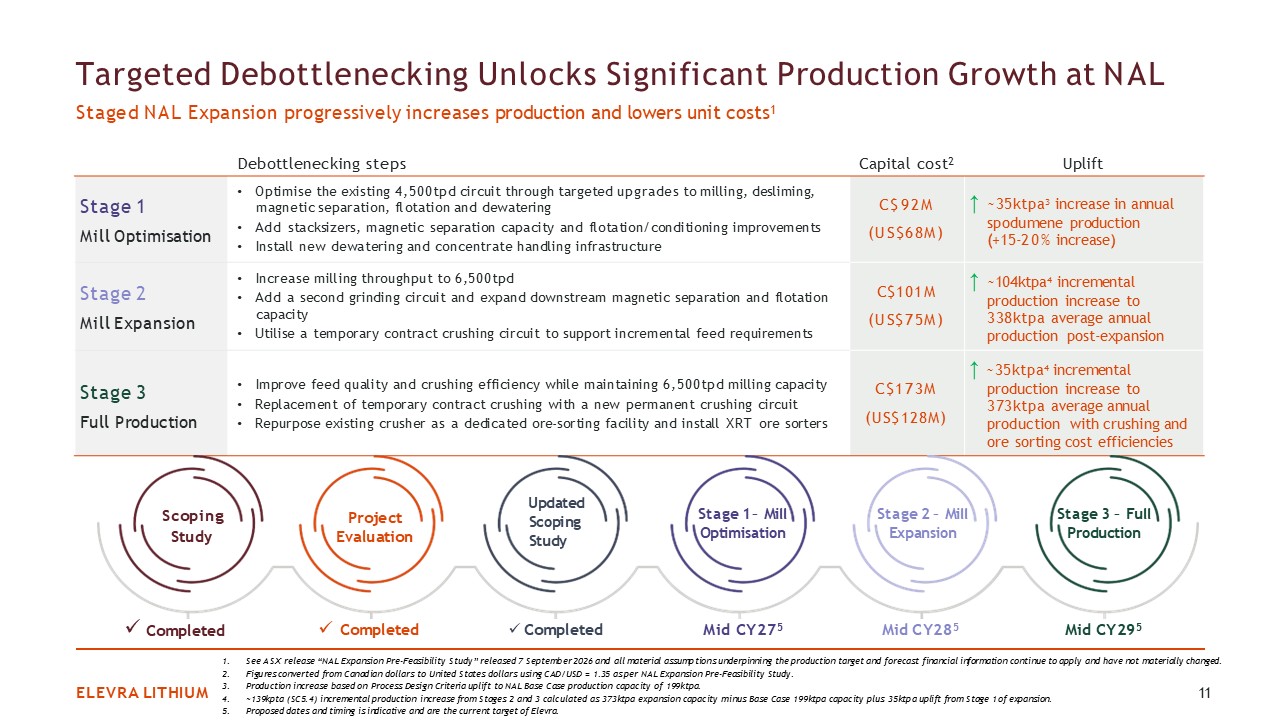
Stage 1 Mill Optimisation Optimise the existing 4,500tpd circuit through
targeted upgrades to milling, desliming, magnetic separation, flotation and dewatering Add stacksizers, magnetic separation capacity and flotation/conditioning improvements Install new dewatering and concentrate handling infrastructure C$92M
(US$68M) ↑ ~35ktpa3 increase in annual spodumene production (+15-20% increase) Stage 2 Mill Expansion Increase milling throughput to 6,500tpd Add a second grinding circuit and expand downstream magnetic separation and flotation
capacity Utilise a temporary contract crushing circuit to support incremental feed requirements C$101M (US$75M) ↑ ~104ktpa4 incremental production increase to 338ktpa average annual production post-expansion Stage 3 Full
Production Improve feed quality and crushing efficiency while maintaining 6,500tpd milling capacity Replacement of temporary contract crushing with a new permanent crushing circuit Repurpose existing crusher as a dedicated ore-sorting
facility and install XRT ore sorters C$173M (US$128M) ↑ ~35ktpa4 incremental production increase to 373ktpa average annual production with crushing and ore sorting cost efficiencies Staged NAL Expansion progressively increases production and
lowers unit costs1 Debottlenecking steps Capital cost2 Uplift Targeted Debottlenecking Unlocks Significant Production Growth at NAL ELEVRA LITHIUM 11 See ASX release “NAL Expansion Pre-Feasibility Study” released 7 September 2026 and all
material assumptions underpinning the production target and forecast financial information continue to apply and have not materially changed. Figures converted from Canadian dollars to United States dollars using CAD/USD = 1.35 as per NAL
Expansion Pre-Feasibility Study. Production increase based on Process Design Criteria uplift to NAL Base Case production capacity of 199ktpa. ~139kpta (SC5.4) incremental production increase from Stages 2 and 3 calculated as 373ktpa expansion
capacity minus Base Case 199ktpa capacity plus 35ktpa uplift from Stage 1 of expansion. Proposed dates and timing is indicative and are the current target of Elevra. Scoping Study Project Evaluation Updated Scoping Study Stage 1 – Mill
Optimisation Stage 2 – Mill Expansion Stage 3 – Full Production Completed Completed Completed Mid CY275 Mid CY285 Mid CY295
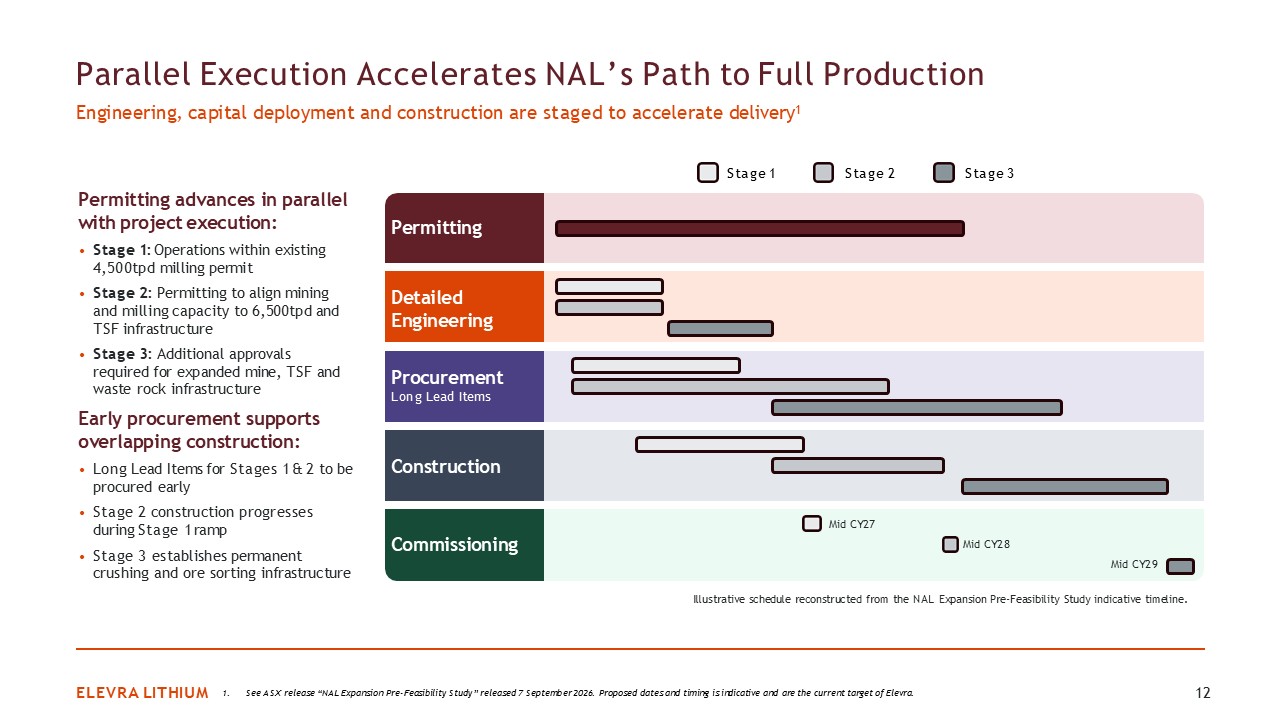
Parallel Execution Accelerates NAL’s Path to Full Production Engineering, capital
deployment and construction are staged to accelerate delivery1 ELEVRA LITHIUM 12 1. See ASX release “NAL Expansion Pre-Feasibility Study” released 7 September 2026. Proposed dates and timing is indicative and are the current target of
Elevra. Stage 1 Stage 2 Stage 3 Permitting advances in parallel with project execution: Stage 1: Operations within existing 4,500tpd milling permit Stage 2: Permitting to align mining and milling capacity to 6,500tpd and TSF
infrastructure Stage 3: Additional approvals required for expanded mine, TSF and waste rock infrastructure Early procurement supports overlapping construction: Long Lead Items for Stages 1 & 2 to be procured early Stage 2 construction
progresses during Stage 1 ramp Stage 3 establishes permanent crushing and ore sorting infrastructure Detailed Engineering Procurement Long Lead Items Construction Commissioning Permitting Illustrative schedule reconstructed from the NAL
Expansion Pre-Feasibility Study indicative timeline. Mid CY27 Mid CY28 Mid CY29
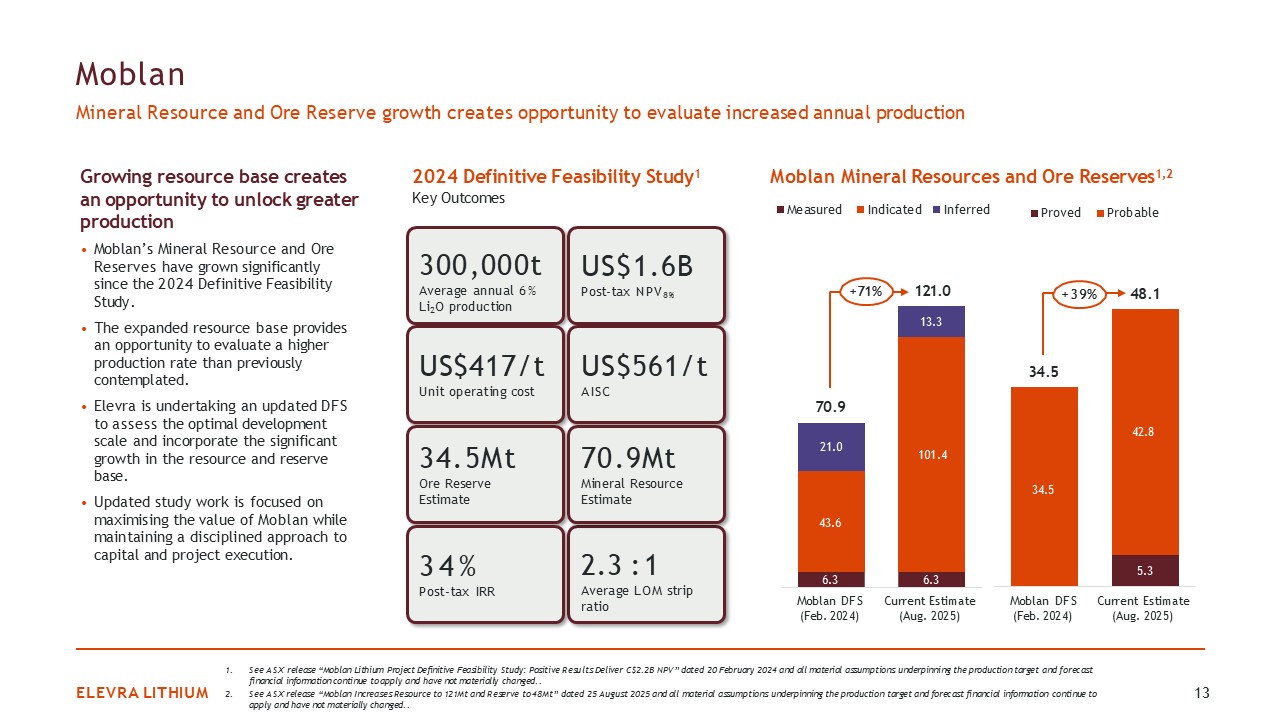
Moblan Mineral Resource and Ore Reserve growth creates opportunity to evaluate
increased annual production ELEVRA LITHIUM 13 See ASX release “Moblan Lithium Project Definitive Feasibility Study: Positive Results Deliver C$2.2B NPV” dated 20 February 2024 and all material assumptions underpinning the production target
and forecast financial information continue to apply and have not materially changed.. See ASX release “Moblan Increases Resource to 121Mt and Reserve to 48Mt” dated 25 August 2025 and all material assumptions underpinning the production
target and forecast financial information continue to apply and have not materially changed.. 2024 Definitive Feasibility Study1 Key Outcomes 300,000t Average annual 6% Li2O production US$417/t Unit operating cost US$1.6B Post-tax
NPV8% 2.3 : 1 Average LOM strip ratio 34.5Mt Ore Reserve Estimate US$561/t AISC 34% Post-tax IRR 70.9Mt Mineral Resource Estimate Moblan Mineral Resources and Ore Reserves1,2 6.3 6.3 43.6 101.4 21.0 13.3 70.9 121.0 Moblan
DFS (Feb. 2024) Current Estimate (Aug. 2025) Measured Indicated Inferred +71% 5.3 34.5 42.8 34.5 48.1 Moblan DFS (Feb. 2024) Current Estimate (Aug. 2025) Proved Probable +39% Growing resource base creates an opportunity to unlock
greater production Moblan’s Mineral Resource and Ore Reserves have grown significantly since the 2024 Definitive Feasibility Study. The expanded resource base provides an opportunity to evaluate a higher production rate than previously
contemplated. Elevra is undertaking an updated DFS to assess the optimal development scale and incorporate the significant growth in the resource and reserve base. Updated study work is focused on maximising the value of Moblan while
maintaining a disciplined approach to capital and project execution.
Moblan Well positioned to become Canada’s next spodumene producer with a funded
pathway to FID ELEVRA LITHIUM 14 See ASX release “Strategic Funding Presentation” dated 12 May 2026. See PMET Resources June 2026 Corporate Presentation. See Rio Tinto ASX filing “Initial reporting of lithium Mineral Resources and Ore
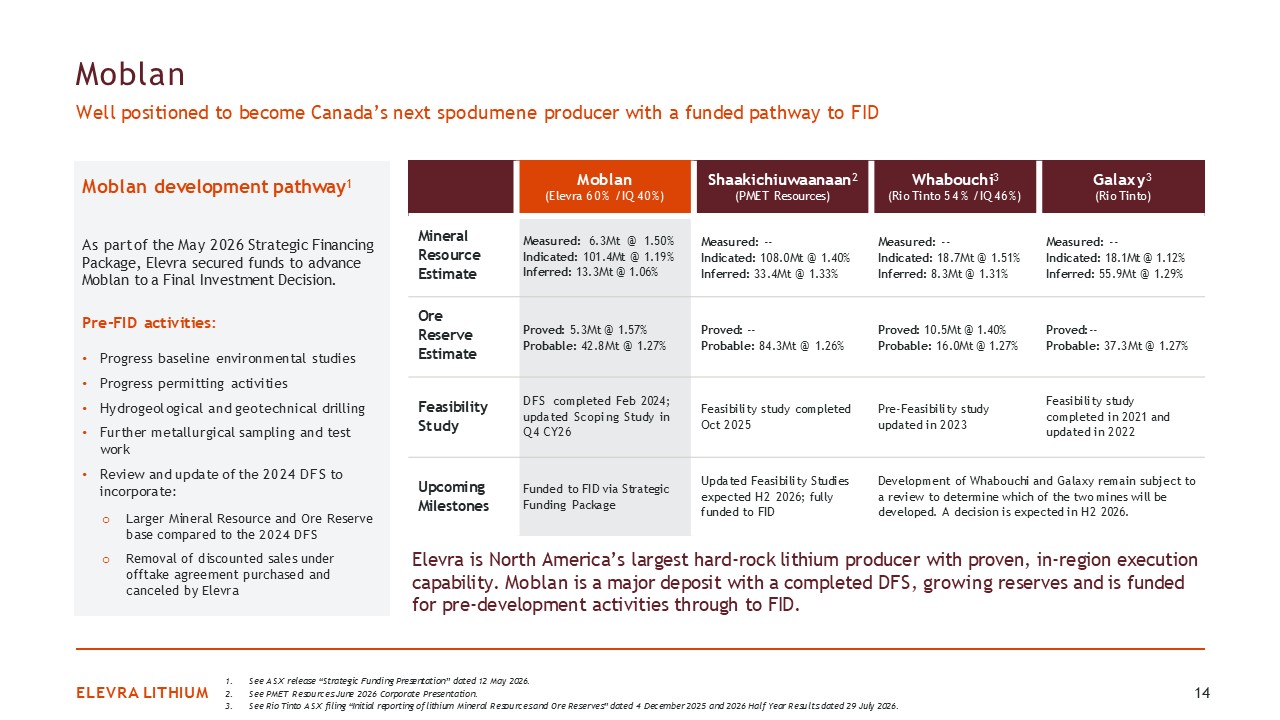
Reserves” dated 4 December 2025 and 2026 Half Year Results dated 29 July 2026. Moblan development pathway1 As part of the May 2026 Strategic Financing Package, Elevra secured funds to advance Moblan to a Final Investment Decision. Pre-FID
activities: Progress baseline environmental studies Progress permitting activities Hydrogeological and geotechnical drilling Further metallurgical sampling and test work Review and update of the 2024 DFS to incorporate: Larger Mineral
Resource and Ore Reserve base compared to the 2024 DFS Removal of discounted sales under offtake agreement purchased and canceled by Elevra Moblan (Elevra 60% / IQ 40%) Shaakichiuwaanaan2 (PMET Resources) Whabouchi3 (Rio Tinto 54% / IQ
46%) Galaxy3 (Rio Tinto) Mineral Resource Estimate Measured: 6.3Mt @ 1.50% Indicated: 101.4Mt @ 1.19% Inferred: 13.3Mt @ 1.06% Measured: -- Indicated: 108.0Mt @ 1.40% Inferred: 33.4Mt @ 1.33% Measured: -- Indicated: 18.7Mt @
1.51% Inferred: 8.3Mt @ 1.31% Measured: -- Indicated: 18.1Mt @ 1.12% Inferred: 55.9Mt @ 1.29% Ore Reserve Estimate Proved: 5.3Mt @ 1.57% Probable: 42.8Mt @ 1.27% Proved: -- Probable: 84.3Mt @ 1.26% Proved: 10.5Mt @ 1.40% Probable:
16.0Mt @ 1.27% Proved:-- Probable: 37.3Mt @ 1.27% Feasibility Study DFS completed Feb 2024; updated Scoping Study in Q4 CY26 Feasibility study completed Oct 2025 Pre-Feasibility study updated in 2023 Feasibility study completed in 2021
and updated in 2022 Upcoming Milestones Funded to FID via Strategic Funding Package Updated Feasibility Studies expected H2 2026; fully funded to FID Development of Whabouchi and Galaxy remain subject to a review to determine which of the
two mines will be developed. A decision is expected in H2 2026. Elevra is North America’s largest hard-rock lithium producer with proven, in-region execution capability. Moblan is a major deposit with a completed DFS, growing reserves and is
funded for pre-development activities through to FID.
Carolina Lithium A fully-integrated U.S. growth option advancing through
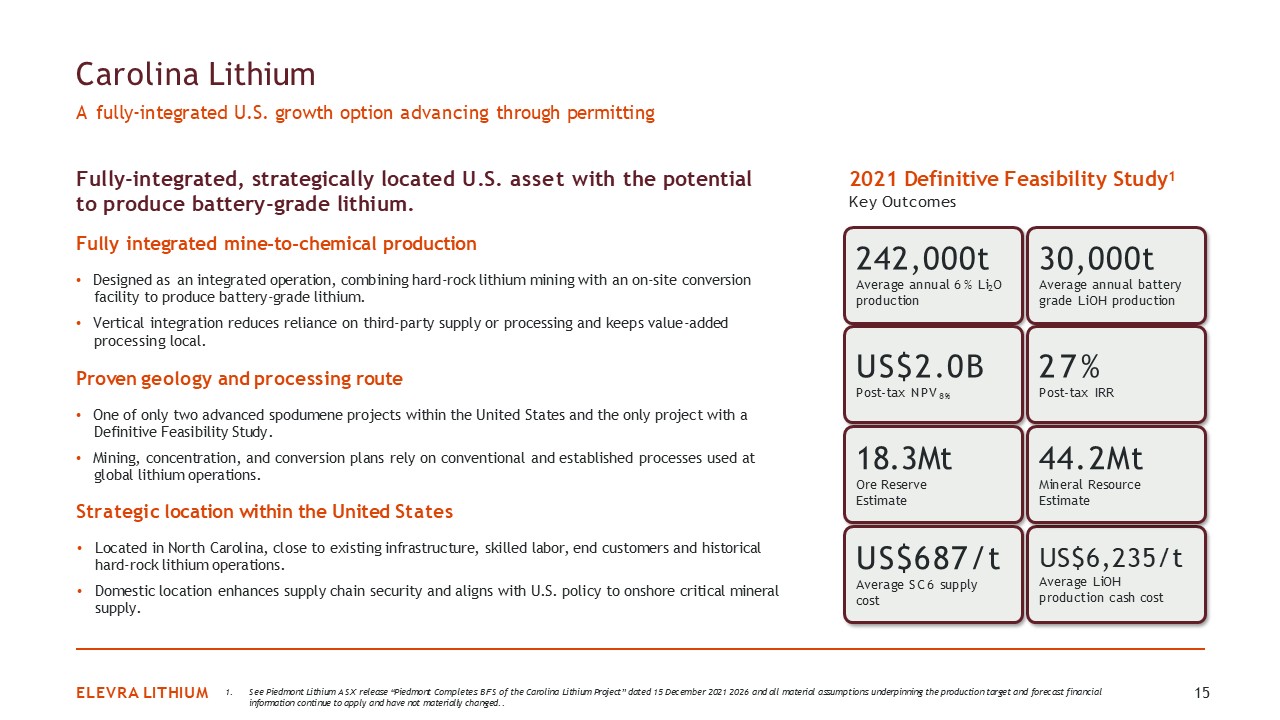
permitting ELEVRA LITHIUM 15 2021 Definitive Feasibility Study1 Key Outcomes 242,000t Average annual 6% Li2O production US$2.0B Post-tax NPV8% 30,000t Average annual battery grade LiOH production US$6,235/t Average LiOH production
cash cost 18.3Mt Ore Reserve Estimate 27% Post-tax IRR US$687/t Average SC6 supply cost 44.2Mt Mineral Resource Estimate Fully-integrated, strategically located U.S. asset with the potential to produce battery-grade lithium. Fully
integrated mine-to-chemical production Designed as an integrated operation, combining hard-rock lithium mining with an on-site conversion facility to produce battery-grade lithium. Vertical integration reduces reliance on third-party supply
or processing and keeps value-added processing local. Proven geology and processing route One of only two advanced spodumene projects within the United States and the only project with a Definitive Feasibility Study. Mining, concentration,
and conversion plans rely on conventional and established processes used at global lithium operations. Strategic location within the United States Located in North Carolina, close to existing infrastructure, skilled labor, end customers and
historical hard-rock lithium operations. Domestic location enhances supply chain security and aligns with U.S. policy to onshore critical mineral supply. 1. See Piedmont Lithium ASX release “Piedmont Completes BFS of the Carolina Lithium
Project” dated 15 December 2021 2026 and all material assumptions underpinning the production target and forecast financial information continue to apply and have not materially changed..
Corporate
FY26 Recap FY26 strengthened NAL’s operating platform, improved safety and
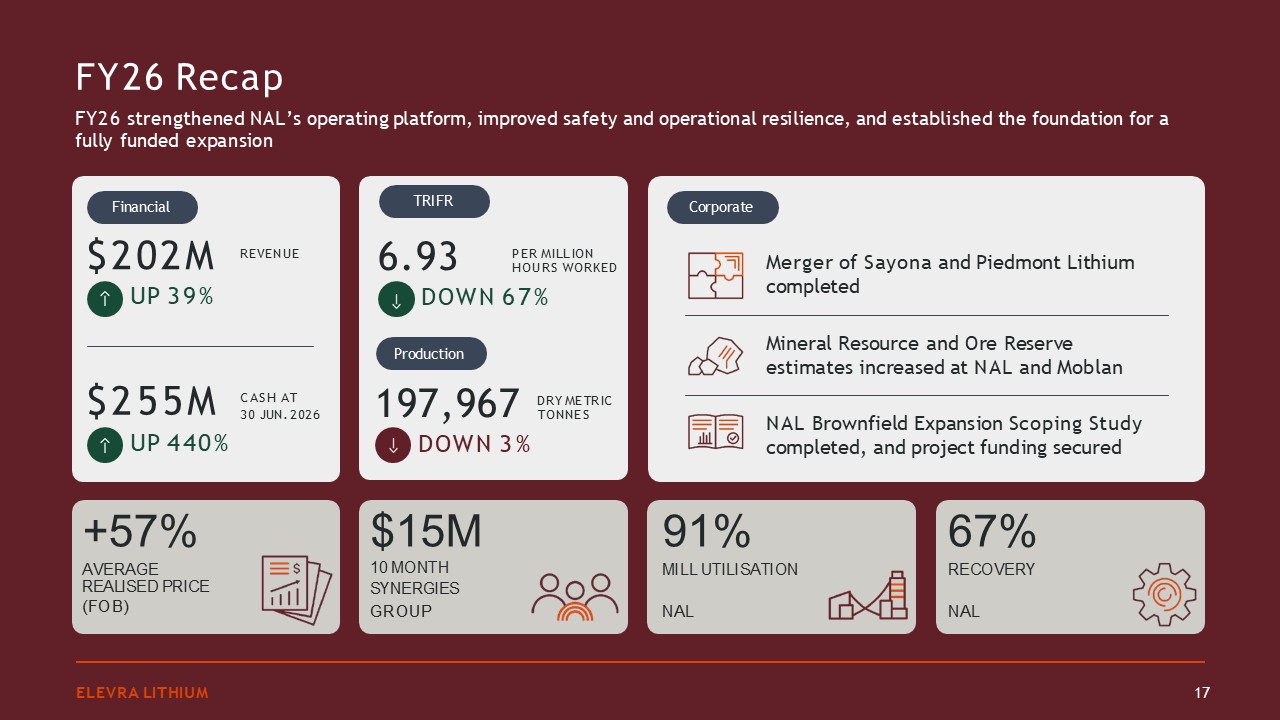
operational resilience, and established the foundation for a fully funded expansion ELEVRA LITHIUM 17 Production TRIFR DRY METRIC TONNES PER MILLION HOURS WORKED 197,967 DOWN 3% 6.93 DOWN 67% Corporate Merger of Sayona and Piedmont
Lithium completed Mineral Resource and Ore Reserve estimates increased at NAL and Moblan +57% AVERAGE REALISED PRICE (FOB) 91% MILL UTILISATION NAL 67% RECOVERY NAL $15M 10 MONTH SYNERGIES GROUP Financial REVENUE CASH AT 30 JUN.
2026 $202M UP 39% $255M UP 440% NAL Brownfield Expansion Scoping Study completed, and project funding secured
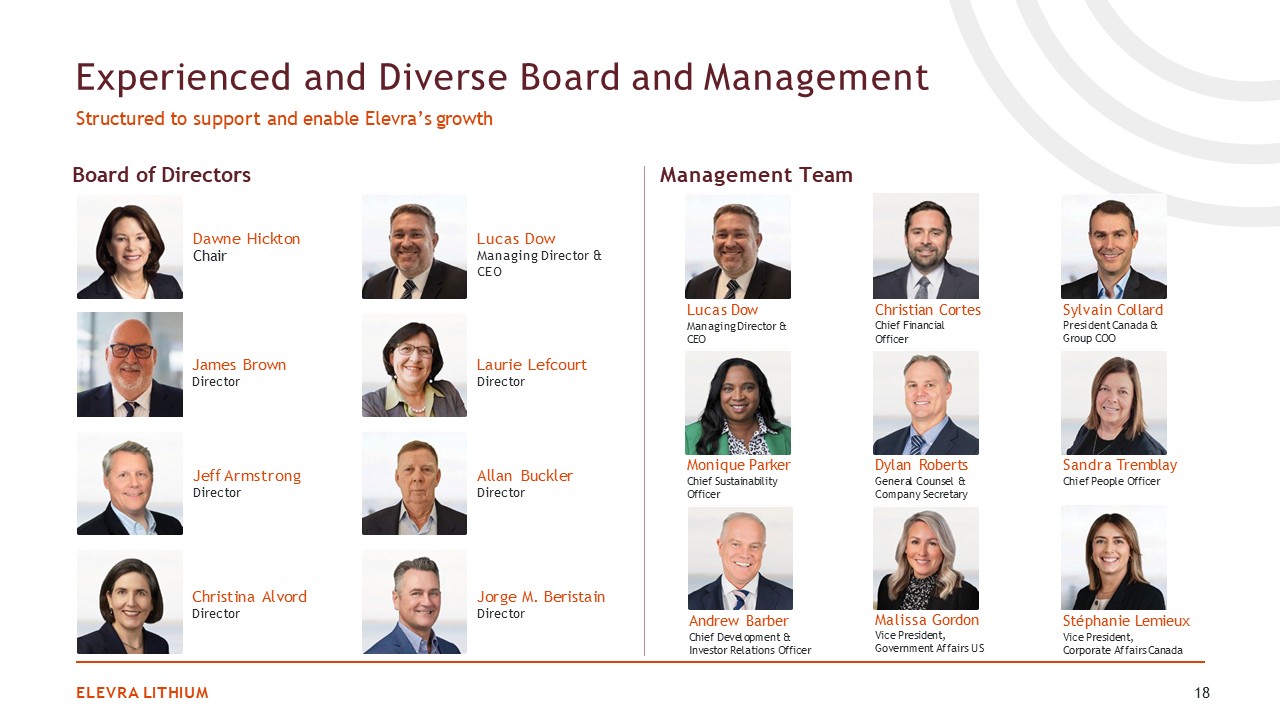
Experienced and Diverse Board and Management Structured to support and enable
Elevra’s growth Dawne Hickton Chair Allan Buckler Director Lucas Dow Managing Director & CEO Jeff Armstrong Director James Brown Director Laurie Lefcourt Director Christina Alvord Director Jorge M. Beristain Director ELEVRA
LITHIUM 18 Lucas Dow Managing Director & CEO Monique Parker Chief Sustainability Officer Christian Cortes Chief Financial Officer Dylan Roberts General Counsel & Company Secretary Sylvain Collard President Canada & Group
COO Andrew Barber Chief Development & Investor Relations Officer Sandra Tremblay Chief People Officer Malissa Gordon Vice President, Government Affairs US Stéphanie Lemieux Vice President, Corporate Affairs Canada Board of
Directors Management Team
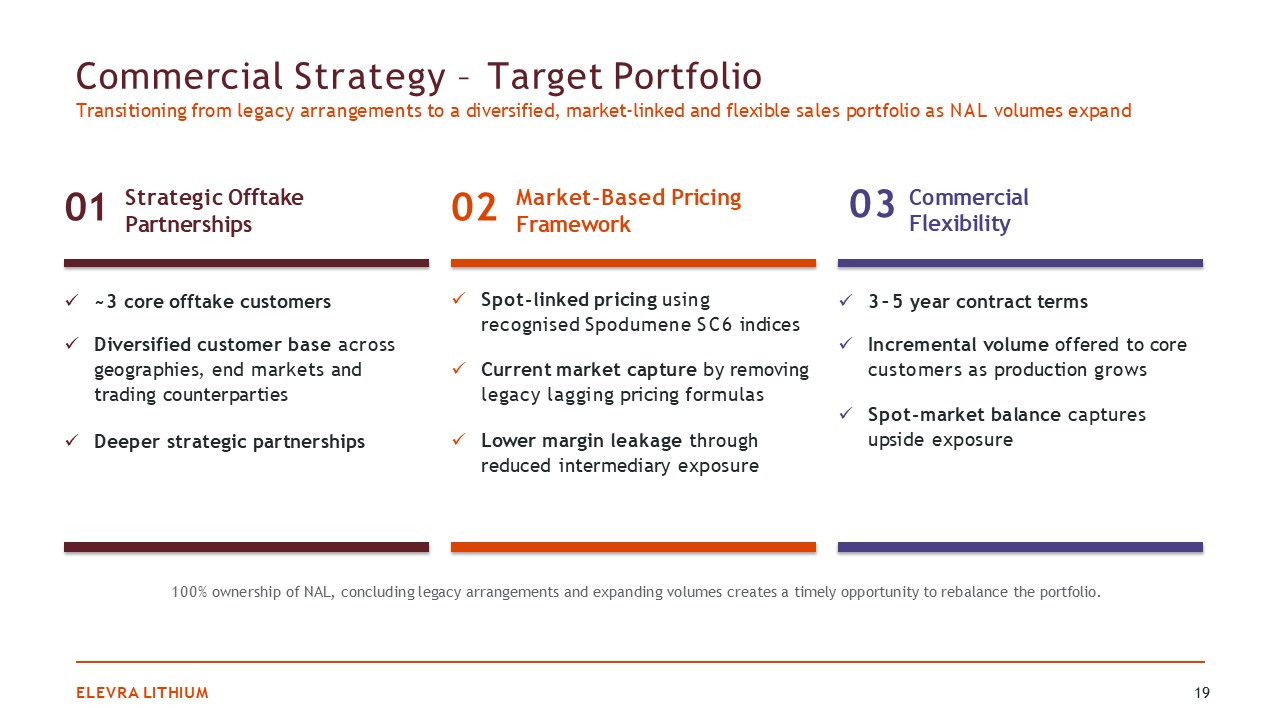
Commercial Strategy – Target Portfolio Transitioning from legacy arrangements to
a diversified, market-linked and flexible sales portfolio as NAL volumes expand ELEVRA LITHIUM 19 Strategic Offtake Partnerships 01 02 ~3 core offtake customers Diversified customer base across geographies, end markets and trading
counterparties Deeper strategic partnerships Market-Based Pricing Framework Spot-linked pricing using recognised Spodumene SC6 indices Current market capture by removing legacy lagging pricing formulas Lower margin leakage through reduced
intermediary exposure 03 Commercial Flexibility 3–5 year contract terms Incremental volume offered to core customers as production grows Spot-market balance captures upside exposure 100% ownership of NAL, concluding legacy arrangements
and expanding volumes creates a timely opportunity to rebalance the portfolio.

Lithium Market & Outlook
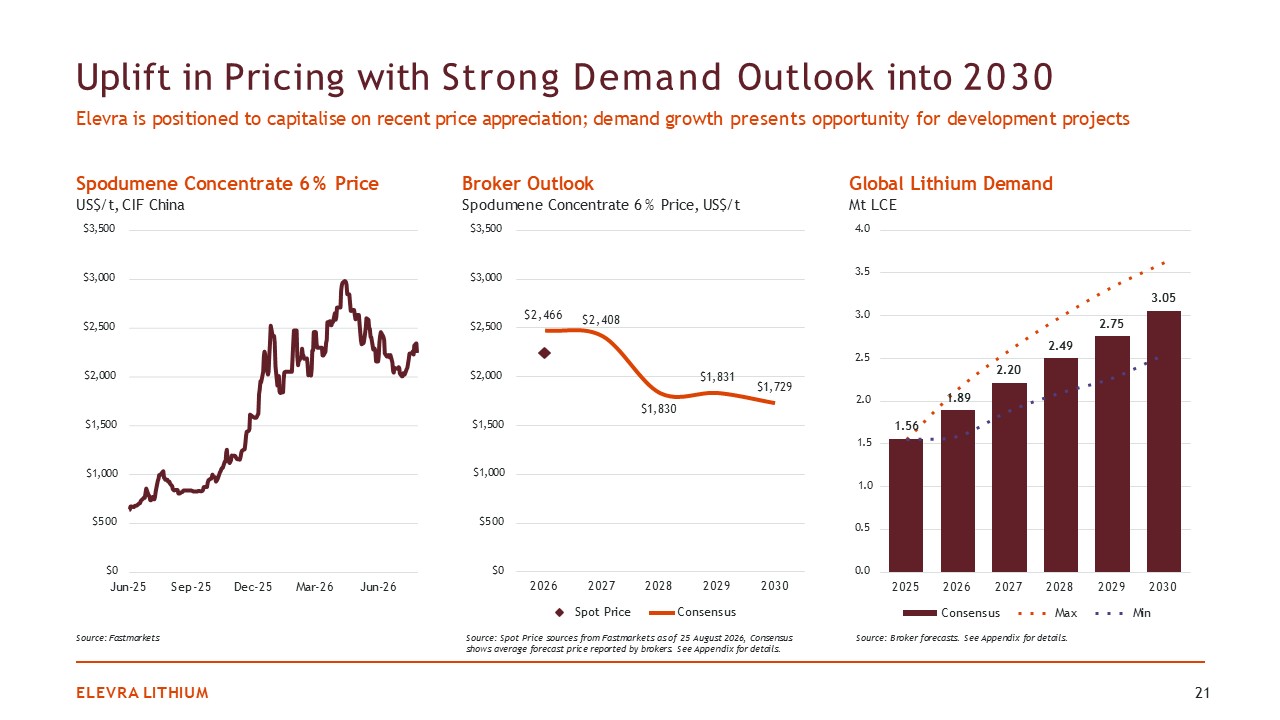
1.56 1.89 2.20 2.49 2.75 3.05 0.0 0.5 1.0 1.5 2.0 2.5 3.0 3.5 4.0 2025
2026 2027 2028 2029 2030 Consensus Max Min Uplift in Pricing with Strong Demand Outlook into 2030 Elevra is positioned to capitalise on recent price appreciation; demand growth presents opportunity for development projects Spodumene
Concentrate 6% Price US$/t, CIF China Global Lithium Demand Mt LCE ELEVRA LITHIUM 21 Source: Fastmarkets $0 $500 $1,000 $1,500 $2,000 $2,500 $3,000 $3,500 Jun-25 Sep-25 Dec-25 Mar-26 Jun-26 Broker Outlook Spodumene
Concentrate 6% Price, US$/t $2,466 $2,408 $1,830 $1,831 $1,729 $0 $500 $1,000 $1,500 $2,000 $2,500 $3,000 $3,500 2026 2027 2028 2029 2030 Spot Price Consensus Source: Spot Price sources from Fastmarkets as of 25 August 2026,
Consensus shows average forecast price reported by brokers. See Appendix for details. Source: Broker forecasts. See Appendix for details.
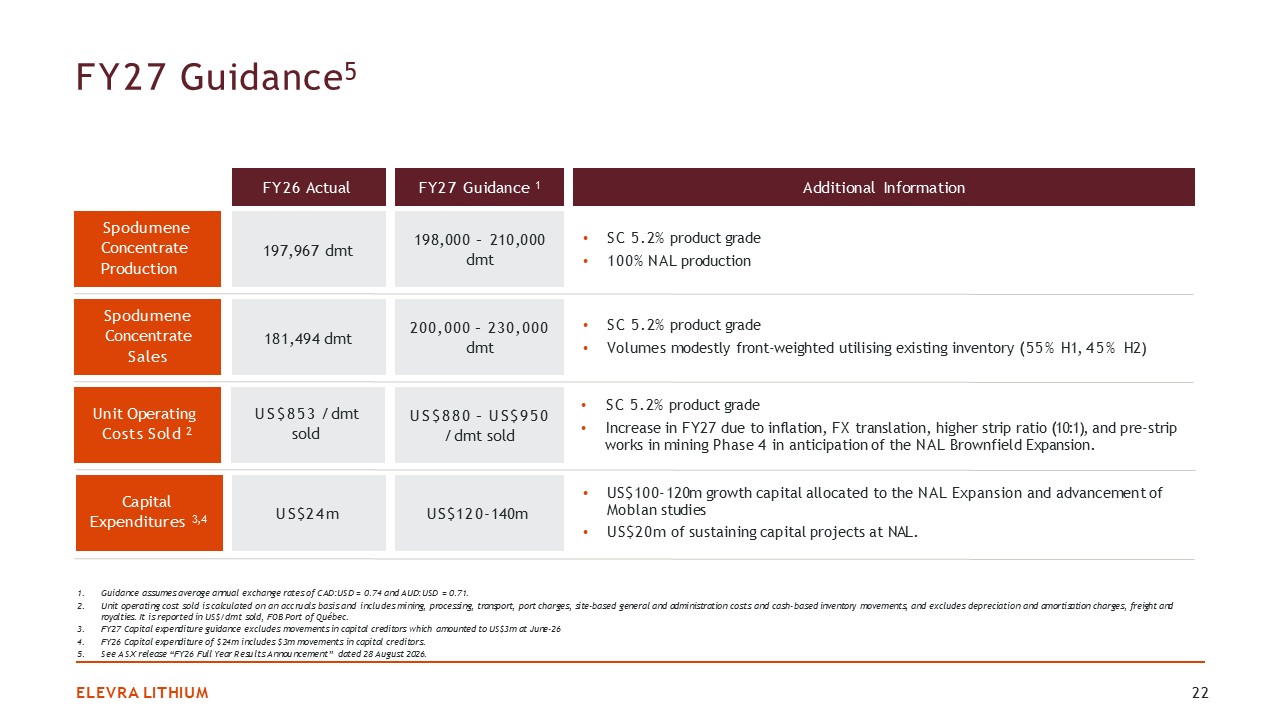
FY27 Guidance5 Guidance assumes average annual exchange rates of CAD:USD = 0.74
and AUD:USD = 0.71. Unit operating cost sold is calculated on an accruals basis and includes mining, processing, transport, port charges, site-based general and administration costs and cash-based inventory movements, and excludes depreciation
and amortisation charges, freight and royalties. It is reported in US$/dmt sold, FOB Port of Québec. FY27 Capital expenditure guidance excludes movements in capital creditors which amounted to US$3m at June-26 FY26 Capital expenditure of $24m
includes $3m movements in capital creditors. See ASX release “FY26 Full Year Results Announcement” dated 28 August 2026. ELEVRA LITHIUM 22 Spodumene Concentrate Production Spodumene Concentrate Sales Unit Operating Costs Sold 2 SC 5.2%
product grade 100% NAL production SC 5.2% product grade Volumes modestly front-weighted utilising existing inventory (55% H1, 45% H2) SC 5.2% product grade Increase in FY27 due to inflation, FX translation, higher strip ratio (10:1), and
pre-strip works in mining Phase 4 in anticipation of the NAL Brownfield Expansion. 198,000 – 210,000 dmt Additional Information FY27 Guidance 1 Capital Expenditures 3,4 US$100-120m growth capital allocated to the NAL Expansion and
advancement of Moblan studies US$20m of sustaining capital projects at NAL. 200,000 – 230,000 dmt US$880 – US$950 / dmt sold US$120-140m 197,967 dmt FY26 Actual 181,494 dmt US$853 / dmt sold US$24m
Appendix
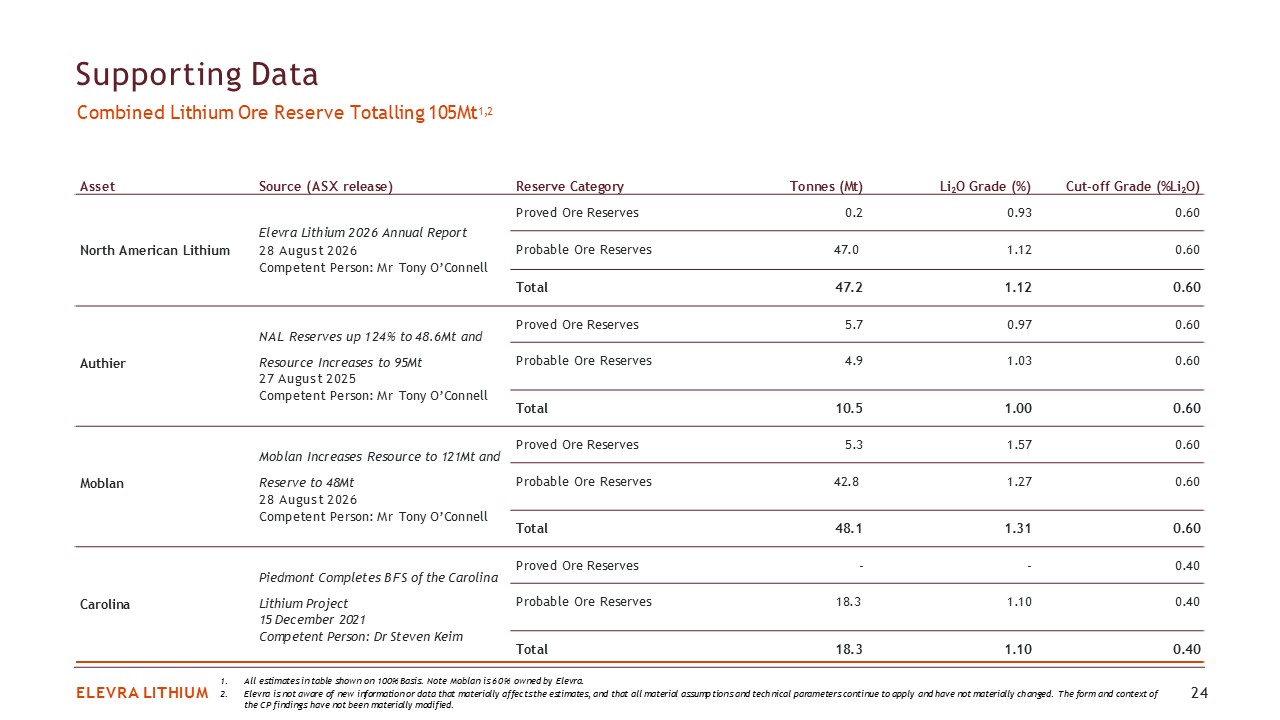
ELEVRA LITHIUM 24 Asset Source (ASX release) Reserve Category Tonnes
(Mt) Li2O Grade (%) Cut-off Grade (%Li2O) Elevra Lithium 2026 Annual Report Proved Ore Reserves 0.2 0.93 0.60 Probable Ore Reserves 47.0 1.12 0.60 North American Lithium 28 August 2026 Competent Person: Mr Tony
O’Connell Total 47.2 1.12 0.60 NAL Reserves up 124% to 48.6Mt and Proved Ore Reserves 5.7 0.97 0.60 Probable Ore Reserves 4.9 1.03 0.60 Authier Resource Increases to 95Mt 27 August 2025 Competent Person: Mr Tony
O’Connell Total 10.5 1.00 0.60 Moblan Increases Resource to 121Mt and Proved Ore Reserves 5.3 1.57 0.60 Probable Ore Reserves 42.8 1.27 0.60 Moblan Reserve to 48Mt 28 August 2026 Competent Person: Mr Tony
O’Connell Total 48.1 1.31 0.60 Piedmont Completes BFS of the Carolina Proved Ore Reserves - - 0.40 Probable Ore Reserves 18.3 1.10 0.40 Carolina Lithium Project 15 December 2021 Competent Person: Dr Steven
Keim Total 18.3 1.10 0.40 Supporting Data Combined Lithium Ore Reserve Totalling 105Mt1,2 All estimates in table shown on 100% Basis. Note Moblan is 60% owned by Elevra. Elevra is not aware of new information or data that materially
affects the estimates, and that all material assumptions and technical parameters continue to apply and have not materially changed. The form and context of the CP findings have not been materially modified.
ELEVRA
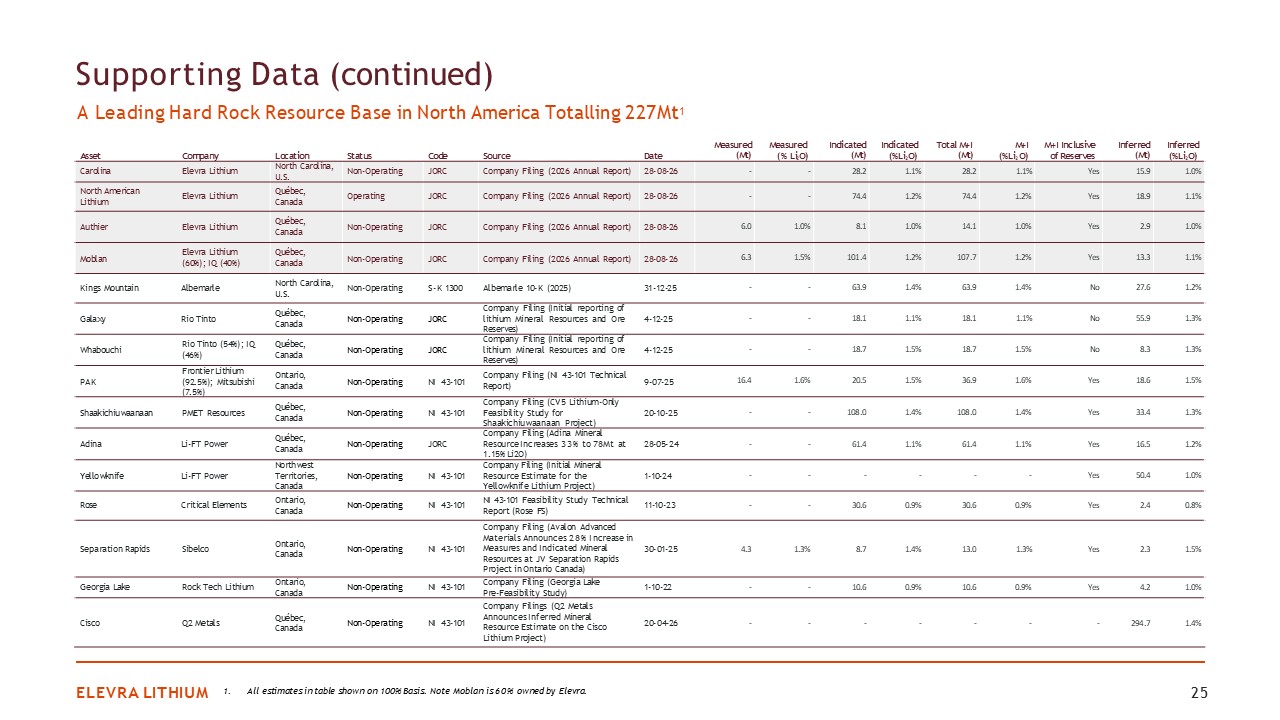
LITHIUM 25 Asset Company Location Status Code Source Date Measured (Mt) Measured (% Li2O) Indicated (Mt) Indicated (%Li2O) Total M+I (Mt) M+I (%Li2O) M+I Inclusive of Reserves Inferred (Mt) Inferred
(%Li2O) Carolina Elevra Lithium North Carolina, U.S. Non-Operating JORC Company Filing (2026 Annual Report) 28-08-26 - - 28.2 1.1% 28.2 1.1% Yes 15.9 1.0% North American Lithium Elevra Lithium Québec,
Canada Operating JORC Company Filing (2026 Annual Report) 28-08-26 - - 74.4 1.2% 74.4 1.2% Yes 18.9 1.1% Authier Elevra Lithium Québec, Canada Non-Operating JORC Company Filing (2026 Annual
Report) 28-08-26 6.0 1.0% 8.1 1.0% 14.1 1.0% Yes 2.9 1.0% Moblan Elevra Lithium (60%); IQ (40%) Québec, Canada Non-Operating JORC Company Filing (2026 Annual
Report) 28-08-26 6.3 1.5% 101.4 1.2% 107.7 1.2% Yes 13.3 1.1% Kings Mountain Albemarle North Carolina, U.S. Non-Operating S-K 1300 Albemarle 10-K (2025) 31-12-25 - - 63.9 1.4% 63.9 1.4% No 27.6 1.2% Galaxy Rio
Tinto Québec, Canada Non-Operating JORC Company Filing (Initial reporting of lithium Mineral Resources and Ore Reserves) 4-12-25 - - 18.1 1.1% 18.1 1.1% No 55.9 1.3% Whabouchi Rio Tinto (54%); IQ (46%) Québec,
Canada Non-Operating JORC Company Filing (Initial reporting of lithium Mineral Resources and Ore Reserves) 4-12-25 - - 18.7 1.5% 18.7 1.5% No 8.3 1.3% PAK Frontier Lithium (92.5%); Mitsubishi (7.5%) Ontario,
Canada Non-Operating NI 43-101 Company Filing (NI 43-101 Technical Report) 9-07-25 16.4 1.6% 20.5 1.5% 36.9 1.6% Yes 18.6 1.5% Shaakichiuwaanaan PMET Resources Québec, Canada Non-Operating NI 43-101 Company Filing (CV5
Lithium-Only Feasibility Study for Shaakichiuwaanaan Project) 20-10-25 - - 108.0 1.4% 108.0 1.4% Yes 33.4 1.3% Adina Li-FT Power Québec, Canada Non-Operating JORC Company Filing (Adina Mineral Resource Increases 33% to 78Mt at
1.15% Li2O) 28-05-24 - - 61.4 1.1% 61.4 1.1% Yes 16.5 1.2% Yellowknife Li-FT Power Northwest Territories, Canada Non-Operating NI 43-101 Company Filing (Initial Mineral Resource Estimate for the Yellowknife Lithium
Project) 1-10-24 - - - - - - Yes 50.4 1.0% Rose Critical Elements Ontario, Canada Non-Operating NI 43-101 NI 43-101 Feasibility Study Technical Report (Rose FS) 11-10-23 - - 30.6 0.9% 30.6 0.9% Yes 2.4 0.8% Separation
Rapids Sibelco Ontario, Canada Non-Operating NI 43-101 Company Filing (Avalon Advanced Materials Announces 28% Increase in Measures and Indicated Mineral Resources at JV Separation Rapids Project in Ontario
Canada) 30-01-25 4.3 1.3% 8.7 1.4% 13.0 1.3% Yes 2.3 1.5% Georgia Lake Rock Tech Lithium Ontario, Canada Non-Operating NI 43-101 Company Filing (Georgia Lake Pre-Feasibility
Study) 1-10-22 - - 10.6 0.9% 10.6 0.9% Yes 4.2 1.0% Cisco Q2 Metals Québec, Canada Non-Operating NI 43-101 Company Filings (Q2 Metals Announces Inferred Mineral Resource Estimate on the Cisco Lithium
Project) 20-04-26 - - - - - - - 294.7 1.4% Supporting Data (continued) A Leading Hard Rock Resource Base in North America Totalling 227Mt1 1. All estimates in table shown on 100% Basis. Note Moblan is 60% owned by Elevra.
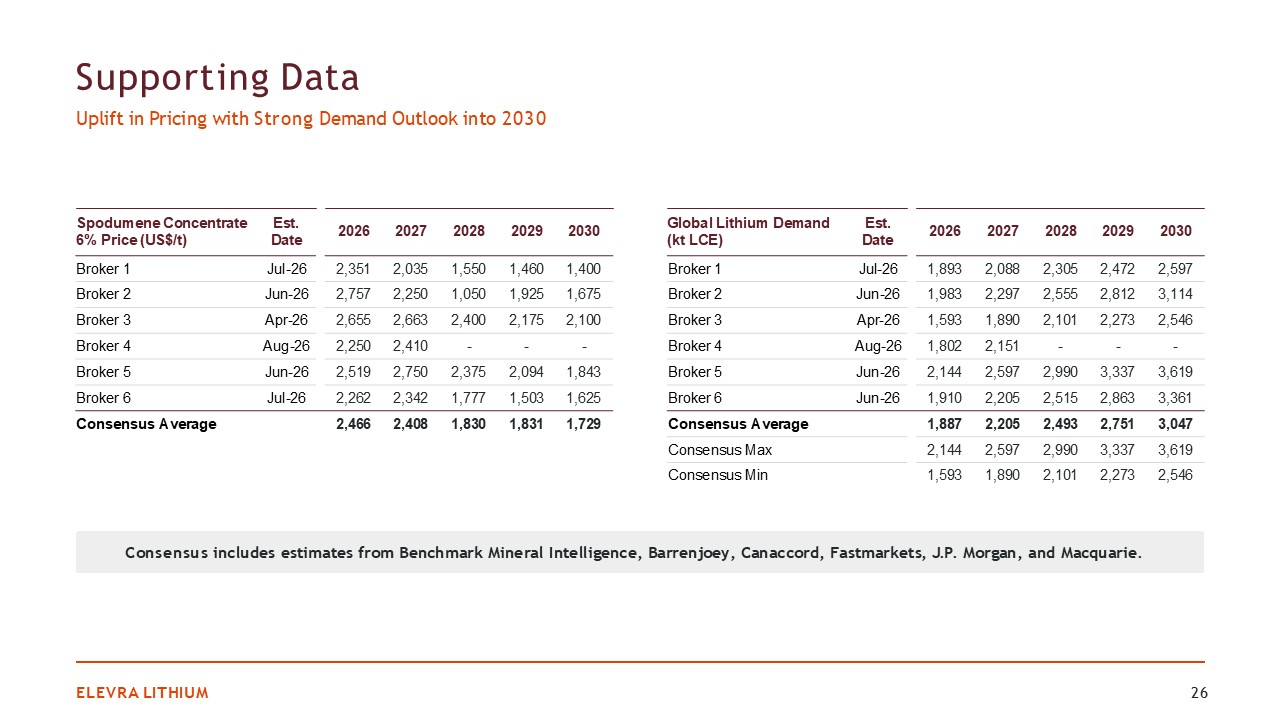
Supporting Data Uplift in Pricing with Strong Demand Outlook into 2030 ELEVRA
LITHIUM 26 Spodumene Concentrate 6% Price (US$/t) Est. Date 2026 2027 2028 2029 2030 Global Lithium Demand (kt LCE) Est. Date 2026 2027 2028 2029 2030 Broker 1 Jul-26 2,351 2,035 1,550 1,460 1,400 Broker
1 Jul-26 1,893 2,088 2,305 2,472 2,597 Broker 2 Jun-26 2,757 2,250 1,050 1,925 1,675 Broker 2 Jun-26 1,983 2,297 2,555 2,812 3,114 Broker 3 Apr-26 2,655 2,663 2,400 2,175 2,100 Broker
3 Apr-26 1,593 1,890 2,101 2,273 2,546 Broker 4 Aug-26 2,250 2,410 - - - Broker 4 Aug-26 1,802 2,151 - - - Broker 5 Jun-26 2,519 2,750 2,375 2,094 1,843 Broker 5 Jun-26 2,144 2,597 2,990 3,337 3,619 Broker
6 Jul-26 2,262 2,342 1,777 1,503 1,625 Broker 6 Jun-26 1,910 2,205 2,515 2,863 3,361 Consensus Average 2,466 2,408 1,830 1,831 1,729 Consensus Average 1,887 2,205 2,493 2,751 3,047 Consensus
Max 2,144 2,597 2,990 3,337 3,619 Consensus Min 1,593 1,890 2,101 2,273 2,546 Consensus includes estimates from Benchmark Mineral Intelligence, Barrenjoey, Canaccord, Fastmarkets, J.P. Morgan, and Macquarie.