

Exhibit 99.1
| |
|
ASX ANNOUNCEMENT
7 September 2026
NAL Expansion Pre-Feasibility Study
North American lithium producer Elevra Lithium Limited (“Elevra” or “Company”) (ASX:ELV; NASDAQ:ELVR) is pleased to announce the results of a Pre- Feasibility Study (“PFS”) for the staged North American Lithium (“NAL”) Brownfield Expansion in Québec. The PFS confirms the NAL Expansion as a high-value growth project that is expected to significantly increase annual spodumene concentrate production while reducing unit operating costs and generating attractive returns on capital invested.
Highlights:
| • | Consistent with the Updated NAL Expansion Scoping Study, the NAL Expansion will be delivered through a three-stage brownfield development, with Stage 1 increasing process plant throughput to the currently permitted rate of 4,500 tpd from mid-CY27, Stage 2 increasing milling capacity to 6,500 tpd from mid CY28, and Stage 3 delivering a permanent crushing solution aligned with increased milling capacity by mid CY29. |
| • | On a post expansion basis, average annual spodumene concentrate production increases to 373 thousand tonnes per annum (ktpa) (nominal SC5.4, post ramp up), nearly double the no expansion scenario (“Base Case”) and 10% above the 338 ktpa estimate from May 20261. Production above the 338 ktpa capacity is attributable to improved mill feed grades largely due to benefits of ore sorting equipment. |
| • | Life of mine (LOM) C1 cost of C$876/t (US$649/t) 2 of spodumene concentrate, reducing to C$851/t (US$630/t)2 post-expansion with AISC of C$918/t (US$680/t)2. |
| • | The NAL Expansion is fully funded based on the total initial CAPEX remaining unchanged at C$366M (US$271M)2 (AACE Class 4 estimate with a target accuracy range of ±40%), including C$73M (US$54M) 2 of contingency, with Stage 1 CAPEX of C$92M (US$68M) 2, Stage 2 CAPEX of C$101M (US$75M) 2 and Stage 3 CAPEX of C$173M (US$128M) 2. |
| • | NAL Expansion delivers a post-tax NPV (8%) of C$3,218M (US2,384M)2, or an incremental post-tax NPV (8%) of C$943M (US$699M)2 compared to the C$969M (US$718M)2 incremental post-tax NPV (8%) declared in May 20261 due primarily to a 4% increase in the mining cost compared to the previous announcement following further detailed haulage modelling. |
| • | The Company’s existing NAL Ore Reserves of 47.2Mt at 1.12% Li2O, comprising 0.2MT Proven and 47.0MT Probable Mineral Reserves, solely underpin the NAL Expansion production profile with a revised life of mine of 20 years. |
| • | The PFS demonstrates that the NAL Expansion can increase production, reduce unit costs and generate significant incremental value from an existing operating asset and established infrastructure. |
| 1 | ASX release “Updated NAL Expansion Scoping Study” dated 12 May 2026. |
| 2 | Figures converted from Canadian dollar to United States dollar at CAD/USD 1.35 as per the PFS. |
| ELEVRA LITHIUM • Level 3, 10 Eagle Street • Brisbane QLD 4000 • Australia | |
| +61 7 3369 7058 • info@elevra.com • ASX:ELV | NASDAQ:ELVR | elevra.com |

| • | The NAL Expansion is fully funded through Elevra’s Strategic Financing Package announced in May 20263. |
Elevra’s Managing Director and Chief Executive Officer, Mr Lucas Dow, said: “The NAL Expansion PFS confirms a compelling value proposition for Elevra, with a high-return brownfield expansion that materially increases production while reducing unit operating costs.
The ability to increase average annual production to 373,000 tonnes post-expansion, while reducing LOM average C1 unit costs post expansion to approximately C$851/t (US$630/t)4, demonstrates the significant operating leverage available at NAL. The production target and cost profile are underpinned by existing Ore Reserves and historical operating data, providing a strong foundation for the production and financial outcomes outlined in the PFS.
The staged development approach allows us to bring additional production online from mid-2027, by progressively increasing throughput and capturing operating efficiencies while managing project execution and prudent capital deployment.”
Study Confirms Compelling Economics for NAL Expansion
The PFS confirms a compelling economic case for the staged expansion of NAL, with the project expected to materially increase spodumene concentrate production while reducing unit operating costs and generating significant incremental value from an existing operating asset.
The PFS estimates an expansion-only post-tax NPV8% of C$943MM (US$699M)4, post-tax IRR of 49.9% and post-tax payback period of 34 months.
The expansion requires initial capital expenditure of C$366 M (US$271M)4, with total sustaining expenditure of C$527M (US$390M)4 over the expansion case. The financial analysis is unlevered and based on the Mineral Reserves estimated as part of the PFS.
The PFS establishes an average annual production rate of 348ktpa (5.4% Li2O spodumene concentrate) and an average annual post-expansion production rate of 373ktpa (5.4% Li2O spodumene concentrate).
Importantly, 100% of the Production Target is underpinned by Proven and Probable Ore Reserves. No Inferred Mineral Resources are included in the economic analysis or Production Target. The PFS states that the economic analysis was based on Measured and Indicated Mineral Resources only, with Inferred Mineral Resources excluded as too geologically speculative for mining and economic considerations to be applied.
Study Confirms Strong Operating Metrics for NAL Expansion
The PFS demonstrates significant operating leverage from increasing the scale of NAL’s existing operation.
Average annual post-expansion spodumene concentrate production is expected to increase from 199ktpa in the base case to 373ktpa post-expansion, while LOM average production increases from 196ktpa to 348ktpa.
LOM C1 operating costs are estimated at C$876/t (US$649/t)4 of concentrate, compared with C$1,048/t (US$776/t)4 for the base case, while the post-expansion C1 cost is estimated at C$851/t (US$630/t)4.
LOM AISC is estimated at C$954/t (US$707/t)4, reducing to C$918/t (US$680/t)4 post-expansion.
The PFS estimates total LOM operating expenditure of C$5.95B (US$4.41B)4 for the expansion case, with the cost estimates supported by actual NAL operating information including salaries, consumables, maintenance costs and established contracts.
| 3 | ASX release “Transformational Financing Package to Accelerate Growth” dated 12 May 2026. |
| 4 | Converted at CAD/USD 1.35. |
| ELEVRA LITHIUM | 2 |
Staged Expansion Delivery
The NAL Expansion Project has been designed as a three-stage brownfield development that progressively increases production and reduces unit costs while leveraging existing infrastructure.
Stage 1
Stage 1 is expected to deliver an initial 15-20% increase in annual spodumene concentrate production within NAL’s existing 4,500 tpd milling permit, together with a reduction in unit operating costs.
Stage 2
Stage 2 will expand downstream milling, flotation and filtration capacity to 6,500 tpd, with additional feed initially supported by a temporary mobile crushing circuit. Production from Stage 2 is expected to commence in mid CY28.
Stage 3
Stage 3 will replace the temporary and existing crushing circuits with a new crushing circuit capable of supporting the targeted 373ktpa post-expansion production profile, together with additional ore sorting capacity. Completion is expected in mid CY29.
The staged development approach was adopted to reduce execution risk, bring forward production growth and stage capital deployment.
Pre-Feasibility Study Metrics
Analysis of the financial model on the key economic assumptions indicates that the Project is robust in terms of operational and financial metrics. The Project is most sensitive to changes in commodity prices, exchange rates, head grades and recoveries, with the key Project assumptions and outputs shown in the tables below
(please note that any reference to Base Case means NAL on an unexpanded or “as is” basis):
Table 1 – Main Financial Assumptions and Results Summary for the NAL Expansion Project
| Parameters | Unit | Base | May-26 Updated Scoping5 |
PFS |
| Average Price 6% Li2O6 | USD$/t | $2,260 | $2,154 | $2,137 |
| Life of mine (from FY27) | yrs | 35 | 21 | 20 |
| Total Waste | Mt | 336 | 335 | 336 |
| Total Ore Processed | Mt | 47 | 47 | 44 |
| Strip Ratio | - | 7.1 | 7.2 | 7.1 |
| Average Annual ROM | Mt/y | 1.36 | 2.22 | 2.41 |
| Average Feed Grade | % Li2O | 1.12% | 1.11% | 1.17% |
| LOM 5.4% Li2O Produced | Mt | 6.77 | 6.85 | 6.79 |
| Average Annual 5.4% Li2O Production (post expansion) | kt/y | 199 | 338 | 373 |
5 May-26 Scoping shows the results of the Updated Scoping Study for the NAL Expansion. See ASX release “Updated NAL Expansion Scoping Study” dated 12 May 2026.
6 Average Price 6% Li2O varies between the cases due to longer mine life at the long-term US$2,340 price for the base case.
| ELEVRA LITHIUM | 3 |
Table 2 – Project Economics
| Parameters | Unit | Base | May-26 Updated Scoping |
PFS |
| LOM C1 Cost Concentrate | C$/t conc | 1,048 | 868 | 876 |
| LOM AISC | C$/t conc | 1,126 | 946 | 954 |
| LOM C1 Cost of Concentrate (post expansion) | C$/t conc | 1,045 | 847 | 851 |
| LOM AISC (post expansion) | C$/t conc | 1,112 | 922 | 918 |
| Total Sustaining Capital (SUSEX) | C$M | 512 | 526 | 527 |
| Total Initial CAPEX | C$M | - | 366 | 366 |
| NPV (8%) (post-tax) | C$M | 2,274 | 3,112 | 3,218 |
| IRR Expansion (post-tax) | % | - | 42% | 50% |
| Payback (post-tax) | Months | - | 25 | 34 |
Notes:
| • | All costs and sales are presented in constant 2026 CAD, with no inflation or escalation factors considered. |
| • | $M = millions of dollars. |
| • | The financial analysis was performed on existing Mineral Reserves as outlined in this report. |
| • | The valuation calculations are unlevered. |
| • | The average metallurgical recovery over the LOM is 71.2% for the expansion and 69.2% for the base case due to improvement in the flowsheet attributable to wet high-intensity magnetic separator (WHIMS) improvements. |
| • | Plant availability is calculated at 90%. |
| • | Tonnes of concentrate are presented as dry metric tonnes. |
| • | An exchange rate of 1.35 CAD/USD was fixed over the LOM for the Project. |
| • | The average 6% Li2O concentrate (SC6) price is based on a market analysis from Benchmark Mineral Intelligence for Q1 2026 as described in the market section and varies over the LOM from US$1,260/t to US$2,430/t. |
| • | Average LOM SC6 pricing may vary between the cases due to longer mine life at the long term US$2,430 price for the base case (2036 and beyond). |
| • | A discount rate of 8% was used for the base case and expansion scenarios. |
| • | Net Cash Flow and valuation calculations include investment tax credit on CAPEX. |
| • | The numbers have been rounded. Any discrepancy in the totals is due to rounding effects. |
Purpose of this ASX Release
This ASX release provides readers with a bridge between prior ASX disclosure on 12 May 2026 “Updated NAL Expansion Scoping Study” and a National Instrument 43-101 Pre-Feasibility Study (attached) that has been prepared for compliance with Quebec, Canada regulatory requirements and to enable subsequent permitting activities for the NAL expansion. The NI43-101 report will also be available on SEDAR.
| ELEVRA LITHIUM | 4 |
The Company can confirm that the Resource and Reserve tables reproduced in this ASX release and the NI43-101 report are compliant with both ASX/JORC requirements and those related to NI43-101 reporting. It should also be noted the ore reserves are: (1) not being reported for the first time; and (2) the same as those estimates which were previously reported in the FY26 Annual Report released to the ASX on 28 August 2026.
Mineral Resources and Ore Reserves
The project database contains data from 1,575 diamond drillholes surfaces and underground collared, spanning a total of 27,183 records of Li2O assays with a mean sample length of approximately 0.884 m. Li2O grade varies from 0.000% to 5.318%. Global average Li2O grade for raw samples (excluding 0.00% assays) is 0.783%. From this database, a subset of 562 surface collared drillholes totalling 153,047 m was used for the Mineral Resource estimate.
The current Mineral Resource Estimate and Ore Reserve Estimate are presented in Table 4 and Table 5 below. The Mineral Resource and Ore Reserve estimates were prepared by Competent Persons in accordance with the 2012 JORC Code.
Table 3 – North American Lithium – Mineral Resource Estimates (0.60% Li2O cut-off grade for the RPEEE pit and 0.70% Li2O cut-off grade for underground domain)
| Resource Classification |
Method | Tonnes (Mt) | Li2O Grade (%) | Cut-Off Grade (%) |
| Indicated | Open Pit | 74.4 | 1.17 | 0.60 |
| Inferred | Open Pit | 8.6 | 1.13 | 0.60 |
| Indicated | Underground | - | - | - |
| Inferred | Underground | 10.3 | 1.01 | 0.70 |
| Total | 93.3 | 1.15 |
Table 4 – North American Lithium – Ore Reserves Estimate, as at of June 30, 2026
| Resource Classification | Tonnes (Mt) | Li2O Grade (%) | Cut-Off Grade (%) | Fe Grade (%) |
| Proved Ore Reserves | 0.2 | 0.93 | 0.60 | 1.48 |
| Probable Ore Reserves | 47.0 | 1.12 | 0.60 | 0.81 |
| Total | 47.2 | 1.12 | 0.60 | 0.81 |
The information on Mineral Resources and Ore Reserves is extracted from the announcement entitled “2026 Annual Report” published on the ASX on August 28th, 2026, and is available to view on the Elevra’s website on the ASX. The company confirms that it is not aware of any new information or data that materially affects the information included in the original market announcement and, in the case of estimates of Mineral Resources or Ore Reserves, that all material assumptions and technical parameters underpinning the estimates in the relevant market announcement continue to apply and have not materially changed. The company confirms that the form and context in which the Competent Person’s findings are presented have not been materially modified from the original market announcement.
| ELEVRA LITHIUM | 5 |
Background
The North American Lithium operation is a hard-rock lithium mining and concentration facility located in La Corne, within the Abitibi-Témiscamingue region of Quebec, Canada. The NAL facility was successfully restarted in March 2023, and the plant is currently permitted for 4,500 tpd of average annual milling rate.
The processing operation consists of three distinct processing areas:
| • | The primary, secondary and tertiary crushing, and ore sorting circuits to produce an upgraded plant feed for downstream processing. |
| • | The spodumene processing plant including grinding, desliming, magnetic separation, flotation and dewatering circuits to produce a final spodumene concentrate. |
| • | The process water and utilities circuits including tailings thickeners, reagents preparation, reverse osmosis treatment, and tailings management. |
The objective of the NAL expansion project is to increase the plant’s milling throughput to an annual level of 6,500 tpd. Elevra determined that permitting is the critical path constraint and identified a project development sequence that provides a shorter timeframe to achieve increased production from NAL. The additional new permitting information, combined with existing permits, provides a pathway to stage the expansion of production volumes at NAL in a disciplined, agile and more time efficient manner.
The expansion pathway is now proposed to take the form of a series of debottlenecking steps which are expected to:
| • | Increase production capacity above current levels in a staged and incremental manner; |
| • | Improve plant recovery by the introduction of additional LIMS and WHIMS, and additional flotation conditioning capacity; |
| • | Reduce the timeframe to achieve the expanded average annual production volume of 373ktpa of spodumene concentrate; and |
| • | Enable the capital investment to be staged and, in doing so, reduce the initial upfront capital requirements. |
The debottlenecking steps are anticipated to be delivered as below:
| 1. | An initial 15-20% increase in annual spodumene concentrate production above current production levels commencing in mid-CY27 with an incremental reduction in unit operating costs. This increase is within the current limits of the milling permit, which is set at 4,500 tpd; |
| 2. | A subsequent expansion of the milling, flotation and filtration capacity to 6,500 tpd. The incremental feed material will be processed using a temporary mobile crushing circuit operating in conjunction with the existing crushing circuit. The further expanded production is expected to commence mid CY28, with an additional incremental reduction in unit operating costs; and |
| 3. | The replacement of the temporary mobile crushing circuit and the existing crushing circuit with a new crushing circuit capable of meeting feed requirements for a LOM average production of 373 ktpa post-expansion. This final step will include additional ore sorting capacity and is expected to be completed in mid CY29 delivering crushing cost efficiencies which are required to meet the anticipated LOM cost reduction. |
Announcement authorised for release by Elevra’s Managing Director and Chief Executive Officer.
| ELEVRA LITHIUM | 6 |
About Elevra Mining
Elevra Lithium Limited is a North American lithium producer (ASX:ELV; NASDAQ:ELVR) with projects in Québec, Canada, United States and a joint venture in Western Australia.
Elevra’s assets comprise North American Lithium (100%), a 60% stake in the Moblan Lithium Project in Central Québec and the Carolina Lithium project (100%) in the United States8.
For more information, please visit us at www.elevra.com.
Competent Person’s Statement
The information on Mineral Resources and Ore Reserves are extracted from the announcement entitled “2026 Annual Report” published on the ASX on 28th August 2026 and is available to view on the Elevra’s website or on the ASX. The Company confirms that it is not aware of any new information or data that materially affects the information included in the original market announcement and all material assumptions and technical parameters continue to apply and have not materially changed. The Company confirms that the form and context in which the Competent Person’s findings are presented have not been materially modified from the original market announcements
The ASX release dated 28th August 2026 that relates to Mineral Resources for the NAL project – referred to in this announcement – is based on and fairly represents information compiled by Mr Stephen John Andrew, an independent consultant employed by Measured Group and who is a member of the Australasian Institute of Mining and Metallurgy (AusIMM). Mr Andrews has sufficient experience which is relevant to the style of mineralisation and type of deposit under consideration and to the activity which he is undertaking to qualify as a Competent Person as defined in the JORC Code (2012 Edition) of the “Australasian Code for Reporting of Exploration Results, Mineral Resources and Ore Reserves.” The Company confirms that the form and context in which the Competent Person’s findings are presented have not been materially modified from the original market announcements
The information in this announcement and the ASX release dated 28th August 2026 relating to Ore Reserves for the North American Lithium project is based on, and fairly represents, information and supporting documentation prepared by Mr. Tony O’Connell an independent consultant employed by Optimal Mining Solutions Pty Ltd and is a member of the Australasian Institute of Mining and Metallurgy (AusIMM). Mr O’Connell has sufficient experience which is relevant to the type of deposits and mining method under consideration and to the activity which has been undertaken to qualify as a Competent Person as defined in the 2012 Edition of the “Australasian Code for Reporting of Exploration Results, Mineral Resources and Ore Reserves”. The Company confirms that the form and context in which the Competent Person’s findings are presented have not been materially modified from the original market announcements.
Forward Looking Statements
This press release contains certain forward-looking statements. Such statements include, but are not limited to, statements relating to “reserves” or “resources”. Forward -looking statements are based on certain assumptions and involve known and unknown risks, uncertainties and other factors, many of which are beyond Elevra’s control. Actual events or results may differ materially from the events or results expressed or implied in any forward-looking statement. There can be no assurance that such information will prove to be accurate as actual results and future events could differ materially from those anticipated in such forward-looking statements.
8 See ASX release dated 11 May 2026, “Elevra enters agreement to sell Ewoyaa Project Interest”.
| ELEVRA LITHIUM | 7 |
Cautionary Statements
The Pre-Feasibility Study (“PFS”) discussed in this announcement has been undertaken to assess the technical and economic viability of the brownfield expansion of the existing North American Lithium (“NAL”) operation. The PFS is a comprehensive technical and economic study of the expansion project and includes a financial analysis based on reasonable assumptions regarding the applicable Modifying Factors and other relevant factors. The PFS has been prepared to a level of confidence sufficient to support the assessment of technical and economic viability and the estimation of Ore Reserves, as applicable. A PFS is, however, at a lower level of confidence than a Feasibility Study and the estimates and assumptions contained in the PFS remain subject to further refinement through subsequent engineering, design and project execution activities.
The PFS has provided Pre-Feasibility Study level estimates of production, capital and operating costs and financial returns. The production target and forecast financial information included in the PFS are based solely on the current NAL Ore Reserves reported in Elevra Lithium Limited’s 2026 Annual Report released to ASX on 28 August 2026. No Inferred Mineral Resources or Exploration Targets are included in the production target or the economic analysis underpinning the PFS.
The PFS is based on the material assumptions outlined in the attached National Instrument 43-101 Pre-Feasibility Study, including assumptions regarding production rates, metallurgical recoveries, capital and operating costs, commodity prices, foreign exchange rates, permitting, project schedule and other applicable Modifying Factors. While Elevra considers that the material assumptions used in the PFS have a reasonable basis, actual results may differ materially from those anticipated in the PFS and there is no certainty that the assumptions will prove to be correct or that the outcomes indicated by the PFS will be achieved.
Based on the Company’s current cost estimates and existing funding arrangements, Elevra considers the NAL Expansion to be fully funded. However, there can be no assurance that actual project costs will not exceed current estimates or that delays, changes in project scope, permitting requirements, market conditions or other circumstances will not result in additional funding requirements.
This announcement contains forward-looking statements, including statements concerning production targets, production rates, mine life, metallurgical recoveries, capital and operating costs, project timing, commodity prices, financial performance and other economic outcomes. These forward-looking statements are based on assumptions and expectations which Elevra considers reasonable as at the date of this announcement. However, forward-looking statements are subject to known and unknown risks, uncertainties and other factors, many of which are outside Elevra’s control, which may cause actual results, performance or achievements to differ materially from those expressed or implied by those statements.
Given the uncertainties associated with forward-looking information and the fact that a PFS is at a lower level of confidence than a Feasibility Study, investors are cautioned not to place undue reliance on the PFS, the production target, forecast financial information or other forward-looking statements contained in this announcement.
For more information, please contact:
Andrew Barber
Investor Relations
Ph: +617 3369 7058
| ELEVRA LITHIUM | 8 |

NAL Expansion FS
Mineral Reserves Pre-Feasibility Study
NI 43-101 Final Report Prepared for Elevra

ELEVRA
SN Document No.: B198-D01-02054-RT-0010 – MDV/mdv
Elevra Document No.: C102-0000-G-RAP-0002
Revision: 0
|
Sedgman Novopro Projects Inc Registration Number: 1517259-4 |
 |
 |
| NAL Expansion FS Mineral Reserve Pre-Feasibility Study NI 43-101 Final Report Prepared for Elevra |
 |
Revision Status
| Revision Number | Author | Description | Date | Approved By |
| A | MDV | Internal Review | 07-Jul-2026 | AM |
| B | MDV | Client Review | 07-Jul-2026 | AM |
| 0 | MDV | Final Issue | 14-Aug-2026 | AM |
Distribution
| Company Name | Contact Name | Revision | Date |
| Elevra | Patrick Wood | B | 07-Jul-2026 |
| Elevra | Patrick Wood | 0 | 14-Aug-2026 |
| Montreal Office | |
| 1350 Sherbrooke West, Suite 600 | T:+(514) 286-0004 |
| Montreal QC H3G 1J1 | E: montreal.admin@sedgman.com |
| CANADA | W: www.sedgmannovopro.com |

| NAL Expansion FS Mineral Reserve Pre-Feasibility Study NI 43-101 Final Report Prepared for Elevra |
|
Table of Contents
| 1 | Executive Summary | 1 | ||||
| 1.1 | Introduction | 1 | ||||
| 1.2 | Forward Looking Notice | 2 | ||||
| 1.3 | Background | 2 | ||||
| 1.4 | Property Description | 3 | ||||
| 1.5 | Accessibility, Climate and Local Resources | 4 | ||||
| 1.6 | History | 4 | ||||
| 1.7 | Geology and Mineralization | 4 | ||||
| 1.8 | Mineral Resource Estimate | 5 | ||||
| 1.9 | Mineral Reserve Estimate | 6 | ||||
| 1.10 | Mining Methods | 6 | ||||
| 1.11 | Mineral Processing and Metallurgical Testing | 10 | ||||
| 1.12 | Recovery Methods | 10 | ||||
| 1.13 | Project Infrastructure | 13 | ||||
| 1.14 | Environmental Studies, Permitting and Social or Community Impact | 15 | ||||
| 1.15 | Market Studies and Contracts | 16 | ||||
| 1.16 | Capital Cost and Operating Cost Estimates | 17 | ||||
| 1.17 | Economic Analysis | 18 | ||||
| 1.18 | Project Execution and Risk Assessment | 20 | ||||
| 1.19 | Interpretations and Conclusions | 21 | ||||
| 1.20 | Recommendations | 22 | ||||
| 2 | Introduction | 23 | ||||
| 2.1 | Purpose of the Report | 23 | ||||
| 2.2 | Context | 23 | ||||
| 2.3 | Study Contributors and Report Responsibility | 24 | ||||
| 2.4 | Site Visits | 25 | ||||
| 2.4.1 | Sedgman Novopro Site Visit | 25 | ||||
| 2.4.2 | BBA Site Visit | 25 | ||||
| 2.4.3 | Previous Site Visits | 25 | ||||
| 2.4.3.1 | Sedgman Novopro Site Visit | 25 | ||||
| 2.4.3.2 | Optimal Mining Site Visit | 25 | ||||
| 2.4.3.3 | Other Site Visits | 27 | ||||
| 2.5 | Sources of Information | 27 | ||||
| 2.6 | Units of Measure and Glossary of Terms | 27 | ||||
| 3 | Reliance on Other Experts | 32 | ||||
| 3.1 | General | 32 | ||||
| 3.2 | Mineral Claims and Surface Rights | 32 | ||||
| 3.3 | Environmental and Social | 32 | ||||
| 3.4 | Taxation | 32 | ||||
| 4 | Property Description and Location | 33 | ||||
| 4.1 | Property Location, Country, Regional and Government Setting | 33 | ||||
| 4.2 | Mineral Tenure, Agreement and Royalties | 36 | ||||
| 4.2.1 | Surface Rights | 36 | ||||
| Revision: 0 – 14-Aug-2026 | |
| B198-D01-02054-RT-0010 | Page iii |
| NAL Expansion FS Mineral Reserve Pre-Feasibility Study NI 43-101 Final Report Prepared for Elevra |
|
| 4.2.2 | Mineral Rights and Permitting | 38 | ||||
| 4.2.3 | Agreements and Royalties | 38 | ||||
| 4.3 | Environmental Liabilities and Other Permitting Requirements | 38 | ||||
| 4.4 | Mineral and Surface Purchase Agreements | 39 | ||||
| 4.5 | Other Significant Factors and Risks | 40 | ||||
| 5 | Accessibility, Climate, Local Resources, Infrastructure and Physiography | 41 | ||||
| 5.1 | Accessibility | 41 | ||||
| 5.2 | Topography, Elevation, Vegetation and Climate | 41 | ||||
| 5.2.1 | Physiography | 41 | ||||
| 5.2.2 | Vegetation | 42 | ||||
| 5.2.3 | Climate | 45 | ||||
| 5.3 | Local Infrastructure and Resources | 45 | ||||
| 5.3.1 | Airports, Rail Terminals, and Bus Services | 45 | ||||
| 5.3.2 | Local Workforce | 46 | ||||
| 5.3.3 | Additional Support Services | 46 | ||||
| 6 | History | 47 | ||||
| 6.1 | General History | 47 | ||||
| 6.2 | Historical Ownership & Activities | 49 | ||||
| 6.3 | Historical Production | 50 | ||||
| 6.3.1 | 2012 – 2014 Production | 51 | ||||
| 6.3.2 | 2017 – 2019 Operations | 51 | ||||
| 6.4 | 2021 Acquisition to Present | 52 | ||||
| 7 | Geology and Mineralization | 53 | ||||
| 7.1 | Regional Geology | 53 | ||||
| 7.2 | Local Geology | 53 | ||||
| 7.3 | Property Geology | 56 | ||||
| 7.3.1 | Volcanics | 57 | ||||
| 7.3.2 | Granodiorite | 57 | ||||
| 7.3.3 | Pegmatite Dykes | 58 | ||||
| 7.4 | Mineralization | 60 | ||||
| 8 | Deposit Types | 62 | ||||
| 8.1 | Rare-Element Pegmatites of the Superior Province | 62 | ||||
| 8.2 | La Corne Pluton Rare-Element Pegmatites | 63 | ||||
| 9 | Exploration | 65 | ||||
| 10 | Drilling | 66 | ||||
| 10.1 | Drilling History | 66 | ||||
| 10.1.1 | Historical (1942 – 1985) | 66 | ||||
| 10.1.2 | Canada Lithium Corp. (2009 – 2011) | 66 | ||||
| 10.1.3 | North American Lithium Corp. (2016 – 2019) | 68 | ||||
| 10.1.4 | Sayona (2022) | 68 | ||||
| 10.1.5 | Sayona (2023 – 2024) | 69 | ||||
| 10.2 | Drilling Procedures | 69 | ||||
| 10.2.1 | Collar Surveys | 69 | ||||
| 10.2.2 | Downhole Surveys | 70 | ||||
| 10.3 | Core Logging Procedures | 70 | ||||
| 10.3.1 | Historical (1942 – 1985) | 70 | ||||
| 10.3.2 | Canada Lithium Corp. (2009 – 2011) | 70 | ||||
| 10.3.3 | North American Lithium Corp. (2016 – 2019) | 71 | ||||
| 10.3.4 | Sayona (2022 – 2024) | 71 | ||||
| Revision: 0 – 14-Aug-2026 | |
| B198-D01-02054-RT-0010 | Page iv |
| NAL Expansion FS Mineral Reserve Pre-Feasibility Study NI 43-101 Final Report Prepared for Elevra |
|
| 10.4 | Qualified Person’s Opinion | 72 | ||||
| 11 | Sample Preparation, Analyses and Security | 73 | ||||
| 11.1 | Sample Preparation Methods | 73 | ||||
| 11.1.1 | Historical (1942 – 1985) | 73 | ||||
| 11.1.2 | Canada Lithium Corp. (2009 – 2011) | 73 | ||||
| 11.1.3 | North American Lithium Corp. (2016 – 2019) | 74 | ||||
| 11.1.4 | Sayona (2022-2024) | 75 | ||||
| 11.2 | Analytical Laboratory Procedures | 75 | ||||
| 11.2.1 | Canada Lithium Corp. (2009 – 2011) | 75 | ||||
| 11.2.2 | North American Lithium Corp. (2016 – 2019) | 75 | ||||
| 11.2.3 | Sayona (2022 – 2024) | 76 | ||||
| 11.3 | QA/QC (Analytical) Procedures | 76 | ||||
| 11.3.1 | Canada Lithium Corp. (2009 – 2011) | 76 | ||||
| 11.3.2 | North American Lithium Corp. (2016 – 2019) | 76 | ||||
| 11.3.3 | Sayona (2022) | 77 | ||||
| 11.3.4 | Sayona (2023 – 2024) | 77 | ||||
| 11.4 | Qualified Person’s Opinion | 77 | ||||
| 12 | Data Verification | 78 | ||||
| 12.1 | Previous Audits and Reviews | 78 | ||||
| 12.2 | Site Visits | 78 | ||||
| 12.2.1 | Field Collar Validation | 79 | ||||
| 12.2.2 | Drilling and Sampling Procedure Validation | 79 | ||||
| 12.2.3 | Log and Core Box Validation | 82 | ||||
| 12.2.4 | Validation Of Sample Preparation, Analytical, QA/QC and Security Procedures | 82 | ||||
| 12.3 | Database Validation | 82 | ||||
| 12.4 | Qualified Person’s Opinion | 82 | ||||
| 13 | Mineral Processing and Metallurgical Testing | 83 | ||||
| 13.1 | North American Lithium – Historical Process Plant Operations | 83 | ||||
| 13.1.1 | Québec Lithium Concentrator Operations (2013 – 2014) | 83 | ||||
| 13.1.2 | North American Lithium Concentrator Operations (2017 – 2019) | 84 | ||||
| 13.1.3 | Sayona Quebec Concentrator Operations (2023 – Present) | 85 | ||||
| 13.2 | North American Lithium Testwork Program | 86 | ||||
| 13.2.1 | North American Lithium Testwork Review Summary | 86 | ||||
| 13.2.2 | Optical Ore Sorting Testwork (2011) | 87 | ||||
| 13.2.3 | WHIMS Testwork (2014) | 88 | ||||
| 13.2.4 | NAL Re-Start Metallurgical Testing (2016) | 89 | ||||
| 13.3 | Blended Ore (NAL and Authier) Testwork Program | 91 | ||||
| 13.3.1 | Preliminary Testwork (2019) | 91 | ||||
| 13.3.2 | Prefeasibility Study Testwork (2021 – 2022) | 93 | ||||
| 13.3.2.1 | Tailings Filtration Tests | 96 | ||||
| 13.3.3 | Feasibility Study Testwork Program (2022 – 2023) | 96 | ||||
| 13.3.3.1 | Composite Samples | 96 | ||||
| 13.3.3.2 | Variability Samples | 98 | ||||
| 13.3.3.3 | Composite Sample Testwork Results | 99 | ||||
| 13.3.3.4 | Variability Sample Testwork Results | 102 | ||||
| 13.3.3.5 | Testwork Analysis | 103 | ||||
| 13.4 | Testwork Analysis | 104 | ||||
| 13.5 | Current Testwork | 105 | ||||
| 14 | Mineral Resource Estimate | 106 | ||||
| 14.1 | Methodology | 106 | ||||
| Revision: 0 – 14-Aug-2026 | |
| B198-D01-02054-RT-0010 | Page v |
| NAL Expansion FS Mineral Reserve Pre-Feasibility Study NI 43-101 Final Report Prepared for Elevra |
|
| 14.2 | Database | 107 | ||||
| 14.3 | Geological Interpretation and Domaining | 107 | ||||
| 14.4 | Data Preparation | 112 | ||||
| 14.4.1 | Exploratory Data Analysis | 112 | ||||
| 14.4.2 | Compositing | 112 | ||||
| 14.4.3 | Grade Capping | 113 | ||||
| 14.5 | Density Estimation | 114 | ||||
| 14.6 | Geostatistics and Grade Estimation | 114 | ||||
| 14.6.1 | Variography | 114 | ||||
| 14.6.2 | Block Model | 116 | ||||
| 14.6.3 | Grade Interpolation | 116 | ||||
| 14.7 | Block Model Validation | 117 | ||||
| 14.7.1 | Visual Inspection | 117 | ||||
| 14.7.2 | Swath Plots | 118 | ||||
| 14.8 | Mineral Resource Classification | 120 | ||||
| 14.9 | Economic Parameters and Cut-off Grade | 121 | ||||
| 14.10 | Mineral Resource Statement | 122 | ||||
| 14.11 | Grade Sensitivity Analysis | 123 | ||||
| 14.12 | Iron Content | 123 | ||||
| 15 | Mineral Reserve Estimate | 125 | ||||
| 15.1 | Summary | 125 | ||||
| 15.2 | Mineral Reserve Estimate | 125 | ||||
| 15.3 | Mineral Reserve Estimation Process | 126 | ||||
| 15.4 | Resource Block Model | 126 | ||||
| 15.5 | Reserves Topography | 127 | ||||
| 15.6 | Pit Optimization | 128 | ||||
| 15.6.1 | Geotechnical Parameters | 128 | ||||
| 15.6.2 | Loss and Dilution | 129 | ||||
| 15.6.3 | Cut-off Grades | 129 | ||||
| 15.6.4 | Costs and Revenue | 129 | ||||
| 15.6.5 | Open Pit Optimization Results | 130 | ||||
| 15.7 | Pit Designs | 131 | ||||
| 15.7.1 | Pit Design Criteria | 131 | ||||
| 15.8 | Life-of-Mine Schedule | 131 | ||||
| 15.9 | Mineral Reserve Estimate Compared to Expanded Feasibility Study | 131 | ||||
| 16 | Mining Methods | 133 | ||||
| 16.1 | Pit Optimization | 134 | ||||
| 16.1.1 | Optimization Inputs | 134 | ||||
| 16.1.2 | Optimization Results | 136 | ||||
| 16.2 | Mining Method | 137 | ||||
| 16.3 | Geotechnical Consideration | 137 | ||||
| 16.3.1 | Planning Around Underground Workings | 137 | ||||
| 16.3.2 | Operational Considerations | 138 | ||||
| 16.4 | Pit Design Parameters | 138 | ||||
| 16.4.1 | Block Models | 138 | ||||
| 16.4.2 | Pit Wall Parameters | 139 | ||||
| 16.4.3 | Ramp Design Parameters | 140 | ||||
| 16.4.4 | Final Pit Design | 142 | ||||
| 16.4.5 | Material Flow Diagram | 144 | ||||
| 16.4.6 | Modifying Factors | 145 | ||||
| Revision: 0 – 14-Aug-2026 | |
| B198-D01-02054-RT-0010 | Page vi |
| NAL Expansion FS Mineral Reserve Pre-Feasibility Study NI 43-101 Final Report Prepared for Elevra |
|
| 16.4.6.1 | Metallurgical Recoveries | 145 | ||||
| 16.4.6.2 | Cut-Off Grade | 147 | ||||
| 16.4.7 | Main Pit Phase Designs | 147 | ||||
| 16.4.8 | Lortie Lake | 157 | ||||
| 16.5 | Life-Of-Mine Plan | 158 | ||||
| 16.5.1 | Dig Solids | 158 | ||||
| 16.5.2 | Waste Dump Designs | 158 | ||||
| 16.5.3 | Waste Dump Solids | 160 | ||||
| 16.5.4 | Dig Schedule Strategy | 160 | ||||
| 16.5.5 | Mining Processes | 160 | ||||
| 16.5.6 | Equipment | 161 | ||||
| 16.5.6.1 | Time Usage Models | 161 | ||||
| 16.5.6.2 | Production Rates | 162 | ||||
| 16.5.7 | Mining Dependencies | 162 | ||||
| 16.5.8 | Mining Constraints | 162 | ||||
| 16.5.9 | Schedule Results | 163 | ||||
| 16.6 | Key Dates | 172 | ||||
| 16.7 | Mining Activities | 172 | ||||
| 16.7.1 | Drilling and Blasting | 173 | ||||
| 16.7.2 | Haulage Assumptions | 174 | ||||
| 16.7.3 | Haulage Results | 175 | ||||
| 16.7.4 | Road Maintenance | 176 | ||||
| 16.7.5 | Mobile Mining Equipment | 176 | ||||
| 16.7.6 | Water Management Strategy | 177 | ||||
| 16.7.7 | Mine Personnel | 177 | ||||
| 17 | Recovery Methods | 178 | ||||
| 17.1 | Existing Plant Description | 178 | ||||
| 17.2 | Process Improvements | 178 | ||||
| 17.2.1 | HPGR Trade-off and Grinding Simulations | 178 | ||||
| 17.2.2 | Plant Layout Considerations | 179 | ||||
| 17.2.3 | Tailings Management | 179 | ||||
| 17.3 | PFS Expansion Design | 179 | ||||
| 17.3.1 | Process Design Criteria | 180 | ||||
| 17.3.2 | Process Flowsheets | 181 | ||||
| 17.4 | Process Description | 183 | ||||
| 17.4.1 | Stage 1 Description | 183 | ||||
| 17.4.2 | Stage 2 Description | 184 | ||||
| 17.4.3 | Stage 3 Description | 185 | ||||
| 17.5 | Production and Recoveries | 185 | ||||
| 17.6 | Recommendations | 186 | ||||
| 18 | Project Infrastructure | 187 | ||||
| 18.1 | Access Roads | 188 | ||||
| 18.1.1 | Public Roads | 188 | ||||
| 18.1.2 | Site Roads | 188 | ||||
| 18.1.3 | Security and Access Point | 188 | ||||
| 18.2 | Electrical Power Supply and Distribution | 190 | ||||
| 18.2.1 | Site Electrical Utility Supply | 190 | ||||
| 18.2.2 | Site Electrical Distribution | 190 | ||||
| 18.2.3 | Emergency Power Supply | 190 | ||||
| 18.3 | Fuel Storage | 190 | ||||
| 18.4 | Natural Gas and Propane | 190 | ||||
| Revision: 0 – 14-Aug-2026 | |
| B198-D01-02054-RT-0010 | Page vii |
| NAL Expansion FS Mineral Reserve Pre-Feasibility Study NI 43-101 Final Report Prepared for Elevra |
|
| 18.5 | Water Supply | 191 | ||||
| 18.5.1 | Water Reclaim System | 191 | ||||
| 18.5.2 | Water for Fire Protection | 191 | ||||
| 18.5.3 | Potable Water | 191 | ||||
| 18.5.4 | Sewage and Waste | 191 | ||||
| 18.6 | Tailings Storage Facility | 192 | ||||
| 18.6.1 | Estimated Needs | 192 | ||||
| 18.6.2 | Project Overview | 192 | ||||
| 18.6.2.1 | Existing TSF-1 | 192 | ||||
| 18.6.2.2 | Planned Expansion Details: TSF-2 | 193 | ||||
| 18.6.2.3 | Planned Expansion Details: TSF-3 | 194 | ||||
| 18.6.3 | Regulatory and Compliance Requirements | 197 | ||||
| 18.6.4 | Design Considerations | 198 | ||||
| 18.6.4.1 | Tailings Material Characterization | 198 | ||||
| 18.6.4.2 | Subsurface investigation extent | 198 | ||||
| 18.6.4.3 | Embankment Configuration | 198 | ||||
| 18.6.4.4 | Water Management | 200 | ||||
| 18.6.4.5 | Seepage mitigation and control | 201 | ||||
| 18.6.4.6 | Closure design | 201 | ||||
| 18.6.4.7 | Monitoring | 201 | ||||
| 18.6.5 | Risk Assessment and Challenges | 201 | ||||
| 18.6.6 | Recommendations | 202 | ||||
| 18.7 | Quebec Lithium Tailings Storage Facility Retaining Structure | 203 | ||||
| 18.7.1 | Preliminary Geotechnical Design of the Retaining Structure for the Tailings Storage Facility (QL-TSF) at the Québec Lithium Tailings Management Area | 203 | ||||
| 18.7.2 | Site Conditions | 204 | ||||
| 18.7.2.1 | Assessment of Liquefaction Potential | 204 | ||||
| 18.7.3 | Stability and Settlement Analysis of the Proposed Retaining Structure | 206 | ||||
| 18.7.3.1 | Stability | 206 | ||||
| 18.7.3.2 | Settlements | 206 | ||||
| 18.7.4 | Risks | 206 | ||||
| 18.8 | Lortie Lake Dyke | 206 | ||||
| 18.8.1 | Design of the Lortie Lake Dyke | 206 | ||||
| 18.8.2 | Sites Conditions | 207 | ||||
| 18.8.3 | Stability and Settlement Analysis of the Lortie Lake Dyke | 209 | ||||
| 18.8.3.1 | Stability | 209 | ||||
| 18.8.3.2 | Settlement | 209 | ||||
| 18.8.4 | Foundation Seepage Control | 209 | ||||
| 18.8.5 | Lortie Lake Emergency Spillway | 209 | ||||
| 18.8.6 | Risks | 211 | ||||
| 18.9 | Site Water Management | 211 | ||||
| 18.9.1 | Water Management Strategy | 211 | ||||
| 18.9.2 | Basins and Ditches Design Criteria | 212 | ||||
| 18.9.3 | Sediment Basins | 212 | ||||
| 18.9.3.1 | Waste Rock Storage 4 Sedimentation basin | 212 | ||||
| 18.9.3.2 | Pit Sedimentation Pond | 213 | ||||
| 18.9.4 | Wastewater Treatment | 214 | ||||
| 18.9.5 | Uncertainties | 216 | ||||
| 18.10 | On-Site Buildings | 216 | ||||
| 18.10.1 | Non-Mineral Waste Management | 216 | ||||
| 18.10.2 | Explosives Magazines | 216 | ||||
| Revision: 0 – 14-Aug-2026 | |
| B198-D01-02054-RT-0010 | Page viii |
| NAL Expansion FS Mineral Reserve Pre-Feasibility Study NI 43-101 Final Report Prepared for Elevra |
|
| 18.10.3 | Administration Office | 216 | ||||
| 18.10.4 | Mine Workshop | 216 | ||||
| 18.10.5 | Process Plant Building | 217 | ||||
| 18.10.6 | Assay Lab | 217 | ||||
| 18.11 | Communications | 217 | ||||
| 19 | Market Studies and Contracts | 218 | ||||
| 19.1 | Market Balance | 218 | ||||
| 19.2 | Demand Forecast | 219 | ||||
| 19.3 | Supply Forecast | 219 | ||||
| 19.4 | Product Pricing | 220 | ||||
| 19.5 | Contract Sales | 220 | ||||
| 19.6 | Packaging and Transportation | 221 | ||||
| 19.7 | Risks and Uncertainties | 221 | ||||
| 20 | Environmental Studies, Permitting and Social or Community Impact | 222 | ||||
| 20.1 | Summary | 222 | ||||
| 20.1.1 | Permitting Stage 1.0 - Current Activities | 222 | ||||
| 20.1.2 | Permitting Stage 2.0 - Milling Capacity Increase | 222 | ||||
| 20.1.3 | Permitting Stage 3.0 Pit Expansion | 223 | ||||
| 20.2 | Environmental Baseline and Impact Studies | 223 | ||||
| 20.2.1 | Physical Environment | 223 | ||||
| 20.2.1.1 | Climate | 223 | ||||
| 20.2.1.2 | Topography | 223 | ||||
| 20.2.1.3 | Geology | 224 | ||||
| 20.2.1.4 | Geomorphology | 224 | ||||
| 20.2.1.5 | Hydrography | 224 | ||||
| 20.2.1.6 | Background Surface Water Quality | 225 | ||||
| 20.2.1.7 | Background Sediment Quality | 226 | ||||
| 20.2.1.8 | Hydrogeology | 226 | ||||
| 20.2.1.9 | Groundwater Quality | 227 | ||||
| 20.2.2 | Biological Environment | 227 | ||||
| 20.2.2.1 | Vegetation | 227 | ||||
| 20.2.2.2 | Wetlands | 227 | ||||
| 20.2.2.3 | Aquatic Fauna | 227 | ||||
| 20.2.3 | Social Considerations | 228 | ||||
| 20.2.3.1 | Territory Use | 228 | ||||
| 20.2.3.2 | Development and Activities | 229 | ||||
| 20.2.3.3 | Land Use | 229 | ||||
| 20.2.3.4 | Public Utilities Infrastructure | 229 | ||||
| 20.2.3.5 | Recreation and Tourism Activities | 229 | ||||
| 20.2.3.6 | Forestry and Agricultural Activities | 229 | ||||
| 20.2.3.7 | First Nations | 230 | ||||
| 20.2.3.8 | Archaeological and Heritage Potential | 231 | ||||
| 20.3 | Project Permitting | 231 | ||||
| 20.3.1 | Ministry of Environment, Fight Against Climate Change, Fauna, and Parks | 231 | ||||
| 20.3.2 | Existing Permits | 232 | ||||
| 20.3.3 | Ongoing Permitting Activities | 232 | ||||
| 20.3.4 | Ministry of Natural Resources and Forests – Lands Sector | 232 | ||||
| Revision: 0 – 14-Aug-2026 | |
| B198-D01-02054-RT-0010 | Page ix |
| NAL Expansion FS Mineral Reserve Pre-Feasibility Study NI 43-101 Final Report Prepared for Elevra |
|
| 20.3.5 | Ministry of Natural Resources and Forests – Forestry Sector | 232 | ||||
| 20.3.6 | Department of Fisheries and Oceans of Canada | 232 | ||||
| 20.4 | Other Environmental Concerns | 233 | ||||
| 20.4.1 | Waste Rock, Tailings and Water Management | 233 | ||||
| 20.4.1.1 | Tailings | 233 | ||||
| 20.4.1.2 | Waste rock | 233 | ||||
| 20.4.1.3 | Emissions of air contaminants | 234 | ||||
| 20.4.2 | Regulatory Context | 234 | ||||
| 20.4.2.1 | Provincial Procedure for Environmental Impact Assessment | 234 | ||||
| 20.4.2.2 | Federal Procedure for Environmental Impact Assessment | 234 | ||||
| 20.4.2.3 | Laws and Regulations for Environmental Impact Assessment | 234 | ||||
| 20.5 | Social and Community Impacts | 236 | ||||
| 20.5.1 | Consultation Activities | 236 | ||||
| 20.5.1.1 | Committee Composition | 236 | ||||
| 20.6 | Water Management | 237 | ||||
| 20.7 | Mine Closure and Reclamation Plan | 237 | ||||
| 20.7.1 | Financial Commitment for Mine Closure | 238 | ||||
| 20.8 | Recommendations | 238 | ||||
| 21 | Capital and Operating Costs | 239 | ||||
| 21.1 | Capital Cost Estimate | 239 | ||||
| 21.1.1 | Basis of Estimate | 240 | ||||
| 21.1.2 | Exclusions | 241 | ||||
| 21.1.3 | Sustaining Capital | 242 | ||||
| 21.2 | Operating Cost Estimate | 242 | ||||
| 21.2.1 | Labour | 244 | ||||
| 21.2.2 | Power | 245 | ||||
| 21.2.3 | Reagents | 245 | ||||
| 21.3 | Author’s Opinion | 245 | ||||
| 22 | Economic Analysis | 246 | ||||
| 22.1 | Reconciliation with Previous Scoping Study | 247 | ||||
| 22.2 | Sensitivity Analysis | 248 | ||||
| 23 | Adjacent Properties | 251 | ||||
| 24 | Other Relevant Data and Information | 252 | ||||
| 24.1 | Project Execution Plan | 252 | ||||
| 24.2 | Project Risks and Opportunities | 253 | ||||
| 24.2.1 | Risks | 253 | ||||
| 24.2.2 | Opportunities | 254 | ||||
| 25 | Interpretation and Conclusion | 255 | ||||
| 25.1 | Geology and Resources | 255 | ||||
| 25.1.1 | Geology | 255 | ||||
| 25.1.2 | Mineral Resource Estimates | 255 | ||||
| 25.2 | Mining | 255 | ||||
| 25.3 | Metallurgy and Processing | 255 | ||||
| 25.4 | Infrastructure and Water Management | 256 | ||||
| 25.5 | Market Studies | 256 | ||||
| 25.6 | Project Costs and Financial Evaluation | 257 | ||||
| 25.6.1 | Capital Costs | 257 | ||||
| 25.6.2 | Operating Costs | 257 | ||||
| Revision: 0 – 14-Aug-2026 | |
| B198-D01-02054-RT-0010 | Page x |
| NAL Expansion FS Mineral Reserve Pre-Feasibility Study NI 43-101 Final Report Prepared for Elevra |
|
| 25.6.3 | Project Economics | 257 | ||||
| 26 | Recommendations | 259 | ||||
| 26.1 | Geology and Resources | 259 | ||||
| 26.2 | Mining and Reserves | 259 | ||||
| 26.3 | Metallurgy and Processing | 260 | ||||
| 26.4 | Waste and Water Management | 260 | ||||
| 26.5 | Project Costs and Financial Evaluation | 261 | ||||
| 27 | References | 262 | ||||
| 28 | Qualified Persons | 266 | ||||
| Revision: 0 – 14-Aug-2026 | |
| B198-D01-02054-RT-0010 | Page xi |
| NAL Expansion FS Mineral Reserve Pre-Feasibility Study NI 43-101 Final Report Prepared for Elevra |
|
List of Tables
| Table 1-1: North American Lithium – Mineral Resource Estimates (0.60% Li2O cut-off grade for the RPEEE pit and 0.70% Li2O cut-off grade for the underground domain) | 5 | |
| Table 1-2: North American Lithium – Mineral Reserves Estimate, as at of June 30, 2026 | 6 | |
| Table 1-3: NAL Physicals by Phase | 7 | |
| Table 1-4: General Process Design Criteria | 11 | |
| Table 1-5: Capital Costs Summary ($M CAD) | 17 | |
| Table 1-6: Sustaining Capital Summary | 17 | |
| Table 1-7: Total OPEX Summary | 17 | |
| Table 1-8: Main financial assumptions and results summary for the NAL Expansion Project | 18 | |
| Table 1-9: Project Economics | 18 | |
| Table 1-10: Expansion Scenarios - Previous Scoping Study and Present PFS | 19 | |
| Table 1-11: Expansion NPV8% Contribution - Staging/Throughput and Price Li2O. | 19 | |
| Table 1-12: Mineral Reserves PFS Recommendations | 22 | |
| Table 2-1: Chapters Responsibility | 24 | |
| Table 2-2: List of Abbreviations and Units of Measurement | 28 | |
| Table 4-1: Mining Titles List and Details | 37 | |
| Table 4-2: NAL Public Land Leases | 39 | |
| Table 6-1: Summary of Ownership and Historic Activities | 47 | |
| Table 6-2: Mine Production Statistics | 50 | |
| Table 7-1: Geological Units | 53 | |
| Table 7-2: Pegmatite Types in the Property | 58 | |
| Table 7-3: Mineralogical Zoning of PEG1 Type Pegmatites (as Intersected in Core from Top to Bottom) | 58 | |
| Table 10-1: Summary of CLC Drillholes | 66 | |
| Table 10-2: Summary of North American Lithium Corp Holes | 68 | |
| Table 10-3: Summary of Sayona Drillholes Completed in 2023 and 2024 | 69 | |
| Table 10-4: Summary of Canadian Lithium Corp. Core Logging Procedures | 70 | |
| Table 10-5: Summary of North American Lithium Corp. Core Logging Procedures | 71 | |
| Table 10-6: Summary of Sayona Core Logging Procedures | 71 | |
| Table 11-1: Summary of CLC Sample Preparation Methods | 73 | |
| Table 11-2: Summary of North American Lithium Corp. Sample Preparation Methods | 74 | |
| Table 11-3: Summary of Sayona Sample Preparation Methods | 75 | |
| Table 12-1: Geological Intervals Inspected During Site Visit | 82 | |
| Table 13-1: Example Mineralogy of NAL Host Rock Types | 86 | |
| Table 13-2: Example Assays of NAL Host Rock Types | 87 | |
| Table 13-3: Assays of Ore Samples Tested | 91 | |
| Table 13-4: Overview of Feed Samples Tested | 91 | |
| Table 13-5: Final Spodumene Concentrate Grade (3-Stages of Cleaning) | 93 | |
| Table 13-6: Assays of the Pegmatite and Host Rock Samples | 93 | |
| Table 13-7: Mineralogy of the Pegmatite and Host Rock Samples | 94 | |
| Table 13-8: Blended Ore Assays | 94 | |
| Table 13-9: Reagent Dosages for Optimized Tests | 94 | |
| Table 13-10: Final Spodumene Concentrate Assays | 95 | |
| Table 13-11: Composite Sample Assays of the Pegmatite and Host Rock Samples | 97 | |
| Table 13-12: Mineralogy of the Pegmatite and Host Rock Samples | 97 |
| Revision: 0 – 14-Aug-2026 | |
| B198-D01-02054-RT-0010 | Page xii |
| NAL Expansion FS Mineral Reserve Pre-Feasibility Study NI 43-101 Final Report Prepared for Elevra |
|
| Table 13-13: Blended Feed Assays | 98 | |
| Table 13-14: Variability Sample Description | 98 | |
| Table 13-15: NAL Variability Sample Assays: Pegmatite and Host Rock | 99 | |
| Table 13-16: NAL Variability Sample Mineralogy: Pegmatite and Host Rock | 99 | |
| Table 13-17: NAL Blended Variability Sample Assays | 99 | |
| Table 13-18: Spodumene Concentrate Assays | 102 | |
| Table 13-19: Variability Conditions | 102 | |
| Table 13-20: Final Spodumene Concentrate Assays | 103 | |
| Table 13-21: Testwork Conditions | 104 | |
| Table 14-1: Drilling Data used in the Geological Model and Mineral Resource Estimate | 107 | |
| Table 14-2: Bulk Density Values Employed for the Mineral Resource Estimate | 114 | |
| Table 14-3: Variogram Parameters used for All Pegmatite Domains | 115 | |
| Table 14-4: Search Ellipsoids | 116 | |
| Table 14-5: Block Model Parameters used in Leapfrog Edge™ | 116 | |
| Table 14-6: Summary of the Suggested Parameters from the KNA Analysis | 117 | |
| Table 14-7: Summary of Parameters used for Li2O Grade Interpolation | 117 | |
| Table 14-8: Reasonable Extraction Factors | 121 | |
| Table 14-9: NAL Mineral Resource Estimate – June 6, 2025 | 122 | |
| Table 14-10: Cut-Off Sensitivity Analysis (Open Pit Portion) | 123 | |
| Table 14-11: Iron Content used for Mineral Resource Estimate | 124 | |
| Table 15-1: NAL Reserves estimate as of June 30th, 2026 | 125 | |
| Table 15-2: Block Model Parameters | 126 | |
| Table 15-3: Block Model Prototype | 126 | |
| Table 15-4: Open Pit Optimization Slope Angles | 128 | |
| Table 15-5: Open Pit Optimization Parameters | 130 | |
| Table 15-6: Ultimate Pit Design Parameters | 131 | |
| Table 16-1: Open Pit Optimization Parameters | 134 | |
| Table 16-2: Open Pit Optimization Slope Angles | 136 | |
| Table 16-3: Pit Optimization Results | 136 | |
| Table 16-4: Block Model Parameters | 139 | |
| Table 16-5: Block Model Prototype | 139 | |
| Table 16-6: Material Properties | 139 | |
| Table 16-7: Ultimate Pit Design Parameters | 139 | |
| Table 16-8: Haul Road Design Criteria | 140 | |
| Table 16-9: Cut-Off Grade Calculation Parameters | 147 | |
| Table 16-10: Material Quantities by Phase | 147 | |
| Table 16-11: NAL LOM Production Plan and Material Movement | 164 | |
| Table 16-12: Key Dates | 172 | |
| Table 16-13 Standard Blast Patterns | 173 | |
| Table 16-14: Trucking Assumptions by Excavator | 174 | |
| Table 16-15: Caterpillar 777G Truck Specifications | 174 | |
| Table 16-16: Haul Road Segment Speed Restrictions | 174 | |
| Table 16-17: Ramp Speed Restrictions | 174 | |
| Table 16-18: Corner Speed Restrictions | 175 | |
| Table 16-19: Mining Equipment Description and Maximum Number of Units | 177 |
| Revision: 0 – 14-Aug-2026 | |
| B198-D01-02054-RT-0010 | Page xiii |
| NAL Expansion FS Mineral Reserve Pre-Feasibility Study NI 43-101 Final Report Prepared for Elevra |
|
| Table 17-1: HPGR Trade-off MCA Score Summary | 179 | |
| Table 17-2: General Process Design Criteria | 180 | |
| Table 18-1: Design Criteria Based on the Tailings Generation Rate | 192 | |
| Table 18-2: TSF-2 and TSF-3 | 200 | |
| Table 18-3: Design Criteria for TSFs Water Management | 201 | |
| Table 18-4: Technical Challenges of the Proposed TSF Design | 201 | |
| Table 18-5: Technical Recommendations and Further Actions | 202 | |
| Table 18-6: Results of the Stability Analyses for the Proposed Retaining Structure | 206 | |
| Table 18-7: Results of the Stability Analyses of the Proposed Lortie Lake Dyke | 209 | |
| Table 18-8: Risks associated with the Lortie Lake dyke and recommended works | 211 | |
| Table 19-1: Forecast Sale Prices (USD/t, real 2025) | 218 | |
| Table 20-1: Provincial and Federal Acts and Regulations | 235 | |
| Table 20-2: New Water Management Infrastructure | 237 | |
| Table 20-3: Total Cost of Closure Plan | 238 | |
| Table 21-1: Capital Costs Summary by Major Area ($M CAD) | 239 | |
| Table 21-2: Summarised Basis of Estimate | 240 | |
| Table 21-3: Sustaining Capital Summary | 242 | |
| Table 21-4: Total OPEX Summary | 243 | |
| Table 21-5: Staff and Hourly Count (Sayona Employees) | 244 | |
| Table 22-1: Main Financial Assumptions and Results Summary for the NAL Expansion Project | 246 | |
| Table 22-2: Project Economics | 246 | |
| Table 22-3: Expansion Scenarios - Previous Scoping Study and Present PFS | 247 | |
| Table 22-4: Expansion NPV8% contribution - Staging/Throughput and Price Li2O. | 247 | |
| Table 24-1: Project Risks | 253 | |
| Table 24-2: Project Opportunities | 254 | |
| Table 25-1: Main financial assumptions and results summary for the NAL Expansion Project | 257 | |
| Table 25-2: Project Economics | 258 |
| Revision: 0 – 14-Aug-2026 | |
| B198-D01-02054-RT-0010 | Page xiv |
| NAL Expansion FS Mineral Reserve Pre-Feasibility Study NI 43-101 Final Report Prepared for Elevra |
|
List of Figures
| Figure 1-1: NAL Property Location | 3 | |
| Figure 1-2: Multiple Exposure of Pegmatite Dykes in the Pit (Face Looking West) | 5 | |
| Figure 1-3: NAL Final Pit Design | 6 | |
| Figure 1-4: Cross Section Through Final Pit Design and Geological Model | 7 | |
| Figure 1-5: Annual Ore Processing | 9 | |
| Figure 1-6: Annual Quantities by Phase | 9 | |
| Figure 1-7: Simplified Overall Block Flow Diagram | 12 | |
| Figure 1-8: Plan View of the proposed Retaining Structure | 14 | |
| Figure 1-9: Plan View of the proposed Lortie Lake dyke | 14 | |
| Figure 1-10: Lithium Market Balance Forecast 2027 – 2040 | 16 | |
| Figure 1-11: Lithium Product Historical and Forecast Pricing (Base Case) | 16 | |
| Figure 1-12: Indicative Timeline | 20 | |
| Figure 2-1: View of the Phase 1 Open Pit Operations | 26 | |
| Figure 2-2: View of the Phase 2 Open Pit Operations | 26 | |
| Figure 2-3: View of the Phase 3 Open Pit Operations | 26 | |
| Figure 4-1: Property Overview Map | 33 | |
| Figure 4-2: NAL Regional Property Location | 34 | |
| Figure 4-3: NAL Property Location | 35 | |
| Figure 4-4: NAL Mineral Titles | 36 | |
| Figure 5-1: General Arrangement of Existing and Planned Infrastructure at the Mine Site | 42 | |
| Figure 5-2: View Looking North-Westerly Across the Plant and Mine Site | 43 | |
| Figure 5-3: View Looking South-Easterly Showing the Plant Facilities in the Foreground of the Tailings Impoundment Area | 44 | |
| Figure 5-4: Val D’or Weather Normals (Source: climat.meteo.gc.ca) | 45 | |
| Figure 6-1: Québec Lithium Project Open Pit Mine Operations at Peak in 2014 | 51 | |
| Figure 7-1: Stratigraphy of NAL Property | 54 | |
| Figure 7-2: Local Geology of NAL Property | 55 | |
| Figure 7-3: Geology of NAL Property, Centred on the Currently Interpreted Mineralized System | 56 | |
| Figure 7-4: NE – SW Geological Cross-Section of Mineralized System | 57 | |
| Figure 7-5: Coarse-Grained Pegmatite Dyke in Hole NAL-16-16 | 59 | |
| Figure 7-6: Spodumene Megacrystals Perpendicular to PEG2 Contact Zone in Hole QL-S09-026 | 59 | |
| Figure 7-7: Preferential Orientation of Spodumene Crystals in Hole NAL-16-024 | 59 | |
| Figure 7-8: Multiple Exposure of Pegmatite Dykes in the pit (Face Looking West) | 60 | |
| Figure 7-9: Coarse to Fine-Grained Spodumene Mineralization in Hole NAL-16-024 | 61 | |
| Figure 7-10: Pegmatite Dyke Zoning and Alteration in Hole NAL-16-036 | 61 | |
| Figure 8-1: Chemical Evolution of Lithium-Rich Pegmatites | 62 | |
| Figure 8-2: History of La Motte and La Corne Plutons | 63 | |
| Figure 10-1: Property Map Showing Location of Drillholes Incorporated Within the Mineral Resource Estimate | 67 | |
| Figure 10-2: Infill and Extension Drilling Program (Late 2016) | 68 | |
| Figure 10-3: Core Logging Facilities at RNC Exploration Office in Amos (35 km from Site) | 72 | |
| Figure 10-4: Core Storage Sheds and Facilities at the NAL Mine Site | 72 | |
| Figure 12-1: View of the Open Pit Visited During the Site Tour | 79 | |
| Figure 12-2: Core Storage Facility at the Project Site | 80 |
| Revision: 0 – 14-Aug-2026 | |
| B198-D01-02054-RT-0010 | Page xv |
| NAL Expansion FS Mineral Reserve Pre-Feasibility Study NI 43-101 Final Report Prepared for Elevra |
|
| Figure 12-3: Core Review at the Core Storage Facility | 81 | |
| Figure 13-1: Monthly Spodumene Concentrate Production | 84 | |
| Figure 13-2: Concentrate Grade and Lithium Recovery (Monthly Averages) | 85 | |
| Figure 13-3: Ore Sorting Test Program Material (Pegmatite Upper Left, Granodiorite Upper Right, Basalt Lower) | 88 | |
| Figure 13-4: Example Images of Sorted Products | 88 | |
| Figure 13-5: Magnetic and Non-Magnetic Fractions from Test Conducted at 8,000 Gauss | 89 | |
| Figure 13-6: Iron Rejection and Li Loss to Magnetic Concentrate for Pegmatite with 10% Granodiorite (Left) and 10% Basalt (Right) | 90 | |
| Figure 13-7: Optimized Flotation Test Results | 90 | |
| Figure 13-8: Grade – Recovery Curves | 92 | |
| Figure 13-9: Fe2O3 vs. Li2O in the Concentrate | 92 | |
| Figure 13-10: Grade – Recovery Curves | 95 | |
| Figure 13-11: Comparison of WHIMS Performance with Basalt vs. Granodiorite Host Rock | 96 | |
| Figure 13-12: Composite Samples – Effect of Grind Size | 100 | |
| Figure 13-13: Effect of Collector (FA-2) Dosage on Flotation Performance | 101 | |
| Figure 13-14: Example of the Impact of Dilution on Flotation Performance | 101 | |
| Figure 13-15: Example of the Impact of Dilution on Flotation Performance | 102 | |
| Figure 13-16: Testwork Analysis: Grade-Recovery Correlation | 103 | |
| Figure 13-17: 2023 DFS Testwork Grade-Recovery Curve | 104 | |
| Figure 13-18: Li2O Grade Recovery Curve including NAL Quarterly Performance | 105 | |
| Figure 14-1: Area of Mineral Resource Estimate, Showing Mineralized Zone Locations at Elevation 350m 106 Figure 14-2: Plan View Showing Pegmatite Dykes and Drillhole Locations | 108 | |
| Figure 14-3: Three-Dimensional Interpretation of Pegmatite Domains | 109 | |
| Figure 14-4: Lithology Model for Volcanics, Granodiorite and Gabbro | 110 | |
| Figure 14-5: Historical Mining Voids Adjusted to Fit Pegmatite Domains, Shown with Semi-Transparent Pegmatite Domains | 111 | |
| Figure 14-6 – Distribution of the Length Before (Left) and After (Right) Compositing | 112 | |
| Figure 14-7: Capping Analysis on All Dykes; Capping at 3.0% Li2O | 113 | |
| Figure 14-8: Variography Study in Supervisor (Example from Dyke A) | 115 | |
| Figure 14-9: Cross-Section Looking West | 118 | |
| Figure 14-10: Swath Plot for Mineralized Pegmatite Dyke A – Direction X | 119 | |
| Figure 14-11: Swath Plot for Mineralized Pegmatite Dyke A – Direction Y | 119 | |
| Figure 14-12: Classification Distribution on a Longitudinal Section of One Pegmatite Dyke, Looking Northeast | 120 | |
| Figure 15-1: Starting Topographic Surface and Dig Solids | 127 | |
| Figure 15-2: Geotechnical Regions | 128 | |
| Figure 15-3: Pit Optimization Results | 130 | |
| Figure 15-4: Final Pit – Plan View | 132 | |
| Figure 15-5: Final Pit – Isometric View | 132 | |
| Figure 16-1: NAL Final Pit Design | 133 | |
| Figure 16-2: Geotechnical Regions | 135 | |
| Figure 16-3: Pit Optimization Results | 137 | |
| Figure 16-4: Underground Solids with Phases 4 to 8 (Phases 1 to 3 Removed) | 138 | |
| Figure 16-5: Single-Lane in-Pit Haul Ramp Design | 141 | |
| Figure 16-6: Dual-Lane in-Pit Haul Ramp Design | 141 |
| Revision: 0 – 14-Aug-2026 | |
| B198-D01-02054-RT-0010 | Page xvi |
| NAL Expansion FS Mineral Reserve Pre-Feasibility Study NI 43-101 Final Report Prepared for Elevra |
|
| Figure 16-7: Final Pit – Plan View | 142 | |
| Figure 16-8: Final Pit – Isometric View. | 143 | |
| Figure 16-9: Final Pit Cross Section with Resource Block Model | 144 | |
| Figure 16-10: Material Flow Diagram | 145 | |
| Figure 16-11: Isometric View of Starting Position as of May 1st, 2026 | 149 | |
| Figure 16-12: Isometric View of Pit with Phase 3B Removed | 149 | |
| Figure 16-13: Isometric View of Pit with Phases 3B to 3F Removed | 150 | |
| Figure 16-14: Isometric View of Pit with Phases 3B to 4A Removed | 150 | |
| Figure 16-15: Isometric View of Pit with Phases 3B to 4B Removed | 151 | |
| Figure 16-16: Isometric View of Pit with Phases 3B to 4F Removed | 151 | |
| Figure 16-17: Isometric View of Pit with Phases 3B to 5A Removed | 152 | |
| Figure 16-18: Isometric View of Pit with Phases 3B to 5B Removed | 152 | |
| Figure 16-19: Isometric View of Pit with Phases 3B to 5C Removed | 153 | |
| Figure 16-20: Isometric View of Pit with Phases 3B to 5D Removed | 153 | |
| Figure 16-21: Isometric View of Pit with Phases 3B to 5F Removed | 154 | |
| Figure 16-22: Isometric View of Pit with Phases 3B to 6A Removed | 154 | |
| Figure 16-23: Isometric View of Pit with Phases 3B to 6F Removed | 155 | |
| Figure 16-24: Isometric View of Pit with Phases 3B to 7A Removed | 155 | |
| Figure 16-25: Isometric View of Pit with Phases 3B to 7F Removed | 156 | |
| Figure 16-26: Isometric View of Pit with Phases 3B to 8F Removed (Ultimate Pit) | 156 | |
| Figure 16-27: Lortie Lake Location | 157 | |
| Figure 16-28: Waste Dump and Tailings Storage Facility Locations | 159 | |
| Figure 16-29: Annual Processed Tonnes and Li2O Grade | 163 | |
| Figure 16-30: NAL Ore Mining Summary | 165 | |
| Figure 16-31: NAL Total Movements | 165 | |
| Figure 16-32: Conceptual Isometric View of Mine as of 1st May 2026 | 166 | |
| Figure 16-33: Conceptual Isometric View of Mine as of 1st July 2026 | 166 | |
| Figure 16-34: Conceptual Isometric View of Mine as of 1st July 2028 | 167 | |
| Figure 16-35: Conceptual Isometric View of Mine as of 1st July 2030 | 167 | |
| Figure 16-36: Conceptual Isometric View of Mine as of 1st July 2032 | 168 | |
| Figure 16-37: Conceptual Isometric View of Mine as of 1st July 2034 | 168 | |
| Figure 16-38: Conceptual Isometric View of Mine as of 1st July 2036 | 169 | |
| Figure 16-39: Conceptual Isometric View of Mine as of 1st July 2038 | 169 | |
| Figure 16-40: Conceptual Isometric View of Mine as of 1st July 2040 | 170 | |
| Figure 16-41: Conceptual Isometric View of Mine as of 1st July 2042 | 170 | |
| Figure 16-42: Conceptual Isometric View of Mine as of 1st July 2044 | 171 | |
| Figure 16-43: Conceptual Isometric View of Mine as of 1st October 2045 (end of mining) | 171 | |
| Figure 16-44: Section View of Mining Method | 173 | |
| Figure 16-45: Haulage Modelling Results | 175 | |
| Figure 16-46: Haulage Network | 176 | |
| Figure 17-1: Simplified Block Flow Diagram | 181 | |
| Figure 17-2: Simplified Process Flow Diagram | 182 | |
| Figure 18-1: Preliminary Layout – Expansion | 189 | |
| Figure 18-2: Plan view – Preliminary Mine Waste Storage Facilities Locations | 193 | |
| Figure 18-3: TSF-2 Final configuration Layout | 195 |
| Revision: 0 – 14-Aug-2026 | |
| B198-D01-02054-RT-0010 | Page xvii |
| NAL Expansion FS Mineral Reserve Pre-Feasibility Study NI 43-101 Final Report Prepared for Elevra |
|
| Figure 18-4: TSF-3 Final configuration Layout | 196 | |
| Figure 18-5: Revised location of Bassin B5 once WR#4 encroach on the Bassin B5 | 197 | |
| Figure 18-6: Typical Cross Section of Peripheral Embankment | 199 | |
| Figure 18-7: Plan View of the proposed Retaining Structure | 204 | |
| Figure 18-8: Typical Cross-Section AA’ of the Proposed Retaining Structure shown on Figure 18-7 | 205 | |
| Figure 18-9: Plan view of the proposed Lortie Lake dyke | 207 | |
| Figure 18-10: Typical section BB’ of the proposed dyke identified on Figure 18-9 | 208 | |
| Figure 18-11: Plan View of the Lortie Lake Emergency Spillway | 210 | |
| Figure 18-12: Sedimentation basin WR#4 | 213 | |
| Figure 18-13: Conceptual design of the Pit Sedimentation basin | 213 | |
| Figure 18-14: Flow Diagram at NAL Facility – Current Operating Conditions | 214 | |
| Figure 18-15: Flow Diagram at NAL Site - Projected Operating Conditions | 215 | |
| Figure 19-1: Lithium Market Balance Forecast 2027 – 2040 | 219 | |
| Figure 19-2: Lithium Product Price Actuals and Forecast 2026 – 2040 | 220 | |
| Figure 20-1: Location of Lakes Around NAL Operations | 225 | |
| Figure 20-2: Provincial and Regional Routes Around NAL Operations | 230 | |
| Figure 22-1: Sensitivity Analysis on NPV8% | 249 | |
| Figure 22-2: Sensitivity Analysis on NPV8% Expansion Only (difference of Expansion and Base Cases) | 250 | |
| Figure 24-1: Indicative timeline for the NAL Expansion Project | 252 |
| Revision: 0 – 14-Aug-2026 | |
| B198-D01-02054-RT-0010 | Page xviii |
| NAL Expansion FS Mineral Reserve Pre-Feasibility Study NI 43-101 Final Report Prepared for Elevra |
|
| 1 | Executive Summary |
| 1.1 | Introduction |
This Mineral Reserves Pre-Feasibility Study (PFS) National Instrument (NI 43-101) Technical Report was prepared at the request of Elevra Lithium Limited (Elevra). The purpose of this NI 43-101 Report is to provide an update to the mineral reserves estimates for the expansion of the North American Lithium (NAL) mine. Elevra serves as the registrant of this NI 43-101-compliant Report. The statement is based on information provided by Sayona Québec and reviewed by various professionals and Qualified Persons (QP).
The information in this Report related to Mineral Resources is based on, and fairly represents, information compiled by the QPs as of the effective date of the Report. Qualified persons who contributed to the drafting of this Report meet the definition of QPs, consistent with the requirements of the NI 43-101 Code. All QPs are independent of the issuer.
This Report provides information from previous reports as context to support the expansion assessment against a base case scenario. The economic analysis presented in this Report was undertaken on the Mineral Reserves as of May 1st, 2026. The Mineral Reserves are based on measured and indicated mineral resources only. Inferred mineral resources have not been considered in the analysis as these are considered too geologically speculative to have mining and economic considerations applied to them.
The North American Lithium (“NAL”) property is wholly owned and operated by Sayona Québec Inc. (“Sayona Québec”), with Elevra owning 100% of Sayona Québec following the merger between Sayona Mining Limited (“Sayona”) and Piedmont Lithium Inc. The NAL property is considered material to Elevra.
The NAL mine site was established in 2012 and has operated during a number of campaigns based on fluctuating commodity pricing. The plant was most recently restarted in 2022 and following a period of ramp up and process optimisation, Elevra now proposes to increase production through a three-stage approach as follows:
| ● | Stage 1: An initial 15-20% increase in annual spodumene concentrate production above current production levels commencing in mid-CY27 with an incremental reduction in unit operating costs. This increase is within the current limits of the milling permit set at 4,500 tpd. |
| ● | Stage 2: A subsequent expansion of downstream milling, flotation and filtration capacity to 6,500 tpd. The incremental feed material will be processed using a temporary mobile crushing circuit operating in conjunction with the existing crushing circuit. The further expanded production is expected to commence early CY28, with an additional incremental reduction in unit operating costs; and |
| ● | Stage 3: The replacement of the temporary mobile crushing circuit and the existing crushing circuit with a new crushing circuit capable of meeting feed requirements for a LOM average production of 373ktpa post-expansion. This final step will include additional ore sorting capacity and is expected to be completed in early CY29 delivering crushing cost efficiencies which are required to meet the anticipated LOM cost reduction. |
Sedgman Novopro Projects Inc. (Sedgman Novopro) was engaged by Elevra in Q1 2026 to complete the Mineral Reserves PFS for major plant and infrastructure expansions to increase spodumene concentrate production at the NAL operation. This Report was prepared as a collaborative effort between Sedgman Novopro, Optimal Mining Pty Ltd (Optimal Mining), BBA, Measured Group Pty Ltd (Measured Group), and Englobe Corp. (Englobe).
| Revision: 0 – 14-Aug-2026 B198-D01-02054-RT-0010 |
Page 1 |
| NAL Expansion FS Mineral Reserve Pre-Feasibility Study NI 43-101 Final Report Prepared for Elevra |
|
| 1.2 | Forward Looking Notice |
Sections of the Report contain estimates, projections and conclusions that are forward-looking information within the meaning of applicable Canadian securities laws. Such statements and information involve known and unknown risks, uncertainties and other factors that may cause the actual results, performance or achievements of Elevra, its project, or industry results, to be materially different from any future results, performance or achievements expressed or implied by such forward-looking statements or information. Such statements can be identified by the use of words such as “may,” “would,” “could”, “will,” “intend,” “expect,” “believe,” “plan,” “anticipate,” “estimate,” “scheduled,” “forecast,” “predict” and other similar terminology, or state that certain actions, events or results “may,” “could,” “would,” “might” or “will” be taken, occur or be achieved. These statements reflect Elevra’s current expectations regarding future events, performance and results and speak only as of the date of this Report.
Mineral Resources that are not Mineral Reserves do not have demonstrated economic viability. There is no certainty that any Mineral Resources will be converted into Mineral Reserves. The estimation of Mineral Resources is inherently uncertain and involves subjective judgments about many relevant factors. Assumptions and interpretations underlying resource estimates may change over time as new information becomes available.
Forward-looking statements are based upon the responsible QPs opinion at the time that they are made but, in most cases, involve significant risk and uncertainty. Although the responsible QP has attempted to identify factors that could cause actual events or results to differ materially from those described in this Report, there may be other factors that cause events or results to not be as anticipated, estimated, or projected. None of the QPs undertake any obligation to update any forward-looking information. There can be no assurance that forward-looking information in any section of the Report will prove to be accurate in such statements or information.
Accordingly, readers should not place undue reliance on forward-looking information.
IMPORTANT NOTICE
This document is not for filing or distribution in the US.
| 1.3 | Background |
Sayona Québec acquired the North American Lithium Inc. mine and concentrator in La Corne, Québec, in August 2021. The operation, which had been placed on care and maintenance in 2019, and has been restarted since Fall 2022, includes an open pit hard rock mine, exploiting lithium-bearing pegmatite dykes, with mineral processing and lithium carbonate production facilities.
This Report has been prepared at the request of Elevra, the registrant, to present the results of the Mineral Reserves PFS of a NAL expansion.
The Project’s property (the “Property”) has seen historic production from an underground mine (1950s-1960s) with production of spodumene concentrate and lithium chemicals. More recently the mine and concentrator operated under Québec Lithium (2013-2014) and North American Lithium (2017-2019). Since acquisition on August 26th, 2021, Elevra Lithium has resumed open-pit mining and restarted concentrator operations, producing spodumene concentrate since Q1-2023.
| Revision: 0 – 14-Aug-2026 B198-D01-02054-RT-0010 |
Page 2 |
| NAL Expansion FS Mineral Reserve Pre-Feasibility Study NI 43-101 Final Report Prepared for Elevra |
|
| 1.4 | Property Description |
The NAL Expansion Project properties (the “Properties”) are situated in the La Corne Township in the Abitibi-Témiscamingue region in the Province of Québec, Canada (Figure 1-1). The Project is located approximately 38 km southeast of Amos, 15 km west of Barraute and 60 km north of Val-d’Or in the Province of Québec, Canada. The Project is approximately 550 km north of Montréal and is serviced by road, rail, and air.
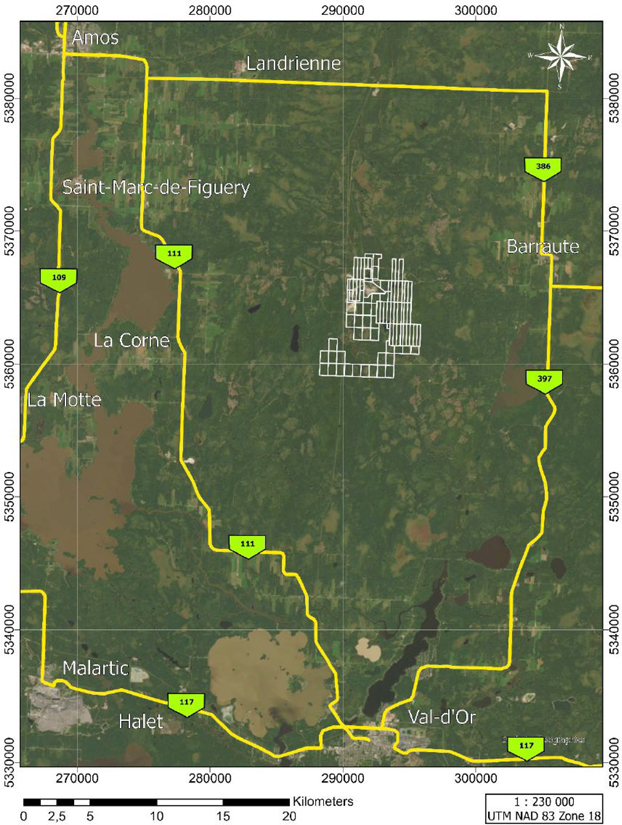
Figure 1-1: NAL Property Location
| Revision: 0 – 14-Aug-2026 B198-D01-02054-RT-0010 |
Page 3 |
| NAL Expansion FS Mineral Reserve Pre-Feasibility Study NI 43-101 Final Report Prepared for Elevra |
|
| 1.5 | Accessibility, Climate and Local Resources |
The town of Val-d’Or, with a population of approximately 32,750 residents (Canadian Census, 2021), is located 60 km south of the Property, along the provincial Highway 111. Since Val-d’Or was founded in the 1920s, it has been a mining service centre. Val-d’Or is one of the largest communities in the Abitibi region and has all major services, including an airport with scheduled service from Montréal. Val-d’Or is a 6-hour drive from Montréal, and there are daily bus services between Montréal and the other cities and towns in the Abitibi region. The town of Amos, with a population of approximately 12,675 residents (Canadian Census, 2021), is located approximately 38 km northwest of the NAL site. Amos is served by highways 109, 111, and 395 and the Amos/Magny airport.
The site is accessible by provincial Highway 111, connecting Val-d’Or and Amos, or alternatively by provincial Highway 397, connecting Val-d’Or and Barraute. An all-weather secondary road, known as Route du Lithium, connecting the site to the Val-d’Or – Amos highway, which was used to traverse the Property and which constrained pit operations, has now been relocated to avoid the mining area. The site is also accessible from Mont-Vidéo, through an all-weather road that connects further east to the Val-d’Or – Barraute highway. Canadian National (CN) railway line is about 49 km east of the Property, connecting east through to Montréal and west to the North American rail network. A high-voltage power line (120 kV) passes approximately 2 km to the west of the Property and a 25 kV electric line, running along the Route du Lithium, services the Mont-Vidéo ski and recreation area
The Val-d’Or area experiences a subarctic continental sub-humid climate, characterized by short, cool summers and long, cold winters. The climatic conditions at the Property do not significantly impede the Project or hinder exploration or mining activities, beyond seasonal consideration for certain works (e.g., drilling muskeg swamps during winter freeze).
| 1.6 | History |
There is a significant history of exploration and mining activities on the Property including underground mining operations dating back to the 1950s. Sayona Québec acquired the NAL project in August 2021. A Prefeasibility Study (PFS) was completed in May 2022 for the restart of mining and concentrator operations. Significant process plant upgrades were implemented to ensure production of high-quality chemical-grade spodumene concentrate at nameplate capacity. Operation of the concentrator commenced in March 2023, with first spodumene concentrate sold in August 2023. The mine is a currently operating spodumene producer.
| 1.7 | Geology and Mineralization |
Results of past mineral exploration, resource evaluation and mining demonstrate that NAL is an extensively mineralised lithium system. The primary metal is lithium, and it is mainly associated with spodumene, a lithium bearing pyroxene.
North American Lithium’s pegmatite dykes occupy an area spanning 3,550 m along strike, 1,300 m in width and 800 m in depth. A total of 117 spodumene-bearing pegmatite dykes each with thicknesses greater than 2 m and up to 70 m are open at depth and have been identified in the NAL geological model shown in Figure 1-2.
Individual spodumene-bearing pegmatite dykes are relatively continuous where exposed over long distances and across several benches in NAL pit. Spodumene-bearing pegmatite dykes vary in width from tens of centimetres, up to 70 m and are interpreted to extend for several hundred meters in length. Most pegmatite dykes greater than 3 m in width are spodumene-bearing.
| Revision: 0 – 14-Aug-2026 B198-D01-02054-RT-0010 |
Page 4 |
| NAL Expansion FS Mineral Reserve Pre-Feasibility Study NI 43-101 Final Report Prepared for Elevra |
|
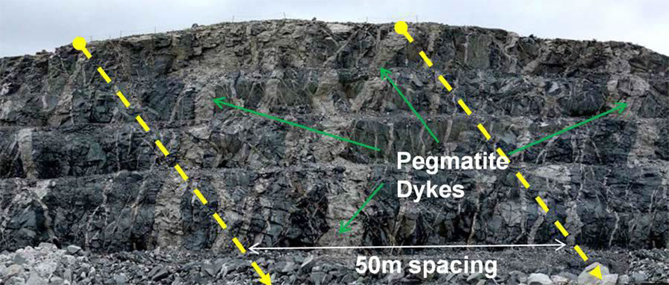
Figure 1-2: Multiple Exposure of Pegmatite Dykes in the Pit (Face Looking West)
The Project database used in the Mineral Resource estimate includes drillhole and sample information collected from the 2009, 2010, 2011, 2016, 2019, 2023 and 2024 as well as sample information collected from historical drill core during 2022.
The Project database comprises 923 surface-collared and 652 underground-collared diamond drillholes with a cumulative length of 221,404 m. A subset of 562 drillholes totalling 153,047 m were used to create the Mineral Resource estimate.
Quality assurance and quality control (“QA/QC”) procedures that conform to current industry standards were developed and implemented for all the drilling and sampling programs.
| 1.8 | Mineral Resource Estimate |
The project database contains data from 1,575 diamond drillholes surfaces and underground collared, spanning a total of 27,183 records of Li2O assays with a mean sample length of approximately 0.884 m. Li2O grade varies from 0.000% to 5.318%. Global average Li2O grade for raw samples (excluding 0.00% assays) is 0.783%. From this database, a subset of 562 surface collared drillholes totalling 153,047m was used for the Mineral Resource estimate.
The current Mineral Resource Estimate is presented in Table 1-1 below. The Mineral Resource estimate was prepared by Qualified Persons in accordance with the NI 43-101 Code.
Table 1-1: North American Lithium – Mineral Resource Estimates (0.60% Li2O cut-off grade for the RPEEE pit and 0.70% Li2O cut-off grade for the underground domain)
| Resource Classification | Method | Tonnes (Mt) | Li2O Grade (%) | Cut-Off Grade (%) |
| Indicated | Open Pit | 74.46.2 | 1.17 | 0.60 |
| Inferred | Open Pit | 8.6 | 1.13 | 0.60 |
| Indicated | Underground | - | - | - |
| Inferred | Underground | 10.3 | 1.01 | 0.70 |
| Total | 93.3 | 1.15 |
The information on Mineral Resources and Ore Reserves is extracted from the announcement entitled “2026 Annual Report” published on the ASX on August 28th, 2026, and is available to view on the Elevra’s website on the ASX Increases” published on the ASX on August 27th, 2025, and is available to view on Elevra’s website on the ASX.
| Revision: 0 – 14-Aug-2026 B198-D01-02054-RT-0010 |
Page 5 |
| NAL Expansion FS Mineral Reserve Pre-Feasibility Study NI 43-101 Final Report Prepared for Elevra |
|
The company confirms that it is not aware of any new information or data that materially affects the information included in the original market announcement and, in the case of estimates of Mineral Resources, that all material assumptions and technical parameters underpinning the estimates in the relevant market announcement continue to apply and have not materially changed. The company confirms that the form and context in which the Qualified Person’s findings are presented have not been materially modified from the original market announcement.
| 1.9 | Mineral Reserve Estimate |
The NAL Mineral Reserve estimate has been prepared using accepted industry practice and in accordance with NI 43-101 reporting standards, by Mr Tony O’Connell who is an employee of Optimal Mining Solutions Pty Ltd, an independent mining consultancy based in Brisbane, Australia.
The North American Lithium Mineral Reserves have been estimated for a total of 47.2Mt of Proven and Probable Mineral Reserves at an average grade of 1.12% Li2O, which is comprised of 0.2Mt of Proven Mineral Reserves at an average grade of 0.93% Li2O and 47.0Mt of Probable Mineral Reserves at an average grade of 1.12% Li2O, as shown in Table 1-2 below.
Table 1-2: North American Lithium – Mineral Reserves Estimate, as at of June 30, 2026
| Resource Classification | Tonnes (Mt) |
Li2O Grade (%) |
Cut-Off Grade (%) |
Fe Grade (%) |
| Proved Mineral Reserves | 0.2 | 0.93 | 0.60 | 1.48 |
| Probable Mineral Reserves | 47.0 | 1.12 | 0.60 | 0.81 |
| Total | 47.2 | 1.12 | 0.60 | 0.81 |
| 1.10 | Mining Methods |
The NAL final pit design, as shown in Figure 1-3, was based on a pit optimisation assessment which determined the economic limits of the deposit.
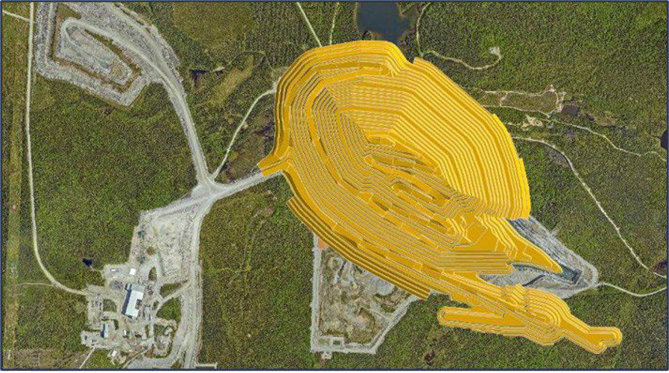
Figure 1-3: NAL Final Pit Design
| Revision: 0 – 14-Aug-2026 B198-D01-02054-RT-0010 |
Page 6 |
| NAL Expansion FS Mineral Reserve Pre-Feasibility Study NI 43-101 Final Report Prepared for Elevra |
|
The final pit was designed with one main haul road servicing the entire pit for the life of the mine. The decision to utilise one main haul road was chosen based on reducing the strip ratio, pit shell disturbance area and operating cost for the operation. The main haul road has been designed on the hanging wall side of the deposit to maximize ore recovery within the pit shell and to provide access for the final mining pushback. A secondary haul road has been designed along the south-west limit of the pit to access phase 8, one of the last phases to be mined.
Figure 1-4 shows a cross section through the final pit design and the geological model, with the modelled Li2O-containing pegmatites clearly visible.
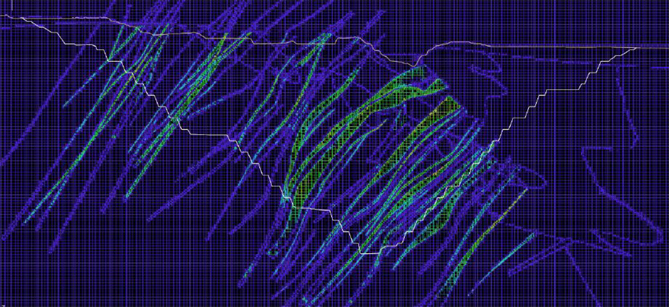
Figure 1-4: Cross Section Through Final Pit Design and Geological Model
A series of six mining phases, numbered 3 through 8 inclusive, were developed including the ultimate pit design. Special attention was given to the historical underground openings when setting the physical limits for every phase. Consideration was taken to ensure that the phase walls did not intersect the old workings. The following criteria was applied during the phase design construction:
| ● | Minimum mining width of 60m considered between phases on the surface and 40m at the phase base. |
| ● | Ease of access to different mining areas. |
| ● | Mining and processing production rate. |
| ● | Physical constraints posed by historical underground workings. |
The phase-by-phase quantities and qualities are summarised in Table 1-3.
Table 1-3: NAL Physicals by Phase
| Item | Units | Total | Phase 3 | Phase 4 | Phase 5 | Phase 6 | Phase 7 | Phase 8 |
| Total In-Pit | (dMt) | 385.2 | 30.0 | 54.8 | 56.5 | 48.0 | 180.8 | 15.1 |
| Waste Rock | (dMt) | 337.9 | 24.8 | 47.4 | 50.4 | 41.1 | 160.9 | 13.3 |
| ROM Ore | (dMt) | 47.3 | 5.2 | 7.4 | 6.2 | 6.9 | 19.9 | 1.8 |
| Lithium Grade | (% Li2O) | 1.12% | 1.15% | 1.08% | 1.06% | 1.24% | 1.11% | 1.03% |
| Iron Grade | (% Fe) | 0.81% | 0.89% | 0.89% | 0.86% | 0.72% | 0.79% | 0.73% |
| Strip Ratio | (t waste : t ore) | 7.1 | 4.8 | 6.4 | 8.2 | 6.0 | 8.1 | 7.4 |
| Revision: 0 – 14-Aug-2026 B198-D01-02054-RT-0010 |
Page 7 |
| NAL Expansion FS Mineral Reserve Pre-Feasibility Study NI 43-101 Final Report Prepared for Elevra |
|
Each of the phases was then subdivided into sub-phases to allow for a more detailed progressive development of the operation. The sub-phases developed were:
| ● | Phase 3 | - 3B and 3F, |
| ● | Phase 4 | - 4A, 4B and 4F, |
| ● | Phase 5 | - 5A, 5B, 5C, 5D and 5F, |
| ● | Phase 6 | - 6A and 6F, |
| ● | Phase 7 | - 7A and 7F, |
| ● | Phase 8 | - 8F. |
A life-of-mine schedule was developed for the PFS using Micromine’s Spry software package. The schedule utilised two stages of capital investment which gradually increased the processing production rate up to 6,500 tonnes per day. The dates and subsequent increase in processing rate are summarised below:
| ● | Initial production rate | - 3,780 tonnes per day |
| ● | Stage 1 | - 4,500 tonnes per day from 1st July 2027 |
| ● | Stage 2 | - 6,500 tonnes per day from 1st April 2028 |
Additionally, an ore sorting circuit came online on 1st July 2029 with a throughput of 1.1mt per annum.
The life-of-mine schedule utilized similar class equipment that is currently operating at site, with a larger 200t-class excavator added to the fleet to assist with maintaining the required stripping quantities.
The key highlights of the LOM plan are summarized below:
| ● | Mine life of approximately 19 years – from May 2026 to September 2045, |
| ● | Total of 47.3mt of ore mined. |
| ● | Total of 337.9mt of waste mined, leading to an overall strip ratio of 7.14:1, which fluctuates over the years. |
| ● | 17.7mt of ore sent to the ore sorting circuit at an average grade of 0.96% Li2O and 1.00% Fe. |
| ● | 14.4mt of product from the ore sorter at an average grade of 1.08% Li2O and 0.69% Fe. |
| ● | 44.0mt of ore sent to the processing plant at an average grade of 1.17% Li2O and 0.66% Fe. |
The annual ore tonnes and ROM Li2O feed grade are shown in Figure 1-5. Annual movements from each of the phases across the life-of-mine is shown in Figure 1-6.
| Revision: 0 – 14-Aug-2026 B198-D01-02054-RT-0010 |
Page 8 |
| NAL Expansion FS Mineral Reserve Pre-Feasibility Study NI 43-101 Final Report Prepared for Elevra |
|
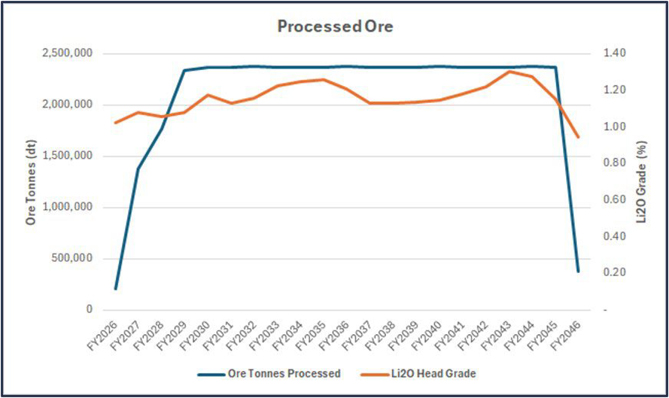
Figure 1-5: Annual Ore Processing
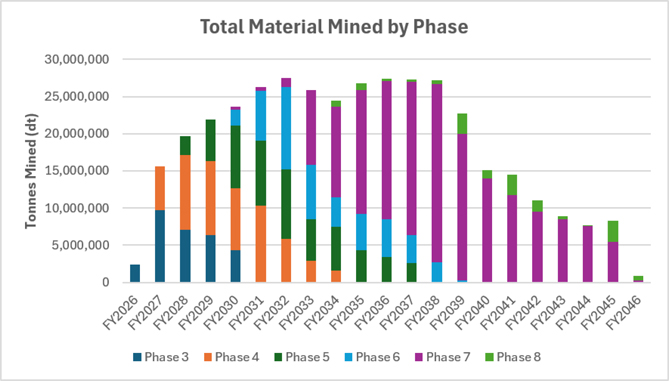
Figure 1-6: Annual Quantities by Phase
The difference between the Mineral Reserve estimate and the total quantities mined in the Expansion Feasibility Study is due to the differing start dates. The Expansion Feasibility Study commences on 1st May, 2026, however the Mineral Reserves are declared at the slightly later date of June 30th, 2026. The Expansion Feasibility Study mines a total of 47.3mt from the pit, whereas the Mineral Reserve Estimate (pit only) is 47.0mt.
| Revision: 0 – 14-Aug-2026 B198-D01-02054-RT-0010 |
Page 9 |
| NAL Expansion FS Mineral Reserve Pre-Feasibility Study NI 43-101 Final Report Prepared for Elevra |
|
| 1.11 | Mineral Processing and Metallurgical Testing |
The NAL deposit has undergone extensive metallurgical test work. Metallurgical recovery assumptions are based on historical metallurgical tests and test work completed during 2018 – 2023. Test work programs began in 2008 to establish the metallurgical character of the orebody, and allow the development of a process flowsheet, testing of that flowsheet, evaluate the impact of head grade on performance and then produce the engineering data for plant design. This test work occurred under the supervision of independent QPs and Sayona representatives.
The test work evaluated a number of processing techniques including flotation, DMS, LIMS and ore sorting. The progression of this test work took the form of batch scale tests looking at flotation, DMS and grindability leading to locked cycle tests flotation tests and then pilot scale continuous tests. WHIMS and DMS were not included in the original flowsheet based on the outcomes of the test work. The test work outcomes formed the design basis of the NAL concentrator that commenced operation in March 2013 but ceased operation in September 2014. This was principally due to higher than anticipated dilution of the ore with host rock, and lower than target spodumene recovery and concentrate grade.
Subsequent test work programs were undertaken to characterise and mitigate the effect of the dilution including hardness testing and WHIMS test work (on both plant samples and pegmatite samples of varying levels of dilution of the two major dilution host rocks). The impact of the WHIMS on flotation was also examined, and the final spodumene flotation concentrate was 6% Li2O at an estimated test work recovery of 80 to 83%.
Historical metallurgical test work from the above-described previous phases, along with current operational performance has been used as the basis for the NAL expansion Mineral Reserves PFS. The following programs are nearing completion:
| ● | Geometallurgical program based on Life of mine sample selection to provide additional data on ore behaviour throughout the mine life. |
| ● | XRT ore sorting testwork. |
Based on the previous laboratory test work and current operational performance, an average global recovery of 71.2% at a spodumene concentrate grade of 5.4% Li2O has been applied to the Expansion Case for the purposes of the study.
| 1.12 | Recovery Methods |
The recovery methods for the Project were established based on the existing plant, historical operational data, historical metallurgical testwork, and lessons learned from other spodumene projects. The expansion process design is based on the operational and metallurgical reviews of the past process plant operation and testwork data.
The design developed for the Mineral Reserves PFS captures opportunities which were previously identified during the previous Updated Scoping Study. The work completed established the design basis of the plant, capital costs, and operating costs that were developed in this Mineral Reserves PFS.
The NAL expansion is based on a staged approach to reach authorised processing plant capacities:
| ● | Stage 1: Increase of 15-20% in spodumene concentrate production within the 4,500 tpd permit. |
| ● | Stage 2: Expansion to a new milling throughput limit of 6,500 tpd average annual rate. |
| ● | Stage 3: New crusher circuit (milling capacity unchanged from Stage 2) |
| Revision: 0 – 14-Aug-2026 B198-D01-02054-RT-0010 |
Page 10 |
| NAL Expansion FS Mineral Reserve Pre-Feasibility Study NI 43-101 Final Report Prepared for Elevra |
|
The targeted capacities will be achieved through the following modifications to the existing facility:
| ● | Stage 1: Plant optimization |
– Addition of lump breakers in the ore feed circuit to the plant to prevent ice lumping
– Increased stacksizer capacity to the existing ball mill circuit
– Optimization of the desliming and magnetic separation circuit
– Increased flotation conditioning capacity
– Refurbishment of carbonate filtration unit for new spodumene dewatering and filtration unit
– Replacement of existing thickener with a larger process thickener
– Addition of a flotation thickener circuit to prevent flotation reagent contamination
– Reconfiguration of tailings pumping to TSF
| ● | Stage 2: Plant expansion |
– Contracting of a temporary crusher to balance plant feed with existing crusher
– Addition of a second rod mill and ball mill line circuit including stacksizers
– Addition of a trash screen to remove oversize (+1mm) material before magnetic separation
– Addition of a third magnetic separation line to match increase throughput
– Addition of a new rougher unit and conversion of the existing rougher to scavenger duty
| ● | Stage 3: New crusher construction |
– Construction of new crusher to handle target throughput
– Construction of new fine covered ore stockpile complete with reclaim and conveyors
– Conversion of the existing crusher circuit to an ore sorting facility
The key design criteria for the various stages of the expansion are summarized in Table 1-4 below. The design will be based on the existing mine and facility, the lithium recovery anticipated is 71.20% and is based on improvements to current plant performance of 69.00% recovery. The recovery is also based on a plant feed Li2O grades presented below and a target concentrate Li2O grades of 5.40%. The financial model considers a LOM average annual 5.4% Li2O concentrate production rate of 348 ktpa (or 373 ktpa post expansion). These rates are superior to the process design criteria due to the production rate being dependant on the plant feed grade; the financial model considers a 1.17% feed grade. The process design is based on lower grades but supports the rates used in the financial model.
Table 1-4: General Process Design Criteria
| Criterion | Unit | Base Case | Stage 1 | Stage 2 | Stage 3 |
| Crushing Plant Availability | % | 65 | 65 | 65 | 65 |
| Processing Plant Availability | % | 90 | 90 | 90 | 90 |
| Total ROM Crusher Feed | tpd | 5,815 | 6,646 | 10,000 | 10,000 |
| Total Processing Plant Feed | tpd | 3,780 | 4,320 | 6,500 | 6,500 |
| Plant Feed Li2O Grade | % | 1.01 | 1.095 | 1.080 | 1.080 |
| Target Concentrate Li2O grade | % | 5.40 | 5.40 | 5.40 | 5.40 |
| Target Concentrate Production | tpa | 178,058 | 213,670 | 338,000 | 338,000 |
| Concentrate P80 | mm | 0.200 | 0.232 | 0.200 | 0.200 |
The recovery benefits will come from the following flowsheet improvements:
| ● | Improved flotation feed sizing due to increased classification capacity and mill power. |
| ● | Improved magnetic separation circuit (LIMS and WHIMS) |
| ● | Improved flotation conditioning |
| ● | Improved rougher flotation control and flexibility |
| ● | Improved cleaner tails handling |
| Revision: 0 – 14-Aug-2026 B198-D01-02054-RT-0010 |
Page 11 |
| NAL Expansion FS Mineral Reserve Pre-Feasibility Study NI 43-101 Final Report Prepared for Elevra |
|
These improvements targeting specific areas will lead to recovery gradually increasing through the staged approach with the full benefits achieved by Stage 2 with all optimisations captured.
The expansion is scheduled to produce an annual average rate of 6,500 tpd of blended ore. The existing crusher, ore sorting, new crusher and ore storage areas are designed to operate with an availability of 65%. The processing plant, including the grinding, classification, desliming, magnetic separation, flotation and dewatering units, is designed to operate at 90% availability. The processing plant will operate on a 24-hour per day and 7 days per week basis.
The expansion block flow is given below in Figure 1-7.
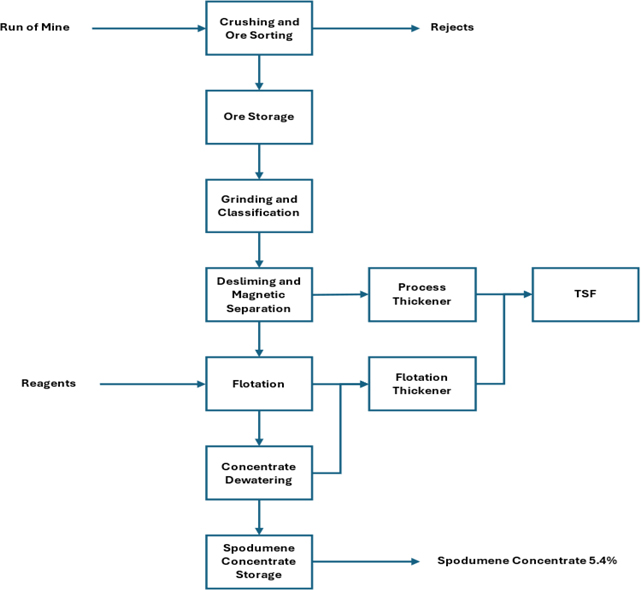
Figure 1-7: Simplified Overall Block Flow Diagram
| Revision: 0 – 14-Aug-2026 B198-D01-02054-RT-0010 |
Page 12 |
| NAL Expansion FS Mineral Reserve Pre-Feasibility Study NI 43-101 Final Report Prepared for Elevra |
|
| 1.13 | Project Infrastructure |
Site infrastructure at the NAL operation is established and operating. Additional infrastructure is required to the meet the requirements of the expansion, which includes:
| ● | An expansion of the open pit and associated water management infrastructure |
| ● | Pit sedimentation basin |
| ● | New crushing and ore sorting circuit including crushed ore dome |
| ● | New grinding, magnetic separation and flotation |
| ● | Concentrate dewatering filters |
| ● | Tailings thickeners |
| ● | An extension of the concentrate storage building |
| ● | Additional mechanical workshop, operation room, and supervisor offices |
| ● | Additional tailings management facilities and associated water management infrastructure: |
– TSF-2 (required for base case and expansion)
– TSF-3 (required for base case and expansion)
| ● | An additional waste stockpile area (WR#4) and associated water management infrastructure. |
| ● | Multi-service buildings: |
– Additional offices, engineering, administration etc.
– Additional capacity for the mine change rooms, showers and ablutions
– Additional mine offices and mining dispatch control room
| ● | Mine maintenance shop: |
– Two additional mining service bays
– Additional warehouse storage
– Additional supervisory and administration offices
– Wash bay
| ● | Auxiliary buildings: |
– Warehouse domes
– Relocation of the mine fuel depot and additional capacity. (required for base case and expansion)
The spodumene pegmatite deposit on the Québec Lithium property was mined between 1954 and 1965. At that time, the deposit was developed from a vertical shaft, and the mine tailings were contained within two dikes located north of the former mine, in an east–west-oriented valley between Lortie and Roy lakes. Waste rock was deposited around the perimeter of this storage area, thereby contributing to the containment and retention of the mine tailings.
Following the planned expansion of the current pit, the pit walls will intersect the Québec Lithium tailings storage facility (QL-TSF). As a result, a portion of the tailings currently in place will need to be excavated, leaving part of the remaining tailings without containment.
The proposed retaining structure at the QL-TSF is intended to ensure the stability of the overburden and tailing slope at this location. In addition, the structure will provide long-term containment and retention of the remaining tailings, thereby ensuring the continued integrity and safe management of the QL-TSF during and after pit expansion operations. The proposed retaining structure at QL-TSF is located in the central portion of the tailings storage area, as shown in Figure 1-8.
| Revision: 0 – 14-Aug-2026 B198-D01-02054-RT-0010 |
Page 13 |
| NAL Expansion FS Mineral Reserve Pre-Feasibility Study NI 43-101 Final Report Prepared for Elevra |
|
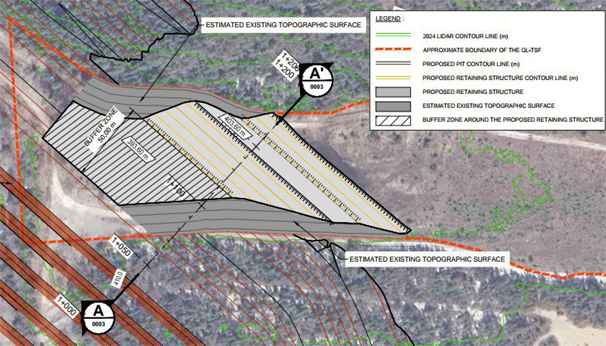
Figure 1-8: Plan View of the proposed Retaining Structure
As part of the open pit expansion, the construction of a dyke at Lortie Lake is being considered to allow the extraction of mineral resources located beneath a portion of the waterbody. This dyke is intended to maintain the water level in the retained section of the lake, notably to limit impacts on fish habitat, while ensuring safe conditions for mining operations. The dyke will be located in the northern portion of Lortie Lake, north of the projected pit as shown Figure 1-9.
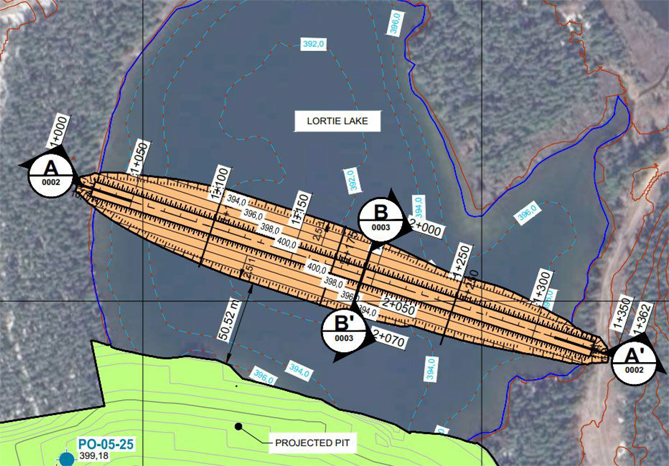
Figure 1-9: Plan View of the proposed Lortie Lake dyke
| Revision: 0 – 14-Aug-2026 B198-D01-02054-RT-0010 |
Page 14 |
| NAL Expansion FS Mineral Reserve Pre-Feasibility Study NI 43-101 Final Report Prepared for Elevra |
|
| 1.14 | Environmental Studies, Permitting and Social or Community Impact |
The expansion projects are to proceed in stages to reflect the permitting requirements for each stage:
| 1. | Permitting Stage 1.0 – reaching a 15-20% increase in the plant’s capacity under the limit of 4,500 tpd, to be carried out in accordance with current regulations. |
| 2. | Permitting Stage 2.0 - increasing the plant’s capacity to 6,500 tpd (’‘Milling capacity’’). This includes infrastructure for Tailings Storage Facility TSF no.2. |
| 3. | Permitting Stage 3.0 - expansion of the mine pit for Phases 6 through 8. (’‘Pit expansion’’). This includes tailings Storage facility TSF no. 3 and Waste Rock Pile HS no.4 |
Since the restart of operation in 2023, the site is staffed with a complete environmental team that ensures compliance with regulatory procedures and monitors social environmental activities at the site. The NAL project has existing environmental permits for mining operations including the disposal of waste rock, storage of tailings, water supply from open pit and tailings and final release of treated water to the environment. Permitting required for Stage 2.0 are currently in the application process and will be obtained in the coming months. For example, TSF-2 authorizations will soon be submitted to provincial authorities to obtain ministerial approval under section 22 of the Environment Quality Act (Q-2). Elevra received final approval for Waste Rock Pile #2 (HS) for several years of production.
Regarding the plant’s capacity expansion, the project will be submitted in three main phases to the government authorities for permitting based on the addition of various equipment. It should be noted that the plant capacity expansion to 6500 tpd will be made within the current building’s footprint. The Government of Quebec guidelines regarding permitting requirements for capacity increase are subject to the standard authorization process under Section 22 of the Environment Quality Act, as long as the plant’s capacity increase does not exceed 50% and is limited to 6,500 tons per day. Regarding federal authorities, Elevra has also received confirmation that the increase in the plant’s capacity is not subject to the environmental assessment process under the Physical Activities Regulations (SOR/2019-285), provided that the total infrastructure, including the plant’s capacity, remains within a 50% increase.
The expansion of the mining pit will affect Lortie Lake by partially impacting the aquatic environment and fish habitat. The Regulation respecting the environmental impact assessment and review of certain projects (Q-2, r. 23.1) specifies in Section 2.2 of Schedule 2 that any project affecting an area greater than 15,000 m² of a lake or river must be submitted to the environmental assessment process, including a public hearing by the Bureau d’Audiences Publiques sur l’Environnement (BAPE). The pit expansion involves draining an area of several hectares of the lake, thereby triggering the provincial process for BAPE hearings. Accordingly, the Ministry of the Environment, Climate Change, Wildlife, and Parks (MELCCFP) has confirmed that the project will be subject to the provincial environmental impact assessment process. This assessment will require that the planned new mining infrastructure—TSF#3 and HS#4— be evaluated alongside the pit expansion.
For its part, the Department of Fisheries and Oceans Canada (DFO) will require that the impacts of mining activities on the fish habitat in Lortie Lake be offset by an approved habitat compensation project. Consultation will be undertaken with First Nations for the design of the compensation project(s). The new mining infrastructure (TSF & HS) could take place within a fish habitat, which would require registration under Appendix II of the Metal and Diamond Mining Effluent Regulations (SOR/2002-222). To do so, Elevra will need to demonstrate that the chosen solution was selected in accordance with the Guidelines for the Assessment of Alternatives for Mine Waste Disposal, as required by the Department of Fisheries and Oceans (DFO).
The extension of mineral resources under Lortie Lake will require the approval from the MRNF for the conversion of this lease area to a mining lease. The MRNF will require an update to the Closure and Rehabilitation Plan and the update of the approval by the MELCCFP. The BAPE process will provide the necessary decree to obtain the permits required for the conversion of the area to a mining lease.
| Revision: 0 – 14-Aug-2026 B198-D01-02054-RT-0010 |
Page 15 |
| NAL Expansion FS Mineral Reserve Pre-Feasibility Study NI 43-101 Final Report Prepared for Elevra |
|
| 1.15 | Market Studies and Contracts |
Global lithium supply is expected to increase materially in 2026, despite the pricing pressure seen through much of 2025. Supply is forecast to rise by around 250 kt LCE year-on-year, or approximately 15%, including recycling. Despite strong supply growth, the market is still expected to remain in deficit in 2026, as robust demand growth, particularly from electric vehicles and energy storage systems, continues to outpace new supply. By 2027, the surplus remains modest at less than 1% of total market size, pointing to a market that is close to balance. As a result, prices are forecast to experience upward pressure over 2026 and 2027. Figure 1-9 shows the market balance forecast between 2027 and 2040. Historical and base case forecast lithium product sale prices from the BMI Q1 2026 report are shown in Figure 1-10.
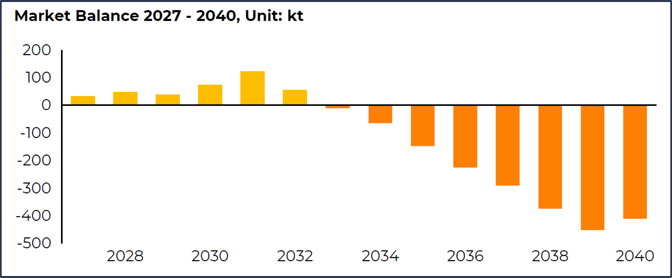
Figure 1-10: Lithium Market Balance Forecast 2027 – 2040
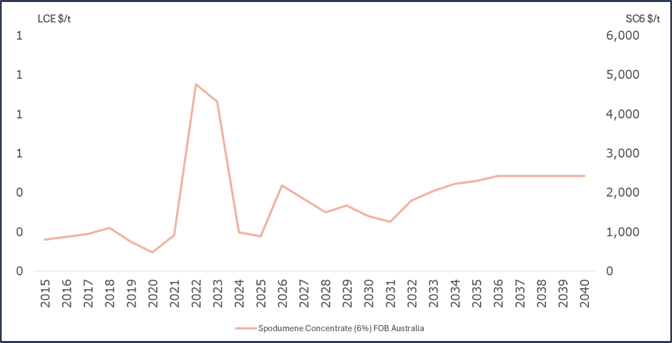
Figure 1-11: Lithium Product Historical and Forecast Pricing (Base Case)
The scoping study utilises BMI Q1 2026 base case price scenario. In the short-term, prices for 6% spodumene concentrate (SC6) are forecast to fluctuate between US$2,181/t (2026) and US$1,260/t (2031), with an average price of US$1,664 per tonne realized up to 2032. The long-term price after 2035 is US$2,430/t.
| Revision: 0 – 14-Aug-2026 B198-D01-02054-RT-0010 |
Page 16 |
| NAL Expansion FS Mineral Reserve Pre-Feasibility Study NI 43-101 Final Report Prepared for Elevra |
|
| 1.16 | Capital Cost and Operating Cost Estimates |
The total estimated initial capital cost for AACE Class 4 of the Expansion Project is estimated at $366.1 M. These costs are stated in constant dollars as of Q1 2026. A breakdown of the capital expenditures is shown in Table 1-5. All costs in Canadian dollar (CAD$, CAD or $).
Table 1-5: Capital Costs Summary ($M CAD)
| Area |
Stage 1 ($M CAD) |
Stage 2 ($M CAD) |
Stage 3 ($M CAD) |
Total Cost ($M CAD) |
| Mechanical Direct | $14.3 | $19.8 | $22.9 | $56.9 |
| Other Disciplines Direct | $41.9 | $38.9 | $80.9 | $161.8 |
| Indirect Costs | $17.0 | $22.2 | $35.0 | $74.1 |
| Total Before Contingency | $73.2 | $80.9 | $138.7 | $292.8 |
| Contingency P50 (30%) | $18.3 | $20.2 | $34.7 | $73.2 |
| Total | $91.5 | $101.1 | $173.4 | $366.1 |
Sustaining expenditures (SUSEX) for the base case and expansion project was estimated using current operational budgets and factors of direct plant cost. Tailings SUSEX costs were derived using previous estimates and quantities applied over preliminary facility designs. The Expansion case includes additional sustaining costs for additional equipment which are offset by the shorter mine life of this scenario.
The existing crushing circuit will be repurposed into an ore sorting facility following the Stage 2 expansion. This change increases sustaining capital compared to the previous scoping study.
Table 1-6: Sustaining Capital Summary
| Area | Base $M CAD | Expansion $M CAD |
| Tailings | $357.7 | $357.7 |
| Stay in Business Capital (SIBC) | $105.4 | $120.9 |
| Mining | $22.9 | $22.9 |
| Compensation | $25.6 | $25.6 |
| Total | $511.7 | $527.1 |
The operating expenditures (OPEX) was developed in accordance with the requirement of an Updated Scoping level study with a nominal accuracy range of ± 20%. The level of estimation is supported by actual operational information including salaries, consumables, maintenance costs and established contracts and therefore are more precise given this is a brownfield project.
The OPEX results represent annual steady state operations therefore no escalation or inflation is included within the estimate. A summary of the average LOM OPEX costs (all values in CAD$) and comparison between scenarios can be found in Table 1-7. OPEX costs are evaluated commencing as of Fiscal Year 2027.
Table 1-7: Total OPEX Summary
| Item | Units | Base | Stage 1 | Stage 2 | Stage 3 |
| LOM | Yrs | 35 | 20 | ||
| Milling rate | Mt/yr | 1.4 | 1.6 | 2.4 | 2.4 |
| Mining Cost (ore and waste) | CAD$/t mined | 8.6 | 7.9 | ||
| Processing cost | CAD$/t milled | 42.6 | 38.7 | 37.5 | 34.2 |
| G&A | CAD$/yr | 23.6 | 24.6 | 28.3 | 29.9 |
| Transport cost | CAD$/t dry conc. | 142.4 | 133.8 | 118.6 | 118.6 |
| Total OPEX | CAD$M | 7,086 | 5,949 | ||
| C1 Cost Concentrate | CAD$/t dry conc. | 1,048 | 876 | ||
| Revision: 0 – 14-Aug-2026 B198-D01-02054-RT-0010 |
Page 17 |
| NAL Expansion FS Mineral Reserve Pre-Feasibility Study NI 43-101 Final Report Prepared for Elevra |
|
| 1.17 | Economic Analysis |
The main highlights of the Project’s financial analysis are presented in Table 1-8 and Table 1-9. Financial Analysis was performed commencing as of Fiscal Year 2027.
Table 1-8: Main financial assumptions and results summary for the NAL Expansion Project
| Parameters | Unit | Base | Expansion |
| Average Price 6% Li2O | USD$/t | $2,260 | $2,137 |
| Life of mine (from FY2027) | yrs | 35 | 20 |
| Total Waste | Mt | 336 | 336 |
| Total Ore | Mt | 47 | 44 |
| Strip Ratio | - | 7.1 | 7.1 |
| Average Annual ROM | Mt/y | 1.36 | 2.41 |
| Average Feed Grade | % Li2O | 1.12% | 1.17% |
| LOM 5.4% Li2O Produced | Mt | 6.77 | 6.79 |
| LOM Average Annual 5.4% Li2O | kt/y | 196 | 348 |
| Average Annual 5.4% Li2O production (post expansion) | kt/y | 199 | 373 |
Notes:
| ● | Total ore value for the expansion case is lower than the base case due to ore sorting. |
Table 1-9: Project Economics
| Project Economics | Unit | Base | Expansion |
| Exchange Rate | CAD/USD | 1.35 | 1.35 |
| Mining Cost (ore and waste) | C$/t mined | 8.60 | 7.91 |
| Process cost | C$/t milled | 42.57 | 34.81 |
| G&A | C$/t milled | 17.31 | 13.05 |
| Transport Cost | C$/t conc | 142.37 | 119.81 |
| Total OPEX | C$M | 7,086 | 5,949 |
| LOM C1 Cost Concentrate | C$/t conc | 1,048 | 876 |
| LOM AISC | C$/t conc | 1,126 | 954 |
| LOM C1 Cost of Concentrate (post expansion) | C$/t conc | 1,045 | 851 |
| LOM AISC (post expansion) | C$/t conc | 1,112 | 918 |
| Total SUSEX | C$M | 512 | 527 |
| Total initial CAPEX | C$M | - | 366 |
| Net Cash Flow (pre-tax) | C$M | 10,297 | 10,822 |
| NPV8% (pre-tax) | C$M | 3,193 | 4,655 |
| NPV8%Expansion Only (pre-tax) | C$M | - | 1,462 |
| IRR Expansion (pre-tax) | % | - | 58.3% |
| Payback (pre-tax) | Months | - | 29 |
| Net Cash Flow (post-tax) | C$M | 7,471 | 7,307 |
| NPV8% (post-tax) | C$M | 2,274 | 3,218 |
| NPV8% Expansion Only (post-tax) | C$M | - | 943 |
| IRR Expansion (post-tax) | % | - | 49.9% |
| Payback (post-tax) | Month | - | 34 |
Notes:
| ● | All costs and sales are presented in constant 2026 CAD, with no inflation or escalation factors considered. |
| ● | $M = millions of dollars. |
| ● | The financial analysis was performed on existing Mineral Reserves as outlined in this report. |
| ● | The valuation calculations are unlevered. |
| ● | The average metallurgical recovery over the LOM is 71.2% for the expansion and 69.2% for the base case due to improvement in the flowsheet attributable to wet high-intensity magnetic separator (WHIMS) improvements. |
| ● | Plant availability is calculated at 90%. |
| ● | Tonnes of concentrate are presented as dry metric tonnes. |
| ● | An exchange rate of 1.35 CAD/USD was fixed over the LOM for the Project. |
| ● | The average 6% Li2O concentrate (SC6) price is based on a market analysis from Benchmark Mineral Intelligence for Q1 2026 as described in the market section and varies over the LOM from US$1,260/t to US$2,430/t. |
| Revision: 0 – 14-Aug-2026 B198-D01-02054-RT-0010 |
Page 18 |
| NAL Expansion FS Mineral Reserve Pre-Feasibility Study NI 43-101 Final Report Prepared for Elevra |
|
| ● | Average LOM SC6 pricing may vary between the cases due to longer mine life at the long term US$2,430 price for the base case (2036 and beyond). |
| ● | A discount rate of 8% was used for the base case and expansion scenarios. |
| ● | Net Cash Flow and valuation calculations include investment tax credit on CAPEX. |
| ● | The numbers have been rounded. Any discrepancy in the totals is due to rounding effects. |
The motivation of the revisions in this prefeasibility study from the previously published scoping study, is to reduce risk in the project execution by staging integration of new infrastructure, bring forward production increase and adjust the throughput. Indirectly the price of Spodumene is updated to ensure the pertinence of the study in the reality of the commodity price, the table below compares the previous scoping study expansion scenario to the current prefeasibility study (PFS).
Table 1-10: Expansion Scenarios - Previous Scoping Study and Present PFS
| Parameters | Unit | Previous Scoping | Present PFS | Variance % |
| Exchange Rate | CAD/USD | 1.35 | 1.35 | - |
| LOM | Years | 24 | 20 | -16.7% |
| Average Price 6% Li2O | USD$/t | 1,392 | 2,137 | 53.5% |
| Mining Cost (ore and waste) | C$/t mined | 7.60 | 7.91 | 4.1% |
| Process Cost | C$/t milled | 35.4 | 34.8 | -1.7% |
| G&A | C$/t milled | 13.4 | 13.1 | -2.2% |
| Transport Cost | C$/t conc | 123.8 | 119.6 | -3.4% |
| Total OPEX | C$M | 6,062 | 5,949 | -1.9% |
| LOM C1 Cost Concentrate | C$/t conc | 877 | 876 | -0.1% |
| LOM AISC | C$/t conc | 952 | 954 | 0.2% |
| LOM C1 Cost of Concentrate (post expansion) | C$/t conc | 851 | 851 | 0.0% |
| LOM AISC (post expansion) | C$/t conc | 922 | 918 | -0.4% |
| Total SUSEX | C$M | 517 | 527 | 1.9% |
| Total Initial CAPEX | C$M | 366 | 366 | - |
| Net Cash Flow (pre-tax) | C$M | 4,626 | 10,822 | 133.9% |
| NPV8% (pre-tax) | C$M | 1,798 | 4,655 | 158.9% |
| NPV8% Expansion Only (pre-tax) | C$M | 628 | 1,462 | 132.8% |
| IRR Expansion (pre-tax) | % | 26.4% | 58.3% | 120.8% |
| Payback (pre-tax) | Months | 36 | 29 | -19.4% |
| Net Cash Flow (post-tax) | C$M | 3,249 | 7,307 | 124.9% |
| NPV8% (post-tax) | C$M | 1,284 | 3,218 | 150.6% |
| NPV8% Expansion Only (8%) (post-tax) | C$M | 479 | 943 | 96.9% |
| IRR Expansion (post-tax) | % | 26.4% | 49.9% | 89.0% |
| Payback (post-tax) | Month | 46 | 34 | -26.1% |
To better understand the impact of staging improvements, the staging, operating cost and throughput increase is separated from the changes in price. Table 1-11 shows the contribution of each to the increase in NPV8%the expansion scenario.
Table 1-11: Expansion NPV8% Contribution - Staging/Throughput and Price Li2O.
| Parameters | Unit | Staging / Throughput* | Price Li2O | Total NPV increase |
| NPV8%Expansion Only (pre-tax) | C$M | 409 | 425 | 834 |
| NPV8% Expansion Only (post-tax) | C$M | 227 | 237 | 464 |
*Predominantly staging/throughput in addition to other assumption changes
From the table above, 51 % of the impact in NPV8% post tax increase is predominantly a contribution of the staging and throughput increase while 49% is attributable to the increase in Li2O price from the previous study.
| Revision: 0 – 14-Aug-2026 B198-D01-02054-RT-0010 |
Page 19 |
| NAL Expansion FS Mineral Reserve Pre-Feasibility Study NI 43-101 Final Report Prepared for Elevra |
|
| 1.18 | Project Execution and Risk Assessment |
The project schedule will be based on the project development sequence identified by Elevra. Engineering will continue following the Mineral Reserves PFS; Elevra plans to move directly to detailed engineering to advance Stage 1 and Stage 2 to advance the Project to construction. A preliminary project schedule was developed and is shown in Figure 1-12. Further development and detailed execution planning will be undertaken in the next project phases.
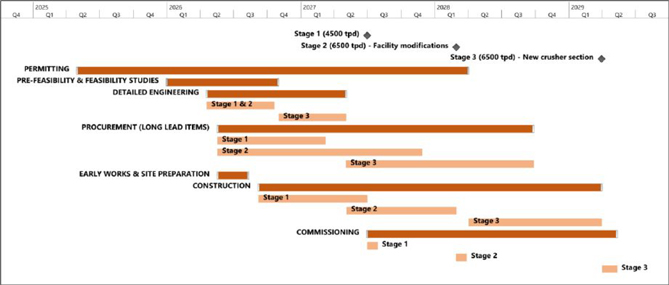
Figure 1-12: Indicative Timeline
A risk assessment workshop was performed during the Mineral Reserves PFS to identify the project risks, determine mitigations measures, and develop a risk register. The key residual risks after mitigation measures have been identified are listed below:
| ● | Environmental impact of temporary crushing circuit due to excessive dust and noise emissions Significant increase in ROM pad traffic due to higher throughput requirements |
| ● | Damage to existing and new equipment during construction |
| ● | Increased chance of fire during construction due to hot work |
| ● | Safety and health concern from release of residue accumulated on equipment from operations during demolition |
| ● | Schedule risk due to difficulties sourcing equipment (same model as in-place, shipping location) |
| ● | Delay to start of detail engineering |
| ● | New permitting required for Increased dump/tailings capacity needed for the expansion |
| ● | Difficulties obtaining permit/approval to drain nearby lake (Lortie Lake) |
| ● | Difficulties obtaining social license in the Project footprint due to previous noise complaints from nearby Lac Legendre community |
| ● | Financing gap is longer than expected. |
| ● | Capital escalation |
These risks will be tracked through the next project phases. The risk register will be updated as the project progresses. As the mitigations identified will be applied in subsequent phases, the likelihood of such risks will diminish or be removed.
| Revision: 0 – 14-Aug-2026 B198-D01-02054-RT-0010 |
Page 20 |
| NAL Expansion FS Mineral Reserve Pre-Feasibility Study NI 43-101 Final Report Prepared for Elevra |
|
There are several opportunities, including the potential for cost reduction opportunities, process recovery enhancements and design improvements.
| ● | Opportunity to reuse the existing color ore sorters if washing can be implemented in both summer and winter effectively. |
| ● | Use of superstacks instead of stacksizers for ball mill classification. Reports by vendor indicate that superstacks are a viable alternative to stacksizers. |
| ● | Further plant capacity expansion in the future due to larger ball mill included in expansion case. This will permit a potential to increase capacity to 8400 tpd in the future without adding further communition capacity. |
| ● | Modularization of equipment packages to reduce costs and reduce reliance on local contractors. |
| ● | Use of prefabricated concrete as an opportunity for cost and schedule benefit. |
| ● | Federal and Provincial government incentives |
These opportunities will be reevaluated in the subsequent phase of the project.
| 1.19 | Interpretations and Conclusions |
The Mineral Reserves PFS demonstrates the potential economic viability of an Expansion of the NAL Operation. The Mineral Reserves PFS expansion design follows the staged approach identified by Elevra to reach the following authorised mill throughputs:
| ● | Stage 1: Increase to the limits of the current milling permit at 4,500 t/d average annual rate. |
| ● | Stage 2: Expansion to a new milling throughput limit of 6,500 t/d average annual rate. |
The NAL Mineral Reserves have been estimated for a total of 47.2Mt of Proven and Probable Mineral Reserves at an average grade of 1.12% Li2O, which is comprised of 0.2Mt of Proven Mineral Reserves at an average grade of 0.93% Li2O and 47.0Mt of Probable Mineral Reserves at an average grade of 1.12% Li2O. The Mineral Reserve estimate is underpinned by a detailed mine plan which includes pit phasing, a dilution model which ensures that potential ROM ore feed respects final product specifications, a detailed LOM schedule, which includes stockpiling, tailings disposal and haulage modelling, that results in a positive cash flow for the Project.
Construction of a dyke at Lortie Lake would allow the extraction of mineral resources located beneath a portion of the waterbody. The dyke would maintain the water level in the retained section of the lake, notably to limit impacts on fish habitat, while ensuring safe conditions for mining operations.
The tailings and water management are based on a strategy of placing conventional spodumene tailings in Tailings Storage Facility 1 (TSF-1) until mid-2029. Additional TSF-2 and TSF-3 are required and have been planned for as part of the Mineral Reserves PFS design. This planning includes site selection, integrated construction with waste rock storage, progressive embankment raises, capital and operating cost estimates. The WMP was updated to manage flows from the expansion scenario. Water management focuses on water diversion, where possible. Water management infrastructure will be phased in as required.
The total estimated initial capital cost for AACE Class 4 of the NAL Expansion Project is estimated at C$ 366,053,000. These costs are stated in constant dollars as of February 2026. Operating costs for the project have been calculated at C$1,048 per tonne of concentrate for base case and C$876 per tonne of concentrate for the expansion scenario.
Analysis of the financial model on the key economic assumptions indicates that the Project is robust in terms of CAPEX and OPEX. The Project is most sensitive to changes in commodity prices, exchange rates, and recoveries.
| Revision: 0 – 14-Aug-2026 B198-D01-02054-RT-0010 |
Page 21 |
| NAL Expansion FS Mineral Reserve Pre-Feasibility Study NI 43-101 Final Report Prepared for Elevra |
|
| 1.20 | Recommendations |
The study’s results demonstrate that the Project is technically feasible and has the potential to be value accretive under the Mineral Reserves PFS case assumptions. Analysis of the results and findings from each major area investigated in this Mineral Reserves PFS suggests several recommendations for further studies.
Table 1-12: Mineral Reserves PFS Recommendations
| Category | Recommendations |
| Geology and Resources |
● Continue resource definition drilling within the conceptual resource pit shell to upgrade remaining Inferred resources to Indicated category and improve geological continuity. ● Continue exploration drilling outside of the conceptual resource pit shell to assess the potential for additional Mineral Resources growth. ● Complete additional bulk density measurements across pegmatite and waste rock to support the calculation of a density regression formula. Apply the regression formula to support more accurate Mineral Resource characterization. ● Complete additional iron analyses for pegmatites and waste rock to support more accurate Mineral Resource characterization. ● Continue detailed geological mapping of exposed pegmatite dykes in open pit faces and incorporate results in a future update of the geological model. ● Regularly review and update Mineral Resource estimation methodology as new drilling data becomes available. Test sensitivity of estimated ore volumes and grades to different data preparation, domaining and Li2O grade estimation methods. ● Reconcile modelled pegmatite domain geometries, volumes and Li2O grades against recent mine production data. |
| Mining and Reserves |
● A fleet selection study should be completed with the results of this study used as the basis for the assessment. The fleet selection study must evaluate the potent mining costs savings which can be realised through the use of larger equipment, without negatively impacting loss and dilution of the ore. ● Focus on the securing of approvals for all aspects of the life-of-mine plan, in particular the HS-4 waste storage area. Gaining of approvals to store waste in the HS-4 facility will provide operating economic benefits due to the closer proximity of HS-4 to the pit compared to other waste storage areas. ● The benefit that backfilling of mined out voids provides should be thoroughly evaluated. Backfilling of mined out voids will provide lower operating costs, reduce the size of the final pit void and reduce the height or size of the out-of-pit dumps. This will only be an option if the surrounding host rock has been drilled sufficiently to ensure that no potentially recoverable ore is sterilised. |
|
Metallurgy and Processing |
● Optimisation testwork on the WHIMS to understand the limitations and set targets for plant operations. |
| Waste and Water Management |
● Advance the detailed geotechnical and hydraulic design of TSF-2 and TSF-3, including centreline embankment configuration, seismic and dam safety criteria, and integration of waste rock into embankment construction, to support the next study phase and permitting. This includes the completion of a site-specific seismic hazard assessment. ● Complete additional geotechnical and hydrogeological investigations, particularly for the TSF-3 footprint and new waste rock storage areas, to reduce key uncertainties and confirm foundation conditions and long-term performance for the expanded mine waste storage system. ● Finalize the design of site water management infrastructure and the associated treatment scheme, ensuring adequate capacity under design storm and freshet events and compliance with applicable provincial and federal water quality requirements. ● Refine the closure and monitoring framework for TSF-1, TSF-2, TSF-3 and waste rock storage areas, including beach reclamation, long-term drainage to spillways, and instrumentation and water quality monitoring programs from operations through post-closure, so that commitments are clearly reflected in the updated closure plan and regulatory approvals. |
Several items mentioned in the previous chapters will reduce costs and improve the financial position of the deposit. The Mineral Reserves PFS CAPEX is on the level of an AACE Class 4, and a Definitive Feasibility Study phase is planned to increase the accuracy of the estimate to a Class 3 and further derisk the Project.
Elevra is planning on moving directly to Detailed Engineering for Stage 1 following the Mineral Reserves PFS to bring the engineering to a level appropriate to meet the construction timelines outlined in this Mineral Reserves PFS. It is recommended to proceed with the DFS and Detailed Engineering as described in the preliminary Project Schedule.
| Revision: 0 – 14-Aug-2026 B198-D01-02054-RT-0010 |
Page 22 |
| NAL Expansion FS Mineral Reserve Pre-Feasibility Study NI 43-101 Final Report Prepared for Elevra |
|
| 2 | Introduction |
| 2.1 | Purpose of the Report |
This Mineral Reserves Pre-Feasibility Study (PFS) National Instrument (NI 43-101) Technical Report (Report) was prepared at the request of Elevra Lithium Limited (Elevra). The purpose of this NI 43-101 Report is to provide a Mineral Reserves PFS for the expansion of the North American Lithium (NAL) mine. Elevra serves as the registrant of this NI 43-101 Report. The statement is based on information provided by Elevra and reviewed by various professionals and qualified persons (QP).
The information in this Report related to Mineral Resources is based on, and fairly represents, information compiled by the QPs as of the effective date of the Report. Qualified persons who contributed to the drafting of this Report meet the definition of QPs, consistent with the requirements of the NI 43-101 Code. All QPs are independent of the issuer.
This Report provides information from previous reports as context to support the expansion assessment against a base case scenario. The economic analysis presented in this Report is based on measured and indicated mineral resources only. Inferred mineral resources have not been considered in the analysis as these are considered too geologically speculative to have mining and economic considerations applied to them.
Sedgman Novopro Pty Ltd (Sedgman Novopro) was engaged by Elevra in Q1 2026 to complete multiple project study phases for major plant and infrastructure expansions to increase spodumene concentrate production at the NAL operation. Ahead of the Mineral Reserves PFS, an Updated Scoping Study was performed by Sedgman Novopro with the collaboration of Optimal Mining Solutions Pty Ltd (Optimal Mining) leading to the publication of a press release by Elevra. The Updated Scoping Study identified process optimizations to deliver the NAL expansion project according to the staging approach detailed by Elevra and provided AACE Class 5 cost estimates.
The Mineral Reserves PFS further develops the process design based on additional surveys conducted by NAL and improves on the accuracy of the cost estimates to AACE Class 4 from major equipment quotes obtained during a request for quotation (RFQ) cycle. This Mineral Reserves PFS Report was prepared as a collaborative effort between Sedgman Novopro, Optimal Mining Pty Ltd (Optimal Mining), BBA, Measured Group Pty Ltd (Measured Group), and Englobe Corp. (Englobe).
| 2.2 | Context |
The North American Lithium (“NAL”) mine site was established in 2012 and has operated during a number of campaigns based on fluctuating commodity pricing. The NAL property is wholly owned and operated by Sayona Québec Inc. (“Sayona Québec”), with Elevra owning 100% of Sayona Québec following the merger between Sayona Mining Limited (“Sayona”) and Piedmont Lithium Inc. The NAL property is considered material to Elevra.
The plant was most recently restarted in 2022 and following a period of ramp up and process optimisation, Elevra now proposes to increase production through a three-stage approach as follows:
| ● | Stage 1: An initial 15-20% increase in annual spodumene concentrate production above current production levels commencing in mid-CY27 with an incremental reduction in unit operating costs. This increase is within the current limits of the milling permit set at 4,500 tpd. |
| ● | Stage 2: A subsequent expansion of downstream milling, flotation and filtration capacity to 6,500 tpd. The incremental feed material will be processed using a temporary mobile crushing circuit operating in conjunction with the existing crushing circuit. The further expanded production is expected to commence early CY28, with an additional incremental reduction in unit operating costs; and |
| Revision: 0 – 14-Aug-2026 B198-D01-02054-RT-0010 |
Page 23 |
| NAL Expansion FS Mineral Reserve Pre-Feasibility Study NI 43-101 Final Report Prepared for Elevra |
|
| ● | Stage 3: The replacement of the temporary mobile crushing circuit and the existing crushing circuit with a new crushing circuit capable of meeting feed requirements for a LOM average production of 373ktpa post-expansion. This final step will include additional ore sorting capacity and is expected to be completed in early CY29 delivering crushing cost efficiencies which are required to meet the anticipated LOM cost reduction. |
| 2.3 | Study Contributors and Report Responsibility |
The following authors have contributed to the study:
| ● | Sedgman Novopro Pty Ltd |
| ● | Optimal Mining Pty Ltd |
| ● | Measured Group Pty Ltd |
| ● | BBA |
| ● | Englobe Corp. |
Table 2-1 presents the owners for each chapter of this Report. The authors of this Report are in good standing with the appropriate professional institutions. The authors have supervised the preparation of this Report and take responsibility for the contents of the Report as set out in Table 2-1. Each author has also contributed relevant figures, tables, and written information for Chapters 1 (Summary),
24 (Other Relevant Data and Information), 25 (Interpretation and Conclusions), 26 (Recommendations), and 27 (References).
Table 2-1: Chapters Responsibility
| No. | Chapter Description | Owners |
| 1 | Summary | Chapter Owners |
| 2 | Introduction | Sedgman Novopro |
| 3 | Reliance on Other Experts | Sedgman Novopro |
| 4 | Property Description and Location | Sedgman Novopro / Elevra |
| 5 | Accessibility, Climate, Local Resources, Infrastructure and Physiography | Sedgman Novopro / Elevra |
| 6 | History | Sedgman Novopro / Elevra |
| 7 | Geology and Mineralization | Optimal Mining |
| 8 | Deposit Types | Optimal Mining |
| 9 | Exploration | Optimal Mining |
| 10 | Drilling | Optimal Mining |
| 11 | Sample Preparation, Analyses and Security | Optimal Mining |
| 12 | Data Verification | Optimal Mining |
| 13 | Mineral Processing and Metallurgical Testing | Sedgman Novopro |
| 14 | Mineral Resource Estimates | Optimal Mining |
| 15 | Mineral Reserve Estimates | Optimal Mining |
| 16 | Mining Methods | Optimal Mining |
| 17 | Recovery Methods | Sedgman Novopro |
| 18 | Project Infrastructure | Sedgman Novopro / Elevra / BBA / Englobe |
| 19 | Market Studies and Contracts | Optimal Mining / Elevra |
| 20 | Environmental Studies, Permitting and Social or Community Impact | Elevra |
| 21 | Capital and Operating Costs | Sedgman Novopro / Elevra |
| 22 | Economic Analysis | Sedgman Novopro / Elevra |
| 23 | Adjacent Properties | Elevra |
| 24 | Other Relevant Data and Information | Sedgman Novopro / Elevra |
| 25 | Interpretation and Conclusions | Chapter Owners |
| 26 | Recommendations | Chapter Owners |
| 27 | References | Chapter Owners |
| Revision: 0 – 14-Aug-2026 B198-D01-02054-RT-0010 |
Page 24 |
| NAL Expansion FS Mineral Reserve Pre-Feasibility Study NI 43-101 Final Report Prepared for Elevra |
|
| 2.4 | Site Visits |
| 2.4.1 | Sedgman Novopro Site Visit |
A site visit was undertaken by Sedgman Novopro experts Benjamin Alliss and Minh Duc Vo from the 9th to the 11th of June 2026, during which time Sedgman Novopro met with key metallurgical and operations management personnel to review the process design developed for the Updated Scoping Study. The work undertaken during the site visit is summarised below:
| ● | Attend the site over a three-day period. |
| ● | Review of the Process Flow Diagrams (PFDs) with key site personnel. |
| ● | Assess physical equipment constraints to further layout and 3D model development. |
| 2.4.2 | BBA Site Visit |
A site visit was undertaken by BBA Tailings and Water Principal Engineers Gerladine Cosset and Eduardo Rodriguez on the 4th of May 2026, during which time BBA staff met with key environmental and operations management personnel after a site visit of existing TSF-1 and future TSF’s location. The work undertaken during the investigation is summarised below:
| ● | Attend the site over a one-day period. |
| ● | Complete a site visit of TSF-1 and associated water infrastructures and future location of TSF-2 and TSF-3. |
| ● | Hold an afternoon workshop with key site personnel to understand current operational challenges and review proposed design. |
| 2.4.3 | Previous Site Visits |
| 2.4.3.1 | Sedgman Novopro Site Visit |
A site visit was undertaken by Sedgman Novopro experts Benjamin Alliss, Robert Simmons and Abbas Mahmoodi from the 29th to the 30th of January 2026, during which time Sedgman Novopro staff met with key metallurgical and operations management personnel before assessing the plant and equipment in operation. The work undertaken during the investigation is summarised below:
| ● | Attend the site over a two-day period. |
| ● | Hold workshops with key site personnel to understand current concerns and operational shortcomings. |
| ● | Review operating data and reports. |
| ● | Assess plant configuration and operation to identify any physical processing constraints and opportunities for improvements, both short term and long term. |
| ● | Review the current proposed optimization/expansion projects to ensure they are suitably addressing the issues at hand. |
| 2.4.3.2 | Optimal Mining Site Visit |
Tony O’Connell of Optimal Mining, QP for several of the chapters, visited the Project and its existing installations between September 10th and 12th 2024 inclusive. The site visit included a field tour of the current operating open pit’s phase 1 operations (Figure 2-1), phase 2 operations (Figure 2-2) and phase 3 operations (Figure 2-3). Extensive discussions were held with management, geologists and engineers of Sayona Quebec during the site visit.
| Revision: 0 – 14-Aug-2026 B198-D01-02054-RT-0010 |
Page 25 |
| NAL Expansion FS Mineral Reserve Pre-Feasibility Study NI 43-101 Final Report Prepared for Elevra |
|
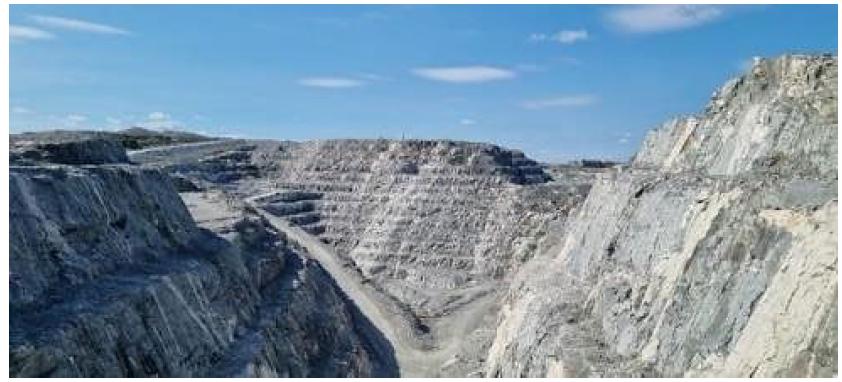
Figure 2-1: View of the Phase 1 Open Pit Operations
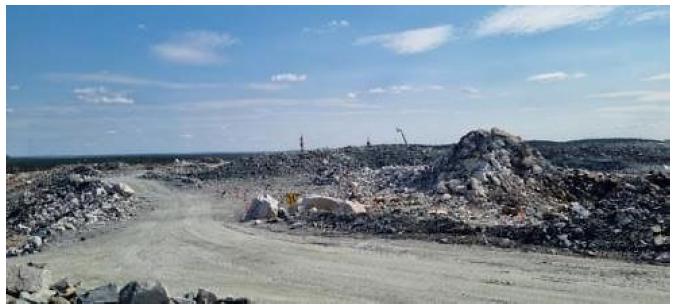
Figure 2-2: View of the Phase 2 Open Pit Operations
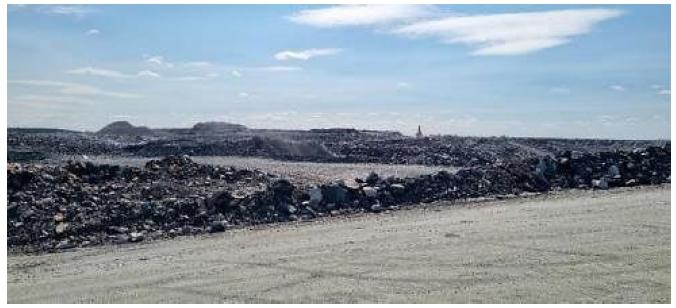
Figure 2-3: View of the Phase 3 Open Pit Operations
| Revision: 0 – 14-Aug-2026 B198-D01-02054-RT-0010 |
Page 26 |
| NAL Expansion FS Mineral Reserve Pre-Feasibility Study NI 43-101 Final Report Prepared for Elevra |
|
| 2.4.3.3 | Other Site Visits |
A site visit was also completed on May 27th, 2025, by other consultants engaged in the preparation of the Mineral Resource estimate. The site visit included a field tour of the main geological features visible in the current open pit, a tour of the core storage facility, visual inspections of drill cores, and discussions with on-site geologists and engineers of Elevra Québec.
Selected drillhole collars in the field were also validated. The site visit also included a review of the sampling and assay procedures, QA/QC program, downhole survey methodologies, and the descriptions of lithologies, alteration and structures. The outcomes of this site visit are discussed in greater detail in Section 12.2.2 – Drilling and Sampling Procedure Validation.
| 2.5 | Sources of Information |
The following documentation were used to support the preparation of this Report:
| ● | Reference documents from C101 – Scoping Study (Wave International, 2025) |
| ● | Reference documents from C102 – DFS Study (BBA, 2023) |
Additional information was sought from Elevra and NAL personnel as required. Sections from reports authored by other consultants may have been directly quoted or summarized in this report and are so indicated where appropriate.
The report has been completed using the aforementioned sources of information as well as information contained in, but not limited to, the following reports, documents, and discussions:
| ● | Technical discussions with NAL and Elevra personnel. |
| ● | QP site visits. |
| ● | Technical and financial information provided by NAL and Elevra personnel. |
| ● | Internal unpublished reports received from NAL. |
| ● | Additional information from public domain sources. |
| 2.6 | Units of Measure and Glossary of Terms |
Unless otherwise specified or noted, this Report uses the following assumptions and units:
| ● | All measurements are in metric units. |
| ● | Currency is in Canadian dollars (CAD, C$ or $). |
| ● | Metal prices are expressed in Canadian dollars, selling prices are in USD. |
A list of the abbreviations and units of measurement used in this Report are provided Table 2-2. This Report includes technical information that required subsequent calculations to derive subtotals, totals, and weighted averages. Such calculations inherently involve a degree of rounding and consequently introduce a margin of error. Where these occur, the authors consider them immaterial.
| Revision: 0 – 14-Aug-2026 B198-D01-02054-RT-0010 |
Page 27 |
| NAL Expansion FS Mineral Reserve Pre-Feasibility Study NI 43-101 Final Report Prepared for Elevra |
|
Table 2-2: List of Abbreviations and Units of Measurement
| Abbreviation | Description |
| 3D | Three dimensional |
| AACE | Association for the Advancement of Cost Engineering |
| ActLabs | Techni-Lab SGB |
| Ag | Silver |
| AGAT | AGAT Laboratories Ltd. |
| Ai | Abrasion index |
| AISC | All-in sustaining cost |
| ALS | ALS Laboratory Group |
| AMC | AMC Mining Consultants (Canada) Ltd. |
| ARD | Acid Rock Drainage |
| ASX | Australian Securities Exchange Ltd. |
| BAPE | Bureau d’audiences publique en Environnement (Public Hearings Office on the Environment) |
| BBA | BBA Engineering Inc. |
| BFA | Bench face angles |
| Bi | Bismuth |
| BM | Block model |
| BMI | Benchmark Minerals Intelligence |
| BO3 | Borate |
| BWi | Ball mill work index |
| CAD | Canadian Dollar |
| CAGR | Compound annual growth rate |
| C-ALS | Cavity autoscanning laser system |
| Cambior | Cambior Inc. |
| Capex | Capital Cost Estimate |
| CDA | Canadian Dam Association |
| CDPNQ | Centre de Données sur le Patrimoine Naturel du Québec |
| CEAA | Canadian Environmental Assessment Agency |
| CIM | Canadian Institute of Mining, Metallurgy and Petroleum |
| CLC | Canada Lithium Corp. |
| CN- | Cyanide |
| CN | Canadian National |
| COG | Cut-off grade |
| CRM | Certified reference materials |
| Cs | Cesium |
| CV | Coefficient of variation |
| CWI | Crushing work index |
| DCF | Discounted cash flow |
| DDH | Diamond drillhole |
| DFO | Department of Fisheries and Oceans of Canada |
| DFS | Definitive Feasibility Study |
| DIL | Diluvio deposit |
| DMS | Dense media separation |
| DTM | Digital terrain model |
| EBITDA | Earnings Before Interest, Taxes, Depreciation, and Amortization |
| EDF | Environmental Design Flood |
| EFE | Exceptional forest ecosystem |
| EGM | Engineering geology model |
| Elevra | Elevra Lithium Limited |
| EOY | End of year |
| EPCM | Engineering, procurement and construction management |
| EQA | Environment Quality Act |
| ESIA | Environmental and Social Impact Assessment |
| ESR | Excellence in Social Responsibility |
| Revision: 0 – 14-Aug-2026 B198-D01-02054-RT-0010 |
Page 28 |
| NAL Expansion FS Mineral Reserve Pre-Feasibility Study NI 43-101 Final Report Prepared for Elevra |
|
| Abbreviation | Description |
| ESS | Energy storage systems |
| EVs | Electric vehicles |
| Fe | Iron |
| FEL | Front-end loader |
| FOB | Freight-on-board |
| FOS | Factor of safety |
| FS | Feasibility Study |
| FY | Fiscal year |
| G&A | General and Administration |
| Geo Labs | Geoscience Laboratories |
| GET | Ground engaging tools |
| GHG | Greenhouse gas |
| Golder | Golder Associates |
| GSC | Geological Survey of Canada |
| Hbl | Hornblende |
| HDPE | High-density polyethylene |
| H2O | Water |
| HLS | Heavy-liquid separation |
| HS | Waste Rock Stockpile |
| IBA | Impact Benefit Agreement |
| ICP-AES | Inductively coupled plasma – atomic emission spectroscopy |
| ICP-OES | Inductively coupled plasma – optical emission spectrometry |
| ID | Inverse distance |
| ID2 | Inverse distance squared |
| ID3 | Inverse distance cubed |
| InnovExplo | InnovExplo Inc. |
| IRA | Inter-ramp angles |
| IRR | Internal rate of return |
| IW | Independent witness |
| JBNQA | James Bay and Northern Quebec Agreement |
| JV | Joint venture |
| KE | Kriging efficiency |
| KNA | Kriging neighbourhood analysis |
| KPI | Key production indicator |
| kt LCE | thousand tonnes lithium carbonate equivalent |
| LAN | Lithium Amérique du Nord |
| LCE | Lithium carbonate equivalent |
| LCT | Li-Cs-Ta (Lithium, cesium, tantalum) |
| LG | Low grade |
| Li | Lithium |
| LIMS | Low-intensity magnetic separator |
| Li2O | Lithium oxide |
| LiOH.H2O | Lithium hydroxide monohydrate |
| LLDPE | Linear low-density polyethylene |
| LOM | Life of mine |
| LSB | Loi sur la sécurité des barrages (The Dam Safety Law applied in Québec) |
| LV | Low voltage |
| m.a.s.l. | Metres above sea level |
| MDMER | Metal and Diamond Mining Effluent Regulations |
| MELCC | Ministère de l’Environnement, et de la Lutte contre les changements climatiques, (now MELCCFP) |
| MELCCFP | Ministère de l’Environnement, de la Lutte contre les changements climatiques, de la Faune et des Parcs (formerly MELCC) |
| MFFP | Ministry of Forest, Fauna and Parks |
| MIBC | Methyl isobutyl carbinol |
| Revision: 0 – 14-Aug-2026 B198-D01-02054-RT-0010 |
Page 29 |
| NAL Expansion FS Mineral Reserve Pre-Feasibility Study NI 43-101 Final Report Prepared for Elevra |
|
| Abbreviation | Description |
| ML | Metals leaching |
| Mo | Molybdenum |
| MRC | Municipalité Régionale de Comté |
| MRE | Mineral resource estimate |
| MRNF | Ministère des Resources naturelles et des Forêts (formerly MERN) |
| MSO | Mine stope optimisation |
| MSSO | MineSight Schedule Optimizer |
| MTOs | Material take-offs |
| MV | Medium voltage |
| Na2CO3 | Soda ash |
| NAD | North American Datum |
| NAG | Non-acid Generating |
| NAL | North American Lithium |
| NaOH | Sodium hydroxide |
| Nb-Y-F (or NYF) | Niobium-yttrium-fluorine |
| NCF | Net cash flow |
| NI 43-101 | National Instrument 43-101 |
| NIR | Near infrared |
| NN | Nearest neighbour |
| NPV8% | Net present value with 8% discount rate applied |
| NSR | Net smelter return |
| OBP-2 | Overburden pile 2 |
| OK | Ordinary kriging |
| Opex | Operating Cost Estimate |
| PCBs | Polychlorinated biphenyls |
| PEA | Preliminary economic assessment |
| PFS | Pre-feasibility study |
| PGA | Potential gravity acceleration |
| PMF | Probable maximum flood |
| PO4 | Phosphate ion |
| POV | Pre-operational verification |
| PwC | PricewaterhouseCoopers |
| Q1 | First quarter |
| Q2 | Second quarter |
| Q3 | Third quarter |
| Q4 | Fourth quarter |
| QA/QC | Quality Assurance / Quality Control |
| QLC | Quebec Lithium Corporation |
| QP | Qualified Person |
| Rb | Rubidium |
| REE | Rare earth elements |
| RNC | Royal Nickel Corporation |
| RNC Media | Radio Nord Communications Inc. |
| ROM | Run of mine |
| ROMPad | Run of Mine pad |
| RPA | Roscoe, Postle and Associates |
| RPEEE | Reasonable Prospects for Eventual Economic Extraction, |
| RQD | Rock quality designation |
| RSB | Règlement sur la sécurité des barrages (Dam Safety Regulation, applied in Quebec) |
| RTK | Real time kinematic |
| SAD | Abitibi RCM’s territory development and activities plan |
| Sayona | Sayona Québec / Sayona Mining Limited |
| SD | Standard deviation |
| SEC | Study of the environmental character |
| Revision: 0 – 14-Aug-2026 B198-D01-02054-RT-0010 |
Page 30 |
| NAL Expansion FS Mineral Reserve Pre-Feasibility Study NI 43-101 Final Report Prepared for Elevra |
|
| Abbreviation | Description |
| SG | Specific gravity |
| SGS | SGS Lakefield |
| SN | Sedgman Novopro |
| Sn | Tin |
| Spd | Spodumene |
| SNC | Surveyor, Nenniger et Chênevert Inc. |
| std | Standard |
| ST-H | High-grade standard |
| ST-L | Low-grade standard |
| tpa | Tonnes per Annum |
| tpd | Tonnes per Day |
| TSF | Tailings Storage Facility |
| TSF-1 | Tailings Storage Facility 1 |
| TSF-2 | Tailings Storage Facility 2 |
| TSF-3 | Tailings Storage Facility 3 |
| TSS | Total suspended solids |
| UFCF | Unlevered free cash flow |
| U/G | Underground |
| URSTM | Unité de Recherche et de Service en Technologie Minérales |
| USD | United States dollar |
| WBS | Work breakdown structure |
| WHIMS | Wet high-intensity magnetic separation |
| WMP | Water Management Plan |
| XRD | X-ray diffraction |
| Revision: 0 – 14-Aug-2026 B198-D01-02054-RT-0010 |
Page 31 |
| NAL Expansion FS Mineral Reserve Pre-Feasibility Study NI 43-101 Final Report Prepared for Elevra |
|
| 3 | Reliance on Other Experts |
| 3.1 | General |
The authors of this Report have relied on information provided by experts who were not authors of the Report. The authors of the various chapters of the Report believe that it is reasonable to rely upon these experts, based on the assertion that the experts have the necessary education, professional designation, and related experience on matters relevant to the technical report.
The authors have assumed, and relied on the fact, that all the information and existing technical documents listed in Chapter 27– References of this Report are accurate and complete in all material aspects. While the authors reviewed all the available information presented, we cannot guarantee its accuracy and completeness. The authors reserve the right, but will not be obligated, to revise the Report and conclusions, if additional information becomes known after publication of this Report.
The statements and opinions expressed in this document are given in good faith and in the belief that such statements and opinions are neither false, nor misleading at the date of this Report. A draft copy of the Report has been reviewed for factual errors by Elevra. Any changes made because of these reviews did not involve any alteration to the conclusions made.
| 3.2 | Mineral Claims and Surface Rights |
The authors have not independently reviewed ownership of the Project area and any underlying property agreements, mineral claims, surface rights or royalties. The authors have fully relied upon information derived from Elevra. Refer to 4 – Property Description and Location for further information on property ownership and agreements.
| 3.3 | Environmental and Social |
The authors have relied upon information provided from Elevra regarding environmental, permitting and social. The authors have reviewed the information and consider it adequate and of a reasonable basis for the Mineral Reserves PFS.
| 3.4 | Taxation |
The Project is subject to three levels of taxation: federal corporate income tax, provincial corporate income tax, and provincial mining taxes. NAL compiled the taxation calculations for the Project with assistance from third-party taxation experts; this information has been relied upon by the authors.
| Revision: 0 – 14-Aug-2026 B198-D01-02054-RT-0010 |
Page 32 |
| NAL Expansion FS Mineral Reserve Pre-Feasibility Study NI 43-101 Final Report Prepared for Elevra |
|
| 4 | Property Description and Location |
This chapter describes the NAL Property location. This chapter contains information that was previously published by Sayona in a NI 43-101 Technical Report titled “Definitive Feasibility Study Report for the North American Lithium Project”, dated April 14th, 2023 (BBA, 2023).
| 4.1 | Property Location, Country, Regional and Government Setting |
The Property is situated in the Province of Québec, Canada (Figure 4-1).
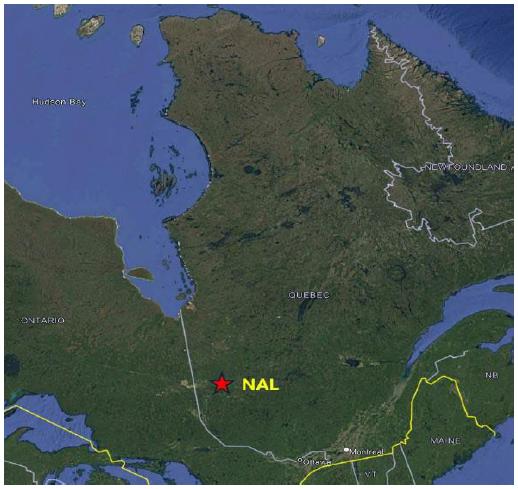
Figure 4-1: Property Overview Map
Canada is a North American country with its centre of government in Ottawa located in the Province of Ontario. Canada is a constitutional monarchy which forms part of the British Commonwealth, and it is ruled by a parliamentary democratic government. The Crown assumes the roles of the executive, as the Crown-in-Council; the legislative, as the Crown-in-Parliament; and the judicial, as the Crown-on-the-Bench. The country is politically stable, comprised of ten provinces and three territories, of which Québec is one.
| Revision: 0 – 14-Aug-2026 B198-D01-02054-RT-0010 |
Page 33 |
| NAL Expansion FS Mineral Reserve Pre-Feasibility Study NI 43-101 Final Report Prepared for Elevra |
|
The site is located in the western Quebec region of Abitibi-Témiscamingue (Figure 4-2). The site is approximately 550 km north of Montréal, 700 km north-west of Québec City, and is serviced by road, rail, and air.
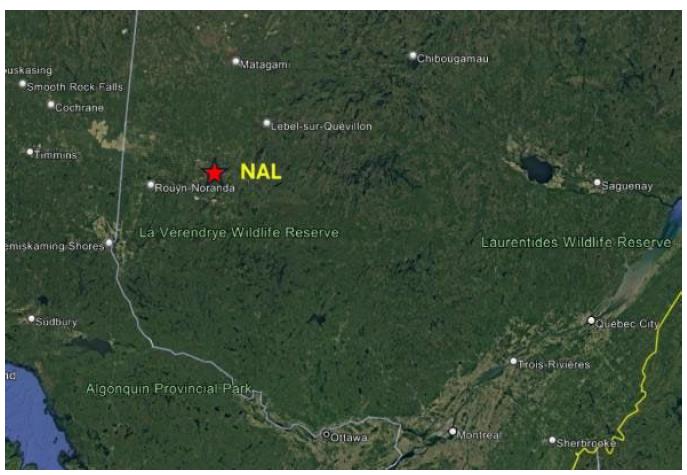
Figure 4-2: NAL Regional Property Location
At the local level, the Property is situated in La Corne Township approximately 38 km southeast of Amos, 15 km west of Barraute and 60 km north of Val-d’Or. The Property is centred near coordinates 292,500 m E and 5,365,600 m N (48°24’24“N, 77°49’50W,), Zone 18N as located on the NTS map sheet 32C05 (Figure 4-3).
As of March 30, 2026, the North American Lithium Property consists of a contiguous group of 59 mineral titles including 1 mining lease covering an area of 116.4 ha and 58 claims, covering an area 2,287.9 ha.
| Revision: 0 – 14-Aug-2026 B198-D01-02054-RT-0010 |
Page 34 |
| NAL Expansion FS Mineral Reserve Pre-Feasibility Study NI 43-101 Final Report Prepared for Elevra |
|
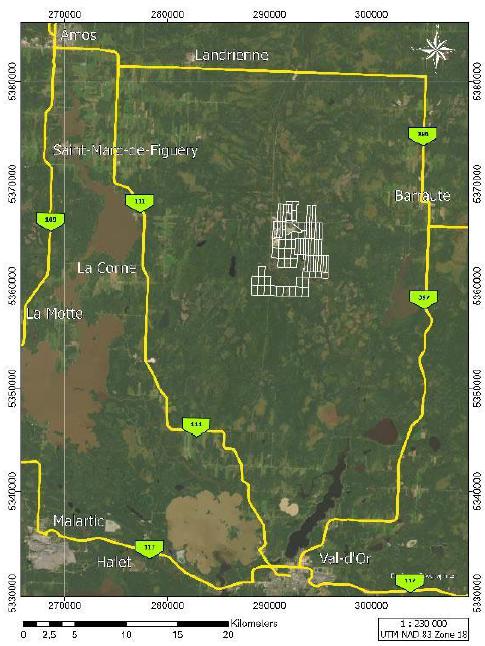
Figure 4-3: NAL Property Location
| Revision: 0 – 14-Aug-2026 B198-D01-02054-RT-0010 |
Page 35 |
| NAL Expansion FS Mineral Reserve Pre-Feasibility Study NI 43-101 Final Report Prepared for Elevra |
|
| 4.2 | Mineral Tenure, Agreement and Royalties |
| 4.2.1 | Surface Rights |
In the Province of Québec, the Mining Act governs the management of mineral resources and the granting of exploration rights for mineral substances during the exploration phase. It also deals with the granting of rights pertaining to the use of these substances during the mining phase. Finally, the act establishes the rights and obligations of the holders of mining rights to ensure maximum development of Québec’s mineral resources.
On August 26, 2021, Sayona Québec, a joint venture of subsidiary company of Sayona Mining Limited (75%) and Piedmont Lithium Inc. (25%) Ltd., acquired NAL. At the time, all claims (19) were registered in the name of NAL for a total area of 583.51 ha. The mining lease (BM1005) is also under NAL’s name and covers an area of 116.4 Ha. The mining lease was granted to Québec Lithium on May 29, 2012, based on a PFS pit filed at the time in support of the application to be granted such a lease. The mining lease has an initial term of 20 years, expiring on May 28, 2032.
On August 30, 2025, Sayona Mining Limited and Piedmont Lithium Inc. merged to form the new entity owning Sayona Québec Inc. under the name of Elevra Lithium Limited. Since the acquisition of the Project, NAL acquired 20 claims spanning roughly 750 ha from Resources Jourdan Inc. and two claims with a total area of 42.3 ha from Lise Daigle. NAL also acquired 17 mineral claims by designation in February 2026, for a total of 911.7 ha.
Claim status was verified using GESTIM, the Québec government’s online claim management system. As of March 30, 2026, the NAL Property consists of a contiguous group of 59 mineral titles including 58 claims and 1 mining lease (Figure 4-4, Table 4-1) covering a total area of 2,404.3 ha. The author has not verified the legal titles to the Property or any underlying agreement(s) that may exist concerning the licenses or other agreement(s) between third parties.
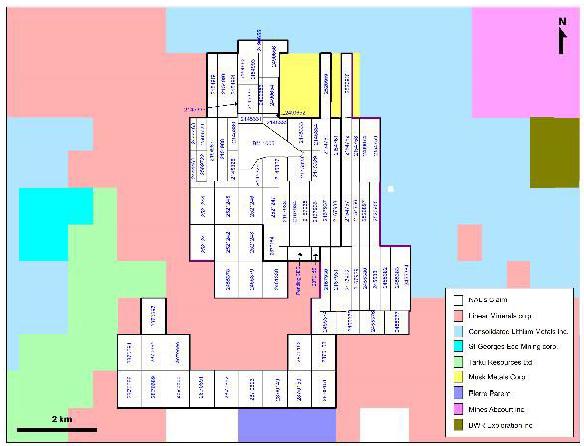
Figure 4-4: NAL Mineral Titles
| Revision: 0 – 14-Aug-2026 B198-D01-02054-RT-0010 |
Page 36 |
| NAL Expansion FS Mineral Reserve Pre-Feasibility Study NI 43-101 Final Report Prepared for Elevra |
|
Table 4-1: Mining Titles List and Details
| Claim Name | Status | Issue Date | Expiry Date | Area (Ha) |
Owner |
| BM 1005 | Active | May 29, 2012 | May 28, 2026 | 116.39 | Lithium Amérique du Nord (100%) |
| CDC 2145325 | Active | March 17, 2008 | November 24, 2026 | 31.25 | Lithium Amérique du Nord (100%) |
| CDC 2145326 | Active | March 17, 2008 | November 24, 2026 | 32.12 | Lithium Amérique du Nord (100%) |
| CDC 2145327 | Active | March 17, 2008 | November 24, 2026 | 42.85 | Lithium Amérique du Nord (100%) |
| CDC 2145328 | Active | March 17, 2008 | November 24, 2026 | 41.64 | Lithium Amérique du Nord (100%) |
| CDC 2145329 | Active | March 17, 2008 | November 24, 2026 | 16.76 | Lithium Amérique du Nord (100%) |
| CDC 2145330 | Active | March 17, 2008 | November 24, 2026 | 23.81 | Lithium Amérique du Nord (100%) |
| CDC 2145331 | Active | March 17, 2008 | November 24, 2026 | 15.29 | Lithium Amérique du Nord (100%) |
| CDC 2145332 | Active | March 17, 2008 | November 24, 2026 | 22.75 | Lithium Amérique du Nord (100%) |
| CDC 2145333 | Active | March 17, 2008 | November 24, 2026 | 46.94 | Lithium Amérique du Nord (100%) |
| CDC 2145334 | Active | March 17, 2008 | November 24, 2026 | 17.59 | Lithium Amérique du Nord (100%) |
| CDC 2145335 | Active | March 17, 2008 | November 24, 2026 | 1.53 | Lithium Amérique du Nord (100%) |
| CDC 2145336 | Active | March 17, 2008 | November 24, 2026 | 35.92 | Lithium Amérique du Nord (100%) |
| CDC 2154760 | Active | May 26, 2008 | May 25, 2027 | 41.71 | Lithium Amérique du Nord (100%) |
| CDC 2154761 | Active | May 26, 2008 | May 25, 2027 | 41.64 | Lithium Amérique du Nord (100%) |
| CDC 2154987 | Active | May 26, 2008 | February 2, 2027 | 42.15 | Lithium Amérique du Nord (100%) |
| CDC 2154988 | Active | May 26, 2008 | February 2, 2027 | 42.15 | Lithium Amérique du Nord (100%) |
| CDC 2154989 | Active | May 26, 2008 | February 2, 2027 | 42.68 | Lithium Amérique du Nord (100%) |
| CDC 2154990 | Active | May 26, 2008 | February 2, 2027 | 42.65 | Lithium Amérique du Nord (100%) |
| CDC 2154991 | Active | May 26, 2008 | February 2, 2027 | 42.67 | Lithium Amérique du Nord (100%) |
| CDC 2154992 | Active | May 26, 2008 | February 2, 2027 | 21.45 | Lithium Amérique du Nord (100%) |
| CDC 2154993 | Active | May 26, 2008 | February 2, 2027 | 21.31 | Lithium Amérique du Nord (100%) |
| CDC 2167933 | Active | July 28, 2008 | July 27, 2027 | 43.07 | Lithium Amérique du Nord (100%) |
| CDC 2167934 | Active | July 28, 2008 | July 27, 2027 | 42.63 | Lithium Amérique du Nord (100%) |
| CDC 2167935 | Active | July 28, 2008 | July 27, 2027 | 42.67 | Lithium Amérique du Nord (100%) |
| CDC 2167936 | Active | July 28, 2008 | July 27, 2027 | 42.71 | Lithium Amérique du Nord (100%) |
| CDC 2167937 | Active | July 28, 2008 | July 27, 2027 | 42.71 | Lithium Amérique du Nord (100%) |
| CDC 2167938 | Active | July 28, 2008 | July 27, 2027 | 42.71 | Lithium Amérique du Nord (100%) |
| CDC 2444462 | Active | May 11, 2016 | May 10, 2027 | 21.66 | Lithium Amérique du Nord (100%) |
| CDC 2444463 | Active | May 11, 2016 | May 10, 2027 | 13.53 | Lithium Amérique du Nord (100%) |
| CDC 2490652 | Active | April 25, 2017 | April 24, 2026 | 4.21 | Lithium Amérique du Nord (100%) |
| CDC 2490653 | Active | April 25, 2017 | April 24, 2026 | 10.67 | Lithium Amérique du Nord (100%) |
| CDC 2490654 | Active | April 25, 2017 | April 24, 2026 | 37.72 | Lithium Amérique du Nord (100%) |
| CDC 2490655 | Active | April 25, 2017 | April 24, 2026 | 26.50 | Lithium Amérique du Nord (100%) |
| CDC 2490656 | Active | April 25, 2017 | April 24, 2026 | 44.59 | Lithium Amérique du Nord (100%) |
| CDC 2520959 | Active | July 19, 2018 | July 18, 2027 | 42.99 | Lithium Amérique du Nord (100%) |
| CDC 2521244 | Active | July 20, 2018 | July 19, 2027 | 57.20 | Lithium Amérique du Nord (100%) |
| CDC 2521245 | Active | July 20, 2018 | July 19, 2027 | 57.20 | Lithium Amérique du Nord (100%) |
| CDC 2521246 | Active | July 20, 2018 | July 19, 2027 | 57.20 | Lithium Amérique du Nord (100%) |
| CDC 2521247 | Active | July 20, 2018 | July 19, 2027 | 37.03 | Lithium Amérique du Nord (100%) |
| CDC 2569722 | Active | June 23, 2020 | June 22, 2027 | 20.53 | Lithium Amérique du Nord (100%) |
| CDC 2569723 | Active | June 23, 2020 | June 22, 2027 | 21.78 | Lithium Amérique du Nord (100%) |
| CDC 2870149 | Active | February 17, 2026 | February 16, 2029 | 57.25 | Lithium Amérique du Nord (100%) |
| CDC 2870150 | Active | February 17, 2026 | February 16, 2029 | 57.24 | Lithium Amérique du Nord (100%) |
| CDC 2870151 | Active | February 17, 2026 | February 16, 2029 | 57.24 | Lithium Amérique du Nord (100%) |
| CDC 2870152 | Active | February 17, 2026 | February 16, 2029 | 57.24 | Lithium Amérique du Nord (100%) |
| CDC 2870153 | Active | February 17, 2026 | February 16, 2029 | 57.24 | Lithium Amérique du Nord (100%) |
| CDC 2870154 | Active | February 17, 2026 | February 16, 2029 | 45.23 | Lithium Amérique du Nord (100%) |
| CDC 2870155 | Active | February 17, 2026 | February 16, 2029 | 7.85 | Lithium Amérique du Nord (100%) |
| CDC 2870688 | Active | February 24, 2026 | February 23, 2029 | 57.25 | Lithium Amérique du Nord (100%) |
| CDC 2870689 | Active | February 24, 2026 | February 23, 2029 | 57.25 | Lithium Amérique du Nord (100%) |
| CDC 2870690 | Active | February 24, 2026 | February 23, 2029 | 57.25 | Lithium Amérique du Nord (100%) |
| CDC 2870691 | Active | February 24, 2026 | February 23, 2029 | 57.25 | Lithium Amérique du Nord (100%) |
| CDC 2870692 | Active | February 24, 2026 | February 23, 2029 | 57.25 | Lithium Amérique du Nord (100%) |
| CDC 2870693 | Active | February 24, 2026 | February 23, 2029 | 57.25 | Lithium Amérique du Nord (100%) |
| Revision: 0 – 14-Aug-2026 B198-D01-02054-RT-0010 |
Page 37 |
| NAL Expansion FS Mineral Reserve Pre-Feasibility Study NI 43-101 Final Report Prepared for Elevra |
|
| Claim Name | Status | Issue Date | Expiry Date | Area (Ha) |
Owner |
| CDC 2870694 | Active | February 24, 2026 | February 23, 2029 | 57.24 | Lithium Amérique du Nord (100%) |
| CDC 2870695 | Active | February 24, 2026 | February 23, 2029 | 57.24 | Lithium Amérique du Nord (100%) |
| CDC 2870696 | Active | February 24, 2026 | February 23, 2029 | 57.24 | Lithium Amérique du Nord (100%) |
| CDC 2870697 | Active | February 24, 2026 | February 23, 2029 | 57.23 | Lithium Amérique du Nord (100%) |
| Total | 2404.30 |
| 4.2.2 | Mineral Rights and Permitting |
Permits are required for any exploration program that involves tree cutting (to create access roads or drill pads or, in preparation for mechanical outcrop stripping, for example). Permits are issued by the Ministère des Resources Naturelles et des Forêts (MRNF). Permitting timelines are typically three to four weeks. Additional permitting requirements are needed when drilling on the historical tailings sites. Permits are also necessary for the exploitation of the mine.
NAL operations have obtained all necessary permits from government agencies to allow for surface drilling on the NAL Property. All necessary regulatory permits required for the operation of the NAL mine since its construction are listed below.
Major existing permits and authorizations include:
| ● | Ore treatment plant (concentrator) and refinery. |
| ● | Construction of tailings accumulation areas. |
| ● | Overburden stockpile #1 and 2. |
| ● | Operation of a spodumene surface mine in La Corne. |
| ● | Operation of the concentrator and the refinery. |
| ● | Wastewater treatment system. |
| ● | Open pit mining. |
A complete list of permits and authorizations for the Project can be found in Chapter 20 – Environmental Studies, Permitting and Social or Community Impact.
| 4.2.3 | Agreements and Royalties |
There are no royalties applicable to any mineral substances extracted from the lands subject to the NAL mining titles. The author did not verify the legality or terms of any underlying agreement(s) that may exist concerning the Project ownership, permits, offtake agreements, license agreements, royalties, or other agreement(s) between NAL / Sayona Québec and any third parties.
| 4.3 | Environmental Liabilities and Other Permitting Requirements |
The author is not aware of any environmental liabilities, other than those mentioned here, to which the Property is subject, other than the normal licensing and permitting requirements that must be made prior to undertaking certain operations and environmental restrictions as set forth in the Provincial Mining Act and Regulations.
There were no outstanding liabilities on the old mining site prior to the resumption of operations in 2013 as a previous owner of the claims, Cambior Inc., had completed the full rehabilitation to the satisfaction of the MRNF and in conformity with provincial safety standards, as well as received confirmation from the authorities for the completion of the work. Such rehabilitation of the mine site
| Revision: 0 – 14-Aug-2026 B198-D01-02054-RT-0010 |
Page 38 |
| NAL Expansion FS Mineral Reserve Pre-Feasibility Study NI 43-101 Final Report Prepared for Elevra |
|
included the complete removal of all underground and surface plant and equipment, the mine’s head frame, the railway spur connecting to the Canadian National (CN) railway line, and all office buildings and other structures, which was completed from 1975 through 2001. The crown pillar was fenced off and all openings sealed.
Old tailings were stored within two dams located to the north of the mine area in a west-east trending valley between Lortie Lake and Lac Roy. There is an estimated 700,000-750,000 t of material stored there, mostly quartz and feldspar sand (Karpoff, Évaluation Technique de la Propriété Minière Québec Lithium, 1993). Rehabilitation included covering the tailings with soil and vegetation.
In 2009, a Study of the Environmental Character (SEC) of the Property was initiated by Genivar Inc. of Amos, Québec, which was then pursued and completed by Project personnel prior to resuming production mid-2013. The objective of the SEC was to outline all environmental concerns and constraints for the proposed development of an open-pit mining operation.
An environmental baseline study for the Project, begun in October 2009, was incorporated into the final SEC report. This was the first step towards obtaining the permits and authorizations from regulatory authorities to permit the construction of new infrastructure and pre-stripping of the deposit in 2012. New office buildings, sheds, warehouse, and a processing plant, all located about 1 km west of the mining pit area, were permitted and constructed prior to launching open-pit operations in mid-2013.
TSF-1 has been raised to 415 m as part of the completed Phase 1C works, providing a total residue storage capacity of 5.6 Mm³. Detailed engineering for Phase 1D is largely complete and includes a +3 m raise, increasing total capacity to 7.2 Mm³. TSF-1 is ultimately planned for a total capacity of 8.8 mm3 reached in 2028. This notwithstanding a second TSF will be required in the short- to medium-term for the storage of LOM concentrator tailings followed by a third TSF to carry to the remaining LOM.
NAL also has two planned waste rock storage areas, currently located 1.5 km and 2.5 km from the pit. Waste rock storage 3 is authorized, and waste rock storage 2, including its final west-side expansion phase, has also received authorization. NAL therefore holds all required permits for waste rock deposition until the end of Phase 5. These two waste rock piles have been designed to reach the final required capacity as previously published by Sayona in a NI 43-101 Technical Report titled “Definitive Feasibility Study Report for the North American Lithium Project”, dated April 14th, 2023. (BBA, 2023)
The only current environmental liabilities are known contaminated soils. The other infrastructures are covered by the restoration plan and the financial guarantee deposited with the MRNF.
| 4.4 | Mineral and Surface Purchase Agreements |
In addition to the mining rights described above, NAL holds five surface leases on lands of the domain of the State (referred to below as Public Land Leases), which it rents or plans to rent from the MRNF for the utilization and rights shown in Table 4-2. NAL has received an extension of the leases for the waste stockpile 2 and the waste stockpile 3 from MRNF.
NAL has federal authorization for TSF-2, with an authorization request planned to be made at the provincial level in mid-2026 for TSF-2.
Table 4-2: NAL Public Land Leases
| MRNF Lease # | Land Lease Description | Area (Ha) |
| 82373700 | Public Land Lease – Surface Infrastructures | 43.2 |
| 824391/41818908 | Public Land Lease – Waste Stockpile 3 | 146,3 |
| 82439000 | Public Land Lease – Overburden stockpile | 30.8 |
| Revision: 0 – 14-Aug-2026 B198-D01-02054-RT-0010 |
Page 39 |
| NAL Expansion FS Mineral Reserve Pre-Feasibility Study NI 43-101 Final Report Prepared for Elevra |
|
| MRNF Lease # | Land Lease Description | Area (Ha) |
| 82439400 | Public Land Lease – Waste Stockpile 2 | 90.6 |
| 82439200 | Public Land Lease – TSF-1 | 117.5 |
| 82438600 | Public Land Lease – Lortie Lake North well (OW-11-03) | 1.0 |
| Total | 394.8 |
| 4.5 | Other Significant Factors and Risks |
To the author’s knowledge, there are no significant factors, risks or legal issues that may affect access, title, the right, or ability to perform work on the Property.
| Revision: 0 – 14-Aug-2026 B198-D01-02054-RT-0010 |
Page 40 |
| NAL Expansion FS Mineral Reserve Pre-Feasibility Study NI 43-101 Final Report Prepared for Elevra |
|
| 5 | Accessibility, Climate, Local Resources, Infrastructure and Physiography |
This chapter describes the NAL Property accessibility, climate, local resources, infrastructure and physiography. This chapter contains information that was previously published by Sayona in a NI 43-101 Technical Report titled “Definitive Feasibility Study Report for the North American Lithium Project”, dated April 14th, 2023. (BBA, 2023)
| 5.1 | Accessibility |
The Property is located approximately 60 km north of Val-d’Or, Québec, and 38 km southeast of Amos, Québec, and is accessible by provincial Highway 111, connecting Val-d’Or and Amos, or alternatively by provincial Highway 397, connecting Val-d’Or and Barraute (Figure 4-3).
An all-weather secondary road, known as Route du Lithium, connecting the site to the Val-d’Or – Amos highway, which was used to traverse the Property and factually caused constraint to the pit operations, has now been relocated to avoid the mining area. The site is also accessible from Mont-Vidéo, through an all-weather road that connects further east to the Val-d’Or – Barraute highway.
Val-d’Or and Rouyn-Noranda are serviced daily by regional air carriers, while small craft landing areas are also located in these towns and nearby Amos. The closest all-weather landing strip and helipad is located at Amos now that the small aircraft landing strip, once located at Mont-Vidéo to the east of the Property, was converted into the new all-weather gravel road circumventing the mine site.
| 5.2 | Topography, Elevation, Vegetation and Climate |
| 5.2.1 | Physiography |
The Property contains small hills and is located at a mean elevation of 400 m above sea level, but the topography is generally flat with swamps, sand plains and an esker along its edge.
Granitic intrusions, which are part of the La Corne pluton, underlie nearly all of the hilly area. The volcanic rocks adjacent to this pluton have been altered to hornblende (Hbl) schists, which are very resistant to weathering and now form the highest hills. In the early 1950s, the hills were covered with dense forest growth consisting mainly of hardwoods. Most of the outcrops of spodumene-bearing (Spd) pegmatite occur on the top of a ridge that rises to an elevation of approximately 150 ft (~45 m) above Lortie Lake. This ridge can be traced for approximately 2,000 ft (~610 m) in an east-west direction.
The region’s landscape typically features mixed forest to the south, while boreal forest covers the northern section, notably along the Amos – La Sarre corridor. Wholesale timber logging activities took place locally during the ’50s and ’60s, until the ’80s, when reforestation was undertaken. As the mine is a recently reclaimed site and also because all timber had been cut earlier, vegetation is limited to spruce with jack pine and alders in regrowth near the site.
Figure 5-1 shows the main existing and planned site infrastructure for the Project. The highlighted features include the fully developed open pit, the existing and expanded tailings management facilities, plant facilities, the waste storage areas, and overburden piles, as well as various other pads associated with the life of mine (LOM) pit plan.
| Revision: 0 – 14-Aug-2026 B198-D01-02054-RT-0010 |
Page 41 |
| NAL Expansion FS Mineral Reserve Pre-Feasibility Study NI 43-101 Final Report Prepared for Elevra |
|
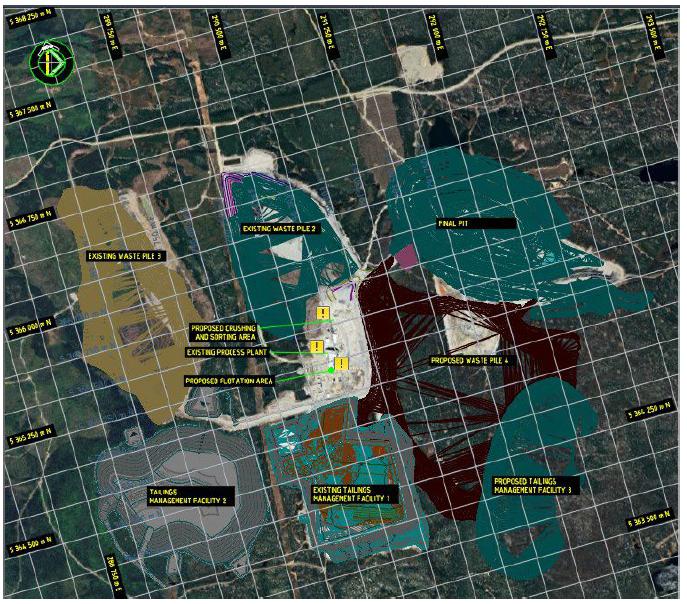
Figure 5-1: General Arrangement of Existing and Planned Infrastructure at the Mine Site
| 5.2.2 | Vegetation |
The regional study zone is located within the western balsam fir-yellow birch bioclimatic domain. The forest landscape is dominated by stands of pine and white spruce, intermingling with white birch trees. The regional study zone includes several open environments, e.g., farmer’s fields, non-forest wetlands, recent logging areas, etc., but is nonetheless primarily comprised of forest. Conifer stands predominate, followed by mixed stands. Hardwood or deciduous stands are less frequent and consist almost solely of young stands or trees undergoing regeneration. The numerous disturbances of the late ’70s, e.g., epidemics, logging, plantations, and windfall, all resulted in major occurrences of these types of stands.
According to the Centre de Données sur le Patrimoine Naturel du Québec (CDPNQ), the sector concerned by the Project does not include any plant species designated as threatened, vulnerable or likely to be thus designated. Any special-status species have been observed in the ESIA previous baseline studies and those conducted in 2025. The sector contains no Exceptional Forest Ecosystems (EFEs), forest stands with a phytosociological interest or biological refuges. Furthermore, the past few years have seen considerable logging activity.
Figure 5-2 and Figure 5-3 show the relief and vegetation of the property adjacent to the mine site, as well as the location of the mine and tailings facility in relation to the processing plant.
| Revision: 0 – 14-Aug-2026 B198-D01-02054-RT-0010 |
Page 42 |
| NAL Expansion FS Mineral Reserve Pre-Feasibility Study NI 43-101 Final Report Prepared for Elevra |
|
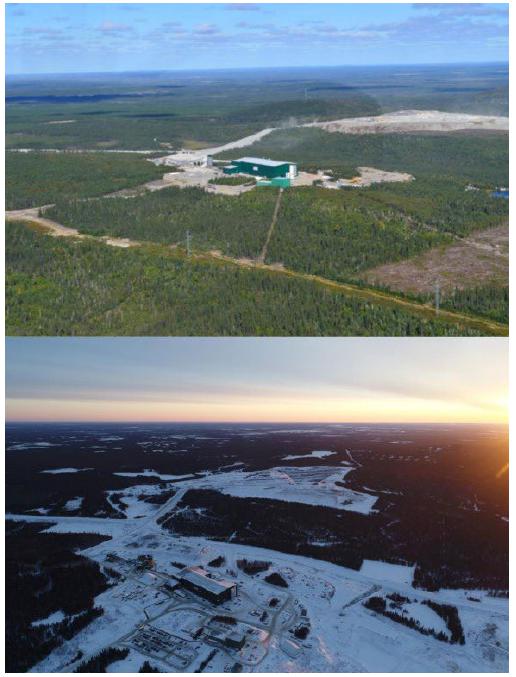
Figure 5-2: View Looking North-Westerly Across the Plant and Mine Site
| Revision: 0 – 14-Aug-2026 B198-D01-02054-RT-0010 |
Page 43 |
| NAL Expansion FS Mineral Reserve Pre-Feasibility Study NI 43-101 Final Report Prepared for Elevra |
|
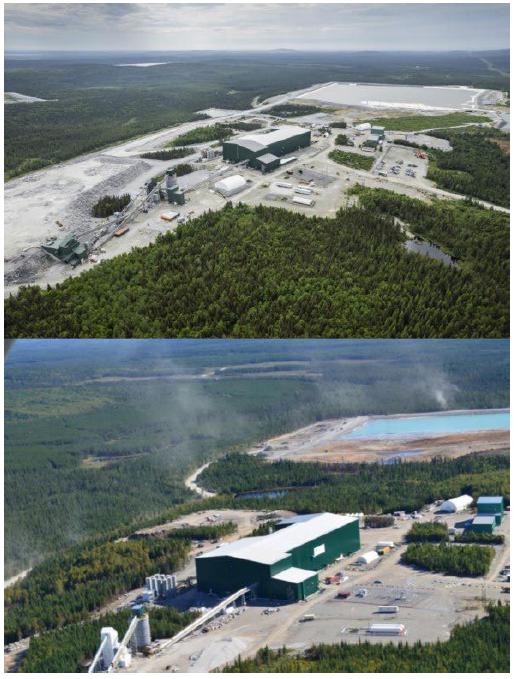
Figure 5-3: View Looking South-Easterly Showing the Plant Facilities in the Foreground of the Tailings Impoundment Area
| Revision: 0 – 14-Aug-2026 B198-D01-02054-RT-0010 |
Page 44 |
| NAL Expansion FS Mineral Reserve Pre-Feasibility Study NI 43-101 Final Report Prepared for Elevra |
|
| 5.2.3 | Climate |
The Val-d’Or area experiences a subarctic continental sub-humid climate, characterized by short, cool summers and long, cold winters. The nearest weather monitoring station with data on climate normals maintained by Environment Canada (climat.meteo.gc.ca) is the Val D’or station, approximately 60 km south of the Property. According to the available data collected at this weather station from 1991-2020, the average daily temperature for January was -16.3 °C and the daily average temperature in July was 17.7 °C. The record low during this period was -42.7 °C, and the record high was 36.1 °C. Figure 5-4 summarizes the weather normal for Val D’Or between 1991 and 2020.
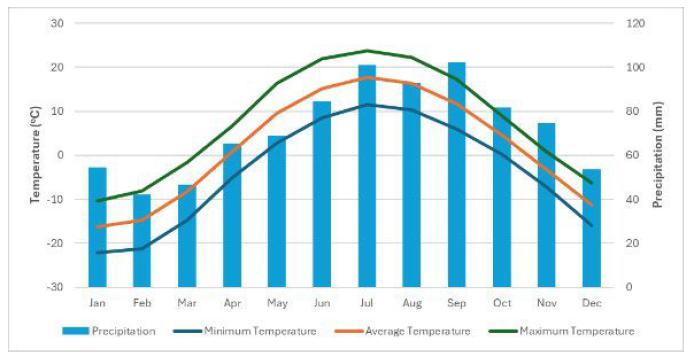
Figure 5-4: Val D’or Weather Normals (Source: climat.meteo.gc.ca)
Data collected from the Val D’or weather station from 1991 to 2020 indicates that the total annual precipitation was 868 mm, with peak rainfall occurring during September (102 mm average), July (101 mm average) and August (93 mm average). Snowfall is light to moderate from October to April, with an annual average of 228 cm.
The climatic conditions at the Property do not significantly impede the Project or hinder exploration or mining activities, beyond seasonal consideration for certain works (e.g., drilling muskeg swamps during winter freeze).
| 5.3 | Local Infrastructure and Resources |
| 5.3.1 | Airports, Rail Terminals, and Bus Services |
The town of Val-d’Or, with a population of approximately 32,750 residents (Canadian Census, 2021), is located 60 km south of the Property, along the provincial Highway 111. Since Val-d’Or was founded in the 1920s, it has been a mining service centre. Val-d’Or is one of the largest communities in the Abitibi region and has all major services, including an airport with scheduled service from Montréal. A CN railway line is about 49 km east of the Property, connecting east through to Montréal and west to the North American rail network. Val-d’Or is a 6-hour drive from Montréal, and there are daily bus services between Montréal and the other cities and towns in the Abitibi region.
| Revision: 0 – 14-Aug-2026 B198-D01-02054-RT-0010 |
Page 45 |
| NAL Expansion FS Mineral Reserve Pre-Feasibility Study NI 43-101 Final Report Prepared for Elevra |
|
The town of Amos, with a population of roughly 12,675 residents (Canadian Census, 2021), is located roughly 40 km northwest of the NAL site. Amos is served by highways 109, 111, and 395 and the Amos/Magny airport.
| 5.3.2 | Local Workforce |
According to the 2021 census prepared by Statistics Canada, the population of the MRC of La Vallée-de-l’Or was 43,347 people, with 63% of the residents aged 15-64, and an average of 42 years old. Male population accounts for 51% of the population, 49% is female, and 8.7% is Aboriginal. In 2021, 64.2% of the population participated in the labour force, with 15.2% of the labour force employed in the “mining, quarrying, and oil and gas extraction” category. This portion of the workforce is experienced in mining operations, as they are currently employed at exploration and gold mines located elsewhere in the Abitibi region. Local resources also include commercial laboratories, drilling companies, exploration service companies, engineering consultants, construction contractors and equipment suppliers.
| 5.3.3 | Additional Support Services |
Additional services within the town of Val-d’Or include the Val-d’Or Hospital, grocery stores, fuel stations, financial institutions, and hotels. Val-d’Or has a Canada Post office and additional shipping/freight services by several providers. Landline telephone, mobile service, high-speed internet, and satellite internet are available in town and the vicinity.
A high-voltage power line (120 kV) passes approximately 2 km to the west of the Property and a 25 kV electric line, running along the Route du Lithium, services the Mont-Vidéo ski and recreation area.
| Revision: 0 – 14-Aug-2026 B198-D01-02054-RT-0010 |
Page 46 |
| NAL Expansion FS Mineral Reserve Pre-Feasibility Study NI 43-101 Final Report Prepared for Elevra |
|
| 6 | History |
This chapter describes the NAL Property history. This chapter contains information that was previously published by Sayona in a NI 43-101 Technical Report titled “Definitive Feasibility Study Report for the North American Lithium Project, dated April 14th, 2023.
| 6.1 | General History |
There is a large amount of historical information relating to the exploration and mining activities on the Property, which has been summarized in the following reports:
| ● | Stone, M. and Selway, J., Technical Report of December 2009. (Stone & Selway, 2009) |
| ● | Stone, M. and Ilieva, T., Technical Report of April 2010. (Stone & Ilieva, 2010) |
| ● | Lavery, M.E. and Stone, M., Technical Report of November 2010. (Lavery & Stone, 2010) |
| ● | Hardy, C.A. and al., Technical Report of August 2017 (unpublished). (Hardy, 2017) |
The compilation work was assisted by published reports, internal reports, drill logs and available assessment files from the MRNF. Historic annual mine reports are missing for the period of 1958 to 1962. Drilling information for all historic underground and some surface holes are incomplete or missing.
Table 6-1 summarizes ownership and historic exploration completed on the Property. The author has not done sufficient work to classify the historical estimates or to verify their accuracy.
Table 6-1: Summary of Ownership and Historic Activities
| Year | Company ownership | Main Activity/Event | Main Result |
| 1942 | Sullivan | Prospecting. | Discovery of spodumene pegmatite. |
| 1942-1943 | Dumont | Diamond drilling. | 17 holes (3,598.9 ft). |
| 1946 |
Nepheline Products Ltd. and Great Lakes Carbon Corporation |
Prospecting, trenching, diamond drilling bulk sampling. |
Sufficient material discovered for mining, 6 holes (2,088 ft) - results encouraging. |
| 1947 | La Corne Lithium Mines Ltd. | Company was established. | |
|
1950
|
Lakefield Research Ltd.
|
Nepheline Products Ltd. Changed name to Lakefield Research Ltd. | |
| 1952-1953 | La Corne Lithium Mines Ltd. | Diamond drilling. | +30,000 ft drilled; several spodumene pegmatites intersected. |
|
1954
|
Québec Lithium Corp.
|
Acquires the Property, surface diamond drilling, shaft sinking mine and mill development. | |
| 1955 | Québec Lithium Corp. | Mine and mill development. | Shaft completed to 560 ft depth. |
| 1955 | Québec Lithium Corp. | Three underground levels (150 ft, 275 ft and 400 ft). | |
| 1955 | Québec Lithium Corp. | Underground drilling. | 118 drillholes (+22,000 ft). |
| 1956 | Québec Lithium Corp. | Mining, underground drilling. |
1,100 tons/d (~1,000 tpd); 325 drillholes totalling +53,000 ft (+16,150 m). |
| 1957 | Québec Lithium Corp. | Mining, surface diamond drilling totalling 58,920 ft. |
1,250 tons/d (1,135 tpd), total 513,403 tons (465,750 t). |
| 1959 | Québec Lithium Corp. | Construction of lithium refinery commences. | |
| 1960 | Québec Lithium Corp. | Refinery operational. | |
| 1963 | Québec Lithium Corp. | Production of lithium hydroxide begins. |
| Revision: 0 – 14-Aug-2026 B198-D01-02054-RT-0010 |
Page 47 |
| NAL Expansion FS Mineral Reserve Pre-Feasibility Study NI 43-101 Final Report Prepared for Elevra |
|
| Year | Company ownership | Main Activity/Event | Main Result |
| 1963-1964 | Québec Lithium Corp. | Mining and refining. | 76,856 tons (69,722 t) of ore hoisted; year-end reserves of broken ore were 198,998 tons (180,528 t). |
| 1965-1966 | Québec Lithium Corp. | Mining and refining. | 62,479 tons (56,680 t) of ore hoisted; year-end reserves of broken ore were 249,842 tons (226,653 t). |
| 1974 | Sullivan Mining Group |
FS on the re-opening of the Québec Lithium mine prepared, mining, processing, historic resource estimate. |
LOM is 2 1/2 years at 1,000 tpd, 2,100 ft (640 m) of cross-cutting and 3,500 ft (1,067 m) of drifting, 17,347,000 t of ore estimated at 1.14% Li2O. |
| 1977 | Sullivan Mining Group | 1974 resource confirmed. | |
| 1979 | Sullivan Mining Group | Diamond drilling. | 7 holes (5,320 ft (1,621 m). |
| 1985 | Sullivan Mining Group | Diamond drilling. | 2 holes (504 ft (154 m). |
| 1987 | Cambior | Acquired the Property. | |
| 1990-1991 | Cambior | Mining facilities sold. | Site rehabilitated. |
| 1993 | Cambior | Report summarizing historic mining activities (Karpoff, 1993). | |
| 2000 | Cambior | Report approving the rehabilitation. | |
| 2001 | Cambior | Grab samples. | |
| 2008 | Canada Lithium Corp. |
Metallurgical testwork to produce battery grade lithium carbonate. Drilling 8 holes. |
Metallurgical testing results encouraging. |
| 2009 | Canada Lithium Corp. | Mine data digitally compiled, diamond drilling program, twinning and infill. |
A first in-house resources estimate from historical compilation; 30-40 Mt at 1.1-1.2% Li2O. Twinning and infill; 38 drillholes (9,648 m).
|
| 2010 | Canada Lithium Corp. | New resource estimate by Caracle Creek, diamond drilling program. |
Metallurgical testwork; 67 drillholes (1,010 m); Infill and extension drilling 45 drillholes (6,938 m); A new resource model and estimate is announced (CCIC): measured and indicated: 46.6 Mt at 1.19% Li2O. |
| 2011 | Canada Lithium Corp. | PFS, diamond drilling program, RPA conduct independent review of the resources. |
RPA downgrades the resources estimate; Infill and extension drilling 63 drillholes (12,003 m); AMC report updated resource estimate: measured and indicated: 32.24 Mt at 1.19% Li2O.
|
| 2012 | Canada Lithium Corp. |
FS completed, construction of mine and plant commences. Production launched late 2012.
|
Production: 20,600t at 1.07% Li2O mined; 1,316t milled. |
| 2013 | Canada Lithium Corp. | Commissioning and ramp up in production. | Production: 303,200 t at 0.99% Li2O mined; 259,834 t milled. |
| 2014 | Canada Lithium Corp. (Restructured) |
Project delivery delays and financial difficulties; Ownership change: CLQ is restructured and becomes Québec Lithium Corp. (QLI); placed on care and maintenance. |
Production: 349,000 t at 0.99% Li2O mined and 278,922 t milled; halts production in September 2014. |
| 2015 | Québec Lithium Corp. (Restructured) | Ownership change; company restructuring; engineering studies. | Property placed in receivership; Interim production plan: Two years start-up pit plan; Project scheduling. |
| 2016 | North American Lithium Corp. |
New ownership and Project management; Infill drilling launched; engineering studies; mill recommissioning. |
Interim in-house resources estimate from new model and data; M+I: 34.4 Mt at 1.22% Li2O. Additional infill drilling: 46 (+4 re-drill) drillholes (8,910.5 m). |
| 2017 | North American Lithium Corp. | Recommissioning of concentrator; engineering |
Phase 1 hot commissioning and ramp-up started June 2, 2017. 22 geotechnical drillholes (956 m). |
| Revision: 0 – 14-Aug-2026 B198-D01-02054-RT-0010 |
Page 48 |
| NAL Expansion FS Mineral Reserve Pre-Feasibility Study NI 43-101 Final Report Prepared for Elevra |
|
| Year | Company ownership | Main Activity/Event | Main Result |
| studies; Geotechnical drilling campaign. | |||
| 2019 | North American Lithium Corp. | Drilling, exploration work and production shutdown. |
42 drillholes (11,487 m) to define Phase 2 of the pit; Shutdown of production on February 19, 2019; Stripping work in summer 2019 permitted surface mapping of the dykes. |
| 2021 | Sayona Québec | Ownership change: Sayona Québec acquires North American Lithium Inc. on August 26, 2021. | Updated resources were published on March 1, 2022. |
| 6.2 | Historical Ownership & Activities |
The original discovery of spodumene-bearing pegmatite on the Property was made in 1942, when three main spodumene dykes were intersected, along with several thinner ones. The owner at that time was Sullivan Mining Group and the Property went through several owners before being acquired by Québec Lithium Corporation (QLC) in 1954. QLC put the operation into production in 1955, after sinking a three-compartment shaft and establishing three working levels at 150 ft, 275 ft, and 400 ft. At the end of 1955, two stopes were in operation, which contained approximately 136,000 tons of ore grading 1.2% Li2O.
In mid-1959, the contract for the sale of spodumene concentrate by QLC to Lithium Corporation of America Inc. was terminated. A refinery capable of producing lithium carbonate, lithium hydroxide monohydrate, and lithium chloride was constructed in Barraute and was operational by 1960. Production of lithium hydroxide monohydrate (LiOH.H2O) began in June 1963.
In October 1965, operations were suspended on account of a strike and due to unfavourable market conditions. Altogether, from 1955 until 1965, a total of 938,292 t of ore were milled from 1,084,738 t mined from underground operations at the site. The production profile for the mine is presented in Section 6.3.
In 1974, the Sullivan Mining Group acquired the Property and contracted Surveyor, Nenniger et Chênevert Inc. (SNC), an engineering consulting firm, to table a feasibility report on the rehabilitation of the Québec Lithium mine (SNC, 1974). They investigated market conditions, alternative mining methods and metallurgical processes. They also recalculated the mining and property Li2O reserves.
In October 1987, Cambior Inc. (Cambior) acquired all assets of QLC. In 1990-1991, the mining facilities were sold, infrastructures were demolished, and the site was completely levelled and rehabilitated (Karpoff, Évaluation Technique de la Propriété Minière Québec Lithium, 1993).
In May 2008, Canada Lithium Corp. (CLC) acquired the Property and began a metallurgical testing program to produce spodumene concentrate and battery-grade lithium carbonate. In 2009, the historic mine data was digitally compiled and a 29-30 Mt exploration target for lithium, with a grade range of 1.1% to 1.2% Li2O, was estimated. This potential tonnage was verified and expanded upon through a number of drill programs completed in 2009 and 2010. In October 2010, the mineral resource was updated to a measured and indicated resource of 46.6 Mt at 1.19% Li2O.
In April 2010, CLC completed a PFS for the development of a battery-grade lithium carbonate mining and processing operation that would produce approximately 19,000tpa of lithium carbonate equivalent (LCE) over a 15-year mine life. The feasibility study was completed in December 2010.
On February 28, 2011, CLC announced the appointment of Roscoe, Postle and Associates (RPA) to undertake an independent review of the mineral resource estimate of October 2010, following an internal review that indicated a material reduction in the resources. In March 2011, CLC announced that RPA had confirmed that there were significant issues with the geological modelling that had
| Revision: 0 – 14-Aug-2026 B198-D01-02054-RT-0010 |
Page 49 |
| NAL Expansion FS Mineral Reserve Pre-Feasibility Study NI 43-101 Final Report Prepared for Elevra |
|
produced the mineral resource estimate announced on October 28, 2010. CLC then appointed AMC Mining Consultants (Canada) Ltd. (AMC) to independently conduct a resource estimate of the Project and expeditiously prepare a new technical report in accordance with NI 43-101. AMC completed the first updated resource estimate in May 2011, filed on SEDAR on June 8, 2011 (Shannon, Nussipakynova, & Pitman, 2011).
Between June and August 2011, a 63-hole infill drilling program was carried out at the Project under CLQ, comprising 12,003 m of diamond core drilling. AMC subsequently carried out an updated mineral resource estimate using a rebuilt mineralized domain model, which incorporated the latest drilling data, in addition to data from CLQ’s 2009 and 2010 drill programs, which included a certain amount of historical data. This updated resource estimate, dated December 5, 2011, reported a measured and indicated resource of 33.24 Mt at 1.19% Li2O, on which BBA estimated a pit reserve of 17.1 Mt at 0.94% Li2O (Shannon, Nussipakynova, & Pitman, 2011).
CLC completed a Feasibility Study in January 2011 (Hardie, et al., 2011) and commenced construction of the Project in September 2011 and its successor, Quebec Lithium Corp. (QLI), went on to operate the mine from late 2012 until September 30, 2014, extracting 676,800 t at 0.99% Li2O from the pit. The concentrator processed some 551,695 t of ore at 1.03% Li2O. Under CLC, the Project faced commissioning issues and mounting financial difficulties; it finally closed in November 2014 and went into receivership in January 2014.
The Project remained under care and maintenance until July 2016, when it was acquired by North American Lithium Inc., which proceeded to carry out additional infill diamond drilling and produced internal studies to recommission the Project. Plant upgrades were undertaken, and the mine and concentrator resumed operation in 2017. During 2018, the concentrator produced roughly 114,000 t of spodumene concentrate that averaged roughly 5.6% Li2O. Due to financial difficulties, the mine and concentrator ceased operations in April 2019. The concentrator was put into care and maintenance.
| 6.3 | Historical Production |
Historical underground mine production lasted 10 years from 1955 to 1965 and peaked at 247,000 t hoisted in 1957; however, production was intermittent after 1959, when the contract for the sale of spodumene concentrate to Lithium Corporation of America Inc. was terminated.
Mine production statistics can be seen in Table 6-2.
Table 6-2: Mine Production Statistics
| Year | Tonnes of Ore Hoisted | Tonnes of Ore Milled |
| 1955 | 10,537 | 9,570 |
| 1956 | 240,732 | 216,190 |
| 1957 | 246,946 | 205,816 |
| 1958 | 170,739 | 142,511 |
| 1959 | 183,769 | 150,858 |
| 1960 | 4,765 | 3,351 |
| 1961 | 21,237 | 23,013 |
| 1962 | 16,566 | 12,825 |
| 1963 | 63,044 | 60,710 |
| 1964 | 69,723 | 63,614 |
| 1965 | 56,680 | 49,834 |
| Total | 1,084,738 | 938,292 |
While it is not known if there were some tonnage reconciliation adjustments contributing to the numbers above, it is noted that hand sorting activities were employed to remove non-dyke material and upgrade the mill feed during the course of historical operations. The total figures above suggest a difference of 13.5%, but it is postulated that sorting removed about 10% of the hoisted material.
| Revision: 0 – 14-Aug-2026 B198-D01-02054-RT-0010 |
Page 50 |
| NAL Expansion FS Mineral Reserve Pre-Feasibility Study NI 43-101 Final Report Prepared for Elevra |
|
| 6.3.1 | 2012 – 2014 Production |
Open pit mining operations (Figure 6-1) took place from late 2012 until September 30, 2014, extracting 676,800 t at 0.99% Li2O from the pit, while processing some 551,695 t at 1.03% Li2O through the concentrator. Planned reserves that were mined were 540,072 t at 1.0% Li2O while the concentrator reported 551,695 t at 1.03% Li2O. Mine operational staff were mindful of grade and quality control, but overall dilution was relatively high at 28%.
CLC officially started concentrator production in November 2012, ramping-up from a modest 20,600 t in late 2012 to 349,000 t in 2014, until September 30, 2014. The process plant never reached nameplate capacity. The concentrator struggled to meet concentrate specification and typically produced concentrate grading between 3% and 4% Li2O with iron typically ranging from 2% to 3%.
The conversion plant operated intermittently and in batch mode during 2014 and produced a total of roughly 100 t of lithium carbonate. Based on the 2012-2014 operation, major challenges included:
| ● | Higher-than-planned dilution in run-of-mine ore. |
| ● | Mining costs were higher than anticipated due to the narrow vein nature of the deposit. |
| ● | High levels of dilution led to processing issues and production of low-quality concentrate. |
| ● | Competition for skilled labour with other mines in the Abitibi-Témiscamingue region. |
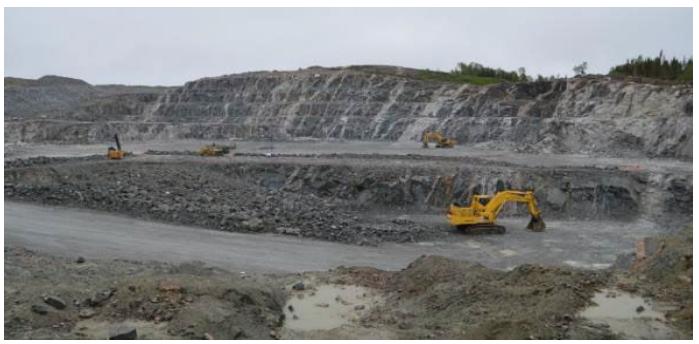
Figure 6-1: Québec Lithium Project Open Pit Mine Operations at Peak in 2014
| 6.3.2 | 2017 – 2019 Operations |
Plant upgrades were undertaken prior to restarting the mining and concentrator operation in 2017. Major plant upgrades included installation of a second ore sorter, modifications to the crushed ore silo, and addition of a wet high-intensity magnetic separator.
Efforts were made to improve operational procedures to better understand and manage dilution in the run-of-mine ore. Mining and processing worked closely together to establish upper specification limits on iron content in the feed to the mill. Geology, mining, and process teams worked in collaboration both on understanding sources of dilution and on aligning key production indicator (KPI) for operations.
| Revision: 0 – 14-Aug-2026 B198-D01-02054-RT-0010 |
Page 51 |
| NAL Expansion FS Mineral Reserve Pre-Feasibility Study NI 43-101 Final Report Prepared for Elevra |
|
The NAL mine and concentrator operated from June 2017 to March 2019. The aim was to maintain host rock dilution below 20%. During operation, roughly 1.5 Mt of ore was fed to the plant. The concentrator produced roughly 166,000 t of spodumene concentrate, typically ranging in grade from 5.5% to 6.0% Li2O and 0.9% to 1.6% Fe. The plant never achieved nameplate capacity (3,800 tpd) and due to depressed spodumene concentrate prices, the plant was put into care and maintenance in April 2019.
| 6.4 | 2021 Acquisition to Present |
Sayona Québec acquired the NAL project in August 2021. A PFS was completed in May 2022 for the restart of mining and concentrator operations. Significant process plant upgrades were implemented to ensure production of high-quality chemical-grade spodumene concentrate at nameplate capacity. Operation of the concentrator commenced in March 2023, with first spodumene concentrate sold in August 2023. The mine is a currently operating spodumene producer.
| Revision: 0 – 14-Aug-2026 B198-D01-02054-RT-0010 |
Page 52 |
| NAL Expansion FS Mineral Reserve Pre-Feasibility Study NI 43-101 Final Report Prepared for Elevra |
|
| 7 | Geology and Mineralization |
This chapter describes the NAL Property geological setting and mineralization. Information contained in this chapter was previously published by Sayona in an ASX Press Release and JORC (2012), dated August 27th, 2025, and in a NI 43-101 Technical Report titled “Definitive Feasibility Study Report for the North American Lithium Project, dated April 14th, 2023.
| 7.1 | Regional Geology |
The Archean Preissac-La Corne batholith is a syn- to post-tectonic intrusion that was emplaced in the Southern Volcanic Zone of the Abitibi Greenstone Belt of the Superior Province of Québec. The batholith intruded along the La Pause anticline into the ultramafic to mafic lavas of the Kinojevis (2,718 Ma; Corfu 1993) and Malartic groups, and biotite schist of the Kewagama Group. The batholith is bound to the north by the Manneville fault and to the south by the Cadillac fault and the eastward extension of the Porcupine-Destor fault.
The batholith is a composite body comprising early metaluminous gabbro, diorite, monzonite, and granodiorite (ca. 2,650-2,760 Ma: Steiger and Wasserburg 1969, Feng and Kerrich 1991) and four late peraluminous monzogranitic plutons (Preissac, Moly Hill, La Motte and La Corne) and associated pegmatites and quartz veins (ca. 2,621-2,655 Ma: Gariépy and Allègre 1985, Feng and Kerrich 1991). The final intrusive activity in the area was the Proterozoic diabase dykes. The regional metamorphic grade is greenschist facies and close to the batholith is hornblende hornfels facies contact metamorphism.
| 7.2 | Local Geology |
The geology of La Corne and Fiedmont Townships is described in reports by Tremblay 1950, Dawson 1966 and Mulja et al., 1995 and is shown on the Geological Survey of Canada (GSC) map 999A (Tremblay, 1950) and GSC map 1179A (Dawson, 1966). Local geological units are summarized in Table 7-1.
Table 7-1: Geological Units
| Geologic Unit | Description |
| Basaltic Lavas Malartic and Kinojevis Groups 2.718 Ma |
Volcanic rocks are generally fine-grained and medium to dark green on fresh surfaces. The units are massive or locally exhibit structures such as pillows, flow breccia or amygdule. Under the microscope, the volcanic rocks are mainly green hornblende, plagioclase with minor amounts of quartz, epidote, biotite, and chlorite. Accessory minerals include titanite, apatite, magnetite, pyrite and an alteration product of ilmenite, leucoxene. The abundant green hornblende shows incipient alteration to chlorite or partial replacement by holmquistite. |
|
Biotite Schist Kewagama Group
|
The biotite schists are conformably interbedded with the basaltic lavas. The schists are mainly sedimentary in origin, derived from greywacke, sandstone, and conglomerate. The biotite schist beds are up to 40 cm thick, fine-grained and are grey to black on fresh surfaces. They are foliated with the foliation parallel with either the contact or the foliation in the outcrops of the Preissac-La Corne batholith. Under the microscope, the biotite schist consists mainly of quartz, plagioclase, and biotite. Hornblende and chlorite are major components in a few beds. The common accessory minerals are apatite, epidote, tourmaline, pyrite, and magnetite. |
|
Metaperidotite
|
The metaperidotite is interbedded with basaltic lavas and, less commonly, with biotite schists. Metaperidotite is fine-grained and black or dark green in colour. The weathered surface is typically brown and exhibits a variety of textures, including polygonal fracture systems, pseudo-pillow structures and a platy structure, which is likely komatiite. The metaperidotite consists mainly of felted aggregates of chlorite flakes, acicular to prismatic actinolite, fibrous serpentine and talc flakes with accessory magnetite, carbonate, and pyrite. The platy structure consists of planar concentrations of chlorite and serpentine, alternating with similarly shaped concentrations of actinolite and magnetite. Primary olivine and/or pyroxene relicts are pseudomorphed by aggregates of chlorite, serpentine, talc, magnetite, and carbonate. |
| Revision: 0 – 14-Aug-2026 B198-D01-02054-RT-0010 |
Page 53 |
| NAL Expansion FS Mineral Reserve Pre-Feasibility Study NI 43-101 Final Report Prepared for Elevra |
|
| Geologic Unit | Description |
|
Granodiorite La Corne Pluton 2,621-2,655 Ma
|
The La Corne pluton has been described by Mulja et al. (1995a). It is dominated by biotite monzogranite, which gives way inward to two-mica and muscovite monzogranite. The geology of the La Corne pluton is similar to that of the rest of the Preissac-La Corne batholith. |
|
Gabbro/Diabase Dykes Proterozoic age |
There are post-batholithic gabbro/diabase dykes that outcrop in the batholith and nearby as tabular bodies up to 60 m wide and several kilometres long, striking either N25º E or N40º E and dipping vertically. The gabbro is fine- to medium-grained and tends to be ophitic. |
Local geological units comprise (from oldest to youngest): basaltic lavas (Malartic and Kinojevis Groups), biotite schist (Kewagama Group), metaperidotite and monzogranite (La Corne pluton).
Local stratigraphy and local geology are shown in Figure 7-1 and Figure 7-2.
The Manneville fault, a major strike fault, is occasionally exposed in the basaltic lava outcrops along the north side of the batholith. As a result of the strike of N80º W, the distance between the fault and the batholith varies from approximately 3.2 km north of Preissac to less than 1.6 km at Lac Roy. It contains some base metal sulphides, locally. Many of the lithium-bearing dykes occur within 2.5 km SW and roughly parallel with the Manneville fault.
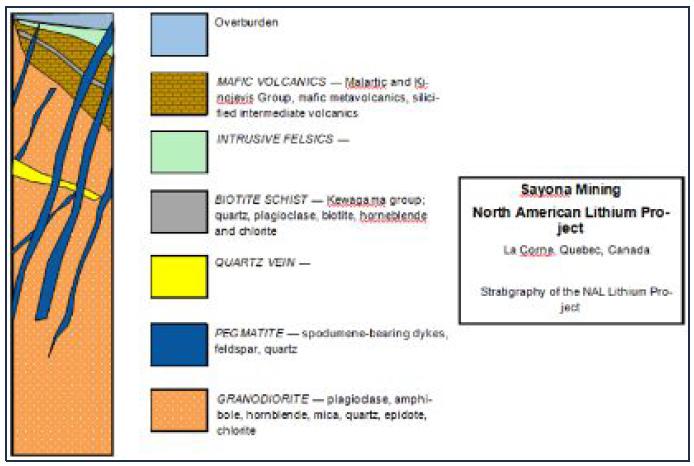
Figure 7-1: Stratigraphy of NAL Property
| Revision: 0 – 14-Aug-2026 B198-D01-02054-RT-0010 |
Page 54 |
| NAL Expansion FS Mineral Reserve Pre-Feasibility Study NI 43-101 Final Report Prepared for Elevra |
|
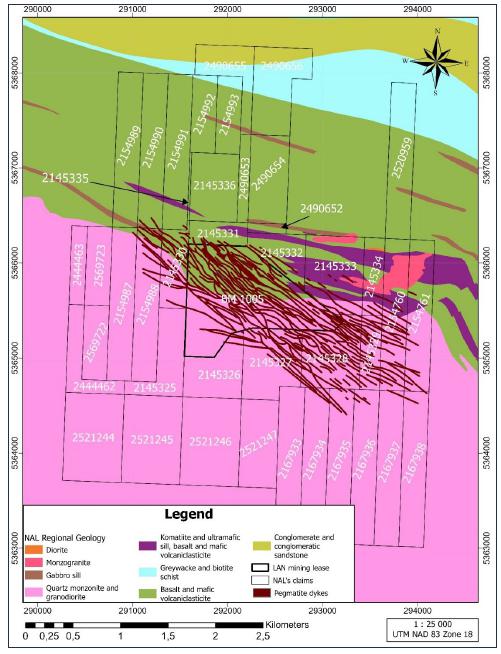
Figure 7-2: Local Geology of NAL Property
| Revision: 0 – 14-Aug-2026 B198-D01-02054-RT-0010 |
Page 55 |
| NAL Expansion FS Mineral Reserve Pre-Feasibility Study NI 43-101 Final Report Prepared for Elevra |
|
| 7.3 | Property Geology |
Figure 7-3 shows the Property geology including an interpreted surface projection of spodumene-bearing pegmatite dykes.
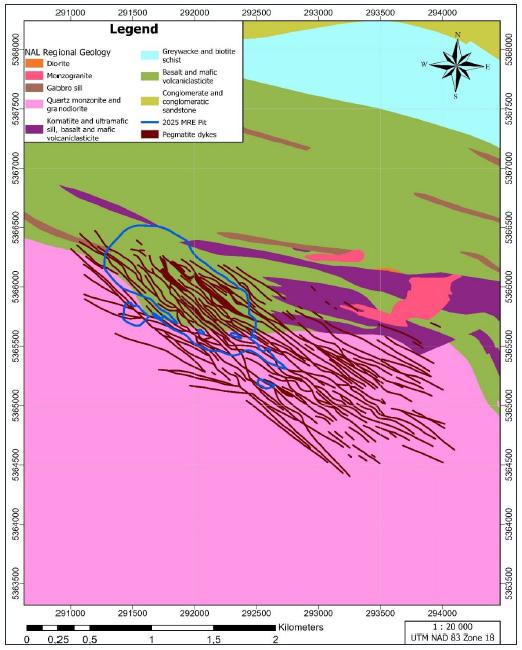
Figure 7-3: Geology of NAL Property, Centred on the Currently Interpreted Mineralized System
| Revision: 0 – 14-Aug-2026 B198-D01-02054-RT-0010 |
Page 56 |
| NAL Expansion FS Mineral Reserve Pre-Feasibility Study NI 43-101 Final Report Prepared for Elevra |
|
Figure 7-4 presents a representative geological cross-section of the Property. Property-scale geological units comprising volcanics, gabbro, granodiorite and pegmatite dykes are described below.
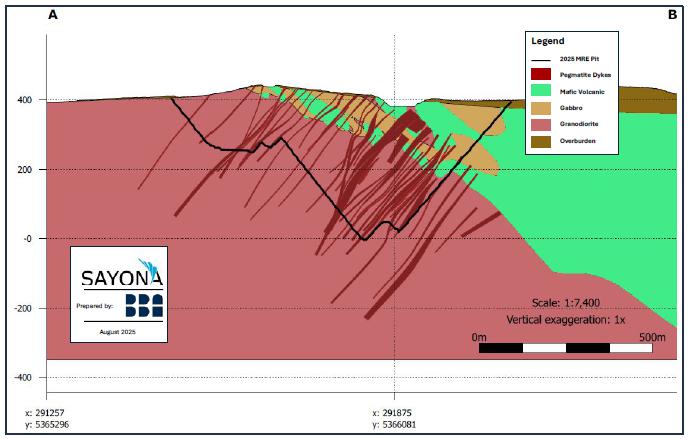
Figure 7-4: NE – SW Geological Cross-Section of Mineralized System
| 7.3.1 | Volcanics |
Volcanic rocks are represented by dark green mafic metavolcanics and medium grey silicified intermediate volcanics. The mafic metavolcanics range from medium grey to dark grey-green and are cryptocrystalline to very fine-grained. While these rocks are mostly massive, they occasionally display compositional banding with slightly coarser-grained amphibole. Some of the mafic volcanic rocks exhibit weak to moderate foliation, featuring minor dark green amphibole-rich bands and irregular patches that generally follow the foliation. Overall, these mafic volcanic rocks are quite hard and sometimes magnetic.
Both mafic and intermediate volcanic rocks show moderate to strong pervasive silicification, with minor chloritization and varying degrees of lithium alteration. Green hornblende alteration is observed near the spodumene-bearing pegmatite dykes. Additionally, there are fine-grained, weakly foliated, dark green amphibolites. Locally, a salt-and-pepper appearance is present where plagioclase is more prominent, making the amphibolite difficult to scratch. These amphibolites undergo strong pervasive potassic alteration, which is evident as biotisation and widespread or patchy lithium alteration.
| 7.3.2 | Granodiorite |
The granodiorite is massive, coarse-grained to porphyritic, medium grey to greenish grey in colour and exhibits a salt-and-pepper appearance. Granodiorite locally contains fragments of the same composition or that are slightly enriched in muscovite.
The main mineral constituents of granodiorite are light grey to greenish white plagioclase (40-45 vol%), dark green to black amphibole, most likely hornblende (15-20 vol%), mica (20 vol%),
| Revision: 0 – 14-Aug-2026 B198-D01-02054-RT-0010 |
Page 57 |
| NAL Expansion FS Mineral Reserve Pre-Feasibility Study NI 43-101 Final Report Prepared for Elevra |
|
represented by biotite and muscovite, grey quartz (10-15 vol%) and minor epidote, chlorite and disseminated sulphides. The grain size ranges from 0.5 mm to 5 mm. Granodiorite has patchy to pervasive lithium and/or chlorite alteration, weak epidote alteration, and locally pervasive potassic alteration.
| 7.3.3 | Pegmatite Dykes |
Three different types of pegmatite dykes have been identified based on mineralogy and textures: PEG1, PEG2 and PEG3. These are described in Table 7-2 and Figure 7-5, Figure 7-6 and Figure 7-7. PEG1 textural characteristics are described in Table 7-3.
The main differences between the three types of pegmatite dykes are the amount of spodumene, feldspar and quartz, the texture of the pegmatite and the presence or absence of zoning. Spodumene grain size can be highly variable within a zone and overall, through entire intersections.
Table 7-2: Pegmatite Types in the Property
| Pegamatite Type | Description |
| PEG1 | PEG1 dykes are zoned and contain five mineralogical/textural zones described in Figure 7-5Table 7-3. |
|
PEG2
|
PEG2 dykes are not zoned and contain coarse- to medium-grained, light grey and with pale yellowish-green crystals of spodumene (5-15 vol%), grey quartz (35-40 vol%), white megacrystals of plagioclase and K-feldspar (40-50 vol% and, most likely, albite and orthoclase), occasional millimetre-sized garnets, light coloured mica that is possibly lepidolite, flakes of biotite, specks of molybdenite, very rare chalcopyrite surrounded by brownish anhedral mineral with resinous lustre that is possibly sphalerite. The spodumene mineralization occurs from contact to contact with no apparent zonation; concentration varies from 2-3 vol% to approximately 20 vol%.
Spodumene crystals can be both tabular and needle-shaped within the same intersection. Euhedral crystals are common, while preferred orientations are exhibited by some spodumene crystals and can form both the matrix or fill the interstices between larger quartz, plagioclase, and K-feldspar grains, as observed in the 2016 drilling program and shown in Figure 7-5. In Figure 7-6, spodumene megacrystals in PEG2 are shown oriented perpendicular to the contact in drillhole QL-S09-026. Observed locally, Figure 7-7 shows a preferential orientation for spodumene crystalline clusters. |
|
PEG3 |
PEG3 dykes are quartz dominant and contain less than 1% spodumene. They are medium-to coarse-grained, light pink-grey to medium grey creamy pink colour, with black or grey patches of mica, i.e., biotite and muscovite. Megacrystals of mica form up to 40% of the rock. PEG3 dykes are variable in width from 0.4 m to 8.0 m, contain small vugs and very hard to scratch and cut. |
Table 7-3: Mineralogical Zoning of PEG1 Type Pegmatites (as Intersected in Core from Top to Bottom)
| Pegamatite Type | Description |
|
Quartz core |
5 cm to 50 cm zone of massive, medium- to coarse-grained grey quartz, with very rare plagioclase or spodumene crystals. Spodumene near the quartz core is white, elongated, and crystals up to 10 cm long and 1 cm wide were observed in the outcrop. |
|
Spodumene zone |
Medium- to coarse-grained pegmatite, 35-40 vol% quartz, 40-50 vol% plagioclase, with white euhedral and pale yellowish green interstitial crystals of spodumene (5-20 vol%) and rare aggregates of mica (biotite). The size of the spodumene crystals varies from 0.2 cm to 14 cm. |
| Border zone | 1 cm to 10 cm fine-grained aplitic zone. Distinct change in grain size and colour. The pegmatite becomes fine-grained and uniformly grey, mainly composed of quartz-plagioclase-K-feldspar. |
| Revision: 0 – 14-Aug-2026 B198-D01-02054-RT-0010 |
Page 58 |
| NAL Expansion FS Mineral Reserve Pre-Feasibility Study NI 43-101 Final Report Prepared for Elevra |
|
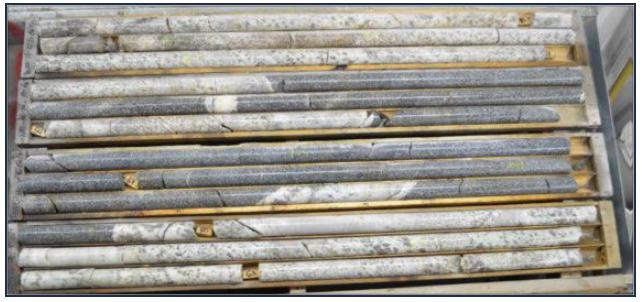
Figure 7-5: Coarse-Grained Pegmatite Dyke in Hole NAL-16-16
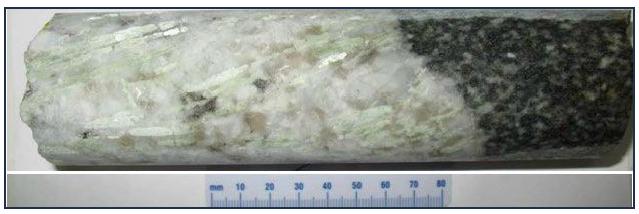
Figure 7-6: Spodumene Megacrystals Perpendicular to PEG2 Contact Zone in Hole QL-S09-026
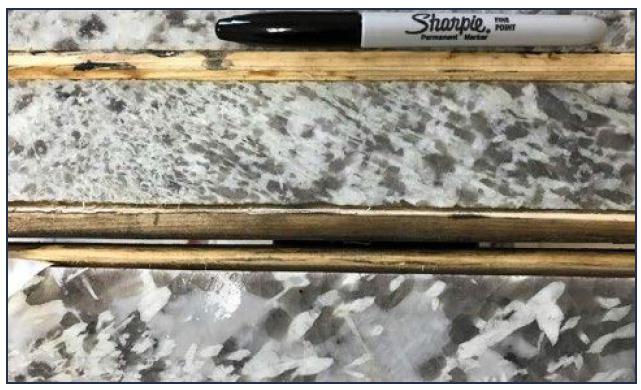
Figure 7-7: Preferential Orientation of Spodumene Crystals in Hole NAL-16-024
| Revision: 0 – 14-Aug-2026 B198-D01-02054-RT-0010 |
Page 59 |
| NAL Expansion FS Mineral Reserve Pre-Feasibility Study NI 43-101 Final Report Prepared for Elevra |
|
| 7.4 | Mineralization |
Results of past mineral exploration, resource evaluation and mining demonstrate that NAL is an extensively mineralised lithium system. The primary metal is lithium and it is mainly associated with spodumene, a lithium bearing pyroxene.
A total of 117 spodumene-bearing pegmatite dykes each with thicknesses more than 2 m have been identified in the NAL geological model.
Pegmatite mineralisation occurs as a swarm of pegmatite dykes spanning at least 3,500 m along strike in a northwest direction and 1,300 m in width. Pegmatite dykes are generally dipping subvertical to 50 degrees southwest. Pegmatite dykes have been drilled to a depth of approximately 800 m vertical, and they remain largely open at depth. A subset of pegmatite dykes strikes east-west, obliquely to the main northwest orientation. Some pegmatite dykes can be traced more than 700 m along strike in surface exposures and 70 m vertically down pit walls (Figure 7-8). Pegmatite dykes have variable widths up to 70 m.
Pegmatite dykes intrude granodiorite and mafic volcanics. They contain steeply dipping splays, splits and bends that can be mapped between benches within the open pit. Pegmatite dykes vary in width from tens of centimetres up to 90 m. Most of the pegmatite dykes greater than 3 m in width are spodumene-bearing.
Spodumene crystals are widely and variably spread throughout the dykes, displaying faint greenish shades and sometimes locally displaying centimetric to decametric crystal gradations (Figure 7-9). Pegmatite dykes display internal zoning (Figure 7-10).
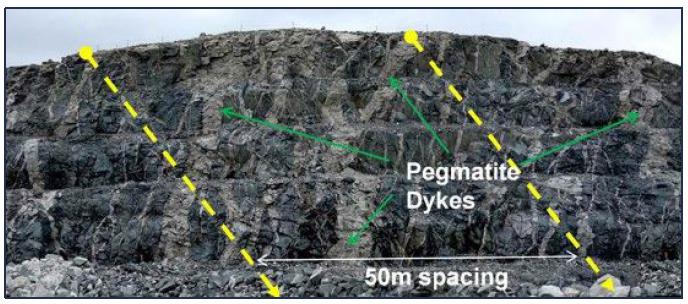
Figure 7-8: Multiple Exposure of Pegmatite Dykes in the pit (Face Looking West)
| Revision: 0 – 14-Aug-2026 B198-D01-02054-RT-0010 |
Page 60 |
| NAL Expansion FS Mineral Reserve Pre-Feasibility Study NI 43-101 Final Report Prepared for Elevra |
|
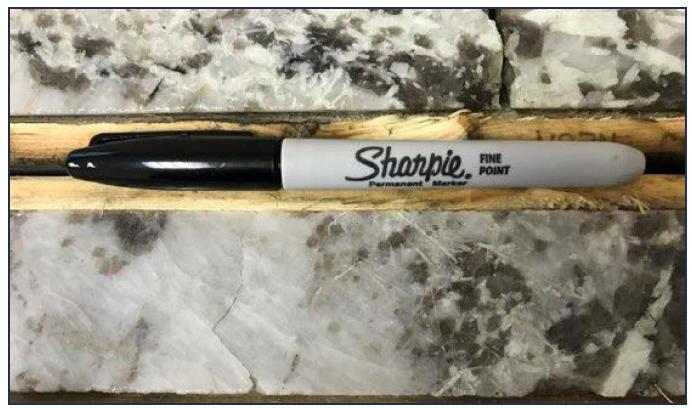
Figure 7-9: Coarse to Fine-Grained Spodumene Mineralization in Hole NAL-16-024
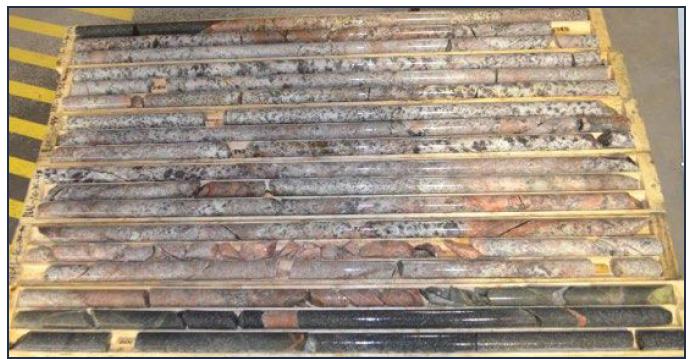
Figure 7-10: Pegmatite Dyke Zoning and Alteration in Hole NAL-16-036
| Revision: 0 – 14-Aug-2026 B198-D01-02054-RT-0010 |
Page 61 |
| NAL Expansion FS Mineral Reserve Pre-Feasibility Study NI 43-101 Final Report Prepared for Elevra |
|
| 8 | Deposit Types |
| 8.1 | Rare-Element Pegmatites of the Superior Province |
Rare-element Li-Cs-Ta (“LCT”) pegmatites may host several types of minerals with potential economic significance, such as columbite-tantalite (tantalum and niobium minerals), tin (Sn) (cassiterite), lithium (Li) (ceramic-grade spodumene and petalite), rubidium (Rb) (lepidolite and K-feldspar), and cesium (Cs) (pollucite), collectively known as rare elements, strategic and energetic metals (Selway et al., 2005). Two families of rare-element pegmatites are common in the Superior Province:
| ● | LCT enriched, and niobium-yttrium-fluorine (“Nb-Y-F” or “NYF”) enriched. LCT pegmatites are associated with S-type, peraluminous (aluminium-rich), quartz-rich granites referred to as two-mica granites. S-type granites crystallize from a magma produced by partial melting of pre-existing sedimentary source rock. They are characterized by the presence of biotite and muscovite, and the absence of hornblende. |
| ● | NYF pegmatites are enriched in rare earth elements (“REE”), uranium and thorium, in addition to Nb, Y, and F, and are associated with A-type, subaluminous to metaluminous (aluminium-poor), quartz-poor granites or syenites (Černý, 1991). |
Figure 8-1 summarizes the postulated chemical evolution of lithium-rich pegmatites with distance from the granitic source (London, 2008).
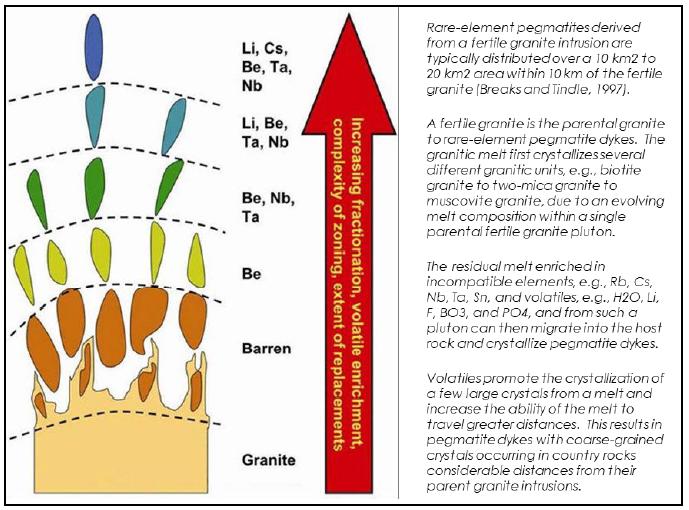
Figure 8-1: Chemical Evolution of Lithium-Rich Pegmatites
| Revision: 0 – 14-Aug-2026 B198-D01-02054-RT-0010 |
Page 62 |
| NAL Expansion FS Mineral Reserve Pre-Feasibility Study NI 43-101 Final Report Prepared for Elevra |
|
| 8.2 | La Corne Pluton Rare-Element Pegmatites |
Rare-element pegmatites associated with the La Corne pluton are LCT pegmatites, because they are enriched in Li and Ta, and they are associated with the S-type La Corne pluton, i.e., biotite to two-mica to muscovite monzogranite. The La Corne pluton is the fertile parental granite from which the pegmatites were derived. The presence of garnet, molybdenite, columbite-tantalite and sphalerite in the muscovite monzogranite indicates that the La Corne pluton is fertile granite rather than barren granite (Mulja et al. 1995a).
Figure 8-2 describes the geological evolution of the La Corne pluton and its role in the emplacement of spodumene-bearing pegmatite dykes. Rare-earth pegmatites are regionally zoned from the La Corne pluton outwards: beryl pegmatites to spodumene-beryl pegmatites, spodumene-bearing pegmatites to molybdenite-bearing albitite to molybdenite-quartz veins.
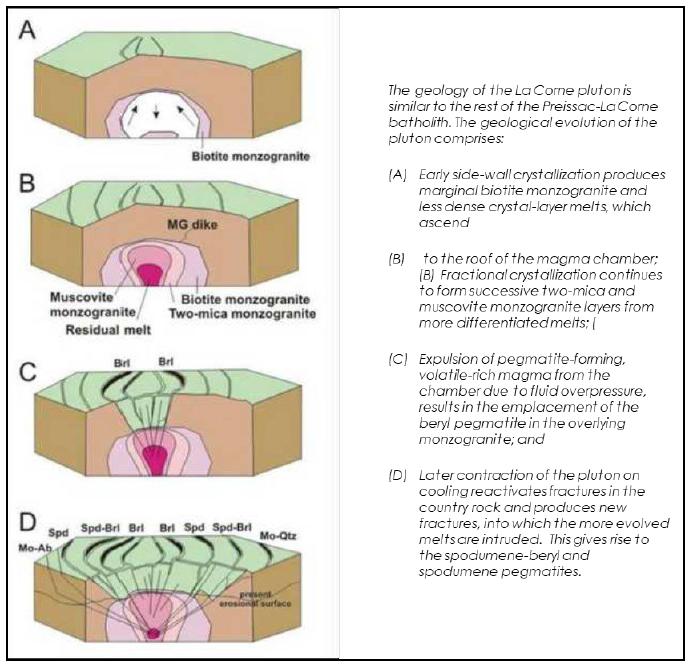
Figure 8-2: History of La Motte and La Corne Plutons
| Revision: 0 – 14-Aug-2026 B198-D01-02054-RT-0010 |
Page 63 |
| NAL Expansion FS Mineral Reserve Pre-Feasibility Study NI 43-101 Final Report Prepared for Elevra |
|
Rare-element pegmatites share characteristics with other pegmatites in the Superior Province:
| ● | They are located within the Abitibi Greenstone Belt, near the contact with the Pontiac sub province. Many pegmatites are less than 2.5 km SW of the Manneville fault zone. |
| ● | They are genetically related to the fertile La Corne pluton. |
| ● | They are hosted within basaltic lavas of the Kinojevis group. |
| ● | Basaltic lavas have undergone metasomatism, resulting in the formation of holmquistite (lithium amphibole) at the contact with the La Corne pluton. |
| ● | Spodumene is the main lithium-bearing mineral. Columbite-tantalite is the main tantalum-bearing mineral. Cesium-bearing minerals have not been identified in pegmatites. |
| ● | Columbite-tantalite crystals are found within the albite. |
| Revision: 0 – 14-Aug-2026 B198-D01-02054-RT-0010 |
Page 64 |
| NAL Expansion FS Mineral Reserve Pre-Feasibility Study NI 43-101 Final Report Prepared for Elevra |
|
| 9 | Exploration |
Elevra has not conducted any exploration work other than diamond core drilling as covered in Chapter 10 – Drilling on the Project as of the effective date of this technical report.
| Revision: 0 – 14-Aug-2026 B198-D01-02054-RT-0010 |
Page 65 |
| NAL Expansion FS Mineral Reserve Pre-Feasibility Study NI 43-101 Final Report Prepared for Elevra |
|
| 10 | Drilling |
| 10.1 | Drilling History |
Diamond core drilling is the only means of exploration employed at NAL Project for the purpose of the Mineral Resource estimate. Exploration drilling programs completed by historical companies (1942 - 1985), Canada Lithium Corp. (“CLC”) (2009 – 2011) and North American Lithium Corp. (2016 – 2019) and Sayona (2023 – 2024) are summarized in the sections below.
The Project database used in the Mineral Resource estimate contains information for:
| ● | Diamond drillholes completed in 2009, 2010, 2011, 2016 and 2019 programs. |
| ● | Diamond drill core resampling completed in 2022 by Sayona. |
| ● | Diamond drillholes completed in 2023 and 2024 programs. |
Figure 10-1 shows the location of drillholes incorporated within the Mineral Resource estimate.
| 10.1.1 | Historical (1942 – 1985) |
Drilling programs were completed from surface and underground by various operators between 1942 and 1985. In total, 873 holes were drilled, totalling 60,862 m. These historic drillholes have not been assayed and their location is uncertain. They are therefore excluded from the Mineral Resource estimate.
| 10.1.2 | Canada Lithium Corp. (2009 – 2011) |
CLC completed exploration, metallurgical and geotechnical drilling programs in 2009, 2010 and 2011. Drilling programs are summarized in Table 10-1.
Table 10-1: Summary of CLC Drillholes
| Year | Period | No. of Holes | Meters | Comments |
| 2008 | June | 8 | Unknown | Metallurgical samples |
| 2009 | October-December | 38 | 9,646 | Twinning and infill |
| 2009-10 | December-January | 67 | 1,010 | Metallurgical samples and geotechnical |
| 2010 | April-June | 45 | 6,938 | Infill and extension |
| 2011 | June-August | 63 | 12,003 | Infill and extension |
| Total | 221 | 29,597 |
The 2009 drilling program comprised 38 NQ-sized (47.6 mm core diameter) diamond drillholes and one wedge (9,646 m). Nine holes were abandoned and redrilled (470 m) because of technical difficulties. Holes were drilled on eight sections intersecting spodumene-bearing pegmatite dykes perpendicular to strike.
The 2010 drilling program comprised 45 NQ-sized diamond drillholes (6,938 m). Eight geotechnical drillholes were also completed. Holes were drilled on 15 sections intersecting pegmatite dykes perpendicular to their strike.
The 2011 drilling program comprised 63 NQ-sized diamond drillholes (12,003 m). Holes were drilled on 14 sections intersecting pegmatite dykes perpendicular to strike.
| Revision: 0 – 14-Aug-2026 B198-D01-02054-RT-0010 |
Page 66 |
| NAL Expansion FS Mineral Reserve Pre-Feasibility Study NI 43-101 Final Report Prepared for Elevra |
|
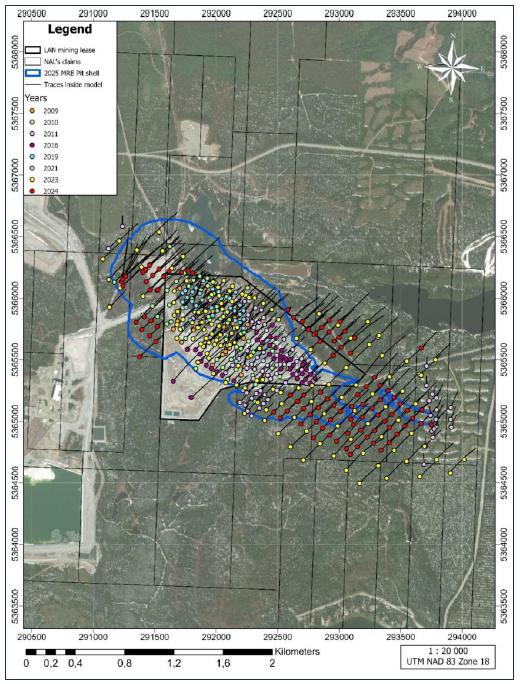
Figure 10-1: Property Map Showing Location of Drillholes Incorporated Within the Mineral Resource Estimate
| Revision: 0 – 14-Aug-2026 B198-D01-02054-RT-0010 |
Page 67 |
| NAL Expansion FS Mineral Reserve Pre-Feasibility Study NI 43-101 Final Report Prepared for Elevra |
|
| 10.1.3 | North American Lithium Corp. (2016 – 2019) |
North American Lithium Corp. completed exploration and resource definition drilling programs in 2016 and 2019 (Table 10-2).
Table 10-2: Summary of North American Lithium Corp Holes
| Year | Period | No. of Holes | Meters | Comments |
| 2016 | October-December | 46 | 8,911 | Infill and extension |
| 2019 | May-July | 42 | 11,487 | Infill and extension |
| Total | 88 | 20,398 |
The 2016 drilling program comprised 46 NQ-sized diamond drillholes, including four redrills (8,911 m). The holes were drilled on nine sections targeting the Naud pegmatite dyke, a new body of mineralization first encountered during pit excavations in 2012-2014, and on thirteen sections targeting pegmatite dyke extensions on the eastern margin of the deposit (Figure 10-2). The holes were drilled on bearings of 45°, perpendicular to the strike of pegmatite dykes.
The 2019 drilling program comprised 42 NQ-sized diamond drillholes (11,487 m). A total of 3,976 samples totalling 4,471 m, were collected, but only 308 samples were analysed due to financial constraints.
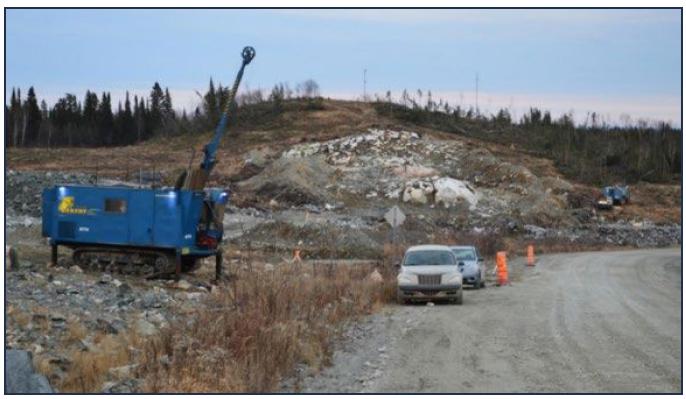
Figure 10-2: Infill and Extension Drilling Program (Late 2016)
| 10.1.4 | Sayona (2022) |
Sayona completed no exploration drilling in 2022. Sayona completed a program of historical drill core sampling in 2022 with objectives to:
| ● | Sample core intervals where they intersect modelled pegmatite dykes. In most instances the core was previously described as pegmatite but had not been sampled. |
| ● | Sample pegmatite, granodiorite, volcanics and gabbro lithologies to collate a valid Fe content database. |
| Revision: 0 – 14-Aug-2026 B198-D01-02054-RT-0010 |
Page 68 |
| NAL Expansion FS Mineral Reserve Pre-Feasibility Study NI 43-101 Final Report Prepared for Elevra |
|
| ● | Sample pegmatite, granodiorite, volcanics and gabbro lithologies to collate a valid density database. |
A total of 574 core samples were collected from 129 drillholes for Li2O % and Fe % analysis. A total of 600 core samples were collected from 97 drillholes for density measurements.
| 10.1.5 | Sayona (2023 – 2024) |
Sayona completed two major resource definition and exploration drilling programs in 2023 and 2024 (Table 10-3). The 2023 drilling program comprised 172 NQ-sized diamond drillholes (48,076 m). The 2024 drilling program comprised 153 NQ-sized diamond drillholes (53,444 m). A subset of 8 holes, totalling 305 m were not surveyed and ignored for the purpose of Mineral Resource estimation.
The 2023 and 2024 drilling programs mainly comprised definition drilling at reduced spacing in order to improve confidence in the location, width, and grade of the pegmatite dykes, and to upgrade Inferred resources to the Indicated category. The drilling also provided the opportunity to investigate the areas between historical stopes and existing mining infrastructure. Exploration drilling was completed to the northwest, north, southeast and west of the NAL open cut pit.
The 2023 and 2024 drilling campaigns programs were successful to improve confidence in the geological model and enhance the understanding of mineralisation within and outside of the current pit shell. Results of the 2023 and 2024 Programs are incorporated in the Mineral Resource estimate.
Table 10-3: Summary of Sayona Drillholes Completed in 2023 and 2024
| Year | Period | No. of Holes | Meters |
| 2023 | 1 January -31 December | 172 | 48,076 |
| 2024 | 1 January – 31 December | 153* | 53,444 |
| Total | 325 | 101,520 |
*Note: Includes drilling of drill hole extensions for two of the 2023 holes during 2024.
| 10.2 | Drilling Procedures |
Diamond drill cores are NQ diameter (47.6 mm) and HQ diameter (63.5 mm). Core recovery for all drilling programs is reported to be excellent, typically exceeding 95%. There is no correlation or bias observed between the Li2O grades obtained and core recovery. No twinned holes have been drilled on the Property.
| 10.2.1 | Collar Surveys |
CLC (2009 – 2011) and North American Lithium Corp. (2016 – 2019) employed similar methods for all drill collar surveys. Casings were left in place and capped to support future downhole testing or drill extensions.
GPS coordinates for all drill collar locations were positioned by mine-site personnel using a Trimble TSC3 precision GPS instrument and incorporated into the exploration grid.
All drillhole collars were precisely surveyed by J.L Corriveau, a local surveying contractor. The topography used is a combination of three Lidar surveys dated from September 2024 to April 1st, 2025. The grid system employed is UTM NAD 83 Zone 18.
| Revision: 0 – 14-Aug-2026 B198-D01-02054-RT-0010 |
Page 69 |
| NAL Expansion FS Mineral Reserve Pre-Feasibility Study NI 43-101 Final Report Prepared for Elevra |
|
| 10.2.2 | Downhole Surveys |
From 2009 to 2016, CLC and North American Lithium Corp. employed similar methods for downhole surveying.
In 2009, Major Drilling used a Reflex EZ-Shot and Orbit utilized a Flexit single shot. In 2010 to 2012, all drilling contractors employed a Reflex EZ-Shot.
In 2016 and 2019, drilling contractors employed Flexit testing instrument with downhole measurements every 15 m whilst drilling. Multishot tests were performed every 3 m along the hole upon closure.
In 2023 and 2024, drillhole deviation was regularly measured by the drill operator, approximately every 10 m using three instruments (EZ-Trac, SPRINT-IQ and DEVI-GYRO) and using the instrument Reflex Sprint-IQ. Multishot tests were recorded every 3 m along the hole upon closure.
Recorded measurements included depth, azimuth (magnetic north), inclination, magnetic tool face angle, magnetic field strength and temperature.
| 10.3 | Core Logging Procedures |
| 10.3.1 | Historical (1942 – 1985) |
Historical records 1942-1985 contain no information concerning drill core logging practices.
| 10.3.2 | Canada Lithium Corp. (2009 – 2011) |
Core logging procedures employed by CLC are summarized in Table 10-4.
Table 10-4: Summary of Canadian Lithium Corp. Core Logging Procedures
| Year | Description |
| 2009 |
Sample security and chain of custody commenced with removal of core from the core tube and boxing of drill core at the drill site. Core was placed in wooden boxes, sealed with lids, and secured with plastic straps. Core was transported from the drill site to CLQ’s core facility in Val-d’Or, either by the drill contractor or CLQ personnel. At the core facility, core was washed, photographed, and logged before sampling. Core logging was performed by consulting geologists, including one responsible for overseeing the 2009 on-site drilling program. Geological and geotechnical data were recorded directly into Coreview v.5.0.0 software (Visidata Pty Ltd.), with nightly exports and backups to a secure data server. |
| 2010 |
CLC established a new core facility in Val-d’Or, relocating all logging, sawing, and storage equipment to that location. Logging and sampling process was overseen by a senior geologist, with two other geologists handling the logging. Logging followed protocols of the 2009 program. |
| 2011 |
The core shack in Val-d’Or was used for the 2011 program, with all logging conducted at that facility. Core from the 2011 program, previously stored with earlier samples at the C-Lab core storage in Val-d’Or, was moved to NAL’s core storage facilities at the mine site. Logging was supervised by M.E. Lavery, P. Geo., and logging was completed by two independent contract geologists. Logging followed protocols of the 2009 and 2011 programs. |
| Revision: 0 – 14-Aug-2026 B198-D01-02054-RT-0010 |
Page 70 |
| NAL Expansion FS Mineral Reserve Pre-Feasibility Study NI 43-101 Final Report Prepared for Elevra |
|
| 10.3.3 | North American Lithium Corp. (2016 – 2019) |
Core logging procedures employed by North American Lithium Corp. are summarized in Table 10-5. Figure 10-3 and Figure 10-4 show core logging and storage facilities.
Table 10-5: Summary of North American Lithium Corp. Core Logging Procedures
| Year | Description |
| 2016 |
North American Lithium Corp. rented well-equipped core logging and sampling facilities from Royal Nickel Corporation (RNC), a local company with a regional base of operations. Core samples were placed in wooden boxes, respecting the drilling sequence, with wooden markers indicating depth. Once filled, lids were sealed on the boxes, which contractors then delivered to North American Lithium Corp. personnel for transportation to the core shack located at Amos. The RNC core shack in Amos was utilized during the 2016 drilling program, and all logging and sawing of core was completed at this facility. All core from the 2016 program is now stored at the mine site, along with core from previous years that was brought back from the C-Lab core storage facility located in Val-d’Or. The 2016 logging was supervised by the chief geologist for North American Lithium Corp. Logging was completed by two independent contract geologists using the Geotic data recording software. Protocols for the logging used in 2016 were consistent with the 2009, 2010 and 2011 programs but they were more systematic and uniform, having adopted MERN geological rock coding. Photographs of the core were taken systematically after core boxes were opened and laid out on the platform and, prior to any marking or cutting taking place, Rock quality designation (RQD) measurements were generally taken at regular intervals of 6 m, with the fracturing and recovery data being recorded. Once geologists had logged and sampled the drill core, boxes were brought back to the mine site for long-term storage on sheltered racks. |
| 2019 |
Core samples were placed in wooden boxes, respecting the drilling sequence, with wooden markers indicating depth. Once filled, lids were sealed on the boxes, which contractors then delivered to North American Lithium Corp. personnel. Logging was supervised by the chief geologist for North American Lithium Corp. Logging was completed by independent contract geologists using the Geotic data recording software. Photographs of the core were taken systematically after core boxes were opened and laid out on the platform and prior to any marking or cutting, RQD measurements were generally taken at regular intervals of 6 m, with the fracturing and recovery data being recorded. Geologists logged core on benches set up outside at mines’ core storage area. Once geologists had logged and sampled core, boxes were placed on sheltered racks. Logging protocols were consistent overall with the 2016 program. |
| 10.3.4 | Sayona (2022 – 2024) |
Core logging procedures employed by Sayona are summarized in Table 10-6.
Table 10-6: Summary of Sayona Core Logging Procedures
| Year | Description |
| 2022 to 2024 |
Drill core was placed in wooden boxes, respecting the drilling sequence, with wooden markers indicating depth. Once filled, lids were sealed on the boxes, and NAL personnel transported the core to the core shack located in the nearby town, Val-d’Or. Upon delivery to the core shack, the drill core was taken care of by the company’s team of technicians and geologists. All sampling is supervised by a geologist. Exploration drill core was logged geologically. Photographs of wet core were taken systematically after core boxes were opened and laid out on the platform and, prior to any marking or cutting taking place. Geological logging recorded qualitative descriptions of lithology, alteration, mineralization, veining and structure. Logging also includes measurement of core recovery and RQD. Geological logging of recovered drill core visually identified as pegmatites and its constituent mineralogy in lithium to determine the intervals for sampling. Samples were clearly identified in their respective bags without risk of contamination. |
| Revision: 0 – 14-Aug-2026 B198-D01-02054-RT-0010 |
Page 71 |
| NAL Expansion FS Mineral Reserve Pre-Feasibility Study NI 43-101 Final Report Prepared for Elevra |
|
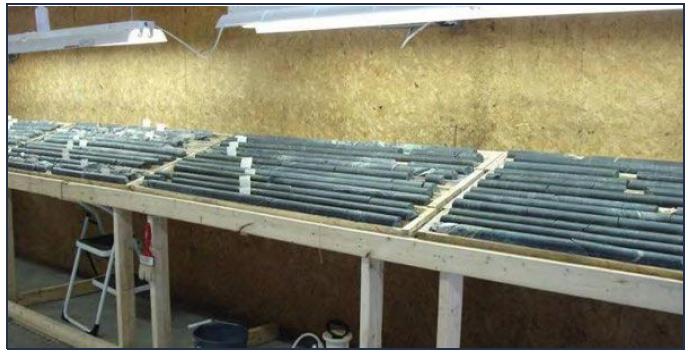
Figure 10-3: Core Logging Facilities at RNC Exploration Office in Amos (35 km from Site)
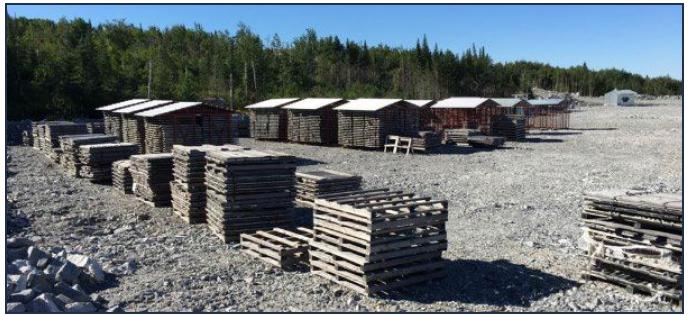
Figure 10-4: Core Storage Sheds and Facilities at the NAL Mine Site
| 10.4 | Qualified Person’s Opinion |
It is the QP’s opinion that the drilling and core logging procedures put in place by Canada Lithium Corp., North American Lithium Corp., and Sayona met acceptable standards at the time of completion and provide sufficiently reliable results for use in the Project database and Mineral Resource estimate.
| Revision: 0 – 14-Aug-2026 B198-D01-02054-RT-0010 |
Page 72 |
| NAL Expansion FS Mineral Reserve Pre-Feasibility Study NI 43-101 Final Report Prepared for Elevra |
|
| 11 | Sample Preparation, Analyses and Security |
This section outlines the sample preparation, analyses and security procedures pertaining to preparation of the Mineral Resource estimate.
| 11.1 | Sample Preparation Methods |
| 11.1.1 | Historical (1942 – 1985) |
Historical records 1942-1985 contain no information concerning the sampling methods employed for drill core sampling, nor the analytical techniques used to determine Li2O content.
A review of historical drill logs indicates that sample intervals varied from around 3 cm to 31 m, with an average interval of about 2.4 m. Assay values for %Li2O are noted either typed or handwritten on the drill logs, but no original assay certificates are available to verify these grades. A total of 806 assays were reported for 61 surface drillholes, with some grade values possibly representing composites. Information on grades for the underground drilling is not available. Historical data was excluded from the Mineral Resource estimate.
| 11.1.2 | Canada Lithium Corp. (2009 – 2011) |
Sample preparation procedures employed by CLC are summarized in Table 11-1.
Table 11-1: Summary of CLC Sample Preparation Methods
| Year | Description |
| 2009 |
A total of 2,342 core samples were collected from 38 drillholes. Core samples were sawn in half; one half of the sampled interval was submitted for analysis, and the remainder was retained in the core box for reference and future testing and/or verification. The nominal sample interval was 1 m, or less, if the pegmatite was less than 1 m in width. Lengths were adjusted as necessary to reflect geological and/or mineralization contacts. Pegmatite veins that were 0.4 m to 1 m in thickness were also sampled if spodumene was visible. Longer sample lengths were taken of strongly sheared core or sections with poor core recoveries. After cutting, the core samples were sealed with a plastic cable tie in labelled plastic bags with their corresponding sample tag. The plastic sample bags were placed in large rice sacks and secured with tape and a plastic cable tie for shipping to the laboratory. The drillhole and sample numbers were also labelled on the outside of each rice sack and checked against the contents, prior to sealing the sacks. Standards and blanks were inserted into the sample sequence prior to shipping. Samples from individual holes constitute individual batches of samples sent to the laboratory. |
| 2010 |
A total of 1,454 core samples were collected from 41 drillholes. Core samples were sawn in half. One half of the sampled interval was submitted for lithium analysis. The nominal sample interval was 1 m with more than 99.7% of the samples being 1 m or less. Lengths were adjusted as necessary to reflect geological and/or mineralization contacts. After cutting, the core samples were sealed with a plastic cable tie in labelled plastic bags with their corresponding sample tag. The plastic sample bags were placed in large rice sacks and secured with tape and a plastic cable tie for shipping to the laboratory. The drillhole and sample numbers were also labelled on the outside of each rice sack and checked against the contents, prior to sealing the sacks. Standards and blanks were inserted into the sample sequence prior to shipping. Samples from individual holes constitute individual batches of samples sent to the laboratory. In 2010, due to a change of primary laboratory, samples were delivered by CLC to the ALS Laboratory Group (ALS) preparation facility in Val-d’Or. |
| Revision: 0 – 14-Aug-2026 B198-D01-02054-RT-0010 |
Page 73 |
| NAL Expansion FS Mineral Reserve Pre-Feasibility Study NI 43-101 Final Report Prepared for Elevra |
|
| Year | Description |
| 2011 |
A total of 3,167 core samples were collected from 53 drillholes. The core shack in Val-d’Or was utilized during the 2011 program, and all the sawing of core was completed at this facility. All the core from the 2011 program that was stored with the previous years’ core at the C-Lab core storage facility in Val-d’Or has now been transferred to NAL’s core storage facilities at the mine site. The 2011 sampling was supervised by M.E. Lavery, P. Geo., and sampling was completed by two independent contract geologists. The same protocols for core cutting and sampling used in the 2009 and 2010 drill programs were used in 2011. Core samples were sawn in half. One half of the sampled interval was submitted for lithium analysis. The nominal sample interval was 1 m with more than 93% of the samples being 1 m or less. Lengths were adjusted as necessary to reflect geological and/or mineralization contacts, which created samples of less than 1 m in length. In 2011, samples were delivered by CLC personnel to the ALS facility in Val-d’Or and the samples were then shipped to ALS facilities in either Timmins or Thunder Bay for preparation. Prepared samples were shipped to Vancouver, British Columbia, for analysis. |
| 11.1.3 | North American Lithium Corp. (2016 – 2019) |
Sample preparation procedures employed by North American Lithium Corp. are summarized in Table 11-2.
Table 11-2: Summary of North American Lithium Corp. Sample Preparation Methods
| Year | Description |
| 2016 |
A total of 2,367 core samples were collected from 46 completed drillholes. The 2016 sampling was supervised by the chief geologist for North American Lithium Corp. Sampling was completed by two independent contract geologists. Protocols for core cutting and sampling were consistent with 2009 and 2010 programs. Chosen core samples were always sawn in half, with one half of the sample interval submitted for lithium analysis and the remainder kept for future testing and/or reference. The nominal sample interval was 1 m. Lengths were adjusted as necessary to reflect geological and/or mineralization contacts, which created the samples of less than 1 m length. Sample tags were fixed to core boxes. To better quantify the background values, samples of the host rocks that were immediately adjacent to the contact with pegmatite dykes were collected systematically, as samples separate from the pegmatite. Samples were delivered by North American Lithium Corp. personnel to the Techni-Lab SGB (ActLabs) laboratory facility in Sainte-Germaine-Boulé, Québec, for sample preparation and primary analysis. Coarse rejects were returned to the mine site for storage and reference, while the ALS Laboratory Group of Vancouver, British Columbia, was contracted for duplicate analyses of chosen pulp and rejects. |
| 2019 |
A total of 3,976 core samples were collected from 37 drillholes. Protocols for the core cutting and sampling that were used in 2019 were consistent with the 2016 drill program. Sampling was completed by independent contract geologists. Chosen core samples were always sawn in half, with one half of the sample interval submitted for lithium analysis and the remainder kept for future testing and/or reference. The nominal sample interval was 1 m. Lengths were adjusted as necessary to reflect geological and/or mineralization contacts, which created the samples of less than 1 m length. Samples were delivered by North American Lithium Corp. personnel to the ActLabs laboratory facility in Sainte-Germaine-Boulé, Québec, for sample preparation and primary analysis. Coarse rejects were returned to the mine site for storage and reference. ALS of Vancouver, British Columbia, was contracted for duplicate analyses of chosen pulp and rejects. Due to financial constraints, not all pegmatite intervals were sampled in 2019. These samples were sampled in 2022 (see section below). |
| Revision: 0 – 14-Aug-2026 B198-D01-02054-RT-0010 |
Page 74 |
| NAL Expansion FS Mineral Reserve Pre-Feasibility Study NI 43-101 Final Report Prepared for Elevra |
|
| 11.1.4 | Sayona (2022-2024) |
Sample preparation procedures employed by Sayona are summarized in Table 11-3.
Table 11-3: Summary of Sayona Sample Preparation Methods
| Year | Description |
| 2022 |
A total of 574 core samples were collected from 129 drillholes for Li2O % and Fe % analysis. A total of 600 core samples were collected from 97 drillholes for density measurements. After logging, core was marked by a geologist with sample intervals. Selected core samples were always split in half, with one half of the sample interval submitted for lithium, iron and density analysis, and the remainder kept for future testing and/or reference. Lengths were adjusted as necessary to reflect geological and/or mineralization contacts. Sample sizes were considered to be appropriate for the style of mineralisation. Samples were delivered by Sayona personnel to SGS Canada Inc. laboratories, for sample preparation and primary analysis. Coarse rejects were returned to the mine site for storage and reference. |
| 2023 |
A total of 24,318 core samples were collected from 172 drillholes. Protocols for core cutting and sampling were consistent with the 2022 program. Samples were delivered to ALS Canada for preparation and analysis using the ME-MS89L analytical method define as the Lowest Detection limit (DL) Multi-Element Super Trace method utilizing Sodium peroxide fusion (Na2O2) and HCl leach digest on 0.2 g aliquot. |
| 2024 |
A total of 33,399 core samples were collected from 153 drillholes. Protocols for core cutting and sampling were consistent with the 2022 program. ALS Canada continued to provide the analytical services. Same analytical method as 2023. |
| 11.2 | Analytical Laboratory Procedures |
| 11.2.1 | Canada Lithium Corp. (2009 – 2011) |
In 2009, the core samples were prepared and analysed either in Lakefield or in Toronto, Ontario, SGS Canada Inc. laboratories using a sodium peroxide fusion with atomic absorption spectrometry, method 9 - 8 - 40, to determine the %Li content. Check samples were prepared for selected samples from a split from the remaining pulps after primary analysis. The samples were packaged by SGS Canada Inc. Lakefield and sent by couriers to the ALS Vancouver laboratory.
In 2010 and 2011, The primary laboratory was ALS and the check laboratory was AGAT Laboratories Ltd. Samples were prepared at ALS Val d’Or and assayed in Vancouver using four - acid digestion with ICP-AES finish, method Li - OG63, to determine the %Li content.
| 11.2.2 | North American Lithium Corp. (2016 – 2019) |
In 2016, the primary laboratory was Techni - Lab. The samples were prepared and assayed using a four - acid digestion with ICP - AES finish, method ICP - OES, to determine the %Li content. The check laboratory for 2016 was ALS Vancouver.
In 2019, a mobile SGS Canada Inc. lab was set - up directly on site. The sample were prepared and assayed by SGS Canada Inc. to determine the %Li content of the core samples.
| Revision: 0 – 14-Aug-2026 B198-D01-02054-RT-0010 |
Page 75 |
| NAL Expansion FS Mineral Reserve Pre-Feasibility Study NI 43-101 Final Report Prepared for Elevra |
|
| 11.2.3 | Sayona (2022 – 2024) |
In 2022, SGS Canada Inc. was responsible for analysing the samples collected by Sayona. Preparation of samples was performed at the Lakefield site, Ontario. Samples were sent to Burnaby site, British Columbia for assaying.
Samples were analysed using a four-acid digestion with ICP-AES finish, Na2O2 Fusion and HNO3 to determine %Li and Fe% content of the pulverized core samples. Coarse rejects and pulps were returned to the NAL mine site for storage and reference.
Sample density measurements were also performed at SGS Canada Inc. laboratories. Specific gravity measurements were determined by the water immersion method. Samples were weighed in air and then placed in a basket suspended in water and weighed again. The samples were not waxed or sealed; however, the natural voids were not considered to be a significant issue with respect to density determination.
In 2023 and 2024, ALS performed the analytical for the Exploration and delineation drill program. The method used was ME-MS89L Super Trace Multi-Element Analysis by Sodium Peroxide Fusion and ICP-MS. A prepared sub-sample (0.2 g) is added to sodium peroxide flux, mixed well and then fused at 670 °C. The resulting melt is cooled and then dissolved in 30% hydrochloric acid. The resulting solution is analysed by a combination of inductively coupled plasma-atomic emission spectrometry (ICP-AES) and inductively coupled plasma-mass spectrometry (“ICP-MS”), with results corrected for spectral or isotopic interference.
| 11.3 | QA/QC (Analytical) Procedures |
| 11.3.1 | Canada Lithium Corp. (2009 – 2011) |
Standards and blanks were reported to have been inserted into the sample sequence prior to shipping. Documentation of specific QA / QC procedures was not available for review here.
| 11.3.2 | North American Lithium Corp. (2016 – 2019) |
In 2016, the quality of the analysis was monitored using blanks (one for approximately every 20 samples), and standards (one for approximately every 20 samples). Site technical personnel created customised lithium standards, i.e. low-grade (ST - L) and high-grade (ST), by the dilution of spodumene concentrate from the Tanco pegmatite mine in Manitoba with pulverised quartz. The spodumene concentrate was sent to Geoscience Laboratories for dilution, pulverisation to < 200 mesh and homogenisation. Additionally, several pulps were sent to a secondary laboratory as a check.
In 2016, three standards were created using pulps from the 2013 and 2014 production drillholes.
In 2016, BBA further investigated NAL’s QA/QC protocol and data produced. Sterile material labelled as “blank” was inserted in the sample stream to control contamination and sample handling errors. Customised reference materials labelled as standards A, B and C, representing low grade (0.336% Li2O), average cutoff grade (0.878% Li2O) and high grade (1.567% Li2O) material, respectively were also inserted into the sample stream. Each sample batch included insertion of one blank sample and insertion of three standard samples (A, B and C). Total QA/QC sample inserts accounted for 5 to 10% of the total material submitted.
| Revision: 0 – 14-Aug-2026 B198-D01-02054-RT-0010 |
Page 76 |
| NAL Expansion FS Mineral Reserve Pre-Feasibility Study NI 43-101 Final Report Prepared for Elevra |
|
| 11.3.3 | Sayona (2022) |
In 2022, a total of five low-grade (A), five medium grade (B), five high-grade (C) and five very high-grade (D) standards were submitted during the sampling program as part of the QA/QC procedure. Results are summarized below.
Using the determined standard A low value of 0.488% Li2O, with an SD of 0.009% Li2O, all samples were within the tolerance specification. A control chart was not generated, as five samples do not constitute a large enough sample population to accurately chart the statistics.
The determined standard B medium value of 1.03% Li2O, with an SD of 0.003% Li2O was used. A control chart was not generated, as five samples do not constitute a large enough sample population to accurately chart the statistics.
The determined standard C high-grade value of 1.52% Li2O, with a standard deviation of 0.016% Li2O was used. A control chart was not generated, as five samples do not constitute a large enough sample population to accurately chart the statistics.
The determined standard D very high-grade value of 2.21% Li2O, with a standard deviation of 0.034% Li2O was used. A control chart was not generated, as five samples do not constitute a large enough sample population to accurately chart the statistics.
Additionally, a total of twelve blank samples were dispersed throughout the sample stream during the sampling program. All samples returned values at or below detection limit. A control chart was not generated, as five samples do not constitute a large enough sample population to accurately chart the statistics.
| 11.3.4 | Sayona (2023 – 2024) |
In 2023 and 2024, four different lithium standard types supplied by Core Lithium’s Finnis Lithium Project, located in the Northern Territory in Australia, were used during the drilling campaigns.
Certified reference material (“CRM”) was produced by Ore Research & Exploration Pty. Ltd. (“OREAS”), a globally recognized supplier of CRM for mining and geochemistry. The selected OREAS lithium certified reference materials offered a systematic progression in lithium grades to support Sayona’s quality assurance and quality control programs. OREAS 750 is certified at 0.496 % Li2O (low grade), OREAS 751 at 1.01 % Li2O (low to medium grade), OREAS 752 at 1.52 % Li2O (medium grade), and OREAS 753 at 2.19 % Li2O (high grade). This series was specifically designed to bracket the range of lithium concentrations typically reported at NAL, thereby ensuring robust method validation and quality control across a spectrum of ore grades.
QA/QC procedures also involved inserting sterile material, labelled as “blank,” into the sample stream to monitor contamination and handling errors. A total of 1100 blank samples were inserted in 2023, and a total of 2025 blank samples were inserted during the 2024 drilling program.
| 11.4 | Qualified Person’s Opinion |
In the Qualified Person’s opinion, the methods used for sample preparation and analysis provide sufficiently reliable results for use in the Project database and Mineral Resource estimate.
| Revision: 0 – 14-Aug-2026 B198-D01-02054-RT-0010 |
Page 77 |
| NAL Expansion FS Mineral Reserve Pre-Feasibility Study NI 43-101 Final Report Prepared for Elevra |
|
| 12 | Data Verification |
This section describes the data verification process for NAL Property.
| 12.1 | Previous Audits and Reviews |
In 2009, data for drill holes completed in that year was audited by Ms. Stone, P.Geo. CCIC. The audit included review of assay certificates, down hole deviation, hard copy records of the down hole survey results, logging codes for pegmatites and checks for data logged, sampled or measured. The 2009 drill hole database was considered to be acceptable for use in resource estimation.
In 2011, Roscoe, Postle and Associates completed an independent review of the Mineral Resource estimate. AMC subsequently completed an independent Mineral Resource estimate in compliance with NI 43 - 101 guidelines. Upon completion of infill drilling in 2011, AMC completed validation work leading to an updated Mineral Resource estimate.
In 2016, SGS Canada Inc. audited the drilling data collected in that year.
In 2016, InnovExplo performed a due diligence review of NAL drilling, core handling, sampling and QA/QC protocols.
In 2016, BBA further investigated NAL’s QA/QC protocol and data produced.
In 2021, BBA audited the drilling data and the geological model completed by NAL in 2019.
In 2022, BBA as previous QPs completed a site visit to NAL mine. The site visit included a field tour of the main geological features visible in the current open pit, a tour of the core storage facility, visual inspections of drill cores and discussions with geologists and engineers of Sayona. Selected drillhole collars in the field were also validated. The site visit also included a review of the sampling and assay procedures, QA/QC program, downhole survey methodologies, and the descriptions of lithologies, alteration and structures.
| 12.2 | Site Visits |
Optimal Mining’s QP visited the Project and its existing installations between September 10th and 12th, 2024 inclusive. The 2024 site visit included a field tour of the current operating open pit’s Phase 1 operations, Phase 2 operations and Phase 3 operations (Figure 12-1 to Figure 12-3). Extensive discussions were held with management, geologists and engineers of Sayona Québec during the site visit.
A site visit was also completed on May 27th, 2025, by other consultants engaged in the preparation of the Mineral Resource estimate.
The site visit included a field tour of the main geological features visible in the current open pit (Figure 12-1), a tour of the core storage facility (Figure 12-2), visual inspections of drill cores (Figure 12-3), and discussions with on-site geologists and engineers of Elevra Québec.
Selected drillhole collars in the field were also validated. The site visit also included a review of the sampling and assay procedures, QA/QC program, downhole survey methodologies, and the descriptions of lithologies, alteration and structures (Figure 12-3).
| Revision: 0 – 14-Aug-2026 B198-D01-02054-RT-0010 |
Page 78 |
| NAL Expansion FS Mineral Reserve Pre-Feasibility Study NI 43-101 Final Report Prepared for Elevra |
|
| 12.2.1 | Field Collar Validation |
Some drill collars were surveyed by a Garmin Rino 755t handheld global positioning system (GPS) unit. These collar readings compared to the recorded collar locations in the Project database; deviations between these two readings were within the expected resolution of the handheld units.
| 12.2.2 | Drilling and Sampling Procedure Validation |
Drill core inspection and discussions were completed with on-site geologists to confirm that drilling and sampling procedures were generally well applied.
Several sections of mineralized core were reviewed while visiting the Project. All core boxes were labelled and properly stored outside. Sample tags were present in the boxes. It was possible to validate sample numbers, confirm the presence of mineralization in core trays and witness half-core samples from the mineralized zones (Figure 12-3).
Drilling was not underway during the site visit; it was however possible to follow the entire path of drill core from drill rig to logging and sampling to the laboratory to Project database by reviewing historical reports.
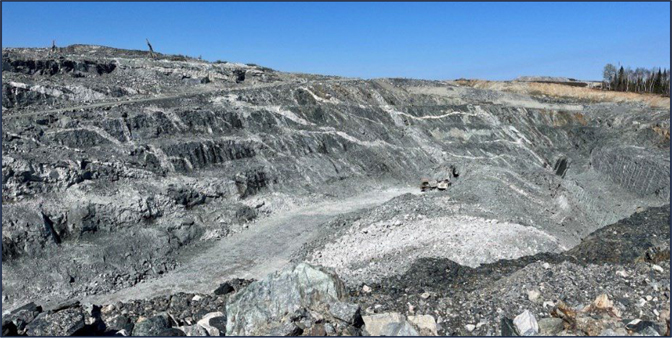
Figure 12-1: View of the Open Pit Visited During the Site Tour
| Revision: 0 – 14-Aug-2026 B198-D01-02054-RT-0010 |
Page 79 |
| NAL Expansion FS Mineral Reserve Pre-Feasibility Study NI 43-101 Final Report Prepared for Elevra |
|
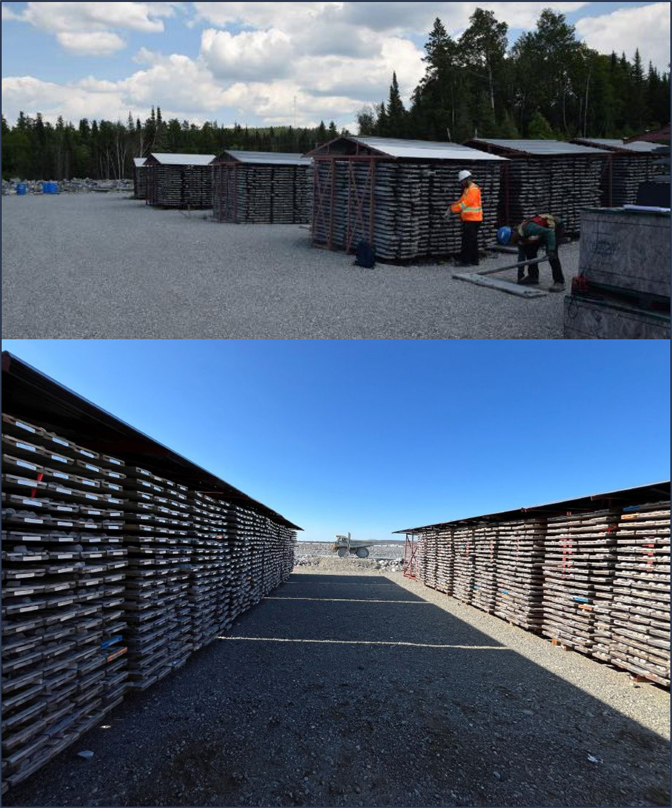
Figure 12-2: Core Storage Facility at the Project Site
| Revision: 0 – 14-Aug-2026 B198-D01-02054-RT-0010 |
Page 80 |
| NAL Expansion FS Mineral Reserve Pre-Feasibility Study NI 43-101 Final Report Prepared for Elevra |
|
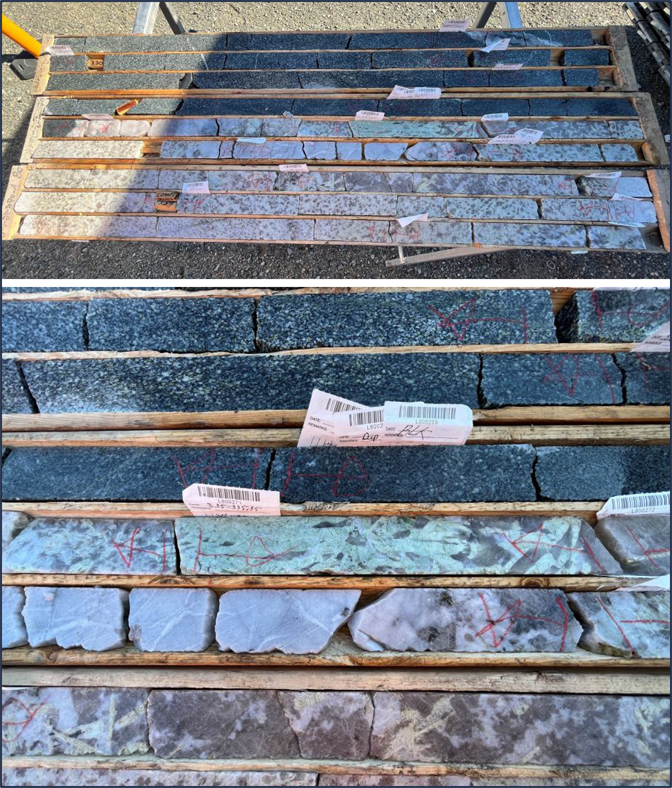
Figure 12-3: Core Review at the Core Storage Facility
| Revision: 0 – 14-Aug-2026 B198-D01-02054-RT-0010 |
Page 81 |
| NAL Expansion FS Mineral Reserve Pre-Feasibility Study NI 43-101 Final Report Prepared for Elevra |
|
| 12.2.3 | Log and Core Box Validation |
During the site visit, visual inspections of drill core were completed for four discrete geological intervals in drillholes completed during the 2024 drilling campaign (Table 12-1). Core boxes were withdrawn from the core rack and laid on the ground to review the selected intervals.
Table 12-1: Geological Intervals Inspected During Site Visit
| BHID | Depth (m) | |
| From | To | |
| LAN-24-170 | 297 | 337 |
| LAN-24-179 | 29 | 50 |
| LAN-24-262 | 265 | 306 |
| LAN-24-270a | 302 | 343 |
| 12.2.4 | Validation Of Sample Preparation, Analytical, QA/QC and Security Procedures |
Discussions were held with on-site personnel to confirm that the sample preparation, analytical, QA / QC and sample security procedures are adequately applied.
A visual inspection of several sections of core boxes confirmed that all core boxes were labelled and properly stored. Sample tags were present in the boxes, and it was possible to validate sample numbers and visually confirm the presence of spodumene mineralization in the remaining half-core.
| 12.3 | Database Validation |
All sampling and assay information are stored in a secure GeoticLog database located on the Sayona Québec server at the NAL site and containing restricted access. The server is backed up daily, and backups are stored in a different building at the NAL site. Assay results from the laboratory with corresponding sample identification are loaded directly into the GeoticLog database.
The digital drill hole database was audited by personnel engaged in the preparation of the Mineral Resource estimate using validation tools for: collar location, azimuth, dip, hole length, survey data and analytical values. There were no relevant errors or discrepancies noted during the validation.
A representative number of assays contained in the Project database were validated against the laboratory certificates. No discrepancies were noted.
| 12.4 | Qualified Person’s Opinion |
It is the QP’s opinion that the drilling, sampling and assaying protocols in place are adequate. The Project database provided by Elevra is of acceptable quality and is suitable for use in the Mineral Resource estimate.
| Revision: 0 – 14-Aug-2026 B198-D01-02054-RT-0010 |
Page 82 |
| NAL Expansion FS Mineral Reserve Pre-Feasibility Study NI 43-101 Final Report Prepared for Elevra |
|
| 13 | Mineral Processing and Metallurgical Testing |
This chapter summarizes testwork results, plant operating data, and other relevant information that has led to the identification of process improvement opportunities and form the basis for process design for the NAL spodumene concentrator. Information contained in this chapter was previously published by Sayona in a NI 43-101 Technical Report titled “Definitive Feasibility Study Report for the North American Lithium Project”, dated April 14th, 2023.
In recent history, the NAL concentrator operated from March 2013 to September 2014 (Québec Lithium Inc.), and June 2017 to March 2019 (North American Lithium Inc.). The concentrator was restarted in March 2023 (Sayona Quebec Inc.) and is currently operational (Elevra Lithium Limited).
Extensive metallurgical testwork has been undertaken on ore from the NAL deposit since 2008 including:
| ● | 2008 – A development program involving grindability tests, DMS separation, flotation, locked cycle tests and pilot scale testwork. |
| ● | 2011 – Ore Sorting. |
| ● | 2014 – WHIMS. |
| ● | 2016 – Restart Testwork involving hardness characterisation, WHIMS testwork and flotation tests. |
| ● | A comprehensive program was undertaken in between 2019 and 2022 looking at the metallurgical performance and characteristics of blends of NAL and Authier material. |
Extensive metallurgical testwork has also been undertaken for the Authier Project including historical testwork since 1969 and has focused on flotation including historical testwork in 1969, 1991, 1997, 1999 and 2012. More recent modern testwork commenced in 2018 by Sayona Quebec involved hardness characterisation, bench and pilot scale flotation.
Operational data was also reviewed as part of the Mineral Reserves PFS to inform mass balances, recoveries and forward works program.
| 13.1 | North American Lithium – Historical Process Plant Operations |
| 13.1.1 | Québec Lithium Concentrator Operations (2013 – 2014) |
The Québec Lithium Project operated from March 2013 until September 2014. The concentrator never reached nameplate capacity and was unable to produce chemical grade spodumene concentrate. The major issue encountered during operation was higher than expected dilution from the mine. The waste rock contained iron-bearing silicate minerals that could not be adequately rejected in the concentrator flowsheet. The result was the production of low-grade spodumene concentrate (ca. 3% to 4% Li2O) with high iron concentrations (ca. 2% to 3% Fe).
Process plant design was based on testwork operated on samples with little to no dilution. During operation, typical levels of dilution in run of mine (ROM) ore were roughly 20%.
Major process plant deficiencies that limited throughput and concentrate quality included:
| ● | Higher than anticipated dilution in ROM ore. |
| ● | Design flaws in the crushing circuit (e.g., materials handling issues, material freezing, inadequate dust collection). |
| ● | Limited buffer capacity in the crushed ore silo. |
| Revision: 0 – 14-Aug-2026 B198-D01-02054-RT-0010 |
Page 83 |
| NAL Expansion FS Mineral Reserve Pre-Feasibility Study NI 43-101 Final Report Prepared for Elevra |
|
| ● | Inadequate iron-bearing mineral rejection in the flowsheet. |
| ● | Inadequate high-intensity conditioning ahead of flotation. |
| 13.1.2 | North American Lithium Concentrator Operations (2017 – 2019) |
Prior to NAL concentrator restart in 2017, several plant upgrades were implemented including:
| ● | Installation of a secondary optical near-infrared (NIR) ore sorter. |
| ● | Modifications to the crushed ore silo. |
| ● | Installation of a wet high-intensity magnetic separator (WHIMS) ahead of the flotation circuit. |
| ● | Modifications to the high-intensity conditioning tank. |
The NAL concentrator operated from June 2017 until March 2019. The concentrator never reached nameplate capacity and typically produced spodumene concentrate ranging in grade from 5.5% to 6.0% Li2O.
Figure 13-1 shows monthly spodumene concentrate production. During 2018 and 2019, monthly production ranged from roughly 4,500 t to 13,250 t. At the time, nameplate capacity was roughly 15,900 t of 5.8% Li2O concentrate.
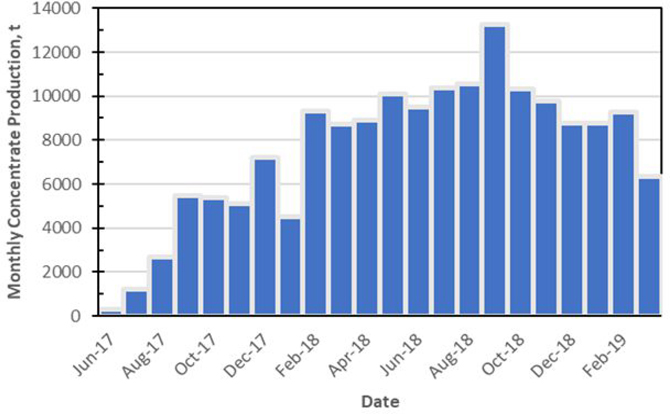
Figure 13-1: Monthly Spodumene Concentrate Production
Figure 13-2 shows monthly averages of spodumene concentrate lithia (Li2O) and iron grades and lithium recovery. After initial plant start-up in 2017, concentrate grades ranged from 5.4% to 6.0% Li2O and from 0.9% to 1.6% Fe. Lithium recovery ranged from roughly 55% to 70% for the same period.
| Revision: 0 – 14-Aug-2026 B198-D01-02054-RT-0010 |
Page 84 |
| NAL Expansion FS Mineral Reserve Pre-Feasibility Study NI 43-101 Final Report Prepared for Elevra |
|
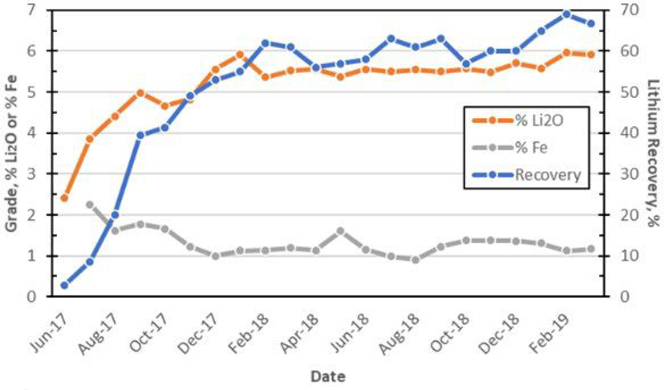
Figure 13-2: Concentrate Grade and Lithium Recovery (Monthly Averages)
Several plant improvement projects were identified which would be required to reach plant nameplate capacity and ensure production of chemical grade spodumene concentrate:
| ● | Modifications to the primary crusher dump hopper and feeder. |
| ● | Improvements in the crushing circuit (e.g., materials handling, dust collection). |
| ● | Increased crushed ore buffer capacity. |
| ● | Installation of a third ore sorter (in parallel to the existing secondary sorter); Increased screening capacity in the ball mill circuit. |
| ● | Improved magnetic separation (installation of a LIMS and a second WHIMS). |
| ● | Installation of a new high-intensity conditioning tank ahead of flotation. |
| ● | Increase spodumene concentrate filter capacity. |
| 13.1.3 | Sayona Quebec Concentrator Operations (2023 – Present) |
Concentrator operations restarted in March 2023 and is processing lithium-bearing pegmatite ore from the NAL mine. The concentrator underwent a period of commissioning and then ramp up following start-up. For Q3 2025, the concentrator operated with a higher-grade feed of 1.2 to 1.4% Li2O, to produce a lithium concentrate of 5.1 to 5.2% Li2O and at a lithium recovery of 72%. Year to date concentrate was 5.2% Li2O at a Li recovery of 70.8%
Recent testwork has been focused on the metallurgical behaviour of an Authier and NAL blended feed samples, determine the impact of granodiorite, gabbro, and volcanics waste rock dilution on metallurgical performance and mimic the NAL flowsheet on the proposed blends.
| Revision: 0 – 14-Aug-2026 B198-D01-02054-RT-0010 |
Page 85 |
| NAL Expansion FS Mineral Reserve Pre-Feasibility Study NI 43-101 Final Report Prepared for Elevra |
|
| 13.2 | North American Lithium Testwork Program |
| 13.2.1 | North American Lithium Testwork Review Summary |
A large number of metallurgical studies have been undertaken on samples from the NAL deposit since 2008. In 2008, SGS Canada Inc., in Lakefield, Ontario operated a development testwork program which included a flotation pilot plant. Variability testwork was undertaken to evaluate the impact of head grades on performance. The testwork was used to produce engineering data for plant design and produce marketing samples.
Two composite samples were used for a series of grindability tests. Dense media separation (DMS) and batch flotation tests were undertaken. During the initial feasibility study, further batch-scale optimization tests were carried out as well as locked-cycle flotation tests and pilot-scale tests. Testwork results are documented in the NI 43-101 Prefeasibility Technical Report (Hardie, et al., 2011) and the updated Feasibility Technical Report (Blanchet, et al., 2011) . The process flowsheet was developed based on projected recoveries that were determined from the testwork program and a plant throughput of 3,800 tpd (rod mill feed).
It should be noted that all tests carried out during the previous prefeasibility and feasibility studies were conducted on relatively clean pegmatite ore with little ore dilution. There were indications in early testing that ore dilution may negatively impact flotation performance; however, the extent of ore dilution was not well defined, and its impact was not thoroughly tested. The use of optical ore sorting to remove waste material in the crushing circuit was investigated during the feasibility study but was not tested and was not included in the final feasibility study flowsheet.
Optical ore sorting was tested during detailed engineering, and an optical ore sorter was installed after plant start-up to sort +3” material after primary crushing and screening. The ore sorter did not operate in the winter months and only operated for a short period before the plant was put on care and maintenance in 2014. A second ore sorter was installed prior to plant restart in 2017.
WHIMS tests were carried out on the final flotation concentrate during prefeasibility and feasibility study testwork. WHIMS was performed to lower iron content of the final concentrate to meet concentrate specifications. During testing, relatively clean pegmatite ore (low levels of dilution) was tested. As such, iron was present in the spodumene crystal structure and WHIMS was not effective. As a result, WHIMS was not included in the original flowsheet.
The NAL pegmatite dykes are hosted in two host rock types: granodiorite or volcanics. The two host rock types have differences in terms of mineralogy, specifically related to presence of iron-bearing silicate minerals. Table 13-1 and Table 13-2 show examples host rock mineralogy and elemental composition from testwork undertaken in 2022.
Table 13-1: Example Mineralogy of NAL Host Rock Types
| Mineral | Granodiorite (Wt %) | Volcanics (Wt %) |
| Albite | 50.8 | 23.8 |
| Magnesio-hornblende | 11.4 | 53.2 |
| Quartz | 14.4 | 1.0 |
| Microcline | 9.6 | 0.9 |
| Chlorite | 1.6 | 2.6 |
| Muscovite | 3.4 | 4.5 |
| Holmquistite | 4.3 | 5.6 |
| Biotite | 2.7 | 1.7 |
| Diopside | 1.7 | 6.2 |
| Rutile | 0.1 | 0.5 |
| Total | 100 | 100 |
| Revision: 0 – 14-Aug-2026 B198-D01-02054-RT-0010 |
Page 86 |
| NAL Expansion FS Mineral Reserve Pre-Feasibility Study NI 43-101 Final Report Prepared for Elevra |
|
Table 13-2: Example Assays of NAL Host Rock Types
| Component | Granodiorite (Wt %) | Volcanics (Wt %) |
| Li | 0.1 | 0.1 |
| Li2O | 0.2 | 0.2 |
| Al | 8.7 | 5.8 |
| Ca | 3.3 | 7.3 |
| Fe | 2.9 | 9.7 |
| Na | 3.4 | 1.9 |
| K | 2.0 | 0.6 |
| Mg | 1.4 | 4.9 |
| Mn | 1.4 | 0.2 |
| Si | 29.7 | 23.7 |
The analyses show magnesio-hornblende concentrations to be significantly higher in the basalt sample (53.2%) as compared to the granodiorite sample (11.4%). Iron concentration in the volcanics sample was 9.72% as compared to 2.87% in the granodiorite sample.
Two process plant upgrades have been executed to reject iron-bearing silicate minerals in the flowsheet. The first is the installation of a third ore sorter in the crushing circuit to reject host rock dilution. Work is ongoing to improve the efficacy of the ore sorting system. The second is the installation of a second WHIMS in the flowsheet to further reject iron-bearing silicate minerals prior to flotation. A LIMS was also installed ahead of the WHIMS units to remove abraded steel from the mills, which has a negative impact on WHIMS performance. The metallurgical testing focused on controlling iron in the flowsheet using WHIMS and the effect of the quantity and type of host rock dilution.
| 13.2.2 | Optical Ore Sorting Testwork (2011) |
In 2011, during detailed engineering, optical sorting tests were undertaken at the TOMRA (previously Commodas Ultrasort GmbH) test facility in Wedel, Germany, using commercial-scale optical sorting units. The material provided for the test program was a mixture of pegmatite, granodiorite, and basalt. Figure 13-3 shows example images of the three rock types tested.
The material provided was screened into four size fractions: -60 mm / + 40 mm, -40 mm / +20 mm, -20 mm / +12 mm, and -12 mm / +8 mm. Each size fraction was tested with 20% and 40% waste of either granodiorite or basalt and was tested with a range of sorting parameters. The sorting parameters can be set to minimize loss of lithium or maximize rejection of waste. These tests demonstrated waste rejection rates as high as 95% with corresponding lithium loss of 6% or less. Example images of sorted products from the testwork are shown in Figure 13-4.
| Revision: 0 – 14-Aug-2026 B198-D01-02054-RT-0010 |
Page 87 |
| NAL Expansion FS Mineral Reserve Pre-Feasibility Study NI 43-101 Final Report Prepared for Elevra |
|
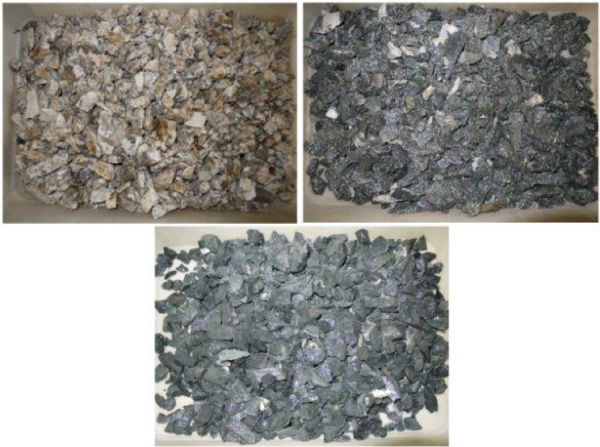
Figure 13-3: Ore Sorting Test Program Material (Pegmatite Upper Left, Granodiorite Upper Right, Basalt Lower)
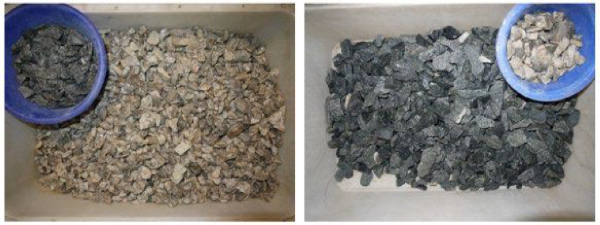
Figure 13-4: Example Images of Sorted Products
| 13.2.3 | WHIMS Testwork (2014) |
Initially, WHIMS testing was carried out at the process plant using lab scale equipment (Eriez model L-20 WHIMS). Tests were carried out on the de-sliming cyclone underflow feeding the flotation circuit and on the spodumene concentrate product. The objective was to remove amphiboles (hornblende) either from the flotation feed or the concentrate. Figure 13-5 shows the magnetic and non-magnetic fractions when the WHIMS unit was operated at 8,000 gauss (G) on the de-sliming cyclone underflow.
| Revision: 0 – 14-Aug-2026 B198-D01-02054-RT-0010 |
Page 88 |
| NAL Expansion FS Mineral Reserve Pre-Feasibility Study NI 43-101 Final Report Prepared for Elevra |
|
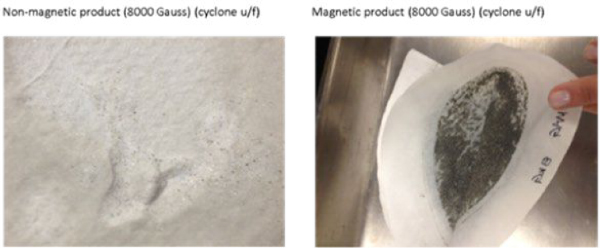
Figure 13-5: Magnetic and Non-Magnetic Fractions from Test Conducted at 8,000 Gauss
The tests were also run on a range of magnetic intensities. Visually, the best results on the cyclone underflow appeared to be at about 12,000 G. Vendor testing was subsequently undertaken. A WHIMS (Eriez WHIMS SSS-I-3000 1.0-1.3 T) was installed in the NAL process plant in 2016-17. The WHIMS is located ahead of spodumene conditioning in the flowsheet.
| 13.2.4 | NAL Re-Start Metallurgical Testing (2016) |
In 2016, a testwork program was undertaken at SGS Canada Inc. in Lakefield, Ontario. The program included:
| ● | Hardness characterization of pegmatite, granodiorite, basalt, and composite samples. |
| ● | WHIMS testing on pegmatite samples with varying levels of dilution containing granodiorite or basalt host rock. |
| ● | Flotation tests on samples processed through the WHIMS unit. |
The results of the grindability tests showed that the Bond work indices of the sample mixtures and in-situ samples were all below the work indices used in the 2012 design criteria for sizing of the rod and ball mills. Therefore, the presence of mine dilution should not negatively impact the mill throughput capacity.
For the WHIMS testing, the magnetic intensity was varied between 5,000 G and 15,000 G for various mixtures of pegmatite ore with granodiorite or basalt. Results indicated that the ideal magnetic intensity to reject iron, while minimizing lithium loss, was in the range of 10,000 G to 13,000 G.
Figure 13-6 shows iron rejection and lithium loss to the magnetic concentrate at various magnetic intensities for an ore sample containing 10% granodiorite (left) and 10% basalt (right). Related to the host rock composition and mineralogy, magnetic separation performance is quite different in the two samples. At 12,000 G, both samples show roughly 4.8% lithium loss with the granodiorite sample showing 47% iron rejection and the basalt sample showing 80% rejection. The feed grades of the granodiorite and basalt samples were 1.16% Li2O and 0.95% Fe2O3, and 1.20% Li2O and 1.74% Fe2O3, respectively.
| Revision: 0 – 14-Aug-2026 B198-D01-02054-RT-0010 |
Page 89 |
| NAL Expansion FS Mineral Reserve Pre-Feasibility Study NI 43-101 Final Report Prepared for Elevra |
|
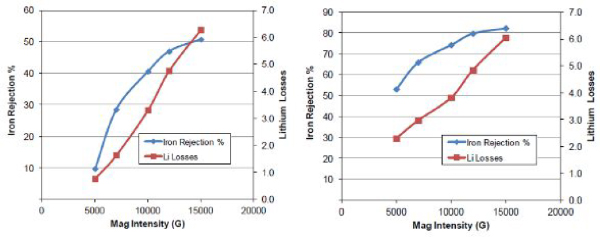
Figure 13-6: Iron Rejection and Li Loss to Magnetic Concentrate for Pegmatite with 10% Granodiorite (Left) and 10% Basalt (Right)
Batch flotation tests were undertaken on the non-magnetic fractions after magnetic separation at 15,000 G. Figure 13-7 shows the grade-recovery curves for the optimized conditions for test F3 (pegmatite with 10% basalt) and test F4 (pegmatite with 10% granodiorite). Spodumene flotation was operated at pH 8.5 using 675 g/t of FA-2 collector with a rougher-scavenger and three stages of cleaning. The final spodumene concentrates assayed between 1.05% and 1.10% Fe2O3. Lithium recovery at 6% Li2O ranged from roughly 80% to 83% (interpolated).
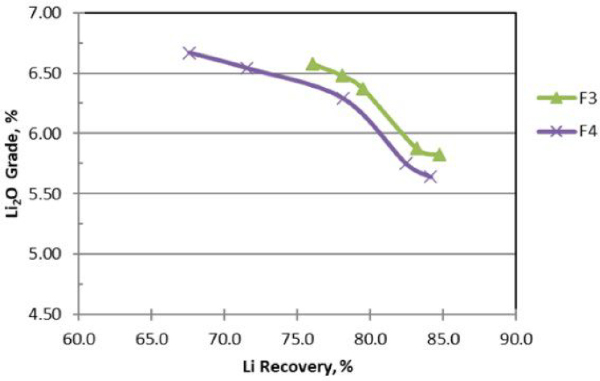
Figure 13-7: Optimized Flotation Test Results
| Revision: 0 – 14-Aug-2026 B198-D01-02054-RT-0010 |
Page 90 |
| NAL Expansion FS Mineral Reserve Pre-Feasibility Study NI 43-101 Final Report Prepared for Elevra |
|
| 13.3 | Blended Ore (NAL and Authier) Testwork Program |
| 13.3.1 | Preliminary Testwork (2019) |
Initial testwork on blended NAL and Authier samples was undertaken in 2019 at SGS Canada Inc. in Lakefield, Ontario. The Authier sample tested was material from the 2018 pilot plant and was a blend of Composite 1 and Composite 2 material. The NAL samples (pegmatite, granodiorite and volcanics) were hand-picked from ROM stockpiles located at the NAL site in November 2019.
The blend ratio tested in the 2019 Preliminary Testwork was 75% NAL ore and 25% Authier ore. Based on historical data, dilution in the NAL mine plan was expected to be roughly 18%. By contrast, and due to the nature of the deposit and the mining strategy, the Authier mine plan was expected to include less than 5% dilution in ROM ore.
Assays of the various feed samples are shown in Table 13-3. The Authier pegmatite sample had a grade of 1.05% Li2O. The NAL pegmatite sample was high-grade at 1.57% Li2O. The NAL granodiorite (4.1% Fe2O3) and the volcanics samples (13.1% Fe2O3) had relatively high iron content as compared to the pegmatite samples (0.82% and 0.49%, respectively). Table 13-4 shows the composition of the feed blends tested.
Table 13-3: Assays of Ore Samples Tested
| Analysis | Authier | NAL | ||
| Composite | Pegmatite | Granodiorite | Volcanics | |
| Li | 0.49 | 0.73 | 0.14 | 0.09 |
| Li2O | 1.05 | 1.57 | 0.30 | 0.19 |
| SiO2 | 73.50 | 74.00 | 62.70 | 48.90 |
| Al2O3 | 15.60 | 15.70 | 16.70 | 8.95 |
| Fe2O3 | 0.82 | 0.49 | 4.10 | 13.10 |
| MgO | 0.26 | 0.02 | 2.30 | 11.80 |
| CaO | 0.21 | 0.24 | 4.59 | 10.50 |
| Na2O | 4.75 | 3.39 | 4.48 | 1.46 |
| K2O | 2.80 | 2.33 | 2.24 | 1.23 |
Table 13-4: Overview of Feed Samples Tested
|
Analysis |
Authier | NAL | ||
| Composite | Pegmatite | Granodiorite | Volcanics | |
| Composition % | ||||
| F3 | 25 | 67.5 | - | 7.5 |
| F4 | 25 | 67.5 | 7.5 | - |
| F5 | - | 100.0 | - | - |
| F6 | 25 | 75.0 | - | - |
Test procedures included: crushing, grinding, de-sliming, WHIMS and spodumene flotation. Reagent dosages were chosen based on historical testwork and NAL operating experience.
Figure 13-8 shows the grade-recovery curves for the four tests. Figure 13-9 shows the relationship between Fe2O3and Li2O concentrations in the concentrates.
| Revision: 0 – 14-Aug-2026 B198-D01-02054-RT-0010 |
Page 91 |
| NAL Expansion FS Mineral Reserve Pre-Feasibility Study NI 43-101 Final Report Prepared for Elevra |
|
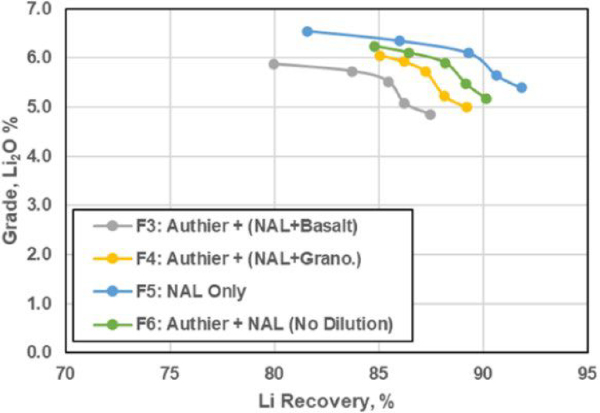
Figure 13-8: Grade – Recovery Curves
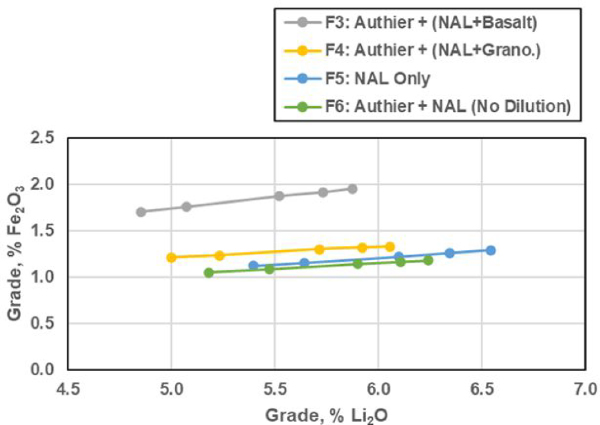
Figure 13-9: Fe2O3 vs. Li2O in the Concentrate
| Revision: 0 – 14-Aug-2026 B198-D01-02054-RT-0010 |
Page 92 |
| NAL Expansion FS Mineral Reserve Pre-Feasibility Study NI 43-101 Final Report Prepared for Elevra |
|
For test F3, the concentrate produced from the blended sample containing basalt was unable to achieve 6% Li2O (5.87% Li2O at 80% recovery). The final concentrate also contained a relatively high level of iron (1.96% Fe2O3).
Results for test F4 showed that the concentrate produced from the blended sample containing granodiorite achieved 6% Li2O at 85% recovery. Iron levels in the final concentrate were slightly high at 1.33% Fe2O3.
Test F5 on NAL pegmatite (no dilution) performed well, achieving 6% Li2O at roughly 90% recovery. Iron in the 6% Li2O concentrate was roughly 1.2% Fe2O3.
Test F6 on a blend of Authier and NAL pegmatite (no dilution) performed well, achieving 6% Li2O at roughly 90% recovery. Iron in the 6% Li2O concentrate was roughly 1.2% Fe2O3.
The pegmatite sample tested from NAL was relatively high-grade compared to the expected life-of-mine average. All samples tested produced concentrate with Fe2O3 concentrations exceeding 1%. The sample tested containing basalt produced a concentrate of 5.87% Li2O (slightly below 6%), which contained a relatively high concentration of iron (1.96% Fe2O3). The results are shown in Table 13-5.
Table 13-5: Final Spodumene Concentrate Grade (3-Stages of Cleaning)
| Test | Li2O | Fe2O3 |
| F3 | 5.87 | 1.96 |
| F4 | 6.05 | 1.33 |
| F5 | 6.54 | 1.29 |
| F6 | 6.24 | 1.18 |
| 13.3.2 | Prefeasibility Study Testwork (2021 – 2022) |
Testwork on blended NAL and Authier ore was undertaken in 2021-22 at SGS Canada Inc. in Lakefield, Ontario. Both samples were selected from drill core. The objectives of the testwork were:
| ● | Test a blended feed sample of 64% NAL and 36% Authier (Compared to 75% NAL and 25% Authier blend from 2019 Preliminary Testwork). |
| ● | Test the impact of basalt waste rock dilution on performance. |
| ● | Examine the impact of two-stages of WHIMS on concentrate quality. |
Pegmatite and host rock samples were analysed separately. Table 13-6 and Table 13-7 show assays and mineralogy of the components.
Table 13-6: Assays of the Pegmatite and Host Rock Samples
|
Component |
NAL | Authier | |||
| Pegmatite | Basalt | Granodiorite | Pegmatite | Basalt | |
| Composition, Wt % | |||||
| Li | 0.67 | 0.08 | 0.11 | 0.68 | 0.10 |
| Li2O | 1.44 | 0.17 | 0.24 | 1.46 | 0.22 |
| Al | 8.42 | 5.77 | 8.73 | 8.42 | 9.21 |
| Ca | 0.23 | 7.29 | 3.32 | 0.12 | 3.51 |
| Fe | 0.15 | 9.72 | 2.87 | 0.26 | 7.76 |
| Na | 3.32 | 1.92 | 3.41 | 3.23 | 3.30 |
| K | 2.16 | 0.62 | 2.00 | 2.40 | 0.59 |
| Mg | 0.02 | 4.94 | 1.39 | 0.04 | 5.62 |
| Mn | 0.10 | 0.16 | 0.05 | 0.09 | 0.22 |
| Si | 34.20 | 23.70 | 29.70 | 34.50 | 22.20 |
| Revision: 0 – 14-Aug-2026 B198-D01-02054-RT-0010 |
Page 93 |
| NAL Expansion FS Mineral Reserve Pre-Feasibility Study NI 43-101 Final Report Prepared for Elevra |
|
Table 13-7: Mineralogy of the Pegmatite and Host Rock Samples
|
Component |
NAL | Authier | |||
| Pegmatite | Basalt | Granodiorite | Pegmatite | Basalt | |
| Composition, Wt % | |||||
| Albite | 39.50 | 23.80 | 50.80 | 37.40 | 40.00 |
| Magnesio-hornblende | - | 53.20 | 11.40 | - | 36.80 |
| Quartz | 25.10 | 1.00 | 14.40 | 26.70 | - |
| Microcline | 12.40 | 0.90 | 9.60 | 11.50 | - |
| Chlorite | - | 2.60 | 1.60 | - | 15.90 |
| Muscovite | 3.00 | 4.50 | 3.40 | 4.50 | 4.10 |
| Holmquistite | - | 5.60 | 4.30 | - | - |
| Biotite | 0.80 | 1.70 | 2.70 | 0.90 | 0.90 |
| Diopside | - | 6.20 | 1.70 | - | 0.40 |
| Rutile | - | 0.50 | 0.10 | - | 0.30 |
| Calcite | 0.50 | - | - | 0.50 | - |
| Beryl | 0.20 | - | - | 0.20 | - |
| Total | 100 | 100 | 100 | 100 | 100 |
Based on previous studies and NAL operational data, the NAL testwork feed sample comprised 10% basalt dilution (to simulate feed to the mill after ore sorting). The feed samples were blended at a ratio of 64% NAL ore and 36% Authier ore (to simulate rod mill feed). Table 10-8 shows the assays of the blended ore sample. The feed grade of the blended sample was 1.14% Li2O and 1.56% Fe2O3.
Table 13-8: Blended Ore Assays
| Component | NAL/Authier Blend |
| Composition | |
| Li | 0.53 |
| Li2O | 1.14 |
| Al2O3 | 15.40 |
| CaO | 0.98 |
| Fe2O3 | 1.56 |
| Na2O | 4.40 |
| K2O | 2.51 |
| MgO | 0.73 |
| MnO | 0.15 |
| SiO2 | 72.50 |
The samples were stage-crushed and stage-ground to a target P80 of 200 µm. The samples were scrubbed and de-slimed, underwent WHIMS, de-slimed and conditioned prior to spodumene rougher and scavenger flotation followed by three stages of cleaning. The testwork was designed to mimic the NAL flowsheet. Table 13-9 shows reagent dosages for the optimized tests. For the optimized tests, FA-2 fatty acid collector dosage ranged from 780 g/t to 1,080 g/t.
Table 13-9: Reagent Dosages for Optimized Tests
| Test | P100 (µm) | Dosage (g/t) | ||||
| Na2CO3 | NaOH | F100 | F220 | FA-2 | ||
| F6 | 300 | 225 | 75 | 250 | - | 780 |
| F9 | 300 | 225 | 75 | 250 | - | 1,080 |
| F16 | 300 | 201 | 75 | - | 250 | 780 |
Figure 13-10 shows the grade-recovery curves for the three optimized tests. Final spodumene concentrate grades in the three tests were roughly 6% Li2O. Lithium recovery ranged from 60% to 66%.
| Revision: 0 – 14-Aug-2026 B198-D01-02054-RT-0010 |
Page 94 |
| NAL Expansion FS Mineral Reserve Pre-Feasibility Study NI 43-101 Final Report Prepared for Elevra |
|
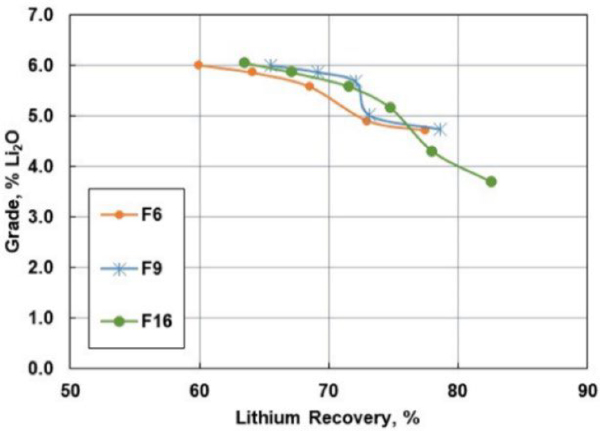
Figure 13-10: Grade – Recovery Curves
Table 13-10 shows the final concentrate grades which ranged from 6.01% to 6.05% Li2O and 0.78% to 1.05% Fe2O3.
Table 13-10: Final Spodumene Concentrate Assays
| Test | Li2O % | Fe2O3 % |
| F6 | 6.01 | 1.05 |
| F9 | 6.01 | 0.98 |
| F16 | 6.05 | 0.78 |
Figure 13-11 compares the performance of the WHIMS when processing ore containing basalt versus granodiorite host rock (10% dilution in all tests shown). The data points are taken from several testwork programs on NAL ore and blended ore. The results show higher mass pulls, iron rejection and lithium losses for the basalt tests. This is due to the higher concentrations of iron-bearing silicate minerals in the basalt samples.
| Revision: 0 – 14-Aug-2026 B198-D01-02054-RT-0010 |
Page 95 |
| NAL Expansion FS Mineral Reserve Pre-Feasibility Study NI 43-101 Final Report Prepared for Elevra |
|
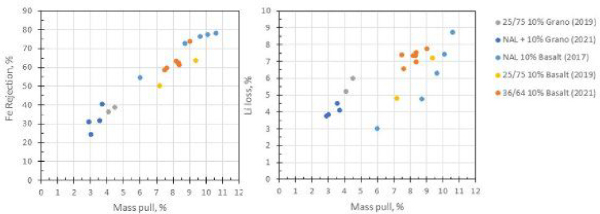
Figure 13-11: Comparison of WHIMS Performance with Basalt vs. Granodiorite Host Rock
| 13.3.2.1 | Tailings Filtration Tests |
In 2022, ten pressure filtration tests were conducted by Pocock Laboratories on combined tailings samples. Two pressure filtration methods were tested:
| ● | Air blowing only. |
| ● | Membrane squeeze with air blow. |
With respect to Tailings Filtration, the target moisture content that forms the basis of assessment and filter sizing was 15%. During the test program, the effects of cake thickness and drying time on filter cake moisture and the production rate were examined.
The design conditions simulated the filtration of tailings with an average 56% solids feed density. The pressure for all ten air blow procedures was maintained at 552 kPa. However, combined tailings material in four out of ten tests were subjected to an additional pressure of 690 kPa for the initial membrane squeeze procedure, which was raised to 1,600 kPa for the final 30 seconds of air blow. The test results and the simulations yielded the production of a tailings cake with satisfactory discharge as well as stacking properties reaching their target values in a cycle time that would require one operating and one stand-by pressure filter configuration, the specifications for which are provided in Chapter 14.
| 13.3.3 | Feasibility Study Testwork Program (2022 – 2023) |
Testwork on blended NAL and Authier ore was undertaken in 2022-23 at SGS Canada Inc. in Lakefield, Ontario. Two composite and five variability samples were tested. The main objectives of the testwork were to:
| ● | Test blended feed samples (64% NAL and 36% Authier). |
| ● | Test the impact of granodiorite, gabbro, and volcanics waste rock dilution on metallurgical performance. |
| ● | Mimic the NAL flowsheet. |
| 13.3.3.1 | Composite Samples |
The NAL pegmatite sample was collected in 2022 by operations geologists from run-of-mine ore remaining in the pit from previous mining operations in 2019. The material was selected to represent average-grade material. The NAL volcanics and granodiorite samples used were material remaining from the PFS testwork program. The Authier pegmatite sample was taken from a test pit onsite. The Authier host rock (ultramafic) sample was from the PFS testwork program.
| Revision: 0 – 14-Aug-2026 B198-D01-02054-RT-0010 |
Page 96 |
| NAL Expansion FS Mineral Reserve Pre-Feasibility Study NI 43-101 Final Report Prepared for Elevra |
|
Pegmatite and host rock samples were analysed separately. Table 13-11 and Table 13-12 show assays and mineralogy of the components. The NAL and Authier pegmatite samples graded 1.12% and 1.05% Li2O, respectively. The host rock samples contained low levels of lithium, ranging from 0.17% to 0.24% Li2O. A major difference between the host rock samples was the varying iron concentrations which ranged from 4.10% to 13.9% Fe2O3.
Table 13-11: Composite Sample Assays of the Pegmatite and Host Rock Samples
|
Component |
NAL | Authier | |||
| Pegmatite | Volcanics | Granodiorite | Pegmatite | Ultramafic | |
| Composition, Wt % | |||||
| Li | 0.52 | 0.08 | 0.11 | 0.49 | 0.10 |
| Li2O | 1.12 | 0.17 | 0.24 | 1.05 | 0.22 |
| Al2O3 | 15.60 | 10.90 | 16.49 | 15.60 | 17.40 |
| CaO | 0.37 | 10.20 | 4.65 | 0.14 | 4.91 |
| Fe2O3 | 0.32 | 13.90 | 4.10 | 0.42 | 11.10 |
| Na2O | 4.57 | 2.59 | 4.60 | 4.42 | 4.45 |
| K2O | 2.61 | 0.75 | 2.41 | 2.86 | 0.71 |
| MgO | 0.05 | 8.19 | 2.31 | 0.05 | 9.32 |
| MnO | 0.10 | 0.21 | 0.06 | 0.13 | 0.28 |
| SiO2 | 74.30 | 50.10 | 63.50 | 74.40 | 47.50 |
The NAL and Authier pegmatite samples contained 14.7% and 12,9% spodumene. The major difference between the host rock types was the varying amounts of magnesio-hornblende which ranged from 11.4% to 53.2%. The volcanics and granodiorite samples contained holmquistite which correlates with the presence of lithium in the samples.
Table 13-12: Mineralogy of the Pegmatite and Host Rock Samples
|
Component |
NAL | Authier | |||
| Pegmatite | Volcanics | Granodiorite | Pegmatite | Ultramafic | |
| Composition, Wt % | |||||
| Spodumene | 14.7 | - | - | 12.9 | - |
| Albite | 38.8 | 23.8 | 50.8 | 38.5 | 40.0 |
| Magnesio-hornblende | - | 53.2 | 11.4 | - | 36.8 |
| Quartz | 27.9 | 1.0 | 14.4 | 29.3 | - |
| Microcline | 15.8 | 0.9 | 9.6 | 15.2 | - |
| Chlorite | - | 2.6 | 1.6 | - | 15.9 |
| Muscovite | 2.2 | 4.5 | 3.4 | 3.6 | 4.1 |
| Holmquistite | - | 5.6 | 4.3 | - | - |
| Biotite | - | 1.7 | 2.7 | - | 0.9 |
| Diopside | - | 6.2 | 1.7 | - | 0.4 |
| Rutile | - | 0.5 | 0.1 | - | 0.3 |
| Petalite | 0.4 | - | - | 0.5 | - |
| Total | 100 | 100 | 100 | 100 | 100 |
The samples were blended at a ratio of 64% NAL ore and 36% Authier ore (to simulate rod mill feed composition). Based on previous studies, mine plans, and NAL operational data, the NAL testwork feed samples comprised 9% dilution (medium dilution). The Authier portion of the sample contained 1.7% dilution. Two samples were prepared, one containing volcanics and one containing granodiorite. Table 13-13 shows the assays of the blended composite samples. The feed grade of composite 1 (volcanics) was 1.12% Li2O and 1.29% Fe2O3, and composite 2 (granodiorite) was 1.12% Li2O and 0.68% Fe2O3.
| Revision: 0 – 14-Aug-2026 B198-D01-02054-RT-0010 |
Page 97 |
| NAL Expansion FS Mineral Reserve Pre-Feasibility Study NI 43-101 Final Report Prepared for Elevra |
|
Table 13-13: Blended Feed Assays
| Component | Composite 1 (Volcanics) % | Composite 2 (Granodiorite) % |
| Li | 0.5 | 0.5 |
| Li2O | 1.1 | 1.1 |
| Al2O3 | 15.2 | 15.7 |
| CaO | 0.9 | 0.6 |
| Fe2O3 | 1.3 | 0.7 |
| Na2O | 4.4 | 4.6 |
| K2O | 2.6 | 2.8 |
| MgO | 0.6 | 0.3 |
| MnO | 0.6 | 0.3 |
| SiO2 | 72.5 | 73.4 |
| 13.3.3.2 | Variability Samples |
Five variability samples were selected from NAL drill core samples (quarter core). The samples were selected to represent early years of production (years 1-10) and to include each major type of host rock (i.e., granodiorite, gabbro and volcanics). Table 13-14 gives a brief description of each of the five variability samples. Pegmatite and host rock samples from each drillhole were grouped separately. Pegmatite and host rock sample composites were analysed for chemical composition and mineralogy.
Table 13-14: Variability Sample Description
| Variability Sample | Years of Production | Host Rock Type | Hole ID | Dykes |
|
1.0 |
Years 1-2 |
Volcanics / Granodiorite |
NAL-19-008 | B |
| NAL-19-008 | N | |||
| NAL-19-019 | B | |||
| NAL-19-023 | B2 | |||
|
2.0 |
Years 1-2 |
Granodiorite |
NAL-16-005 | CT_S-K |
| NAL-16-012 | CT_S-K | |||
| NAL-16-028 | CT_K | |||
| NAL-19-010 | B2 | |||
|
3.0 |
Years 3-5 |
Volcanics / Granodiorite |
NAL-16-035 | P |
| NAL-16-036 | N | |||
| NAL-19-020 | B | |||
| NAL-19-026 | B | |||
|
4.0 |
Years 3-5 |
Gabbro |
NAL-19-011 | CT_V2 |
| NAL-19-031 | N2 | |||
| NAL-19-034 | CT_V2 | |||
| NAL-19-036 | CT_S-K | |||
|
5.0 |
Years 5-10 |
Gabbro / Granodiorite |
NAL-19-021 | A |
| NAL-19-024 | B | |||
| NAL-19-036 | CT_V |
Table 13-15 shows the chemical composition of the pegmatite and host rock for each variability sample. Pegmatite grades ranged from 0.88% to 1.25% Li2O and from 0.15% to 0.79% Fe2O3. Host rock sample grades ranged from 0.19% to 0.47% Li2O and from 4.1% to 12.1% Fe2O3.
Spodumene content of the pegmatite samples ranged from 10.8% to 15.4%. Muscovite content ranged from 2.0% to 4.5%. Low levels of spodumene are seen in the host rock samples (1.1% to 2.4%). Holmquistite is present in all host rock samples ranging from 2.0% to 6.8%. Large variations in magnesio-hornblende content (3.3% to 63.2%) can be seen in the various host rock types.
Similar to the composite samples, NAL variability testwork feed samples comprised 9% dilution while the Authier portion (composite samples) contained 1.7% dilution. The samples were blended at a ratio of 64% NAL ore and 36% Authier ore (to simulate rod mill feed composition).
| Revision: 0 – 14-Aug-2026 B198-D01-02054-RT-0010 |
Page 98 |
| NAL Expansion FS Mineral Reserve Pre-Feasibility Study NI 43-101 Final Report Prepared for Elevra |
|
Table 13-15: NAL Variability Sample Assays: Pegmatite and Host Rock
| Component | Pegmatite Composition, wt% | Host Rock, Composition, wt% | ||||||||
| Var 1 | Var 2 | Var 3 | Var 4 | Var 5 | Var 1 | Var 2 | Var 3 | Var 4 | Var 5 | |
| Li | 0.57 | 0.41 | 0.57 | 0.50 | 0.58 | 0.14 | 0.10 | 0.22 | 0.09 | 0.15 |
| Li2O | 1.23 | 0.88 | 1.23 | 1.08 | 1.25 | 0.30 | 0.21 | 0.47 | 0.19 | 0.32 |
| Al2O3 | 15.50 | 15.80 | 15.70 | 14.90 | 15.30 | 15.30 | 16.40 | 14.00 | 8.80 | 8.90 |
| CaO | 0.38 | 0.86 | 0.48 | 0.39 | 0.36 | 8.40 | 4.41 | 7.67 | 12.10 | 11.80 |
| Fe2O3 | 0.15 | 0.79 | 0.28 | 0.26 | 0.23 | 8.24 | 4.11 | 9.70 | 11.90 | 11.20 |
| Na2O | 4.79 | 4.85 | 4.79 | 4.50 | 4.38 | 2.54 | 4.45 | 2.99 | 1.51 | 1.62 |
| K2O | 1.95 | 2.70 | 2.22 | 2.49 | 2.45 | 1.07 | 2.36 | 1.44 | 0.72 | 0.65 |
| MgO | 0.04 | 0.40 | 0.12 | 0.11 | 0.10 | 5.49 | 2.32 | 6.50 | 9.89 | 9.69 |
| MnO | 0.15 | 0.10 | 0.16 | 0.16 | 0.16 | 0.17 | 0.08 | 0.17 | 0.20 | 0.19 |
| SiO2 | 74.90 | 72.60 | 73.40 | 75.60 | 75.40 | 55.50 | 62.70 | 53.90 | 52.10 | 52.70 |
Table 13-16: NAL Variability Sample Mineralogy: Pegmatite and Host Rock
| Mineral | Pegmatite Composition, wt % | Host Rock, Composition, wt% | ||||||||
| Var 1 | Var 2 | Var 3 | Var 4 | Var 5 | Var 1 | Var 2 | Var 3 | Var 4 | Var 5 | |
| Spodumene | 14.7 | 10.8 | 15.4 | 13.5 | 14.9 | 2.1 | 1.1 | 2.4 | 1.3 | 2.4 |
| Quartz | 29.3 | 24.1 | 27.6 | 30.4 | 30.3 | 10.0 | 13.4 | 4.5 | 5.2 | 6.1 |
| Plagioclase | 42.3 | 45.7 | 43.3 | 40.8 | 39.2 | 36.5 | 47.7 | 36.6 | 14.1 | 19.8 |
| Magnesio-hornblende | - | 0.8 | - | - | - | 24.5 | 3.3 | 26.3 | 63.2 | 47.3 |
| K-feldspar | 10.4 | 11.9 | 10.4 | 13.1 | 13.1 | 1.5 | 10.5 | 2.4 | 1.8 | 2.0 |
| Phlogopite | - | - | - | - | - | 7.5 | 6.6 | 9.1 | 3.4 | 3.5 |
| Epidote | - | - | - | - | - | 4.9 | 4.7 | 4.8 | 3.3 | 5.9 |
| Holmquistite | - | 0.7 | - | - | - | 3.8 | 3.9 | 6.8 | 2.0 | 4.5 |
| Muscovite | 2.0 | 4.5 | 3.3 | 2.2 | 2.4 | - | - | - | - | - |
| Diopside | - | - | - | - | - | 4.2 | 2.9 | 2.5 | 2.7 | 3.3 |
| Clinochlore | - | 1.3 | - | - | - | 1.7 | 3.0 | 1.9 | 0.8 | 1.3 |
| Schorl | 1.3 | - | - | - | - | 1.9 | 1.9 | 0.9 | 1.0 | 1.3 |
| Other | - | 0.2 | - | - | - | 1.0 | 0.4 | 1.0 | 1.0 | 1.9 |
| Total | 100 | 100 | 100 | 100 | 100 | 100 | 100 | 100 | 100 | 100 |
Table 13-17: NAL Blended Variability Sample Assays
| Component | Composition | ||||
| Var 1 | Var 2 | Var 3 | Var 4 | Var 5 | |
| Li | 0.52 | 0.46 | 0.52 | 0.48 | 0.53 |
| Li2O | 1.12 | 0.99 | 1.12 | 1.03 | 1.14 |
| Al2O3 | 15.60 | 15.70 | 15.60 | 14.00 | 15.60 |
| CaO | 0.81 | 0.84 | 0.83 | 0.97 | 0.68 |
| Fe2O3 | 0.81 | 0.93 | 1.05 | 1.13 | 0.95 |
| Na2O | 4.51 | 4.67 | 4.56 | 4.32 | 4.54 |
| K2O | 2.20 | 2.73 | 2.39 | 2.41 | 2.67 |
| MgO | 0.43 | 0.46 | 0.52 | 0.65 | 0.36 |
| MnO | 0.15 | 0.10 | 0.15 | 0.15 | 0.16 |
| SiO2 | 73.70 | 72.20 | 72.30 | 69.60 | 73.40 |
| 13.3.3.3 | Composite Sample Testwork Results |
The composite samples were stage-crushed and stage-ground to P100 values between 212 µm and 300 µm. The samples were scrubbed and de-slimed, underwent two stages of magnetic separation (WHIMS), de-slimed and conditioned prior to batch spodumene rougher and scavenger flotation followed by three stages of cleaning. The batch tests were designed to mimic the NAL flowsheet with recent 2023 circuit modifications.
| Revision: 0 – 14-Aug-2026 B198-D01-02054-RT-0010 |
Page 99 |
| NAL Expansion FS Mineral Reserve Pre-Feasibility Study NI 43-101 Final Report Prepared for Elevra |
|
Initial testwork examined the impact of grind size on flotation performance. Samples were stage-ground and screened. Tests were operated on each composite at -300 µm (tests F2 and F5) and - 250 µm (tests F7 and F8) as shown in Figure 13-12. The finer grind (-250 µm) showed improved performance. Based on the results, all further testing was undertaken at a grind size of -250 µm. Tests were operated with a 250 g/t dosage of F220 dispersant and total dosage of FA-2 collector of 780 g/t.
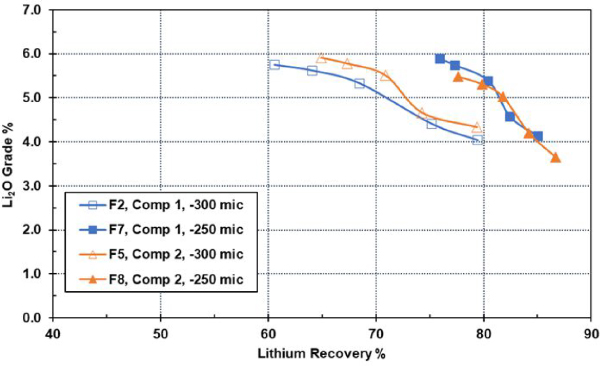
Figure 13-12: Composite Samples – Effect of Grind Size
Tests were undertaken to examine the effect of collector dosage of flotation performance. Figure 13-13 shows an example for composite 1. Tests were undertaken using 680 g/t, 780 g/t and 980 g/t of FA-2 collector. There was a slight improvement in performance at the highest collector dosage.
| Revision: 0 – 14-Aug-2026 B198-D01-02054-RT-0010 |
Page 100 |
| NAL Expansion FS Mineral Reserve Pre-Feasibility Study NI 43-101 Final Report Prepared for Elevra |
|
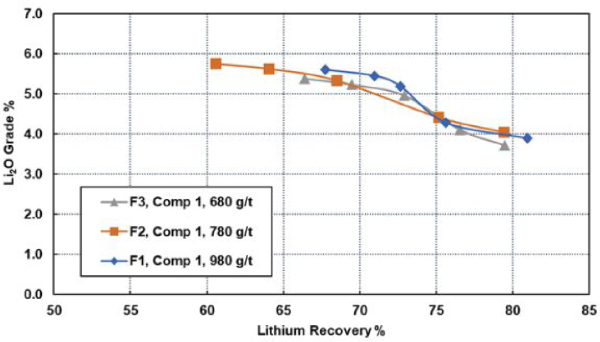
Figure 13-13: Effect of Collector (FA-2) Dosage on Flotation Performance
Tests were undertaken to examine the impact of host rock dilution on flotation performance. The amount of NAL volcanics (host rock) included in the feed sample was varied: low (4.5%), medium (9%), and high (11%). Figure 13-14 shows grade-recovery curves for the three batch flotation tests. The low dilution sample showed the best performance which was largely attributed to lower lithium losses during magnetic separation (5.8% lithium loss as compared to 8.5% and 8.6% for the medium and high dilution samples, respectively).
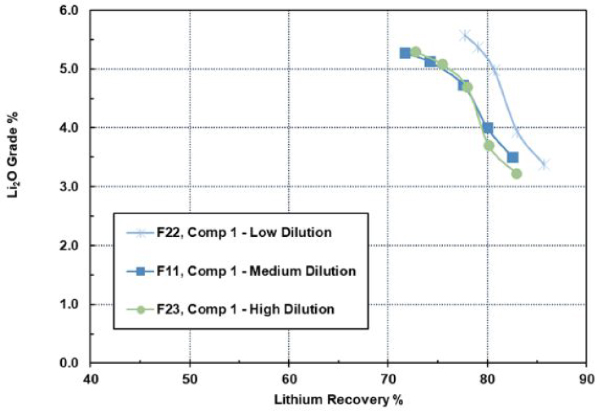
Figure 13-14: Example of the Impact of Dilution on Flotation Performance
| Revision: 0 – 14-Aug-2026 B198-D01-02054-RT-0010 |
Page 101 |
| NAL Expansion FS Mineral Reserve Pre-Feasibility Study NI 43-101 Final Report Prepared for Elevra |
|
Table 13-18 shows final spodumene concentrate assays for the tests. The low dilution sample showed the highest lithia grade and lowest iron content.
Table 13-18: Spodumene Concentrate Assays
| Test | Li2O % | Fe2O3 % |
| F22 (Low Dilution) | 5.58 | 1.26 |
| F11 (Medium Dilution) | 5.27 | 1.76 |
| F23 (High Dilution) | 5.30 | 1.43 |
| 13.3.3.4 | Variability Sample Testwork Results |
The variability samples were tested using the same flowsheet (mimicking the NAL flowsheet) as the composite samples. All variability tests were operated under the same conditions as shown in Table 13-19.
Table 13-19: Variability Conditions
| Test | P100 (µm) | Dosage (g/t) | |||
| Na2CO3 | NaOH | F220 | FA-2 | ||
| Variability | 250 | 88 | 200 | 250 | 780 |
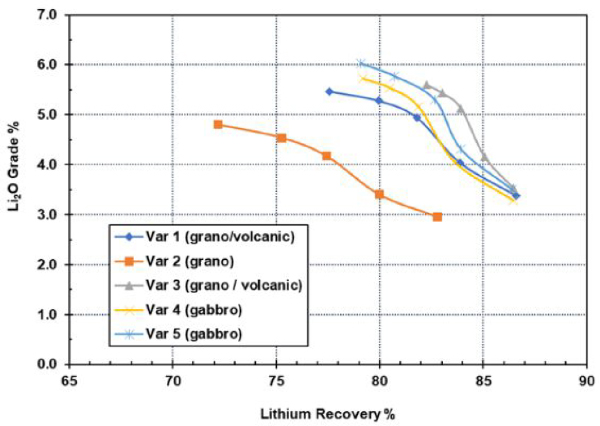
Figure 13-15: Example of the Impact of Dilution on Flotation Performance
Table 13-20 shows final concentrate assays for each test. For variability samples 1, 3, 4, and 5 grades ranged from 5.47% to 6.03% Li2O, and from 0.92% to 1.19% Fe2O3. Final lithium recovery for these samples ranged from 77.6% to 82.3%. Variability sample 2 performed poorly and only achieved 4.80% Li2O and 1.87% Fe2O3 with lithium recovery of 72.2%.
| Revision: 0 – 14-Aug-2026 B198-D01-02054-RT-0010 |
Page 102 |
| NAL Expansion FS Mineral Reserve Pre-Feasibility Study NI 43-101 Final Report Prepared for Elevra |
|
Further testing is planned for variability sample 2 to investigate the impact of finer grind size and varying collector dosage.
Table 13-20: Final Spodumene Concentrate Assays
| Variability Sample | Li2O % | Fe2O3 % |
| 1 (grano. /volcanics) | 5.47 | 1.19 |
| 2 (grano.) | 4.80 | 1.87 |
| 3 (grano. /volcanics) | 5.60 | 0.98 |
| 4 (gabbro) | 5.73 | 1.05 |
| 5 (gabbro) | 6.03 | 0.92 |
| 13.3.3.5 | Testwork Analysis |
Optimized testwork data was selected and analysed to support the process mass balance. The majority of the tests selected to be used in the analysis were from the DFS testwork program (one test from the PFS testwork program was included). All tests analysed were from testing on composite samples.
Figure 13-16 outlines the testwork conditions for the optimized tests. Two fatty acid collectors were tests: Sylfat FA-2 and Arrmaz Custofloat 7080. Custofloat 7080 was employed at the NAL concentrator but the collector has been changed since the restart.
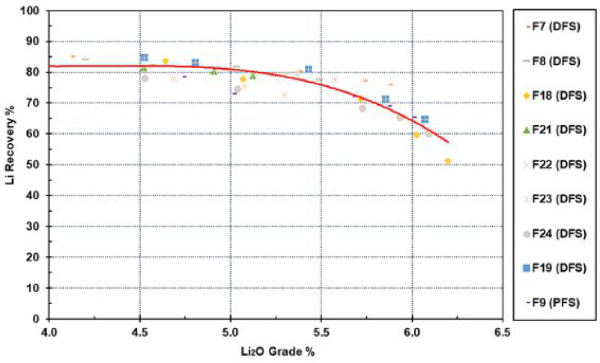
Figure 13-16: Testwork Analysis: Grade-Recovery Correlation
All tests were operated with two stages of wet high-intensity magnetic separation at 13,000 gauss. Table 13-21 shows the grade-recovery data point for the selected tests. The red curve is the correlation through all the datapoints which was used to support the recovery assumptions in the process mass balance.
| Revision: 0 – 14-Aug-2026 B198-D01-02054-RT-0010 |
Page 103 |
| NAL Expansion FS Mineral Reserve Pre-Feasibility Study NI 43-101 Final Report Prepared for Elevra |
|
Table 13-21: Testwork Conditions
| Test |
P100 (µm) |
Dosage (g/t) | |||||
| Na2CO3 | NaOH | F100 | F220 | FA-2 | CF 7080 | ||
| F7 (DFS) | 250 | 250 | NM | 0 | 250 | 780 | 0 |
| F8 (DFS) | 250 | 200 | NM | 0 | 250 | 780 | 0 |
| F18 (DFS) | 250 | 200 | 88 | 0 | 250 | 0 | 780 |
| F19 (DFS) | 250 | 200 | 88 | 0 | 250 | 0 | 780 |
| F21 (DFS) | 250 | 200 | 88 | 0 | 250 | 780 | 0 |
| F22 (DFS) | 250 | 200 | 88 | 0 | 250 | 780 | 0 |
| F23 (DFS) | 250 | 188 | 88 | 0 | 250 | 780 | 0 |
| F24 (DFS) | 250 | 225 | 100 | 0 | 250 | 0 | 780 |
| F9 (PFS) | 300 | 225 | 75 | 250 | 0 | 1,080 | 0 |
*Note: NM = Not Measured.
| 13.4 | Testwork Analysis |
Optimised testwork data was selected and analysed to support the process mass balance. The majority of the tests selected to be used were from the 2023 DFS testwork program. The 2023 DFS testwork assessed NAL/Authier ore feed blends and the figure below summarises the spodumene concentrate grade vs testwork recovery curve (DFS, 2023).
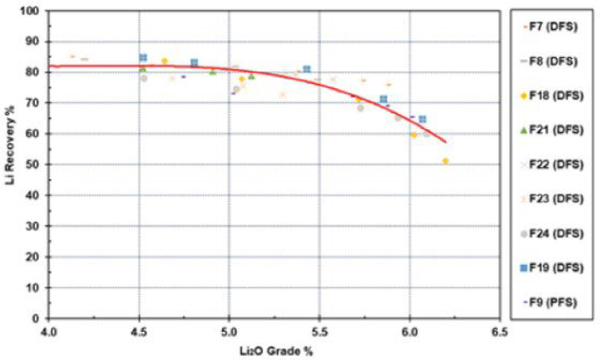
Figure 13-17: 2023 DFS Testwork Grade-Recovery Curve
A comparison of the global Li2O recovery comparing the testwork recovery curve (without any industrial derating) against the NAL operational quarterly performance data (from Q3 FY24 to Q4 FY25) is presented below. The recent quarterly performance (Q4 FY25) with a spodumene concentrate grade of 5.2% Li2O at 73% global recovery is also shown. The expansion forecast recovery curve also includes the datapoint of 71.2% recovery at 5.4% Li2O concentrate grade.
| Revision: 0 – 14-Aug-2026 B198-D01-02054-RT-0010 |
Page 104 |
| NAL Expansion FS Mineral Reserve Pre-Feasibility Study NI 43-101 Final Report Prepared for Elevra |
|
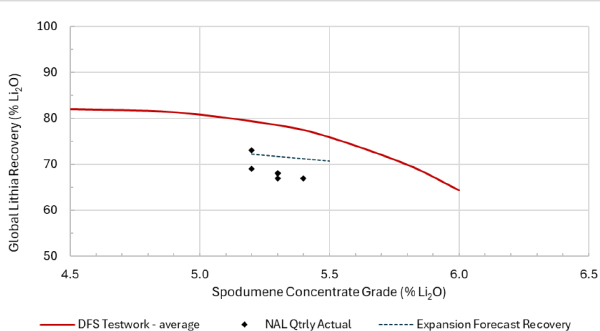
Figure 13-18: Li2O Grade Recovery Curve including NAL Quarterly Performance
Historical metallurgical testwork from the above-described previous phases, along with current operational performance has been used as the basis for the NAL expansion FS.
Based on the previous laboratory testwork and current operational performance, an average global recovery of 71.2% at a spodumene concentrate grade of 5.4% Li2O has been applied for the Expansion Scenario for the purposes of the PFS.
The impact of ore sorters was analysed through statistical methods for impact on recovery from operating data. A recovery increase of 2% above the base case is included in the above 71.2% with additional ore sorting performance testing underway.
| 13.5 | Current Testwork |
Historical metallurgical testwork from the above previous phases, along with current operational performance has been used as the basis for the NAL expansion FS. Geometallurgy testwork and further metallurgy optimisation testwork is currently underway to increase understanding of the metallurgical performance and spodumene recovery across the NAL mineral resource and Mine Plan, in addition to identifying potential spodumene recovery improvement opportunities. The following programs are nearing completion:
| ● | Geometallurgical program based on Life of mine sample selection to provide additional data on ore behaviour throughout the mine life. |
| ● | XRT ore sorting testwork. |
The author is of the opinion that the previous feasibility-level testwork, current operating metallurgical data and methodologies applied are relevant and of adequate nature for the treatment of NAL ore at the NAL treatment plant.
| Revision: 0 – 14-Aug-2026 B198-D01-02054-RT-0010 |
Page 105 |
| NAL Expansion FS Mineral Reserve Pre-Feasibility Study NI 43-101 Final Report Prepared for Elevra |
|
| 14 | Mineral Resource Estimate |
This chapter describes the process and results of the Mineral Resource estimate for the NAL Property. Information contained in this chapter was previously published by Sayona in an ASX Press Release and JORC (2012) Mineral Resource Estimate dated August 27th, 2025, in a NI 43-101 Technical Report titled “Definitive Feasibility Study Report for the North American Lithium Project, dated April 14th, 2023 and from the announcement entitled “2026 Annual Report” published on the ASX on August 28th, 2026
| 14.1 | Methodology |
The Mineral Resource estimate occupies an area spanning 3,550 m along strike, 1,300 m in width and 800 m depth (Figure 14-1).
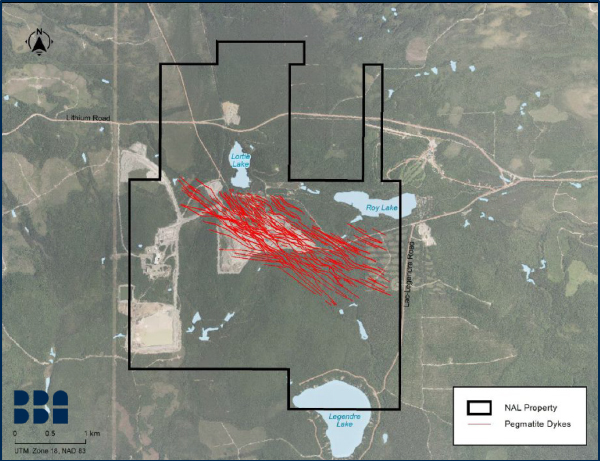
Figure 14-1: Area of Mineral Resource Estimate, Showing Mineralized Zone Locations at Elevation 350m
Three-dimensional geological wireframes, mineralized intercepts, composites, block modelling, interpolation, classification and reporting were all constructed using Seequent Leapfrog Geo™ (“Leapfrog Geo”) and Leapfrog Edge™ version 2024.1 (“Leapfrog Edge”). Statistical studies were undertaken using Excel and Snowden Supervisor version 9.1 (“Supervisor”). Deswik version 2025.1.2156 was used for the pit shell optimization and Deswik.SO 5.1.3878 for the definition of potentially mineable underground stopes.
| Revision: 0 – 14-Aug-2026 B198-D01-02054-RT-0010 |
Page 106 |
| NAL Expansion FS Mineral Reserve Pre-Feasibility Study NI 43-101 Final Report Prepared for Elevra |
|
| 14.2 | Database |
The Project database contains data for 1,575 diamond drillholes, including 923 surface-collared and 652 underground-collared drillholes with a cumulative length of 221,404 m (Figure 14-2).
Table 14-1 shows available drilling data and the drilling data subsequently included in the Mineral Resource estimate. A subset of 562 surface-collared drillholes completed between 2009 and the end of 2024 with a cumulative length of 153,047 m was included in the Mineral Resource estimate. The last drillhole contained in the Project database is hole LAN-24-289.
The average drill spacing is approximately 100 m x 100 m in the area of the deposit, with local definition up to 50 m x 50 m, mostly within the conceptual pit shell. The majority of holes completed between 2009 and 2024 were drilled with an azimuth of N045, which is perpendicular to most of the pegmatite dykes. Holes were typically angled at -45 to -60 degrees to cut as closely as possible to the interpreted true width of each dyke.
Table 14-1: Drilling Data used in the Geological Model and Mineral Resource Estimate
| Available Data | Number of Holes | Data Used in the New Model | Grade Interpolation |
| Drilling Type | Program | ||
| Underground | 652 | Historical | 0 |
|
Surface
|
21 | Historical Jourdan | 0 |
| 81 | Historical (LV) | 0 | |
| 119 | Historical (SB-LB-E-CL-S) | 0 | |
| 53 | 2009 - Environment and GT | 11 | |
| 39 | 2009 | 39 | |
| 51 | 2010 | 50 | |
| 63 | 2011 | 63 | |
| 50 | 2016 | 46 | |
| 22 | 2017 - Geotech | 0 | |
| 59 | 2018 - Pit limits | 0 | |
| 42 | 2019 | 38 | |
| 172 | 2023 | 164 | |
| 151 | 2024 | 151 | |
| Total | 1,575 | 562 | |
| 14.3 | Geological Interpretation and Domaining |
The geological model employed for the Mineral Resource estimate is based on drillholes, open pit mapping and historical underground mapping and voids. A three-dimensional interpretation of pegmatite dykes was developed using Leapfrog Geo, employing lithology information contained in the Project database (Figure 14-3). A total of 117 pegmatite wireframes (“pegmatite domains”) were created. Other lithology wireframes were developed for granodiorite, volcanic rocks and gabbro (Figure 14-4).
Historical mining voids from past production work are included in the model (Figure 14-5). The location, dimensions and content of some of the historical void shapes are not sufficiently precise, therefore their location and volume were adapted and slightly modified to fit the pegmatite domains.
| Revision: 0 – 14-Aug-2026 B198-D01-02054-RT-0010 |
Page 107 |
| NAL Expansion FS Mineral Reserve Pre-Feasibility Study NI 43-101 Final Report Prepared for Elevra |
|
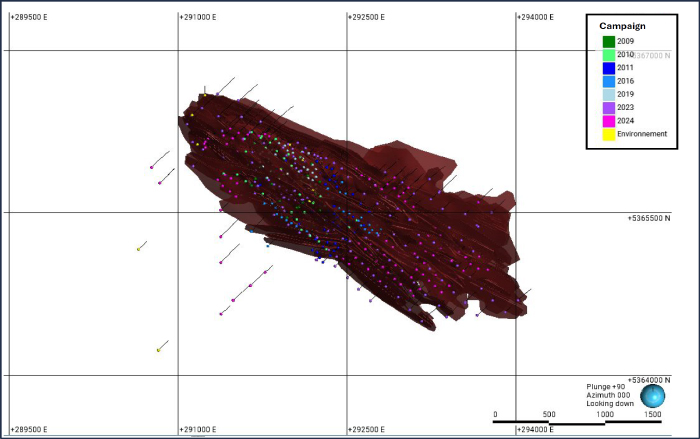
Figure 14-2: Plan View Showing Pegmatite Dykes and Drillhole Locations
| Revision: 0 – 14-Aug-2026 B198-D01-02054-RT-0010 |
Page 108 |
| NAL Expansion FS Mineral Reserve Pre-Feasibility Study NI 43-101 Final Report Prepared for Elevra |
|
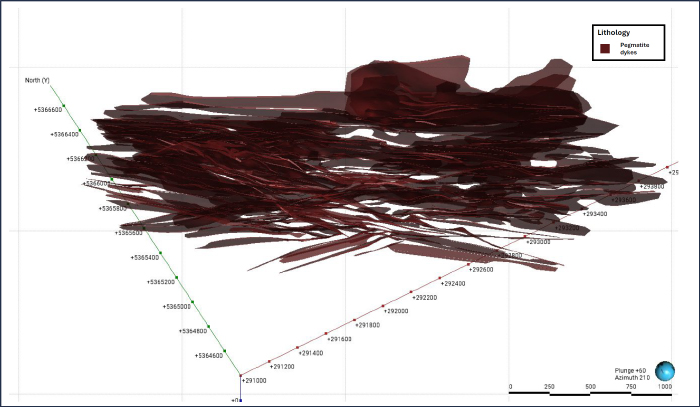
Figure 14-3: Three-Dimensional Interpretation of Pegmatite Domains
| Revision: 0 – 14-Aug-2026 B198-D01-02054-RT-0010 |
Page 109 |
| NAL Expansion FS Mineral Reserve Pre-Feasibility Study NI 43-101 Final Report Prepared for Elevra |
|
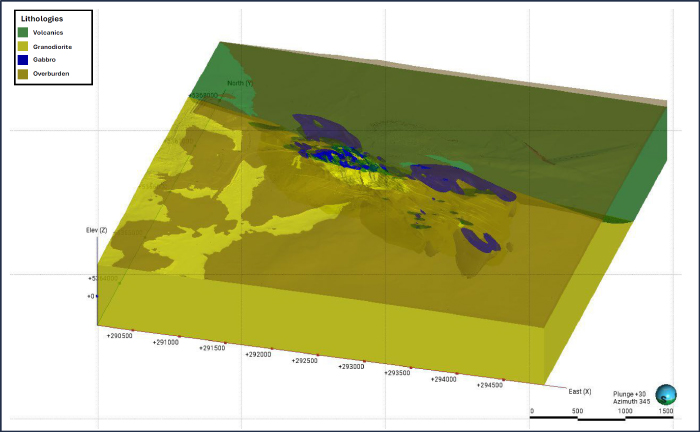
Figure 14-4: Lithology Model for Volcanics, Granodiorite and Gabbro
| Revision: 0 – 14-Aug-2026 B198-D01-02054-RT-0010 |
Page 110 |
| NAL Expansion FS Mineral Reserve Pre-Feasibility Study NI 43-101 Final Report Prepared for Elevra |
|
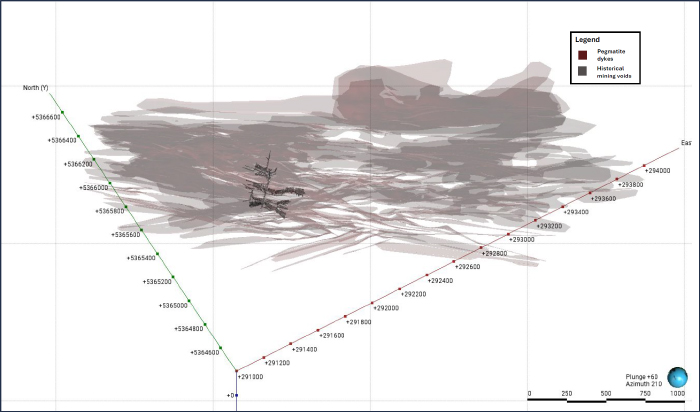
Figure 14-5: Historical Mining Voids Adjusted to Fit Pegmatite Domains, Shown with Semi-Transparent Pegmatite Domains
| Revision: 0 – 14-Aug-2026 B198-D01-02054-RT-0010 |
Page 111 |
| NAL Expansion FS Mineral Reserve Pre-Feasibility Study NI 43-101 Final Report Prepared for Elevra |
|
| 14.4 | Data Preparation |
| 14.4.1 | Exploratory Data Analysis |
The Mineral Resource estimate incorporates a total of 27,183 records of Li2O assays with a mean sample length of approximately 0.884 m. Li2O grade varies from 0.000% to 5.318%. Global average Li2O grade for raw samples (excluding 0.00% assays) is 0.783%.
The following methods were employed to prepare and analyse Li2O assay data prior to grade estimation:
| ● | All raw assay data intersecting pegmatite domains were assigned individual mineralisation codes using Leapfrog Geo. |
| ● | Unsampled intervals in the Project database were assigned a zero grade. |
| ● | An evaluation table was created in Leapfrog Geo where all drillholes that intersected a wireframe within each domain were assigned a name representative of the domain. This table was then merged with the assay table to proceed with the descriptive statistics. |
| ● | Exploratory data analysis was completed on raw assay data for all the pegmatite domains to determine the correlation of Li2O grade within each pegmatite domain and to identify high-grade outlier samples. A combination of descriptive statistics and histograms were used to analyse the grade population of the data using Excel and Leapfrog Geo. The findings were used to help define parameters used in the Mineral Resource estimate. |
| ● | High-grade outlier assays in each domain were reviewed. |
| ● | Li% is converted to Li2O% for reporting purposes. The conversion used is Li2O = Li x 2.153. |
| 14.4.2 | Compositing |
Compositing of drillhole samples was conducted to homogenize the Project database to remove any bias associated with sample length. The compositing length was determined after consideration of original sample length statistics and other factors. Figure 14-6 shows the distribution of the length before and after compositing.
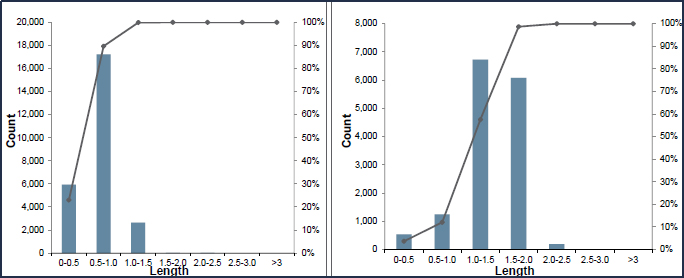
Figure 14-6 – Distribution of the Length Before (Left) and After (Right) Compositing
| Revision: 0 – 14-Aug-2026 B198-D01-02054-RT-0010 |
Page 112 |
| NAL Expansion FS Mineral Reserve Pre-Feasibility Study NI 43-101 Final Report Prepared for Elevra |
|
All assay intervals captured within the pegmatite domains were composited to regular 1.5 m lengths, based on the observed modal distribution of raw sample lengths. Residual intervals at domain edges of up to 0.75 m were equally distributed along the drillhole to maintain consistency in composite lengths. Unsampled intervals were assigned a zero grade. A total of 14,946 composite samples were generated in pegmatite domains.
Compositing was completed within each pegmatite domain. Composite samples do not cross domain boundaries. The composite assays were validated statistically to ensure there was no loss of data or significant change to the mean grade of each assay population.
| 14.4.3 | Grade Capping |
An outlier is an observation that appears to be inconsistent with most of the data in the same statistical population. It is common practice to statistically examine higher grades within a population and to trim outliers to a lower-grade value, commonly referred to as capping.
Capping analysis was performed by searching for abnormal breaks or changes of slope on the grade distribution probability plot, whilst ensuring that: (A) the coefficient of variation (“COV”) of the capped data was lower than 2.00; and (B) no more than 10% of total contained metal was enclosed within the first 1% of highest-grade samples. This analysis was performed on the entire dataset for all pegmatite domains. The study determined that capping is warranted on the entire set of composites at 3.0 Li2O (%) (Figure 14-7).
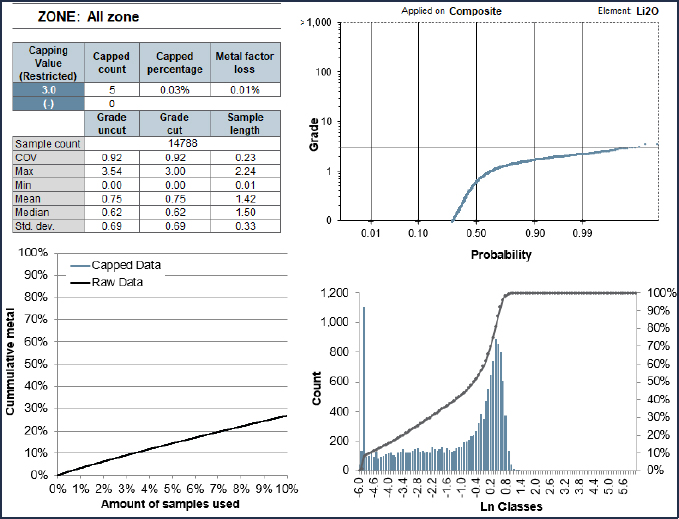
Figure 14-7: Capping Analysis on All Dykes; Capping at 3.0% Li2O
| Revision: 0 – 14-Aug-2026 B198-D01-02054-RT-0010 |
Page 113 |
| NAL Expansion FS Mineral Reserve Pre-Feasibility Study NI 43-101 Final Report Prepared for Elevra |
|
| 14.5 | Density Estimation |
According to previous NAL reports, density measurements were collected from core during past drilling programs. However, the raw data for these measurements were not available to use for the Mineral Resource estimate.
In 2022, a total of 600 samples collected from 97 drillholes throughout the deposit were sent to SGS Canada Inc. laboratories for bulk density measurement. Representative samples were selected for pegmatites and waste rock.
Bulk density measurements were determined by the water immersion method. Core samples were weighed in air and then placed in a basket suspended in water and were weighed again. The samples were not waxed or sealed; however, natural voids were not considered to be a significant issue with respect to bulk density determination.
Table 14-2 lists the median values used for each lithology.
Table 14-2: Bulk Density Values Employed for the Mineral Resource Estimate
| Rock Type | Count | Min (g/cm3) | Max (g/cm3) | Median (g/cm3) |
| Gabbro | 35 | 2.85 | 3.20 | 3.11 |
| Granodiorite | 30 | 2.63 | 3.16 | 2.77 |
| Pegmatite | 482 | 2.56 | 2.93 | 2.70 |
| Volcanic | 53 | 2.83 | 3.19 | 3.01 |
| Overburden | 2.00 |
| 14.6 | Geostatistics and Grade Estimation |
| 14.6.1 | Variography |
A semi-variogram is used to measure the spatial variability of Li2O grade within specific mineralized zones. Samples collected far apart will typically vary more than samples collected close to each other. A variogram provides a measure of how much two samples taken from the same mineralized zone will vary in grade depending on the distance and spatial orientation between those samples.
Variography studies were completed for eleven of the largest pegmatite domains using Supervisor (Figure 14-8). Experimental variograms were calculated from the composited Li2O assay data to determine the approximate dimensions and orientations of the search ellipses.
The following steps were considered for each domain analysis:
| 1. | Downhole variograms were created and modelled to define the nugget effect. |
| 2. | Experimental semi-variograms were calculated to determine directional variograms for the major, semi-major, and minor orientations. |
| 3. | Variograms were modelled using an exponential model with practical range and a normalized sill of 1. |
| Revision: 0 – 14-Aug-2026 B198-D01-02054-RT-0010 |
Page 114 |
| NAL Expansion FS Mineral Reserve Pre-Feasibility Study NI 43-101 Final Report Prepared for Elevra |
|
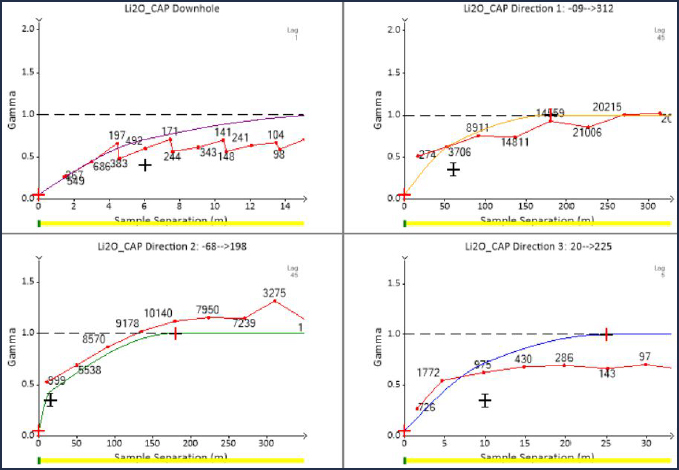
Figure 14-8: Variography Study in Supervisor (Example from Dyke A)
Variogram ranges were observed to be similar for all eleven pegmatite domains. The variogram model for Dykes A and B, which are the two pegmatite domains containing the most composites, was therefore chosen to be used for all domains in the geological model. Table 14-3 summarises the variogram parameters employed for all pegmatite domains.
Table 14-3: Variogram Parameters used for All Pegmatite Domains
|
Domain |
Nugget |
First Structure | Second Structure | ||||||
| Sill | Range X (m) | Range Y (m) | Range Z (m) | Sill | Range X (m) | Range Y (m) | Range Z (m) | ||
| ALL_ZONES | 0.05 | 0.3 | 60 | 15 | 10 | 0.65 | 180 | 180 | 25 |
All of the pegmatite domains were estimated using the ordinary kriging (“OK”) method, employing Leapfrog Edge software. All of the pegmatite domains were also estimated using Inverse Distance Square (“ID2”) and Nearest Neighbour (“NN”) methods employing Leapfrog Edge, for comparison and validation purposes. The OK estimation results were determined to be similar to the results for ID2 and NN methods. The OK method was therefore retained as the preferred estimation method for all pegmatite domains to simplify the estimation process.
Three successively less restrictive passes were completed to interpolate Li2O grades. The ellipse sizes and anisotropies were based on variography, drillhole spacing and pegmatite geometry. The ellipsoid used for the first pass was 50% of the range of the variogram (90 m x 90 m x 12.5 m), for the second pass the ellipsoid was 100% of the range of the variogram (180 m x 180 m x 25 m) and for the third pass, the ellipsoid was 150% the range of the variogram (270 m x 270 m x 37.5 m) and meant to fill the remaining blocks of the block model. The first and second pass has a minimum of four (4) composites and a maximum of eight (8) composites and a minimum of two drillholes were needed to interpolate. The third pass has a minimum of two (2) composites and a maximum of eight
| Revision: 0 – 14-Aug-2026 B198-D01-02054-RT-0010 |
Page 115 |
| NAL Expansion FS Mineral Reserve Pre-Feasibility Study NI 43-101 Final Report Prepared for Elevra |
|
(8) composites with no minimum number of drillholes needed to interpolate. Table 14-4 summarises the search ellipsoid parameters.
Spatial anisotropy of the pegmatite domains was respected during estimation using the Leapfrog Edge Variable Orientation tool. The Variable Orientation tool uses the central reference plane from each individual pegmatite dyke to select the locally appropriate anisotropy orientation and to orient the search ellipse for selection of composites and determination of kriging weights.
Table 14-4: Search Ellipsoids
| Pass | Ellipse (m) | Min. Sample | Max. Sample | Max per Hole |
| 1 | 90 x 90 x 12.5 | 4 | 8 | 3 |
| 2 | 180 x 180 x 25 | 4 | 8 | 3 |
| 3 | 270 x 270 x 37.5 | 2 | 8 | None |
| 14.6.2 | Block Model |
Block models were generated in Leapfrog Edge for each of the pegmatite domains. Parent cells of 5 m x 5 m x 5 m were sub-blocked four times in each direction (minimum sub-block of 1.25 m in each direction). Sub-blocks are triggered by the geological model, mining voids, overburden, topography, and classification. The block model is rotated -50 degrees around the Z axis.
Block models include proportional sub-blocks to cover spaces inside the solid boundaries and to honour wireframe volumes. The size of sub-blocking was chosen to best match the thickness of the pegmatite domains and the complexity of the geological model. Block model parameters are shown in Table 14-5. Grades were estimated using the parent block and assigned to the sub-blocks.
Table 14-5: Block Model Parameters used in Leapfrog Edge™
| Properties | X (Column) | Y (Row) | Z (Level) |
| Origin of coordinates | 293,380 | 5,363,260 | 490 |
| Number of blocks | 515 | 826 | 170 |
| Block size (m) | 5 | 5 | 5 |
| Minimum sub-block size(m) | 1.25 | 1.25 | 1.25 |
| Rotation | -50 | ||
| 14.6.3 | Grade Interpolation |
Block models were estimated using Ordinary Kriging (“OK”) and Variable Orientation search algorithms fully implemented in Leapfrog Edge. Variable Orientation allows the orientation of the ellipsoid and variograms to be used for each block individually based on local characteristics. ID2 and Nearest-Neighbour (“NN”) models were produced for validation purposes.
Kriging neighbourhood analysis (“KNA”) was performed to assist with the selection of the estimation parameters. KNA provides a quantitative method of testing different estimation parameters, such as block size, number of samples, optimum search radius, and discretization by assessing their impact on the quality of the resultant estimates in terms of kriging efficiency and slope of regression. This study is dependent on several factors, including the inherent deposit variability, grade continuity, anisotropy, and the data spacing. The variogram mathematically represents these factors and is critical for a KNA. Table 14-6 summarizes the suggested parameters of the KNA analysis.
| Revision: 0 – 14-Aug-2026 B198-D01-02054-RT-0010 |
Page 116 |
| NAL Expansion FS Mineral Reserve Pre-Feasibility Study NI 43-101 Final Report Prepared for Elevra |
|
Table 14-6: Summary of the Suggested Parameters from the KNA Analysis
| Properties | Global Optimum |
| Block sizes (m) | 5x5x5 |
| Sample ranges | 4 to 8 |
| Search ranges (m) | 180, 180, 25 |
| Discretization | 3, 3, 3 |
The interpolation was performed with three search passes. The first pass is interpolated using 50% of the ranges of the second structure of the variogram (0.5x), the second pass uses 100% (1x) and the third pass uses 150% (1.5x) of the ranges of the second structure of the variogram and is meant to fill the remaining blocks. A minimum and a maximum number of composites were required in each pass, as well as a maximum number of composites by drillhole to satisfy the estimation criteria, as shown in Table 14-7.
Hard boundaries were implemented between each pegmatite domain to ensure that grades from adjacent domains were not included during interpolation. Each block was tagged with the pass number corresponding to its estimation. Interpolation was carried out sequentially, domain by domain, and was limited to composites that were uniquely coded for each domain.
Table 14-7: Summary of Parameters used for Li2O Grade Interpolation
|
Dyke |
Interpolation Method |
Pass
|
Ellipsoid Ranges (m) | Number of Samples |
Drillhole Limit | |||
| Max | Intermediate | Min | Max | Min | Max Samples/Hole | |||
| All dykes | OK | P1 | 90 | 90 | 12.5 | 4 | 8 | 3 |
| All dykes | OK | P2 | 180 | 180 | 25 | 4 | 8 | 3 |
| All dykes | OK | P3 | 270 | 270 | 37.5 | 2 | 8 | - |
| 14.7 | Block Model Validation |
Validation of the block model was performed using Swath Plots in each of the three block model axes, ID2 and Nearest-Neighbour (“NN”) grade estimations, global means comparisons, and visual inspection in 3D and along plan views and cross-sections.
| 14.7.1 | Visual Inspection |
Block model grades were visually compared against drillhole composite grades in cross-section and 3D views. This visual validation process also included confirming that the proper parameters were selected for the various domains and checks for global and local bias. The visual comparison shows that the block model is reasonably consistent and correlates well with the primary data without excessive smoothing, as shown in Figure 14-9.
| Revision: 0 – 14-Aug-2026 B198-D01-02054-RT-0010 |
Page 117 |
| NAL Expansion FS Mineral Reserve Pre-Feasibility Study NI 43-101 Final Report Prepared for Elevra |
|
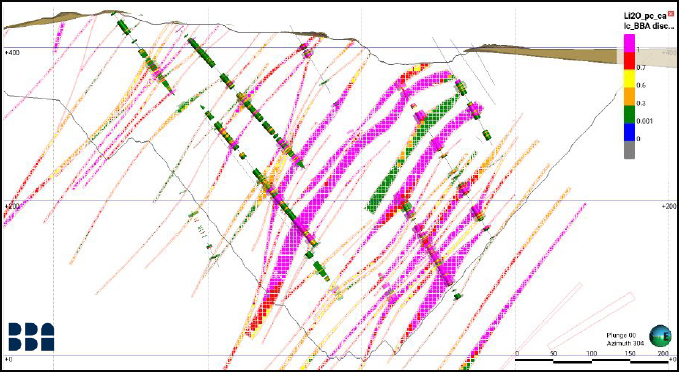
Figure 14-9: Cross-Section Looking West
| 14.7.2 | Swath Plots |
Swath plots were generated as part of the block model validation process. A swath plot is a graphical display of the grade distribution derived from a series of bands (or swaths) generated in several directions throughout the deposit. Using swath plots, grade variations from the Li2O_OK model are compared to the distribution of grades interpolated with the Li2O_NN and Li2O_ID2 methods and the composites. This validation method also works as a visual means to identify possible interpolation bias. Figure 14-10 and Figure 14-11 show an example of swath plots through a single pegmatite domain. The Li2O grades estimated in each block are generally close to the average grades provided by the data source, albeit with some smoothing of values evident. Block grades determined by OK and ID2 estimates are observed to be lower than the composite values in some areas. This is attributed to the interpolation of lower grade composite samples from further away within the search ellipse.
| Revision: 0 – 14-Aug-2026 B198-D01-02054-RT-0010 |
Page 118 |
| NAL Expansion FS Mineral Reserve Pre-Feasibility Study NI 43-101 Final Report Prepared for Elevra |
|
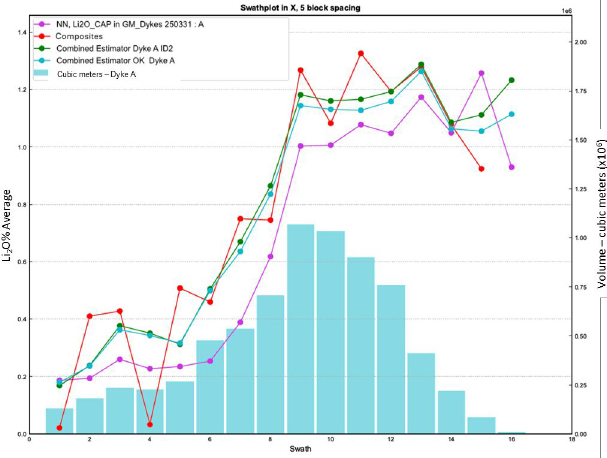
Figure 14-10: Swath Plot for Mineralized Pegmatite Dyke A – Direction X
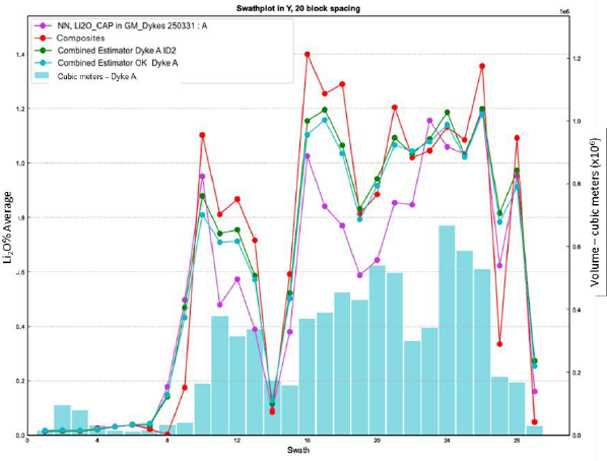
Figure 14-11: Swath Plot for Mineralized Pegmatite Dyke A – Direction Y
| Revision: 0 – 14-Aug-2026 B198-D01-02054-RT-0010 |
Page 119 |
| NAL Expansion FS Mineral Reserve Pre-Feasibility Study NI 43-101 Final Report Prepared for Elevra |
|
| 14.8 | Mineral Resource Classification |
The Mineral Resource estimate includes Mineral Resources classified as Indicated and Inferred categories. The classification of Mineral Resources takes into account the following criteria:
| 1. | Interpolation passes. |
| 2. | Distance to closest information. |
| 3. | Number of drill holes used to estimate the block’s grade. |
| 4. | Proximity to known mineralization in the current pit. |
The Indicated category was assigned to blocks informed by a minimum of two drillholes where drill spacing is less than 80 m inside the conceptual resource pit shell. The Inferred category was assigned to blocks when the drill spacing was 150 m or less. Classification volumes are created around contiguous blocks at the stated spacing criteria with consideration for the selected mining method. Geological and grade continuity is also taken into consideration during the classification process.
Figure 14-12 shows a longitudinal section of the Mineral Resource classification for one pegmatite dyke wireframe
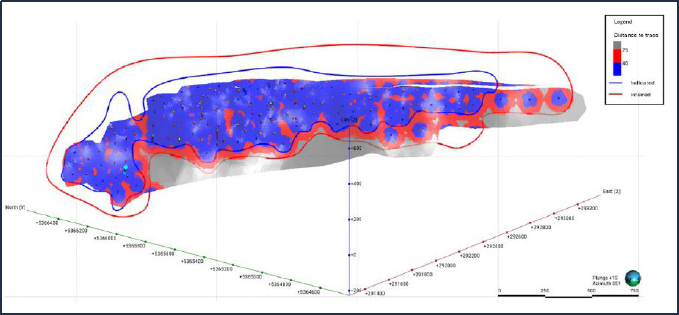
Figure 14-12: Classification Distribution on a Longitudinal Section of One Pegmatite Dyke, Looking Northeast
Measured category blocks from the previous Mineral Resource estimate have been reclassified as Indicated Resources to align with the more stringent definition of Measured Resources under SEC disclosure standards (§ 229.1300). This standard requires a higher level of geological confidence in the estimates than comparable frameworks for NI 43-101 and JORC (2012). Due to the complex geometry of the pegmatite dykes, characterized by pinching, swelling, and intertwining within the pit, it is not possible to precisely confirm their location. As a result, while the underlying data remains unchanged, the level of geological confidence does not meet the threshold required for Measured classification under SEC disclosure standards, necessitating the downgrade to Indicated.
| Revision: 0 – 14-Aug-2026 B198-D01-02054-RT-0010 |
Page 120 |
| NAL Expansion FS Mineral Reserve Pre-Feasibility Study NI 43-101 Final Report Prepared for Elevra |
|
| 14.9 | Economic Parameters and Cut-off Grade |
Mineral Resources were estimated using Leapfrog Edge to create the block model and Deswik. CAD 2025.1.2156 and Deswik.SO 5.1.3878 software to create a pit shell and reasonable underground mineable shapes. To ensure that the Mineral Resource estimate for the Property satisfies the Reasonable Prospects for Eventual Economic Extraction (“RPEEE”) requirement, a number of technical and economic factors were considered in the derivation of the Mineral Resource volume used to constrain the mineralization.
Pit shells were used to constrain open-pit sections of the Mineral Resource estimate. Resource-level optimized pit shells and their corresponding cut-off grades were used for the open pit Mineral Resource estimate. The constraining pit shell was developed using pit slopes of 46 to 53 degrees based on geotechnical data.
Reasonable underground mining shapes were based on minimum width and/or the geometry of the mineralization. The solids representing the reasonable mining shapes are based upon contiguous blocks above the cut-off grade.
The Mineral Resource estimate has been tabulated using a cut-off grade (“COG”) of 0.60% Li2O for an open pit mining scenario and 0.70% Li2O for an underground mining scenario based on 5.4% spodumene concentrate selling price of USD$1,395/t. A COG of 0.60% Li2O was used for the Mineral Resource estimate due to processing limitations and should be viewed as a mill-feed cut-off grade for an open pit scenario.
Stope Optimiser shapes (“DSO”) with a minimum of 3 m were used for reporting underground resources. All material within the shapes, including internal dilution below the cut-off grade of 0.7% Li2O, was reported.
Forecast lithium product sale prices calculated by BMI (source: Benchmark Mineral Intelligence 2025 Q1 2025 Lithium Forecast Report) are shown in Figure 16-3 (Chapter 16). The average nominal sale price of 6% spodumene concentrate is approximately USD1,550/t between 2026 and 2040. Refer to Chapter 16 (Market Studies and Contracts) for further information.
Table 14-8 summarizes the values used to determine the cut-off grades for the Mineral Resource estimate. The COG should be reassessed periodically, considering market conditions and factors such as the price of lithium, exchange rates, mining techniques and associated costs.
Table 14-8: Reasonable Extraction Factors
| Cost | Unit | Open Pit | Underground |
| Mining | CAD/t mined | 8.50 | 100.00 |
| Processing (including water treatment and tailings Management costs) | CAD/t milled | 46.10 | 46.10 |
| G&A | CAD/t milled | 17.09 | 17.09 |
| 6% Li2O concentrate price | USD/t conc. | 1,550 | 1,550 |
| Concentrate transport | USD/t conc. | 126.23 | 126.23 |
| Exchange rate | USD:CAD | 0.74 | 0.74 |
| Recovery | % | 69.20 | 69.201 |
| Break-even grade | % | 0.28 | 0.72 |
| Cut-off grade applied | % | 0.60 | 0.70 |
Notes:
| 1. | An average Life-of-Mine metallurgical recovery of 71.2% at a spodumene concentrate grade of 5.4% Li2O has been applied to the Expansion Case for the purpose of the PEA study, compared with an estimate of 69.2% for the Base Case. See Section 13.5 - Testwork Analysis and Section 16.4.5 - Modifying Factors for further information. |
| Revision: 0 – 14-Aug-2026 B198-D01-02054-RT-0010 |
Page 121 |
| NAL Expansion FS Mineral Reserve Pre-Feasibility Study NI 43-101 Final Report Prepared for Elevra |
|
| 14.10 | Mineral Resource Statement |
The Mineral Resource estimate as of June 30, 2026, is shown in Table 14-9.
Table 14-9: NAL Mineral Resource Estimate – June 30, 2026
| NAL – Total Open Pit and Underground Constrained Mineral Resource Estimate | |||||
| Classification | Scenario | Tonnes (Mt) | Grade (% Li2O) |
Cut-Off Grade % Li2O |
Met Recovery % |
| Indicated | OP | 74.4. | 1.17 | 0.60 | 69.2 |
| UG | - | - | - | - | |
| Total | 74.4 | 1.17 | 0.60 | 69.2 | |
| Inferred | OP | 8.6 | 1.13 | 0.60 | 69.2 |
| UG | 10.3 | 1.01 | 0.70 | 69.2 | |
| Total | 18.9 | 1.06 | 69.2 | ||
Notes:
| 2. | The information on Mineral Resources and Ore Reserves is extracted from the announcement entitled “2026 Annual Report” published on the ASX on August 28th, 2026, and is available to view on the Elevra’s website on the ASX. Measured Group and Optimal Mining are responsible for the Mineral Resource estimate presented in this Report. |
| 1. | The independent QP for the Mineral Resource estimate, as defined by NI43-101, is Stephen Andrews (MAusIMM) of Measured Group Pty Ltd. |
| 2. | The Effective Date of the Mineral Resource estimate. is June 30th, 2026. |
| 3. | Mineral Resources are inclusive of Mineral Reserves, but do not include the stockpiled ROM ore. |
| 4. | The Mineral Resource has been adjusted for mining depletion up to 30th June 2026 based on LiDAR survey information. No re-estimation of the underlying Mineral Resource model has been undertaken. The Effective Date of the Mineral Resource estimate is June 30th, 2026. |
5.
6. 3. The independent QP for the Mineral Resource estimate, as defined by NI43-101, is Stephen Andrews (MAusIMM) of Measured Group Pty Ltd.
| 7. |
| 8. | Mineral Resources are not Mineral Reserves as they do not have demonstrated economic viability. The quantity and grade of reported Inferred resources in this Mineral Resource estimate are uncertain in nature and there has been insufficient exploration to define these resources as Indicated; however, it is reasonably expected that the majority of Inferred Mineral Resources could be upgraded to Indicated Mineral Resources with continued exploration. |
| 9. | The geological model created in Leapfrog Geo™ 2024.1 contains a total of 117 pegmatite dykes, of which 93 demonstrate RPEEE ‘reasonable prospects for eventual economic extraction’. |
| 10. | Based on the statistical analysis, capping value was set at 3.00% Li2O and applied after compositing. Compositing of 1.5 m in length was completed using the grade of the adjacent material when assayed or a value of zero when not assayed. |
| 11. | The Mineral Resources were estimated using Leapfrog ™ 2024.1 using hard boundaries on composited assays. The OK method was used to interpolate a sub-blocked model (parent block size = 5 m x 5 m x 5 m and subblocks of 1.25 m). |
| 12. | The Mineral Resource estimate is categorized as Indicated and Inferred resources. There are no Mineral Resources in the Measured category. The Indicated category was defined for blocks that are informed by a minimum of two (2) drillholes where drill spacing is less than 80 m. The Inferred category was assigned to blocks where drill spacing is less than 150 m. Where needed, some materials have been either upgraded or downgraded to avoid isolated blocks and spotted-dog effects. |
| 13. | Fixed density values were established on a per unit basis, corresponding to the median of the bulk density data of each unit ranging from 2.70g/cm3 to 3.11g/cm3 (2.70 g/cm3 for all pegmatite dykes, 2.77 g/cm3 for Granodiorite, 3.01 g/cm3 for Volcanics and 3.11 g/cm3 for Gabbro). |
| 14. | The Topography used for this Mineral Resource estimate is a combination of Lidar surveys dating from September 2024 to June 29th 2026. |
| 15. | Mineral Resources are presented undiluted, pit constrained and within stope shapes and are considered to have reasonable prospects for eventual economic extraction. Although the calculated cut-off grade is 0.28% Li2O for open pit, a cut-off grade of 0.60% Li2O was used for the Mineral Resource estimate due to processing limitations. The pit optimization was completed using Deswik mining software. The constraining pit shell was developed using pit slopes of 46 to 53 degrees. The open-pit cut-off grade and pit optimization were calculated using the following parameters (amongst others): 5.40% Li2O concentrate price = USD1,395 per tonne; USD:CAD exchange rate = 0.74; Hard Rock and Overburden Mining cost = $8.50/t mined; Mill Recovery of 69.2%; Processing cost (including water treatment, tailing management and sustaining capital)= $46.10/t processed; G&A = $17.09/t processed; Transportation cost = $126.23/t conc. The cut-off grade for underground resources was calculated at 0.72% Li2O but rounded to 0.70% Li2O; it used identical costs and recoveries, except for mining costs being at $100/t. Cut-off grades will be re-evaluated in light of future prevailing market conditions and costs. |
| 16. | The number of tonnes has been rounded to the nearest hundred thousand. Any discrepancy in the total is due to rounding effects. |
| Revision: 0 – 14-Aug-2026 B198-D01-02054-RT-0010 |
Page 122 |
| NAL Expansion FS Mineral Reserve Pre-Feasibility Study NI 43-101 Final Report Prepared for Elevra |
|
| 17. | The QPs are not aware of any known environmental, permitting, legal, title-related, taxation, socio-political, marketing, or other relevant issues that could materially affect the mineral resources estimate other than those disclosed in this Report. |
| 18. | Mineral resources are 100% attributable to NAL Property. Elevra has 100% interest in North American Lithium. |
| 19. | The Mineral Resources were prepared in accordance with the standards set out in the 2012 Edition of the ‘Australasian Code for Reporting of Exploration Results, Mineral Resources and Ore Reserves’ (“JORC Code”) and in accordance with National Instrument 43-101 – Standards of Disclosure for Mineral Projects of the Canadian Securities Administrators (“NI 43-101”). |
| 14.11 | Grade Sensitivity Analysis |
Table 14-10 presents the sensitivity of the open-pit portion of the June 2025 Mineral Resource estimate at different cut-off grades. Each iteration of the cut-off grade sensitivity study was pit constrained only. Sensitivity has not been run on the underground portion of the MRE. Tonnages and grade are presented at 0.10% Li2O, Li2O cut-off grade increments within the official RPEEE pit shell from 0.2% to 0.8%.
Note that the figures provided in this table should not be interpreted as a Mineral Resource statement. The reported quantities and grade estimates at different cut-off grades are presented for the sole purpose of demonstrating the sensitivity of the Mineral Resource estimate to the reporting cut-off grade.
Table 14-10: Cut-Off Sensitivity Analysis (Open Pit Portion) of June 2025 Mineral Resources
| Classification | Indicated | Inferred | Indicated and Inferred | |||
| Cut-off Grade Li2O % | Tonnes (Mt) | Li2O % | Tonnes (Mt) | Li2O % | Tonnes (Mt) | Li2O % |
| 0.2 | 93.7 | 1.03 | 11.2 | 0.96 | 104.8 | 1.02 |
| 0.3 | 89.8 | 1.07 | 10.7 | 0.99 | 100.5 | 1.06 |
| 0.4 | 85.8 | 1.1 | 10.1 | 1.03 | 95.9 | 1.09 |
| 0.5 | 81.4 | 1.13 | 9.4 | 1.08 | 90.7 | 1.13 |
| 0.6 | 76.2 | 1.17 | 8.6 | 1.13 | 84.7 | 1.17 |
| 0.7 | 70.2 | 1.22 | 7.5 | 1.19 | 77.7 | 1.22 |
| 0.8 | 63.6 | 1.27 | 6.6 | 1.25 | 70.2 | 1.27 |
| 14.12 | Iron Content |
Iron content (% Fe) can influence metallurgical recovery and the quality of potential spodumene concentrate. As a result, an “Fe” attribute was assigned to both the blocks and sub-blocks of the resource model. This is especially important when converting mineral resources into mineral reserves. The iron content plays a significant role in subsequent stages of studies, including potential mining sequencing and planning. At the mineral reserves stage, iron will not only come from the pegmatites but also from dilution caused by surrounding host rocks. A sampling program conducted in 2022 provided precise data for all lithologies. Since 2022, iron grades have been analysed alongside lithium.
Iron content was incorporated into the block model using the median values for each host rock lithology and was estimated within pegmatite domains using ID2. Where data was insufficient for estimation, the median iron grade of the pegmatite was assigned to the affected blocks.
The median values used for each lithology are shown in Table 14-11.
| Revision: 0 – 14-Aug-2026 B198-D01-02054-RT-0010 |
Page 123 |
| NAL Expansion FS Mineral Reserve Pre-Feasibility Study NI 43-101 Final Report Prepared for Elevra |
|
Table 14-11: Iron Content used for Mineral Resource Estimate
| Rock Type | Fe (%) |
| Gabbro | 6.68 |
| Granodiorite | 2.30 |
| Pegmatite | ID2 or fixed value of 0.29 |
| Volcanics | 5.72 |
| Revision: 0 – 14-Aug-2026 B198-D01-02054-RT-0010 |
Page 124 |
| NAL Expansion FS Mineral Reserve Pre-Feasibility Study NI 43-101 Final Report Prepared for Elevra |
|
| 15 | Mineral Reserve Estimate |
| 15.1 | Summary |
North American Lithium (NAL) is an operational mine which allows for the use of current mine designs, equipment operating parameters and historical unit cost rates in the development of the Mineral Reserve estimate. All required processing, maintenance and technical infrastructure required to produce spodumene concentrate and bring the concentrate to market exists on site. The economics of the Mineral Reserve estimate may be materially affected by a significant change to commodity pricing, however spodumene concentrate is forecast to remain at elevated levels.
The NAL Reserve estimates have been prepared using accepted industry practice and in accordance with NI 43-101 reporting standards, by Mr Tony O’Connell who is an employee of Optimal Mining Solutions Pty Ltd, an independent mining consultancy based in Brisbane, Australia.
| 15.2 | Mineral Reserve Estimate |
The Mineral Reserve estimate for NAL has been estimated as of June 30th, 2026, with the results shown in Table 15-1.
Table 15-1: NAL Reserves estimate as of June 30th, 2026
| Category | Tonnes (Mt) | Li2O Grade (%) | Li2O Cut-Off (%) | Fe Grade (%) |
| Proven Reserves | 0.2 | 0.93% | 0.60% | 1.48% |
| Probable Reserves | 47.0 | 1.12% | 0.60% | 0.81% |
| Proven + Probable Reserves | 47.2 | 1.12% | 0.60% | 0.81% |
Notes on the Mineral Reserve estimate:
| ● | The effective date for the Mineral Reserves estimate is June 30th, 2026. |
| ● | Mineral Reserves are measured as dry tonnes at the crusher above a diluted cut-off grade of 0.60% Li2O. |
| ● | All Proven Reserves are from ROM stockpiles as of June 30th, 2026. |
| ● | Mineral Reserves result from a positive pre - tax financial analysis based on a 5.4% Li2O spodumene concentrate average base price of US$1,250/t for 6% spodumene and an exchange rate of 0.74 US$:1.00 C$. |
| ● | The selected optimized pit shell is based on a revenue factor of 0.95 applied to a base case selling price of US$1,250/tonne for 6% spodumene concentrate. |
| ● | Topographic surface as of June 29th, 2026, was used as the starting surface. |
| ● | The reference point of the Mineral Reserves Estimate is the NAL crusher feed. |
| ● | In-situ Mineral Resources are converted to Mineral Reserves based on pit optimization, pit design, mine scheduling and the application of modifying factors, all of which support a positive LOM cash flow model. |
| ● | The waste and overburden to ore ratio (strip ratio) is 7.1. |
| ● | Totals may not add up due to the rounding of significant figures. |
| ● | The Reserve estimate was prepared in accordance with the standards set out in the 2012 Edition of the ‘Australasian Code for Reporting of Exploration Results, Mineral Resources and Ore |
| Revision: 0 – 14-Aug-2026 B198-D01-02054-RT-0010 |
Page 125 |
| NAL Expansion FS Mineral Reserve Pre-Feasibility Study NI 43-101 Final Report Prepared for Elevra |
|
| Reserves’ (“JORC Code”) and in accordance with National Instrument 43-101 – Standards of Disclosure for Mineral Projects of the Canadian Securities Administrators (“NI 43-101”). |
| 15.3 | Mineral Reserve Estimation Process |
The process followed for the 2026 NAL Mineral Reserve estimate is summarised by the points below, with the points completed in order:
| 1. | Complete a pit optimization assessment on the Resource block model to determine economic limits, with only ore classified as Indicated included. All Inferred material is converted to waste. |
| 2. | Generate a practical final pit shell and internal phases within the chosen economic shell from the pit optimization assessment, adhering to all geotechnical parameters and mining limits. |
| 3. | Create all dig solids within the final pit shell, subdivided into phases and then into 10m x 10m x 5m regularized solids. |
| 4. | Apply loss and dilution calculations to all dig solids to calculate ROM (as mined) quantities and qualities. |
| 5. | Import all dig solids into a life-of-mine schedule, along with all dump designs, operating equipment and time usage models. |
| 6. | Complete life-of-mine schedule, achieving planned plant throughput rates. |
| 7. | Undertake financial assessment of results from life-of-mine schedule ensuring positive cashflow and NPV8% for the site. |
| 15.4 | Resource Block Model |
The Resource block mode used for the Mineral Reserve estimate is a Datamine block model titled 2025 BM_20250814.dm, which was used for the June 6, 2025, Mineral Resource estimate.
Parent cells 5m x 5m x 5m were sub-blocked four times in each direction (minimum sub-block of 1.25 m in each direction). Sub-blocks are triggered by both the geological model and mining voids, for precise depletion. This model has proportional sub-blocks to cover the spaces inside the solid boundaries. The size of the sub-blocking was chosen to best match the thickness of the mineralized dykes and the complexity of the geological model. The block model parameters and prototype values are shown in Table 15-2 and Table 15-3 respectively.
Table 15-2: Block Model Parameters
| Item | Value |
| Name | 2025 BM_20250814.dm |
| File Size | 18.4 GB |
| Number of Records | 72,316,300 |
| File Format | .dm (Datamine) |
| Date Generated | 2025-08-14 |
Table 15-3: Block Model Prototype
| Item | X (UTM) | Y (UTM) | Z (UTM) |
| Min. Extent | 290216.2364499186 | 5363260 | -360.00 |
| Maximum Extent | 295035.1780949428 | 5367887.2772690365 | 490.00 |
| Revision: 0 – 14-Aug-2026 B198-D01-02054-RT-0010 |
Page 126 |
| NAL Expansion FS Mineral Reserve Pre-Feasibility Study NI 43-101 Final Report Prepared for Elevra |
|
| Largest (parent) cell | 5 | 5 | 5 |
| Smallest sub cell | 1.25 | 1.25 | 1.25 |
| No. of Parent Cells | 515 | 826 | 170 |
| Rotation | - | - | 310 degs |
Each cell in the block model was allocated a material type based on the geological zone of the cell. Material types were either overburden, pegmatite, volcanics, gabbro, granodiorite or voids (for underground voids).
| 15.5 | Reserves Topography |
The topography used for the Mineral Reserve estimate was created on June 29th from high-definition Lidar information. The topographic surface contained over 9.5 million faces and was used to cut all planned dig solids to provide the final Mineral Reserve estimate values. The topographic surface used for the Mineral Reserve estimate and the dig solids are shown in Figure 15-1.
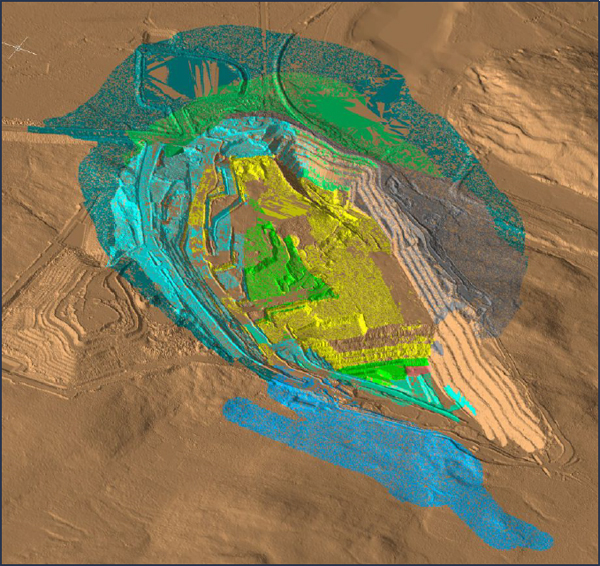
Figure 15-1: Starting Topographic Surface and Dig Solids
| Revision: 0 – 14-Aug-2026 B198-D01-02054-RT-0010 |
Page 127 |
| NAL Expansion FS Mineral Reserve Pre-Feasibility Study NI 43-101 Final Report Prepared for Elevra |
|
| 15.6 | Pit Optimization |
A pit optimization assessment was undertaken to calculate the final economic pit shell based on given financial parameters, processing assumptions and pit slopes that results in the maximum undiscounted value for a specific revenue factor.
| 15.6.1 | Geotechnical Parameters |
Overall pit slopes, based on parameters developed by Golder Associates, were included in the pit optimization assessment. The overall pit slopes were lowered slightly after preliminary runs to include allowances for haulage ramps and geotechnical berms. The overall slope angle varied depending on the geotechnical region, as shown in Figure 15-2 and Table 15-4.
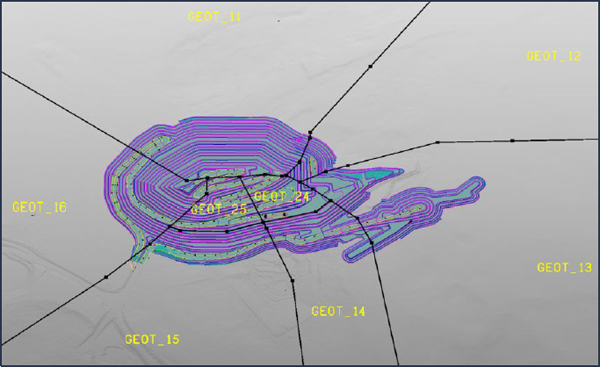
Figure 15-2: Geotechnical Regions
Table 15-4: Open Pit Optimization Slope Angles
| Region | Units | Overall Slope Angle |
| GEOT_11 | degs | 44.9 |
| GEOT_12 | degs | 47.6 |
| GEOT_13 | degs | 49.0 |
| GEOT_14 | degs | 41.5 |
| GEOT_15 | degs | 41.1 |
| GEOT_16 | degs | 42.6 |
| GEOT_24 | degs | 32.1 |
| GEOT_25 | degs | 33.9 |
| Revision: 0 – 14-Aug-2026 B198-D01-02054-RT-0010 |
Page 128 |
| NAL Expansion FS Mineral Reserve Pre-Feasibility Study NI 43-101 Final Report Prepared for Elevra |
|
| 15.6.2 | Loss and Dilution |
The final ROM quantity of ore and waste, taking into account loss, dilution and cut-off grades, was calculated for each mining dig solid by a set of detailed formulas as described below:
| 1. | If more than 30m3 of ore exists in the dig solid, then consider the ore as potentially recoverable, otherwise (<30m3 of ore) convert the entire solid to waste. |
| 2. | Allocate between 5% and 50% dilution depending on the percentage of ore in the block. Each 1% drop in ore percentage adds 0.3% dilution, up to a maximum of 50% dilution. |
| 3. | Allocate between 0% and 30% loss depending on the percentage of ore in the solid. Each 1% drop in ore percentage adds 0.3% loss, up to a maximum of 30% loss. |
| 4. | Obtain the diluting rock type (i.e. volcanics, gabbro, granodiorite or overburden) and subsequent Li2O, Fe and density parameters. |
| 5. | Add the dilution quantities and qualities to the ore component of the solid based on the percentage dilution calculated (step 2) and the diluting material properties (step 4). |
| 6. | Remove the loss quantities and qualities from the ore component of the solid based on the percentage loss calculated (step 3). |
| 7. | Calculate the final ore quantities and qualities (original values less losses plus dilution). |
| 8. | If the Li2O percentage of the final ore quantity is less than 0.60% (the assigned cut-off grade) then convert the ore component to waste. |
| 9. | Assign a final ROM material to the block – a block with any ore is allocated “ORE” with all others allocated as “WASTE”. |
As the above formulas indicate, a smallest mining unit (SMU) of 30m3 has been assigned for ore mining. This represents approximately one truckload of ore.
Application of the above formulas results in the following overall loss and dilution values:
| ● | The overall loss percentage is 10.5% (tonne:tonne), |
| ● | The overall dilution percentage is 11.6% (tonne:tonne). |
| 15.6.3 | Cut-off Grades |
The cut-off grade (COG) was calculated considering costs for processing, general & administration (G&A) costs, and other costs related to concentrate production and transport, as shown in Table 15-5.
Based on the parameters shown in Table 15-5, a COG of 0.29% Li2O has been calculated. However, due to metallurgical recovery limitations, a metallurgical COG of 0.60% Li2O was selected based on iterative analysis and to assure a feed grade that allows a sufficient metallurgical recovery to produce the required spodumene concentrate grade.
| 15.6.4 | Costs and Revenue |
The cost and revenue inputs for the pit optimization process are presented in Table 15-5. A metallurgical recovery of 69.2% was applied to all ore.
| Revision: 0 – 14-Aug-2026 B198-D01-02054-RT-0010 |
Page 129 |
| NAL Expansion FS Mineral Reserve Pre-Feasibility Study NI 43-101 Final Report Prepared for Elevra |
|
Table 15-5: Open Pit Optimization Parameters
| Parameters | Unit | Value | Comments |
| Revenue | |||
| Concentrate price | USD/t of conc. | 1,250 | For 6% spodumene concentrate (US$1,125 for 5.40%) |
| Concentrate grade | % Li2O | 5.40% | |
| Transportation cost | CAD/t of conc. | 126.23 | |
| Economics | |||
| Currency | CAD | - | |
| Exchange rate | USD/CAD | 0.74 | |
| Cost Basis | |||
| Mining | |||
| Mining cost | CAD/t mined | 9.22 | 2025 budget mining cost and mining contractor costs (inclusive of attribution of G&A cost of 0.72/t mined) |
| Incremental mining cost | CAD/t/10m | 0.03 | Additional cost per tonne for every 10 vertical metres below RL400 (to take into account additional haulage). |
| Processing and G&A | |||
| Processing | CAD/t milled | 51.44 | Inclusive of 41.58 processing cost and 9.86 G&A/SIBC (attribution of 5.34 G&A, 4.52 SIBC) |
| General G&A | CAD/t milled | 4.68 | |
| 15.6.5 | Open Pit Optimization Results |
Figure 16-3 shows the results of the pit optimization assessment. The values returned by the pit optimization assessment do not include capital investments as the cashflow generated within the pit shell must be large enough to cover all foreseeable capital outlays.
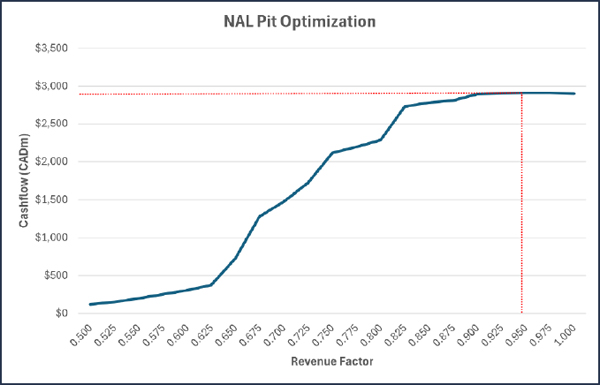
Figure 15-3: Pit Optimization Results
| Revision: 0 – 14-Aug-2026 B198-D01-02054-RT-0010 |
Page 130 |
| NAL Expansion FS Mineral Reserve Pre-Feasibility Study NI 43-101 Final Report Prepared for Elevra |
|
The revenue factor 0.95 pit shell, where realized prices are 95% of the forecast price, was selected as a guide for the final pit design. The selection of this revenue factor shell was based on maximizing project ore tonnes mined while respecting a relatively high NPV8%.
As Figure 15-3 indicates, the 0.95 revenue factor shell contains approximately 50.8mt of ore and 335.5mt of waste. However, these values are calculated as part of the pit optimization process which generates an evenly spaced grid of the economic pit shell for each scenario. Conversion of the economic pit shell grid from pit optimization to a practical pit design, which contains all required ramps, berms and benches, results in an increase in the strip ratio of the pit incurred by either a reduction in ore tonnes or an increase in waste tonnes, or both.
| 15.7 | Pit Designs |
| 15.7.1 | Pit Design Criteria |
The final pit and the 15 phase designs utilised a set of detailed geotechnical parameters generated by Golder and Associates as shown in Table 16-7.
Table 15-6: Ultimate Pit Design Parameters
| Design Sector | Wall Dip Direction | Bench | Catch Bench | Bench Face | Inter-Ramp | Geotechnical | |
| From | To | Height (m) | Width (m) | Angle (deg) | Angle (deg) | Berm Interval (m) | |
| Overburden* | 0 | 360 | N/A | 9 | 26.6 | N/A | N/A |
| South | 355 | 35 | 20 | 16 | 60.0 | 45.7 | 120 |
| Northeast | 195 | 270 | 20 | 10 | 65.0 | 49.1 | 120 |
| Northwest | 35 | 195 | 20 | 10 | 70.0 | 52.6 | 120 |
| Southeast | 270 | 355 | 20 | 10 | 70.0 | 52.6 | 120 |
Note: A 7 to 9 m setback considered at bedrock contact, depending on various factors listed in section 2.4.2 of the WSP-Golder memorandum (22515754-166-MTF-RevB).
Dual-lane ramps were designed into the final pit shell as well as the phase designs. The final pit shell is shown in Figure 16-7 and Figure 15-5.
| 15.8 | Life-of-Mine Schedule |
The life-of-mine schedule, as detailed in Chapter 16 of this report, was completed and generated physicals which provided a positive cashflow and net present value for the operation.
| 15.9 | Mineral Reserve Estimate Compared to Expanded Feasibility Study |
The difference between the Mineral Reserve estimate and the total quantities mined in the Expansion Feasibility Study is due to the slightly differing start dates. The Expansion Feasibility Study commences on 1st May 2026; however the Mineral Reserves are declared at the slightly later date of June 30th, 2026.
The Expansion Feasibility Study mines a total of 47.3mt from the pit, whereas the Mineral Reserve Estimate (pit only) is 47.0mt.
| Revision: 0 – 14-Aug-2026 B198-D01-02054-RT-0010 |
Page 131 |
| NAL Expansion FS Mineral Reserve Pre-Feasibility Study NI 43-101 Final Report Prepared for Elevra |
|
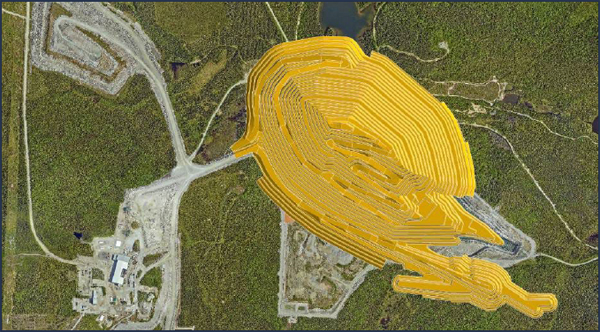
Figure 15-4: Final Pit – Plan View
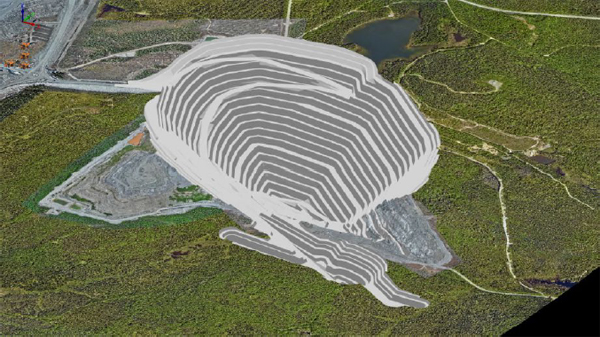
Figure 15-5: Final Pit – Isometric View
| Revision: 0 – 14-Aug-2026 B198-D01-02054-RT-0010 |
Page 132 |
| NAL Expansion FS Mineral Reserve Pre-Feasibility Study NI 43-101 Final Report Prepared for Elevra |
|
| 16 | Mining Methods |
The open pit will be mined using conventional drill-blast-load-haul methods, with 10m bench heights installed for delivery of run-of-mine (ROM) ore from the open pit to the stockpiles or crusher. The Project has been operational since November 2022 using the same mining practices. Historical underground openings are within the proposed open pit and mining in these areas will take place in the near term, necessitating particular consideration in detailed mine planning and operations.
The NAL final pit design, as shown in Figure 16-1, was based on a pit optimization assessment which determined the economic limits of the deposit. The in-pit haul road has been designed on the hanging wall side of the deposit to maximise ore recovery within the pit shell, provide more direct access to the waste storage facilities and ROM and to provide access for the final mining pushback. The final pit reaches a maximum depth of approximately 380 m below topography.
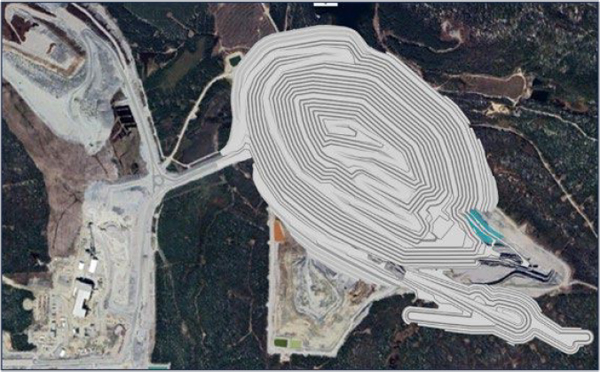
Figure 16-1: NAL Final Pit Design
A life-of-mine plan for NAL has been developed based on the results of a pit optimization assessment and subsequent practical pit and stage designs. The life-of-mine schedule undergoes multiple increases in the wet plant processing rate as summarised below:
| ● | Initial daily processing rate of 3,780tpd through wet plant; |
| ● | Wet plant processing rate increased to 4,354tpd on 1st July 2027; |
| ● | Wet plant processing rate increased to 4,500tpd on 1st January 2028; |
| ● | Wet plant processing rate increased to 6,100tpd on 1st April 2028; |
| ● | Wet plant processing rate increased to 6,500tpd on 1st October 2028. |
An ore sorter is added to the processing circuit on July 1st, 2029. The ore sorter has an annual capacity of 1.1mt per annum and is fed the lowest quality and most diluted ore for pre-treatment prior to processing through the wet plant. The ore sorter rejects 90% of the waste and dilution contained
| Revision: 0 – 14-Aug-2026 B198-D01-02054-RT-0010 |
Page 133 |
| NAL Expansion FS Mineral Reserve Pre-Feasibility Study NI 43-101 Final Report Prepared for Elevra |
|
within the ROM ore, whilst recovering 90% of the contained Li2O. More information on the ore sorter can be found in Section 16.4.6.
To accommodate the increase in wet plant throughput and the addition of an ore sorting circuit, the ore mining rate from the pit is limited to 5,100 tonnes per day annual average until April 1, 2028, gradually increasing up to a maximum of approximately 7,000 tonnes per day annual average. The life-of-mine schedules only mine Resources classified as Indicated, with no Inferred Resources mined. The deposit contains no Measured Resources.
This chapter provide an overview of the key assumptions used in the pit optimization assessment, the development of the practical pit shell and completion of the life-of-mine schedule for the Mineral Reserves PFS.
| 16.1 | Pit Optimization |
Pit optimization is the process which calculates the ultimate economic and practical pit limits of a deposit based on cost, revenue, processing and geotechnical assumptions. Pit optimization generates a surface which defines the economic limits for the deposit. The surface generated by the pit optimization process is used as a guide for the design of the final detailed pit shell.
Pit optimization is run over a range of scenarios where the revenue factor varies for each scenario. For each scenario, the revenue factor is multiplied by the forecast sale price for the concentrate produced. The scenarios which utilise a low revenue factor (i.e. 50%) highlight areas within the deposit that are the most profitable, as these areas generate an economic pit even with revenues reduced. The high revenue factor scenarios (i.e. 150%) highlight areas for potential future growth if commodity prices increase in the future. The high revenue factor scenarios provide guidance on where infrastructure such as the mining industrial area, tailings storage facilities, etc. should be located. This reduces the likelihood of having to relocate infrastructure at a later date if commodity prices increase.
Pit optimization is undertaken assessing the operating cost of the operation only, with capital costs excluded. The resultant economic pit shell must generate enough free cash to pay for all foreseeable capital outlays. Pit optimization was carried out at NAL on the diluted mining block model using the Whittle mining planning software package. Inferred and unclassified resources were converted to waste as part of the pit optimization assessment.
The following sections summarize the pit optimization which was undertaken.
| 16.1.1 | Optimization Inputs |
The inputs for the pit optimization process are presented in Table 16-1.
Table 16-1: Open Pit Optimization Parameters
| Parameters | Unit | Value | Comments |
| Revenue | |||
| Concentrate price | USD/t of conc. | 1,250 | For 6% spodumene concentrate (US$1,125 for 5.40%) |
| Concentrate grade | % Li2O | 5.40% | |
| Transportation cost | CAD/t of conc. | 126.23 | |
| Royalty | 0% | ||
| Economics | |||
| Currency | CAD | - | |
| Exchange rate | USD/CAD | 0.74 | |
| Discount rate | % | 8.0% | |
| Revision: 0 – 14-Aug-2026 B198-D01-02054-RT-0010 |
Page 134 |
| NAL Expansion FS Mineral Reserve Pre-Feasibility Study NI 43-101 Final Report Prepared for Elevra |
|
| Parameters | Unit | Value | Comments |
| Cost Basis | |||
| Mining | |||
| Mining cost | CAD/t mined | 9.22 | 2025 budget mining cost and mining contractor costs (inclusive of attribution of G&A cost of 0.72/t mined) |
| Incremental mining cost | CAD/t/10m | 0.03 | Additional cost per tonne for every 10 vertical metres below RL400 (to take into account additional haulage). |
| Processing and G&A | |||
| Processing | CAD/t milled | 51.44 | Inclusive of 41.58 processing cost and 9.86 G&A/SIBC (attribution of 5.34 G&A, 4.52 SIBC) |
| General G&A | CAD/t milled | 4.68 | |
| Operating Parameters | |||
| Ore production | Mtpa | 1.36 | Average ore production sent to the crusher |
| Overall recovery | % | 69.2% | |
| Geotechnical | |||
| Overburden (IRA) | degree | 26.6 | Golder-WSP Memo Feb. 2023 |
| Rock | degree | Variable | Golder-WSP Memo Feb. 2023 |
Overall pit slopes were based on the parameters developed by Golder Associates. The overall pit slopes were lowered slightly after preliminary runs to include allowances for haulage ramps and geotechnical berms. The overall slope angle varied depending on the geotechnical region, as shown in Figure 16-2.
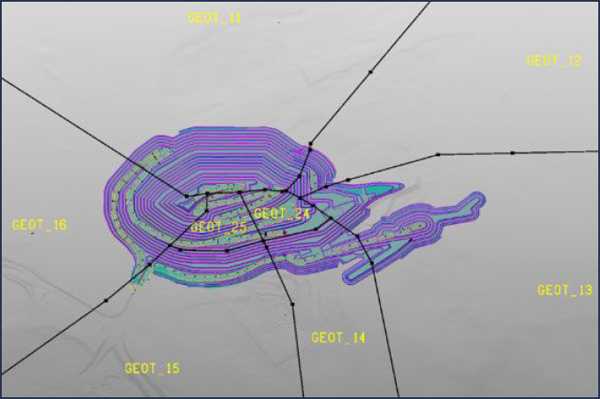
Figure 16-2: Geotechnical Regions
The overall slope angles are shown in Table 16-2. Revenue factors were applied to evaluate the sensitivity of the pit size versus selling prices, varying from 0.5 to 1.0 in 0.025 increments.
| Revision: 0 – 14-Aug-2026 B198-D01-02054-RT-0010 |
Page 135 |
| NAL Expansion FS Mineral Reserve Pre-Feasibility Study NI 43-101 Final Report Prepared for Elevra |
|
Table 16-2: Open Pit Optimization Slope Angles
| Region | Units | Overall Slope Angle |
| GEOT_11 | degs | 44.9 |
| GEOT_12 | degs | 47.6 |
| GEOT_13 | degs | 49.0 |
| GEOT_14 | degs | 41.5 |
| GEOT_15 | degs | 41.1 |
| GEOT_16 | degs | 42.6 |
| GEOT_24 | degs | 32.1 |
| GEOT_25 | degs | 33.9 |
| 16.1.2 | Optimization Results |
As described in the previous chapter, pit optimization calculated the final economic pit shell based on given financial parameters, processing assumptions and pit slopes that results in the maximum undiscounted value for a specific revenue factor.
Table 16-3 presents the results of the pit optimization in table form, while Figure 16-3 presents the results in graphical format. The values returned by the pit optimization model do not include capital investments as the cashflow generated within the pit shell must be large enough to cover all foreseeable capital outlays.
The revenue factor 0.95 pit shell, where realized prices are 95% of the forecast price, was selected as a guide for the final pit design. The selection of this revenue factor shell was based on maximizing project ore tonnes mined while respecting a relatively high NPV8%.
Table 16-3: Pit Optimization Results
| Revenue Factor | Ore Tonnes (mt) | Ore Li2O Grade (%) | Waste Tonnes (mt) | Strip Ratio (t:t) | Total Cost (M$CAD) | Total Revenue (M$CAD) | Total Cashflow (M$CAD) |
| 0.500 | 0.8 | 1.26% | 1.2 | 1.49 | $62 | $183 | $121 |
| 0.525 | 1.1 | 1.24% | 1.8 | 1.66 | $83 | $234 | $151 |
| 0.550 | 1.5 | 1.21% | 3.0 | 1.99 | $121 | $322 | $201 |
| 0.575 | 2.0 | 1.18% | 4.4 | 2.21 | $166 | $419 | $252 |
| 0.600 | 2.5 | 1.16% | 6.2 | 2.45 | $217 | $520 | $303 |
| 0.625 | 3.3 | 1.14% | 9.3 | 2.79 | $301 | $678 | $377 |
| 0.650 | 7.5 | 1.13% | 29.3 | 3.92 | $772 | $1,498 | $726 |
| 0.675 | 14.5 | 1.13% | 68.8 | 4.75 | $1,636 | $2,916 | $1,279 |
| 0.700 | 17.2 | 1.13% | 85.3 | 4.95 | $1,985 | $3,462 | $1,476 |
| 0.725 | 21.0 | 1.12% | 108.0 | 5.15 | $2,465 | $4,184 | $1,719 |
| 0.750 | 27.9 | 1.11% | 151.8 | 5.44 | $3,375 | $5,494 | $2,118 |
| 0.775 | 29.4 | 1.10% | 161.4 | 5.49 | $3,574 | $5,770 | $2,197 |
| 0.800 | 31.5 | 1.10% | 176.0 | 5.59 | $3,861 | $6,150 | $2,289 |
| 0.825 | 42.4 | 1.08% | 256.7 | 6.05 | $5,428 | $8,158 | $2,730 |
| 0.850 | 44.1 | 1.08% | 270.4 | 6.13 | $5,687 | $8,472 | $2,785 |
| 0.875 | 45.0 | 1.08% | 277.8 | 6.17 | $5,872 | $8,637 | $2,810 |
| 0.900 | 49.2 | 1.08% | 321.4 | 6.53 | $6,572 | $9,465 | $2,893 |
| 0.925 | 49.9 | 1.08% | 327.6 | 6.56 | $6,686 | $9,588 | $2,903 |
| 0.950 | 50.8 | 1.08% | 335.5 | 6.61 | $6,826 | $9,737 | $2,910 |
| 0.975 | 51.2 | 1.08% | 340.0 | 6.64 | $6,905 | $9,816 | $2,911 |
| 1.000 | 53.4 | 1.08% | 368.3 | 6.90 | $7,359 | $10,257 | $2,898 |
| Revision: 0 – 14-Aug-2026 B198-D01-02054-RT-0010 |
Page 136 |
| NAL Expansion FS Mineral Reserve Pre-Feasibility Study NI 43-101 Final Report Prepared for Elevra |
|
As Table 16-3 indicates, the 0.95 revenue factor shell contains 50.8mt of ore and 335.5mt of waste. However, these values are calculated as part of the pit optimization process which generates an evenly spaced grid of the economic pit shell for each scenario. Conversion of the economic pit shell grid from pit optimization to a practical pit design, which contains all required ramps, berms and benches, usually results in an increase in the strip ratio of the pit incurred by either a reduction in ore tonnes or an increase in waste tonnes or both.
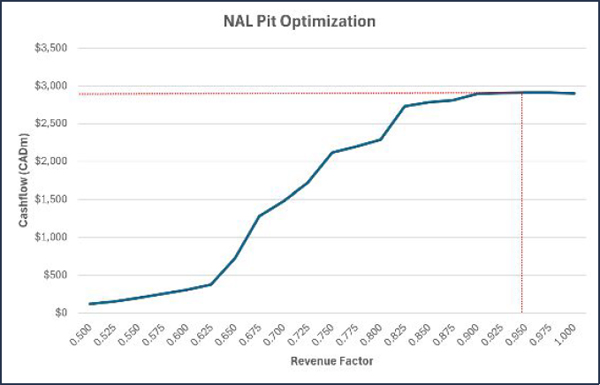
Figure 16-3: Pit Optimization Results
| 16.2 | Mining Method |
The Project will be mined using conventional open-pit drill-blast-load-haul methods, with 10m bench heights installed for delivery of ROM ore from the open pit to the stockpiles or crusher. The Project has been operational since November 2022 using the same mining practices. Historical underground openings are within the proposed open pit and mining in these areas will take place in the near term, necessitating particular consideration in detailed mine planning and operations.
| 16.3 | Geotechnical Consideration |
| 16.3.1 | Planning Around Underground Workings |
Based on the current understanding of the geometries and locations of the existing underground openings in relation to the pit shell, all of these underground openings are contained within the final pit shell and will not intercept the final pit wall. Local modifications to the slope design may be required to enable safe and stable excavations in areas where stopes intersect the pit wall or floor, or drifts that run parallel to the pit wall.
| Revision: 0 – 14-Aug-2026 B198-D01-02054-RT-0010 |
Page 137 |
| NAL Expansion FS Mineral Reserve Pre-Feasibility Study NI 43-101 Final Report Prepared for Elevra |
|
Approximately 90% of the underground solids are contained within phase 3, which is currently being excavated. Figure 16-4 shows the location of the underground solids with phases 4 to 8 inclusive shown.
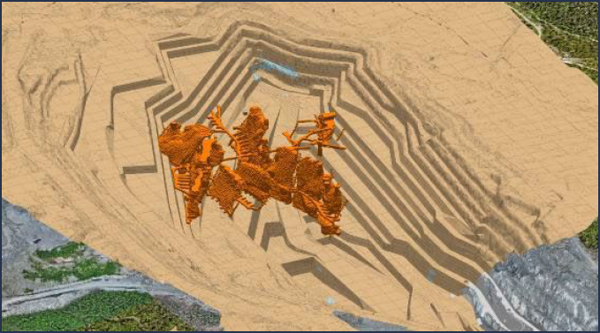
Figure 16-4: Underground Solids with Phases 4 to 8 (Phases 1 to 3 Removed)
The historical underground openings represent an operational hazard, a risk to local bench-scale and multi-bench stability and a potential rockfall hazard, depending on the character of the openings and any backfill. Systematic investigation and mitigation design will be required to manage these risks for both interim and final pit walls. Investigation and evaluation of these hazards, and design of mitigation, are currently underway by Alius and ASAGeotech for Elevra and will be continued through the operating life of the mine. Site has developed multiple Safe Operating Procedures (SOPs) to manage the risks associated with mining adjacent to voids. Significant mining around underground workings has been undertaken in the past two years, with no incidents being reported.
| 16.3.2 | Operational Considerations |
Good quality operational practices will be essential for the safe development of stable and steep slopes. The slope design recommendations based on pre-split blasting assume that a workforce and supervisors skilled in implementing effective, controlled blasting and excavation procedures will be available throughout the mining operations. Optimized controlled blasting designs should be developed early in the mine life for use on long-term and final slopes. Blasting experience and trials should be developed and optimized in the interior of the open pit prior to applying it to the final slopes.
| 16.4 | Pit Design Parameters |
| 16.4.1 | Block Models |
The geological basis for the study is the Resource block model, a Datamine block model titled 2025 BM_20250814.dm, which was used for the June 6, 2025, Mineral Resource estimate. 5m x 5m x 5m parent cells were sub-blocked four times in each direction (minimum sub-block of 1.25 m in each direction). Sub-blocks are triggered by both the geological model and mining voids, for precise
| Revision: 0 – 14-Aug-2026 B198-D01-02054-RT-0010 |
Page 138 |
| NAL Expansion FS Mineral Reserve Pre-Feasibility Study NI 43-101 Final Report Prepared for Elevra |
|
depletion. This model has proportional sub-blocks to cover the spaces inside the solid boundaries. The size of the sub-blocking was chosen to best match the thickness of the mineralized dykes and the complexity of the geological model. The block model parameters and prototype values are shown in Table 16-4 and Table 16-5 respectively.
Table 16-4: Block Model Parameters
| Item | Value |
| Name | 2025 BM_20250814.dm |
| File Size | 18.4 GB |
| Number of Records | 72,316,300 |
| File Format | .dm (Datamine) |
| Date Generated | 2025-08-14 |
Table 16-5: Block Model Prototype
| Item | X (UTM) | Y (UTM) | Z (UTM) |
| Min. Extent | 290216.2364499186 | 5363260 | -360.00 |
| Maximum Extent | 295035.1780949428 | 5367887.2772690365 | 490.00 |
| Largest (parent) cell | 5 | 5 | 5 |
| Smallest sub cell | 1.25 | 1.25 | 1.25 |
| No. of Parent Cells | 515 | 826 | 170 |
| Rotation | - | - | 310 degs |
Each cell in the block model was allocated a material type based on the geological zone of the cell. Material types were either overburden, pegmatite, volcanics, gabbro, granodiorite or voids (for underground voids). Each material type was allocated a density, an Li2O grade and an Fe grade as shown in Table 16-6.
Table 16-6: Material Properties
| Material | Density (t/m3) | Li2O (%) | Fe (%) |
| Pegmatite | 2.70 | As modelled | As modelled, else 0.29% |
| Overburden | 2.00 | 0% | 0% |
| Volcanics | 3.01 | 0% | 5.72% |
| Gabbro | 3.11 | 0% | 6.68% |
| Granodiorite | 2.77 | 0% | 2.30% |
| 16.4.2 | Pit Wall Parameters |
Detailed mine designs were carried out using the selected 0.95 revenue factor pit shell from the pit optimization process as a guide. The pit design parameters are detailed in Table 16-7.
Table 16-7: Ultimate Pit Design Parameters
| Design Sector | Wall Dip Direction | Bench | Catch Bench | Bench Face | Inter-Ramp | Geotechnical | |
| From | To | Height (m) | Width (m) | Angle (deg) | Angle (deg) | Berm Interval (m) | |
| Overburden* | 0 | 360 | N/A | 9 | 26.6 | N/A | N/A |
| South | 355 | 35 | 20 | 16 | 60.0 | 45.7 | 120 |
| Northeast | 195 | 270 | 20 | 10 | 65.0 | 49.1 | 120 |
| Northwest | 35 | 195 | 20 | 10 | 70.0 | 52.6 | 120 |
| Southeast | 270 | 355 | 20 | 10 | 70.0 | 52.6 | 120 |
Note: A 7 to 9 m setback considered at bedrock contact, depending on various factors listed in section 2.4.2 of the WSP-Golder memorandum (22515754-166-MTF-RevB).
| Revision: 0 – 14-Aug-2026 B198-D01-02054-RT-0010 |
Page 139 |
| NAL Expansion FS Mineral Reserve Pre-Feasibility Study NI 43-101 Final Report Prepared for Elevra |
|
| 16.4.3 | Ramp Design Parameters |
The proposed pit design includes the practical geometry required in a mine, including pit access and haulage ramps to all pit benches, pit slope designs, benching configurations, smoothed pit walls and catch benches.
The haulage fleet operated by the mining contractor utilizes 90t capacity haul trucks, with ramps and access roads designed to accommodate this class of truck. Table 16-8 presents the haul road design parameters. This is also shown graphically in Figure 16-5 and Figure 16-6 for in-pit single- and dual-lane haul ramps, respectively.
The haul and ramp design parameters used in the generation of the ultimate pit shell, and all phases are summarized in Table 16-8.
Table 16-8: Haul Road Design Criteria
| Parameters | Units | Dual Lane | Single Lane | Comments |
| Reference Haul Truck | - | 90T-class | 90T-class | Largest haul truck expected for the NAL project |
| Operating Width | (m) | 6.7 | 6.7 | Includes clearance for mirrors and accessories |
| Running Surface Multiplier | (factor) | 3.0 | 1.9 | Minimum value for adequate clearance |
| Running Surface Width | (m) | 20.0 | 12.5 | For temporary and permanent roads |
| Tire Diameter | (m) | 2.7 | 2.7 | For 27.00 R49 tires |
| Berm Height: Tire Ratio | (ratio) | 0.5 | 0.5 | Minimum recommended value |
| Berm Height | (m) | 1.3 | 1.3 | For temporary and permanent roads |
| Berm slope xH:1V Ratio | (ratio) | 1.3H:1.0V | 1.3H:1.0V | Angle of Repose 37.5 |
| Berm Width (Top) | (m) | 0.5 | 0.5 | Minimum recommended value |
| Berm Width (Bottom) | (m) | 4.0 | 4.0 | For temporary and permanent roads |
| No. of Berms - Surface Road | (#) | 2.0 | 2.0 | Industry standard practice |
| No. of Berms - Pit Ramp | (#) | 1.0 | 1.0 | Industry standard practice |
| No. of Berms - Pit Slot | (#) | 0.0 | 0.0 | Industry standard practice |
| Ditch Depth | (m) | 0.8 | 0.5 | For temporary and permanent roads |
| Ditch slope xH:1V Ratio | (ratio) | 1.0H:1.0V | 1.0H:1.0V | Maximum recommended value |
| Ditch Width (Bottom) | (m) | 0.5 | 0.5 | Minimum recommended value |
| Ditch Width (Top) | (m) | 2.0 | 1.5 | For temporary and permanent roads |
| No. of Ditches - Surface Road | (#) | 0.0 | 0.0 | Industry standard practice |
| No. of Ditches - Pit Ramp | (#) | 1.0 | 1.0 | Industry standard practice |
| No. of Ditches - Pit Slot | (#) | 2.0 | 2.0 | Industry standard practice |
| Overall Width - Surface Road | (m) | 28.0 | 20.5 | For temporary and permanent roads |
| Overall Width - Pit Ramp | (m) | 26.0 | 18.5 | For temporary and permanent roads |
| Overall Width - Pit Slot | (m) | 24.0 | 15.5 | For temporary and permanent roads |
| Maximum Grade - Permanent Road | (%) | 10.0 | 10.0 | Maximum recommended value |
| Maximum Grade - Temporary Road | (%) | 12.0 | 12.0 | Maximum recommended value |
| Haul Road Drainage Crossfall | (%) | 2.0 | 2.0 | For temporary and permanent roads |
| Revision: 0 – 14-Aug-2026 B198-D01-02054-RT-0010 |
Page 140 |
| NAL Expansion FS Mineral Reserve Pre-Feasibility Study NI 43-101 Final Report Prepared for Elevra |
|
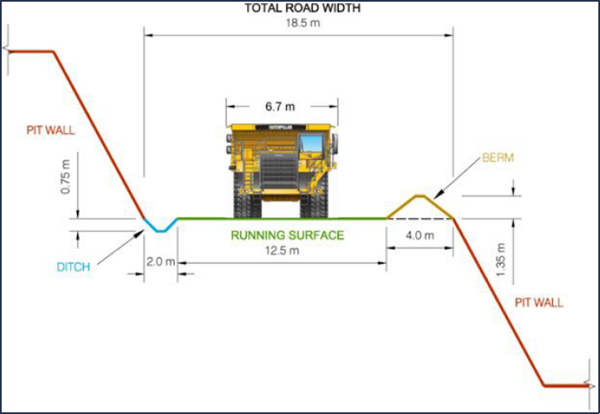
Figure 16-5: Single-Lane in-Pit Haul Ramp Design
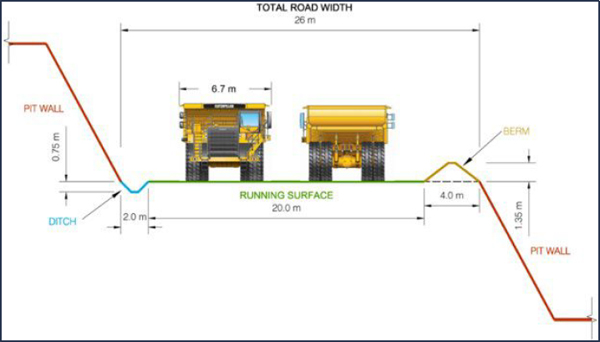
Figure 16-6: Dual-Lane in-Pit Haul Ramp Design
| Revision: 0 – 14-Aug-2026 B198-D01-02054-RT-0010 |
Page 141 |
| NAL Expansion FS Mineral Reserve Pre-Feasibility Study NI 43-101 Final Report Prepared for Elevra |
|
| 16.4.4 | Final Pit Design |
The final pit was designed with one main haul road servicing the entire pit for the life of the mine. The decision to utilise one main haul road was chosen based on reducing the strip ratio, pit shell disturbance area and operating cost for the operation. An additional haul road would have added significant additional waste stripping.
The main haul road has been designed on the hanging wall side of the deposit to maximize ore recovery within the pit shell and to provide access for the final mining pushback. Blasting and excavation around the main haul road must be carefully executed as any geotechnical issue with the main haul road will cause significant disruptions and issues for all levels below the geotechnical issue. Scaling of the final wall and other stabilizing methods should be implemented as the main haul road is progressively extended.
A secondary haul road has been designed along the south-west limit of the pit to access phase 8, one of the last phases to be mined. The secondary haul road to phase 8 is used by the upper levels of some of the phases.
Figure 16-7 and Figure 16-8 show the final pit design in plan view and isometric view respectively.
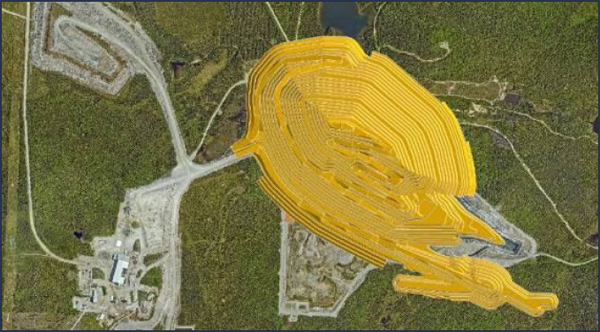
Figure 16-7: Final Pit – Plan View
| Revision: 0 – 14-Aug-2026 B198-D01-02054-RT-0010 |
Page 142 |
| NAL Expansion FS Mineral Reserve Pre-Feasibility Study NI 43-101 Final Report Prepared for Elevra |
|
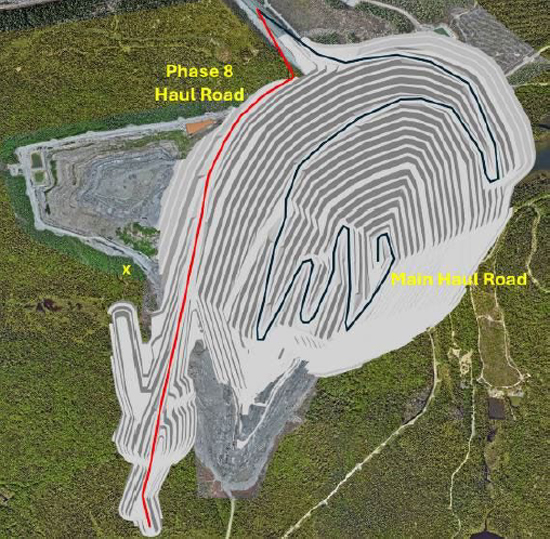
Figure 16-8: Final Pit – Isometric View.
As Figure 16-8 shows, the pit is serviced by one main haul road (black line) whilst an upper ramp services the phase 8 area located at the southern end of the operation. Both haul roads exit the pit at the same pit located in the north-west corner of the operation. The exit point is the closest location to the ROM area and also the main haul road to the waste dumps.
Some waste which is hauled to the central and southern sections of the HS4 waste dump (located adjacent to the pit) may exit the pit at the point highlighted by the “X” in Figure 16-8. This exit point provides a shorter haulage distance between the pit and the dump location.
Figure 16-9 shows a cross section through the deposit, showing the final pit design and the resource block model cells.
| Revision: 0 – 14-Aug-2026 B198-D01-02054-RT-0010 |
Page 143 |
| NAL Expansion FS Mineral Reserve Pre-Feasibility Study NI 43-101 Final Report Prepared for Elevra |
|
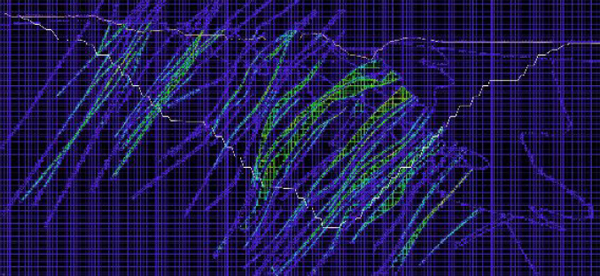
Figure 16-9: Final Pit Cross Section with Resource Block Model
As Figure 16-9 indicates, the resource block model contains variable sized blocks, with sub-cells down to 1.25m x 1.25m x 1.25m used around the modelled pegmatites. The stringy nature of the Li2O-containing pegmatites can be seen clearly in the cross section. The cells are colour coded by Li2O grade, with red (2.4%) and light cyan (0.6%) representing the limits of the ore cells.
Figure 16-9 also shows that several pegmatites have been modelled but contain Li2O values below the cut-off grade of 0.60% Li2O, or the pegmatite contains material classified as Inferred and has therefore not been included in the mined pegmatite quantities.
| 16.4.5 | Material Flow Diagram |
Figure 16-10 shows the simplified flow of material from the mine and to the possible final destinations: the waste dumps, the tailings storage facilities or concentrate.
ROM waste material is drilled and blasted before being excavated and hauled to the waste dumps. ROM ore material is also drilled and blasted before being mined by excavators and hauled out of the pit. The ROM ore is either placed on the ore sorter stockpile or the direct feed ROM stockpile.
ROM ore that is sent to the ore sorting circuit is processed with the product material reporting to the ROM stockpile, whilst the reject material is trucked to the waste dumps. The ore sorter rejects are usually high quality, crushed and sorted materials that are suitable for road surfaces and also blast stemming. This material may be stockpiled and used in a strategic manner if required. For this study, it has been assumed that the ore sorter reject material is hauled and stored in the waste dumps.
| Revision: 0 – 14-Aug-2026 B198-D01-02054-RT-0010 |
Page 144 |
| NAL Expansion FS Mineral Reserve Pre-Feasibility Study NI 43-101 Final Report Prepared for Elevra |
|
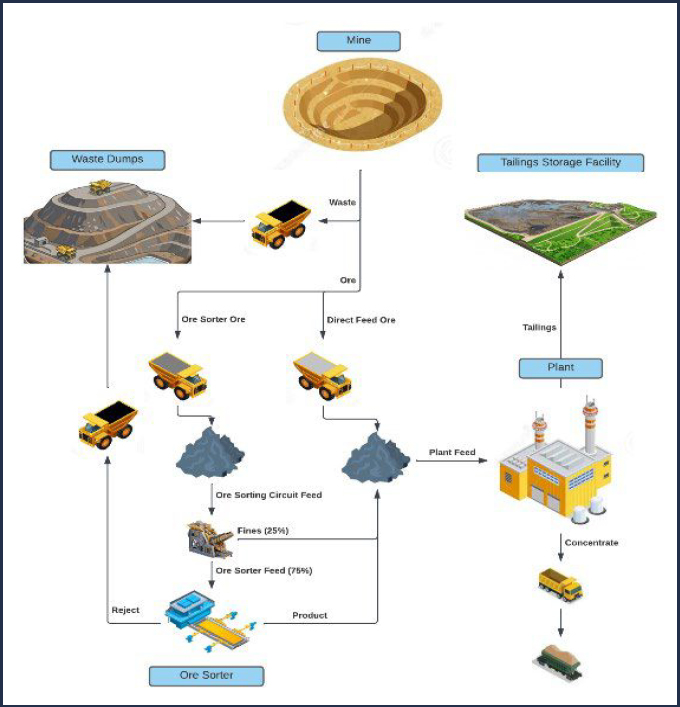
Figure 16-10: Material Flow Diagram
| 16.4.6 | Modifying Factors |
| 16.4.6.1 | Metallurgical Recoveries |
As Figure 16-10 shows, ore is either fed directly to the plant or sent to the ore sorting circuiting prior to processing. The poorest quality ore with the lowest Li2O grade or highest dilution is sent to the ore sorter, however this is dependent on stockpile inventories and the quality of the ore being mined and on the stockpiles.
The assumptions and metallurgical factors for the material sent to the ore sorting circuit are summarised below:
| ● | Annual ore sorting capacity | - 1.1mt per annum |
| Revision: 0 – 14-Aug-2026 B198-D01-02054-RT-0010 |
Page 145 |
| NAL Expansion FS Mineral Reserve Pre-Feasibility Study NI 43-101 Final Report Prepared for Elevra |
|
| ● | % of ore sorter feed to ore sorters | - 75% |
| ● | % of ore sorter feed sent to ROM stockpile (fines) | - 25% |
| ● | % of ore sorter feed Li2O recovered | - 90% |
| ● | % of ore sorter waste/dilution removed | - 90% |
An example of the application of the above assumptions through the ore sorting circuit is provided below for a mined block with the following arbitrary values:
| ● | Mined block total tonnes | - 128t |
| ● | Mined block pegmatite tonnes | - 105t |
| ● | Mined block dilution tonnes | - 23t |
| ● | Mined block total Li2O grade | - 0.98% |
| ● | Mined block contained Li2O tonnes | - 1.2544 (128t x 0.98%) |
The values through the ore sorting circuit for the block above are summarised below:
| ● | Tonnes sent to ore sorting circuit | - 128t |
| ● | Tonnes sent to ROM stockpile (fines) | - 32t (25% of 128t) |
| ● | Total tonnes sent for ore sorting | - 96t (75% of 128t) |
| ● | Pegmatite tonnes sent for ore sorting | - 78.75t (75% of 105t) |
| ● | Dilution tonnes sent for ore sorting | - 17.25t (75% of 23t) |
| ● | Pegmatite tonnes recovered from ore sorter | - 70.875 (90% of 78.75t) |
| ● | Dilution tonnes recovered from ore sorter | - 1.725t (10% of 17.25t) |
| ● | Reject tonnes to waste dump | - 23.4t (96t – 70.875t – 1.725t) |
The final product from the ore sorting circuit is summarised below:
| ● | Total product tonnes from ore sorter | - 72.6t (70.875t + 1.725t) |
| ● | Total Li2O product tonnes from ore sorter | - 0.84672t (128t x 0.98% x75% x 90%) |
| ● | Total Li2O product grade from ore sorter | - 1.166% (0.84672t / 72.6t) |
The final product placed on the ROM stockpile from the ore sorting circuit (fines plus ore sorter product) is summarised below:
| ● | Total product tonnes to ROM stockpile | - 104.6t (72.6t + 32t) |
| ● | Total Li2O product tonnes to ROM stockpile | - 1.16032t (0.84672t + 32t x 0.98%) |
| ● | Total Li2O product grade to ROM stockpile | - 1.109% (1.16032t / 104.6t) |
Two recoveries have been applied for the plant:
| ● | 69.2% Li2O recovery prior to the plant upgrades, |
| ● | 71.2% Li2O recovery after the plant has been upgraded. |
Upgrades at the plant are forecast to be completed by 1st April 2028, at which point the plant is operating at 6,500t per day and Li2O recovery is 71.2%.
| Revision: 0 – 14-Aug-2026 B198-D01-02054-RT-0010 |
Page 146 |
| NAL Expansion FS Mineral Reserve Pre-Feasibility Study NI 43-101 Final Report Prepared for Elevra |
|
| 16.4.6.2 | Cut-Off Grade |
The breakeven cut-off grade (COG) is calculated considering costs for processing, general & administration (G&A) costs, and other costs related to concentrate production and transport. Table 16-9 presents the parameters used to determine the mill COG.
Table 16-9: Cut-Off Grade Calculation Parameters
| Parameter | Units | Value |
| Recovery | % | 69.20% |
| Gross 6.0% Li2O Price | USD/t conc. | 1,250.00 |
| Concentrate Transportation Cost | USD/t conc. | 126.23 |
| Royalties | USD/t conc. | 0.00 |
| Net 5.4% Li2O Selling Price | USD/t conc. | 1,125.00 |
| Concentrate Grade | % | 5.40% |
| Exchange Rate | USD/CAD | 0.74 |
| Processing Cost | CAD/t milled | 41.58 |
| Processing G&A and SIBC Cost | CAD/t milled | 9.86 (5.34 G&A, 4.52 SIBC) |
| Calculated Cut-Off Grade | % Li2O | 0.29% |
| Metallurgical Cut-Off Grade | % Li2O | 0.60% |
Based on a 5.40% Li2O concentrate selling price of $1,250 USD/t, the COG would be 0.29% Li2O. However, due to metallurgical recovery limitations, a metallurgical COG of 0.60% Li2O was selected based on iterative analysis and to assure a feed grade that allows a sufficient metallurgical recovery to produce the required spodumene concentrate grade.
| 16.4.7 | Main Pit Phase Designs |
A series of six mining phases, numbered 3 through 8 inclusive, were developed including the ultimate pit design. Special attention was given to the historical underground openings when setting the physical limits for every phase. Consideration was taken to ensure that the phase walls did not intersect the old workings. The following criteria was applied during the phase design construction:
| ● | Minimum mining width of 60m considered between phases on the surface and 40m at the phase base. |
| ● | Ease of access to different mining areas. |
| ● | Mining and processing production rate. |
| ● | Physical constraints posed by historical underground workings. |
Table 16-10: Material Quantities by Phase
| Item | Units | Total | Phase 3 | Phase 4 | Phase 5 | Phase 6 | Phase 7 | Phase 8 |
| Total In-Pit | (dMt) | 385.2 | 30.0 | 54.8 | 56.5 | 48.0 | 180.8 | 15.1 |
| Waste Rock | (dMt) | 337.9 | 24.8 | 47.4 | 50.4 | 41.1 | 160.9 | 13.3 |
| ROM Ore | (dMt) | 47.3 | 5.2 | 7.4 | 6.2 | 6.9 | 19.9 | 1.8 |
| Lithium Grade | (% Li2O) | 1.12% | 1.15% | 1.08% | 1.06% | 1.24% | 1.11% | 1.03% |
| Iron Grade | (% Fe) | 0.8173% | 0.8976% | 0.8981% | 0.8672% | 0.7258% | 0.7974% | 0.7374% |
| Strip Ratio | (twaste : tore) | 7.1 | 4.8 | 6.4 | 8.2 | 6.0 | 8.1 | 7.4 |
*Note: Totals may not add up due to rounding.
Each of the phases was then subdivided into sub-phases to allow for a more detailed progressive development of the operation. The sub-phases developed were:
| Revision: 0 – 14-Aug-2026 B198-D01-02054-RT-0010 |
Page 147 |
| NAL Expansion FS Mineral Reserve Pre-Feasibility Study NI 43-101 Final Report Prepared for Elevra |
|
| ● | Phase 3 | - 3B and 3F, |
| ● | Phase 4 | - 4A, 4B and 4F, |
| ● | Phase 5 | - 5A, 5B, 5C, 5D and 5F, |
| ● | Phase 6 | - 6A and 6F, |
| ● | Phase 7 | - 7A and 7F, |
| ● | Phase 8 | - 8F. |
To show the design of each individual sub-phase, the starting topography with each of the sub-phases cumulatively cut out are presented in Figure 16-11 to Figure 16-26 respectively, including the starting position of the mine as of May 1st, 2026. It should be noted that Phases 1 and 2 plus 3A have been mined out previously.
| Revision: 0 – 14-Aug-2026 B198-D01-02054-RT-0010 |
Page 148 |
| NAL Expansion FS Mineral Reserve Pre-Feasibility Study NI 43-101 Final Report Prepared for Elevra |
|
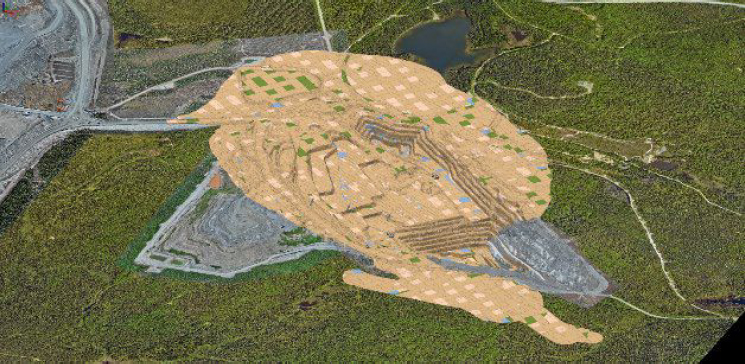
Figure 16-11: Isometric View of Starting Position as of May 1st, 2026
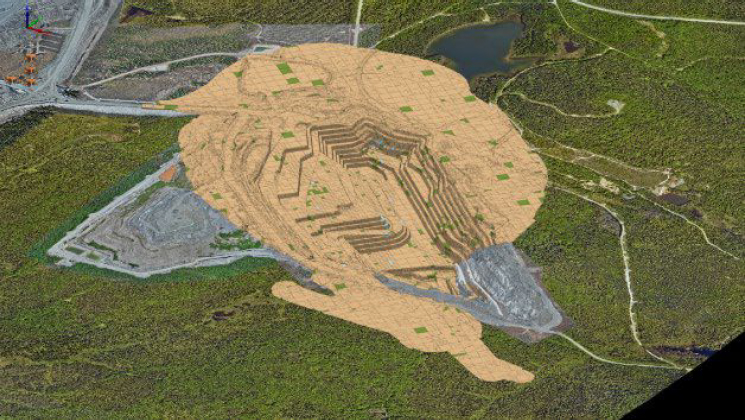
Figure 16-12: Isometric View of Pit with Phase 3B Removed
| Revision: 0 – 14-Aug-2026 B198-D01-02054-RT-0010 |
Page 149 |
| NAL Expansion FS Mineral Reserve Pre-Feasibility Study NI 43-101 Final Report Prepared for Elevra |
|
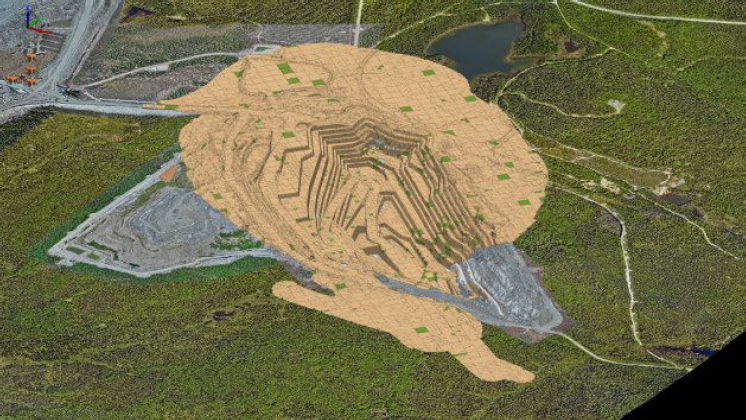
Figure 16-13: Isometric View of Pit with Phases 3B to 3F Removed
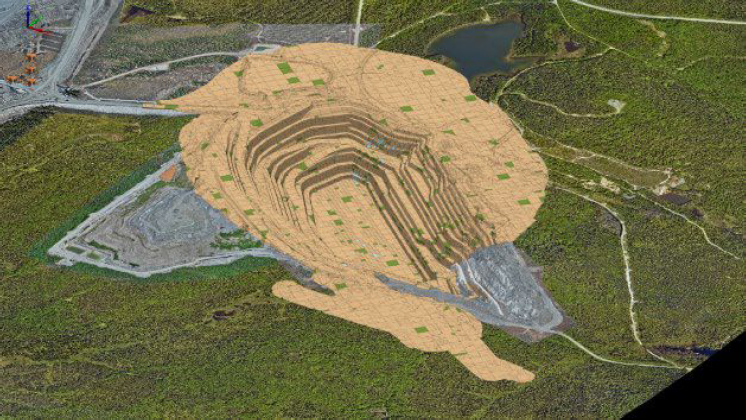
Figure 16-14: Isometric View of Pit with Phases 3B to 4A Removed
| Revision: 0 – 14-Aug-2026 B198-D01-02054-RT-0010 |
Page 150 |
| NAL Expansion FS Mineral Reserve Pre-Feasibility Study NI 43-101 Final Report Prepared for Elevra |
|
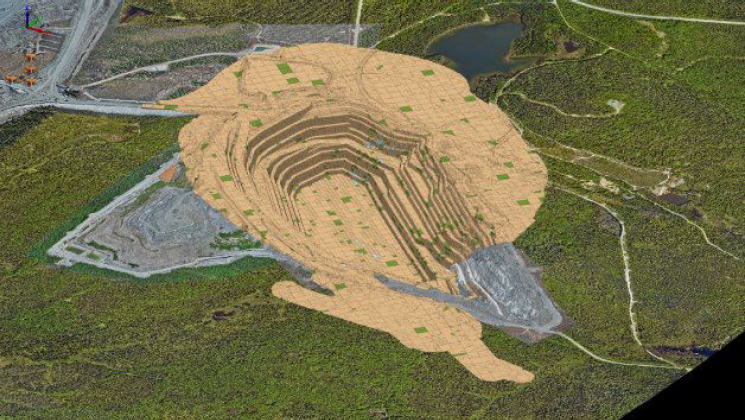
Figure 16-15: Isometric View of Pit with Phases 3B to 4B Removed
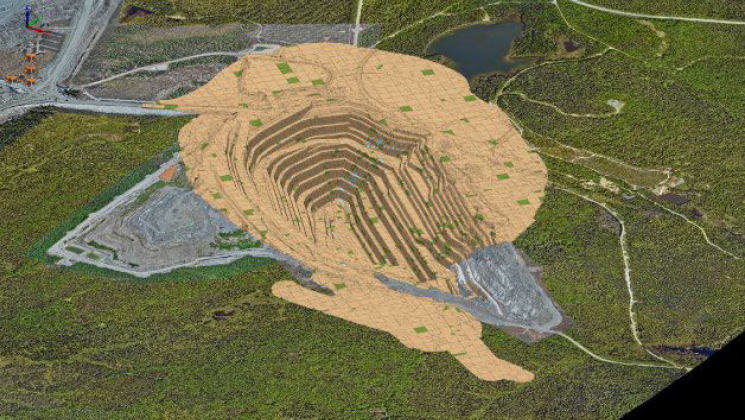
Figure 16-16: Isometric View of Pit with Phases 3B to 4F Removed
| Revision: 0 – 14-Aug-2026 B198-D01-02054-RT-0010 |
Page 151 |
| NAL Expansion FS Mineral Reserve Pre-Feasibility Study NI 43-101 Final Report Prepared for Elevra |
|
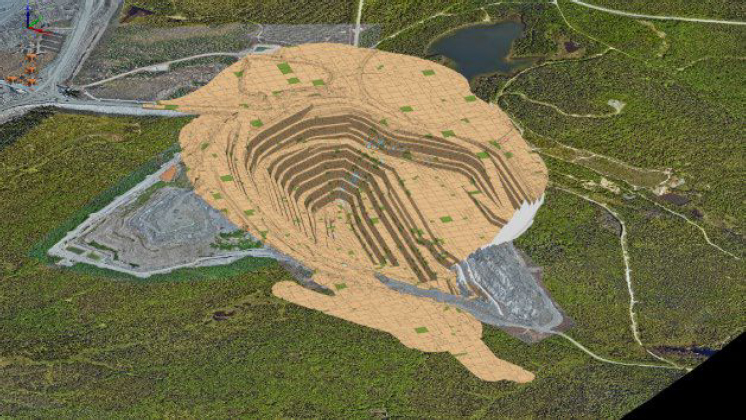
Figure 16-17: Isometric View of Pit with Phases 3B to 5A Removed
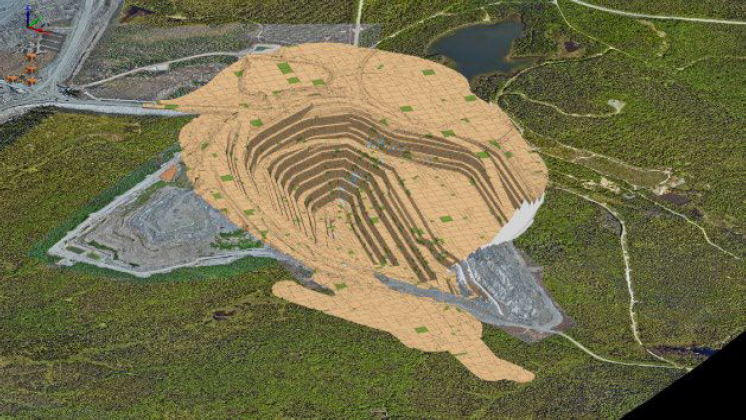
Figure 16-18: Isometric View of Pit with Phases 3B to 5B Removed
| Revision: 0 – 14-Aug-2026 B198-D01-02054-RT-0010 |
Page 152 |
| NAL Expansion FS Mineral Reserve Pre-Feasibility Study NI 43-101 Final Report Prepared for Elevra |
|
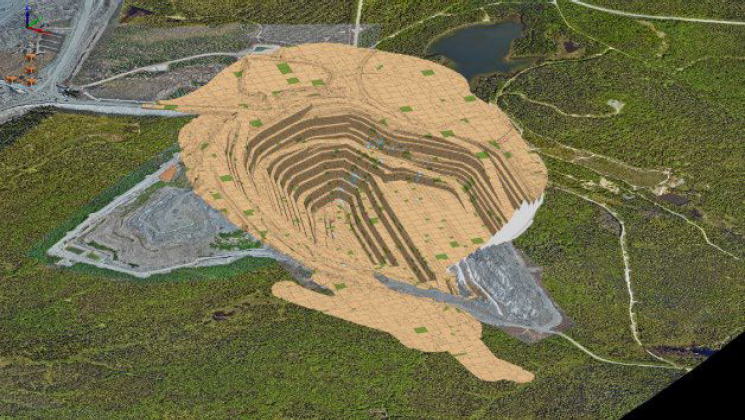
Figure 16-19: Isometric View of Pit with Phases 3B to 5C Removed
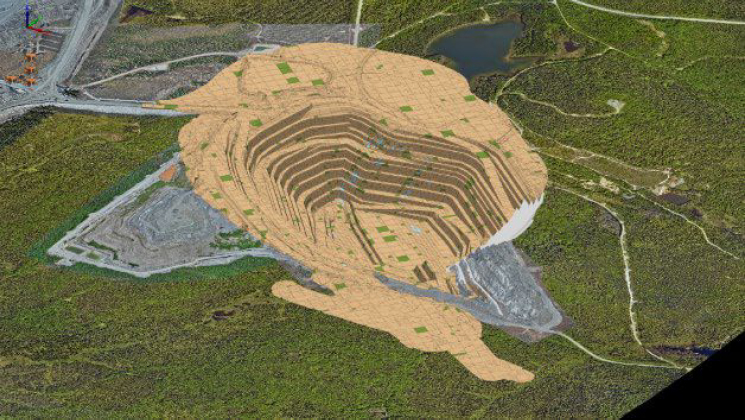
Figure 16-20: Isometric View of Pit with Phases 3B to 5D Removed
| Revision: 0 – 14-Aug-2026 B198-D01-02054-RT-0010 |
Page 153 |
| NAL Expansion FS Mineral Reserve Pre-Feasibility Study NI 43-101 Final Report Prepared for Elevra |
|
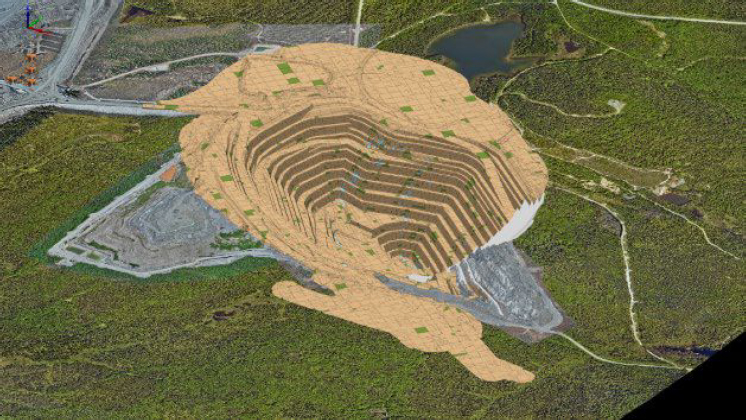
Figure 16-21: Isometric View of Pit with Phases 3B to 5F Removed
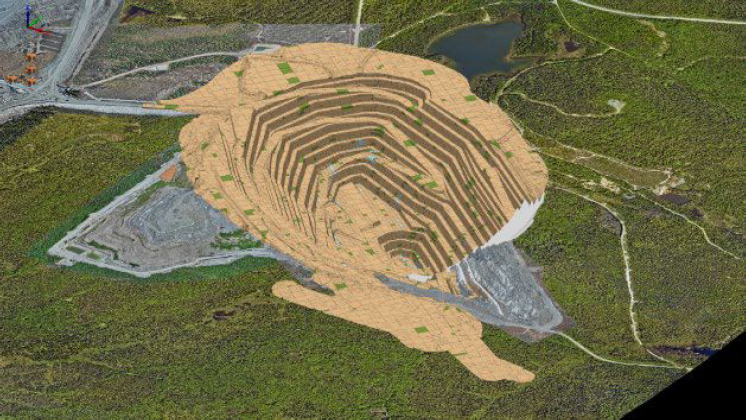
Figure 16-22: Isometric View of Pit with Phases 3B to 6A Removed
| Revision: 0 – 14-Aug-2026 B198-D01-02054-RT-0010 |
Page 154 |
| NAL Expansion FS Mineral Reserve Pre-Feasibility Study NI 43-101 Final Report Prepared for Elevra |
|
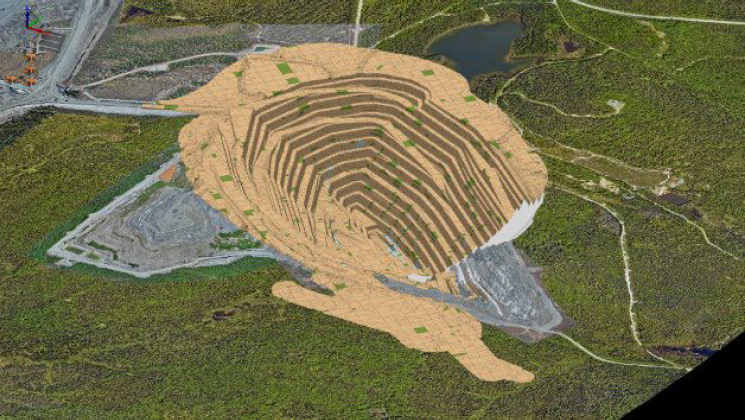
Figure 16-23: Isometric View of Pit with Phases 3B to 6F Removed
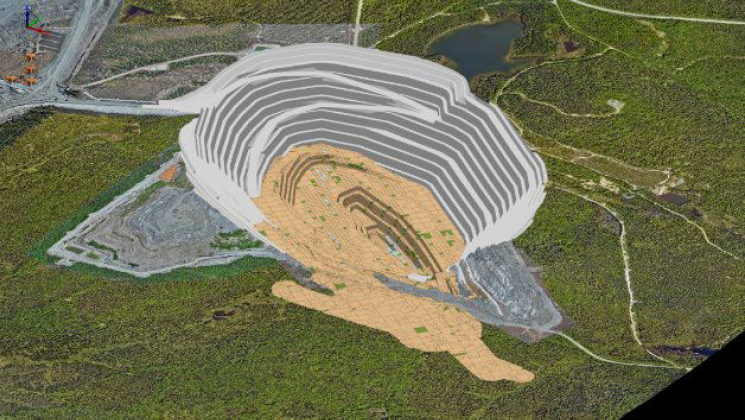
Figure 16-24: Isometric View of Pit with Phases 3B to 7A Removed
| Revision: 0 – 14-Aug-2026 B198-D01-02054-RT-0010 |
Page 155 |
| NAL Expansion FS Mineral Reserve Pre-Feasibility Study NI 43-101 Final Report Prepared for Elevra |
|
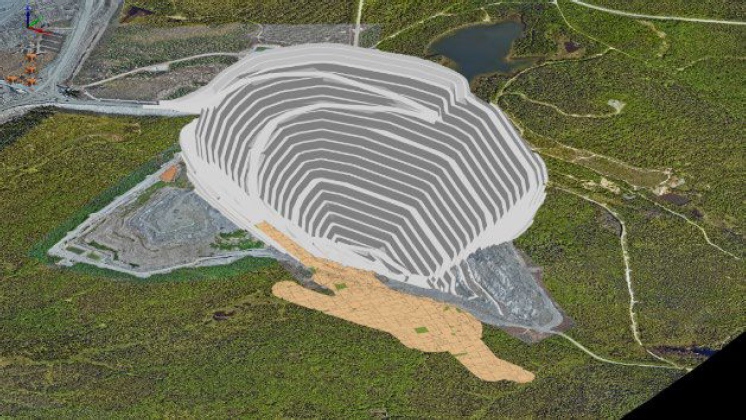
Figure 16-25: Isometric View of Pit with Phases 3B to 7F Removed
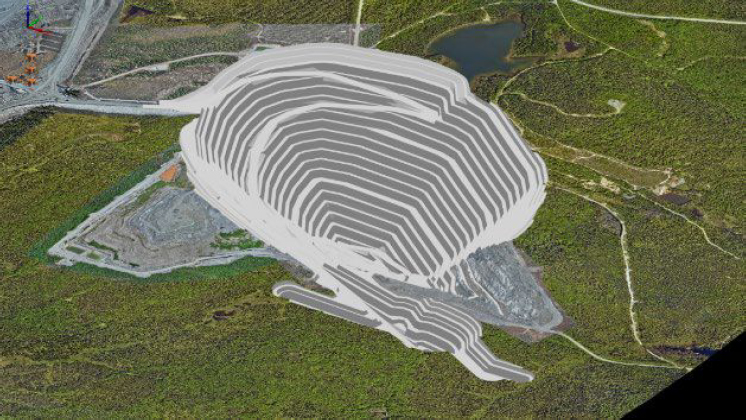
Figure 16-26: Isometric View of Pit with Phases 3B to 8F Removed (Ultimate Pit)
| Revision: 0 – 14-Aug-2026 B198-D01-02054-RT-0010 |
Page 156 |
| NAL Expansion FS Mineral Reserve Pre-Feasibility Study NI 43-101 Final Report Prepared for Elevra |
|
| 16.4.8 | Lortie Lake |
Lake is a small lake located to the north of the current mining operations. The lake is very shallow with a maximum depth of 5m. Phases 3 to 5 inclusive have been designed to stay at least 60m from the lake edge. Phase 6 traverses the southern half of the lake and the phase 7 crest runs through the middle of the lake. The pit crests for phases 5, 6 and 7 relative to Lortie Lake are shown in Figure 16-27.
At full capacity, the lake holds 350,000 m3 of water over an area of 12.4 hectares, which leads to an average depth of 2.2m. The lake drains to the north, away from mining operations and has a local catchment of 39 hectares.
The mine operating plan involves partial or complete drainage of the lake and the creation of waterways to regulate the natural flow of water around the final perimeter of the pit. Environmental and ecological studies were conducted in 2025, and additional studies are planned for 2026 to support the submission of an Environmental and Social Impact Assessment, which is expected to be reviewed by the BAPE and ultimately lead to the approval and extension of the mining lease covering mining phases 6 and 7.
For more information on the proposed Lortie Lake dyke, refer to Section 18.8 - Lortie Lake Dyke.
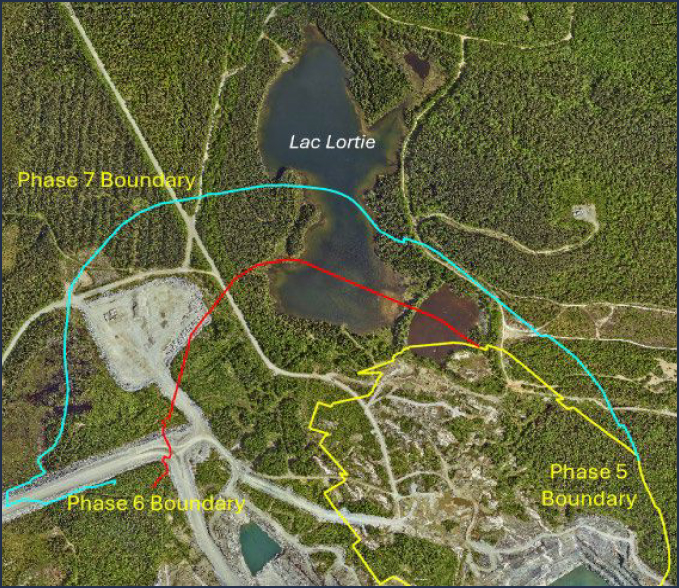
Figure 16-27: Lortie Lake Location
| Revision: 0 – 14-Aug-2026 B198-D01-02054-RT-0010 |
Page 157 |
| NAL Expansion FS Mineral Reserve Pre-Feasibility Study NI 43-101 Final Report Prepared for Elevra |
|
| 16.5 | Life-Of-Mine Plan |
The life-of-mine dig and dump designs were completed using Deswik.CAD. The life-of-mine schedule, including haulage modelling, was developed for the PFS using Micromine’s Spry software package.
| 16.5.1 | Dig Solids |
Regularized three-dimensional dig solids 10m wide by 10m long by 5m high were drafted in Deswik.CAD across the entire deposit. The solids were then cut by each sub-phase to provide an initial set of dig solids for each sub-phase.
The quantity of waste and ore within each dig solid was calculated via an interrogation of the Resource block model (as described in chapter 16.4.1). The final ROM quantity of ore and waste, taking into account loss, dilution and cut-off grades, was calculated for each mining dig solid by a set of detailed formulas as described below:
| 1. | If more than 30m3 of ore exists in the dig solid, then consider the ore as potentially recoverable, otherwise (<30m3 of ore) convert the entire solid to waste. |
| 2. | Allocate between 5% and 50% dilution depending on the percentage of ore in the block. Each 1% drop in ore percentage adds 0.3% dilution, up to a maximum of 50% dilution. |
| 3. | Allocate between 0% and 30% loss depending on the percentage of ore in the solid. Each 1% drop in ore percentage adds 0.3% loss, up to a maximum of 30% loss. |
| 4. | Obtain the diluting rock type (i.e. volcanics, gabbro, granodiorite or overburden) and subsequent Li2O, Fe and density parameters. |
| 5. | Add the dilution quantities and qualities to the ore component of the solid based on the percentage dilution calculated (step 2) and the diluting material properties (step 4). |
| 6. | Remove the loss quantities and qualities from the ore component of the solid based on the percentage loss calculated (step 3). |
| 7. | Calculate the final ore quantities and qualities (original values less losses plus dilution). |
| 8. | If the Li2O percentage of the final ore quantity is less than 0.60% (the assigned cut-off grade) then convert the ore component to waste. |
| 9. | Assign a final ROM material to the block – a block with any ore is allocated “ORE” with all others allocated as “WASTE”. |
As the above formulas indicate, a smallest mining unit (SMU) of 30m3 has been assigned for ore mining. This represents approximately one truckload of ore. The final dig solids with a ROM material of “ORE” can contain mineable quantities of both ore and waste, whereas “WASTE” material only contains waste material.
| 16.5.2 | Waste Dump Designs |
The site currently utilizes two existing waste dump areas named HS-2 and HS-3 for the storage of waste rock mined from the pit. These two areas will continue to be used for waste storage along with three additional waste dump areas:
| ● | HS4 | - the largest waste rock pile area located between the pit and TSF1, |
| ● | TSF2 wall | - the bulk material for tailing storage facility 2 (TSF2) located on the western side of the operation, |
| Revision: 0 – 14-Aug-2026 B198-D01-02054-RT-0010 |
Page 158 |
| NAL Expansion FS Mineral Reserve Pre-Feasibility Study NI 43-101 Final Report Prepared for Elevra |
|
| ● | TSF3 wall - the bulk material for tailings storage facility 3 (TSF3) located to the south of HS4. |
The location of all current and proposed waste and tailings storage facilities are shown in Figure 16-28.
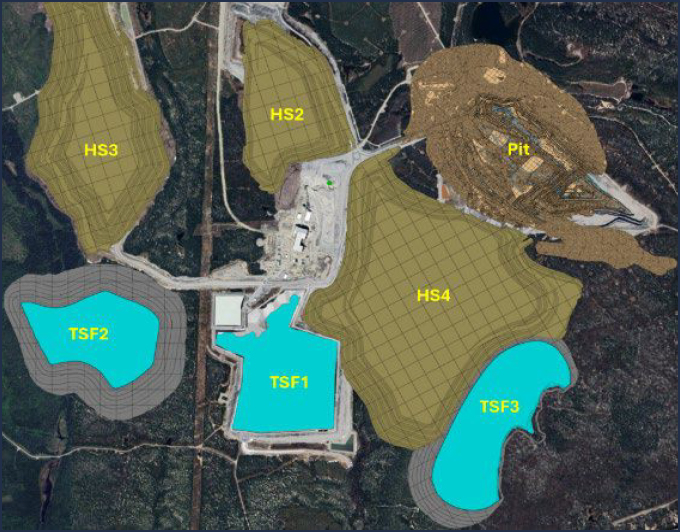
Figure 16-28: Waste Dump and Tailings Storage Facility Locations
Geotechnical slope stability recommendations were provided by Golder. Current dump designs were adjusted according to the recommendations included in this report and the ongoing geotechnical campaign data.
A swell factor of 30% was applied to all waste rock material to calculate waste storage requirements.
Permits for current non-permitted areas (HS-4, TSF-2 and TSF-3) are expected to be granted prior to the planned commencement dates. With exception of TSF 1 and 2, it should be noted that all proposed dumps and tailings facility shown above are conceptual at this stage, with final location and designs to be completed after approvals have been gained.
TSF-1 is currently in operation and the footprint of the TSF-2 has already been approved by Fisheries and Oceans Canada (DFO). The TSF-2 design, presented in the following chapters, will remain within the approved footprint. For HS-4 and TSF-3, a variants analysis will confirm the location of these two facilities. These infrastructure components will be optimized in the next studies of the project.
| Revision: 0 – 14-Aug-2026 B198-D01-02054-RT-0010 |
Page 159 |
| NAL Expansion FS Mineral Reserve Pre-Feasibility Study NI 43-101 Final Report Prepared for Elevra |
|
| 16.5.3 | Waste Dump Solids |
All waste designs shown in the previous chapter were converted to a solid and then subdivided into 100m x 100m x 10m high solids in Deswik.CAD. The subdivided solids were then imported into Spry for use in the dump scheduling component of the life-of-mine plan.
| 16.5.4 | Dig Schedule Strategy |
The schedule utilised two stages of capital investment which gradually increased the processing production rate up to 6,500 tonnes per day. The dates and subsequent increase in processing rate are summarised below:
| ● | Initial production rate | - 3,780 tonnes per day |
| ● | Stage 1 | - 4,500 tonnes per day from 1st July 2027 |
| ● | Stage 2 | - 6,500 tonnes per day from 1st April 2028 |
Additionally, an ore sorting circuit comes online on 1st July 2029 with a throughput of 1.1mt per annum.
The life-of-mine dig schedule strategy was based on the following:
| ● | Ensure target plant throughput (3,780tpd to 6,500tpd) is achieved each year, |
| ● | Target the lowest strip ratio areas to achieve the required ore tonnes, and |
| ● | Ensure stockpile inventories remain at manageable levels. |
| 16.5.5 | Mining Processes |
Nine mining and two processing processes were established in Spry to provide a detailed life-of-mine schedule that included all major operations. The processes included in Spry life-of-mine model are:
| 1. | Drill Presplit (114mm holes) |
| 2. | Load and Fire Presplit Blast |
| 3. | Drill Ore (140mm holes) |
| 4. | Drill Waste (171mm holes) |
| 5. | Load Explosives |
| 6. | Fire Production Blast |
| 7. | Mine Waste |
| 8. | Mine Ore |
| 9. | Rehandle Material Off Stockpiles |
| 10. | Dispose of Ore Sorter Rejects |
| 11. | Dispose of Tailings from Plant |
| Revision: 0 – 14-Aug-2026 B198-D01-02054-RT-0010 |
Page 160 |
| NAL Expansion FS Mineral Reserve Pre-Feasibility Study NI 43-101 Final Report Prepared for Elevra |
|
| 16.5.6 | Equipment |
Equipment to undertake the processes summarised in the previous chapter were established in Spry. The selection of the equipment types and classes was based on current equipment operating at site, the availability of equipment in the local area, ongoing support and physical suitability for the NAL operation. Large 200t excavators were added to the fleet to assist with maintaining the required stripping quantities. The equipment utilised in the life-of-mine schedule, grouped into general classifications, are summarised below:
| ● | Drill and Blast: |
| – | Presplit drill (114mm holes) |
| – | Ore drill (141mm holes) |
| – | Waste drill (171mm holes) |
| – | Blast crew |
| ● | Mining: |
| – | PC800 excavator (80t class) |
| – | PC1250 excavator (125t class) |
| – | PC2000 excavator (200t class) |
| ● | Processing: |
| – | Ore sorter |
| – | Processing plant |
| – | Loader (for ROM ore feed and ore sorter rejects) |
| – | Tailings disposal |
The PC2000 excavators are limited to mining waste only, whilst all other excavators can mine waste and ore. All ore is dumped on a stockpile at the ROM before being rehandled into the plant or ore sorter crushing units at a later date.
| 16.5.6.1 | Time Usage Models |
For all pieces of equipment, the number of operating hours is controlled by availability and utilisation values assigned each month in the time usage model established in Spry. The following availability and utilisation values have been applied, with the subsequent number of operating hours per non-leap year also shown:
| ● | Drills: |
| – | 78% availability, |
| – | 65% utilisation, |
| – | 4,441 operating hours per annum |
| ● | 200t and 125t class excavators: |
| – | 78% availability, |
| – | 80% utilisation, |
| – | 5,466 operating hours per annum |
| ● | 80t class excavators: |
| – | 78% availability, |
| – | 75% utilisation, |
| – | 5,125 operating hours per annum |
| Revision: 0 – 14-Aug-2026 B198-D01-02054-RT-0010 |
Page 161 |
| NAL Expansion FS Mineral Reserve Pre-Feasibility Study NI 43-101 Final Report Prepared for Elevra |
|
| 16.5.6.2 | Production Rates |
For all pieces of equipment, the production rate achieved for every operating hour has been hardwired for each process undertaken by the equipment. The production rates for the mining equipment is summarised below:
| ● | Presplit drills (114mm holes) | - 50m per operating hour |
| ● | Ore drills (140mm holes) | - 50m per operating hour |
| ● | Waste drills (171mm holes) | - 65m per operating hour |
| ● | Blast crew | - 50t of explosives per day |
| ● | 200t class excavators | - 310bcm per operating hour |
| ● | 125t class excavators | - 180bcm per operating hour |
| ● | 80t class excavators | - 142bcm per operating hour |
| 16.5.7 | Mining Dependencies |
A suite of dependencies was created in Spry to ensure a safe and practical schedule is generated. The dependencies control the progression of the equipment by limiting the number of tasks available to the equipment at the conclusion of a task.
The primary dependencies created in Spry are summarised below:
| ● | Block Above: |
| – | the dig block directly above must be completed first (no undermining) |
| ● | Process Order: |
| – | the processes in each block must be completed in order (i.e. drilling before blasting before mining) |
| ● | Previous Sub-Phase: |
| – | the block directly in front of the current block (in the previous sub-phase) must be mined first (no funnelling down) |
| ● | Develop Out From Ramp: |
| – | each bench is developed radially out from the ramp mouth |
| 16.5.8 | Mining Constraints |
Similar to dependencies, a range of constraints to control the progression of the equipment. The constraints controlled two primary aspects of the schedule: the proximity of the equipment (ensuring each piece of equipment did not operate too close to other equipment) and the maximum tonnage mined in a given period.
In general, the proximity constraints ensure that:
| ● | Each excavator is at least 100m away from any other excavator at all times, and |
| ● | A maximum of 3 excavators are operating in phase at any one time, except for phase 7a (which is very large) where up to 4 excavators are permitted. |
| Revision: 0 – 14-Aug-2026 B198-D01-02054-RT-0010 |
Page 162 |
| NAL Expansion FS Mineral Reserve Pre-Feasibility Study NI 43-101 Final Report Prepared for Elevra |
|
| 16.5.9 | Schedule Results |
All dig solids and dump solids were imported into Spry for dig and dump scheduling. Haulage modelling was also completed to provided annual truck hours for both waste and ore haulage. The quantities of tailings placed in the tailings storage facilities were also included in the LOM schedule, to provide accurate planning for the development of new tailings storage facilities and wall lifts.
The key highlights of the LOM plan are summarized below:
| ● | Mine life of approximately 20 years – from May 2026 to September 2046. |
| ● | Total of 47.3mt of ore mined. |
| ● | Total of 337.9mt of waste mined, leading to an overall strip ratio of 7.14:1, which fluctuates over the years. |
| ● | 17.7mt of ore sent to the ore sorting circuit at an average grade of 0.96% Li2O and 1.00% Fe. |
| ● | 14.4mt of product from the ore sorter at an average grade of 1.08% Li2O and 0.69% Fe. |
| ● | 44.0mt of ore sent to the processing plant at an average grade of 1.17% Li2O and 0.66% Fe. |
Figure 16-29 shows the annual tonnes processed through the plant and the Li2O feed grade.
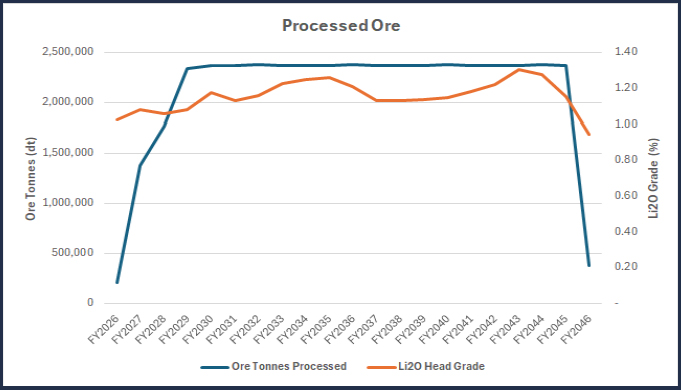
Figure 16-29: Annual Processed Tonnes and Li2O Grade
As Figure 16-29 indicates, the target production rate of 6,500 tonnes per day (2.37mt per annum) is achieved every year from FY2029 onwards.
A summary of the LOM plan is presented in Table 16-11 and Figure 16-30 to Figure 16-31 on the following pages.
Isometric views showing progression of the LOM schedule, including dig faces, dump faces and tailings dam utilisation, are presented in Figure 16-32 to Figure 16-43 on the following pages.
| Revision: 0 – 14-Aug-2026 B198-D01-02054-RT-0010 |
Page 163 |
| NAL Expansion FS Mineral Reserve Pre-Feasibility Study NI 43-101 Final Report Prepared for Elevra |
|
Table 16-11: NAL LOM Production Plan and Material Movement
| Physicals | Units | Production | Total | ||||||||
| FY26 | FY27 | FY28 | FY29 | FY30 | FY31-FY35 | FY36-FY40 | FY41-FY45 | FY46-FY49 | |||
| Ore | |||||||||||
| Ore Tonnes | (Mt) | 0.28 | 1.61 | 1.77 | 2.34 | 2.63 | 13.00 | 12.68 | 12.80 | 0.21 | 47.33 |
| Ore Li2O Grade | (%) | 0.94% | 1.02% | 1.06% | 1.09% | 1.10% | 1.13% | 1.10% | 1.17% | 1.02% | 1.12% |
| Ore Fe Grade | (%) | 1.22% | 1.00% | 1.01% | 0.91% | 0.89% | 0.81% | 0.84% | 0.71% | 0.76% | 0.81% |
| Waste | |||||||||||
| Waste Tonnes | (Mt) | 2.2 | 14.0 | 17.9 | 19.6 | 21.0 | 118.0 | 107.1 | 37.5 | 0.7 | 337.9 |
| Strip Ratio | (t:t) | 7.6 | 8.7 | 10.1 | 8.3 | 8.0 | 9.1 | 8.4 | 2.9 | 3.4 | 7.1 |
| Processing | |||||||||||
| Feed Tonnes Processed | (Mt) | 0.21 | 1.38 | 1.77 | 2.34 | 2.37 | 11.9 | 11.9 | 11.9 | 0.4 | 44.05 |
| Feed Li2O Grade | (%) | 1.02% | 1.08% | 1.06% | 1.08% | 1.17% | 1.20% | 1.15% | 1.23% | 0.95% | 1.17% |
| Feed Fe Grade | (%) | 0.84% | 0.78% | 0.83% | 0.78% | 0.71% | 0.61% | 0.66% | 0.62% | 0.67% | 0.66% |
| Product Li2O | (t) | 1,488 | 10,307 | 13,274 | 17,974 | 19,843 | 101,662 | 97,288 | 103,606 | 2,504 | 367,947 |
| Concentrate Tonnes | (t) | 27,560 | 190,876 | 245,820 | 332,859 | 367,465 | 1,882,635 | 1,801,626 | 1,918,623 | 46,373 | 6,813,837 |
| Revision: 0 – 14-Aug-2026 B198-D01-02054-RT-0010 |
Page 164 |
| NAL Expansion FS Mineral Reserve Pre-Feasibility Study NI 43-101 Final Report Prepared for Elevra |
|
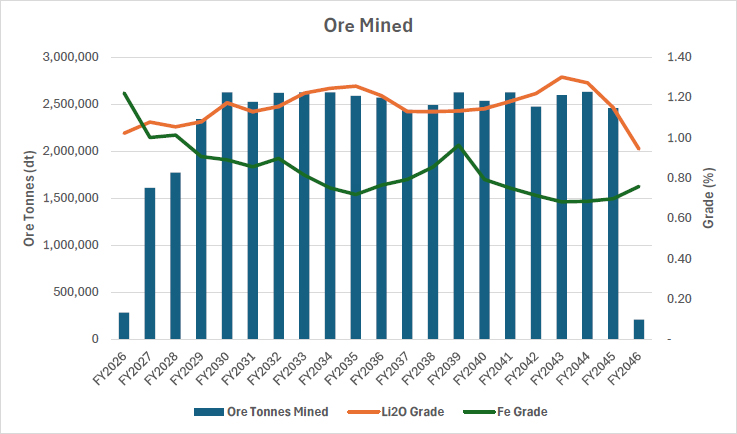
Figure 16-30: NAL Ore Mining Summary
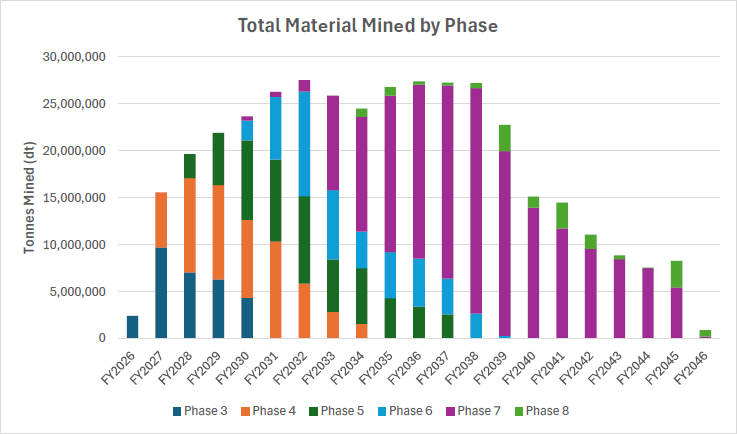
Figure 16-31: NAL Total Movements
| Revision: 0 – 14-Aug-2026 B198-D01-02054-RT-0010 |
Page 165 |
| NAL Expansion FS Mineral Reserve Pre-Feasibility Study NI 43-101 Final Report Prepared for Elevra |
|
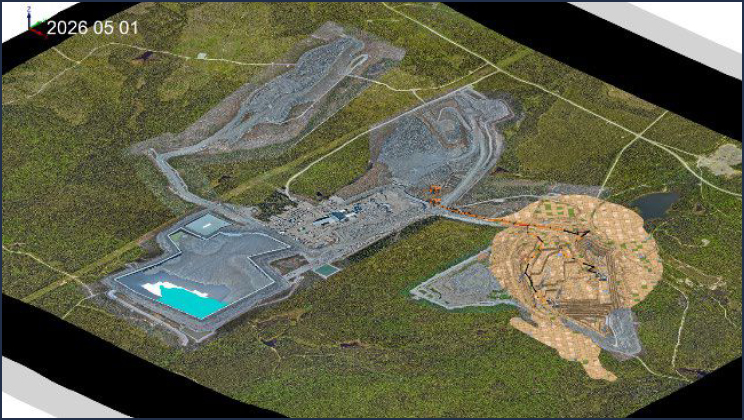
Figure 16-32: Conceptual Isometric View of Mine as of 1st May 2026
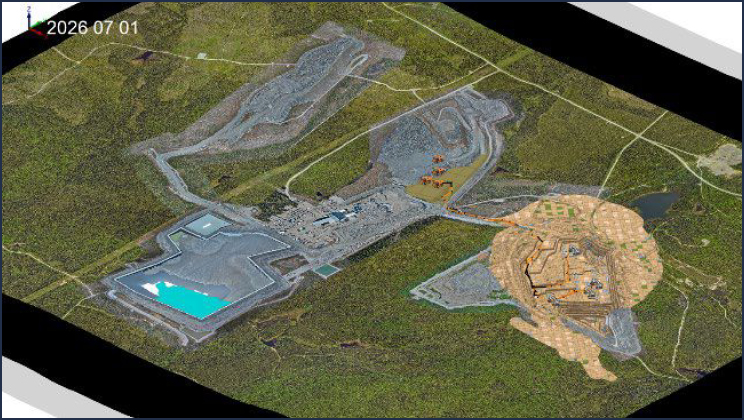
Figure 16-33: Conceptual Isometric View of Mine as of 1st July 2026
| Revision: 0 – 14-Aug-2026 B198-D01-02054-RT-0010 |
Page 166 |
| NAL Expansion FS Mineral Reserve Pre-Feasibility Study NI 43-101 Final Report Prepared for Elevra |
|
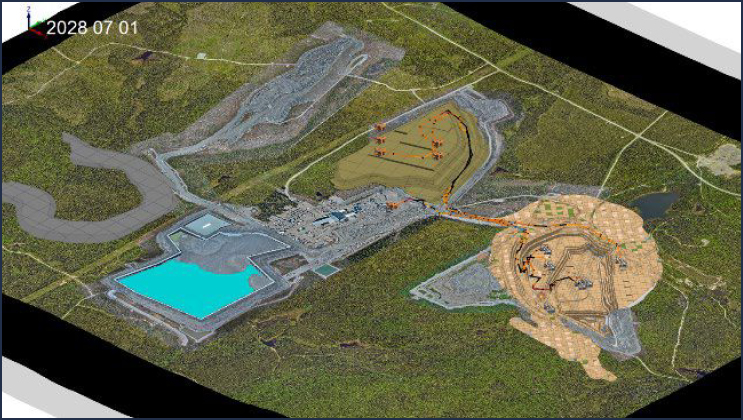
Figure 16-34: Conceptual Isometric View of Mine as of 1st July 2028
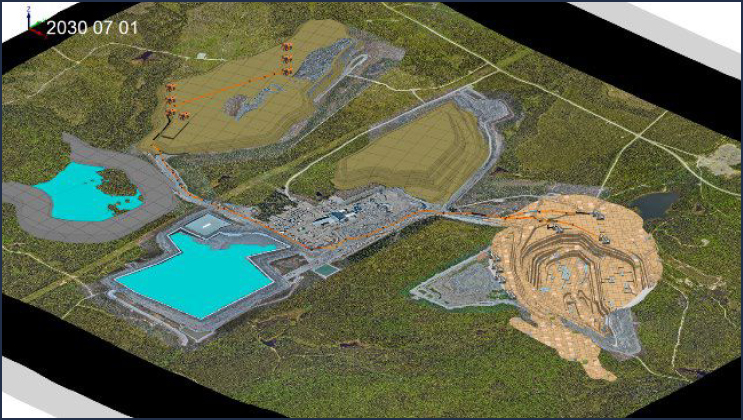
Figure 16-35: Conceptual Isometric View of Mine as of 1st July 2030
| Revision: 0 – 14-Aug-2026 B198-D01-02054-RT-0010 |
Page 167 |
| NAL Expansion FS Mineral Reserve Pre-Feasibility Study NI 43-101 Final Report Prepared for Elevra |
|
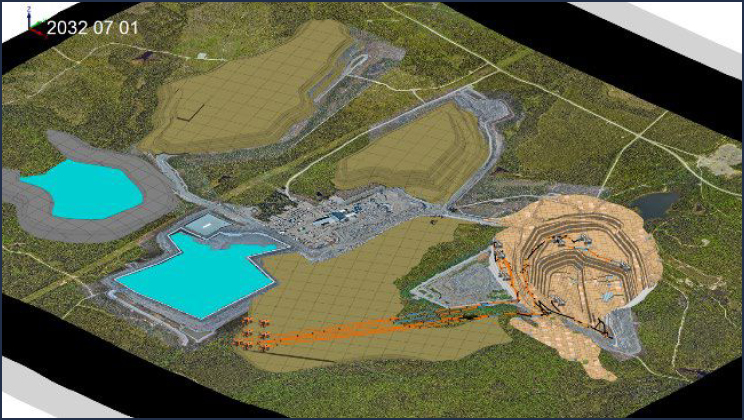
Figure 16-36: Conceptual Isometric View of Mine as of 1st July 2032
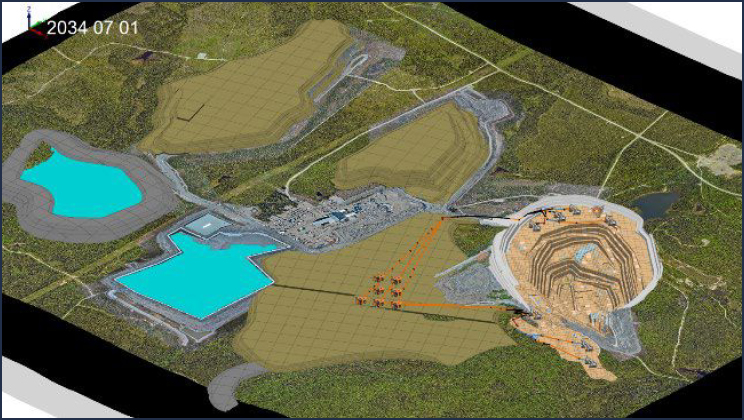
Figure 16-37: Conceptual Isometric View of Mine as of 1st July 2034
| Revision: 0 – 14-Aug-2026 B198-D01-02054-RT-0010 |
Page 168 |
| NAL Expansion FS Mineral Reserve Pre-Feasibility Study NI 43-101 Final Report Prepared for Elevra |
|
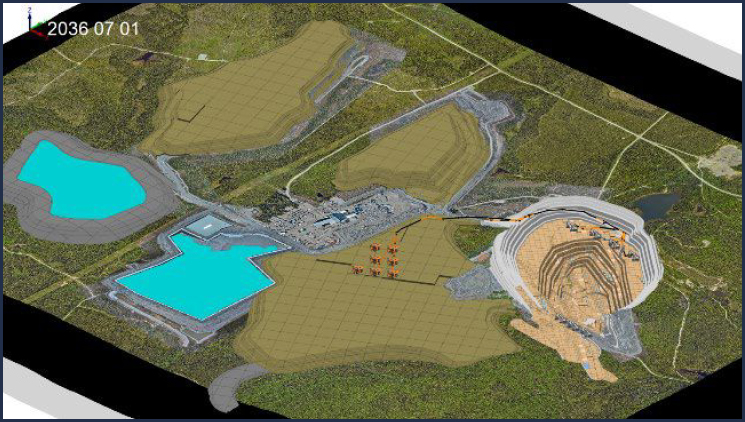
Figure 16-38: Conceptual Isometric View of Mine as of 1st July 2036
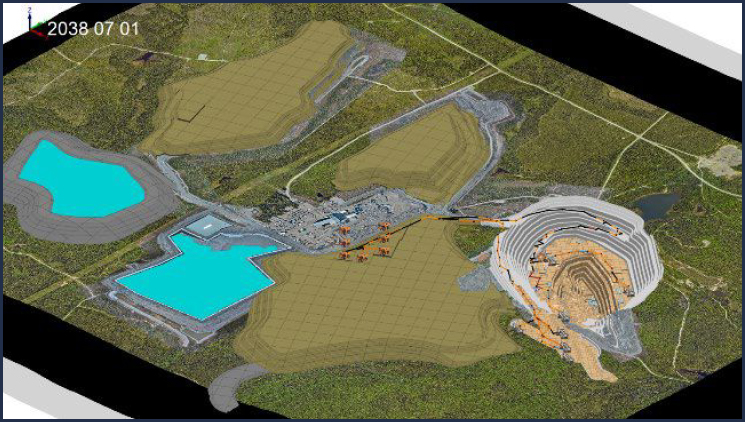
Figure 16-39: Conceptual Isometric View of Mine as of 1st July 2038
| Revision: 0 – 14-Aug-2026 B198-D01-02054-RT-0010 |
Page 169 |
| NAL Expansion FS Mineral Reserve Pre-Feasibility Study NI 43-101 Final Report Prepared for Elevra |
|
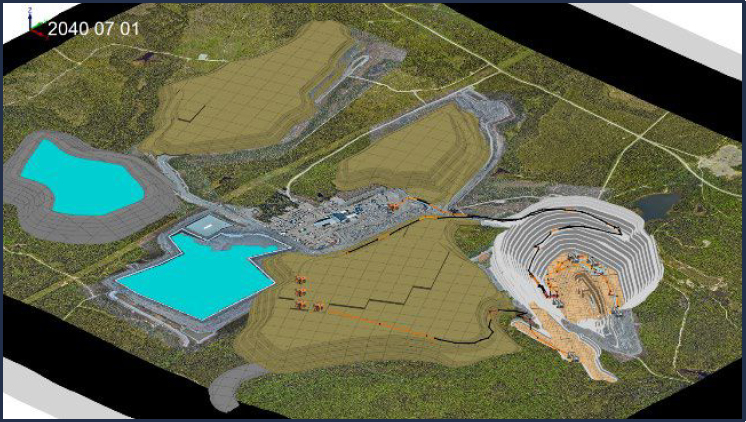
Figure 16-40: Conceptual Isometric View of Mine as of 1st July 2040
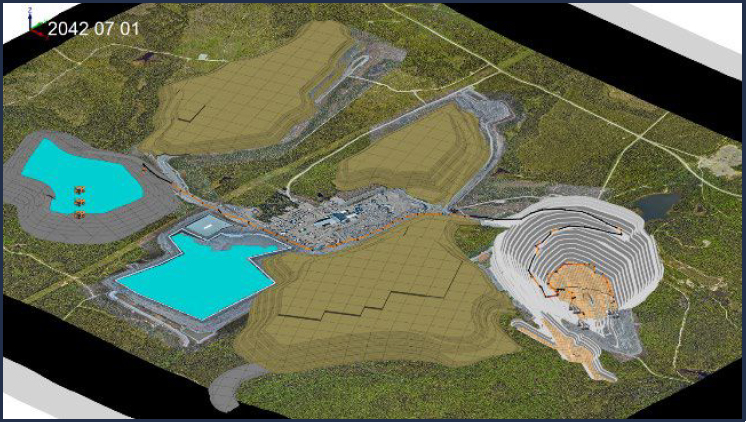
Figure 16-41: Conceptual Isometric View of Mine as of 1st July 2042
| Revision: 0 – 14-Aug-2026 B198-D01-02054-RT-0010 |
Page 170 |
| NAL Expansion FS Mineral Reserve Pre-Feasibility Study NI 43-101 Final Report Prepared for Elevra |
|
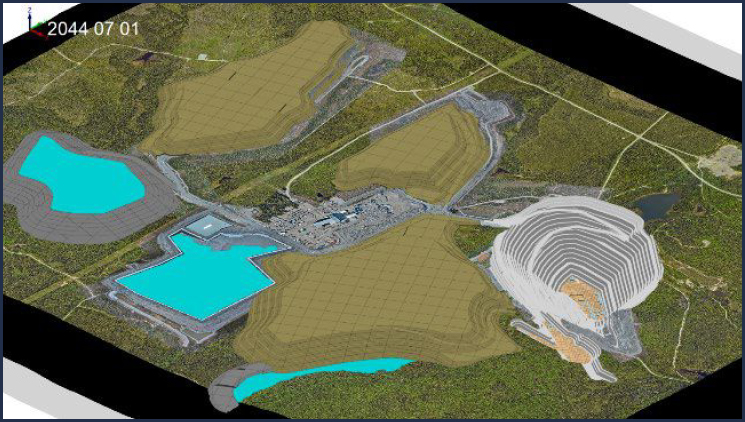
Figure 16-42: Conceptual Isometric View of Mine as of 1st July 2044
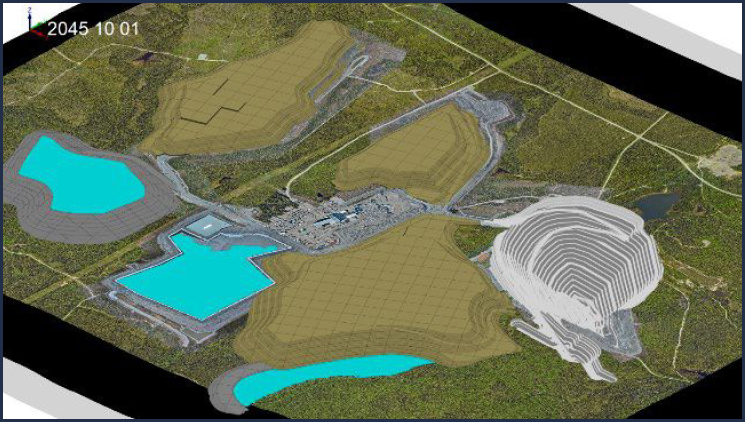
Figure 16-43: Conceptual Isometric View of Mine as of 1st October 2045 (end of mining)
| Revision: 0 – 14-Aug-2026 B198-D01-02054-RT-0010 |
Page 171 |
| NAL Expansion FS Mineral Reserve Pre-Feasibility Study NI 43-101 Final Report Prepared for Elevra |
|
| 16.6 | Key Dates |
A series of key dates from the schedule is provided in Table 16-12.
Table 16-12: Key Dates
| Item | Start Date | Finish Date |
| Mining Phases | ||
| Phase 3B | 1/05/2026 | 1/06/2029 |
| Phase 3F | 19/05/2026 | 13/07/2030 |
| Phase 4A | 1/07/2026 | 15/08/2031 |
| Phase 4B | 13/03/2031 | 17/08/2031 |
| Phase 4F | 31/08/2027 | 13/03/2034 |
| Phase 5A | 21/07/2027 | 9/01/2031 |
| Phase 5B | 9/01/2031 | 24/01/2031 |
| Phase 5C | 13/12/2030 | 14/12/2031 |
| Phase 5D | 25/09/2031 | 4/07/2034 |
| Phase 5F | 4/04/2034 | 10/07/2037 |
| Phase 6A | 1/01/2030 | 1/08/2036 |
| Phase 6F | 24/02/2036 | 2/09/2038 |
| Phase 7A | 28/01/2030 | 28/03/2040 |
| Phase 7F | 14/09/2032 | 26/07/2045 |
| Phase 8F | 24/08/2033 | 3/09/2045 |
| Waste Dumps | ||
| HS2 | 1/05/2026 | 9/11/2028 |
| HS3 | 22/08/2028 | 3/09/2045 |
| HS4 | 18/06/2031 | 12/07/2043 |
| TSF1 | ||
| Tailings Deposition | 1/05/2026 | 14/11/2029 |
| TSF2 | ||
| Dam Wall | 4/01/2028 | 9/07/2042 |
| Dam Wall RL410 Lift | 4/01/2028 | 11/06/2028 |
| Dam Wall RL421 Lift | 8/03/2031 | 19/06/2031 |
| Dam Wall RL432 Lift | 20/11/2033 | 23/02/2034 |
| Dam Wall RL443 Lift | 2/10/2036 | 20/12/2036 |
| Dam Wall RL454 Lift | 20/07/2039 | 31/10/2039 |
| Dam Wall RL465 Lift | 18/04/2042 | 9/07/2042 |
| Tailings Deposition | 14/11/2029 | 24/03/2044 |
| TSF3 | ||
| Dam Wall | 20/07/2032 | 19/08/2044 |
| Dam Wall RL384 Lift | 20/07/2032 | 22/07/2032 |
| Dam Wall RL394 Lift | 22/07/2032 | 9/08/2032 |
| Dam Wall RL404 Lift | 24/05/2044 | 19/08/2044 |
| Tailings Deposition | 24/03/2044 | 3/09/2045 |
| 16.7 | Mining Activities |
To achieve minimal mining dilution and ore losses, mining operations must follow specific procedures, depending on the width and physical properties of the Li2O-containing pegmatite. Grade control drilling will assist with resource definition and the reduction of both losses and dilution.
The mining direction for ore and waste mining when exposing the dykes should be into the dip of the dyke, as shown in Figure 16-44.
| Revision: 0 – 14-Aug-2026 B198-D01-02054-RT-0010 |
Page 172 |
| NAL Expansion FS Mineral Reserve Pre-Feasibility Study NI 43-101 Final Report Prepared for Elevra |
|
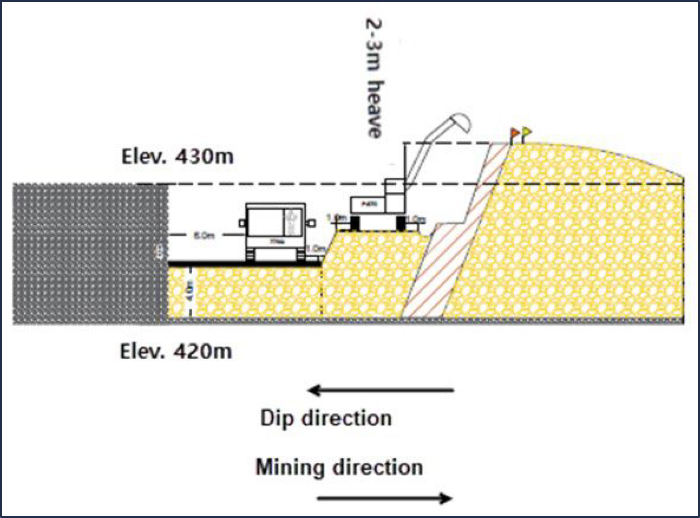
Figure 16-44: Section View of Mining Method
| 16.7.1 | Drilling and Blasting |
Typical blast patterns for pre-split, ore material and waste rock material are described in
Table 16-13 and are currently implemented on site. Blasting parameters will constantly be adjusted as mining progresses in the pit according to the geotechnical properties of the rock and dyke configuration. Pre-split is undertaken on ultimate pit walls, using prepackaged emulsion. Pre-split holes are drilled on double bench height (20 m) and have a 114mm diameter.
Waste rock material is excavated in 10m benches, while ore is mined on flitches of 5 m or less, where operational considerations allow.
Table 16-13 Standard Blast Patterns
| Description | Units | Pre-Split | Ore Pattern | Waste Pattern |
| Bench Height | m | 20.0 | 10.0 | 10.0 |
| Hole Diameter | mm | 114.0 | 140.0 | 171.0 |
| Hole length | m | 20.0 | 9.0 | 9.0 |
| Burden | m | - | 2.8 | 3.4 |
| Spacing | m | 1.6 | 5.1 | 6.8 |
| Collar | m | - | 2.5 | 3.0 |
| Sub-drilling | m | -0.6 | -1.1 | -1.0 |
| Powder Factor | kg/m3 | - | 0.5 | 0.5 |
| Revision: 0 – 14-Aug-2026 B198-D01-02054-RT-0010 |
Page 173 |
| NAL Expansion FS Mineral Reserve Pre-Feasibility Study NI 43-101 Final Report Prepared for Elevra |
|
| 16.7.2 | Haulage Assumptions |
Haulage modelling assumptions were configured in Spry for each excavator class in the fleet, with trucking parameters assigned per dig unit and material process. All excavators were allocated Caterpillar 777G Dual Slope rear dump trucks, with loading times varying by excavator size and dig rates reflecting the productivity of each class. Trucking and haulage assumptions are shown in the following tables.
Table 16-14: Trucking Assumptions by Excavator
| Item | Process | Dig Rate (bcm/hr) |
Truck Payload (bcm) |
Loading Time (min) |
Dumping Time (min) |
Queue Time (min) |
Additional Time (min) |
Efficiency Factor |
| 200t | Waste | 310 | 33 | 4.0 | 1.5 | 0.0 | 2.0 | 0.95 |
| 200t | Ore | 315 | 33 | 4.0 | 1.5 | 0.0 | 2.0 | 0.95 |
| PC1250 | Waste/Ore | 180 | 33 | 6.9 | 1.5 | 0.0 | 2.0 | 0.95 |
| PC800 Ore | Ore | 142 | 33 | 8.7 | 1.5 | 0.0 | 2.0 | 0.95 |
|
PC800 Waste |
Waste | 142 | 33 | 8.7 | 1.5 | 0.0 | 2.0 | 0.95 |
Table 16-15: Caterpillar 777G Truck Specifications
| Parameter | Unit | Value |
| Truck model | - | Caterpillar 777G Dual Slope |
| Gross engine power | kW | 765 |
| Net engine power | kW | 704 |
| Tyre size | - | 27.00R49 |
| Heaped tray capacity | m³ | 60 |
| Empty weight | kg | 73,618 |
| Full weight (rated) | kg | 164,654 |
| Rated payload | t | 91.0 |
| Simulated payload | t | 90.4 |
| Max acceleration | m/s² | 1.8 |
| Max deceleration | m/s² | 1.5 |
| Max traction for braking | % | 60 |
| Fuel usage (0% load) | l/hr | 10.0 |
| Fuel usage (100% load) | l/hr | 206.0 |
Table 16-16: Haul Road Segment Speed Restrictions
| Segment | Description | Rolling Resistance |
Retarder Use (Full / Empty) |
Max Speed Full (km/h) |
Max Speed Empty (km/h) |
| A | Main haul road | 2.0% | 70% / 70% | 60 | 60 |
| B | Main in-pit and dump haul road | 3.0% | 85% / 85% | 30 | 60 |
| C | Around dig face and tiphead | 4.0% | 85% / 85% | 25 | 30 |
| D | Round-a-bout | 3.0% | 85% / 85% | 12 | 12 |
Table 16-17: Ramp Speed Restrictions
| Code | Ramp Grade |
Retarder Use (Full / Empty) |
Max Speed Full (km/h) |
Max Speed Empty (km/h) |
| RA | Down ≥ 5.0% | 100% / 100% | 20 | 40 |
| A | Up ≥ 5.0% | 100% / 100% | 100 (engine limited) | 100 (engine limited) |
| Revision: 0 – 14-Aug-2026 B198-D01-02054-RT-0010 |
Page 174 |
| NAL Expansion FS Mineral Reserve Pre-Feasibility Study NI 43-101 Final Report Prepared for Elevra |
|
Table 16-18: Corner Speed Restrictions
| Code | Direction Change | Max Speed Full (km/h) | Max Speed Empty (km/h) |
| CA | ≥ 45° and < 65° | 30 | 35 |
| CB | ≥ 65° and < 85° | 20 | 25 |
| CC | ≥ 85° | 10 | 10 |
| 16.7.3 | Haulage Results |
Haulage modelling was completed on the life-of-mine plan, with haul profiles created using Networkr, a module in Spry which generates accurate haul profiles from the active topographic surface. Haulage modelling was based on the allocation of Caterpillar 777 trucks, with a capacity of 90t (33bcm), to all dig units and processes (waste, ore and ore sorter rejects), using historical performance factors.
The haulage modelling generated a haul profile for every waste and ore dig solid/dump combination (155,000 haul profiles) with the load time, haulage time, dump time, queue time and spot time added to calculate a total cycle time for each profile. The number of truck hours, fuel consumed, changes in elevation, TKPH and other haulage performance indicators are calculated for each haul profile. The results of the haulage modelling assessment are shown in Figure 16-45.
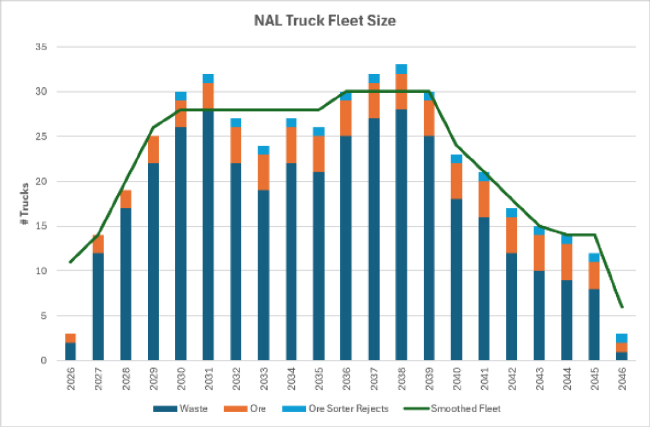
Figure 16-45: Haulage Modelling Results
The number of Caterpillar 777 trucks required were smoothed on annual basis with a maximum fleet size of 30 trucks required from FY2036 to FY2039, when production from the pit is at its highest level. Excavators start parking permanently from FY2039 which reduces the number of trucks required.
| Revision: 0 – 14-Aug-2026 B198-D01-02054-RT-0010 |
Page 175 |
| NAL Expansion FS Mineral Reserve Pre-Feasibility Study NI 43-101 Final Report Prepared for Elevra |
|
| 16.7.4 | Road Maintenance |
Existing roads connect the various site service buildings and provide passage for heavy trucks between the pit, the crusher, the waste rock dumps, and the truck maintenance shop. The NAL haulage network is shown in Figure 16-46.
The haulage network shown in Figure 16-46 displays the in-pit haul roads (black lines), the dump access haul roads (green lines) and the main haul roads linking each of the operating areas (red lines).
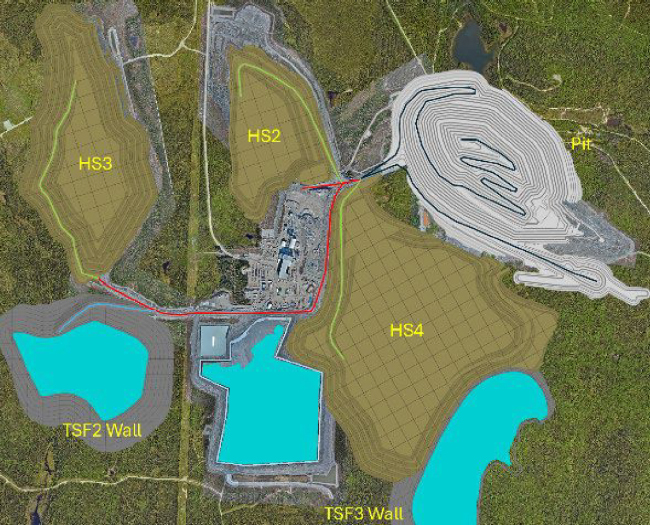
Figure 16-46: Haulage Network
| 16.7.5 | Mobile Mining Equipment |
It is currently forecast that mining will be conducted by a mining contractor for the duration of the schedule. The mining contractor is responsible for providing and maintaining all equipment required to supply ROM ore to the crusher.
Table 16-19 details the primary mining equipment types and sizes that are planned, with their peak requirements. An additional fleet may be added or modified by the contractor, as needed, to support operations. Pumping is carried out using diesel pumps, HDPE piping and generators.
| Revision: 0 – 14-Aug-2026 B198-D01-02054-RT-0010 |
Page 176 |
| NAL Expansion FS Mineral Reserve Pre-Feasibility Study NI 43-101 Final Report Prepared for Elevra |
|
Table 16-19: Mining Equipment Description and Maximum Number of Units
| Equipment Type | Description | Peak Requirement |
| Mining truck | Caterpillar 777 - 90t | 30.0 |
| Hydraulic excavator | PC2000 (200t class) | 4.0 |
| Hydraulic excavator | PC1250 (120t class) | 2.0 |
| Hydraulic excavator | PC800 (80t class) | 1.0 |
| Production drill | DTH – 4” to 7” hole size | 4.0 |
| Track Dozer | Net Power – 197 kW | 4.0 |
| Track Dozer | Net Power – 265 kW | 4.0 |
| Road grader | Net Power – 216 kW | 3.0 |
| Utility Excavator | Net Power – 308 kW | 1.0 |
| Wheel Dozer | Net Power – 249 HP | 1.0 |
| Water Truck/Sand spreader | Capacity – 80 000L | 1.0 |
| Wheel Loader | Bucket payload – 7.8 m3 | 1.0 |
| Fuel and Lube Truck | n/a | 4.0 |
| Service Truck | n/a | 1.0 |
| Pick-Up Trucks | n/a | 15.0 |
| Tower Lights | n/a | 8.0 |
| 16.7.6 | Water Management Strategy |
The general water management strategy developed for the Project aims to:
| ● | Divert off-site, all non-contact water from non-perturbed areas surrounding the site. |
| ● | Manage by draining, conveying, and containing runoff from surface infrastructure from the mill and waste (tailings and waste rock) management areas as well as underground water. |
| ● | Recycle a maximum of the mine site water from runoff, process, and groundwater for water supply purposes. |
| ● | For TSS sedimentation, retain water in ponds prior to treatment for release to the environment. |
| ● | Treat all contaminated water before releasing it to the environment. |
The Water Management Plan (WMP) addresses the management of runoff water that has been in contact with the mine site as well as the clean water that flows through the Project site. The WMP update includes the tailings and waste rock storage facility runoff water, which represents a major addition in impacted surface area to the Project. Runoff water and underground water from the open pit are also collected. The domestic water is collected, and an appropriate treatment system is to be provided.
In preparing the WMP, priority was given to minimizing the impacted areas that generate contact water, to reduce the water volumes that will be managed. On the other hand, reclaim of contact water is prioritized to maximize the re-utilization ratio. Particular consideration was given to water management based on watersheds. The WMP mitigates the volume of contact water inflows to be managed on-site by diverting clean water to the environment.
| 16.7.7 | Mine Personnel |
Contractors are responsible for providing all personnel required to carry out mining activities such as drilling, blasting, loading, and hauling material, for the duration of its contract with the mine. Mining contractor personnel includes superintendents, mine supervisors, operators, drill-and-blast personnel, maintenance supervisors and mechanics. Elevra’s team will consist of technical services and management personnel for the duration of the entire operation.
| Revision: 0 – 14-Aug-2026 B198-D01-02054-RT-0010 |
Page 177 |
| NAL Expansion FS Mineral Reserve Pre-Feasibility Study NI 43-101 Final Report Prepared for Elevra |
|
| 17 | Recovery Methods |
The recovery methods for the Project were established based on the existing plant, historical operational data, historical metallurgical testwork, and lessons learned from other spodumene projects. Expansion process design is based on the operational and metallurgical reviews of the past process plant operation and testwork data. The work completed established the design basis of the plant, capital costs, and operating costs that were developed in this Mineral Reserves PFS.
| 17.1 | Existing Plant Description |
NAL’s current operations are authorized at 4,500 tpd average annual production for the processing plant to produce spodumene concentrate. It consists of the following distinct areas:
| ● | The primary, secondary and tertiary crushing, and ore sorting circuits on the ROM to produce an upgraded plant feed for downstream processing. |
| ● | The spodumene processing plant including grinding, desliming, magnetic separation, flotation and dewatering circuits to produce a final spodumene concentrate. |
| ● | Process water and utilities circuits including tailings thickeners, reagents preparation, reverse osmosis treatment, and tailings management. |
In addition to the areas described above, the processing plant includes an area for the conversion of the spodumene concentrate into lithium carbonate. This area is currently not in operation and Elevra has indicated that there are no plans to produce lithium carbonate at the NAL facility.
| 17.2 | Process Improvements |
The process design developed for the Mineral Reserves PFS captures opportunities which were previously identified during the Updated Scoping Study.
| 17.2.1 | HPGR Trade-off and Grinding Simulations |
Process modelling confirmed the concerns that the previous design basis had underestimated the required circuit modifications required to achieve targets, resulting in additional power/equipment being required or a relaxed grind size. Based on this modelling, a trade-off study assessed three comminution circuit configurations to achieve a target throughput of 300 tph at a primary grind size of 200 µm P80 with the following scenarios as described below:
| ● | Scenario 1: High Pressure Grinding Rolls (HPGR) and 1.6 MW ball mill circuit followed by two parallel ball mills (existing rod mill converted). |
| ● | Scenario 2A: Duplication of existing comminution circuit (rod mill and ball mill circuit). |
| ● | Scenario 2B: Duplication of existing comminution circuit with larger ball mill for future expansion. |
| ● | Scenario 3: Primary 2.1 MW ball mill followed by two parallel ball mills (existing rod mill converted). |
The analysis demonstrates that all scenarios are technically capable of meeting the production target, but each presents different trade-offs in terms of cost, risk, and long-term flexibility. Scenario 2B was found to be the preferred option from a multi-criteria analysis (MCA) evaluating ease of implementation, operability, capital and operating costs, layout constraints, additional equipment and technology, and future expansion potential.
The qualitative scoring is presented in Table 17-1.
| Revision: 0 – 14-Aug-2026 B198-D01-02054-RT-0010 |
Page 178 |
| NAL Expansion FS Mineral Reserve Pre-Feasibility Study NI 43-101 Final Report Prepared for Elevra |
|
Table 17-1: HPGR Trade-off MCA Score Summary
| Criterion | Scenario 1 | Scenario 2A | Scenario 2B | Scenario 3 |
| Ease of Implementation | 1 | 5 | 5 | 3 |
| Operability | 2 | 4 | 4 | 3 |
| Cost | 1 | 5 | 4 | 4 |
| Layout | 1 | 4 | 4 | 4 |
| Technology | 2 | 5 | 4 | 4 |
| Future Expansion | 2 | 1 | 5 | 2 |
| TOTAL | 9 | 24 | 25 | 20 |
The design for Scenario 2B was implemented as the base case for the PFS process design and the flowsheets modified.
| 17.2.2 | Plant Layout Considerations |
The NAL operations team raised concerns related to layout constraints which could impact the initial updated scoping study design. The initial design included new conditioning tanks to implement two-stage conditioning for the existing rougher and scavenger flotation circuits due to issues reported by the operations team.
A review of the layout revealed that there is insufficient space to install new conditioning tanks for the rougher and scavenger flotation circuits. The PFS process design was therefore updated to repurpose the existing rougher and scavenger dilution tanks into conditioning tanks in Stage 1. As the existing rougher circuit will be reconfigured as a scavenger duty in Stage 2, the loss of the dilution tank is considered an acceptable trade-off during Stage 1.
| 17.2.3 | Tailings Management |
The updated scoping design had a new process thickener added in Stage 2 to increase the capacity of the existing thickener circuit. In this previous design, the existing process thickener would be operated in conjunction with a new flotation thickener as it was deemed adequate for a 15-20% increase in capacity combined with the reduced duty because of the split of water circuits. The new Stage 2 thickener would then only be added to match the difference in throughput from Stage 1 to Stage 2. This approach had the disadvantage of requiring operation of the existing thickener and new process thickener operating in parallel, thus increasing complexity.
A new process water circuit configuration is proposed for the PFS. A new process thickener will be installed to replace the existing thickener immediately from Stage 1. This new thickener will be sized for the Stage 2 throughput. The existing thickener could potentially be used in the future for water clarification but this was not part of the scope for the PFS.
The tailings from both process and flotation water circuits will be combined in an agitated tailings tank. The combined tailings will be sent to the TSF though two main pipelines with one pipeline in standby to provide redundancy to the TSF system.
| 17.3 | PFS Expansion Design |
The NAL expansion is based on a staged approach to reach authorised processing plant capacities:
| ● | Stage 1: Increase of 15-20% in spodumene concentrate production within the 4,500 tpd permit. |
| ● | Stage 2: Expansion to a new milling throughput limit of 6,500 tpd average annual rate. |
| ● | Stage 3: New crusher circuit (milling capacity unchanged from Stage 2) |
| Revision: 0 – 14-Aug-2026 B198-D01-02054-RT-0010 |
Page 179 |
| NAL Expansion FS Mineral Reserve Pre-Feasibility Study NI 43-101 Final Report Prepared for Elevra |
|
The targeted capacities will be achieved through the following modifications to the existing facility:
| ● | Stage 1: Plant optimization |
| – | Addition of lump breakers in the ore feed circuit to the plant to prevent ice lumping |
| – | Increased stacksizer capacity to the existing ball mill circuit |
| – | Optimization of the desliming and magnetic separation circuit |
| – | Increased flotation conditioning capacity |
| – | Refurbishment of carbonate filtration unit for new spodumene dewatering and filtration unit |
| – | Replacement of existing thickener with a larger process thickener |
| – | Addition of a flotation thickener circuit to prevent flotation reagent contamination |
| – | Reconfiguration of tailings pumping to TSF |
| ● | Stage 2: Plant expansion |
| – | Contracting of a temporary crusher to balance plant feed with existing crusher |
| – | Addition of a second rod mill and ball mill line circuit including stacksizers |
| – | Addition of a trash screen to remove oversize (+1mm) material before magnetic separation |
| – | Addition of a third magnetic separation line to match increase throughput |
| – | Addition of a new rougher unit and conversion of the existing rougher to scavenger duty |
| ● | Stage 3: New crusher construction |
| – | Construction of new crusher to handle target throughput |
| – | Construction of new fine covered ore stockpile complete with reclaim and conveyors |
| – | Conversion of the existing crusher circuit to an ore sorting facility |
| 17.3.1 | Process Design Criteria |
The key design criteria for the various stages of the expansion are summarized in Table 17-2 below. The design will be based on the existing mine and facility, the lithium recovery anticipated is 71.20% and is based on improvements to current plant performance of 69.00% recovery. The recovery is also based on a plant feed Li2O grades presented below and a target concentrate Li2O grades of 5.40%.
Table 17-2: General Process Design Criteria
| Criterion | Unit | Base Case | Stage 1 | Stage 2 | Stage 3 |
| Crushing Plant Availability | % | 65 | 65 | 65 | 65 |
| Processing Plant Availability | % | 90 | 90 | 90 | 90 |
| Total ROM Crusher Feed | tpd | 5,815 | 6,646 | 10,000 | 10,000 |
| Total Processing Plant Feed | tpd | 3,780 | 4,320 | 6,500 | 6,500 |
| Plant Feed Li2O Grade | % | 1.01 | 1.095 | 1.080 | 1.080 |
| Target Concentrate Li2O grade | % | 5.40 | 5.40 | 5.40 | 5.40 |
| Target Concentrate Production | tpa | 178,058 | 213,670 | 338,0001 | 338,0001 |
| Concentrate P80 | mm | 0.200 | 0.232 | 0.200 | 0.200 |
Note 1: The financial model prepared for the PFS considers a LOM average annual 5.4% Li2O concentrate production rate of 348 ktpa (or 373 ktpa post expansion). These rates are superior to the process design criteria due to the production rate being dependant on the plant feed grade; the financial model considers a 1.17% feed grade. The process design is based on lower grades but the design supports the rates used for the financial model. The financial model is discussed in greater detail in Chapter 22 – Economic Analysis.
| Revision: 0 – 14-Aug-2026 B198-D01-02054-RT-0010 |
Page 180 |
| NAL Expansion FS Mineral Reserve Pre-Feasibility Study NI 43-101 Final Report Prepared for Elevra |
|
| 17.3.2 | Process Flowsheets |
The simplified block flow diagram is shown in Figure 17-1. The simplified process flow diagram is shown in Figure 17-2. The changes to existing equipment and additional equipment to be installed are colour coded according to the expansion Stage.
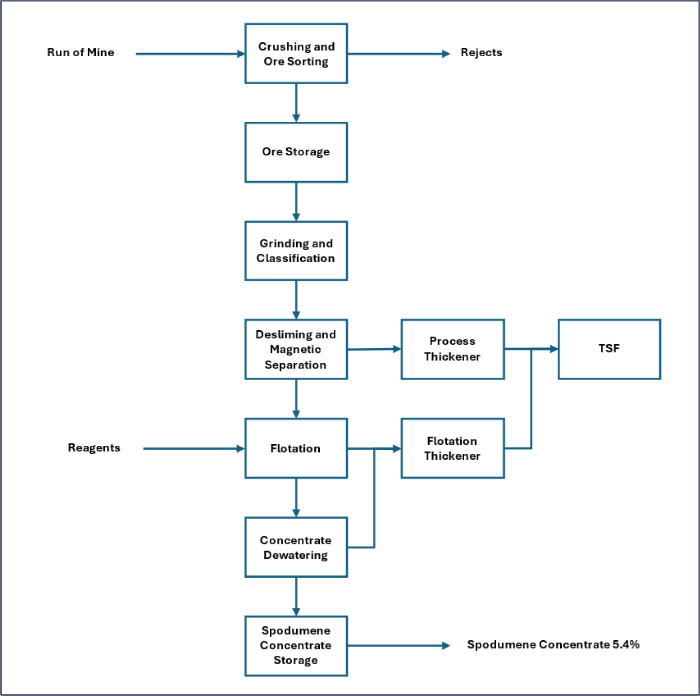
Figure 17-1: Simplified Block Flow Diagram
| Revision: 0 – 14-Aug-2026 B198-D01-02054-RT-0010 |
Page 181 |
| NAL Expansion FS Mineral Reserve Pre-Feasibility Study NI 43-101 Final Report Prepared for Elevra |
|
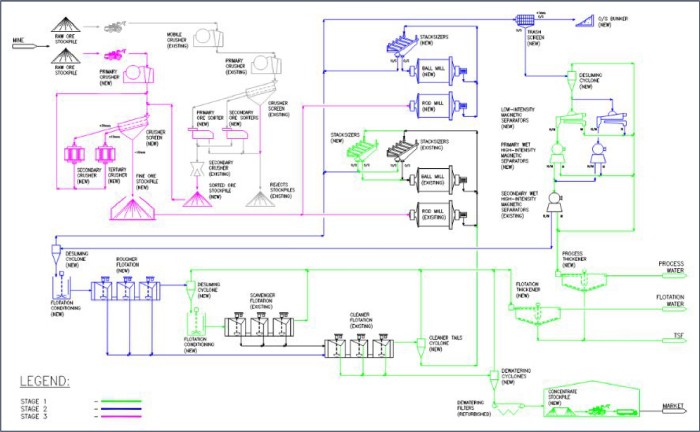
Figure 17-2: Simplified Process Flow Diagram
| Revision: 0 – 14-Aug-2026 B198-D01-02054-RT-0010 |
Page 182 |
| NAL Expansion FS Mineral Reserve Pre-Feasibility Study NI 43-101 Final Report Prepared for Elevra |
|
| 17.4 | Process Description |
The following sections detail the plant design optimisations and expansion modifications to the existing NAL facility proposed by Sedgman Novopro and approved by Elevra for the Mineral Reserves PFS. The key areas of the NAL facility following the various stages of expansion are described in the following subsections.
As the expansion will be delivered in a staged approach, the process is described below following the three stages of expansion.
| 17.4.1 | Stage 1 Description |
The existing crusher will continue regular operations during Stage 1. It is expected that the crusher capacity can be increased to meet the 15-20% concentrate production increase required for Stage 1 without any expansion. Due to reported issues with ice lumps forming in the fine ore silo due to the cold weather conditions, lump breakers will be installed at the outlet of the silos ahead of the plant feed conveyor to ensure the quality of the plant feed.
The Stage 1 plant process flow is as follows:
| ● | Fine ore is fed from the fine ore silo to the grinding circuit via the plant feed conveyor. |
| ● | The existing grinding circuit consists of a rod mill and ball mill circuit with six stacksizers; three additional stacksizers are added to the circuit to improve the performance of the milling circuit. The combined rod mill and ball mill discharge reports to the stacksizers, and the oversize is returned to the ball mill. |
| ● | The stacksizer undersize is sent to a new primary desliming cyclone to remove slimes. The desliming cyclone targets a cut point (D50) of 10 µm. The overflow reports to the process thickener. |
| ● | The primary desliming cyclone underflow is sent to a new magnetic separation circuit which consists of two lines each including a low-intensity magnetic separator (LIMS) and a primary wet high-intensity magnetic separator (WHIMS). The intermediate non-magnetic product from both lines is combined and sent to parallel secondary WHIMS (existing, repurposed). The magnetics extracted by all stages are combined and pumped to the process thickener. |
| ● | The non-magnetic slurry from the secondary WHIMS is fed to a new secondary desliming cyclone to reach a solids concentration of 65% in the underflow. The cyclone overflow is returned to the primary desliming cyclone in Stage 1. The cyclone underflow reports to rougher conditioning. Conversion of the existing dilution tank into a new conditioning tank allows for a two-stage rougher conditioning when combined with the existing high-density rougher conditioning tank. The conditioned slurry is diluted and fed to the existing rougher flotation circuit. |
| ● | The rougher tails are further deslimed in a cyclone and conditioned before scavenger flotation. The scavenger dilution tank will be converted to conditioning duty to have a two-stage conditioning like the rougher circuit. The scavenger tails are sent to the flotation thickener. |
| ● | The concentrate from the rougher and scavenger circuits is combined and sent to cleaner 1 flotation. Cleaner flotation tails are sent to a new classifier cyclone with the underflow returned to the grinding circuit and the overflow sent to the flotation thickener. |
| ● | The cleaner concentrate is pumped to a new concentrate storage tank which serves as a buffer between the upstream process and the downstream dewatering and filtration. The new dewatering unit consists of a concentrate dewatering cyclone and a concentrate scavenger cyclone. The purpose of the scavenger cyclone is to recover misreporting material from the dewatering cyclone and vacuum filters. |
| Revision: 0 – 14-Aug-2026 B198-D01-02054-RT-0010 |
Page 183 |
| NAL Expansion FS Mineral Reserve Pre-Feasibility Study NI 43-101 Final Report Prepared for Elevra |
|
| ● | The new filtration unit consists of parallel vacuum belt filters (1 Duty/1 Standby). These filters are refurbished lithium carbonate filters that are existing in the plant. The spodumene concentrate is dewatered to a final moisture content of 6%. The existing filter unit will be bypassed by not dismantled. |
| ● | The final 5.4% spodumene concentrate is stored in a new enclosed stockpile in the location of the carbonate calciner which will be dismantled. The stockpile will have a capacity for ~200 hours in Stage 1 and have truck access for loading of the product. |
The processing plant will operate with new separate process water and flotation water circuits. This design will isolate water contaminated with flotation reagents from sensitive equipment such as the LIMS and WHIMS. The existing thickener will be bypassed but not dismantled.
The process water circuit consists of a single thickener receiving the following tails streams:
| ● | Slimes from primary desliming |
| ● | Magnetic material from magnetic separation (LIMS and WHIMS) |
The new flotation water circuit consists of a single thickener and receives the following tails streams:
| ● | Cyclone overflow from cleaner classification |
| ● | Scavenger flotation tailings |
| ● | Scavenger concentrate dewatering cyclone overflow |
The thickener underflow from both thickeners will be combined in a tank and pumped to the TSF through two parallel pipelines.
| 17.4.2 | Stage 2 Description |
The existing crusher will continue regular operations as during Stage 2. A temporary contract crusher will be added in Stage 2 to balance the requirements of the processing plant after the expansion to a milling throughput of 6,500 tpd. The contract crusher will feed the emergency ore stockpile.
The Stage 2 plant process flow is as follows:
| ● | A new grinding circuit with rod mill and ball mil is added in Stage 2. To feed the new circuit, the transfer conveyor from the emergency ore stockpile will be extended to feed a new line of conveyors. The second grinding circuit will be fed uniquely from the emergency stockpile until a permanent solution is installed in Stage 3. The feed from the fine ore silo for the existing line is unchanged. The total fine ore fed to the grinding circuit via conveyor will be at a total rate of 6,500 tpd by a combination of the existing crusher and a temporary contract crusher. |
| ● | The fine ore feed to the existing and new grinding circuits will be at a ratio of 50%/50% respectively. The new grinding circuit includes a larger ball mill than the existing one to provide the opportunity to further increase capacity in the future. The new grinding circuit will include six stacksizers. Should a future expansion be completed to reach a throughput of 200 tph in the new ball mill, additional stacksizers will be required. |
| ● | The stacksizer undersize from the two griding circuits is collected and screened through a new trash screen to remove product over 1 mm. The screen undersize is sent to the primary desliming cyclone to remove slimes as in Stage 1. The cyclone will be installed in Stage 1 but sized for the capacity of Stage 2. |
| ● | The primary deslime cyclone underflow is sent to the magnetic separation circuit as in Stage 1. A new third line of LIMS and primary WHIMS is added in Stage 2 for the increased capacity. The intermediate non-magnetic product from all three lines is combined and sent to two parallel |
| Revision: 0 – 14-Aug-2026 B198-D01-02054-RT-0010 |
Page 184 |
| NAL Expansion FS Mineral Reserve Pre-Feasibility Study NI 43-101 Final Report Prepared for Elevra |
|
secondary WHIMS as in Stage 1. The final non-magnetic slurry is collected and sent to the new rougher flotation circuit. The magnetics extracted by all stages are combined and pumped to the process thickener as in Stage 1.
| ● | The non-magnetic slurry is fed to a new secondary desliming cyclone to reach a solids concentration of 65 % in the underflow. The cyclone overflow is returned to the trash screen. The secondary deslime cyclone underflow is sent to new two-stage rougher conditioning tanks followed by a new rougher flotation circuit. The first step of rougher flotation consists of two cells in parallel and individual cell level control to ensure the effectiveness of the flotation. Tails from the first stage is sent to the second step of rougher flotation. The concentrate from both stage of rougher flotation are sent to cleaner 1 flotation. The design also allows for the first step of rougher flotation to bypass straight to cleaner 2 or cleaner 3. The tails from the new rougher flotation are sent to the scavenger unit. |
| ● | With the new rougher flotation circuit added in Stage 2, the Stage 1 rougher circuit, including secondary deslime cyclone, is converted to a scavenger flotation duty to increase scavenger capacity. Each scavenger flotation circuit is preceded by a scavenger cyclone and two-stage conditioning. This new scavenger unit will be configured with the converted scavenger circuit in series with the existing scavenger circuit. It will also be possible to bypass the first scavenger circuit or run the scavenger circuits in parallel if required. The scavenger cyclones overflows and scavenger cells tails are sent to the flotation thickener. The scavenger concentrate is returned to cleaner flotation. |
| ● | The remaining steps for the cleaner flotation, dewatering, and filtration are unchanged from Stage 1. Equipment added in Stage 1 are sized for the Stage 2 capacity. |
The storage area for the final 5.4% Li2O spodumene concentrate is unchanged from Stage 1. The process thickener circuit and the flotation thickener circuit are sized for the capacity of Stage 2 and are unchanged from Stage 1.
| 17.4.3 | Stage 3 Description |
In Stage 3, the existing crusher will be repurposed as a dedicated ore sorting facility once the new crusher is operational. This ore sorting unit will increase the operations’ flexibility, as well as simplify the design and reduce the capital cost of the new crusher facility. The existing secondary ore sorters will be replaced with XRT ore sorters, which use the density of the particles as opposed to the surface properties. The primary ore sorter will not be modified and will be maintained for processing of coarse ore. The sorted ore will be conveyed to a new sorted ore silo or transported to the ROM. Sorted ore will then be fed to the Stage 3 crusher ahead of the crusher screen.
Fresh ore from the ROM is discharged to the new Stage 3 crusher through a 90 mm aperture vibrating grizzly, with oversize feeding a jaw crusher. Primary crusher product will be conveyed to a double deck banana screen. The top deck oversize will be conveyed to the secondary cone crusher, and the bottom deck oversize material will be conveyed to the tertiary cone crusher. The crushed product will be conveyed back to the double deck screen for re-sizing. Crushed product underflowing the double deck screen will have a nominal size (F80) of <10.2 mm and will be conveyed to a new fine ore stockpile. Fine ore will be reclaimed from the ore stockpile and conveyed to the plant feed conveyors.
The processing plant is unchanged from Stage 2 as the required modifications to increase capacity to 6,500 tpd are completed for Stage 2.
| 17.5 | Production and Recoveries |
The NAL expansion project is scheduled to process an annual average rate of 6,500 tpd of blended ore. Based on a plant feed Li2O grade of 1.17%, the spodumene concentrate average annual production rate post-expansion is estimated at 373,000 tpa.
| Revision: 0 – 14-Aug-2026 B198-D01-02054-RT-0010 |
Page 185 |
| NAL Expansion FS Mineral Reserve Pre-Feasibility Study NI 43-101 Final Report Prepared for Elevra |
|
The existing crusher, ore sorting, new crusher and ore storage areas are designed to operate with an availability of 65%. The processing plant, including the milling, classification, desliming, magnetic separation, flotation and dewatering, is designed to operate at 90% availability. The processing plant will operate on a 24-hour per day and 7 days per week basis.
Metallurgical recovery is improved at the onset of the stage implementation and will achieve an estimate of 71.2 % average over the life of mine as disclosed in the previous study. This recovery is well supported by previous testwork as described in Chapter 13 – Mineral Processing and Metallurgical Testing.
The recovery benefits from the existing operation will come from the following flowsheet improvements:
| ● | Improved flotation feed sizing due to increased classification capacity and mill power. |
| ● | Improved magnetic separation circuit (LIMS and WHIMS) |
| ● | Improved flotation conditioning |
| ● | Improved rougher flotation control and flexibility |
| ● | Improved cleaner tails handling |
These improvements targeting specific areas will lead to recovery gradually increasing through the staged approach with the full benefits achieved by Stage 2 with all optimisations captured.
| 17.6 | Recommendations |
The process design proposed for the Mineral Reserves PFS is based on previous metallurgical studies, operating data from the existing plant, and experience acquired from work on similar spodumene projects across the world. The work completed should be further advanced during a detailed engineering phase to bring the engineering to a level suitable for construction.
The work described below is underway and will help confirm and support design parameters used in the Mineral Reserves PFS.
| ● | Plant trials on operating the existing WHIMS in parallel. These trials will help validate the increases in recovery assumed in the design. |
| ● | Flotation conditioning tests and lip surveys in the processing plant to increase understanding of the potential improvements and impact on downstream flotation, as well as understand the existing circuits limitations and potential bottlenecks to be addressed. |
| ● | Repeat surveys and simulations to assess the new flotation feed PSD and expected slimes generation. |
To further de-risk the project, the following test is recommended in addition to the planned testwork described above. This additional testwork program would be completed in the next phase of the project.
| ● | Optimisation testwork on the WHIMS to understand the limitations and set targets for plant operations. |
| Revision: 0 – 14-Aug-2026 B198-D01-02054-RT-0010 |
Page 186 |
| NAL Expansion FS Mineral Reserve Pre-Feasibility Study NI 43-101 Final Report Prepared for Elevra |
|
| 18 | Project Infrastructure |
This chapter describes the project infrastructure of the existing NAL operation and projected infrastructure required for expansion. This chapter contains information which was previously published by Sayona in a NI 43-101 Technical Report titled “Definitive Feasibility Study Report for the North American Lithium Project”, dated April 14th, 2023 (BBA, 2023).
Site infrastructure at the NAL operation is established and operating, currently including:
| ● | An open pit. |
| ● | A processing plant and a ROM ore pad. |
| ● | Waste rock and overburden storage areas (WR#2, WR#3 & OB#1). |
| ● | A conventional tailings storage facility (TSF-1). |
| ● | The administration facility, including offices and personnel changing area (dry rooms). |
| ● | Workshop, mechanical workshop, warehouse, and storage areas. |
| ● | Fuel, lube, and oil storage facility/equipment. |
| ● | Reticulated services, including power, lighting and communications, raw water and clean water for fire protection, process water and potable water, sewage collection, treatment, and disposal. |
| ● | A crushed ore dome. |
| ● | Access roads. |
| ● | Water management infrastructures. |
Additional infrastructure is required to the meet the requirements of the expansion design, which includes:
| ● | An expansion of the open pit and associated water management infrastructure. |
| ● | Pit sedimentation basin |
| ● | New crushing and ore sorting circuit including crushed ore dome. |
| ● | New grinding, magnetic separation and flotation. |
| ● | Concentrate dewatering filters and new concentrate storage and loading facility. |
| ● | Tailings thickeners. |
| ● | Additional mechanical workshop, operation room, and supervisor offices. |
| ● | Additional tailings management facilities and associated water management infrastructure: |
| – | TSF-2 (required for base case and expansion) |
| – | TSF-3 (required for base case and expansion) |
| ● | An additional waste stockpile area (WR#4) and associated water management infrastructure. |
| ● | Multi-service buildings: |
| – | Additional offices, engineering, administration etc. |
| – | Additional capacity for the mine change rooms, showers and ablutions. |
| – | Additional mine offices and mining dispatch control room. |
| ● | Mine maintenance shop: |
| – | Two additional mining service bays. |
| – | Additional warehouse storage. |
| Revision: 0 – 14-Aug-2026 B198-D01-02054-RT-0010 |
Page 187 |
| NAL Expansion FS Mineral Reserve Pre-Feasibility Study NI 43-101 Final Report Prepared for Elevra |
|
| – | Additional supervisory and administration offices. |
| – | Wash bay. |
| ● | Auxiliary buildings: |
| – | Warehouse domes. |
| – | Relocation of the mine fuel depot and additional capacity. (required for base case and expansion) |
Figure 18-1 shows the overall site layout and offers a general overhead view of existing and new infrastructure required to manage the process plant expansion, mine waste and impacted water. They represent the planned infrastructure at the end of the current life-of-mine plan.
| 18.1 | Access Roads |
| 18.1.1 | Public Roads |
The site can be accessed by existing public roads, Route 111, and Route du Lithium from the municipality of Barraute, 17.2 km away, via Chemin du Mont-Vidéo and Route du Lithium. From Route du Lithium, there are multiple small access roads that can lead into the pit area. These access roads have been blocked, and their access will be limited during blasting operations.
| 18.1.2 | Site Roads |
Existing roads connect the various site service buildings and provide passage for heavy trucks between the pit, the crusher, the waste rock dumps, and the truck maintenance shop.
| 18.1.3 | Security and Access Point |
Site access is through a guard/security house located at the entrance to the site on the main access road. The guard house is a prefabricated building with separate entrance and exit doors. Parking bays for trucks and visitors’ reception are provided next to the guard house.
| Revision: 0 – 14-Aug-2026 B198-D01-02054-RT-0010 |
Page 188 |
| NAL Expansion FS Mineral Reserve Pre-Feasibility Study NI 43-101 Final Report Prepared for Elevra |
|
|
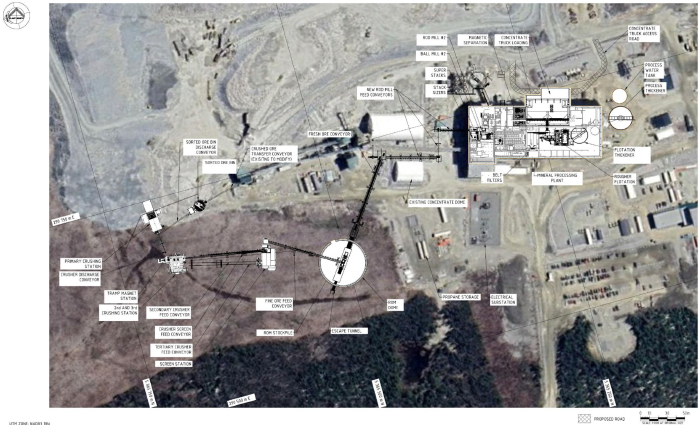
Figure 18-1: Preliminary Layout – Expansion
| Revision: 0 – 14-Aug-2026 B198-D01-02054-RT-0010 |
Page 189 |
| NAL Expansion FS Mineral Reserve Pre-Feasibility Study NI 43-101 Final Report Prepared for Elevra |
|
| 18.2 | Electrical Power Supply and Distribution |
| 18.2.1 | Site Electrical Utility Supply |
Power for the Project is taken at 120 kV from transmission line No. 1301, which is owned by the provincial utility company, Hydro Québec. This transmission line runs on the west side of the Project site and the spur feeding the plant is approximately 600 m long.
| 18.2.2 | Site Electrical Distribution |
The plant’s outdoor substation steps down the incoming voltage to 13.8 kV, which is used to power up the different transformers, all located indoors, further stepping down the voltage to 4.16 kV and 600 V, two voltage levels at which process equipment is operated. NAL is in the process of purchasing a new larger 120/13.8 kV transformer to meet future needs and improve reliability. The power distribution to the process equipment is through armoured cables installed in cable trays.
Power for the expansion project will be subject to an additional request. Stage 1 expansion falls within current contract limits whereas Stage 2 and 3 will require approval from the Ministère de l’Économie, de l’Innovation et de l’Énergie (MEIE) and studies by Hydro Québec. Coordination is currently underway to process the forecasted increase.
| 18.2.3 | Emergency Power Supply |
In the event of a power failure, emergency power for operating critical equipment is provided by a single 4.16 kV, 1,400 kW emergency stand-by generator. The generator is connected to the main 4.16 kV switchgear to back feed the 13.8 kV switchgear during emergency operations. This configuration allows emergency power to be routed to any load in the plant. All switching is done manually, with interlocks in place to prevent unsafe operations.
| 18.3 | Fuel Storage |
There are two fuel stations at the site:
| ● | A gasoline station near the garage with a 2,359 L capacity tank dedicated to light vehicles. |
| ● | A three-tank diesel station for heavy equipment located near the pit operations. The capacity of each tank is 50,000 L. |
As part of the expansion project, the current fuel storage facility will require re-location prior to mining activities in future phases. Cost for the relocation and expansion of the facility capacity has been allowed for in the Sustaining Capital.
| 18.4 | Natural Gas and Propane |
Propane tanks are in two areas on the site:
| ● | A station near the plant at the south side with two tanks of 2,000 L each. This station is used to heat a part of the plant. |
| ● | A station on the west side of the plant with two tanks of 50,000 L each. This station is used to heat a part of the plant. |
| Revision: 0 – 14-Aug-2026 B198-D01-02054-RT-0010 |
Page 190 |
| NAL Expansion FS Mineral Reserve Pre-Feasibility Study NI 43-101 Final Report Prepared for Elevra |
|
A 30 km natural gas line was built while the Project was under CLQ; natural gas can be supplied from local natural gas distributor Énergir’s Abitibi network. The line runs to the site, but the tie-in has not been done at this point. Previous discussions indicated the natural gas pipeline tie-in is possible with Énergir for an assured supply of 3,400 m3/h. This is the maximum that can be secured by the distribution system. Peak winter loads are expected to exceed the assured supply. Énergir has indicated that they are investigating ways to expand the network’s capacity.
Additional studies into possible pipeline supply of gas will be investigated in the next phase of project
| 18.5 | Water Supply |
| 18.5.1 | Water Reclaim System |
The Project has no infrastructure in place to draw water from any external source for processing purposes, and the expansion does not require the installation of water drawing infrastructure. Groundwater and run-off from the mine pit are recovered for use as fresh water in the process plant. All water used in the concentrator is recycled internally or is reclaimed from the tailings ponds, where levels must be managed seasonally.
To support the NAL expansion, a site-wide water balance was performed based on major infrastructure expansion footprint (see Figure 18-14). The water balance shows an excess of water on the overall site for all stages of development. To manage future water balance, infrastructure such as basins and drainage ditches has been incorporated into the expansion project.
| 18.5.2 | Water for Fire Protection |
Water for fire protection is currently stored in the lower section of the process water tank. Water pumps feed the process plant fire water ring main and also supply fire water hydrants at the mine garage and at the administration building. Exterior sections of the fire water piping are buried below the frost line to prevent freezing. Additional fire protection capacity is not envisaged for the expansion project.
| 18.5.3 | Potable Water |
Potable water is supplied by a contractor who is responsible for managing bottled water supplies. The potable water demand will be evaluated in the next phase of the project. The demand is expected to increase due to the increase in the number of employees at the site. Use of safety showers is also not currently possible due to the lack of a potable water system.
| 18.5.4 | Sewage and Waste |
A complete sewage water plant with two septic tanks (20 m3 and 10 m3) were installed at the west end of the main building in the summer of 2022. These units treat the wastewater from the concentrator, dry house, the main building, and the garage. The drain water is being discharged into a septic field. Sewage and waste capacity assessment will be undertaken in the next project phase. The current water treatment system is at the limit of its capacity; an increase in the number of employees would likely further strain the system.
| Revision: 0 – 14-Aug-2026 B198-D01-02054-RT-0010 |
Page 191 |
| NAL Expansion FS Mineral Reserve Pre-Feasibility Study NI 43-101 Final Report Prepared for Elevra |
|
| 18.6 | Tailings Storage Facility |
| 18.6.1 | Estimated Needs |
The current site includes a conventional tailings storage facility (TSF-1) as part of the tailings management infrastructure, located 500 m south of the processing plant. However, the mine plan for NAL forecasts mining operations continuing beyond the capacity of the existing Tailings Storage Facility (TSF) No. 1. Consequently, new mine waste and tailings facilities are planned to manage the additional waste streams coming from a larger mining operation.
Two tailings storage facility identified as TSF-2 and TSF-3 are required to accommodate the volumes associated with the recently published Mineral Resources and LOM plan.
Total mine waste to be managed by the expanded NAL site storage facilities is given by Table 18-1.
Table 18-1: Design Criteria Based on the Tailings Generation Rate
| Criterion | Value | Source |
| Tailings average dry density | 1.3 t/m3 | PEA mine plan |
| Tailings Production | 40.5 Mt (NAG tailings, non-leachable) | PEA mine plan |
| Mine waste production | 340,8 Mt (NAG waste rock, slightly leachable) | PEA mine plan |
| 18.6.2 | Project Overview |
| 18.6.2.1 | Existing TSF-1 |
TSF-1 is a conventional slurry tailings storage facility located approximately 500 m south of the processing plant. Golder Associates performed geotechnical and hydrologic engineering services for the design of the TSF-1 Phase 1C, including geotechnical foundation investigation programs, design of the peripheral dykes and ancillary hydraulic structures, and tailings deposition planning. Englobe Corp. has then been responsible for Phases 1D and 1E development.
TSF-1 comprises of a perimeter dyke with variable elevation along its length and raised in stages using the downstream method. Tailings deposition is carried out via a single spigot deposition point, with a reclaimed water system to manage TSF water levels seasonally.
TSF-1 was raised to an elevation of 415 m under Phase 1C works, achieving a total residue storage capacity of 1.8 Mt. Detailed engineering of Phase 1D is complete and includes a 3 m raise, increasing total capacity to 2.34 Mt. The final raise of the TSF-1 will use waste material for its construction. TSF-1 is ultimately planned for a total capacity of 2 Mt. With every raise the emergency spillway is adapted to safely convey the probable maximum flood. Peripheral ditches collect seepage water and convey them to water pond (380B, B01 and the polishing pond) where they are returned to the reclaim or safely discharge to the environment.
As well, the previous NAL operators included a secondary transformation process to make lithium carbonate, which generated additional residues, and is not part of current plans.
TSF-1 is expected to service the existing operation and early years of the LOM. Once its ultimate capacity is reached, tailings will be directed to TSF-2 and subsequently TSF-3, as described in the sections below.
Mine waste management forecasted facilities are shown on the expanded NAL site configuration in Figure 18-2.
| Revision: 0 – 14-Aug-2026 B198-D01-02054-RT-0010 |
Page 192 |
| NAL Expansion FS Mineral Reserve Pre-Feasibility Study NI 43-101 Final Report Prepared for Elevra |
|
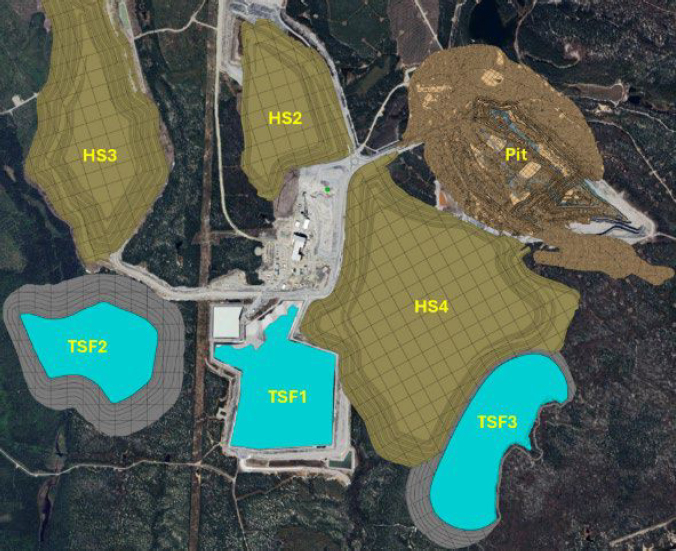
Figure 18-2: Plan view – Preliminary Mine Waste Storage Facilities Locations
| 18.6.2.2 | Planned Expansion Details: TSF-2 |
TSF-2 is a new tailings storage facility required in the short-term for the storage of LOM concentrator tailings. TSF-2 facility that can manage a total of 25.6 Mt of tailings produced at the concentrator and the possibility to use waste rock from the mine. The projected TSF-2 capacity is 25.6 Mt; for a LOM of 25.9 Mt over 14 years, TSF-2 is expected to be in operation for 14 years.
The conceptual design for TSF-2 consists of a compacted waste rock perimeter embankment constructed using a centreline method, with hydraulically deposited tailings forming a central pond. Tailings will be discharged from spigots along the crest to maintain a water pond and adequate beach length for embankment stability. The main reclaimed water pond will be managed by a barge-mounted pump system connected to the plant reclaim water system, which also provides storage for process water and the design flood.
The new facility will be located to the west of the current TSF-1 across the Hydro-Quebec corridor. The original selection of the proposed location has been defined as per the following steps:
| ● | Analysis of site characteristics based on aerial photos, LIDAR information, and regional land use information, which includes the identification of existing infrastructure such as electric lines, roads, forestry domains, and natural water bodies. |
| ● | Volumetric compliance for tailings and waste rock placement. |
| Revision: 0 – 14-Aug-2026 B198-D01-02054-RT-0010 |
Page 193 |
| NAL Expansion FS Mineral Reserve Pre-Feasibility Study NI 43-101 Final Report Prepared for Elevra |
|
| ● | Preliminary analysis of the environmental and social constraints of the selected deposition storage facility footprints. |
The size of the TSF water pond shall be controlled by a new pump system (e.g., barge-mounted pump station) as part of the new reclaimed water system. This new infrastructure envisioned an additional pond to store plant process water in winter (and possibly to contain the environmental design flood). The reclaimed water system must ensure reclaimed water supply to the concentrator plant and maintain sufficient volume and minimum water cover depth for tailings settling.
A new water management basin (B2 pond) will be located to the northeast of the facility. A total of three new pumping stations around TSF-2 are required over the life of the project for runoff water management: two at the south end (B3 and B4) and one at the north end of the facility (B1). For each pumping point, a surge pump basin has been designed. All pumped water will be transferred to TSF2 and then to the B2 basin. A treatment system primarily based on decantation, complemented by additional TSS control measures, will be implemented to allow environmentally compliant discharge of Basin B2 water. A spillway will be located on the west side of the TSF-2 along the lowest section of the Dam. The spillway will be gradually adapted as the dyke is raised.
The proposed layout of the TSF is presented in Figure 18-3. The TSF-2 is scheduled to begin operations in 2029.
| 18.6.2.3 | Planned Expansion Details: TSF-3 |
Later in NAL project lifetime, it is currently projected that following operation of TSF-2, a new tailings stream will be managed in a new TSF-3. TSF-3 is designed to store 18 Mt of tailings. TSF3 can accommodate the last 6 years of production from 2042 to 2047 (total production of 9.2 Mt of tailings). A preliminary location and conceptual design for TSF-3 have been undertaken for the purposes of the Pre-feasibility study. The proposed location for TSF-3 is located east of the existing TSF-1. The final location of the tailings is currently under review and will be confirmed through a detailed Variant Analysis. Figure 18-4 presents the proposed location of TSF-3 at the southern end of the mining property at the east side of TSF-1.
Similarly to TSF-2, the TSF-3 comprises a compacted waste rock peripheral dyke to contain the deposited tailings. The dyke will be built along a natural topographic high point minimise the embankment requirements. The dyke will be raised using the central raise method. Tailings will be discharged from a single discharge point regularly moved along the crest to maintain a central water pond and adequate beach length for embankment stability.
A spillway will be located at the south end of the peripheral dam and excavated in the natural ground to convey water to the stream located further south. Peripheral ditch will collect seepage water and convey it to a temporary pumping pond (Basin B5) located at the toe of the dam at a low topographic point. Once the waste rock stockpile #4 encroach on the pond it will be moved further south closer to the WR#4 sedimentation pond as shown in Figure 18-5.
| Revision: 0 – 14-Aug-2026 B198-D01-02054-RT-0010 |
Page 194 |
| NAL Expansion FS Mineral Reserve Pre-Feasibility Study NI 43-101 Final Report Prepared for Elevra |
|
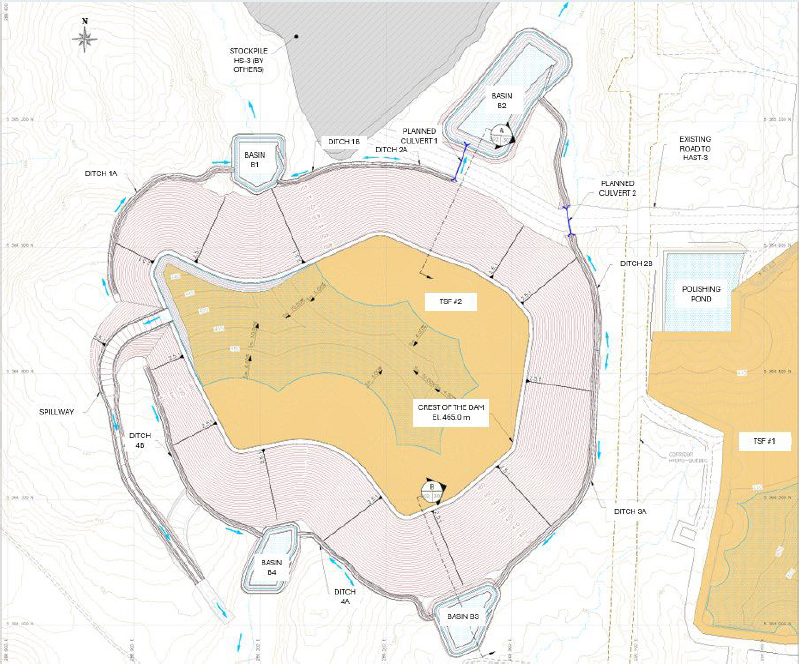
Figure 18-3: TSF-2 Final configuration Layout
| Revision: 0 – 14-Aug-2026 B198-D01-02054-RT-0010 |
Page 195 |
| NAL Expansion FS Mineral Reserve Pre-Feasibility Study NI 43-101 Final Report Prepared for Elevra |
|
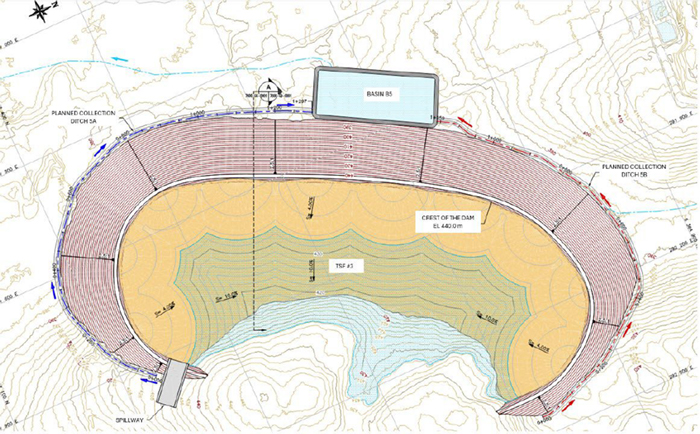
Figure 18-4: TSF-3 Final configuration Layout
| Revision: 0 – 14-Aug-2026 B198-D01-02054-RT-0010 |
Page 196 |
| NAL Expansion FS Mineral Reserve Pre-Feasibility Study NI 43-101 Final Report Prepared for Elevra |
|
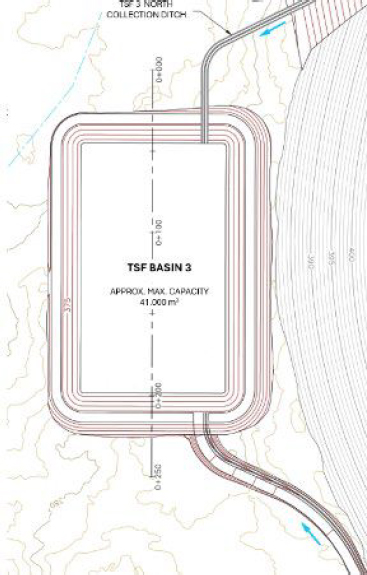
Figure 18-5: Revised location of Bassin B5 once WR#4 encroach on the Bassin B5
| 18.6.3 | Regulatory and Compliance Requirements |
The following standards and regulations were considered for the design of the new TSFs as well as all their related water management infrastructure:
| 1. | Québec’ Directive 019 sur l’industrie minière (MELCCFP, 2025). |
| 2. | Guidelines for preparing mine closure plans in Québec (MRNF, 2024). |
| 3. | The Dam Safety Act applied in Québec (LSB) and the associated regulation (RSB). |
| 4. | The Dam Safety Guidelines and Technical Bulletins produced by the Canadian Dam Association. |
| 5. | Metal and Diamond Mining Effluent Regulations (MDMER) in Canada. |
| 6. | Regulation respecting occupational health and safety in mines, Act respecting occupational health and safety – Québec (2014) (Québec Health and Safety Regulations). |
| 7. | The local, Québec and/or the Canadian Legal framework applied to the environment and water sectors. |
| Revision: 0 – 14-Aug-2026 B198-D01-02054-RT-0010 |
Page 197 |
| NAL Expansion FS Mineral Reserve Pre-Feasibility Study NI 43-101 Final Report Prepared for Elevra |
|
| 18.6.4 | Design Considerations |
| 18.6.4.1 | Tailings Material Characterization |
The most recent tailings geochemical characterisation completed at the end of 2017 and the beginning of 2018, showed that tailings from spodumene concentrate production are neither PAG, nor leachable. Whereas previous geochemical tests were relevant, their results are no longer representative of the tailings management approach going forward since the current plan is to produce only spodumene tailings (no lithium carbonate tailings). This would remain consistent, going forward; even if carbonate tailings are to be produced at some point, the NAL management strategy would be to keep such tailings separate from the spodumene tailings. Results from geochemical studies showed that NAL site waste rock is neither PAG, nor leachable; therefore, no special geochemical precautions for waste rock stockpiling and runoff water management.
| 18.6.4.2 | Subsurface investigation extent |
BBA Consulting has been mandated in 2022 and late 2025 to extensively investigate TSF-2’ footprint. In total, twenty-seven (27) boreholes, including fifteen (15) monitoring wells installations, and twenty-nine (29) tests-pit have been performed to describe and sample the projected infrastructure foundation. The stratigraphy of the TSF-2 site is relatively uniform. Generally, the overburden soil encountered is predominantly glacial till ranging from silty sand to sandy silt with some gravel, traces of clay, and presence of cobbles and boulders. The soil was generally moist to saturated and mainly grey in colour, with some soil having lighter and darker brown colours. Based on N-SPT indices computation and interpretation, early conclusion sates the glacial till shows no potential to liquefaction. The overburden soil is directly seating on the bedrock encountered at an average depth of 4.3 m. Additionally, completed and ongoing laboratory tests have been performed to characterize the glacial till rheology and mechanical behaviour in order to feed TSF-2 geotechnical and hydrotechnical design.
As TSF-3’s location is not confirmed yet, BBA Consulting investigation work has been limited in its footprint compiling one (1) borehole and four (4) tests-pit, complementary to a few early 2010’s boreholes performed in the same area. The stratigraphy of the TSF-3 differs from TSF-2’ site as the overburden soil encountered is predominantly a fluvioglacial deposit. The overburden soil is directly seating on the bedrock encountered at depths exceeding 30 m. If TSF-3’ footprint is eventually defined, additional geotechnical and hydrogeological investigation efforts will be necessary to support its engineering design.
| 18.6.4.3 | Embankment Configuration |
As mentioned in sections above, TSFs peripheral compacted waste rock dykes will be built following the centreline method with the characteristics presented in Table 18-2 and typical cross-section presented in Figure 18-6.
Dam design criteria include storage for the Environmental Design Flood (EDF) defined as a 1 in 1,000 years return hydrologic event (24-hour storm or 30-day spring freshet) with no discharge through a spillway. An emergency spillway will be installed in the future to safely pass the Inflow Design Flood (IDF) consisting of a routed Probable Maximum Flood (PMF) of 24-hour duration. The dams are designed for seismic events of 1:10,000 years (Maximum Credible Earthquake). Stability will be assessed by considering loading conditions and minimum factors of safety, as described in Directive 019. The Consequence Category if the Dam is considered “very high”. due to Potential Loss of Life. This classification may be revised once the Dam breach assessment is completed. Both TSF-2 and TSF-3 final configurations are summarized in Table 18-2.
| Revision: 0 – 14-Aug-2026 B198-D01-02054-RT-0010 |
Page 198 |
| NAL Expansion FS Mineral Reserve Pre-Feasibility Study NI 43-101 Final Report Prepared for Elevra |
|
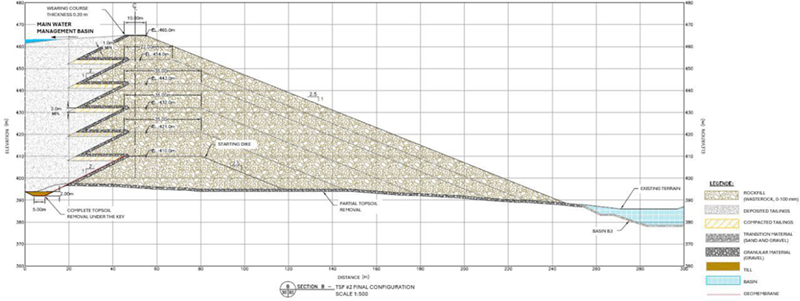
Figure 18-6: Typical Cross Section of Peripheral Embankment
| Revision: 0 – 14-Aug-2026 B198-D01-02054-RT-0010 |
Page 199 |
| NAL Expansion FS Mineral Reserve Pre-Feasibility Study NI 43-101 Final Report Prepared for Elevra |
|
Table 18-2: TSF-2 and TSF-3
| Item | TSF-2 | TSF-3 |
| Crest elevation | 465 m | 440 m |
| Downstream slope | 2.5H: 1V | Refer TSF-2 |
| Upstream slope | 2H: 1V | Refer TSF-2 |
| Impervious lining | Along the TSF perimeter at interface between tailings and starting dyke first bench | Refer TSF-2 |
| Dyke crest final width | 10 m | Refer TSF-2 |
| Tailings minimum freeboard in operation | 0,5 m | Refer TSF-2 |
| Water minimum freeboard in operation | 1 m | Refer TSF-2 |
| Access ramp maximum slope | 10% | Refer TSF-2 |
| Footprint | ~90 ha | ~111 ha |
| Maximum height | ±70 m | ±60 m |
| Bench height | 10 m | 10 m |
| 18.6.4.4 | Water Management |
The design criteria for the hydraulic deposition tailings storage facilities, as established in Directive 019, aim to ensure the environmental safety and long-term sustainability of the TSFs. In the context of NAL site, where the tailings are neither acid-generating nor leachable, the directive states that the containment structure must be designed to manage the design flood event without discharging water through the emergency spillway.
At all times, for any event equal to or less than the design flood, a freeboard of at least 1 m must be maintained. To ensure compliance with this requirement during exceptional weather events, the following must be met:
| ● | The design of the structures (based on minimum design flood recurrences of 1:1,000 years, 1:2,000 years or more, with allowances applied to account for climate change) must include an additional distance that allows the minimum required freeboard to be always maintained. |
| ● | The maximum operating level, meaning the highest level that the retained water can reach under normal operation of the structure, including seasonal fluctuations and peak periods, must be set and maintained as a precaution to ensure the minimum 1 m freeboard during exceptional weather events. |
To verify compliance with the Ministry’s requirements, the freeboard measured at the time of inspection must meet the maximum operating level.
The design flood must be determined by taking into account critical rainfall events with a recurrence interval of 1 in 1000 years, combined with the average snowmelt over a 30-day period, and considering the maximum expected snow accumulation with a recurrence interval of 1 in 100 years.
Regarding the drainage networks surrounding the tailings management infrastructure—including drainage ditches and pumping ponds—they must be sized to properly evacuate a 100-year flood (recurrence interval of 1 in 100 years), combined with the average snowmelt over a 30-day period and accounting for the snow accumulation expected from a 1 in 100-year event. An additional safety margin must also be applied to incorporate the effects of climate change in the design of the water management infrastructure.
As a result, the infrastructures developed for this phase of the project will have the following characteristics presented in Table 18-3.
| Revision: 0 – 14-Aug-2026 B198-D01-02054-RT-0010 |
Page 200 |
| NAL Expansion FS Mineral Reserve Pre-Feasibility Study NI 43-101 Final Report Prepared for Elevra |
|
Table 18-3: Design Criteria for TSFs Water Management
| Infrastructure | Parameter | Value |
| Main water management basin | Design return period (storm) | 1,000 years |
| Return period for spring snowmelt (30-day) | 100 years | |
| Minimum freeboard | 1.0 m | |
| Emergency spillway | Design return period | PMP (Probable Maximum Precipitation) |
|
Plant water pump basin |
Design return period | 100 years |
| Minimum freeboard | 0.3 m | |
| Impermeabilization (seepage control) | Geomembrane liner to prevent seepage to environment | |
|
Drainage ditches |
Design return period | 100 years |
| Cross-section profile | Trapezoidal | |
| Minimum freeboard | 0.3 m | |
| Slope protection / lining | Riprap (rock armouring) for slope protection; geomembrane for sealing | |
|
Surge pump basin |
Design return period | 100 years |
| Cross-section profile | Trapezoidal | |
| Minimum freeboard | 1 m | |
| Slope protection / lining | Riprap (rock armouring) for slope protection; geomembrane for sealing |
| 18.6.4.5 | Seepage mitigation and control |
Seepage mitigation measures have been included in the TSFs designs with the construction of a granular material drain extended to the whole dyke’s footprint above the natural foundation.
| 18.6.4.6 | Closure design |
NAL site’s tailings storage facilities are to remain in place after mine closure. Once the water quality of the tailings pond will be deemed suitable for discharge to the environment, runoff from the TSFs will be directed through the overflow spillway into the environment. The integrated reclamation strategy plans the backfilling and seeding of exposed tailings beaches with vegetal substrate and the construction of a gravity-driven ditches network towards the existing spillway.
| 18.6.4.7 | Monitoring |
The NAL site’s TSFs are to be implemented with an exhaustive monitoring system including instrumentation tracking dykes’ integrity, water table levels and discharges quality over time, from operation to closure. Such monitoring program will be developed accordingly to the best practices of the industry. Additionally, monitoring and periodic inspection programs for the mine waste management infrastructure, respectively during the operational, restoration, and post-restoration phases will be developed.
| 18.6.5 | Risk Assessment and Challenges |
The following table presents different technical challenges inherent to the proposed TSF design. These challenges need to be addressed prior the development of the following engineering phases.
Table 18-4: Technical Challenges of the Proposed TSF Design
| Category | Description |
|
Construction challenges
|
Some constructions challenges before placement of waste rock on the tailings beach (spigottes tailings). Following freshet and rainfall events the tailings will be saturated and may pose constraints when grading/compacting the tailings beach forming the foundation of the embankment. No specialized crew required. |
| Revision: 0 – 14-Aug-2026 B198-D01-02054-RT-0010 |
Page 201 |
| NAL Expansion FS Mineral Reserve Pre-Feasibility Study NI 43-101 Final Report Prepared for Elevra |
|
| Category | Description |
| Operational challenges |
Building the dyke in waste rock reduces slope erosion maintenance. However, deposition from the entire perimeter means more piping, hence more pipeline maintenance (no geomembrane is used in this option, so no liner-related issues). |
| Design challenges |
- Lack of any impermeable layer above the starting bench will increase seepage through the raises of the dyke. Detailed seepage analyses will be needed to support the water management strategy and demonstrate dyke stability. - Water management strategy is more complex. - Lab and field testing will be needed to determine tailings geotechnical and hydraulic parameters. - Specific investigation (piezocone) and tests to evaluate the expected compacted tailings beach bearing capacity and tailings’ liquefaction potential and detail dyke material mechanical behaviour will be required. - Presence of a groundwater discharge area feeding the network of stream in the footprint of the TSF. Foundation preparation consideration. |
| Environmental challenges |
Dusting from exposed tailings, low dust levels expected, thanks to the central location of the pond. High seepage rates increase risk of environmental contamination. Social acceptability considerations, since no geomembrane is present (the absence of a liner will need to be justified and proven acceptable during the permitting process). |
| Water management challenges |
Requires a barge-mounted pump station. An additional pond will be needed to store plant process water in winter (and possibly to contain the environmental design flood). There are constraints on maintaining sufficient volume and minimum water cover depth for tailings settling, and on maintaining a minimum beach length to ensure dyke stability. Higher seepage rates necessitate larger downstream water retention ponds and more powerful pumps. Increased monitoring of water levels will be required. Challenges in tailings deposition near the emergency spillway. |
| CAPEX (initial capital) (Cost) | No geomembrane to install. Requires construction of an additional pond to store plant water in winter (and potentially the environmental design flood). The site drainage network must accommodate a greater volume due to higher seepage rates. |
| OPEX (operational) (Cost) |
The process plant will need higher-capacity pumps due to the greater final height of the TSFs. Barge operation is more complex (as the pond is larger/deeper). Maintaining careful control of water levels and deposition is critical. Groundwater monitoring is critical given higher seepage and the risk of internal erosion. |
| SUSEX (raises capital) (Cost) | Moderate volume of waste rock to haul for raises. No geomembrane installation needed for raises (simpler construction), this option has the lowest sustaining capital needs overall). |
| 18.6.6 | Recommendations |
The following recommendations are presented to address current information gaps that might have a significant influence on the projects CAPEX/OPEX, and to inform further decision stages in the next engineering phases.
Table 18-5: Technical Recommendations and Further Actions
| Aspect | Recommendation |
| Tailings properties and deposition |
ONGOING – Undertake a targeted tailings investigation and test program (piezocone, large-strain consolidation, CRS/Rowe, cyclic/LIQ screening, hydraulic conductivity vs void ratio) to replace assumed input values and support liquefaction/deformation analyses flagged as required. |
|
Validate beach slope and in-situ density assumptions with site-specific trials (e.g., pilot spigoting, beach surveys) to support the “≤10 m below rock berm” operating premise and NAL nominal slopes/densities. |
|
| Geochemistry | ONGOING - Update geochemical characterisation for spodumene-only tailings (the report notes legacy, mixed-tailings work; spodumene-only needs its own program). |
| Undertake kinetic tests to inform closure Capex, and to include preventive actions during the operation phase that could influence the TSFs Opex. | |
| Stability analyses/monitoring and seismic inputs | ONGOING – Undertake stability analyses for the wet disposal configuration for both TSF-2 and TSF-3, covering all Directive-019 load cases and the pseudo static hazard basis. |
| Perform a Probabilistic Specific Hazard Assessment (PSHA) for NAL site in order to define representative seismic events and inputs to support TSFs detailed design. | |
| Develop a monitoring and surveillance plan. Design a monitoring network accordingly. The selected instrumentation (e.g., VWP) must be part of the CAPEX. | |
| Seepage and liners | Because the embankment concept has no geomembrane/impermeable layer, complete finite-element seepage modelling (transient and steady). The outcome will allow the assessment for internal drains/cutoffs as additional controls if needed to manage gradients and exit heads. |
| Revision: 0 – 14-Aug-2026 B198-D01-02054-RT-0010 |
Page 202 |
| NAL Expansion FS Mineral Reserve Pre-Feasibility Study NI 43-101 Final Report Prepared for Elevra |
|
| Aspect | Recommendation |
| Develop a groundwater monitoring plan and baseline model; the document highlights high seepage risk and the need for strong groundwater monitoring. | |
| Hydrology, pond and water balance |
Size the main basin/emergency spillway to 1:1,000-year storm and PMP respectively; confirm 100-year criteria for ditches/pump basins and implement the 18% climate change uplift noted. |
| Complete the water balance and winter storage pond sizing for process water and flood containment; integrate the three new pump stations and surge basins into the control philosophy. | |
| Produce a deposition plan that maintains a central pond and minimum beach length, with special rules near the emergency spillway (called out as an operational challenge). | |
| Hydraulic and mechanical systems | Finalise pump sizing (reclaim and decant barge systems) and pipeline routing; the concept notes higher head requirements and more complex barge operations with a larger/deeper pond. |
| Civil and constructability | Detail construction sequencing for centreline raises, granular material filters, and wet deposition interfaces (the report flags sequencing and rainy-day pond constraints near the upstream crest). |
| Verify foundation preparation scope and volumes (foundation stripping ~550,000 m² referenced) and confirm foundation stratigraphy given “no clayey soils identified”. | |
| Regulatory, risk and classification | Complete the CDA consequence classification and ensure alignment of design criteria and emergency planning with the outcome. |
| Engineering design review | Establishment of Independent Tailings Review Board (ITRB) for TSF infrastructure design operation and monitoring review. |
| Costing | Close the OPEX by modelling power, pump duty, barge ops, pipeline maintenance; carry groundwater monitoring costs explicitly, etc. |
| Revisit layout/volume optimisation in Detailed Design (the design reports notes optimisation potential) and test variant options (e.g., partial liners/under-drains) against seepage, CAPEX/OPEX, and permitting risk. |
| 18.7 | Quebec Lithium Tailings Storage Facility Retaining Structure |
The spodumene pegmatite deposit on the Québec Lithium property was mined between 1954 and 1965. At that time, the deposit was developed from a vertical shaft, and the mine tailings were contained within two dikes located north of the former mine, in an east–west-oriented valley between Lortie and Roy lakes. Waste rock was deposited around the perimeter of this storage area, thereby contributing to the containment and retention of the mine tailings.
Following the planned expansion of the current pit, the pit walls will intersect the Québec Lithium tailings storage facility (QL-TSF). As a result, a portion of the tailings currently in place will need to be excavated, leaving part of the remaining tailings without containment.
The proposed retaining structure at the QL-TSF is intended to ensure the stability of the overburden and tailing slope at this location. In addition, the structure will provide long-term containment and retention of the remaining tailings, thereby ensuring the continued integrity and safe management of the QL-TSF during and after pit expansion operations.
| 18.7.1 | Preliminary Geotechnical Design of the Retaining Structure for the Tailings Storage Facility (QL-TSF) at the Québec Lithium Tailings Management Area |
The proposed retaining structure at QL-TSF is located in the central portion of the tailings storage area, as shown in Figure 18-7.
| Revision: 0 – 14-Aug-2026 B198-D01-02054-RT-0010 |
Page 203 |
| NAL Expansion FS Mineral Reserve Pre-Feasibility Study NI 43-101 Final Report Prepared for Elevra |
|
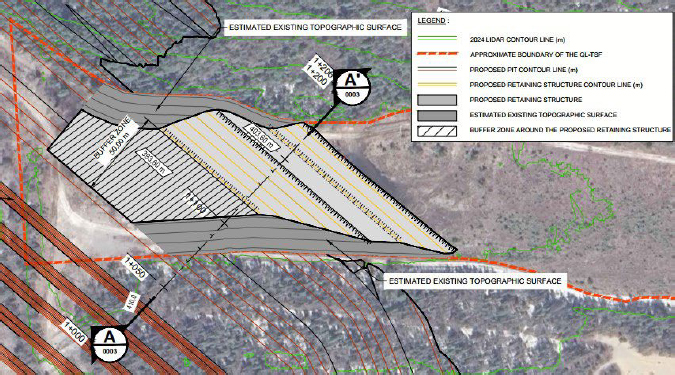
Figure 18-7: Plan View of the proposed Retaining Structure
A typical cross-section of the Lortie Lake dyke is shown in Figure 18-8. The proposed retaining structure features 1.0V:3.0H slopes and consists of 0–600 mm rockfill underlain by a 0–80 mm filter layer. A 50 m separation distance is maintained between the slope of the proposed pit and the toe of the retaining structure.
| 18.7.2 | Site Conditions |
The QL-TSF has been the subject of several geotechnical investigations conducted between 1995 and 2026. Geotechnical investigations at the QL-TSF identified layered subsurface conditions: a thin vegetation cover, mine waste rock encountered within the containment dikes, fill materials, a compressible peat layer (0.8–2.2 m), natural sand and silt deposits, a thin till layer, and bedrock at 23–36 m depth. Hydrogeologically, despite varying material hydraulic conductivities, groundwater data indicate a single aquifer system mainly controlled by fractured bedrock, allowing vertical water flow between layers.
| 18.7.2.1 | Assessment of Liquefaction Potential |
Liquefaction potential was assessed using simplified methods, indicating that certain layers of mine tailings, sand deposits, and silt deposits are considered susceptible to liquefaction. The estimated impacts include vertical settlements ranging from centimetres to decimetres and lateral displacements ranging from decimetres to metres in the vicinity of the planned pit. Given the conservative nature of these methods, a one-dimensional (1D) dynamic response analysis was also conducted to refine the assessment. The dynamic response analysis of the deposits demonstrated the absence of liquefaction potential at boreholes TF-01-26 and sCPT-01-26, located within the QL-TSF.
| Revision: 0 – 14-Aug-2026 B198-D01-02054-RT-0010 |
Page 204 |
| NAL Expansion FS Mineral Reserve Pre-Feasibility Study NI 43-101 Final Report Prepared for Elevra |
|
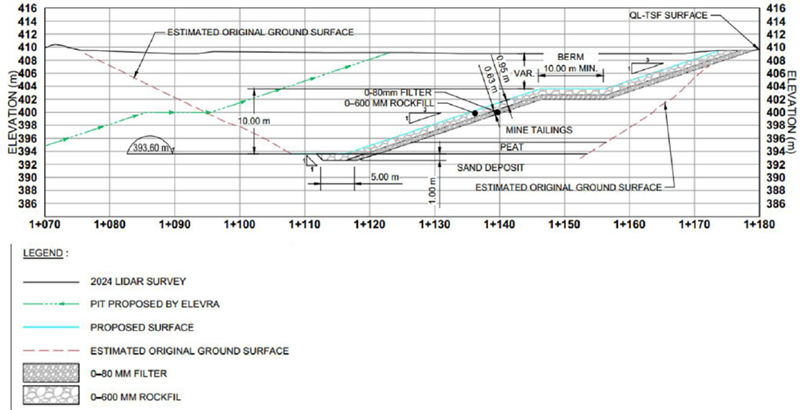
Figure 18-8: Typical Cross-Section AA’ of the Proposed Retaining Structure shown on Figure 18-7
| Revision: 0 – 14-Aug-2026 B198-D01-02054-RT-0010 |
Page 205 |
| NAL Expansion FS Mineral Reserve Pre-Feasibility Study NI 43-101 Final Report Prepared for Elevra |
|
| 18.7.3 | Stability and Settlement Analysis of the Proposed Retaining Structure |
Static and pseudo-static stability analyses of the proposed retaining structure were conducted as part of this study to validate the proposed design concept. The analyses were performed on Section AA’, shown in Figure 18-7.
| 18.7.3.1 | Stability |
The calculated factors of safety, presented in Table 18-6, exceed the minimum required values, thereby indicating satisfactory stability of the proposed retaining structure under the analyzed conditions.
Table 18-6: Results of the Stability Analyses for the Proposed Retaining Structure
| Analysis case | Slope Component | Factor of Safety | Minimum Required Factor of Safety |
| Long-term - Static | Benches | 1.7 - 2.1 | 1.3 |
| Long-term - Static | Overall slope | 2.1 | 1.5 |
| Short-term - Pseudo-static | Benches | 1.4 – 1.7 | 1.0 |
| Short-term - Pseudo-static | Overall slope | 1.6 | 1.1 |
| 18.7.3.2 | Settlements |
Given that the works will be carried out by excavation, no significant settlement associated with additional loading is anticipated. Consequently, no settlement analysis was performed as part of this study.
| 18.7.4 | Risks |
The required construction material quantities depend on the limits of the QL-TSF. At this stage, the undisturbed tailings profile has been estimated based on data obtained from boreholes as well as information presented in the PhD thesis Hydrogeochemical Behaviour of Mine Wastes from Spodumene Pegmatites (December 2023). It should be noted, however, that no borehole has directly defined or constrained the limits of the QL-TSF.
The tie-ins between the overburden slopes of the proposed retaining structure and the slopes of the planned pit located outside the tailings storage footprint should be subject to additional geotechnical verification, given the uncertainties associated with the topography and surface data provided by Elevra, particularly in areas of overburden cover and bedrock outcrops.
| 18.8 | Lortie Lake Dyke |
As part of the open pit expansion, the construction of a dyke at Lortie Lake is being considered to allow the extraction of mineral resources located beneath a portion of the waterbody. This dyke is intended to maintain the water level in the retained section of the lake, notably to limit impacts on fish habitat, while ensuring safe conditions for mining operations.
| 18.8.1 | Design of the Lortie Lake Dyke |
The dyke is located in the northern portion of Lortie Lake, north of the projected pit as shown on Figure 18-9.
| Revision: 0 – 14-Aug-2026 B198-D01-02054-RT-0010 |
Page 206 |
| NAL Expansion FS Mineral Reserve Pre-Feasibility Study NI 43-101 Final Report Prepared for Elevra |
|
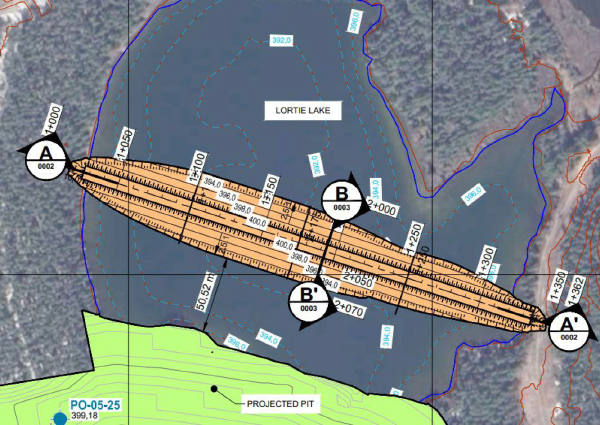
Figure 18-9: Plan view of the proposed Lortie Lake dyke
A typical cross-section of the Lortie Lake dyke is shown in Figure 18-10. Preliminary design criteria and assumptions, based on applicable Québec standards and project-specific requirements, were established to evaluate the feasibility of the proposed Lortie Lake dyke, including its geometry, construction materials, setback distance, and reservoir operating conditions. Key design parameters include upstream and downstream slopes of 2.5H:1V, a 9.0 m-wide crest at elevation 400.0 m, a minimum freeboard of 1.5 m, and a minimum setback distance of 50 m from the pit crest. The proposed dyke section comprises a low permeability till core, a sand filter, a fine rockfill transition zone, and a coarse rockfill shell.
| 18.8.2 | Sites Conditions |
The stratigraphic conditions in the Lortie Lake area are characterized by fine lacustrine sediments (primarily a clayey silt to clay deposit with organic matter) overlying a gravelly sand deposit, which in turn overlies a dense till deposit and bedrock at variable depths. The clayey silt to clay deposit, with an assumed thickness of approximately 2 m, has geotechnical and hydraulic properties that remain unknown at this stage. This material may significantly influence the performance of the dyke, particularly with respect to stability, settlements, and seepage conditions.
From a hydrogeological perspective, Lortie Lake behaves as a perched lake system. The lake water level is maintained above the regional groundwater table due to the low hydraulic conductivity of the lacustrine sediments. The underlying aquifer system is interpreted as a single regional aquifer primarily hosted within the fractured bedrock and characterized by relatively higher transmissivity.
| Revision: 0 – 14-Aug-2026 B198-D01-02054-RT-0010 |
Page 207 |
| NAL Expansion FS Mineral Reserve Pre-Feasibility Study NI 43-101 Final Report Prepared for Elevra |
|
|
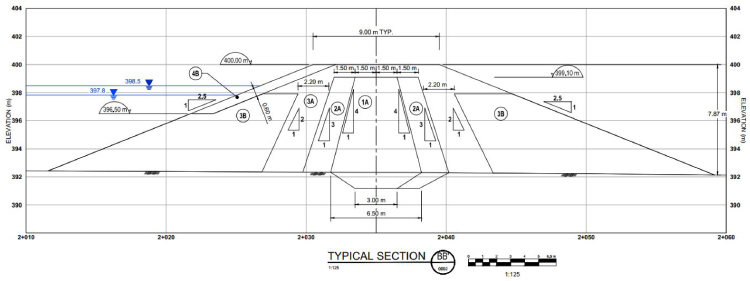
Figure 18-10: Typical section BB’ of the proposed dyke identified on Figure 18-9
| Revision: 0 – 14-Aug-2026 B198-D01-02054-RT-0010 |
Page 208 |
| NAL Expansion FS Mineral Reserve Pre-Feasibility Study NI 43-101 Final Report Prepared for Elevra |
|
| 18.8.3 | Stability and Settlement Analysis of the Lortie Lake Dyke |
Static and pseudo-static stability analyses, as well as settlement analyses, of the Lortie Lake dyke were conducted as part of this study to validate the proposed design concept. The analyses were performed on Section BB’, shown in Figure 18-10, identified as the most critical section of the Lortie Lake dyke.
| 18.8.3.1 | Stability |
The calculated factors of safety, presented in Table 18-7, exceed the minimum values recommended by the Canadian Dam Association (CDA), thereby indicating satisfactory stability of the proposed Lortie Lake dyke under the analyzed conditions.
Table 18-7: Results of the Stability Analyses of the Proposed Lortie Lake Dyke
| Analysis Case |
Loading Condition | Upstream Water Level (m) |
Direction | Factor of Safety (min. – max.) |
Minimum Required |
| Static | Short term (end of construction) | 392.0 / 398.5 | Upstream / Downstream | 1.4 – 1.9 | 1.3 |
| Static | Long term (permanent) | 398.5 | Upstream / Downstream | 1.9 | 1.5 |
| Pseudo-static | Short term (seismic loading) | 392.0 / 398.5 | Upstream / Downstream | 1.1 – 1.3 | 1.1 |
| 18.8.3.2 | Settlement |
The results indicate that maximum crest settlements could reach approximately 1 m at the end of construction. These settlements are primarily attributed to the presence of underlying compressible lacustrine sediments. However, these results remain preliminary due to uncertainties associated with the geotechnical properties of this deposit.
| 18.8.4 | Foundation Seepage Control |
The presence of a clayey silt to clay layer at the bottom of the lake makes Lortie Lake a perched lake, thereby limiting hydraulic exchanges with the underlying aquifer. However, since this layer has not yet been fully characterized, there is a risk that it could be disturbed during construction activities or mining operations. Disturbance of this layer could create a hydraulic connection between the lake and the underlying aquifer, potentially resulting in increased seepage through the foundation soils, the development of internal erosion mechanisms, or a lowering of the lake water level.
To mitigate these risks, foundation seepage control measures may be required. Potential solutions include the installation of an upstream impermeable blanket or the construction of a soil-bentonite cutoff trench. The selection of the appropriate solution will depend on actual conditions observed during additional investigations.
| 18.8.5 | Lortie Lake Emergency Spillway |
An emergency spillway will be constructed in the northeastern section of Lortie Lake to maintain the existing drainage pathway. The spillway is designed to convey the 24-hour PMF peak discharge of 9.9 m³/s from the identified watershed and prevent overtopping of the Lortie Lake dyke. The emergency spillway consists of two trapezoidal channels connecting Lortie Lake to the pond and the pond to the existing gravel road, as shown on Figure 18-11.
| Revision: 0 – 14-Aug-2026 B198-D01-02054-RT-0010 |
Page 209 |
| NAL Expansion FS Mineral Reserve Pre-Feasibility Study NI 43-101 Final Report Prepared for Elevra |
|
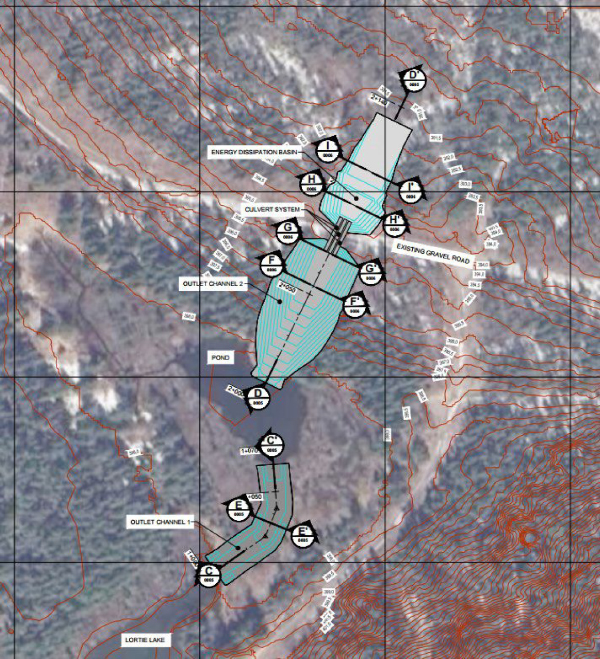
Figure 18-11: Plan View of the Lortie Lake Emergency Spillway
The channels are designed to operate under supercritical flow conditions immediately downstream of the lake and pond, ensuring that discharge is controlled by the upstream water levels and is not influenced by downstream conditions. The channels have base widths ranging from 6 m to 10 m, side slopes of 3H:1V, and are protected against erosion with geotextile and riprap lining. Culverts beneath the existing gravel road convey flow to an energy dissipation basin designed in accordance with established hydraulic engineering guidelines. The spillway alignment maintains the existing drainage pathway from Lortie Lake, allowing flood flows to re-enter the natural environment in a manner consistent with current conditions.
| Revision: 0 – 14-Aug-2026 B198-D01-02054-RT-0010 |
Page 210 |
| NAL Expansion FS Mineral Reserve Pre-Feasibility Study NI 43-101 Final Report Prepared for Elevra |
|
| 18.8.6 | Risks |
The principal risks associated with the design of the Lortie Lake dyke and recommended works are presented in Table 18-8.
Table 18-8: Risks associated with the Lortie Lake dyke and recommended works
| Potential Event | Effect of the Potential Event | Recommended Works |
| Presence of a clayey silt to clay deposit with unknown geotechnical properties and thickness. | Differential and excessive settlements; dyke instability. | Conduct additional geotechnical investigations, including drilling, in situ testing, and laboratory testing, to characterize the clayey silt to clay deposit and assess the foundation conditions beneath the lakebed. |
| Borrow materials unsuitable for construction of the low permeability core et filters. | Inability to meet required material properties, potentially requiring a change in the dyke design concept. | Characterize potential borrow-source materials through test pits, and laboratory testing. |
| Seepage through the dyke body. | Internal erosion of the core. | Design filters suitable for the low permeability core material based on establish engineering guidelines. |
| Hydraulic connection between Lortie Lake and the underlying aquifer. |
Seepage through foundation soils, potentially generating high hydraulic gradients and initiating internal erosion. The rate of lake water seepage into the foundation exceeds natural recharge, resulting in dewatering the remaining portion of Lortie Lake. |
Design appropriate foundation seepage control measures, where required. |
|
Erosion of the upstream slope due to wave action, ice loading, and wind. |
Damage to the upstream slope and loss of material, potentially leading to dyke instability. |
Design appropriate upstream slope protection, including riprap armouring and bedding/filter layers. |
| Vibrations generated by blasting operations associated with pit development. | Dyke deformation and instability. | Assess the effects of blasting-induced vibrations on dyke performance. |
| 18.9 | Site Water Management |
| 18.9.1 | Water Management Strategy |
The general water management strategy for the Project aims to:
| ● | Divert off-site, all non-contact water from non-perturbed areas surrounding the site. |
| ● | Manage by draining, conveying, and containing surface infrastructure runoff from the mill and waste (tailings and waste rock) management areas as well as underground water. |
| ● | Recycle a maximum of the mine site water from runoff, process, and groundwater for water supply purposes. |
| ● | For Total Suspended Solids sedimentation, retain water in ponds prior to treatment for release to the environment. |
| ● | Treat all contaminated water before releasing it to the environment. |
The Water Management Plan (WMP) address the management of runoff water which has been in contact with the mine site as well as the clean water which flows through the Project site. The WMP update includes the tailings and waste rock storage facilities runoff water, which represents a major addition in impacted surface area to the Project. Runoff water and underground water from the open pit are also collected.
In preparing the WMP, priority was given to minimizing the impacted areas that generate contact water, to reduce the water volumes to be managed. On the other hand, reclaim of contact water is prioritized to maximize its re-utilization. Particular consideration was given to water management
| Revision: 0 – 14-Aug-2026 B198-D01-02054-RT-0010 |
Page 211 |
| NAL Expansion FS Mineral Reserve Pre-Feasibility Study NI 43-101 Final Report Prepared for Elevra |
|
based on watersheds. The WMP mitigates the volume of contact water inflows to be managed on-site by diverting clean water to the environment.
The WMP was updated to manage flows from the expansion scenario.
| 18.9.2 | Basins and Ditches Design Criteria |
The minimal design criteria applying to the ditches of TSF and WR are based on a design rainfall of a 100-year recurrence as per Directive 019. To prevent environmental impacts associated with mine tailing’s accumulation areas, strict water management is required in accordance with Directive 019. All runoff and seepage water generated by these facilities must be collected through a drainage network designed to direct the water to treatment ponds or monitoring stations prior to any discharge into the environment.
This drainage network must be sized to withstand extreme hydrological events, including a 100-year flood combined with the average snowmelt over a 30-day period, while accounting for future climate scenarios. Ditches, conduits, and pumping basins must be engineered to meet this capacity. When accumulation areas pose a risk of groundwater contamination, protective measures must be implemented. These include hydrogeological studies, sealing systems or leachate collection systems, as well as groundwater monitoring and surveillance programs.
Finally, water management infrastructure must be designed with long-term climate projections in mind, including increased precipitation, more frequent flooding, permafrost thaw, and prolonged droughts. Post-closure and post-restoration monitoring programs must also be established to ensure the long-term integrity of the structures and the protection of water quality. For water management basins where retaining structures are considered, an emergency spillway and exit channel must be able to safely discharge the most severe flooding event. This is the probable Maximum Flood (PMF) as specified in Directive 019. Furthermore, freeboard requirements are as stipulated by Directive 019 (section 2.9.3.1) and the CDA guidelines.
| 18.9.3 | Sediment Basins |
Based on the design criteria and the water management approach previously described, the environmental design flood was established. The volume entering the basins was estimated considering summer and spring rainfall combined with snowmelt (over a 30-day period), with a coefficient of 18% to incorporate the effects of climate change. Summer rainfall, having generated higher volumes, was therefore used to calculate the volume of the pumping basins. Basin volumes will be attained partially through excavation and partially through the construction of dams.
| 18.9.3.1 | Waste Rock Storage 4 Sedimentation basin |
A sedimentation basin is required to manage contact runoff from Waste Rock Pile WR#4. The WR#4 sedimentation basin will be located at the south end of WR#4, where it can receive runoff from the contributing catchment. The basin will be formed partially in excavation and partially by a low earth dam constructed downstream of the excavation. Locally, surface runoff will drain naturally toward the basin due to the existing topography, and a perimeter collection ditch will be constructed as needed to intercept and convey contact water to the pond. Sedimentation ponds are widely used in mining to capture runoff, promote settling of suspended solids, and control suspended sediment discharge to the environment.
Water collected in the WR#4 sedimentation basin will be discharged to the environment once it meets applicable water quality criteria or pumped back to the process plant where needed. The conceptual design of the WR#4 sedimentation basin is shown on Figure 18-12. Sediment removal and pond maintenance will be planned so that adequate live storage and freeboard are maintained throughout operations, consistent with typical sedimentation pond design guidance for mine drainage
| Revision: 0 – 14-Aug-2026 B198-D01-02054-RT-0010 |
Page 212 |
| NAL Expansion FS Mineral Reserve Pre-Feasibility Study NI 43-101 Final Report Prepared for Elevra |
|
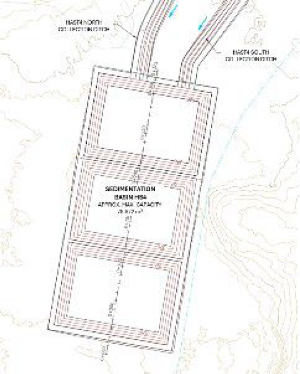
Figure 18-12: Sedimentation basin WR#4
| 18.9.3.2 | Pit Sedimentation Pond |
A second sedimentation basin will be constructed north of the site, adjacent to the open pit, to receive water pumped from the pit starting at Stage 5 of pit development. This basin will provide retention time for suspended solids to settle prior to discharge, in line with common practice for pit dewatering management at mine sites. Similar to the WR#4 basin, water accumulated in the pit dewatering sedimentation basin will be discharged to the environment once monitoring confirms that water quality meets prescribed criteria or returned to the process plant. The location and conceptual design of the pit dewatering sedimentation pond are shown on Figure 18-13.
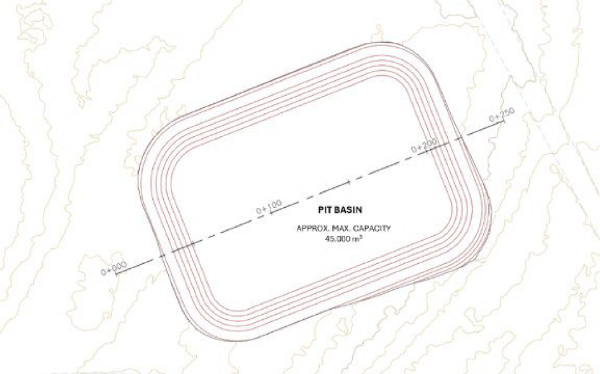
Figure 18-13: Conceptual design of the Pit Sedimentation basin
| Revision: 0 – 14-Aug-2026 B198-D01-02054-RT-0010 |
Page 213 |
| NAL Expansion FS Mineral Reserve Pre-Feasibility Study NI 43-101 Final Report Prepared for Elevra |
|
| 18.9.4 | Wastewater Treatment |
All solid waste coming from the NAL mine and mill are considered to be non-acid generating and non-leaching. As such, a conventional sedimentation and physical-chemical treatment approach can be considered for the treatment of TSS. A water treatment facility may be required for this Project depending upon the availability of spare capacity of the reverse-osmosis treatment system that is currently installed.
Basins have been designed as a sedimentation basin for water management around HS. As such, no additional treatment has been planned. However, in the event that the water quality does not meet the required effluent criteria, additional water treatment infrastructure would be required.
A flow diagram of the current operating conditions at the NAL facility is shown in Figure 18-14. A flow diagram of the projected operating conditions is shown in Figure 18-15.
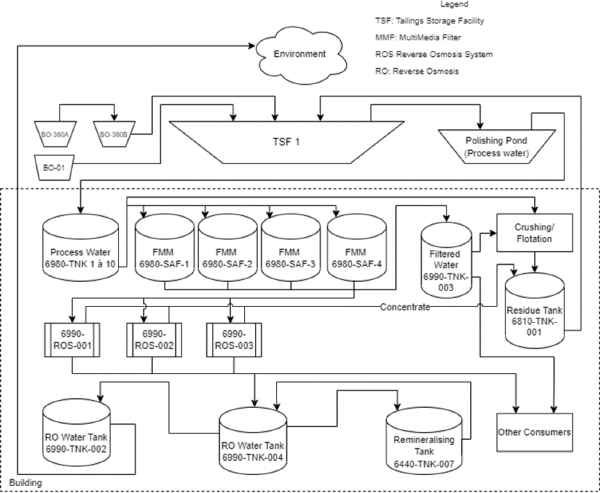
Figure 18-14: Flow Diagram at NAL Facility – Current Operating Conditions
| Revision: 0 – 14-Aug-2026 B198-D01-02054-RT-0010 |
Page 214 |
| NAL Expansion FS Mineral Reserve Pre-Feasibility Study NI 43-101 Final Report Prepared for Elevra |
|
|
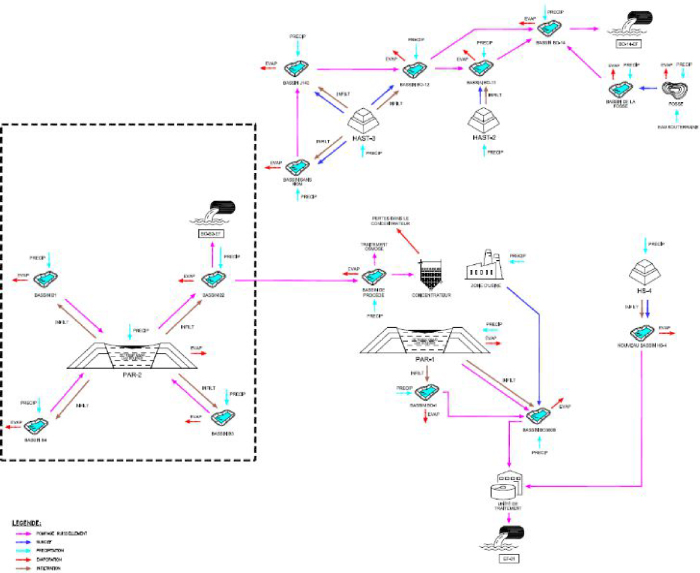
Figure 18-15: Flow Diagram at NAL Site - Projected Operating Conditions
| Revision: 0 – 14-Aug-2026 B198-D01-02054-RT-0010 |
Page 215 |
| NAL Expansion FS Mineral Reserve Pre-Feasibility Study NI 43-101 Final Report Prepared for Elevra |
|
| 18.9.5 | Uncertainties |
The existing water treatment capacity (Reverse Osmosis) could be limited given the needs of the new infrastructure; it was assumed that TSS is the only potential contaminant. If the settlement capacities of new basins are not appropriate for finer TSS or for additional contaminants, use of additives to enhance the settlement or use of auxiliary treatment units will be used. Since 2024, exfiltration of ferrous water coming from OBP-1 is treated through flocculation with satisfactory results.
| 18.10 | On-Site Buildings |
| 18.10.1 | Non-Mineral Waste Management |
General, green, and regulated waste is sorted, stored, and disposed of according to the regulations and good practices. Bins are labelled for sorting. Two categories are defined: hazardous waste and non-hazardous waste.
For the non-hazardous waste, recyclable materials are collected and sent to a subcontractor for recycling, while non-recyclable materials are sent to the landfill site.
All categories of hazardous waste are collected by a licensed contractor and managed according to the regulations.
| 18.10.2 | Explosives Magazines |
Two explosives’ magazines are managed on-site by the explosive’s provider. The first is the cap magazine that houses priming explosives such as detonators, and the second explosive magazine will contain boosters and pre-shear explosives.
The magazines are strategically located in a fenced and gated area just outside of the mine site.
| 18.10.3 | Administration Office |
The administration building accommodates senior staff, including the general manager, human resources, health and safety, environment, geology, mining, procurement, and accounting, but excludes process plant personnel. In addition to the offices, the prefabricated wood frame building includes facilities such as lunchrooms, toilets, print rooms, conference rooms, etc. All workstations are provided with basic furnishings, internet, and telephone connections. Potable water is supplied to the kitchen and drinking fountains. Power outlets are provided in all rooms.
Additional administrative office space has been allowed for the expansion case.
| 18.10.4 | Mine Workshop |
The mine workshop is attached to the administration building and is a prefabricated structure, constructed of light steel, that was brought to site and erected. The garage has two service bays and a warehouse area, all of which are currently used by the mining contractor.
The mining workshop requires two additional service bays to accommodate the expansion fleet accounting for current utilisation.
| Revision: 0 – 14-Aug-2026 B198-D01-02054-RT-0010 |
Page 216 |
| NAL Expansion FS Mineral Reserve Pre-Feasibility Study NI 43-101 Final Report Prepared for Elevra |
|
| 18.10.5 | Process Plant Building |
The process plant building is a steel structured building with aluminium siding with an approximate surface area of just under 8,000 m2. The building, which has a height of about 26 m, houses the concentrator, including ball mill and rod mill, ore sorters, flotation, and WHIMS. There are dedicated areas for offices, a control room, and electrical room, as well as the analytical laboratory. The building has some overhead cranes for service and maintenance.
The southern area of the process plant building currently houses the legacy carbonates plant. The carbonates plant area will be repurposed for the expansion converting the existing filters for re-purposed concentrate filters, concentrate shed, and flotation extension.
| 18.10.6 | Assay Lab |
The plant laboratories, metallurgical and analytical, are located inside the concentrator building. The metallurgical lab is fully equipped to operate bench scale flotation tests. The analytical laboratory is split into three sections, comprising a sample preparation room, a wet lab, and an instrument lab.
The analytical laboratory includes sample preparation equipment and analytical equipment, including ICP-EOS and Flame AA for elemental analyses. The analytical lab treats geological, grade control, and plant metallurgical samples.
NAL owns the laboratories and all installed equipment. NAL sub-contracts the operation of the analytical lab to a specialized and certified contractor.
The current laboratories are located next to the milling area in the concentrator building. The laboratories will be relocated to the carbonate plant area before Stage 2 to provide the required space for an additional ball mill with the expansion of plant capacity.
| 18.11 | Communications |
On-site communications consist of interconnected, pole-mounted fibre optic cables linking the various infrastructure buildings. The plant is equipped with communication fire wall protection, Ethernet switches and telephone server, Internet web server for the personnel’s computer network, and a camera server for monitoring the plant and operations.
Additional fibre optic infrastructure is assessed as part of the expansion.
| Revision: 0 – 14-Aug-2026 B198-D01-02054-RT-0010 |
Page 217 |
| NAL Expansion FS Mineral Reserve Pre-Feasibility Study NI 43-101 Final Report Prepared for Elevra |
|
| 19 | Market Studies and Contracts |
Portions of this chapter have been adapted from the “Lithium Forecast Report” study prepared by Benchmark Minerals for Sayona dated Q1, 2026 (Benchmark Minerals, 2026). The author believes that the information in this study is relevant for the Mineral Reserves PFS report.
In the short-term, prices for 6% spodumene concentrate (SC6) are forecast to fluctuate between US$2,181 (2026) and US$1,260 (2031), with an average price of US$1,664 per tonne realized up to 2032. The long-term price after 2035 is US$2,430/t.
Forecast lithium product sale prices are shown in Table 19-1.
Table 19-1: Forecast Sale Prices (USD/t, real 2025)
| Product | Lithium Carbonate | Lithium Hydroxide | Spodumene Concentrate (6%) |
| Incoterm | CIF Asia | CIF Asia | FOB Australia |
| 2026 | 18,893 | 18,048 | 2,181 |
| 2027 | 16,500 | 16,000 | 1,838 |
| 2028 | 14,500 | 14,000 | 1,500 |
| 2029 | 15,500 | 15,000 | 1,670 |
| 2030 | 13,500 | 13,000 | 1,400 |
| 2031 | 13,000 | 12,500 | 1,260 |
| 2032 | 17,000 | 16,500 | 1,800 |
| 2033 | 19,000 | 18,500 | 2,040 |
| 2034 | 20,500 | 20,000 | 2,230 |
| 2035 | 21,000 | 20,500 | 2,300 |
| 2036 | 22,000 | 21,500 | 2,430 |
| 2037 | 22,000 | 21,500 | 2,430 |
| 2038 | 22,000 | 21,500 | 2,430 |
| 2039 | 22,000 | 21,500 | 2,430 |
| 2040 | 22,000 | 21,500 | 2,430 |
The Mineral Reserves PFS utilises the forecast sale prices shown in Table 19-1. An SC6 price of US$2,430 has been adopted for years past the 2040 forecast period.
| 19.1 | Market Balance |
Global lithium supply is expected to increase materially in 2026, despite the pricing pressure seen through much of 2025. Supply is forecast to rise by around 250 kt LCE year-on-year, or approximately 15%, including recycling.
China will provide most of the growth, adding ~46kt LCE, whilst African-based projects will add an extra 89kt LCE. Australia and South America will add ~40kt together in 2026 as several projects progress through commissioning and scaling phases.
Despite strong supply growth, the market is still expected to remain in deficit in 2026, as robust demand growth — particularly from electric vehicles and energy storage systems — continues to outpace new supply. By 2027, the surplus remains modest at less than 1% of total market size, pointing to a market that is close to balance.
As a result, prices are forecast to experience upward pressure over 2026 and 2027. Figure 19-1 shows the market balance forecast between 2027 and 2040.
| Revision: 0 – 14-Aug-2026 B198-D01-02054-RT-0010 |
Page 218 |
| NAL Expansion FS Mineral Reserve Pre-Feasibility Study NI 43-101 Final Report Prepared for Elevra |
|
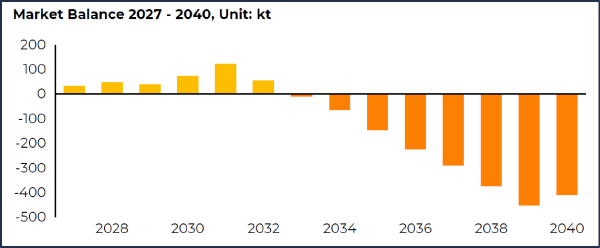
Figure 19-1: Lithium Market Balance Forecast 2027 – 2040
| 19.2 | Demand Forecast |
Overall, demand is projected to grow at 7.1% Compound Annual Growth Rate (CAGR) from 2025 to 2040 under BMI’s base case scenario. In the near term, lithium demand rises from 1,610kt LCE in 2025 to 1,885kt LCE in 2026 and 2,096 kt LCE in 2027, representing an increase of 17% and 11% year-on-year respectively.
The short-term lithium demand outlook remains constructive, with growth increasingly supported by electric vehicles (as the dominant demand base) and energy storage systems as the fastest-rising source of new demand. Portable devices and industrial applications remain comparatively stable but make only limited contributions to overall growth, reinforcing the increasingly central role of battery-driven demand.
Energy storage systems are emerging as the fastest-growing segment and the secondary driver of lithium demand. After a standout year of deployment growth, ESS makes an increasingly meaningful contribution to incremental demand, reflecting strong project pipelines, improving system economics and wider adoption across grid and behind-the-meter applications.
China remains the largest contributor to incremental demand, supported by strong EV adoption, battery manufacturing and energy storage system deployment. Europe remains the second most important growth market in the near term, while North America’s contribution becomes more meaningful from 2027 onwards as electric vehicle and battery supply chains improve.
| 19.3 | Supply Forecast |
From 2025 to 2026, supply is forecast to increase by 260kt LCE (+15% year-on-year), with the largest increase coming from Africa, which is forecast to contribute 107kt LCE (+35%) to global supply growth in 2026.
Australian production will improve in 2026 driven by several projects including Greenbushes’ new CGP3 plant and Pilgangoora’s return to full capacity. China’s forecast growth in 2026 will come from Zijin’s new Xiangyuan and Lakkor Tso mica and brine projects.
South American lithium supply is projected to grow by around 22kt, or 5%, in 2026 with Argentina is expected to account for the majority of this increase followed by Chile and Brazil. Most of the
| Revision: 0 – 14-Aug-2026 B198-D01-02054-RT-0010 |
Page 219 |
| NAL Expansion FS Mineral Reserve Pre-Feasibility Study NI 43-101 Final Report Prepared for Elevra |
|
additional output will come from existing operations that are currently ramping up or undergoing an expansion phase.
From a long-term perspective, global supply is forecast to grow at CAGR of 9% over the next decade with all the current major producing regions seeing a reduction in their market shares. Recycling is expected to assume a more prominent position as significant end-of-life stock becomes available through the end of the decade.
North America and Europe, particularly through North American unconventional clay and DLE sources, will quintuple their share relative to 2026, combining for 10% of the world’s output.
| 19.4 | Product Pricing |
Over the next seven years, prices for 6% spodumene concentrate are forecast to fluctuate between US$2,181 (2026) and US$1,280 (2031), with an average price of US$1,664 per tonne realized. Historical sale prices (2015-2025) as well as forecast lithium product sale prices are shown in Figure 19-2. The average sale price of 6% spodumene concentrate in the BMI analysis averages approximately US$2,025 between 2026 and 2040. The long-term price after 2034 is US$2,430/t.
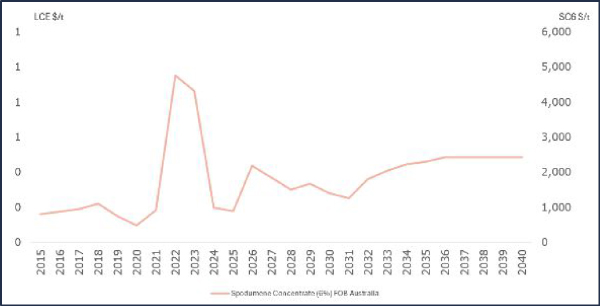
Figure 19-2: Lithium Product Price Actuals and Forecast 2026 – 2040
| 19.5 | Contract Sales |
Through the merger consolidation of Sayona and Piedmont into Elevra, the offtake agreement between Sayona and Piedmont has been unwound. The underlying offtake agreements with Tesla and LG Chem remain intact. The contracts with Tesla for 125 kt over 3 years (refer to PLL ASX release 4 January 2023) and LG Chem for 200 kt over 4 years (refer to PLL ASX release 16 February 2023) remain in place. Further, Elevra also has an agreement with Mitsubishi for a total of 100 kt per year (including base volume and mutual options) over the 2025 to 2028 calendar years.
| Revision: 0 – 14-Aug-2026 B198-D01-02054-RT-0010 |
Page 220 |
| NAL Expansion FS Mineral Reserve Pre-Feasibility Study NI 43-101 Final Report Prepared for Elevra |
|
| 19.6 | Packaging and Transportation |
Spodumene concentrate is bulked transported by truck from the NAL Property to a rail transport boarding facility in Val-d’Or where concentrate is transferred into mineral covered railcar gondolas and then shipped on CN’s mainline to the Québec City port.
| 19.7 | Risks and Uncertainties |
As shown by the actual values realised historically in Figure 19-2, the lithium market is extremely volatile and is expected to remain volatile in the near future.
| Revision: 0 – 14-Aug-2026 B198-D01-02054-RT-0010 |
Page 221 |
| NAL Expansion FS Mineral Reserve Pre-Feasibility Study NI 43-101 Final Report Prepared for Elevra |
|
| 20 | Environmental Studies, Permitting and Social or Community Impact |
This chapter describes the environmental, permitting, social and community aspects of the existing NAL operation and any additional considerations required for expansion project.
This Chapter is intended to provide all relevant information regarding environmental studies, permitting and social community impact for NAL’s expansion projects. The expansion projects are to proceed in stages in order to reflect the permitting requirements for each stage
| 1. | Permitting Stage 1.0 – reaching a 15-20% increase in the plant’s capacity under the limit of 4,500 tpd, to be carried out in accordance with current regulations. This precedes Permitting Stage 2. |
| 2. | Permitting Stage 2.0 – increasing the plant’s capacity to 6,500 tpd (‘’Milling capacity’’). This includes infrastructure for Tailings Storage Facility TSF no.2. |
| 3. | Permitting Stage 3.0 – expansion of the mine pit for Phases 6 through 8. (‘’Pit expansion’’). This includes tailings Storage facility TSF no. 3 and Waste Rock Pile HS no.4 |
NAL has already committed to delivering a complete Environmental, Social Impact Assessment for its Permitting Stage 3.0 and has proceeded since 2025 with multiple environmental, social, hydrogeological and geotechnical studies to support permitting efforts of its expansion project.
| 20.1 | Summary |
| 20.1.1 | Permitting Stage 1.0 - Current Activities |
Since the restart of operation in 2023, the site is staffed with a complete environmental team that ensures compliance with regulatory procedures and monitors social environmental activities at the site. The NAL project has existing environmental permits for mining operations including the disposal of waste rock, storage of tailings, water supply from open pit and tailings and final release of treated water to the environment. Elevra is currently operating in accordance with existing approvals and permits received from both provincial and federal authorities. Current activities are in the process of ramping up towards an increased annual throughput of 4500 tpd for the concentrator while the mine is authorized to extract 5,100 tons per day since approval of Phase 4.
| 20.1.2 | Permitting Stage 2.0 - Milling Capacity Increase |
Regarding the plant’s capacity expansion, the project will be submitted in three main phases to the government authorities for permitting based on the addition of various equipment. It should be noted that the plant capacity expansion to 6500tpd will be made within the current building’s footprint. The Government of Quebec guidelines regarding permitting requirements for capacity increase are subject to the standard authorization process under Section 22 of the Environment Quality Act, as long as the plant’s capacity increase does not exceed 50% and is limited to 6,500 tons per day. Regarding federal authorities, Elevra has also received confirmation that the increase in the plant’s capacity is not subject to the environmental assessment process under the Physical Activities Regulations (SOR/2019-285), provided that the total infrastructure, including the plant’s capacity, remains within a 50% increase.
Permitting required for Stage 2.0 are currently in the application process and will be obtained in the coming months. For example, TSF-2 authorizations will soon be submitted to provincial authorities to obtain ministerial approval under section 22 of the Environment Quality Act (Q-2). Elevra recently received final approval for Waste Rock Pile #2 (HS) for several years of production.
| Revision: 0 – 14-Aug-2026 B198-D01-02054-RT-0010 |
Page 222 |
| NAL Expansion FS Mineral Reserve Pre-Feasibility Study NI 43-101 Final Report Prepared for Elevra |
|
| 20.1.3 | Permitting Stage 3.0 Pit Expansion |
The expansion of the mining pit will affect Lortie Lake by partially impacting the aquatic environment and fish habitat. The Regulation respecting the environmental impact assessment and review of certain projects (Q-2, r. 23.1) specifies in Section 2.2 of Schedule 2 that any project affecting an area greater than 15,000 m² of a lake or river must be submitted to the environmental assessment process, including a public hearing by the Bureau d’Audiences Publiques sur l’Environnement (BAPE). The pit expansion involves draining an area of several hectares of the lake, thereby triggering the provincial process for BAPE hearings. Accordingly, the Ministry of the Environment, Climate Change, Wildlife, and Parks (MELCCFP) has confirmed that the project will be subject to the provincial environmental impact assessment process. This assessment will require that the planned new mining infrastructure—TSF#3 and HS#4— be evaluated alongside the pit expansion.
For its part, the Department of Fisheries and Oceans Canada (DFO) will require that the impacts of mining activities on the fish habitat in Lortie Lake be offset by an approved habitat compensation project. Consultation will be undertaken with First Nations for the design of the compensation project(s). The new mining infrastructure (TSF & HS) could take place within a fish habitat, which would require registration under Appendix II of the Metal and Diamond Mining Effluent Regulations (SOR/2002-222). To do so, Elevra will need to demonstrate that the chosen solution was selected in accordance with the Guidelines for the Assessment of Alternatives for Mine Waste Disposal, as required by the Department of Fisheries and Oceans (DFO).
The extension of mineral resources under Lortie Lake will require the approval from the MRNF for the conversion of this lease area to a mining lease. The MRNF will require an update to the Closure and Rehabilitation Plan and the update of the approval by the MELCCFP. The BAPE process will provide the necessary decree to obtain the permits required for the conversion of the area to a mining lease.
| 20.2 | Environmental Baseline and Impact Studies |
| 20.2.1 | Physical Environment |
| 20.2.1.1 | Climate |
The Val-d’Or area experiences a subarctic continental sub-humid climate, characterized by short, cool summers and long, cold winters. The nearest weather monitoring station with data on climate properties maintained by Environment Canada (climat.meteo.gc.ca) is the Val D’or station, approximately 40 km south of the Property. In 2025, NAL proceeded with an independent review of climatic data from 1991-2020 and performed forecasts with various climate change scenarios up to 2070. Data obtained from the Val-d’Or weather station, located 40 km to the south, between 1991 and 2020 indicates that the average daily temperature for January was -16.3 °C and the daily average temperature in July was 17.7 °C. The record low during this period was -42.7 °C, and the record high was 36.1 °C.
The total average annual precipitation at Val d’Or is 868 mm, with peak rainfall occurring during September (102 mm average), July (101 mm average) and August (93 mm average). Snowfall is light to moderate from October to April, with an annual average of 228 cm.
| 20.2.1.2 | Topography |
The regional study zone is in the physical geography unit of the region’s lower plateau, called the Bas-Plateau de l’Abitibi. The slightly hilly relief was moulded and smoothed out somewhat by the introduction of thick clay deposits from the Ojibway-Barlow Lake vestiges. The site also has a few chain of rocky cliffs that cut across the clay plain, including Mont-Vidéo, a hill that rises to 470 m (m.a.s.l.). The other hills are between 420 m and 450 m high, and the lowlands have an average altitude of around 360 m.
| Revision: 0 – 14-Aug-2026 B198-D01-02054-RT-0010 |
Page 223 |
| NAL Expansion FS Mineral Reserve Pre-Feasibility Study NI 43-101 Final Report Prepared for Elevra |
|
The Property contains small hills and is located at a mean elevation of 400 m.a.s.l., but the topography is generally flat with swamps, sand plains and an esker along its edge.
| 20.2.1.3 | Geology |
The study zone lies within the Superior Province of the Canadian Shield. The rocks in this zone date back to the Archean era. The batholith consists of several parallel dykes, ranging from pegmatite to spodumene, feldspar and quartz. These dykes are nearly 3 km long and run northwest/southeast. They are present to a maximum depth of 260 m, are very continuous and contain a uniformly distributed spodumene mineralization.
| 20.2.1.4 | Geomorphology |
The glacial footprint of the existing landscape is the one left by the last glacier in the region, nearly 9,000 years ago. A key feature of the last deglaciation in Abitibi-Témiscamingue is the development of the Harricana till. This till delineates the convergence of the Hudson and the Nouveau-Québec glaciers. Several major fluvio-glacial deposits, e.g., eskers and spreads, emerged during the glacial retreat.
The region is essentially characterized by the presence of a continuous cover till, generally over 1 m in thickness, over the pit and the mining complex. The existing till has an average permeability and can be considered a discontinuous aquifer, enabling the flow of groundwater.
| 20.2.1.5 | Hydrography |
Three lakes – Roy, Legendre and Lortie – are the main bodies of water near the mine, as shown in Figure 20-1. Lortie Lake, located north of the planned pit, is an isolated lake with no surface outlet. The Hydrological Atlas of Canada indicates that it drains northwest, into the Landrienne River basin. The Harricana till is located at the Continental Divide, between the waters flowing towards the Landrienne River, a Harricana River tributary, and the Barraute Stream, a Laflamme River tributary.
The mining site is located at the head of the sub-watersheds of the Laflamme, Fiedmont and Landrienne Rivers. The concentrator and tailings site are in the Fiedmont River sub-basin, the area of waste rock accumulation is in the Landrienne River basin, and the pit is at the intersection of the three sub-watersheds.
Further hydrologic studies were performed in 2025 in order to define impacts of mining infrastructures on the hydrologic network for the Lortie Lake, as well as northern catchment basins of Riviere Landrienne and the R1 (East and R1 (West) affluent basins to Lortie Lake. These hydrological reports define any potential required mitigation measures and form an intrinsic part of the complete ESIA.
| Revision: 0 – 14-Aug-2026 B198-D01-02054-RT-0010 |
Page 224 |
| NAL Expansion FS Mineral Reserve Pre-Feasibility Study NI 43-101 Final Report Prepared for Elevra |
|
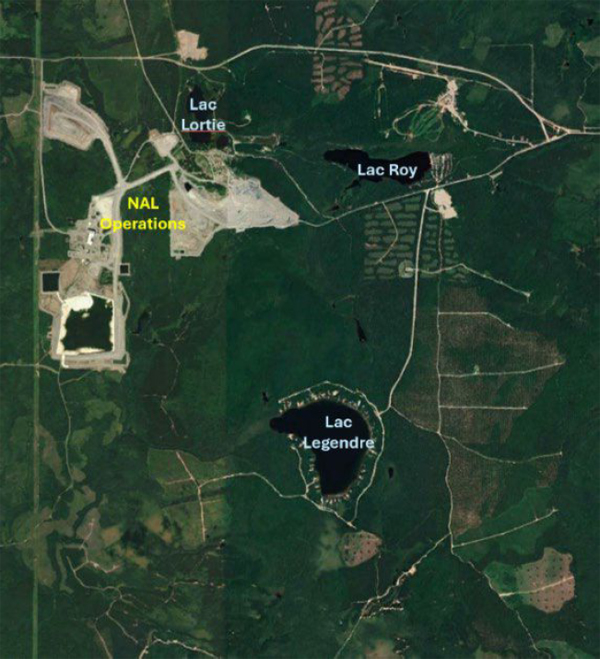
Figure 20-1: Location of Lakes Around NAL Operations
| 20.2.1.6 | Background Surface Water Quality |
As part of the Environmental and Social Impact Assessment (ESIA) completed in 2012, two characterization campaigns of the surface water and sediment quality were conducted in 2009 and 2010. The quality of the surface water of the three local lakes and three nameless streams was analysed and compared to known quality criteria. Globally, the environmental protection criteria for the analysed substances were rarely exceeded. Some exceedances have been observed for fluoride, total phosphorus, pH, aluminium, iron, manganese, and mercury.
NAL’s site environmental team performs a surface water monitoring program is carried out yearly to ensure continuous monitoring of surface water quality around the site.
| Revision: 0 – 14-Aug-2026 B198-D01-02054-RT-0010 |
Page 225 |
| NAL Expansion FS Mineral Reserve Pre-Feasibility Study NI 43-101 Final Report Prepared for Elevra |
|
| 20.2.1.7 | Background Sediment Quality |
The stations for which a stream sediment quality analysis were performed are the same as those used for the water quality assessments. The substances analysed in the sediments include metals and organic compounds, such as oils, greases, and aliphatic hydrocarbons (C10–C50). The 2010 campaign also included an analysis of polychlorinated biphenyls (PCBs). The Lortie Lake station contains more aluminium, lithium, potassium, sodium, and zinc than other stations. This difference can be explained by the nearby presence of the former Québec Lithium tailings storage facility that operated from 1955 to 1965. A polishing basin discharged directly into Lortie Lake. Petroleum hydrocarbons were detected but no PCBs were detected. Some exceedances of criteria have been observed for cadmium, arsenic, mercury, lead, and zinc.
| 20.2.1.8 | Hydrogeology |
An integrated hydrogeological study and numerical modelling was conducted for the planned expansion of the open pit mine for NAL in 2025. The work completed supports regulatory requirements (Directive 019 – Industrie minière) and aims to inform the feasibility of pit expansion, new tailings storage (TSF-3), and waste rock management.
The study included:
| ● | Compilation and validation of geological, hydrogeological, and piezometric data from 2010–2025, including previous studies, recent fieldwork, and public datasets. |
| ● | Development of a conceptual hydrogeological model based on stratigraphy, aquifer properties, and groundwater flow mechanisms. |
| ● | Construction and calibration of a numerical groundwater model to simulate current and projected conditions, including sensitivity analyses. |
Notable findings form this study are:
| ● | The site stratigraphy comprises permeable granular deposits (mainly Quaternary sands), glacial till of lower permeability, and fractured bedrock. Groundwater flow is primarily controlled by topography and the distribution of these units. |
| ● | Hydraulic conductivities range from approximately 1 × 10⁻⁵ m/s in sands to 1 × 10⁻⁸ m/s in bedrock, as determined by slug and pumping tests. |
| ● | Regional groundwater flow is generally west to west-northwest, following topographic gradients and natural drainage. Local variations are influenced by the geometry of permeable units and natural discharge zones. Importantly, no hydraulic connection was identified between Lortie Lake and the aquifers in the pit zone. |
| ● | Groundwater levels are highest in the central and northern site areas (>400 m elevation), decreasing toward lower-lying zones. Both overburden and fractured bedrock aquifers are present. |
| ● | Pumping tests have confirmed that the aquifer yield of the Harricana moraine is well below 25m³/h which is a threshold defined by MELCCFP Directive 019 (2025). |
The numerical model predicts drawdown (dewatering) requirements for the proposed pit, estimates necessary pumping rates, and delineates the hydraulic zone of influence. Sensitivity analyses show the model’s response to changes in precipitation and hydraulic conductivity.
The hydrogeological work carried out establishes a solid technical basis for the preliminary feasibility of mine expansion, identifying key aquifer characteristics, flow regimes, and dewatering requirements. The integrated approach ensures that groundwater management strategies are aligned with both operational and environmental objectives and will support regulatory submission requirements.
| Revision: 0 – 14-Aug-2026 B198-D01-02054-RT-0010 |
Page 226 |
| NAL Expansion FS Mineral Reserve Pre-Feasibility Study NI 43-101 Final Report Prepared for Elevra |
|
| 20.2.1.9 | Groundwater Quality |
The quality of the groundwater is very good and only two exceedances of criteria for iron and nickel have been observed in ESIA baseline studies produced in 2018. Groundwater monitoring is performed on a regular basis, twice a year, covering the whole site area. With a few exceptions, the groundwater on the property is of the calcic bicarbonate type, representative of water in the recharge zone.
| 20.2.2 | Biological Environment |
| 20.2.2.1 | Vegetation |
The regional study zone is located within the western balsam fir-yellow birch bioclimatic domain. The forest landscape is dominated by stands of pine and white spruce, intermingling with white birch trees.
The regional study zone includes several open environments, e.g., farmer’s fields, non-forest wetlands, recent logging areas, etc., but is nonetheless primarily comprised of forest. Conifer stands predominate, followed by mixed stands. Hardwood or deciduous stands are less frequent and consist almost solely of young stands or trees undergoing regeneration. The numerous disturbances of the late ‘70s, e.g., epidemics, logging, plantations, and windfall, all resulted in major occurrences of these types of stands.
According to the Centre de Données sur le Patrimoine Naturel du Québec (CDPNQ), the sector concerned by the Project does not include any plant species designated as threatened, vulnerable or likely to be thus designated. There were no special-status species observed in the ESIA baseline studies of 2010 and an update of the baseline environmental studies conducted in the summer of 2025 confirmed the findings of 2010.
The sector contains no Exceptional Forest Ecosystems (EFEs), forest stands with a phytosociological interest or biological refuges. Furthermore, the past few years have seen considerable logging activity.
| 20.2.2.2 | Wetlands |
There are numerous forest wetlands in the deciduous or mixed stands, or in areas where trees were recently felled.
Types of wetlands include open bogs, wooded bogs, anthropogenic wet meadows, treed swamps (including anthropogenic), and marshes. Wetland vegetation is characterized by species such as sphagnum moss, sedges, willows, and various obligate wetland plants (e.g., broadleaf cattail, bluejoint reedgrass, marsh cinquefoil).
These zones are characterized by hydric and sub-hydric drainage. The area also has non-forest wetlands consisting of alder groves and stripped wetlands.
| 20.2.2.3 | Aquatic Fauna |
Fish Fauna and Aquatic Habitats
Overall, the quality of the fish habitats is very poor, which is due to the homogeneity of the aquatic habitats, very low flow rates that are intermittent or below ground with numerous obstacles. According to the MRNF (formerly MERN), there may be up to 49 fish species in the Abitibi-Témiscamingue watercourses; with 15 of these species having already been identified in the sectors surrounding the operation.
| Revision: 0 – 14-Aug-2026 B198-D01-02054-RT-0010 |
Page 227 |
| NAL Expansion FS Mineral Reserve Pre-Feasibility Study NI 43-101 Final Report Prepared for Elevra |
|
Through samplings, nine species of fish were confirmed as present in the inventoried bodies of water around the mine, specifically lake cisco, brook stickleback, lake whitefish, goldeye, monkfish, white sucker, pearl dace, brook trout and yellow perch. In addition to the species identified, the MRNF noted the presence of three other species in the area’s lakes; they are the brown bullhead (Ameiurus nebulosus), the northern pike (Esox lucius) and the walleye (Sander vitreus), which are all found in Lake Legendre. None of these species has a special status, be it provincial or federal. Results from the update of the baseline environmental studies conducted in the summer of 2025 do not reveal any additional fish species.
Herpetofauna
Several species of herpetofauna were observed during the survey conducted in the summer of 2025. Of all these species, none is designated as vulnerable or likely to be designated as vulnerable. All these species are widely distributed in the region. A special effort was made to observe the wood turtle (Glyptemys insculpta), which is likely to be found in the study area, but no sightings of this species were recorded during the 2025 ecological inventory campaign.
Avian Fauna
Although no species with a threatened status were observed in 2012, the 2025 survey revealed the presence of the Common nighthawk, the Evening Grosbeak, and the Rusty blackbird in the study area. These three species are classified as vulnerable or are likely to be classified as vulnerable.
Mammals
The local study zone could be a habitat for a wide variety of mammals. The large animals most likely to be found are the moose (Alces americanus) and the brown bear (Ursus americanus). The presence of white-tailed deer (Odocoileus virginianus) is unlikely.
The site zone potentially includes 13 species of small mammals and seven species of bats, five of which could be designated threatened or vulnerable. The small mammals in this latter group are the rock vole (Microtus chrotorrhinus) and the southern bog lemming (Synaptomys cooperi), while the bats are the silver-haired bat (Lasionycteris noctivagans), the eastern red bat (Lasiurus borealis) and the hoary bat (Lasiurus cinereus).
While the sub-sections for the different animal groups indicate the possible presence of a few special-status species, the information obtained from the CDPNQ in 2010 reveals that no threatened or vulnerable faunal species, or faunal species likely to be designated as such, were identified in the site zone. The 2025 wildlife inventory revealed the presence of five bat species, four of which are classified as vulnerable or likely to be designated as vulnerable.
| 20.2.3 | Social Considerations |
| 20.2.3.1 | Territory Use |
The NAL Project is situated in the administrative region of Abitibi-Témiscamingue (08), within the boundaries of the Abitibi RCM. All planned mining infrastructure for the Project are within the municipality of La Corne.
The lands in the immediate area of the site are mostly comprising Crown Land, hence a territory under the administrative responsibility of the MRNF.
Of the nine major land uses for the territory identified in the Abitibi RCM’s territory development and activities plan (Schéma d’Aménagement et de Développement, SAD), three major assignments concern the surrounding mining site:
| Revision: 0 – 14-Aug-2026 B198-D01-02054-RT-0010 |
Page 228 |
| NAL Expansion FS Mineral Reserve Pre-Feasibility Study NI 43-101 Final Report Prepared for Elevra |
|
| ● | Forestry. |
| ● | Recreational. |
| ● | Vacationing resorts. |
Most of the land near the mining site is designated for forestry purposes. In the immediate area of the mining site, there is a recreational zone around Lake Roy, Lortie Lake, and Mont Vidéo. This zone has mixed zoning and allows mining activities. Lake Legendre is considered a year-round vacation area with residences.
| 20.2.3.2 | Development and Activities |
As regards the major activities included in the SAD, the Abitibi RCM wants to ensure available space for the development of various types of industries, while protecting the existing environment and activities. The need to minimize the impact of mining activities on nearby sectors, protect the aquifers, including those of the Harricana moraine, ensure adequate protection for the various natural environments and their elements of interest, and promote the integrated enhancement of forest resources should be highlighted.
| 20.2.3.3 | Land Use |
The three municipalities included in the mining site area are characterized by a low land use density. The residential environment is concentrated in urban sectors, all of which are less than 15 km from the Project site. There are no landholdings on the planned site. However, two groupings of private, resort-type homes are located nearby at Lake Legendre and Mont Vidéo.
| 20.2.3.4 | Public Utilities Infrastructure |
With respect to transport infrastructure, the regional sector includes a section of provincial Route 111, which links Val-d’Or and Amos (blue line in Figure 20 2), and runs through La Corne. Two regional routes also pass through the zone: Route 386, between Landrienne and Amos (purple line in Figure 20 2), and Route 397, between Barraute and Val-d’Or (red line in Figure 20 2). The Abitibi RCM’s electricity network is managed by Hydro-Québec and a 120 kV power line crosses the site.
| 20.2.3.5 | Recreation and Tourism Activities |
The Centre de plein air du Mont-Vidéo, an outdoor recreation centre, is located approximately 2 km to the east of the Project. This complex includes a downhill skiing centre, snowshoe, and cross-country ski trails, hiking and mountain bike trails, a campsite with a beach on the shore of Lake Roy and a number of summer camps. Fishing and hunting, in turn, are regularly practiced throughout the region. Snowshoe and mountain bike trails pass near Lortie Lake and will need to be relocated as NAL expands its activities.
The recreational or leisure network includes numerous snowmobile trails and a few quad trails, which are currently being developed.
| 20.2.3.6 | Forestry and Agricultural Activities |
Selected areas of Crown land located near the mining site are subject to forest logging rights, i.e., guarantee of supply. The area is included in the common area of UAF 086-51. There are no agricultural zones designated as protected under the Act respecting the preservation of agricultural land and agricultural activities on the site dedicated to Project infrastructure.
| Revision: 0 – 14-Aug-2026 B198-D01-02054-RT-0010 |
Page 229 |
| NAL Expansion FS Mineral Reserve Pre-Feasibility Study NI 43-101 Final Report Prepared for Elevra |
|
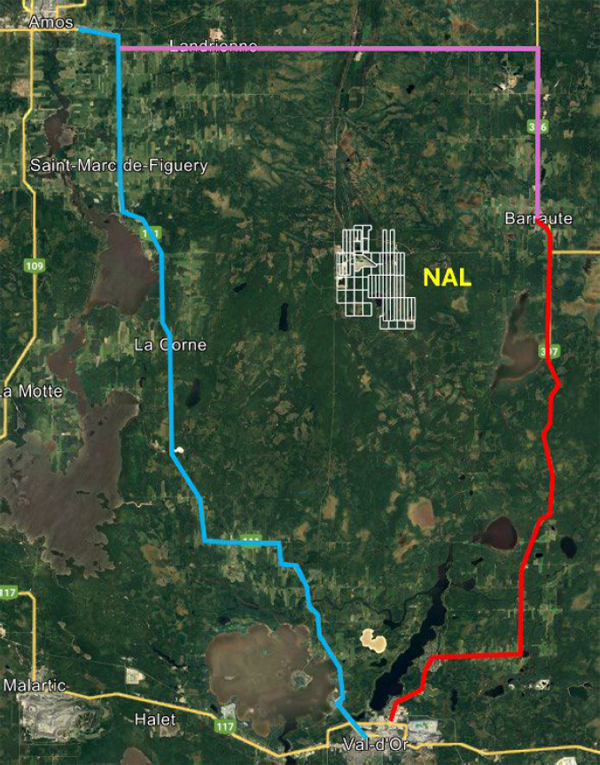
Figure 20-2: Provincial and Regional Routes Around NAL Operations
| 20.2.3.7 | First Nations |
The Project site is situated at the boundary of the First Nations communities of Lac Simon and Pikogan. Since mining operations have commenced NAL have consistently held constructive dialogue with First Nations communities. The 2018 ESIA review report of the Federal government Agency notes that taking into account the mitigation measures anticipated by NAL, the Project was
| Revision: 0 – 14-Aug-2026 B198-D01-02054-RT-0010 |
Page 230 |
| NAL Expansion FS Mineral Reserve Pre-Feasibility Study NI 43-101 Final Report Prepared for Elevra |
|
not likely to cause significant adverse environmental effects on the current use of lands and resources for traditional purposes and on structures, sites or things of historical, archaeological, paleontological or architectural significance in the study area.
First Nations participation in the existing monitoring committee has been constructive to date and NAL will continue close dialogue to ensure mitigation measures are put in place with the expansion project to limit the impacts of its operations.
| 20.2.3.8 | Archaeological and Heritage Potential |
While there are no known archaeological sites within the boundaries of the regional study zone, a 2010 study on the area’s archaeological potential had been carried out, with the goal being to adequately evaluate the probability of prehistorical and historical human occupation. This study had indicated the presence of two 25 m shorelines encircling Lake Roy and Lortie Lake having a strong archaeological potential.
As part of the expansion project’s environmental studies, NAL proceeded with an updated archaeological potential study as well as a complete archaeological inventory for the study zone. The archaeological inventory of the Zone of interest (ZDP) did not reveal any archeological sites despite a previously identified potential during preliminary analyses. The report confirms that NAL can undertake it’s work without constraints from an archaeological point of view.
| 20.3 | Project Permitting |
In 2023, Sayona has restarted mining and ore treatment at NAL, in accordance with existing approvals by provincial and federal authorities. The concentrator is currently authorized for a throughput of 4,500 tpd while the mining is permitted for 5,100 tpd.
At the federal level, the impact study of the initial work was carried out in accordance with the Canadian Environment Assessment Agency (“CEAA”) under the Canadian Environmental Assessment Act. The CEAA issued a Study Report in February 2018. Authorization process was completed in 2022 and updated in 2025.
At the provincial level, permits have been obtained for all actual components. Some original permits were transferred to North American Lithium following acquisition of the site in 2017. Sayona acquired the rights on NAL, including all permits and authorizations following acquisition in 2021. All current permits authorize the operation of the mine and the processing plant.
| 20.3.1 | Ministry of Environment, Fight Against Climate Change, Fauna, and Parks |
The MELCCFP is the provincial authority that issues ministerial environmental permits for all industrial projects. Under section 22 of the Environment Quality Act (Q-2), the ministry authorizes industrial projects. Its authority applies to both new projects and modifications to existing projects.
To increase the milling capacity, additional authorizations will have to be obtained for the concentrator’s capacity and for the implementation of new infrastructure such as TSF#2. Other authorizations will be required, such as for the implementation of the new crushing circuit, the petroleum product storage area, and air emissions control equipment.
The open pit mine expansion (Pit expansion) on Lortie Lake will be subject to more permitting effort as a complete environmental assessment process is required. This expansion project of the open pit mine also involves the addition of a waste rock pile #4 (HS#4) and a new TSF #3. All these project components are subject to the environmental assessment process under the Environment Quality Act (Q-2) and will be reviewed by the BAPE over the next two years to obtain the government decree for the extension of the mining lease.
| Revision: 0 – 14-Aug-2026 B198-D01-02054-RT-0010 |
Page 231 |
| NAL Expansion FS Mineral Reserve Pre-Feasibility Study NI 43-101 Final Report Prepared for Elevra |
|
| 20.3.2 | Existing Permits |
The NAL Property possesses all permits for current operations including Phase 4 mining activities up to 5100tpd as well as milling capacity of 4500tpd. These include activities, such as, but not limited to;
| ● | Open pit mine. |
| ● | Spodumene concentrate mill. |
| ● | Lithium carbonate refinery. |
| ● | Tailings management area no. 1. |
| ● | Process water pond. |
| ● | Industrial wastewater treatment plant. |
| ● | Waste rock pile no. 2. |
| ● | Waste rock pile no. 3. |
| ● | Overburden dump no. 1. |
| ● | Overburden dump no. 2. |
| ● | Fuel pad and Above ground fuel storage tank and its equipment |
| 20.3.3 | Ongoing Permitting Activities |
The permitting process is well advanced for additional Project components or modification of existing authorizations:
| ● | Permitting Stage no.1 – Authorization to reach 4500 tpd |
| ● | Permitting Stage no.2 - Mining Phase #5 with an increase of mining and milling capacity to 6500 tpd as well as TSF no.2 |
| ● | Permitting Stage no.3 – Mining Phases 6 to 8 + TSF no.3 and Waste Rock Pile no.4. |
Environmental Studies have been carried out in 2025 to support the ESIA efforts for the Permitting Stage No. 3
| 20.3.4 | Ministry of Natural Resources and Forests – Lands Sector |
Various land occupation leases have been obtained from MRNF, including the leases for the industrial sector, the current HS#2, including the proposed extension, and the HS#3.
| 20.3.5 | Ministry of Natural Resources and Forests – Forestry Sector |
Permits for tree cutting will be required for new infrastructures development such as TSF#2 or pit extension and will be obtained as per the site development project timing.
| 20.3.6 | Department of Fisheries and Oceans of Canada |
It is the mandate of the DFO to ensure perennity of the fish habitat. Since part or all of Lortie Lake is expected to be affected by the expansion of the mining pit, an amendment to the DFO permit will be made during the next phases of the project. This amendment will require that fish habitat losses be offset through compensatory projects.
| Revision: 0 – 14-Aug-2026 B198-D01-02054-RT-0010 |
Page 232 |
| NAL Expansion FS Mineral Reserve Pre-Feasibility Study NI 43-101 Final Report Prepared for Elevra |
|
| 20.4 | Other Environmental Concerns |
| 20.4.1 | Waste Rock, Tailings and Water Management |
| 20.4.1.1 | Tailings |
In 2012, a geochemical characterization of a combined tailings sample, i.e., tailings from spodumene concentrate production and tailings from lithium carbonate production, was carried out by Golder Associates. Metals content measurements, static Acid Rock Drainage (ARD) testing and Metals Leaching (ML) static testing have been carried out on solid samples and the liquid fraction of tailings pulp.
The results showed that combined tailings and ARD tests are below the limits of the Directive 019 of the MELCCFP However, leaching tests and liquid fraction analysis showed that low pH as well as copper, lithium, zinc, sodium, and sulphate concentrations could be a concern. Therefore, a liner was installed under TSF#1.
In 2018, seven samples of tailings produced from spodumene concentrate production had been analysed. The results showed that tailings from spodumene concentrate production were below limits for both ARD, nor ML.
Whereas the geochemical test was previously relevant, it no longer represents the tailings management approach going forward. The current plan is to have only spodumene tailings. The first results of the ongoing geochemical characteristics of these tailings show that they are still below the limits for both ARD, nor ML. For this reason, and pending final confirmation, TSF #2 and #3 will be constructed with only a liner at the base of the pond to provide enhanced protection for the groundwater, while still allowing the use of filter dikes.
| 20.4.1.2 | Waste rock |
Tests on waste rock were conducted as part of a geochemical study performed by Golder Consulting in 2012. A total of 65 samples from six different overburden areas were analysed for their metal contents, ARD potential, and ML potential. A complementary geochemical study was conducted at Unité de Recherche et de Service en Technologie Minérales (URSTM) in 2013. Column testing was also carried out on four samples representing the main waste rock lithologies.
Results from the geochemical studies showed that waste rock is neither ARD, nor ML; therefore, no special requirements are required by the MELCCFP (formerly MELCC) for stockpiling and water management. In fact, the MELCCFP also allows use of waste rock for construction purposes at the site, e.g., road, lay-down areas, etc.
Static and kinetic tests are currently being conducted to confirm the absence of acid mine drainage or metal leaching. These new tests are being performed on waste rock and mine tailings from mining phases 6 and 7. Results are expected by September 2026 and will be incorporated into the project’s development. Although the results are only preliminary, all indications are that the tests will be like those conducted in 2013.
Further tests are currently being conducted by the Centre de Transfert Technologique en Écologie Industrielle (CTTÉI) to explore the potential for use of certain lithologies from the waste rock. Initial results also indicate that this waste rock is safe, which could allow for its use as civil engineering materials. This parallel study would confirm the absence of ARD and ML potential.
| Revision: 0 – 14-Aug-2026 B198-D01-02054-RT-0010 |
Page 233 |
| NAL Expansion FS Mineral Reserve Pre-Feasibility Study NI 43-101 Final Report Prepared for Elevra |
|
| 20.4.1.3 | Emissions of air contaminants |
Since NAL resumed operations in 2023, the presence of crystalline silica, beryllium, arsenic, and lead has been under monitoring. These contaminants have been detected in areas with high dust levels, such as the crusher. All workers in contact with operational dust must wear appropriate PPE. NAL regularly assesses workers’ exposure to these airborne contaminants, and necessary measures are immediately implemented when a risk is identified.
To address the environmental risks associated with these contaminants, the site is equipped with a range of instruments to measure atmospheric concentrations. Atmospheric concentrations of the elements measured currently are all below regulatory thresholds. As part of the increase in processing capacity and the expansion of the mining pit, atmospheric modeling involving multiple scenarios is currently underway, and preliminary results will be shared with government authorities. This study is necessary to obtain the ministerial authorizations required under the Environment Quality Act (Q-2).
| 20.4.2 | Regulatory Context |
| 20.4.2.1 | Provincial Procedure for Environmental Impact Assessment |
Mining projects are subject to Quebec’s Environment Quality Act (EQA, c. Q-2). Under this act, projects requiring environmental impact studies are identified in the Regulation Respecting Environmental Impact Assessment and Review (Q-2, r. 23.1).
All greenfield mining projects are subject to this procedure. For projects which have already been authorized by the government, expansion projects do not necessarily make it subject to the environmental impact assessment procedure, except if the project triggers an increase of more than 50% of authorized area or 50% increase of the concentrator capacity. Elevra has received confirmation from both the provincial and federal governments that the project to expand the plant’s capacity (Milling capacity) is not subject to environmental assessments.
Regarding the Pit Expansion project, seeing that it would impact an area greater than 15,000 m² on Lortie Lake, this would then trigger the requirement for an additional and revised environmental assessments. The expansion project of the pit (Pit expansion) will be subject to this procedure given its impact on Lortie Lake and relevant HS#4 & TSF#3.
| 20.4.2.2 | Federal Procedure for Environmental Impact Assessment |
The impact study of the initial project was submitted in February 2013 to the Canadian Environment Assessment Agency (CEAA) under the Canadian Environmental Assessment Act (S.C. 1992, c. 37). The CEAA issued a Study Report in February 2018 presenting the Agency requirements for atmospheric environment, water quality, fish and fish habitats, birds, and bird habitats as well as traditional land and resources use.
As per the Physical Activities Regulations (SOR/2019-285), the Project would be subjected to the new Impact Assessment Act (S.C. 2019, c. 28, s. 1) procedure if the expansion of the Project results in an increase in the area of mining operations of 50% or more and the total ore input capacity reaches 5,000 today or more after the expansion. Both conditions must be triggered to be subjected to this procedure, which is not the case for all phases of the expansion.
| 20.4.2.3 | Laws and Regulations for Environmental Impact Assessment |
The Project is mainly subject to several provincial and federal regulations. Main laws and regulations that are applicable are listed in Table 20-1.
| Revision: 0 – 14-Aug-2026 B198-D01-02054-RT-0010 |
Page 234 |
| NAL Expansion FS Mineral Reserve Pre-Feasibility Study NI 43-101 Final Report Prepared for Elevra |
|
Table 20-1: Provincial and Federal Acts and Regulations
| Acts and Regulations |
| PROVINCIAL |
| Environment Quality Act (c. Q-2) |
| Regulation respecting the application of section 32 of the Environmental Quality Act (Q-2, r. 2) |
| Regulation respecting the supervision of activities with respect to their impact on the environment (Q-2, r. 17.1) |
| Regulation respecting the application of the Environment Quality Act (Q-2, r. 3) |
| Regulation respecting the environmental impact assessment and review of certain projects (Q-2, r.23.1) |
| Design code of a storm water management system eligible for a declaration of compliance (Q-2, r.9.01) |
| Clean Air Regulation (Q-2, r. 4.1) |
| Regulation respecting the operation of industrial establishments (Q-2, r. 26.1) |
| Snow, Road Salt and Abrasives Management Regulation (Q-2, r. 28.2) |
| Regulation respecting pits and quarries (Q-2, r. 7) |
| Regulation respecting the declaration of water withdrawals (Q-2, r. 14) |
| Regulation respecting mandatory reporting of certain emissions of contaminants into the atmosphere (Q-2, r. 15) |
| Regulation respecting halocarbons (Q-2, r. 29) |
| Regulation respecting hazardous materials (Q-2, r. 32) |
| Regulation respecting the reclamation of residual materials (Q-2, r.49) |
| Regulation respecting activities in wetlands, bodies of water and sensitive areas (Q-2, r.0.1) |
| Protection policy for lakeshores, riverbanks, littoral Zones and floodplains (Q-2, r. 35) |
| Water withdrawal and protection regulation (Q-2, r. 35.2) |
| Land protection and rehabilitation regulation (Q-2, r. 37) |
| Regulation respecting the charges payable for the use of water (Q-2, r. 42.1) |
| Directive 019 sur l’industrie minière (2025) |
| Protection and rehabilitation of contaminated sites policy (1998) |
| Mining Act (c. M-13.1) |
| Regulation respecting mineral substances other than petroleum, natural gas and brine (M-13.1, r. 2) |
| Threatened or Vulnerable Species Act (c. E-12.01) |
| Regulation respecting threatened or vulnerable wildlife species and their habitats (E-12.01, r. 2) |
| Regulation respecting threatened or vulnerable plant species and their habitats (E-12.01, r. 3) |
| Compensation Measures for the Carrying out of Projects Affecting Wetlands or Bodies of Water Act (M-11.4) |
| Act respecting the conservation of wetlands and bodies of water (2017, chapter 14; Bill 132) |
| Watercourses Act (c. R-13) |
| Regulation respecting the water property in the domain of the State (R-13, r. 1) |
| Conservation and Development of Wildlife Act (c. C-61.1) |
| Regulation respecting wildlife habitats (C-61.1, r. 18) |
| Act respecting the lands in the domain of the state (c. T-8.1) |
| Regulation respecting the sale, lease and granting of immovable rights on lands in the domain of the State (c. T-8.1, r. 7) |
| Sustainable Forest Development Act (c. A-18.1) |
| Regulation respecting the sustainable development of forests in the domain of the State (c. A-18.1, r. 0.01) |
| Regulation respecting forestry permits (c. A-18.1, r. 8.) |
| Building Act (c. B-1.1) |
| Safety Code (B-1.1, r. 3) |
| Construction Code (B-1.1, r. 2) |
| Explosives Act (c. E-22) |
| Regulation under the Act respecting explosives (E-22, r. 1) |
| Cultural Heritage Act (c. P-9.002) |
| Occupational Health and Safety Act (c. S-2.1) |
| Regulation respecting occupational health and safety in mines (S-2.1, r. 14) |
| Highway Safety Code (c. C-24.2) |
| Transportation of Dangerous Substances Regulation (c. 24.2, r. 43) |
| Revision: 0 – 14-Aug-2026 B198-D01-02054-RT-0010 |
Page 235 |
| NAL Expansion FS Mineral Reserve Pre-Feasibility Study NI 43-101 Final Report Prepared for Elevra |
|
| Acts and Regulations |
| FEDERAL |
| Impact Assessment Act (S.C. 2019, c. 28, s. 1) |
| Physical Activities Regulations (SOR/2019-285) |
| Designated Classes of Projects Order (SOR/2019-323) |
| Information and Management of Time Limits Regulations (SOR/2019-283) |
| Fisheries Act (R.S.C., 1985, c. F-14) |
| Authorizations Concerning Fish and Fish Habitat Protection Regulations (SOR/2019-286); |
| Metal Mining Effluent Regulations (SOR/2002-222) |
| Canadian Environmental Protection Act (S.C. 1999, c. 33) |
| PCB Regulations (SOR/2008-273) |
| Environmental Emergency Regulations, 2019 (SOR/2019-51); |
| Federal Halocarbon Regulations (SOR/2003-289) |
| National Pollutant Release Inventory |
| Species at Risk Act (S.C. 2002, c. 29) |
| Canadian Wildlife Act (R.S.C., 1985, c. W-9) |
| Wildlife Area Regulations (C.R.C., c. 1609) |
| Migratory Birds Convention Act, 1994 (S.C. 1994, c. 22) |
| Migratory Birds Regulations (C.R.C., c. 1035) |
| Nuclear Safety and Control Act (S.C., 1997, c. 9) |
| General Nuclear Safety and Control Regulations (SOR/2000-202) |
| Nuclear Substances and Radiation Devices Regulations (SOR/2000-207) |
| Hazardous Products Act (R.S.C., 1985, c. H-3) |
| Explosives Act (R.S.C., 1985, c. E-17) |
| Transportation of Dangerous Goods Act (1992) |
| Transportation of Dangerous Goods Regulations (SOR/2001-286) |
| 20.5 | Social and Community Impacts |
| 20.5.1 | Consultation Activities |
As part of the management of mining operations at the site, numerous consultation activities and/or information sessions are organized on a regular basis. A monitoring committee has been in place since mining activities resumed in 2022. A good neighbour committee with Lake Legendre residents is also active. These committees allow Elevra to share information about the mine’s development and public results, and to discuss issues surrounding the neighbourhood with committee members. These committees facilitate constructive dialogue on issues raised by citizens or organizations outside Elevra.
For the Pit expansion, stakeholder consultations are ongoing and will be finalized for the ESIA. The purpose of these consultations is to gather and address the concerns of these stakeholders. Those consultations are focussing on the expansion of the pit. Elevra is expected to follow up with the same stakeholders to present the changes that have been incorporated following the first round of consultations.
| 20.5.1.1 | Committee Composition |
The Monitoring Committee is composed of citizens from the Abitibi RCM, regional representatives, and representatives from the First Nations communities concerned.
The Lake Legendre Good Neighbour Committee is composed of five citizens from Lac-Legendre, the nearest residential area, and was established in 2024 to discuss concerns related to noise, vibrations, and water quality.
| Revision: 0 – 14-Aug-2026 B198-D01-02054-RT-0010 |
Page 236 |
| NAL Expansion FS Mineral Reserve Pre-Feasibility Study NI 43-101 Final Report Prepared for Elevra |
|
| 20.6 | Water Management |
Water management are important aspects of environmental compliance and operational effectiveness of the mining site. To support NAL expansion, a site-wide water balance was performed based on major infrastructure expansion footprint. Water balance shows excess of water on the overall site for all stages of development. Water infrastructure (ponds and ditches) was added to the project to ensure proper environmental and operation water management. These infrastructures are shown in Table 20-2 below and more details are provided in Chapter 18 – Project Infrastructure.
Table 20-2: New Water Management Infrastructure
| Water Infrastructure |
| HS-4 Ditches |
| TSF-3 Ditches |
| Pond BO_14 - Mine water (Phase 5 and beyond) |
| Pond BO_15 - Runoff water HS-4 and TSF-3 |
| 20.7 | Mine Closure and Reclamation Plan |
As per the provisions of Section 232.1 of the Mining Act (R.S.Q., c.M-13.1), any entity that engages in mining exploration activities must submit a restoration plan for its mining site. The restoration plan must be prepared according to the specific requirements of the MRNF’s document Guidelines for preparing a mining site rehabilitation plan and general mining site rehabilitation requirements. Since then, there have been amendments to the Regulation respecting mineral substances other than petroleum, natural gas, and brine (R.S.R.Q. section M-13.1, r.2). The regulation amendment, which came into force on July 23, 2013, has a direct impact on the calculations for the financial guarantee and payment of the contribution to this guarantee for site restoration once the mining activities have ceased.
The mining company must foresee the costs of restoring the entire site, as well as the costs associated with the closing and rehabilitation of the mining site, necessary for securing the area and returning it to a condition that is deemed compatible with its environment and that satisfies the expectations of the community and the government departments involved. The main measures for restoring the mining site will include:
| ● | Stabilizing the natural water level, following the end of the pumping activities in the pit, at an elevation of around 410 m, which will transform the pit into a body of water. |
| ● | Seeding the slope of the overburden over the entire perimeter of the pit. |
| ● | Building a raised trench to prevent access to the pit. |
| ● | Dismantling the infrastructure of the tailings site, e.g., power line, barge, conduits. |
| ● | Reconfiguring the tailings site spillway so as to accommodate a freshet of 1:1,000 as well as the progressive flow of the runoff, based on the capacity, for receiving this flow, of the watercourses. |
| ● | Comprehensive revegetation of the accumulation sites, i.e., tailings and waste rock, by spreading a layer of overburden and then covering it with topsoil before seeding. |
| ● | Revegetation of the overburden dumps by covering them with topsoil before seeding. |
| ● | For all ponds, breaching the dam and then filling with topsoil before seeding. |
| ● | Demolition and removal of all buildings and other surface infrastructure, including power lines, pipelines, etc. |
| ● | Levelling of the process plant area and landscaping to restore the natural drainage system. |
| ● | Revegetation of the process plant area by scarification, then covering it with topsoil before seeding. |
| Revision: 0 – 14-Aug-2026 B198-D01-02054-RT-0010 |
Page 237 |
| NAL Expansion FS Mineral Reserve Pre-Feasibility Study NI 43-101 Final Report Prepared for Elevra |
|
| ● | Management of the matter generated during the dismantling of the facilities, by applying the principles of reduction, reuse, recycling, and reclamation and, if necessary, elimination of matter at authorized sites, according to the degree of contamination. |
| ● | Execution of a land characterization study to identify the presence of contaminants with concentrations in excess of regulatory values and taking the necessary measures, in compliance with the provisions of the Environment Quality Act and the Land Protection and Rehabilitation Regulation. |
| ● | Scarification of the roads built by NAL as part of the mining activities, restoring of the natural drainage and seeding. |
Some of the restoration works will be carried out during the mining operations, with the balance done at the end of the mine life. The implementation of the proposed environmental monitoring program will allow for demonstrating that the restoration works have achieved their goals.
A former tailings facility, under the responsibility of the Province of Quebec since 2010, is located within the mineral resource footprint. The management of tailings from previous mining operations are subject to specific conditions, depending on their geochemical characteristics. The MRNF has stated in 2010 that these tailings do not show acid rock drainage potential. However, the MELCCFP requirements for geochemical characterisation have increased since 2020 and a more comprehensive characterisation is currently underway.
Finally, the responsibility for historical infrastructure will be assessed and discussed with the MRNF as additional resources beyond current permits are accessed.
| 20.7.1 | Financial Commitment for Mine Closure |
As part of approvals for the site restoration plan, the MRNF issued to the previous owners of the Project a schedule for providing the financial guarantees (i.e. closure bond, needed to cover the cost of closure). The closure cost estimate was updated from the 2024 closure cost which was acceptable by the Ministry. The same cost per unit was utilized in this update. The concept of closure remains unchanged from the previous closure plan. Additional areas were considered for the reclamation of TSF-3, HS-4. The expansion closure cost also includes additional amount for demolition and restoration of crushing and mill expansion. Table 20-3 summarizes cost closure for each scenario:
Table 20-3: Total Cost of Closure Plan
| Version of Closure Plan | Closure Cost (C$) | Total Cost (C$) |
| MRNF Approved plan (2024) Base Case (No Expansion) | - | 36 486 691 $ |
| NAL Extension Stage 1 & Stage 2 (6500 tpd) | 1,988,189 $ | 38,474,880 $ |
| NAL Expansion 2026 (Stage 3) Pit Extension (6500 tpd) | 23,948,953 $ | 62 423 833 $ |
| 20.8 | Recommendations |
The following recommendations for future stages of the expansion:
| ● | Finalize waste rock and tailings characterisation testwork on resource expansion. |
| ● | Continue hydrogeological investigations to refine the hydrogeological model, |
| ● | Engagement and submission of initial permits for expansion related infrastructure and construction. |
| ● | Continue engagement to communicate with and consult stakeholders to highlight the project’s positive impacts and mitigation measures. |
| ● | Continue to measure the presence of beryllium, arsenic, lead, and crystalline silica and provide a comprehensive air emissions model for the expansion project. |
| Revision: 0 – 14-Aug-2026 B198-D01-02054-RT-0010 |
Page 238 |
| NAL Expansion FS Mineral Reserve Pre-Feasibility Study NI 43-101 Final Report Prepared for Elevra |
|
| 21 | Capital and Operating Costs |
This chapter summarizes the Capital Expenditures (CAPEX) and Operating Expenses (OPEX) estimates related to the Project installations. The Project capital and operating costs in this study centre around the addition of new equipment and infrastructure required for the expansion of NAL facilities. These additions are required to achieve the intended design throughput rate of 4,500 tpd in Stage 1 and 6,500 tpd in Stage 2 and Stage 3.
| 21.1 | Capital Cost Estimate |
The total estimated initial capital cost for Association for the Advancement of Cost Engineering (AACE) Class IV of the NAL Expansion Project is estimated at C$ 366,053,000. These costs are stated in constant dollars as of first quarter of 2026. This section describes the methodologies and basis for the preparation of the CAPEX. A breakdown of the CAPEX is shown in Table 21-1. All costs in Canadian dollar (CAD or $).
Table 21-1: Capital Costs Summary by Major Area ($M CAD)
| Area | Stage
1 ($M CAD) |
Stage
2 ($M CAD) |
Stage
3 ($M CAD) |
Total ($M CAD) |
| Mechanical Direct | $14.3 | $19.8 | $22.9 | $56.9 |
| Mechanical | $14.3 | $19.8 | $22.9 | $56.9 |
| Other Disciplines Direct | $41.9 | $38.9 | $80.9 | $161.8 |
| HVAC | $0.9 | $1.2 | $2.5 | $4.6 |
| Platework | $0.9 | $1.7 | $9.8 | $12.4 |
| Civil | $1.7 | $1.2 | $3.7 | $6.6 |
| Piping | $3.9 | $5.3 | $1.4 | $10.6 |
| Concrete | $6.9 | $8.3 | $22.7 | $37.8 |
| Structural | $6.9 | $8.3 | $21.9 | $37.0 |
| Building | $2.6 | $0.8 | $4.7 | $8.1 |
| Electrical | $9.2 | $8.9 | $10.3 | $28.4 |
| Instrumentation & Controls | $1.7 | $2.4 | $2.7 | $6.8 |
| Demolitions | $7.3 | $0.9 | $0.3 | $8.5 |
| Mobile Equipment | $0.0 | $0.0 | $1.0 | $1.0 |
| Indirect Costs | $17.0 | $22.2 | $35.0 | $74.1 |
| PCM Services | $4.0 | $3.4 | $11.6 | $19.0 |
| Detail Engineering | $5.0 | $6.0 | $5.0 | $16.0 |
| Construction indirects | $3.4 | $4.3 | $6.5 | $14.1 |
| Owner’s costs | $1.7 | $1.8 | $3.1 | $6.6 |
| Operational Readiness & Pre-Production Labour | $0.3 | $3.0 | $1.2 | $4.6 |
| Insurances | $1.1 | $1.1 | $1.1 | $3.3 |
| Spares Strategic | $0.0 | $0.6 | $0.5 | $1.1 |
| Spares Commissioning | $0.2 | $0.2 | $0.4 | $0.9 |
| Transport / Delivery to Site | $1.1 | $1.7 | $5.2 | $8.0 |
| First Fill | $0.2 | $0.2 | $0.3 | $0.7 |
| Total Before Contingency | $73.2 | $80.9 | $138.7 | $292.8 |
| Contingency P50 (30%) | $18.3 | $20.2 | $34.7 | $73.2 |
| Total CAPEX | $91.5 | $101.1 | $173.4 | $366.1 |
| Revision: 0 – 14-Aug-2026 B198-D01-02054-RT-0010 |
Page 239 |
| NAL Expansion FS Mineral Reserve Pre-Feasibility Study NI 43-101 Final Report Prepared for Elevra |
|
| 21.1.1 | Basis of Estimate |
The estimate prepared is Class 4 Capital Cost Estimate (CCE) in line with AACE with a nominal target accuracy range of ±40%. The level of estimation is supported by vendor quotation for major equipment and previous installation cost data at NAL for some items.
The estimate was developed from a combination of factoring from similar projects and more detailed estimating calculation in some areas. Equipment and material cost factors have been sourced from projects of similar scope and design with costs escalated where necessary.
The estimate was based on the following general approach:
| ● | Major mechanical equipment costs for the expansion were obtained from vendor budget quotation. |
| ● | Secondary and minor equipment was sourced from an in-house database for similar projects. |
| ● | An estimate base date of February 2026. |
| ● | An Estimate Base Currency of Canadian Dollars (CAD). |
| ● | Project executed through a self-perform delivery model with engineering services contracted out and Elevra performing the general contractor (GC) role. |
| ● | All costs exclusive of escalation beyond the base date. |
| ● | Exclusive of taxes. |
Table 21-2 summarises the Basis of Estimate.
Table 21-2: Summarised Basis of Estimate
| Description | Basis of Estimate |
|
Mechanical Equipment |
The equipment supply pricing for most of the major equipment is based on recent quotes. For smaller equipment, Sedgman used inhouse data or quotes from similar projects. In addition to this equipment, costs coming from other sources are the following: ● Carbonates Plant Demolition: From previous quote provided by client, however Sedgman did an independent estimate and evaluated a higher value. ● Operational readiness: Cost estimated by client ● The Sedgman’s inhouse library of installation/modification/demolition hours for each equipment type and size, and the latest all-in labour rate was applied to these hours to calculate the installation cost for each equipment. ● The mechanical platework was estimated using quantities for each equipment and the most recent rates were applied to them to estimate the cost |
|
Civil |
The cost was estimated as a percentage of mechanical. The quantities were not developed by engineering at this stage; however, the overall footprint and topography was taken into account to confirm the estimated budget for crushing plant area of Stage 3. |
|
Structural Steel |
For Stage 1 and Stage 2, the cost was estimated as a percentage of mechanical. For Stage 3, the quantities were copied from a similar design performed by Sedgman, and the local rates were applied to calculate the cost. |
|
Concrete |
For Stage 1 and Stage 2, the cost was estimated as a percentage of mechanical. For Stage 3, the quantities were copied from a similar design performed by Sedgman, and the local rates were applied to calculate the cost. |
|
Piping and Valves |
The cost was estimated as a percentage of mechanical. The quantities were not developed by engineering, however the overall dimensions of the plant, expected lengths of pipe and choice of material was considered to assess the calculated budget for each phase. |
|
Electrical and instrumentation |
The cost was estimated as a percentage of mechanical. The quantities were not developed by engineering, however the overall dimensions of the plant, expected loads of equipment, expected control requirements, and availability of existing infrastructure was considered to assess the calculated budget for each phase. |
|
Buildings |
A building list was developed, and the dimensions were measured to calculate the footprint and volume of each building. The general characteristics of each building was considered to apply the appropriate rate to calculate the overall cost. |
| Revision: 0 – 14-Aug-2026 B198-D01-02054-RT-0010 |
Page 240 |
| NAL Expansion FS Mineral Reserve Pre-Feasibility Study NI 43-101 Final Report Prepared for Elevra |
|
| Description | Basis of Estimate |
| Building modifications to comply to the latest codes: cost estimate by the Architect. | |
|
PCM Services |
The cost for PCM services includes all efforts required after full sanctioning of the Project, and which are required to bring the Project to a state of Construction and Mechanical completion. PCM services budget for the project was estimated as a percentage of direct costs. |
| Detail Engineering | Detail engineering costs were calculated by Sedgman as a bottom-up estimate. |
|
Construction Indirects |
Construction indirects include site vehicles, including site utilities, facilities including trailers, ablution blocks, furniture and storage containers, site running costs including stationary, cleaning, garbage and sewage disposal, temporary power, potable water, security, IT set-up and communications. This budget is to support the entire PCM and Owner’s team. The subcontractor’s construction indirect includes all the above-mentioned items as well as the construction equipment, tools, and consumables. This cost was calculated using a percentage of direct costs. The total was evaluated by comparing against similar projects to ensure the accuracy. |
|
Vendor Representatives |
The cost of vendors’ representatives included in the CAPEX will be sufficient to bring the Project to mechanical completion. is provided by vendors or calculated based on the historical data. |
| Taxes and Duties | All tax and duties are excluded. |
|
Operational Readiness and Pre-Production Labour |
Operational Readiness and Pre-Production Labour were included as a bottom-up estimate provided by Elevra based on current and forecast requirements. |
| External Consultants and Vendor Support | Included in Owner’s costs |
| Owners Costs | Owner’s cost was calculated using a percentage of direct costs. The total was evaluated by comparing against similar projects to ensure the accuracy. |
| Project Insurance | A quote from a reputable insurance provider was received and used in the CAPEX cost estimate. |
| Spares Strategic | An allowance of (0%,1%, and 0.5% for Stage 1, 2, and 3 respectively) of direct costs were made to calculate this cost. |
| Spares Commissioning | An allowance of 0.4% of direct costs were made to calculate this cost. |
| Transport / Delivery to Site | Mostly estimated per cost item depending on the size and weight and distance. An allowance was added to compensate for any missing delivery costs. |
| First Fill | An allowance of 0.3% of direct costs were made to calculate this cost. |
| Escalation | No provision has been made for any escalation in the capital cost estimate. |
| Contingency (P50) | Factored at 25% of total project cost |
| 21.1.2 | Exclusions |
The following items are considered excluded from the capital cost estimate:
| ● | Cost changes due to currency fluctuation. |
| ● | Force Majeure issues. |
| ● | Scope changes. |
| ● | Changes due to government legislation. |
| ● | Project delays because of abnormal climatic conditions. |
| ● | Lost time due to industrial disputes, strikes, or civil unrest. |
| ● | Environmental, ecological, or cultural considerations other than those addressed in the design. |
| ● | The cost of producing any environmental related documents and studies related to obtaining permits, approvals, or variance agreements from governing authorities. |
| ● | Contract incentives to engineering contractor and other contractors, i.e., early completion bonuses. |
| ● | Closure costs (closure costs for mine closure have been estimated separately in Section 20.7 – Mine Closure and Reclamation Plan). |
| Revision: 0 – 14-Aug-2026 B198-D01-02054-RT-0010 |
Page 241 |
| NAL Expansion FS Mineral Reserve Pre-Feasibility Study NI 43-101 Final Report Prepared for Elevra |
|
| 21.1.3 | Sustaining Capital |
Sustaining expenditures (SUSEX) for the base case and expansion project were estimated using current operational budgets and factors of direct plant cost. Tailings SUSEX costs were derived using updated unit rate estimates and quantities derived from current facility designs. The Expansion case includes additional sustaining costs for additional equipment which are offset by the shorter mine life of this scenario.
The existing crushing circuit will be repurposed into an ore sorting facility following the Stage 2 expansion. This change increases sustaining capital compared to the previous scoping study.
Table 21-3: Sustaining Capital Summary
| Area | Base ($M CAD) | Expansion ($M CAD) |
| Tailings | $357.7 | $357.7 |
| TSF1 | $22.0 | $22.0 |
| TSF 2 | $243.1 | $243.1 |
| TSF 3 | $79.9 | $79.9 |
| HS4 | $9.1 | $9.1 |
| Pit Pond | $3.7 | $3.7 |
| Stay in Business Capital (SIBC) | $105.4 | $120.9 |
| SIBC – Base | $105.4 | $61.2 |
| SIBC - Stage 1 | $- | $14.7 |
| SIBC - Stage 2 | $- | $16.8 |
| SIBC - Stage 3 | $- | $28.2 |
| Mining | $22.9 | $22.9 |
| Phase 5 Site Preparation (does not include any mining activity) | $1.0 | $1.0 |
| Phase 6 Site Preparation (does not include any mining activity) | $1.5 | $1.5 |
| Phase 7 Site Preparation (does not include any mining activity) | $3.0 | $3.0 |
| Phase 8 Site Preparation (does not include any mining activity) | $1.5 | $1.5 |
| Fuel Bay | $0.8 | $0.8 |
| HS4 Dump | $5.5 | $5.5 |
| Lortie Lake | $8.7 | $8.7 |
| Ancien PAR | $0.4 | $0.4 |
| Fish Removal Cost | $0.4 | $0.4 |
| Compensation | $25.6 | $25.6 |
| Compensation - Open Pit | $20.9 | $20.9 |
| Compensation - HS4 | $4.0 | $4.0 |
| Compensation - TSF2 | $0.8 | $0.8 |
| Total | $511.7 | $527.1 |
| 21.2 | Operating Cost Estimate |
Operating expenses (OPEX) are based on the LOM plan. The OPEX for the base and the three expansion stages are calculated from the NAL operating budgets. The base case is developed from an annual average feed rate of 3,780 tpd while the expansion stages are based on an average annual processing rate of 4,500 tpd for Stage 1, and an average annual processing rate of 6,500 tpd for Stage 2 and Stage 3.
The OPEX was developed in accordance with the requirement of a pre-feasibility study level with a nominal accuracy range of ± 20%. The level of estimation is supported by actual operational information including salaries, consumables, maintenance costs and established contracts and therefore are more precise given this is a brownfield project.
| Revision: 0 – 14-Aug-2026 B198-D01-02054-RT-0010 |
Page 242 |
| NAL Expansion FS Mineral Reserve Pre-Feasibility Study NI 43-101 Final Report Prepared for Elevra |
|
Some updated operations costs have occurred since the last publication which include more precise values on general and administrative costs and improvements in logistics concentrate transport costs that are being implemented in June 2026 and crusher consumables and temporary crushing facilities. These will be discussed below.
The OPEX results represent annual steady state operations therefore no escalation or inflation is included within the estimate. A summary of the average LOM OPEX costs (all values in CAD$) and comparison between scenarios can be found in Table 21-4. OPEX costs are evaluated commencing as of Fiscal Year 2027.
Table 21-4: Total OPEX Summary
| Item | Units | Base | Stage 1 | Stage 2 | Stage 3 |
| LOM | Yrs | 35 | 20 | 20 | 20 |
| Milling rate | Mt/yr | 1.4 | 1.6 | 2.4 | 2.4 |
| Mining Cost (ore and waste) | CAD$/t mined | 8.6 | 7.9 | ||
| Processing cost | CAD$/t milled | 42.6 | 38.7 | 37.5 | 34.2 |
| G&A | CAD$/yr | 23.6 | 24.6 | 28.3 | 29.9 |
| Transport cost | CAD$/t dry conc. | 142.4 | 133.8 | 118.6 | 118.6 |
| Total OPEX | CAD$M | 7,086 | 5,949 | ||
| C1 Cost Concentrate | CAD$/t dry conc. | 1,048 | 876 | ||
Principal drivers influencing unit cost C1 Cost reduction are driven by the impact of increased tonnage of concentrate, processed and mined. The following are additional details to help understand the changes. It is important to note that base cost is based on actual operating costs or that will be in place in 2026.
Stage 1 – Increase of 19% in throughput versus Base:
| 1. | 13% reduction in G&A per tonne processed resultant from relatively fixed costs between scenarios with minor adjustments required for additional head count, insurance and employee benefits. |
| 2. | 6% reduction in transport costs per tonne dry concentrate directly related to increased movement of material versus elements that are fixed costs. Improvements in material handling on site with new concentrate loading facility reducing on site tramming of material and material loadout. |
| 3. | 9% reduction in Processing cost driven mostly by relative low increase in head count required, addition of line power reticulation replacing diesel generators on site for pumping. Power costs and reagents have no impact between the stages as same unit rates are used. Fixed costs from the base case not impacted by the stages provide the remainder of improvements. |
Stage 2 – Increase of 72% in throughput versus Base:
| 1. | 30% reduction in G&A per tonne processed resultant from relatively fixed costs between scenarios with adjustments required for additional head count, insurance and employee benefits. As the new crushing circuit is only available in Stage 3, all management and cost elements for the contractor are treated in the processing cost. Once Stage 3 is implemented on contractor terminated some G&A costs will increase. This is covered below. |
| 2. | 17% reduction in transport costs per tonne dry concentrate directly related to increased movement of material versus elements that are fixed costs and an estimated improvement in contract rates for variables costs considering the approximate 72% increase in volume. |
| 3. | 12% reduction in Processing cost similar to Stage 1. Despite the increased volume the fact that contractor crushing is used is the large driver that prohibits any additional savings. The additional savings will be garnered in Stage 3. Other drivers are relative low increase in head count required. |
| Revision: 0 – 14-Aug-2026 B198-D01-02054-RT-0010 |
Page 243 |
| NAL Expansion FS Mineral Reserve Pre-Feasibility Study NI 43-101 Final Report Prepared for Elevra |
|
Stage 3 – Increase of 72% in throughput versus Base:
| 1. | 26% reduction in G&A per tonne processed very similar to Stage 2, but as mentioned additional admin resources are counted for as the new crushing circuit is operated by owner. Health and Safety, Human Resources and Environmental costs are added to the G&A. |
| 2. | 17% reduction in transport costs the same as Stage 2. |
| 3. | 20% reduction in Processing principally impacted by the improvement from operating the new crushing circuit. Other drivers are increase in head count to operate and maintain the new crushing circuit required. The existing crushing circuit is converted to a pure marginal ore sorting circuit to upgrade low grade lithium with potential high iron content to increased lithium grade with reduced iron. The adapted circuit is considered in the operating cost. |
In previous scoping study mining costs were estimated based on increased volume, use of larger shovels in waste and benefits from fixed management and administration costs relative to increased tonnage for both contractor and owner costs. Unit rates were based on current operating costs and incorporated an increase in unit rate as mining goes deeper in a similar manner as used for the establishment of the reserves.
In this updated prefeasibility study, a detailed mining cost estimate was performed using SPRY simulation software which incorporates detailed distance, elevation and equipment parameters to account for fuel consumption accurately. Rates for equipment were based on existing contract condition on site and does not account for improved rates that may come from increased fleet size which could be expected. LOM fuel cost of $1.35 /l based on historical pricing and future Brent/WTI trends published by Goldman Sachs. Costing incorporates elements of current contractor and updated quote from an equipment supplier for fleet rental required for the base case and expansion cases. All contractor mining indirect costs as well as costs from Elevra’s mining technical services and operating personnel are included in costing. The expansion scenario of the LOM cost decreases from base case of $8.60/t to LOM $7.91/t. In the first 10 years of the expansion case the LOM the mining cost is an average of $7.39 /t lower than full LOM as in the latter part deepening of the pit increases the mining cost.
| 21.2.1 | Labour |
All mine, processing plant and administration site staff personnel work 10-hour shifts on a 4 on / 3 off basis. Contracted mine operations will work 12-hour shifts. For the processing plant, operations and maintenance crews will work two 12-hour shifts. There will be four shift crews rotating on a 7 on / 7 off schedule.
Staffing requirements are built as bottom-up and based off existing operations. The main increases in labour between the base and expansion case are summarised from operational site roles. The plant increase covers the most significant increase which is attributable to additional operators for grinding and floatation extensions as well as increased maintenance (mechanical / piping / electrical / instrumentation). Mine technical services are augmented to cover increased throughput, assay treatment and geology support. G&A costs are impacted by an increase in site support for Health and Safety, Environment and Increased Surface and Warehousing support.
Table 21-5: Staff and Hourly Count (Sayona Employees)
| Area | Base | Stage 1 | Stage 2 | Stage 3 |
| G&A | 59 | 60 | 65 | 70 |
| Plant | 126 | 132 | 150 | 172 |
| Mine | 40 | 40 | 51 | 51 |
| TOTAL | 225 | 232 | 266 | 293 |
| Revision: 0 – 14-Aug-2026 B198-D01-02054-RT-0010 |
Page 244 |
| NAL Expansion FS Mineral Reserve Pre-Feasibility Study NI 43-101 Final Report Prepared for Elevra |
|
| 21.2.2 | Power |
Power is estimated from current power consumption with rates as per contracted supply with Hydro Quebec scaled for the additional throughput. Power is calculated to account for $2.0 / t processed for base and stages. In further studies, the benefits of a complete load study will allow for closer estimate of power savings given the expansion.
| 21.2.3 | Reagents |
Reagent costs are calculated from NAL’s current operating contracts with consumptions escalated for the additional throughput.
| 21.3 | Author’s Opinion |
The Author is of the opinion that the capital and operating estimating performed, and methodologies applied are relevant and of adequate nature for the expansion study economics assessment at a scoping study level.
Operating cost estimates were compiled by the Elevra team from operating data and contracts. While the Author did not directly undertake the operating estimate, the Author has reviewed and is satisfied with the basis and assumptions used in the operating cost estimates.
| Revision: 0 – 14-Aug-2026 B198-D01-02054-RT-0010 |
Page 245 |
| NAL Expansion FS Mineral Reserve Pre-Feasibility Study NI 43-101 Final Report Prepared for Elevra |
|
| 22 | Economic Analysis |
The main highlights of the Project’s financial analysis are presented in Table 22-1 and Table 22-2. Financial Analysis was performed commencing as of Fiscal Year 2027.
Table 22-1: Main Financial Assumptions and Results Summary for the NAL Expansion Project
| Parameters | Unit | Base | Expansion |
| Average Price 6% Li2O | USD$/t | $2,260 | $2,137 |
| Life of mine (from FY2027) | yrs | 35 | 20 |
| Total Waste | Mt | 336 | 336 |
| Total Ore | Mt | 47 | 44 |
| Strip Ratio | - | 7.14 | 7.14 |
| Average Annual ROM | Mt/y | 1.36 | 2.41 |
| Average Feed Grade | % Li2O | 1.12% | 1.17% |
| LOM 5.4% Li2O Produced | Mt | 6.77 | 6.79 |
| LOM Average Annual 5.4% Li2O | kt/y | 196 | 348 |
| Average Annual 5.4% Li2O production (post expansion) | kt/y | 199 | 373 |
Notes:
| ● | Total ore value for the expansion case is lower than the base case due to ore sorting. |
Table 22-2: Project Economics
| Parameters | Unit | Base | Expansion |
| Exchange Rate | CAD/USD | 1.35 | 1.35 |
| Mining Cost (ore and waste) | C$/t mined | 8.60 | 7.91 |
| Process cost | C$/t milled | 42.57 | 34.81 |
| G&A | C$/t milled | 17.31 | 13.05 |
| Transport Cost | C$/t conc | 142.37 | 119.81 |
| Total OPEX | C$M | 7,086 | 5,949 |
| LOM C1 Cost Concentrate | C$/t conc | 1,048 | 876 |
| LOM AISC | C$/t conc | 1,126 | 954 |
| LOM C1 Cost of Concentrate (post expansion) | C$/t conc | 1,045 | 851 |
| LOM AISC (post expansion) | C$/t conc | 1,112 | 918 |
| Total SUSEX | C$M | 512 | 527 |
| Total initial CAPEX | C$M | - | 366 |
| Net Cash Flow (pre-tax) | C$M | 10,927 | 10,822 |
| NPV8% (pre-tax) | C$M | 3,193 | 4,655 |
| NPV8% Expansion Only (pre-tax) | C$M | - | 1,462 |
| IRR Expansion (pre-tax) | % | - | 58.3% |
| Payback (pre-tax) | Months | - | 29 |
| Net Cash Flow (post-tax) | C$M | 7,471 | 7,307 |
| NPV8% (post-tax) | C$M | 2,274 | 3,218 |
| NPV8% Expansion Only (post-tax) | C$M | - | 943 |
| IRR Expansion (post-tax) | % | - | 49.9% |
| Payback (post-tax) | Month | - | 34 |
Notes:
| ● | All costs and sales are presented in constant 2026 CAD, with no inflation or escalation factors considered. |
| ● | $M = millions of dollars. |
| ● | The financial analysis was performed on existing Mineral Reserves as outlined in this report. |
| ● | The valuation calculations are unlevered. |
| ● | The average metallurgical recovery over the LOM is 71.2% for the expansion and 69.2% for the base case due to improvement in the mill flowsheet specifically attributable to WHIMS improvements. |
| ● | Plant availability is calculated at 90%. |
| ● | Tonnes of concentrate are presented as dry metric tonnes. |
| ● | An exchange rate of 1.35 CAD/USD was fixed over the LOM for the Project. |
| Revision: 0 – 14-Aug-2026 B198-D01-02054-RT-0010 |
Page 246 |
| NAL Expansion FS Mineral Reserve Pre-Feasibility Study NI 43-101 Final Report Prepared for Elevra |
|
| ● | The average 6% Li2O concentrate (SC6) price is based on a market analysis from Benchmark Mineral Intelligence for Q1 2026 as described in the market section and varies over the LOM from US$1,260/t to US$2,430/t. |
| ● | Average LOM SC6 pricing may vary between the cases due to longer mine life at the long term US$2,430 price for the base case (2036 and beyond). |
| ● | A discount rate of 8% was used for the base case and expansion scenarios. |
| ● | Net Cash Flow and valuation calculations include investment tax credit on CAPEX. |
| ● | The numbers have been rounded. Any discrepancy in the totals is due to rounding effects. |
| ● | The expansion case ore processed is less than base case as ore-sorting is used to reject high Fe low Li2O material which in turn increases the ore processed grade relative to the base case. |
| 22.1 | Reconciliation with Previous Scoping Study |
The motivation of the revisions in this prefeasibility study from the previously published scoping study, is to reduce risk in the project execution by staging integration of new infrastructure, bring forward production increase and adjust the throughput. Indirectly the price of Spodumene is updated to ensure the pertinence of the study in the reality of the commodity price, the table below compares the previous scoping study expansion scenario to the current prefeasibility study (PFS) .
Table 22-3: Expansion Scenarios - Previous Scoping Study and Present PFS
| Parameters | Unit | Previous Scoping | Present PFS | Variance |
| Exchange Rate | CAD/USD | 1.35 | 1.35 | - |
| LOM | Years | 24 | 20 | -16.7% |
| Average Price 6% Li2O | USD$/t | 1,392 | 2,137 | 53.5% |
| Mining Cost (ore and waste) | C$/t mined | 7.60 | 7.91 | 4.1% |
| Process Cost | C$/t milled | 35.4 | 34.8 | -1.7% |
| G&A | C$/t milled | 13.4 | 13.1 | -2.2% |
| Transport Cost | C$/t conc | 123.8 | 119.6 | -3.4% |
| Total OPEX | C$M | 6,062 | 5,949 | -1.9% |
| LOM C1 Cost Concentrate | C$/t conc | 877 | 876 | -0.1% |
| LOM AISC | C$/t conc | 952 | 954 | 0.2% |
| LOM C1 Cost of Concentrate (post expansion) | C$/t conc | 851 | 851 | 0.0% |
| LOM AISC (post expansion) | C$/t conc | 922 | 918 | -0.4% |
| Total SUSEX | C$M | 517 | 527 | 1.9% |
| Total Initial CAPEX | C$M | 366 | 366 | - |
| Net Cash Flow (pre-tax) | C$M | 4,626 | 10,822 | 133.9% |
| NPV (8%) (pre-tax) | C$M | 1,798 | 4,655 | 158.9% |
| NPV Expansion Only (8%) (pre-tax) | C$M | 628 | 1,462 | 132.8% |
| IRR Expansion (pre-tax) | % | 26.4% | 58.3% | 120.8% |
| Payback (pre-tax) | Months | 36 | 29 | -19.4% |
| Net Cash Flow (post-tax) | C$M | 3,249 | 7,307 | 124.9% |
| NPV (8%) (post-tax) | C$M | 1,284 | 3,218 | 150.6% |
| NPV Expansion Only (8%) (post-tax) | C$M | 479 | 943 | 96.9% |
| IRR Expansion (post-tax) | % | 26.4% | 49.9% | 89.0% |
| Payback (post-tax) | Month | 46 | 34 | -26.1% |
To better understand the impact of staging improvements, the staging, operating cost and throughput increase is separated from the changes in price. The following Table 22-4 shows the contribution of each to the increase in NPV8% the expansion scenario.
Table 22-4: Expansion NPV8% contribution - Staging/Throughput and Price Li2O.
| Parameters | Unit | Staging / Throughput* | Price Li2O | Total NPV increase |
| NPV8%Expansion Only (pre-tax) | C$M | 409 | 425 | 834 |
| NPV8%Expansion Only (post-tax) | C$M | 227 | 237 | 464 |
*Predominantly staging/throughput in addition to other assumption changes
| Revision: 0 – 14-Aug-2026 B198-D01-02054-RT-0010 |
Page 247 |
| NAL Expansion FS Mineral Reserve Pre-Feasibility Study NI 43-101 Final Report Prepared for Elevra |
|
From the table, 51% of the impact in NPV8%post tax increase is predominantly a contribution of the staging and throughput increase while 49% is attributable to the increase in Li2O price from the previous study.
| 22.2 | Sensitivity Analysis |
A sensitivity analysis was conducted on the factors presented below:
| ● | Spodumene Price |
| ● | Exchange Rate |
| ● | Blended Li2O Grade |
| ● | OPEX |
| ● | Project CAPEX |
| ● | Sustaining CAPEX |
| ● | Mill Recovery |
Post-Tax NPV8% sensitivities range from -30% to +30% for all factors. The impact of the NPV8% (in CAD $M) outputs was tested at discount rate of 8%. Figure 22-1 demonstrates the NPV8% value of the asset with new expansion capacity whereas Figure 22-2 demonstrates the improvement in NPV8% the Expansion provides relative to remaining with the Base Case.
| Revision: 0 – 14-Aug-2026 B198-D01-02054-RT-0010 |
Page 248 |
| NAL Expansion FS Mineral Reserve Pre-Feasibility Study NI 43-101 Final Report Prepared for Elevra |
|
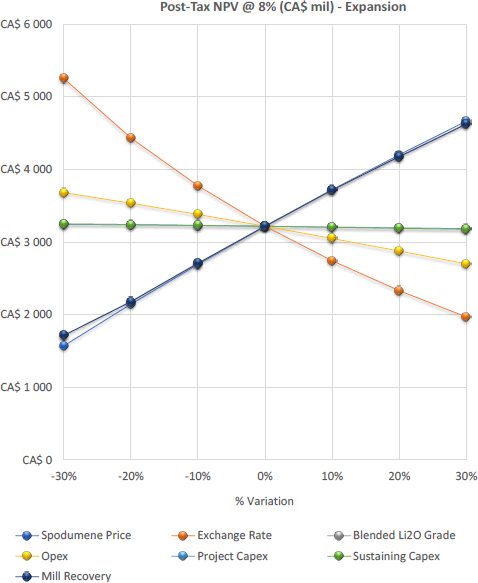
Figure 22-1: Sensitivity Analysis on NPV8%
| Revision: 0 – 14-Aug-2026 B198-D01-02054-RT-0010 |
Page 249 |
| NAL Expansion FS Mineral Reserve Pre-Feasibility Study NI 43-101 Final Report Prepared for Elevra |
|
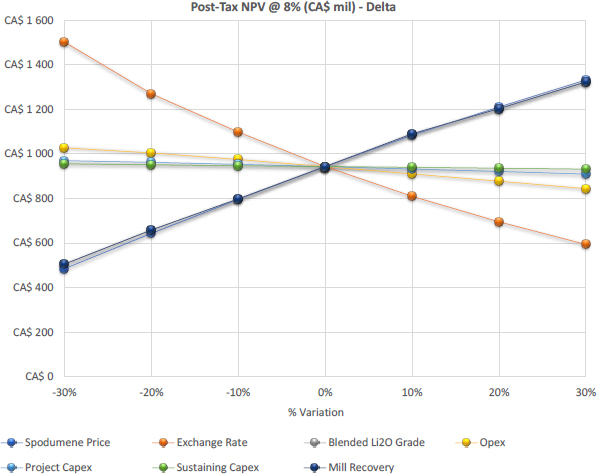
Figure 22-2: Sensitivity Analysis on NPV8% Expansion Only (difference of Expansion and Base Cases)
| Revision: 0 – 14-Aug-2026 B198-D01-02054-RT-0010 |
Page 250 |
| NAL Expansion FS Mineral Reserve Pre-Feasibility Study NI 43-101 Final Report Prepared for Elevra |
|
| 23 | Adjacent Properties |
The area around the Property contains several active exploration projects. No data from these projects has been used in the preparation of the MRE for the Project.
| Revision: 0 – 14-Aug-2026 B198-D01-02054-RT-0010 |
Page 251 |
| NAL Expansion FS Mineral Reserve Pre-Feasibility Study NI 43-101 Final Report Prepared for Elevra |
|
| 24 | Other Relevant Data and Information |
| 24.1 | Project Execution Plan |
The project execution strategy will be based on the project development sequence identified by Elevra and published in the previous ASX press release “Accelerated NAL Expansion” published on January 12th, 2026. The following dates were identified for the delivery of the three Stages:
| ● | Stage 1: An initial 15-20% increase in annual spodumene concentrate production above current production levels commencing in mid-CY27 with an incremental reduction in unit operating costs. This increase is within the current limits of the milling permit, which is set at 4,500 tpd; |
| ● | Stage 2: A subsequent expansion of downstream milling, flotation and filtration capacity to 6,500 tpd with an anticipated corresponding concentrate production rate of 348,000 tonnes per year. The incremental feed material will be processed using a temporary mobile crushing circuit operating in conjunction with the existing crushing circuit. The further expanded production is expected to commence early CY28, with an additional incremental reduction in unit operating costs; and |
| ● | Stage 3: The replacement of the temporary mobile crushing circuit and the existing crushing circuit with a new crushing circuit capable of meeting feed requirements for a LOM average production of 315ktpa. This final step is expected to be completed in mid-CY29 and is expected to deliver crushing cost efficiencies required to meet the anticipated LOM cost reduction. |
Engineering development will continue following the Mineral Reserves PFS. A feasibility study is planned to increase the accuracy of the cost estimate and further derisk the Project.
As outlined in the January 2026 ASX press release, Elevra plans to move directly to detailed engineering following the Mineral Reserves PFS to advance Stage 1 and Stage 2 to a level required for construction. Procurement of long lead items for Stage 1 and Stage 2, and early works and site preparation will be initiated shortly after the start of detailed engineering.
A preliminary project execution strategy for the remaining activity, construction of the expansion project was developed and is shown in Figure 24-1. Further development and detailed execution planning will be undertaken in the next project phase.
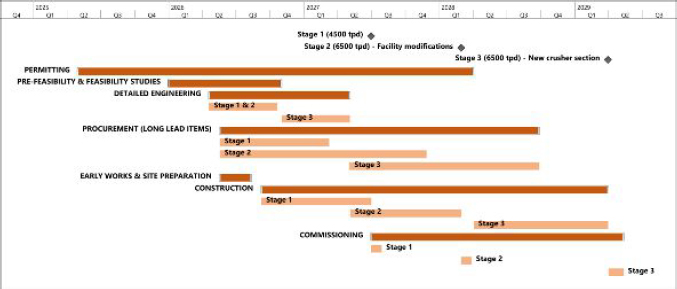
Figure 24-1: Indicative timeline for the NAL Expansion Project
| Revision: 0 – 14-Aug-2026 B198-D01-02054-RT-0010 |
Page 252 |
| NAL Expansion FS Mineral Reserve Pre-Feasibility Study NI 43-101 Final Report Prepared for Elevra |
|
| 24.2 | Project Risks and Opportunities |
A risk review session was held during the PFS with the participation of discipline leads from Elevra, Sedgman Novopro and Optimal Mining. This session served to provide an update on the risks and opportunities identified during the initial kick-off risk review workshop held on February 2nd, 2026 for the Updated Scoping Study phase of the Project. This initial risk workshop reviewed risks and opportunities from previous project phases and identified new risks based on past experience in other spodumene projects. These efforts lead to the development of Project’s preliminary risk register documenting a total of 78 risks and 6 opportunities.
Each risk and opportunity was evaluated based on probability and consequence criteria, and were assessed across health and safety, financial, environmental, community relations, project development, regulatory compliance, systems/data, management, and operations areas. Mitigation measures were proposed for all risks, and residual ratings were reassessed following mitigation.
| 24.2.1 | Risks |
The mitigation measures for the highest rated process risks were implemented during the PFS. As these are now part of the base case, the associated risk has been removed. A subset of risks remains with high residual ratings due to their influence on the overall project. This high rating could be from insufficient mitigation measures or the high baseline of the risk itself despite the proposed mitigations. These residual risks and proposed mitigation measures are listed in Table 24-1.
Table 24-1: Project Risks
| Risk Description | Mitigation Measure(s) |
| Increased dust production and emissions due to Stage 2 temporary contract crusher | ● Mitigation measures to be determined. Contact crusher supplier to determine possible mitigation measures. |
| Significant increase in ROM pad traffic due to higher throughput requirements with consequence of vehicles and/or personnel impact by mine vehicle whilst accessing equipment in the vicinity of the ROM bin (on ROM pad). |
● Mining team to develop ROM plan showing space and volumes. ● Crusher design will be such that personnel segregation from ROM Pad will be possible with access via positive communications including radio and lights system. – Secluded area for the access to the equipment – Windrow protection – No direct access from process plant to ROM pad |
| Damage to existing and new equipment during construction | ● Insurance during construction (bid pending at time of this report) |
| Increased chance of fire during construction due to hot work | ● Firewatch to be implemented during construction work |
| Safety and health concern from release of residue accumulated on equipment from operations during demolition | ● Wash area for demolished equipment |
| Schedule risk due to difficulties sourcing equipment (same model as in-place, shipping location) |
● Possibility to source used equipment ● Favor simple equipment that can be fabricated locally |
| Delay to start of detail engineering |
● Ramp up of detailed engineering to be started as soon as possible ● Sedgman and Elevra to ensure robust communications to ensure project timeline is understood at all times. ● Following establishment of project strategy, engineering and implementation kick-off will need to be immediate to prevent schedule slip. |
| Environmental impact of temporary crushing circuit due to excessive dust and noise emissions |
● Temporary crusher design to fit into current environmental limits. ● Additional dust control & sound control measures to be implemented if necessary |
| New permitting required for Increased dump/tailings capacity needed for the expansion |
● Review of dump height ● Ensure social acceptance, particularly with First Nations |
| Difficulties obtaining permit/approval to drain nearby lake (Lortie Lake) | ● PFS-level cost prepared for close-out of the lake. |
| Revision: 0 – 14-Aug-2026 B198-D01-02054-RT-0010 |
Page 253 |
| NAL Expansion FS Mineral Reserve Pre-Feasibility Study NI 43-101 Final Report Prepared for Elevra |
|
| ● Studies on-going to present findings on conservation of the lake and show that there is no alternative to draining. | |
|
Difficulties obtaining social license in the Project footprint due to previous noise complaints from nearby Lac Legendre community (More than 100 noise complaints per year.) |
● Noise studies completed ● Noise monitoring system near the lake ● Procedure for noise complaints |
| Financing gap is longer than expected. | ● Improve overall project definition by advancing engineering. |
| Capital escalation of equipment |
● Multiple cost estimates developed to ensure rigorous cost tracking ● Simplification of the plant expansion strategy ● Monte Carlo analysis to reduce risk |
| 24.2.2 | Opportunities |
Key process optimizations have been incorporated in the PFS expansion design; still, opportunities remain to improve the Project. The major opportunities that have been identified for the Project are summarized in Table 24-2. These opportunities exclude those typical to all mining projects, such as changes in product prices, exchange rates, etc.
Table 24-2: Project Opportunities
| Opportunity Description | Benefit |
| Opportunity to reuse the existing colour sorters for both applications if washing can be implemented in both summer and winter effectively. |
CAPEX savings from not replacing ore sorters. Noted colour performance will typically not be as good as XRT (ability to separate liberation/inclusions, etc,) so for long term this performance difference (and ability to effectively wash in winter) will need to be considered. |
| Reducing density in rod mill to reduce slimes generation | Reduction in slimes generation leading to increased rod mill performance. |
| Use of superstacks instead of stacksizers for classification. Reports by Derrick indicate that superstacks are a viable alternative to stacksizers. | Reduction in CAPEX. Derrick report indicates that superstacks is a viable alternative to stacksizer. |
| Further plant capacity expansion in the future due to larger ball mill included in base case. Potential for increased capacity to 8400 tpd | Potential for increased capacity to 8400 tpd. Further debottlenecking will be required to ensure downstream processes can meet the increased capacity offered by the larger ball mill |
| Opportunity to reuse the existing primary cyclones in Stage 2 instead of a new larger cyclone. | Reduction in CAPEX. Will add flexibility to the operation when running on one train only (improved maintainability, rod charging stability, ability to reduce power draw as required). |
| Opportunity to convert dilution tank to additional conditioning stage for short term improvement. |
Reduction in CAPEX. Insufficient real estate to easily install new conditioning tanks in Stage 1. Additional conditioning tank is mostly relevant for Stage 1, new rougher in Stage 2 will lessen the value of additional conditioning in Stage 1 |
| Modularization of equipment packages to reduce costs and reduce reliance on local contractors. | Reduction in CAPEX. Use a laydown and staging area in the nearby town of Barraute |
| Use of prefabricated concrete as an opportunity for cost and schedule benefit. | Reduction in CAPEX. Target of 50% of volume as prefabricated concrete |
| Federal and Provincial government incentives | Direct support or tax incentives |
| Revision: 0 – 14-Aug-2026 B198-D01-02054-RT-0010 |
Page 254 |
| NAL Expansion FS Mineral Reserve Pre-Feasibility Study NI 43-101 Final Report Prepared for Elevra |
|
| 25 | Interpretation and Conclusion |
The Mineral Reserves PFS demonstrates the potential economic viability of an Expansion of the NAL Operation. The conclusions are supported by the following:
| 25.1 | Geology and Resources |
| 25.1.1 | Geology |
Geology and mineralization on the NAL Property are well understood following decades of exploration, resource evaluation and active mining.
The geological model supporting the Mineral Resource estimate has been substantially updated following the incorporation of new drilling results from the 2023 and 2024 programs. The geological model now contains a total of 117 spodumene-bearing pegmatite dyke wireframes, of which 93 demonstrate RPEEE ‘reasonable prospects for eventual economic extraction’.
The NAL Mineral Resource estimate incorporates geological and analytical data for 563 surface-collared drillholes completed between 2009 and the end of 2024.
| 25.1.2 | Mineral Resource Estimates |
The NAL Mineral Resource estimate as of June 6th, 2025, is 95 Mt at 1.15% Li2O, applying a cut-off grade of 0.60% Li2O for open pit and 0.70% Li2O for underground resources. The Mineral Resource estimate includes open-cut Indicated resources of 76.2 Mt at 1.17% Li2O; and open-cut Inferred resources of 8.6 Mt at 1.13% Li2O, applying a cut-off grade of 0.60% Li2O. The Mineral Resource estimate also includes underground Inferred resources of 10.3 Mt at 1.01% Li2O, applying a cut-off grade of 0.70% Li2O.
| 25.2 | Mining |
The North American Lithium Mineral Reserves have been estimated for a total of 47.2Mt of Proven and Probable Mineral Reserves at an average grade of 1.12% Li2O, which is comprised of 0.2Mt of Proven Mineral Reserves at an average grade of 0.93% Li2O and 47.0Mt of Probable Mineral Reserves at an average grade of 1.12% Li2O.
The Mineral Reserve estimate is underpinned by a detailed mine plan which includes pit phasing, a dilution model which ensures that potential ROM ore feed respects final product specifications, a detailed LOM schedule, which includes stockpiling, tailings disposal and haulage modelling, that results in a positive cash flow for the Project.
| 25.3 | Metallurgy and Processing |
The NAL expansion project is scheduled to process an annual average rate of 6,500 tpd of blended ore. Based on a plant feed Li2O grade of 1.01%, the process design estimates a spodumene concentrate average annual 5.4% Li2O concentrate production rate at 338,000 tpa.
The financial model considers a LOM average annual 5 production rate of 348 ktpa (or 373 ktpa post expansion). These rates are superior to the process design criteria due to the production rate being dependant on the plant feed grade; the financial model considers a 1.17% feed grade. The process design is based on lower grades but supports the rates used in the financial model.
| Revision: 0 – 14-Aug-2026 B198-D01-02054-RT-0010 |
Page 255 |
| NAL Expansion FS Mineral Reserve Pre-Feasibility Study NI 43-101 Final Report Prepared for Elevra |
|
The existing crusher, ore sorting, new crusher and ore storage areas are designed to operate with an availability of 65%. The processing plant, including the milling, classification, desliming, magnetic separation, flotation and dewatering, is designed to operate at 90% availability. The processing plant will operate on a 24-hour per day and 7 days per week basis.
Metallurgical recovery is improved at the onset of the stage implementation and will achieve an estimate of 71.2 % average over the life of mine as disclosed in the previous study. This recovery is well supported by previous testwork as described in Chapter 13 – Mineral Processing and Metallurgical Testing.
The recovery benefits from the existing operation will come from the following flowsheet improvements:
| ● | Improved flotation feed sizing due to increased classification capacity and mill power. |
| ● | Improved magnetic separation circuit (LIMS and WHIMS) |
| ● | Improved flotation conditioning |
| ● | Improved rougher flotation control and flexibility |
| ● | Improved cleaner tails handling |
These improvements targeting specific areas will lead to recovery gradually increasing through the staged approach with the full benefits achieved by Stage 2 with all optimisations captured.
| 25.4 | Infrastructure and Water Management |
The tailings and water management are based on a strategy of placing conventional spodumene tailings in Tailings Storage Facility 1 (TSF-1) until mid-2029.
Additional TSF-2 and TSF-3 are required and have been planned for as part of the Mineral Reserves PFS design. This planning includes site selection, integrated construction with waste rock storage, progressive embankment raises, capital and operating cost estimates.
Construction of a dyke at Lortie Lake would allow the extraction of mineral resources located beneath a portion of the waterbody. The dyke would maintain the water level in the retained section of the lake, notably to limit impacts on fish habitat, while ensuring safe conditions for mining operations.The WMP was updated to manage flows from the expansion scenario. Water management focuses on water diversion, where possible. Water management infrastructure will be phased in as required.
| 25.5 | Market Studies |
The feasibility study utilises information from the “Lithium Forecast Report” study prepared by Benchmark Minerals for Sayona dated Q1, 2026 (Benchmark Minerals, 2026).
Global lithium supply is expected to increase materially in 2026, despite the pricing pressure seen through much of 2025. Supply is forecast to rise by around 250 kt LCE year-on-year, or approximately 15%, including recycling. Despite strong supply growth, the market is still expected to remain in deficit in 2026, as robust demand growth – particularly from electric vehicles and energy storage systems – continues to outpace new supply. By 2027, the surplus remains modest at less than 1% of total market size, pointing to a market that is close to balance.
Forecast pricing for SC6 used in the financial evaluation varies between US$1,260/t in 2031 to US$2,430 in 2036.
| Revision: 0 – 14-Aug-2026 B198-D01-02054-RT-0010 |
Page 256 |
| NAL Expansion FS Mineral Reserve Pre-Feasibility Study NI 43-101 Final Report Prepared for Elevra |
|
| 25.6 | Project Costs and Financial Evaluation |
| 25.6.1 | Capital Costs |
The total estimated initial capital cost for AACE Class 4 of the NAL Expansion Project is estimated at C$ 366,053,000. These costs are stated in constant dollars as of February 2026.
The Capex estimate includes all the direct and indirect project costs, complete with the associated contingency. The estimating methods include quotations from vendors and suppliers specifically sought for this project, factoring and historic projects and allowances based on past projects.
| 25.6.2 | Operating Costs |
Operating costs for the project have been calculated at C$1,048 per tonne of concentrate for base case and C$876 per tonne of concentrate for the expansion scenario.
The OPEX for the base and the three expansion stages are calculated from the NAL operating budgets. The base case is developed from an annual average feed rate of 3,780 tpd while the expansion stages are based on an average annual processing rate of 4,500 tpd for Stage 1, and an average annual processing rate of 6,500 tpd for Stage 2 and Stage 3.
The OPEX was developed in accordance with the requirement of a Scoping Study level study with a nominal accuracy range of ± 20%. The level of estimation is supported by actual operational information including salaries, consumables, maintenance costs and established contracts and therefore are more precise given this is a brownfield project.
| 25.6.3 | Project Economics |
Analysis of the financial model on the key economic assumptions indicates that the Project is robust in terms of operating costs and Capex. The Project is most sensitive to changes in commodity prices, exchange rates, and recoveries.
The Project demonstrates robust operational and financial metrics, with the key Project assumptions and outputs shown in the tables below. The main highlights of the Project’s financial analysis are presented in Table 25-1 and Table 25-2. Financial Analysis was performed commencing as of Fiscal Year 2027.
Table 25-1: Main financial assumptions and results summary for the NAL Expansion Project
| Parameters | Unit | Base | Expansion |
| Average Price 6% Li2O | US$/t | $2,260 | $2,137 |
| Life of mine (from FY2027) | yrs | 35 | 21 |
| Total Waste | Mt | 336 | 336 |
| Total Ore | Mt | 47 | 44 |
| Strip Ratio | - | 7.1 | 7.1 |
| Average Annual ROM | Mt/y | 1.34 | 2.24 |
| Average Feed Grade | % Li2O | 1.12% | 1.17% |
| LOM 5.4% Li2O Produced | Mt | 6.78 | 6.80 |
| LOM Average Annual 5.4% Li2O | kt/y | 193 | 323 |
| Average Annual 5.4% Li2O production (post expansion) | kt/y | 199 | 373 |
Notes:
| ● | Total ore value for the expansion case is lower than the base case due to ore sorting. |
| Revision: 0 – 14-Aug-2026 B198-D01-02054-RT-0010 |
Page 257 |
| NAL Expansion FS Mineral Reserve Pre-Feasibility Study NI 43-101 Final Report Prepared for Elevra |
|
Table 25-2: Project Economics
| Parameters | Unit | Base | Expansion |
| Exchange Rate | CAD/USD | 1.35 | 1.35 |
| Mining Cost (ore and waste) | C$/t mined | 8.60 | 7.91 |
| Process cost | C$/t milled | 42.57 | 34.81 |
| G&A | C$/t milled | 17.31 | 13.05 |
| Transport Cost | C$/t conc | 142.37 | 119.81 |
| Total OPEX | C$M | 7,086 | 5,949 |
| LOM C1 Cost Concentrate | C$/t conc | 1,048 | 876 |
| LOM AISC | C$/t conc | 1,126 | 918 |
| LOM C1 Cost of Concentrate (post expansion) | C$/t conc | 1,045 | 851 |
| LOM AISC (post expansion) | C$/t conc | 1,112 | 918 |
| Total SUSEX | C$M | 512 | 527 |
| Total initial CAPEX | C$M | - | 366 |
| Net Cash Flow (pre-tax) | C$M | 10,297 | 10,822 |
| NPV8% (pre-tax) | C$M | 3,193 | 4,655 |
| NPV8%Expansion Only (pre-tax) | C$M | - | 1,462 |
| IRR Expansion (pre-tax) | % | - | 58.3% |
| Payback (pre-tax) | Months | - | 29 |
| Net Cash Flow (post-tax) | C$M | 7,471 | 7,307 |
| NPV8% (post-tax) | C$M | 2,274 | 3,218 |
| NPV8%Expansion Only (post-tax) | C$M | - | 943 |
| IRR Expansion (post-tax) | % | - | 49.9% |
| Payback (post-tax) | Month | - | 34 |
Notes:
| ● | All costs and sales are presented in constant 2026 CAD, with no inflation or escalation factors considered. |
| ● | $M = millions of dollars. |
| ● | The financial analysis was performed on existing Mineral Reserves as outlined in this report. |
| ● | The valuation calculations are unlevered. |
| ● | The average metallurgical recovery over the LOM is 71.2% for the expansion and 69.2% for the base case due to improvement in the mill flowsheet specifically attributable to wet high-intensity magnetic separator (WHIMS) improvements. |
| ● | Plant availability is calculated at 90%. |
| ● | Tonnes of concentrate are presented as dry metric tonnes. |
| ● | An exchange rate of 1.35 CAD/USD was fixed over the LOM for the Project. |
| ● | The average 6% Li2O concentrate (SC6) price is based on a market analysis from Benchmark Mineral Intelligence for Q1 2026 as described in the market section and varies over the LOM from US$1,260/t to US$2,430/t. |
| ● | Average LOM SC6 pricing may vary between the cases due to longer mine life at the long term US$2,430 price for the base case (2036 and beyond). |
| ● | A discount rate of 8% was used for the base case and expansion scenarios. |
| ● | Net Cash Flow and valuation calculations include investment tax credit on CAPEX. |
| ● | The numbers have been rounded. Any discrepancy in the totals is due to rounding effects. |
| ● | The expansion case ore processed is less than base case as ore-sorting is used to reject high Fe low Li2O material which in turn increases the ore processed grade relative to the base case. |
| Revision: 0 – 14-Aug-2026 B198-D01-02054-RT-0010 |
Page 258 |
| NAL Expansion FS Mineral Reserve Pre-Feasibility Study NI 43-101 Final Report Prepared for Elevra |
|
| 26 | Recommendations |
This NI 43-101 compliant technical report on North American Lithium’s Expansion Project was prepared by experienced and qualified independent consultants using established engineering methodologies and standards. It provides a comprehensive summary of findings across key areas, including exploration, geological modelling, mineral resources, open pit mine design, metallurgy, process design, infrastructure, environmental management, waste and water management, capital and operating costs, and economic analysis. The depth of investigation in each area meets or exceeds the standards typically expected of a scoping study.
The study’s results demonstrate that the Project is technically feasible and has the potential to be value accretive under the Mineral Reserves PFS case assumptions. Analysis of the results and findings from each major area investigated in this Mineral Reserves PFS suggests several recommendations for further studies.
| 26.1 | Geology and Resources |
The following actions are recommended for the next phase of the Project:
| ● | Continue resource definition drilling within the conceptual resource pit shell to upgrade remaining Inferred resources to Indicated category and improve geological continuity. |
| ● | Continue exploration drilling outside of the conceptual resource pit shell to assess the potential for additional Mineral Resources growth. |
| ● | Complete additional bulk density measurements across pegmatite and waste rock to support the calculation of a density regression formula. Apply the regression formula to support more accurate Mineral Resource characterization. |
| ● | Complete additional iron analyses for pegmatites and waste rock to support more accurate Mineral Resource characterization. |
| ● | Continue detailed geological mapping of exposed pegmatite dykes in open cut pit faces and incorporate results in a future update of the geological model. |
| ● | Regularly review and update Mineral Resource estimation methodology as new drilling data becomes available. Test sensitivity of estimated ore volumes and grades to different data preparation, domaining and Li2O grade estimation methods. |
| ● | Reconcile modelled pegmatite domain geometries, volumes and Li2O grades against recent mine production data. |
| 26.2 | Mining and Reserves |
The following actions are recommended for the next phase of the Project:
| ● | A fleet selection study should be completed with the results of this study used as the basis for the assessment. The fleet selection study must evaluate the potent mining costs savings which can be realised through the use of larger equipment, without negatively impacting loss and dilution of the ore. The results of the fleet selection study should provide guidance on the potential increase in Reserves and life-of-mine physicals. |
| ● | Focus on the securing of approvals for all aspects of the life-of-mine plan, in particular the HS-4 waste storage area. Gaining of approvals to store waste in the HS-4 facility will provide operating economic benefits due to the closer proximity of HS-4 to the pit compared to other waste storage areas. |
| Revision: 0 – 14-Aug-2026 B198-D01-02054-RT-0010 |
Page 259 |
| NAL Expansion FS Mineral Reserve Pre-Feasibility Study NI 43-101 Final Report Prepared for Elevra |
|
| ● | The benefit that backfilling of mined out voids provides should be thoroughly evaluated. Backfilling of mined out voids will provide lower operating costs, reduce the size of the final pit void and reduce the height or size of the out-of-pit dumps. This will only be an option if the surrounding host rock has been drilled sufficiently to ensure that no potentially recoverable ore is sterilised. |
| 26.3 | Metallurgy and Processing |
The process design proposed for the Mineral Reserves PFS is based on previous metallurgical studies and experience acquired from work on similar spodumene projects across the world. The work completed should be further advanced during a detailed engineering phase to bring the engineering to a level suitable for construction.
The work described below is underway and will help confirm and support design parameters used in the Mineral Reserves PFS.
| ● | Plant trials on operating the existing WHIMS in parallel. These trials will help validate the increases in recovery assumed in the design. |
| ● | Flotation conditioning tests in the processing plant to increase understanding of the potential improvements and impact on downstream flotation. |
| ● | Repeat surveys and simulations to assess the new flotation feed PSD and expected slimes generation. |
To further de-risk the project, the following test is recommended in addition to the planned testwork described above. This additional testwork program would be completed in the next phase of the project.
| ● | Optimisation testwork on the WHIMS to understand the limitations and set targets for plant operations. |
| 26.4 | Waste and Water Management |
The waste and management design proposed for the Mineral Reserves PFS is based on previous geotechnical and hydrogeological investigations and experience acquired from similar projects. The work completed should be further advanced during a detailed engineering phase to bring the engineering to a level suitable for construction.
| ● | Advance the detailed geotechnical and hydraulic design of TSF-2 and TSF-3, including centreline embankment configuration, seismic and dam safety criteria, and integration of waste rock into embankment construction, to support the next study phase and permitting. This includes the completion of a site-specific seismic hazard assessment. |
| ● | Complete additional geotechnical and hydrogeological investigations, particularly for the TSF-3 footprint and new waste rock storage areas, to reduce key uncertainties and confirm foundation conditions and long-term performance for the expanded mine waste storage system. |
| ● | Finalize the design of site water management infrastructure (basins B1–B5, drainage ditches, sedimentation ponds and surge pump basins) and the associated treatment scheme, ensuring adequate capacity under design storm and freshet events and compliance with applicable provincial and federal water quality requirements. |
| ● | Refine the closure and monitoring framework for TSF-1, TSF-2, TSF-3 and waste rock storage areas, including beach reclamation, long-term drainage to spillways, and instrumentation and water quality monitoring programs from operations through post-closure, so that commitments are clearly reflected in the updated closure plan and regulatory approvals. |
| Revision: 0 – 14-Aug-2026 B198-D01-02054-RT-0010 |
Page 260 |
| NAL Expansion FS Mineral Reserve Pre-Feasibility Study NI 43-101 Final Report Prepared for Elevra |
|
| 26.5 | Project Costs and Financial Evaluation |
Several items mentioned in the previous chapters will reduce costs and improve the financial position of the deposit. The Mineral Reserves PFS CAPEX is on the level of an AACE Class 4, and a Definitive Feasibility Study phase is planned to increase the accuracy of the estimate to a Class 3 and further derisk the Project.
Elevra is planning on moving directly to Detailed Engineering for Stages 1 and 2 following the Mineral Reserves PFS to bring the engineering to a level appropriate to meet the construction timelines outlined in this Mineral Reserves PFS. It is recommended to proceed with the DFS and Detailed Engineering as described in the preliminary Project Schedule.
| Revision: 0 – 14-Aug-2026 B198-D01-02054-RT-0010 |
Page 261 |
| NAL Expansion FS Mineral Reserve Pre-Feasibility Study NI 43-101 Final Report Prepared for Elevra |
|
| 27 | References |
Agence Canadienne d’Évaluation Environnementale. (2018). Projet de mine de spodumène North American Lithium. Rapport d’étude approfondie. 107 p.
Asselin, R. (2016). Final – Procédures Forages de Surface 2016. Internal North American Lithium report (in French).
BBA. (2023). Tailing Storage Facility 2 – Geotechnical Baseline Study – Geotechnical Investigation Report. Report n° 6015037-023100-41-ERA-0001-R01.
BBA. (2023). Updated Definitive Feasibility Study Report for the Authier Lithium Project. Prepared for Sayona Mining Limited, dated April 14, 2023.
Benchmark Minerals. (2022). Lithium Forecast | Q1 2022. Benchmark Mineral Intelligence.
Benchmark Minerals. (2026). Lithium Forecast | Q1 2026.
Blanchet, D., Hardie, C., Lavery, M., Lemieux, M., Nussipakynova, D., Shannon, J., & Woodhouse, P. (2011). Feasibility Study Update, NI 43-101 Technical Report, Québec Lithium Project, La Corne Township, Québec. Prepared for Canada Lithium Corp.
Breaks, F., & Tindle, A. (1997). Rare-Metal Exploration Potential of the Separation Lake Area: An Emerging Target for Bikita-Type Mineralization in Superior Province, Northwestern Ontario. Ministry of Energy, Northern Development and Mines Publication OFR5966.
Canada Lithium Corp. (2012). Feasibility Study Update – NI 43-101 Technical Report, Québec Lithium Project, La Corne Township, Québec, October, 2012.
Canadian Dam Association (CDA). (2007, Edition 2013). Dam Safety Guidelines.
Canadian Dam Association. (2013). Application of Dam Safety Guidelines to Mining Dams.
Canadian Dam Association. (2014). Application of Dam Safety Guidelines to Mining Dams.
Carrier, A., & Kerr-Gilespis, F. (2016). Note technique préliminaire de diligence raisonnable sur la campagne de forage de surface et d’échantillonnage. InnovExplo due diligence report, 10 p. (in French).
Castro, L., & El Madani, F. (2010). Feasibility Pit Slope Design. Québec Lithium Open Pit Project - report no. 10-1221-0017-3000-Rev0.
Černý, P. (1991). Rare Element Granitic Pegmatites. Part I: Anatomy and Internal Evolution of Pegmatite Deposits. Geoscience Canada, v.18, (pp. 46-67).
Corfu, F. (1993). The evolution of the southern Abitibi greenstone belt in light of precise U-Pb geochronology. Economic Geology (1993) 88 (6): 1323–1340.
Dawson, K. (1966). A Comprehensive Study of the Preissac-La Corne Batholith, Abitibi Country, Québec. Geological Survey of Canada, Bulletin 142. .
Derry, D. (1950). Lithium-bearing Pegmatites in Northern Québec. Economic Geology, v. 45(2), (pp. 95-104). Direction de la sécurité des barrages (DSB). (2024). Chapitre S-3.1.01 – Loi sur la sécurité des barrages.
Elevra Lithium Limited. (2026). ASX Announcement “Accelerated NAL Expansion”. Dated January 12th, 2026.
Englobe. (2025). Analyse hydrologique du lac Lortie. Report n° 05-02502921.000-0100-GS-R-0001-0A. Englobe. (2025). Digue du lac Lortie. Rapport n° 05-02502921.000-0100-GS-R-0004-00.
Englobe. (2025). Rapport géotechnique et hydrogéologique factuel de la zone d’étude Nord. Rapport n° 05-02502921.000-0100-GS-R-0006-00.
Englobe. (2025). Stabilité géotechnique du Parc Québec Lithium – Conditions existantes. Rapport n° 05-02502921.000-0100-GS-R-0005-00.
Englobe. (2026). Analyse dynamique des sols et évaluation du potentiel de liquéfaction - Projet de conception géotechnique d’un ouvrage de retenue pour le parc à résidus miniers de Québec Lithium, Québec. Rapport n° 05-02502921.002-0100-GS-N-0003-00.
Englobe. (2026). Étude intégrée et modélisation numérique des eaux souterraines – Agrandissement phase 5. Rapport n° 05-02601707.000-0400-GS-R-0001-0B.
Englobe. (2026). Rapport géotechnique factuel de l’Ancien PAR et du lac Lortie. Rapport n° 05-02502921.002-0100-GS-R-0001-0A.
Englobe. (2026). Stabilité du mort-terrain de la fosse projeté. Rapport n° 05-02502921.000-0100-GS-N-0004-00.
Environment Canada. (2016). Guidelines for the Assessment of Alternatives for Mine Waste Disposal.
| Revision: 0 – 14-Aug-2026 B198-D01-02054-RT-0010 |
Page 262 |
| NAL Expansion FS Mineral Reserve Pre-Feasibility Study NI 43-101 Final Report Prepared for Elevra |
|
Feng, R., & Kerrich, R. (1991). Single zircon age constraints on the tectonic juxtaposition of the Archean Abitibi greenstone belt and Pontiac Subprovince, Québec, Canada. Geochimica et Cosmochimica Acta, volume 55 Issue 11.
Gariépy, C., & Allègre, C. (1985). The lead isotope geochemistry and geochronology of late-kinematic intrusives from the Abitibi greenstone belt, and the implications for late Archaean crustal evolution. Geochimica et Cosmochimica Acta, volume 49 Issue 11.
GCM Consultants. (2022). Avis technique – Critères de conception pour l’enveloppe de fosse de niveau préfaisabilité – Site minier Lithium Amérique du Nord, Lacorne, Québec. Rapport n° 22515754-148-MTF-Rev0.
Golder. (2017). Niveau Maximum d’Opération du Parc à Résidus #1 – Phase 1B+.
Golder. (2022). Analyse de l’impact du projet minier sur le lac Lortie et mesures d’atténuation. Report n° 143-21482889-RF-Rev0.
Golder Associates. (2012). Caractérisation géochimique d’échantillons de résidu combiné du projet Québec Lithium. 13 p. + appendices.
Golder Associates. (2012). Caractérisation géochimique d’échantillons de stériles miniers du projet Québec Lithium. Québec Lithium inc. 9 p. + appendices.
Golder Associés Ltée. (2010). Investigation hydrogéologique - Exploitation à ciel ouvert, Québec Lithium - Secteur du Lac Lortie.
Golder Associés Ltée. (2013). Développement du parc à résidus No. 1, Mine Québec Lithium, La Corne (Québec) – Rapport de conception Phases 1B et 1C. Report n° 003-12-1221-0118-2000-RF-Rev0.
Golder Associés Ltée. (2017). Caractérisation hydrogéologique complémentaire – Secteur du lac Lortie. Report n° 002-1665476 Rev0.
Golder Associés Ltée. (2017). Investigation hydrogéologique - Exploitation à ciel ouvert, Québec Lithium - Secteur du Lac Lortie.
Golder Associés Ltée. (2018). Memorandum Technique, TMF Chapter for NI-43101 Update – June 17.
Golder Associés Ltée. (2022). Avis Technique – Critères de Conception pour l’Enveloppe de Fosse de Niveau Pré-faisabilité – Site Minier Lithium Amérique du Nord, La Corne, Québec.
Hardie, C., Live, P., & Palumbo, E. (2016). Technical Report 43-101 on the Pre-Feasibility Study for the Québec Lithium Project. Prepared for Canada Lithium Corp., (pp. 135).
Hardie, C., Stone, M., Lavery, M., Lemieux, M., Blanchet, D., & Woodhouse, P. (2011). Technical Report NI 43-101 on the Feasibility Study for the Québec Lithium Project, La Corne Township, Québec. Prepared for Canada Lithium Corp., (pp. 146).
Hardy, C. A. (2017). Technical Report of August 2017 (unpublished).
Hawley, M., & Cunning, J. (2017). Guidelines for Mine Waste Dump and Stockpile Design. CRC Press/Balkema. .
Karpoff, B. (1955). Pegmatitic Lithium Deposit of the Québec Lithium Corporation. Internal Report of Québec Lithium Corporation.
Karpoff, B. (1993). Évaluation Technique de la Propriété Minière Québec Lithium. Internal Report for Cambior Inc. (in French).
Kramer, S. (1996). Geotechnical Earthquake Engineering, Prentice Hall Inc. Englewood Cliffs, NJ.
Laboratoires d’Expertises de Québec ltée. (1996). Analyse de stabilité d’une digue. Rapport n° 4171-01-02.
Lavery, M. E., & Stone, M. (2010). Technical Report, Québec Lithium Property, La Corne Township, Québec. Prepared for Canada Lithium Corp., (pp. 146).
Leblanc, I., Piciacchia, L., Jarry, M., Dupuis, P., Richard, P., & Quinn, J. (2023). NI 43-101 Technical Report Definitive Feasibility Study Report for the North American Lithium Project. Prepared for Sayona Mining Limited and dated April 14th, 2023.
London, D. (2008). Pegmatites. The Canadian Mineralogist Special Publication 10.
McCracken, et al. (2022). Prefeasibility Study Report for the North American Lithium Project, Québec Lithium Property, La Corne, Québec, Canada. Prepared for Sayona Mining Limited.
Ministère de l’Énergie et des Ressources Naturelles. (2016). Guide de préparation du plan de réaménagement et de restauration des sites miniers au Québec . Direction de la restauration des sites miniers.
Ministère de l’Environnement, de la Lutte contre les changements climatiques, de la Faune et des Parcs (MELCCFP). (2025). Directive 019 sur l’industrie minière.
Ministère des Ressources Naturelles. (2014). Approbation de la mise à jour du plan de restauration du site minier Québec Lithium. Direction de la restauration des sites miniers.
| Revision: 0 – 14-Aug-2026 B198-D01-02054-RT-0010 |
Page 263 |
| NAL Expansion FS Mineral Reserve Pre-Feasibility Study NI 43-101 Final Report Prepared for Elevra |
|
Ministère des Ressources Naturelles et des Forêts (MRNF). (2024). Guide de préparation du plan de réaménagement et de restauration des sites miniers du Québec.
Ministère du Développement durable, de l’Environnement et des Parcs. (2012). Directive 019 sur l’industrie minière.
Mulja, T., Williams-Jones, A., Wood, S., & Boily, M. (1995). The Rare-Element enriched Monzogranite-Pegmatite-Quartz Vein System in the Preissac-La Corne Batholith, Québec. Geology and Mineralogy, Canadian Mineralogist, v. 33, (pp. 793-815).
North American Lithium. (2019). Rapport de Production (Internal document), June 2017 to March 2019.
Palumbo, E., & Hardie, C. (2016). Technical Report on Laboratory Testwork and Operational Issues. Prepared for North American Lithium Inc. by BBA Inc. (Technical Report No. 5939017-000000-49-ERA-0002, Rev 00, December 12, 2016), (pp. 112).
Poniewierski, J. (2017). Pseudoflow Explained - A discussion of Deswik Pseudoflow Pit Optimization in comparison to Whittle LG Pit Optimization. (pp. 4).
Primero. (2022). North American Lithium Mine - Concentrate Belt Filter Upgrade Study - 24003-REP-PR-001 Rev. C, February 8th, 2022.
Rowe, R. (1953). Pegmatitic Beryllium and Lithium Deposits, Preissac-La Corne region, Abitibi County, Québec. Geological Survey of Canada, Paper 53-3.
Roy, T. (2023). Thèse de doctorat « Comportement hydrogéochimique de rejets miniers issus de pegmatites à spodumène ».
Sayona Mining Limited. (2025). ASX announcement “NAL Expansion Scoping Study Confirms Lower Costs and Strong Returns”. Dated September 15th, 2025.
Sayona Mining Limited. (2025). ASX Announcement “NAL Reserves up 124% to 48.6 Mt and Resource increases to 95 MT” and accompanying JORC (2012) Table 1. Dated August 27th, 2025.
Selway, J., Breaks, F., & Tindle, A. (2005). A Review of Rare-Element (Li-Cs-Ta) Pegmatite Exploration Techniques for the Superior Province, Canada, and Large Worldwide Tantalum Deposits. Exploration and Mining Geology (2005) 14 (1-4): 1–30.
SGS Canada Inc. (2010). A Pilot Plant Investigation into the Flotation Recovery of Lithium, Québec Lithium Project. Final Report prepared for Canada Lithium Corp., October 25, 2010.
SGS Canada Inc. (2019). 15818-004A Flot Test NAL-Sayona.
SGS Canada Inc. (2021). 15818-05A Flot Test-Nov. 18.
SGS Canada Inc. (2022). 15818-05A Flot Test-March 13.
SGS Canada Inc. (2022). 15818-05A/MI4537-NOV21, Semi-Quantitative X-Ray Diffraction.
SGS Canada Inc. (2023). 15818-05A Flot Testwork-March 05.
Shannon, J., Nussipakynova, D., & Pitman, C. (2011). Québec Lithium Property, La Corne Township, Québec, Technical Report for Canada Lithium Corp. Prepared by AMC Mining Consultants (Canada) Ltd., December 5, 2011, (pp. 115).
SNC. (1974). Report of Lithium Property, Barraute, Quebec for Sullivan Mining Group. Montreal, Quebec. 63 pp.
Steiger, R., & Wasserburg, G. (1969). Comparative U-Th-Pb systematics in 2.7 × 10⁹yr plutons of different geologic histories. Geochimica et Cosmochimica Acta, Volume 33, Issue 10, Pages 1213-1232.
Stone, M., & Ilieva, T. (2010). Independent Technical Report, Québec Lithium Property, La Corne Township, Québec. Prepared for Canada Lithium Corp. by Caracle Creek International Consulting Inc., (pp. 227).
Stone, M., & Selway, J. (2009). Independent Technical Report, Québec Lithium Property, La Corne Township, Québec, Prepared for Canada Lithium Corp. by Caracle Creek International Consulting Inc., (pp. 132, plus appendices).
Thompson, P. a. (2006). Hydraulic Design of Energy Dissipators for Culverts and Channels. Hydraulic Engineering Circular No. 14, Third Edition, Publication No. FHWA-NHI-06-086. Federal Highway Administration, U.S. Department of Transport.
Tremblay, L. (1950). Fiedmont Map Area, Abitibi County, Québec. Geological Survey of Canada, Memoir 253.
URSTM. (2015). Essais cinétiques sur quatre lithologies du projet Québec Lithium. 54 p.
Wave International. (2025). Preliminary Economic Assessment for the North American Lithium Expansion Project. Prepared for Elevra Lithium Limited.
Wood Mackenzie. (2022). Global lithium strategic planning outlook – Q1 2022.
Woodhouse; et al. (2011). Updated Feasibility Study for the Quebec Lithium Project – Process Section. Prepared for Canada Lithium Corp. by Technology Management Group, (pp. 66).
| Revision: 0 – 14-Aug-2026 B198-D01-02054-RT-0010 |
Page 264 |
| NAL Expansion FS Mineral Reserve Pre-Feasibility Study NI 43-101 Final Report Prepared for Elevra |
|
WSP Golder. (2022). Étude hydrogéologique du secteur de la fosse au site minier de Lithium Amérique du Nord, La Corne, Québec.
WSP Golder. (2022). Mise à jour de l’évaluation des piliers de surface de la mine Lithium Amérique du Nord.
WSP Golder. (2023). Memorandum Technique, Préliminaire - Recommandations pour les angles de pentes pour l’étude de faisabilité de la réouverture de la fosse Lithium Amérique du Nord - Lacorne, Québec, Canada.
WSP Golder. (2023). Revue sommaire de l’enveloppe de fosse du 21 février 2023.
| Revision: 0 – 14-Aug-2026 B198-D01-02054-RT-0010 |
Page 265 |
| NAL Expansion FS Mineral Reserve Pre-Feasibility Study NI 43-101 Final Report Prepared for Elevra |
|
| 28 | Qualified Persons |
| Revision: 0 – 14-Aug-2026 B198-D01-02054-RT-0010 |
Page 266 |