Exhibit 99.1
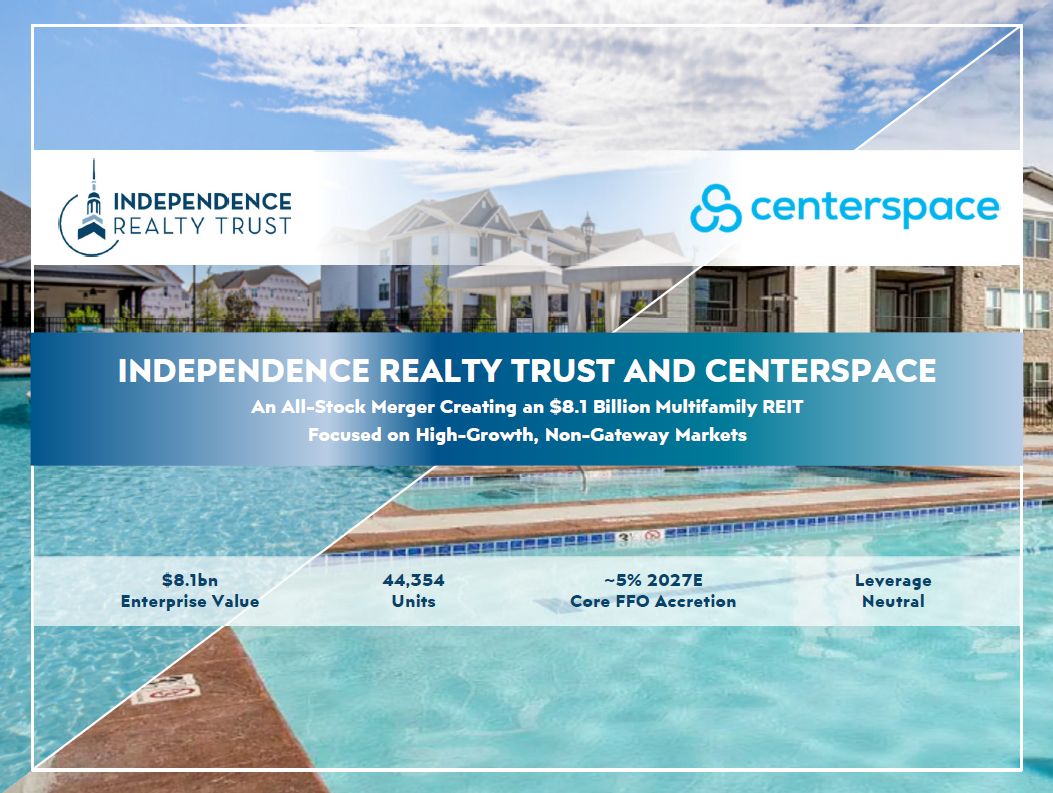
INDEPENDENCE REALTY TRUST AND CENTERSPACE An All-Stock Merger Creating an $8.1
Billion Multifamily REIT Focused on High-Growth, Non-Gateway Markets $8.1bn Enterprise Value 44,354 Units ~5% 2027E Core FFO Accretion Leverage Neutral
The information contained in this presentation may contain certain
forward-looking statements, within the meaning of Section 27A of the Securities Act of 1933, as amended (the “Securities Act”), and Section 21E of the Securities Exchange Act of 1934, as amended (the “Exchange Act”), including, but not
limited to, certain plans, expectations, goals, projections, and statements about the benefits of the proposed transaction, the plans, objectives, expectations and intentions of Centerspace (“CSR”) and Independence Realty Trust, Inc. (“IRT”),
the expected timing of completion of the proposed transaction, and other statements that are not historical facts. Such statements are subject to numerous assumptions, risks, estimates, uncertainties and other important factors that change
over time and could cause actual results to differ materially from any results, performance, or events expressed or implied by such forward-looking statements, including as a result of the factors referenced below. Forward-looking statements
do not discuss historical fact, but instead include statements related to expectations, projections, intentions or other items related to the future. Forward-looking statements are typically identified by the use of terms such as “expects,”
“anticipates,” “intends,” “plans,” “believes,” “seeks,” “estimates,” “will,” “assumes,” “may,” “projects,” “outlook,” “future,” and variations of those words and similar expressions. These forward-looking statements involve known and unknown
risks, uncertainties, and other factors that may cause the actual results, performance, or achievements to be materially different from the results of operations, financial condition, or plans expressed or implied by the forward-looking
statements. Although we believe the expectations reflected in these forward-looking statements are based upon reasonable assumptions, we can give no assurance that IRT’s and CSR’s expectations will be achieved. Any statements contained herein
that are not statements of historical fact should be deemed forward-looking statements. As a result, undue reliance should not be placed on these forward-looking statements, as these statements are subject to known and unknown risks,
uncertainties, and other factors beyond IRT’s and CSR’s control and could differ materially from actual results and performance. The forward-looking statements in this communication are not guarantees of future performance and involve a
number of known and unknown risks, uncertainties and assumptions that are difficult to assess and are subject to change based on factors which are, in many instances, beyond CSR’s and IRT’s control. The following factors, among others, could
cause IRT’s and CSR’s future results to differ materially from those expressed in the forward-looking statements: IRT’s and CSR’s ability to complete the transaction on the proposed terms or on the anticipated timeline, or at all, including
risks and uncertainties related to securing the necessary stockholder approvals and satisfaction of other closing conditions to consummate the transaction; the occurrence of any event, change or other circumstances that could give rise to
the right of one or both of the parties to terminate the merger agreement between CSR and IRT; the outcome of any legal proceedings that may be instituted against CSR or IRT; delays in completing the proposed transaction involving CSR and
IRT; the possibility that the anticipated benefits of the transaction are not realized when expected or at all, including as a result of the impact of, or problems arising from, the integration of the two companies or as a result of the
strength of the economy and competitive factors in the areas where CSR and IRT do business; the possibility that the transaction may be more expensive to complete than anticipated, including as a result of unexpected factors or events; the
ability of CSR and IRT to meet expectations regarding the timing, completion and accounting and tax treatment of the transaction; diversion of IRT’s and CSR’s management’s attention from ongoing business operations and
opportunities; potential adverse reactions or changes to business, customer or employee relationships, including those resulting from the announcement or completion of the transaction; the ability to complete the transaction and integration
of CSR and IRT successfully; the dilution caused by IRT’s issuance of additional shares of its capital stock in connection with the transaction; financing risks, including IRT’s and CSR’s potential inability to meet existing covenants in
IRT’s and CSR’s existing credit facilities or to obtain new debt or equity financing on favorable terms, or at all; uncertain global macro-economic and political conditions, the impact of actual or threatened wars or other international
conflicts, such as in Ukraine, the Middle East, and South America, including sanctions imposed by the U.S. and other countries, on inflation, trade, and general economic conditions; deteriorating economic conditions and rising unemployment
rates, energy costs, and inflation, in the markets where we own apartment communities or in which we may invest in the future; rental conditions in IRT’s and CSR’s markets, including occupancy levels and rental rates, IRT’s and CSR’s
potential inability to renew residents or obtain new residents upon expiration of existing leases, IRT’s and CSR’s ability to identify and consummate attractive acquisitions and dispositions on favorable terms, IRT’s and CSR’s ability to
reinvest sales proceeds successfully, IRT’s and CSR’s inability to accommodate any significant decline in the market value of real estate serving as collateral for IRT’s and CSR’s debt and mortgage obligations; changes in tax and housing
laws, including rent control laws, or other factors; timely access to material and labor required to renovate and maintain apartment communities; adverse changes in IRT’s and CSR’s markets, including future demand for apartment homes in
those markets, barriers of entry into new markets, limitations on IRT’s and CSR’s ability to increase rental rates, IRT’s and CSR’s ability to identify and consummate attractive acquisitions and dispositions on favorable terms, IRT’s and
CSR’s ability to reinvest sales proceeds successfully, and inability to accommodate any significant decline in market value of real estate serving as collateral for IRT’s and CSR’s debt and mortgage obligations; the ability of CSR to
complete its proposed dispositions on a timely basis, or at all; risks that CSR’s recently completed or proposed dispositions disrupt current plans and operations; and other factors that may affect the future results of CSR and
IRT. 1 SAFE HARBOR
SAFE HARBOR 2 Additional factors that could cause results to differ materially
from those described above can be found in CSR’s Annual Report on Form 10-K for the year ended December 31, 2025 and in its subsequent Quarterly Reports on Form 10-Q, including for the quarter ended June 30, 2026, each of which is on file
with the Securities and Exchange Commission (the “SEC”) and available on the “Investor Relations” section of CSR’s website, www.centerspacehomes.com, under the heading “Investors” and in other documents CSR files with the SEC, and in IRT’s
Annual Report on Form 10-K for the year ended December 31, 2025 and in its subsequent Quarterly Reports on Form 10-Q, including for the quarter ended June 30, 2026, each of which is on file with the SEC and available on IRT’s website,
www.irtliving.com, under the heading “Investors” and in other documents IRT files with the SEC. All forward-looking statements are expressly qualified in their entirety by the cautionary statements set forth above. Forward-looking statements
speak only as of the date they are made and are based on information available at that time. Neither CSR nor IRT assume any obligation to update forward-looking statements to reflect actual results, new information or future events, changes
in assumptions or changes in circumstances or other factors affecting forward-looking statements that occur after the date the forward-looking statements were made or to reflect the occurrence of unanticipated events except as required by
federal securities laws. If CSR or IRT updates one or more forward-looking statements, no inference should be drawn that CSR or IRT will make additional updates with respect to those or other forward-looking statements. As forward-looking
statements involve significant risks and uncertainties, caution should be exercised against placing undue reliance on such statements. Important Additional Information about the Proposed Transaction and Where to Find It In connection with
the proposed transaction, IRT will file with the SEC a registration statement on Form S-4 that will include a joint proxy statement of CSR and IRT and a prospectus of IRT, as well as other relevant documents concerning the proposed
transaction. The proposed transaction involving CSR and IRT will be submitted to CSR’s shareholders and IRT’s shareholders for their consideration. This communication does not constitute an offer to sell or the solicitation of an offer to buy
any securities or a solicitation of any vote or approval, nor shall there be any sale of securities in any jurisdiction in which such offer, solicitation or sale would be unlawful prior to registration or qualification under the securities
laws of any such jurisdiction. INVESTORS, SHAREHOLDERS OF CSR AND STOCKHOLDERS OF IRT ARE URGED TO READ THE REGISTRATION STATEMENT AND THE JOINT PROXY STATEMENT/PROSPECTUS REGARDING THE TRANSACTION WHEN IT BECOMES AVAILABLE AND ANY OTHER
RELEVANT DOCUMENTS FILED WITH THE SEC, AS WELL AS ANY AMENDMENTS OR SUPPLEMENTS TO THOSE DOCUMENTS, BECAUSE THEY WILL CONTAIN IMPORTANT INFORMATION. Investors and stockholders will be able to obtain the registration statement and the
definitive joint proxy statement/prospectus free of charge from the SEC’s website or from CSR or IRT. The documents filed by CSR with the SEC may be obtained free of charge at CSR’s website at www.centerspacehomes.com or at the SEC’s website
at www.sec.gov. The documents filed by IRT with the SEC may be obtained free of charge at IRT’s website at www.irtliving.com or at the SEC’s website at www.sec.gov. Participants in the Solicitation CSR, IRT, and certain of their respective
trustees or directors, as applicable, and executive officers may be deemed to be participants in the solicitation of proxies from the shareholders of CSR and stockholders of IRT in connection with the proposed transaction. Information
regarding the interests of the trustees or directors, as applicable, and executive officers of CSR and IRT and other persons who may be deemed to be participants in the solicitation of shareholders of CSR and IRT in connection with the
transaction and a description of their direct and indirect interests, by security holdings or otherwise, will be included in the definitive joint proxy statement/prospectus related to the transaction, which will be filed by CSR with the SEC.
Information regarding CSR’s trustees and executive officers is available in its definitive joint proxy statement relating to its 2026 Annual Meeting of Shareholders, which was filed with the SEC on April 3, 2026, and other documents filed by
CSR with the SEC. Information regarding IRT’s directors and executive officers is available in its definitive proxy statement relating to its 2026 Annual Meeting of Stockholders, which was filed with the SEC on March 19, 2026, and other
documents filed by IRT with the SEC. Other information regarding the participants in the proxy solicitation and a description of their direct and indirect interests, by security holdings or otherwise, will be contained in the joint proxy
statement/prospectus and other relevant materials filed with the SEC by CSR and IRT, respectively. Free copies of these documents may be obtained as described above under “Important Additional Information.” No Offer or Solicitation This
communication shall not constitute an offer to sell or the solicitation of an offer to buy any securities, nor shall there be any sale of securities in any jurisdiction in which such offer, solicitation or sale would be unlawful prior to
registration or qualification under the securities laws of any such jurisdiction. No offering of securities shall be made except by means of a prospectus meeting the requirements of Section 10 of the U.S. Securities Act of 1933, as amended.
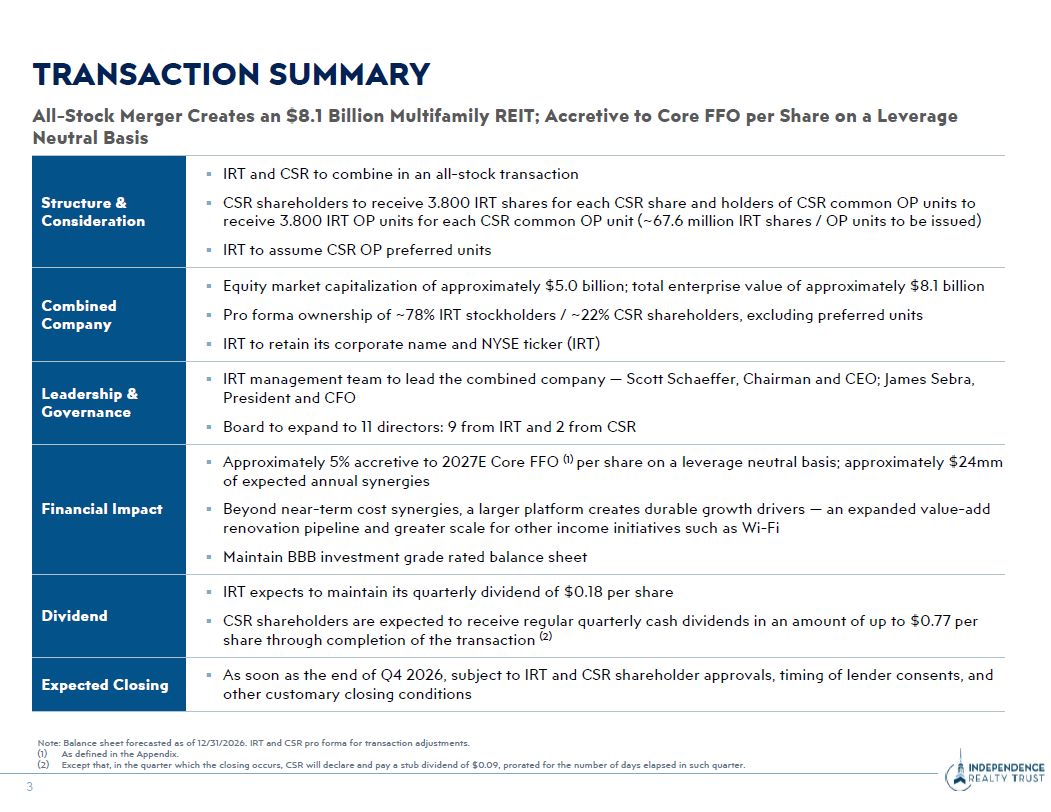
Structure & Consideration IRT and CSR to combine in an all-stock
transaction CSR shareholders to receive 3.800 IRT shares for each CSR share and holders of CSR common OP units to receive 3.800 IRT OP units for each CSR common OP unit (~67.6 million IRT shares / OP units to be issued) IRT to assume CSR OP
preferred units Combined Company Equity market capitalization of approximately $5.0 billion; total enterprise value of approximately $8.1 billion Pro forma ownership of ~78% IRT stockholders / ~22% CSR shareholders, excluding preferred
units IRT to retain its corporate name and NYSE ticker (IRT) Leadership & Governance IRT management team to lead the combined company — Scott Schaeffer, Chairman and CEO; James Sebra, President and CFO Board to expand to 11 directors:
9 from IRT and 2 from CSR Financial Impact Approximately 5% accretive to 2027E Core FFO (1) per share on a leverage neutral basis; approximately $24mm of expected annual synergies Beyond near-term cost synergies, a larger platform creates
durable growth drivers — an expanded value-add renovation pipeline and greater scale for other income initiatives such as Wi-Fi Maintain BBB investment grade rated balance sheet Dividend IRT expects to maintain its quarterly dividend of
$0.18 per share CSR shareholders are expected to receive regular quarterly cash dividends in an amount of up to $0.77 per share through completion of the transaction (2) Expected Closing As soon as the end of Q4 2026, subject to IRT and
CSR shareholder approvals, timing of lender consents, and other customary closing conditions 3 TRANSACTION SUMMARY All-Stock Merger Creates an $8.1 Billion Multifamily REIT; Accretive to Core FFO per Share on a Leverage Neutral
Basis Note: Balance sheet forecasted as of 12/31/2026. IRT and CSR pro forma for transaction adjustments. As defined in the Appendix. Except that, in the quarter which the closing occurs, CSR will declare and pay a stub dividend of $0.09,
prorated for the number of days elapsed in such quarter.
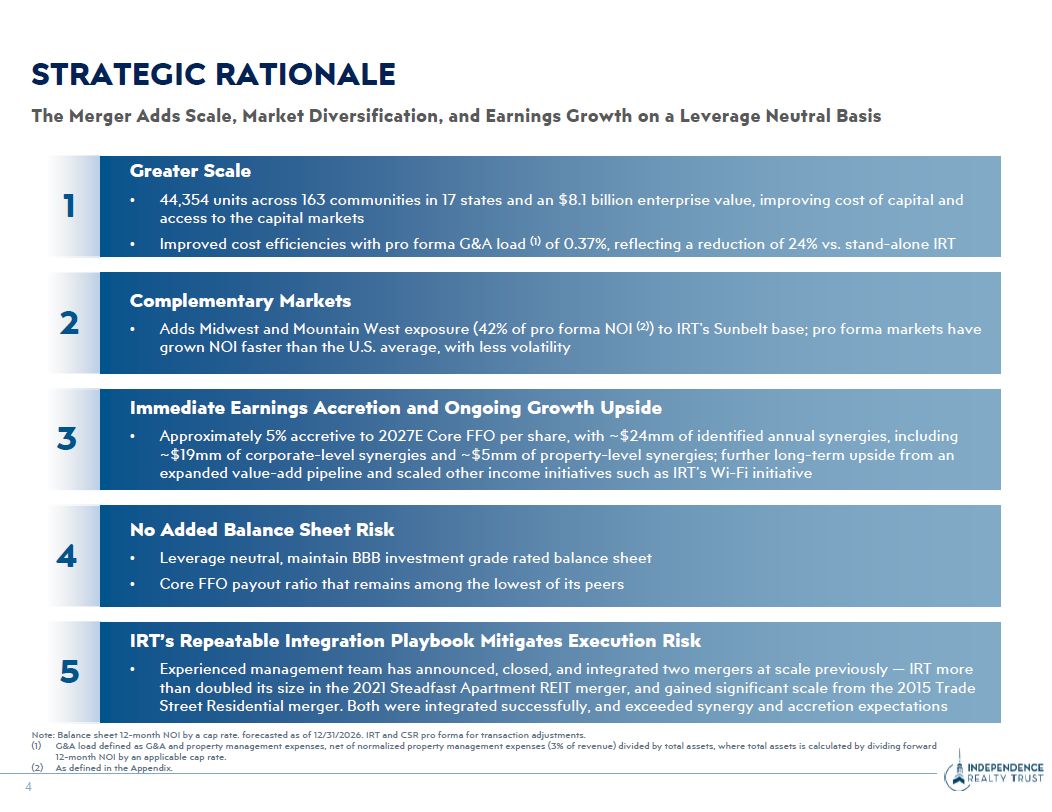
STRATEGIC RATIONALE The Merger Adds Scale, Market Diversification, and Earnings
Growth on a Leverage Neutral Basis 1 Greater Scale 44,354 units across 163 communities in 17 states and an $8.1 billion enterprise value, improving cost of capital and access to the capital markets Improved cost efficiencies with pro
forma G&A load (1) of 0.37%, reflecting a reduction of 24% vs. stand-alone IRT 2 Complementary Markets Adds Midwest and Mountain West exposure (42% of pro forma NOI (2)) to IRT's Sunbelt base; pro forma markets have grown NOI faster
than the U.S. average, with less volatility 3 Immediate Earnings Accretion and Ongoing Growth Upside Approximately 5% accretive to 2027E Core FFO per share, with ~$24mm of identified annual synergies, including ~$19mm of corporate-level
synergies and ~$5mm of property-level synergies; further long-term upside from an expanded value-add pipeline and scaled other income initiatives such as IRT’s Wi-Fi initiative 4 No Added Balance Sheet Risk Leverage neutral, maintain BBB
investment grade rated balance sheet Core FFO payout ratio that remains among the lowest of its peers 5 IRT’s Repeatable Integration Playbook Mitigates Execution Risk Experienced management team has announced, closed, and integrated two
mergers at scale previously — IRT more than doubled its size in the 2021 Steadfast Apartment REIT merger, and gained significant scale from the 2015 Trade Street Residential merger. Both were integrated successfully, and exceeded synergy and
accretion expectations 4 Note: Balance sheet 12-month NOI by a cap rate. forecasted as of 12/31/2026. IRT and CSR pro forma for transaction adjustments. (1) G&A load defined as G&A and property management expenses, net of
normalized property management expenses (3% of revenue) divided by total assets, where total assets is calculated by dividing forward 12-month NOI by an applicable cap rate. (2) As defined in the Appendix.
As of June 30, 2026. Excludes IRT’s development projects Flatiron Flats and
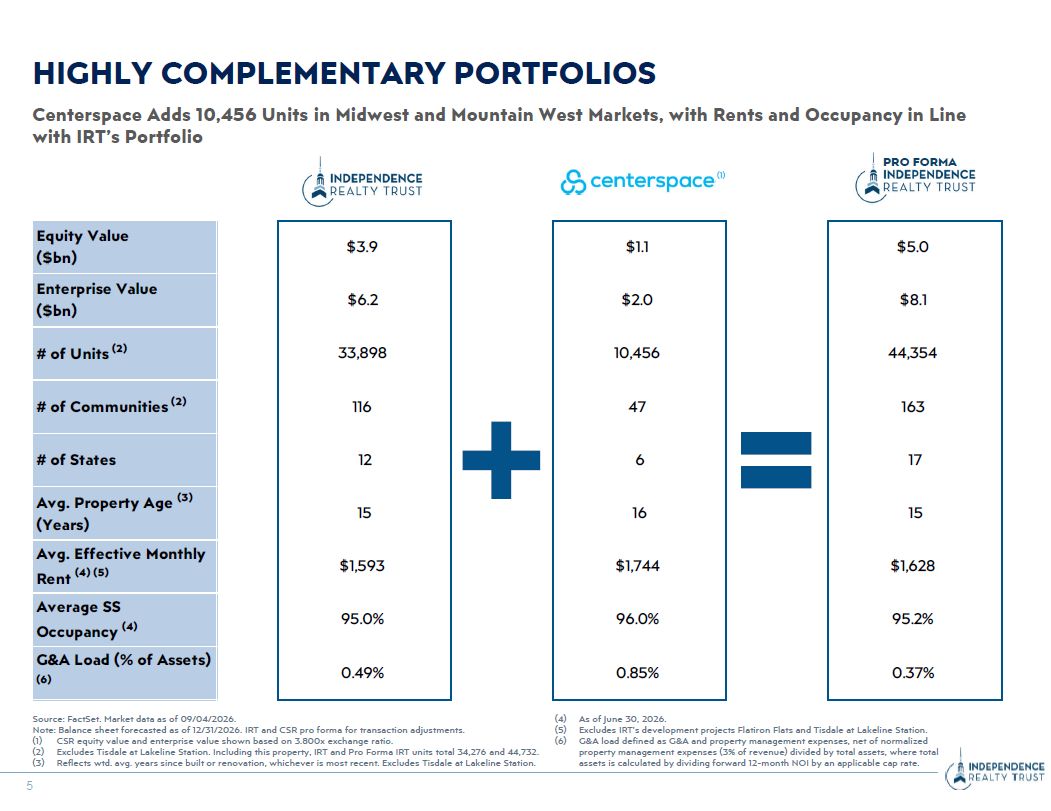
Tisdale at Lakeline Station. G&A load defined as G&A and property management expenses, net of normalized property management expenses (3% of revenue) divided by total assets, where total HIGHLY COMPLEMENTARY PORTFOLIOS Centerspace
Adds 10,456 Units in Midwest and Mountain West Markets, with Rents and Occupancy in Line with IRT’s Portfolio PRO FORMA (1) Source: FactSet. Market data as of 09/04/2026. Note: Balance sheet forecasted as of 12/31/2026. IRT and CSR pro
forma for transaction adjustments. CSR equity value and enterprise value shown based on 3.800x exchange ratio. Excludes Tisdale at Lakeline Station. Including this property, IRT and Pro Forma IRT units total 34,276 and 44,732. Equity Value
($bn) Enterprise Value ($bn) # of Units (2) # of Communities (2) # of States Avg. Property Age (3) (Years) Avg. Effective Monthly Rent (4) (5) Average SS Occupancy (4) G&A Load (% of Assets) (6) $3.9 $6.2
33,898 116 12 15 $1,593 95.0% 0.49% $1.1 $2.0 10,456 47 6 16 $1,744 96.0% 0.85% $5.0 $8.1 44,354 163 17 15 $1,628 95.2% 0.37% (3) Reflects wtd. avg. years since built or renovation, whichever is most recent. Excludes
Tisdale at Lakeline Station. 5 assets is calculated by dividing forward 12-month NOI by an applicable cap rate.
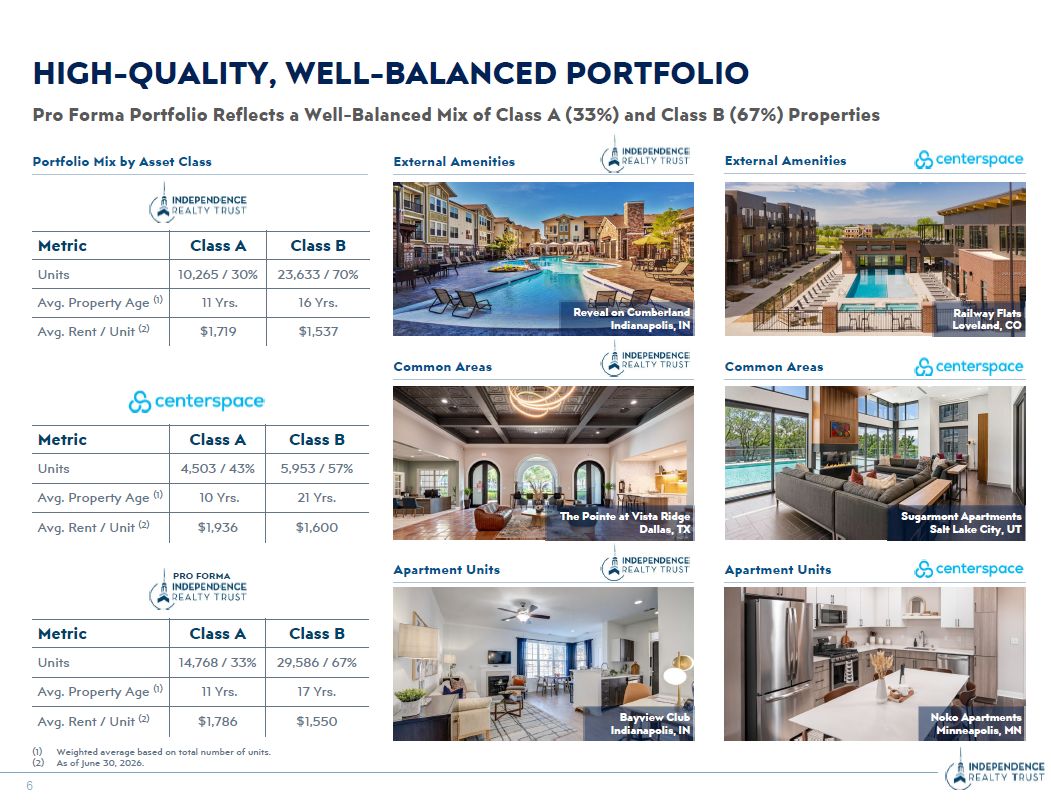
Metric Class A Class B Units 10,265 / 30% 23,633 / 70% Avg. Property Age
(1) 11 Yrs. 16 Yrs. Avg. Rent / Unit (2) $1,719 $1,537 Metric Class A Class B Units 4,503 / 43% 5,953 / 57% Avg. Property Age (1) 10 Yrs. 21 Yrs. Avg. Rent / Unit (2) $1,936 $1,600 Metric Class A Class B Units 14,768 /
33% 29,586 / 67% Avg. Property Age (1) 11 Yrs. 17 Yrs. Avg. Rent / Unit (2) $1,786 $1,550 HIGH-QUALITY, WELL-BALANCED PORTFOLIO Pro Forma Portfolio Reflects a Well-Balanced Mix of Class A (33%) and Class B (67%) Properties External
Amenities External Amenities Reveal on Cumberland Indianapolis, IN Railway Flats Loveland, CO Common Areas The Pointe at Vista Ridge Dallas, TX Sugarmont Apartments Salt Lake City, UT Common Areas Apartment Units Noko Apartments
Minneapolis, MN Apartment Units Bayview Club Indianapolis, IN Portfolio Mix by Asset Class PRO FORMA (1) Weighted average based on total number of units. (2) As of June 30, 2026. 6
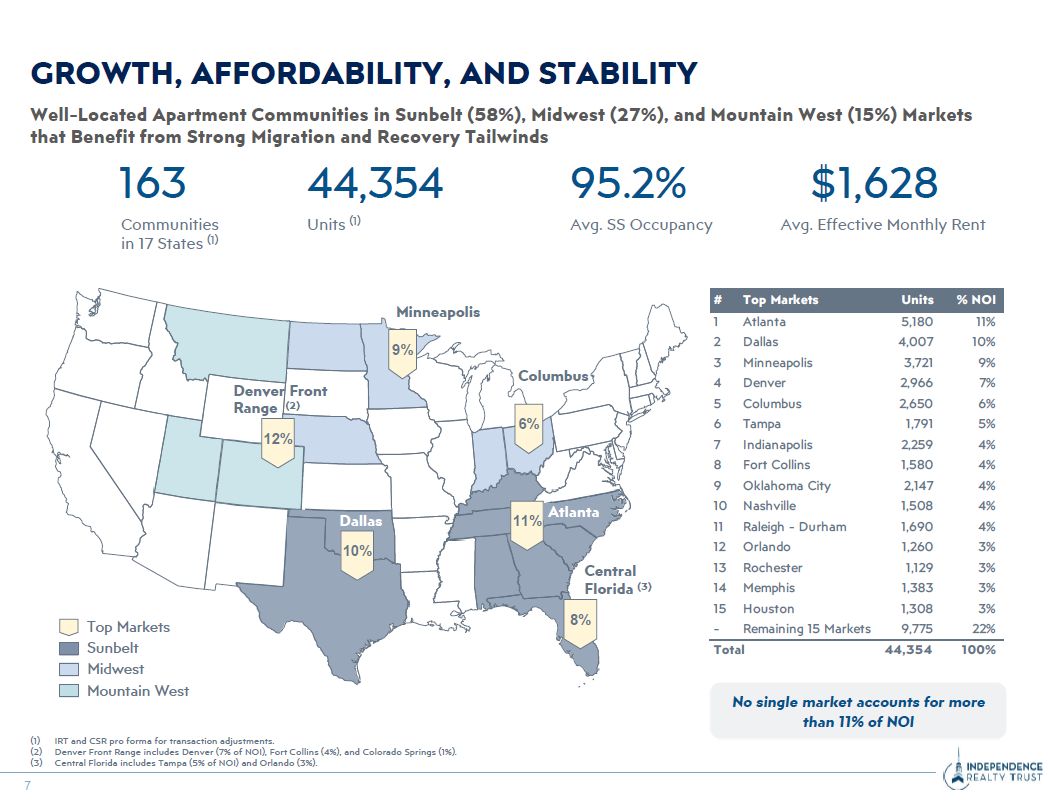
163 Communities in 17 States (1) 44,354 Units (1) 95.2% Avg. SS
Occupancy $1,628 Avg. Effective Monthly Rent Well-Located Apartment Communities in Sunbelt (58%), Midwest (27%), and Mountain West (15%) Markets that Benefit from Strong Migration and Recovery Tailwinds GROWTH, AFFORDABILITY, AND
STABILITY Top Markets Sunbelt Midwest Mountain West 6% 11% Minneapolis 9% Columbus Denver Front Range (2) 12% Dallas 10% IRT and CSR pro forma for transaction adjustments. Denver Front Range includes Denver (7% of NOI), Fort
Collins (4%), and Colorado Springs (1%). Atlanta No single market accounts for more than 11% of NOI 8% (3) Central Florida includes Tampa (5% of NOI) and Orlando (3%). 7 Central Florida (3) # Top Markets Units %
NOI 1 Atlanta 5,180 11% 2 Dallas 4,007 10% 3 Minneapolis 3,721 9% 4 Denver 2,966 7% 5 Columbus 2,650 6% 6 Tampa 1,791 5% 7 Indianapolis 2,259 4% 8 Fort Collins 1,580 4% 9 Oklahoma
City 2,147 4% 10 Nashville 1,508 4% 11 Raleigh - Durham 1,690 4% 12 Orlando 1,260 3% 13 Rochester 1,129 3% 14 Memphis 1,383 3% 15 Houston 1,308 3% - Remaining 15 Markets 9,775 22% Total 44,354 100%
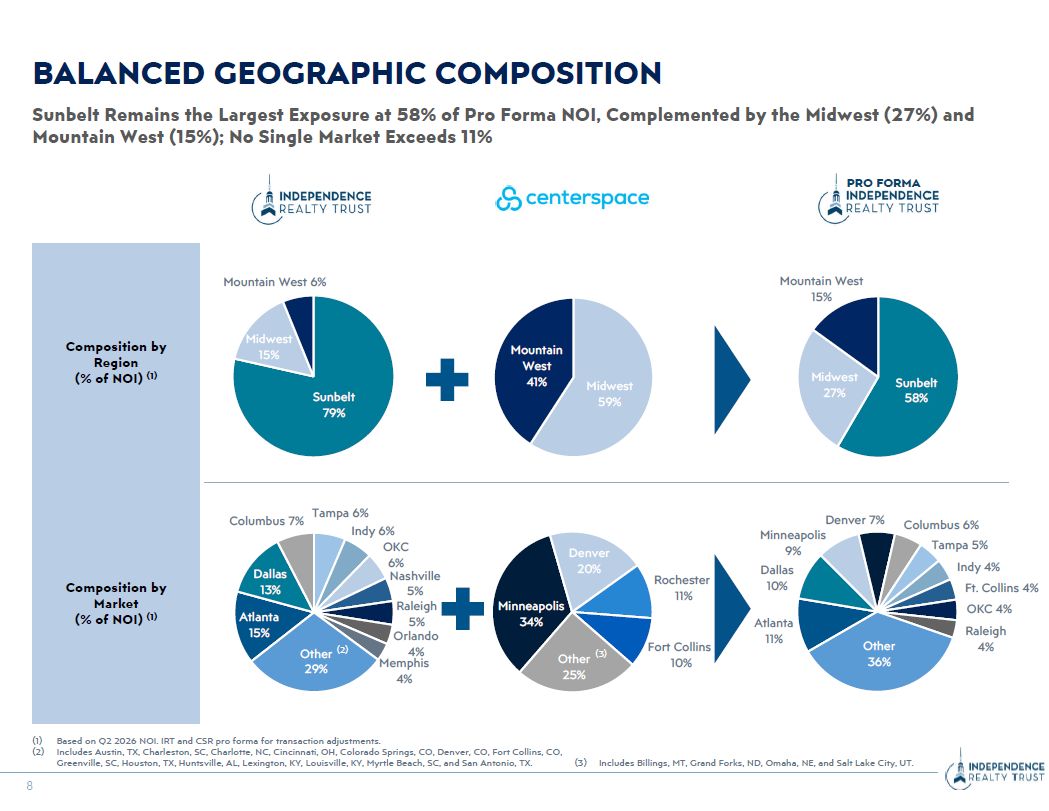
PRO FORMA Sunbelt 79% Midwest 15% Mountain West 6% Minneapolis 34% Denver
20% Rochester 11% Fort Collins 10% Other (3) 25% Atlanta 11% Denver 7% Minneapolis 9% Dallas 10% Columbus 6% Tampa 5% Indy 4% Ft. Collins 4% OKC 4% Raleigh 4% Other 36% Sunbelt 58% Midwest 27% Mountain West 15% Midwest
59% Mountain West 41% BALANCED GEOGRAPHIC COMPOSITION Sunbelt Remains the Largest Exposure at 58% of Pro Forma NOI, Complemented by the Midwest (27%) and Mountain West (15%); No Single Market Exceeds 11% Composition by Region (% of NOI)
(1) Composition by Market (% of NOI) (1) Based on Q2 2026 NOI. IRT and CSR pro forma for transaction adjustments. Includes Austin, TX, Charleston, SC, Charlotte, NC, Cincinnati, OH, Colorado Springs, CO, Denver, CO, Fort Collins,
CO, Dallas 13% Atlanta 15% Columbus 7% Tampa 6% 4% Indy 6% OKC 6% Nashville 5% Raleigh 5% Orlando Memphis 4% Other (2) 29% Greenville, SC, Houston, TX, Huntsville, AL, Lexington, KY, Louisville, KY, Myrtle Beach, SC, and San
Antonio, TX. (3) Includes Billings, MT, Grand Forks, ND, Omaha, NE, and Salt Lake City, UT. 8
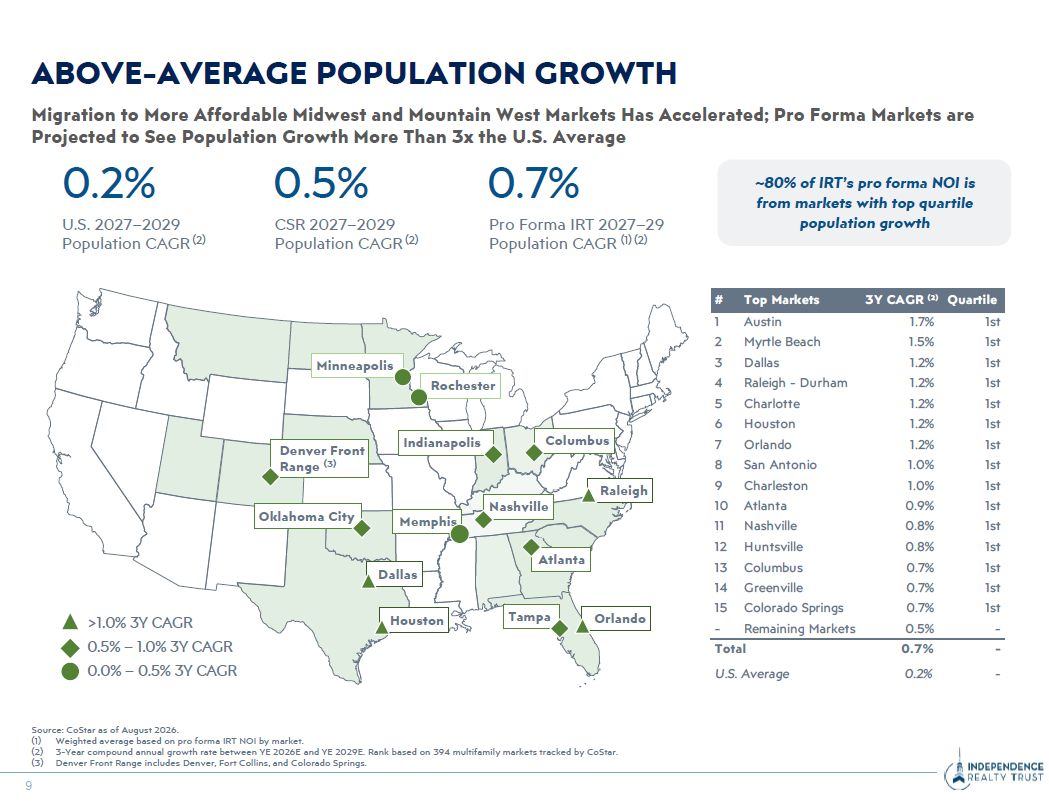
Migration to More Affordable Midwest and Mountain West Markets Has Accelerated;
Pro Forma Markets are Projected to See Population Growth More Than 3x the U.S. Average ABOVE-AVERAGE POPULATION GROWTH Source: CoStar as of August 2026. Weighted average based on pro forma IRT NOI by market. 3-Year compound annual growth
rate between YE 2026E and YE 2029E. Rank based on 394 multifamily markets tracked by CoStar. Indianapolis Raleigh Denver Front Range (3) Minneapolis Rochester Columbus Tampa Dallas Orlando Atlanta Oklahoma City Nashville >1.0%
3Y CAGR 0.5% CSR 2027–2029 Population CAGR (2) 0.7% Pro Forma IRT 2027–29 Population CAGR (1) (2) 0.2% U.S. 2027–2029 Population CAGR (2) Houston Memphis # Top Markets 3Y CAGR (2) Quartile 1 Austin 1.7% 1st 2 Myrtle
Beach 1.5% 1st 3 Dallas 1.2% 1st 4 Raleigh - Durham 1.2% 1st 5 Charlotte 1.2% 1st 6 Houston 1.2% 1st 7 Orlando 1.2% 1st 8 San
Antonio 1.0% 1st 9 Charleston 1.0% 1st 10 Atlanta 0.9% 1st 11 Nashville 0.8% 1st 12 Huntsville 0.8% 1st 13 Columbus 0.7% 1st 14 Greenville 0.7% 1st 15 Colorado Springs 0.7% 1st - Remaining
Markets 0.5% - 0.5% – 1.0% 3Y CAGR Total 0.7% - 0.0% – 0.5% 3Y CAGR U.S. Average 0.2% - ~80% of IRT’s pro forma NOI is from markets with top quartile population growth (3) Denver Front Range includes Denver, Fort Collins, and
Colorado Springs. 9
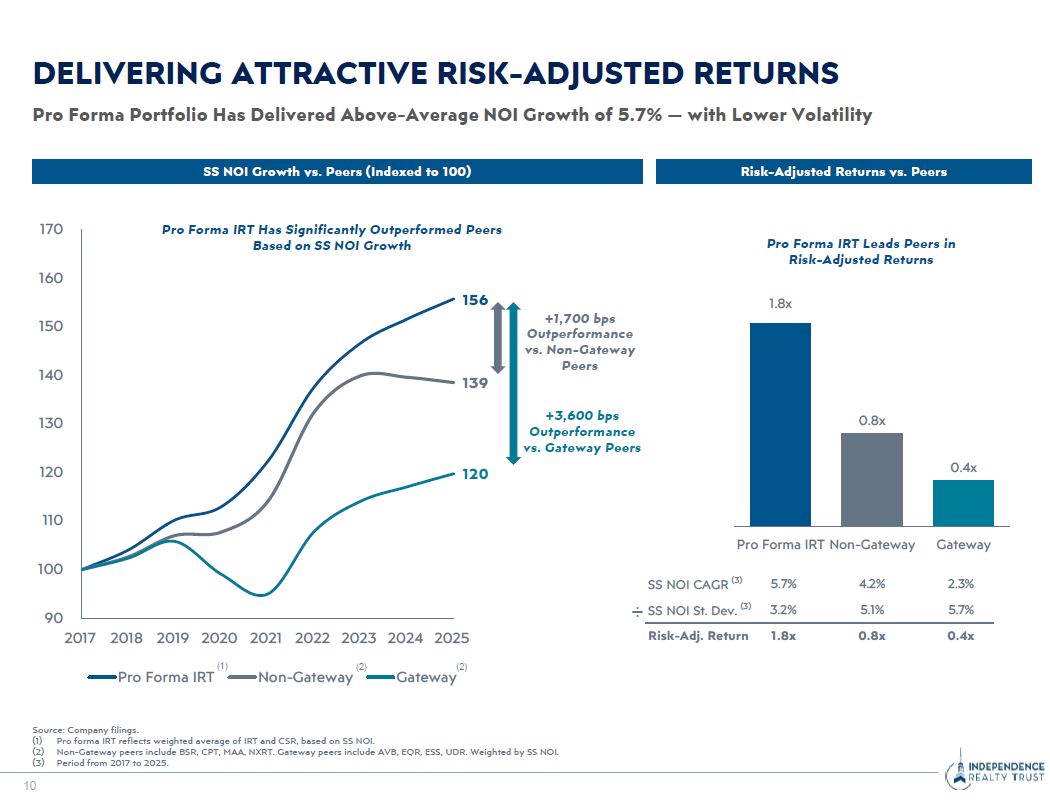
156 139 120 100 90 2017 2018 2019
2020 110 120 130 140 150 160 170 Pro Forma IRT Non-Gateway Gateway SS NOI Growth vs. Peers (Indexed to 100) DELIVERING ATTRACTIVE RISK-ADJUSTED RETURNS Pro Forma Portfolio Has Delivered Above-Average NOI Growth of 5.7% — with
Lower Volatility Source: Company filings. Pro forma IRT reflects weighted average of IRT and CSR, based on SS NOI. Non-Gateway peers include BSR, CPT, MAA, NXRT. Gateway peers include AVB, EQR, ESS, UDR. Weighted by SS NOI. Pro Forma IRT
Leads Peers in Risk-Adjusted Returns (1) (2) (2) Risk-Adjusted Returns vs. Peers 1.8x 0.8x 0.4x Pro Forma IRT Non-Gateway Gateway Pro Forma IRT Has Significantly Outperformed Peers Based on SS NOI Growth SS NOI CAGR
(3) 5.7% 4.2% 2.3% ÷ SS NOI St. Dev. (3) 3.2% 5.1% 5.7% 2021 2022 2023 2024 2025 Risk-Adj. Return 1.8x 0.8x 0.4x +1,700 bps Outperformance vs. Non-Gateway Peers (3) Period from 2017 to 2025. 10 +3,600 bps Outperformance vs.
Gateway Peers
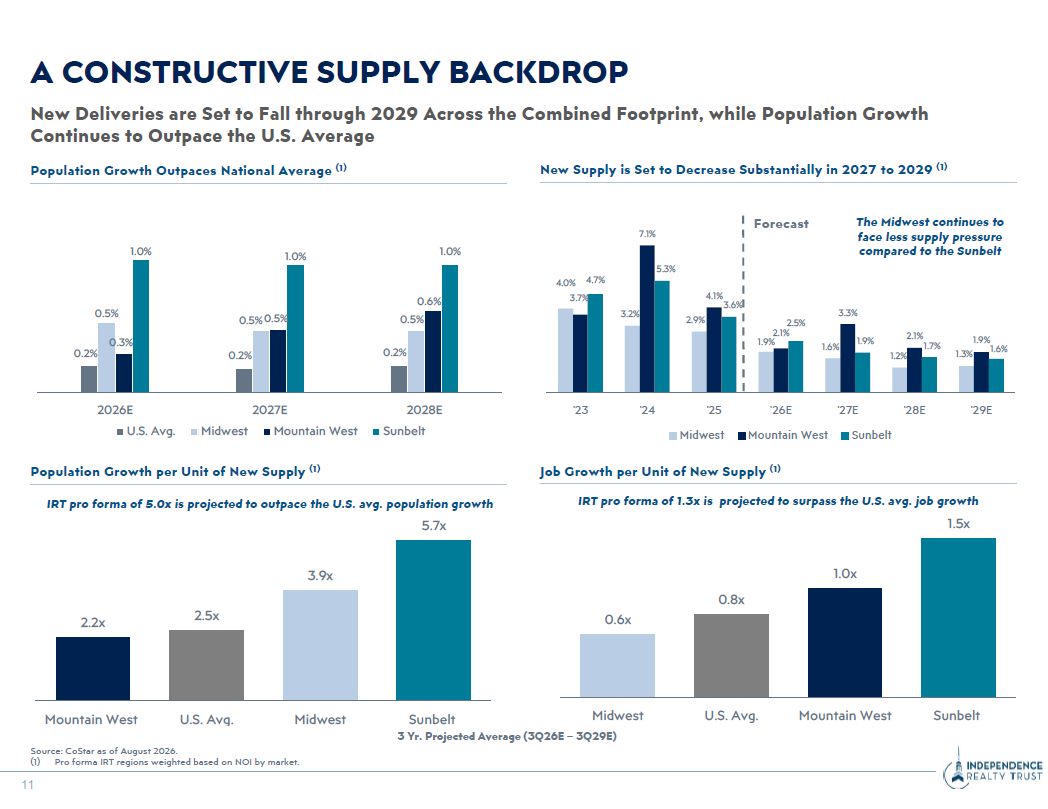
4.0% 3.2% 2.9% 1.9% 1.6% 1.2% 1.3% 3.7% 7.1% 2.1% 3.3% 2.1% 1.9% 4.7% 5.3% 4.1% 3.6% 2.5% 1.9% 1.7% 1.6% '23 '24 '25 Midwest '26E Mountain
West '28E '29E '27E Sunbelt 0.2% 0.2% 0.2% 0.5% 0.5% 0.3% 0.5% 0.5% 0.6% 1.0% 1.0% 1.0% 2026E U.S. Avg. 2027E 2028E Midwest Mountain West Sunbelt 2.2x 2.5x 3.9x IRT pro forma of 5.0x is projected to outpace the U.S.
avg. population growth 5.7x Mountain West U.S. Avg. Midwest Sunbelt A CONSTRUCTIVE SUPPLY BACKDROP New Deliveries are Set to Fall through 2029 Across the Combined Footprint, while Population Growth Continues to Outpace the U.S.
Average Population Growth Outpaces National Average (1) New Supply is Set to Decrease Substantially in 2027 to 2029 (1) Population Growth per Unit of New Supply (1) Forecast The Midwest continues to face less supply pressure compared to
the Sunbelt 3 Yr. Projected Average (3Q26E – 3Q29E) Source: CoStar as of August 2026. Job Growth per Unit of New Supply (1) 0.6x (1) Pro forma IRT regions weighted based on NOI by market. 11 0.8x 1.0x IRT pro forma of 1.3x is
projected to surpass the U.S. avg. job growth 1.5x Midwest U.S. Avg. Mountain West Sunbelt
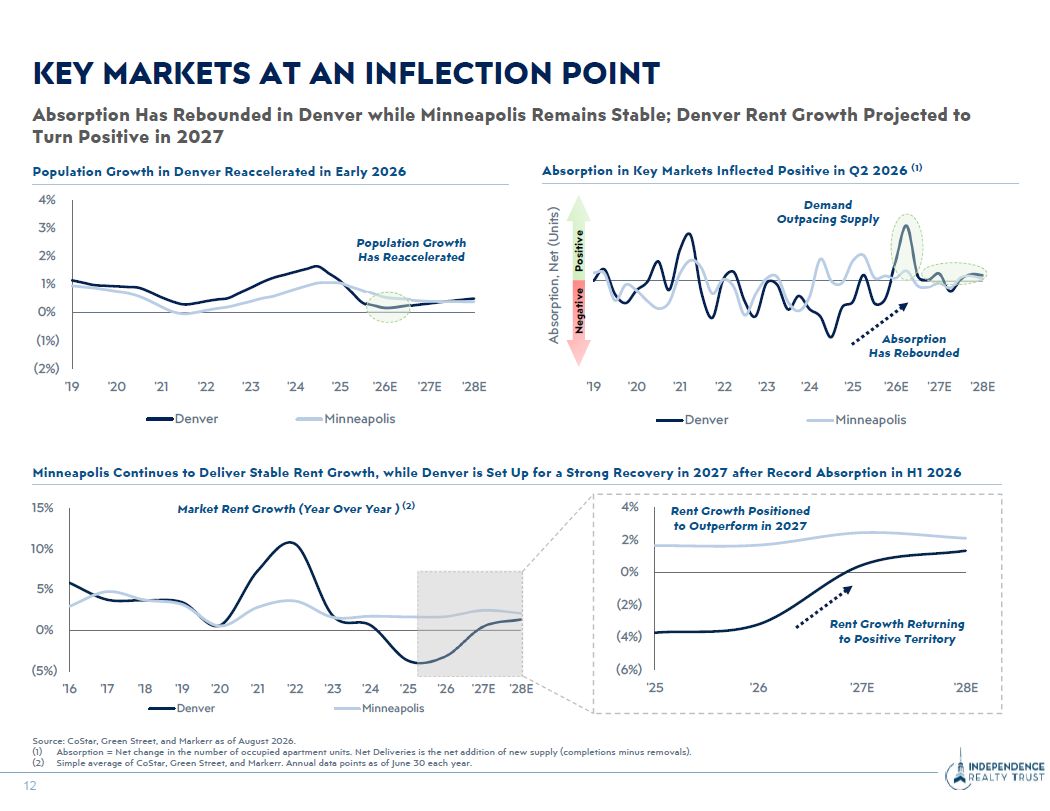
4% 3% 2% 1% 0% (1%) (2%) '19 '20 '27E '28E '21 '22 Denver '23 '24
'25 '26E Minneapolis '19 '20 '21 '28E Denver Absorption, Net (Units) Negative Positive (6%) (4%) (2%) 0% 2% '25 '26 '27E '28E (5%) 0% 5% 10% '26 '27E '28E Denver '16 '17 '18 '19 '20 '21 '22 '23 '24 '25 Minneapolis KEY
MARKETS AT AN INFLECTION POINT Absorption Has Rebounded in Denver while Minneapolis Remains Stable; Denver Rent Growth Projected to Turn Positive in 2027 Population Growth in Denver Reaccelerated in Early 2026 Absorption in Key Markets
Inflected Positive in Q2 2026 (1) Source: CoStar, Green Street, and Markerr as of August 2026. (1) Absorption = Net change in the number of occupied apartment units. Net Deliveries is the net addition of new supply (completions minus
removals). Rent Growth Returning to Positive Territory Population Growth Has Reaccelerated Demand Outpacing Supply Absorption Has Rebounded '22 '23 '24 '25 '26E '27E Minneapolis Minneapolis Continues to Deliver Stable Rent Growth,
while Denver is Set Up for a Strong Recovery in 2027 after Record Absorption in H1 2026 Rent Growth Positioned to Outperform in 2027 15% Market Rent Growth (Year Over Year ) (2) 4% (2) Simple average of CoStar, Green Street, and Markerr.
Annual data points as of June 30 each year. 12
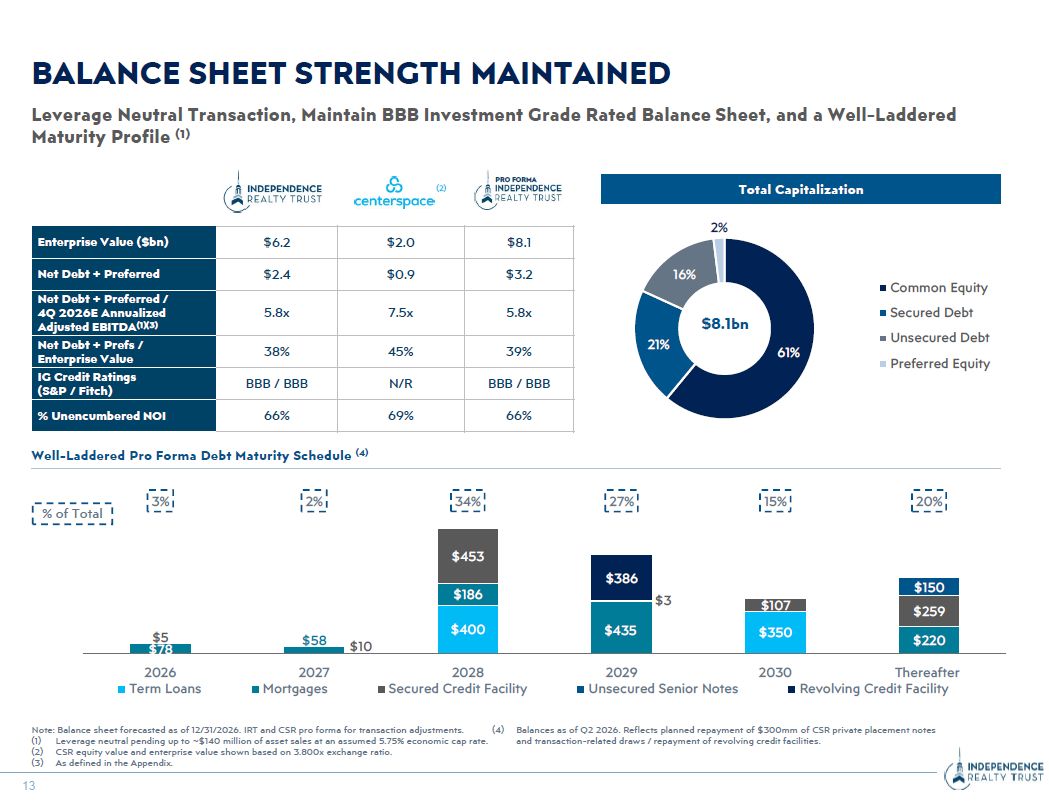
61% 21% 16% 2% Common Equity Secured Debt Unsecured Debt Preferred
Equity Well-Laddered Pro Forma Debt Maturity Schedule (4) BALANCE SHEET STRENGTH MAINTAINED Leverage Neutral Transaction, Maintain BBB Investment Grade Rated Balance Sheet, and a Well-Laddered Maturity Profile (1) $8.1bn % of Total PRO
FORMA Total Capitalization (2) Note: Balance sheet forecasted as of 12/31/2026. IRT and CSR pro forma for transaction adjustments. (4) Balances as of Q2 2026. Reflects planned repayment of $300mm of CSR private placement notes Leverage
neutral pending up to ~$140 million of asset sales at an assumed 5.75% economic cap rate. and transaction-related draws / repayment of revolving credit facilities. CSR equity value and enterprise value shown based on 3.800x exchange
ratio. $400 $350 $78 $58 $186 $435 $220 $5 $10 $453 $3 $107 $259 $150 $386 3% 2% 34% 27% 15% 20% 2026 Term Loans 2027 Mortgages 2028 Secured Credit Facility 2029 Unsecured Senior Notes 2030 Thereafter
Revolving Credit Facility Enterprise Value ($bn) $6.2 $2.0 $8.1 Net Debt + Preferred $2.4 $0.9 $3.2 Net Debt + Preferred / 4Q 2026E Annualized Adjusted EBITDA(1)(3) 5.8x 7.5x 5.8x Net Debt + Prefs / Enterprise
Value 38% 45% 39% IG Credit Ratings (S&P / Fitch) BBB / BBB N/R BBB / BBB % Unencumbered NOI 66% 69% 66% (3) As defined in the Appendix. 13
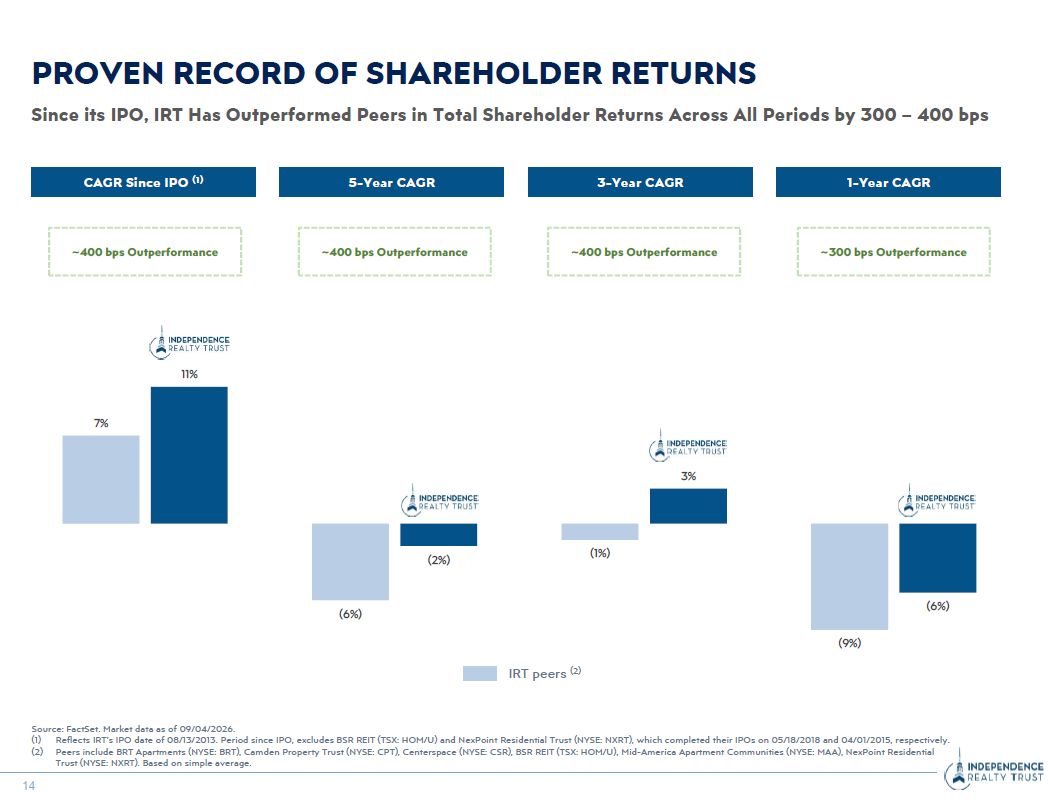
7% (6%) (1%) (9%) 11% (2%) 3% (6%) ~400 bps Outperformance ~400 bps
Outperformance ~400 bps Outperformance ~300 bps Outperformance 1-Year CAGR 3-Year CAGR 5-Year CAGR CAGR Since IPO (1) Since its IPO, IRT Has Outperformed Peers in Total Shareholder Returns Across All Periods by 300 – 400 bps PROVEN
RECORD OF SHAREHOLDER RETURNS Source: FactSet. Market data as of 09/04/2026. Reflects IRT’s IPO date of 08/13/2013. Period since IPO, excludes BSR REIT (TSX: HOM/U) and NexPoint Residential Trust (NYSE: NXRT), which completed their IPOs on
05/18/2018 and 04/01/2015, respectively. Peers include BRT Apartments (NYSE: BRT), Camden Property Trust (NYSE: CPT), Centerspace (NYSE: CSR), BSR REIT (TSX: HOM/U), Mid-America Apartment Communities (NYSE: MAA), NexPoint Residential Trust
(NYSE: NXRT). Based on simple average. IRT peers (2) 14
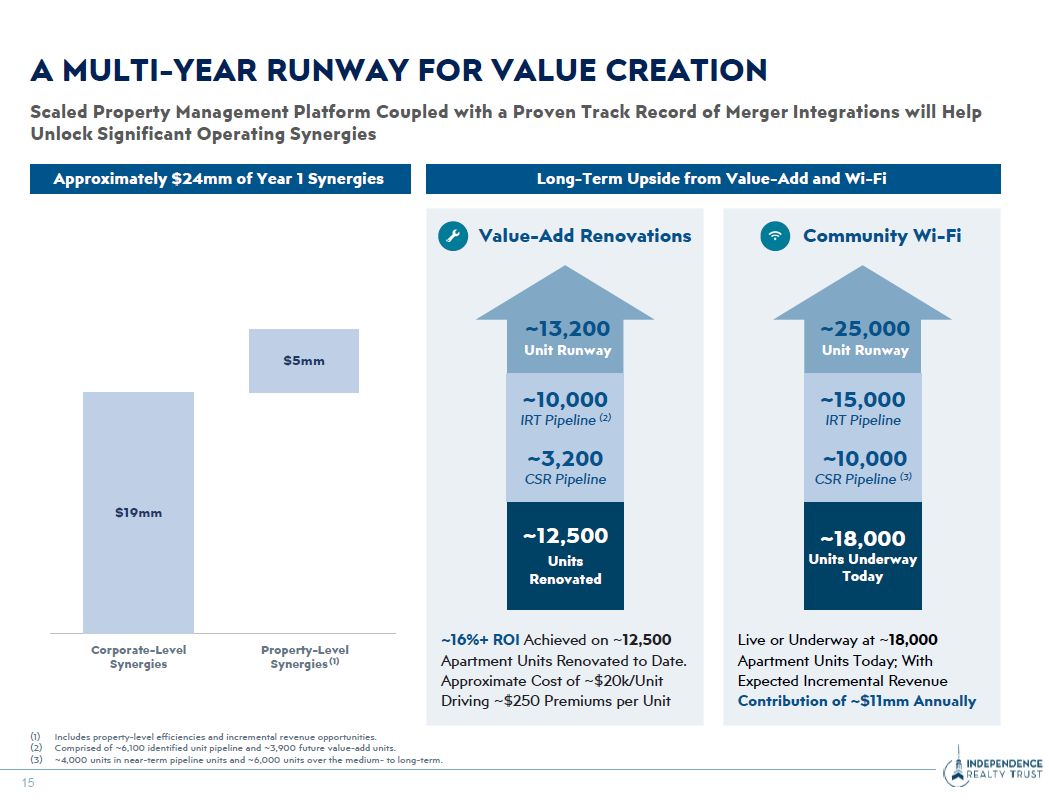
A MULTI-YEAR RUNWAY FOR VALUE CREATION Scaled Property Management Platform
Coupled with a Proven Track Record of Merger Integrations will Help Unlock Significant Operating Synergies Approximately $24mm of Year 1 Synergies Value-Add Renovations ~13,200 Unit Runway ~10,000 IRT Pipeline (2) ~3,200 CSR
Pipeline ~12,500 Units Renovated ~16%+ ROI Achieved on ~12,500 Apartment Units Renovated to Date. Approximate Cost of ~$20k/Unit Driving ~$250 Premiums per Unit Long-Term Upside from Value-Add and Wi-Fi Community Wi-Fi ~25,000 Unit
Runway ~15,000 IRT Pipeline ~10,000 CSR Pipeline (3) ~18,000 Units Underway Today Live or Underway at ~18,000 Apartment Units Today; With Expected Incremental Revenue Contribution of ~$11mm Annually Includes property-level
efficiencies and incremental revenue opportunities. Comprised of ~6,100 identified unit pipeline and ~3,900 future value-add units. ~4,000 units in near-term pipeline units and ~6,000 units over the medium- to
long-term. $19mm 15 $5mm Corporate-Level Synergies Property-Level Synergies (1)
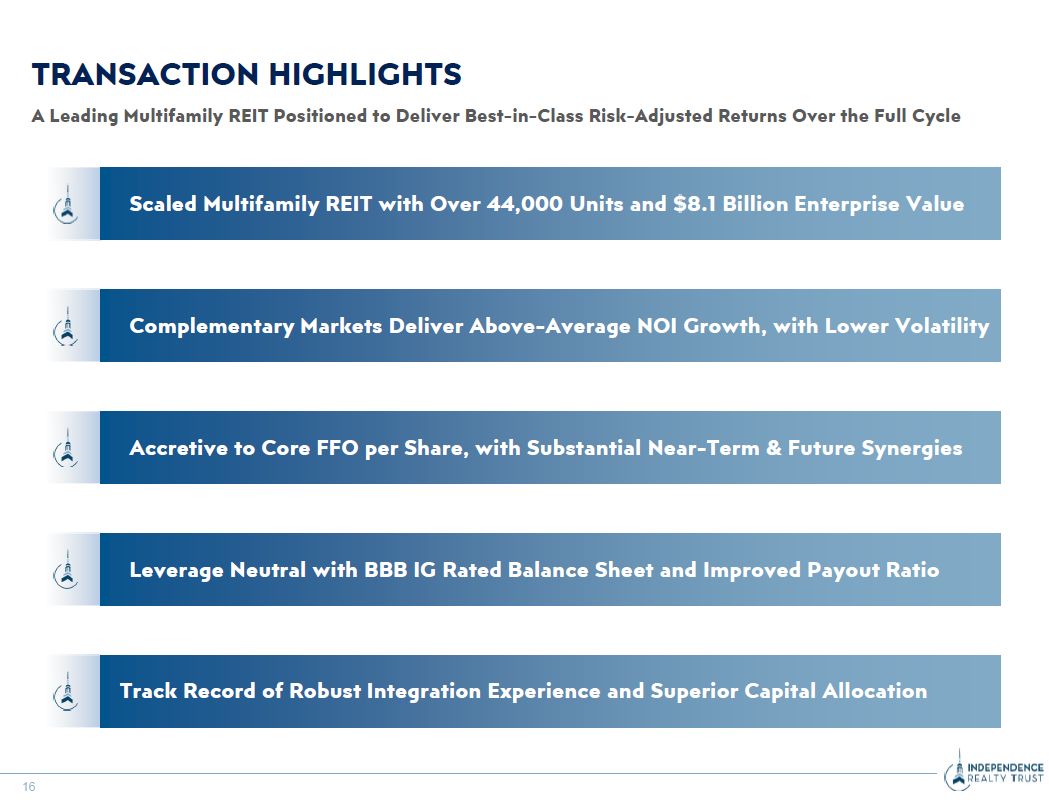
TRANSACTION HIGHLIGHTS A Leading Multifamily REIT Positioned to Deliver
Best-in-Class Risk-Adjusted Returns Over the Full Cycle Scaled Multifamily REIT with Over 44,000 Units and $8.1 Billion Enterprise Value Complementary Markets Deliver Above-Average NOI Growth, with Lower Volatility Accretive to Core FFO
per Share, with Substantial Near-Term & Future Synergies Leverage Neutral with BBB IG Rated Balance Sheet and Improved Payout Ratio Track Record of Robust Integration Experience and Superior Capital Allocation 16
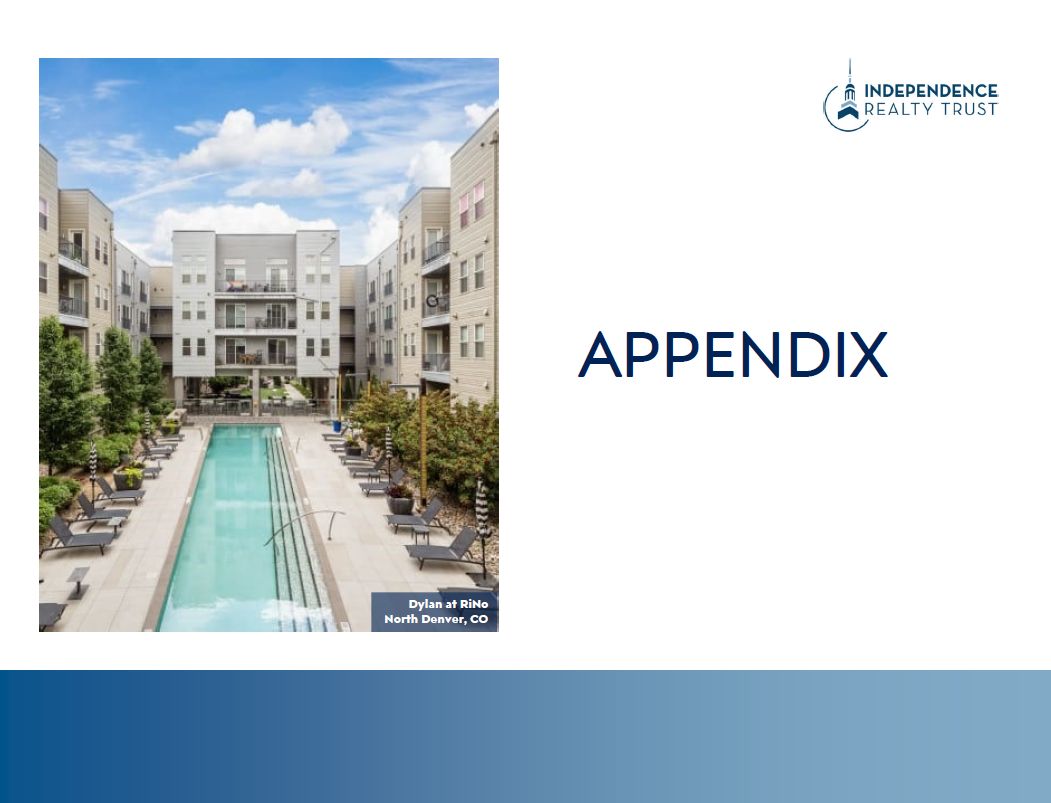
APPENDIX Dylan at RiNo North Denver, CO
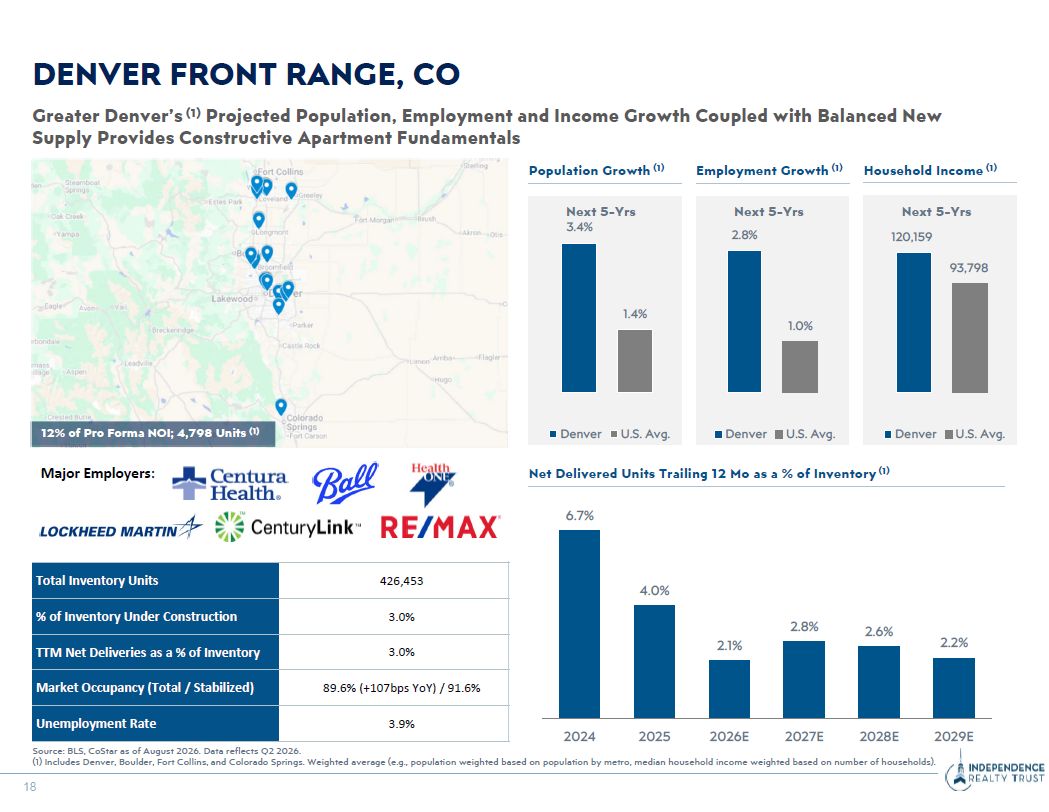
Net Delivered Units Trailing 12 Mo as a % of Inventory (1) Total Inventory
Units 426,453 % of Inventory Under Construction 3.0% TTM Net Deliveries as a % of Inventory 3.0% Market Occupancy (Total / Stabilized) 89.6% (+107bps YoY) / 91.6% Unemployment Rate 3.9% Major Employers: Source: BLS, CoStar as of
August 2026. Data reflects Q2 2026. (1) Includes Denver, Boulder, Fort Collins, and Colorado Springs. Weighted average (e.g., population weighted based on population by metro, median household income weighted based on number of
households). DENVER FRONT RANGE, CO Greater Denver’s (1) Projected Population, Employment and Income Growth Coupled with Balanced New Supply Provides Constructive Apartment Fundamentals Population Growth (1) Employment Growth (1) Household
Income (1) Next 5-Yrs 120,159 93,798 Denver U.S. Avg. 12% of Pro Forma NOI; 4,798 Units (1) Next 5-Yrs 3.4% 1.4% Denver U.S. Avg. Next 5-Yrs 2.8% 1.0% Denver U.S. Avg. 6.7% 18 4.0% 2.1% 2.8% 2.6% 2.2% 2024 2025 2026E
2027E 2028E 2029E
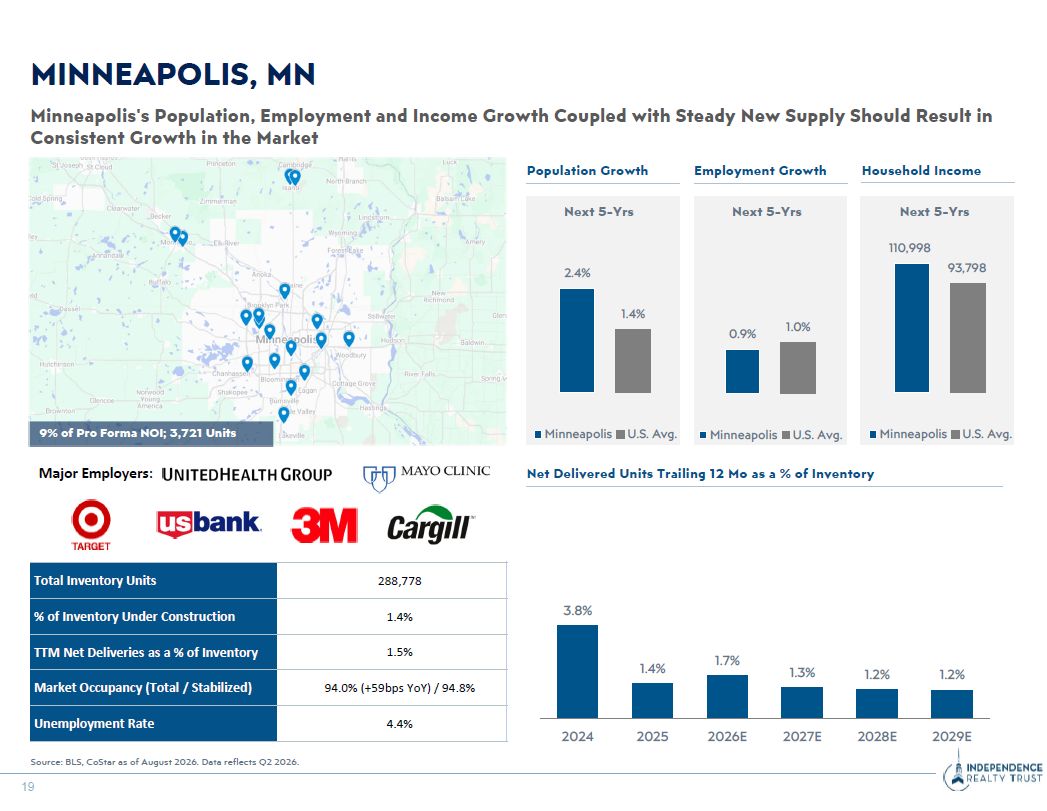
Major Employers: Total Inventory Units 288,778 % of Inventory Under
Construction 1.4% TTM Net Deliveries as a % of Inventory 1.5% Market Occupancy (Total / Stabilized) 94.0% (+59bps YoY) / 94.8% Unemployment Rate 4.4% Minneapolis's Population, Employment and Income Growth Coupled with Steady New
Supply Should Result in Consistent Growth in the Market Population Growth Employment Growth Household Income Source: BLS, CoStar as of August 2026. Data reflects Q2 2026. MINNEAPOLIS, MN Net Delivered Units Trailing 12 Mo as a % of
Inventory 9% of Pro Forma NOI; 3,721 Units 3.8% 1.4% 1.7% 1.3% 1.2% 1.2% 2024 2025 2026E 2027E 2028E 2029E Next 5-Yrs 2.4% 1.4% Minneapolis U.S. Avg. Next 5-Yrs Next 5-Yrs 110,998 93,798 Minneapolis U.S.
Avg. 0.9% 19 1.0% Minneapolis U.S. Avg.
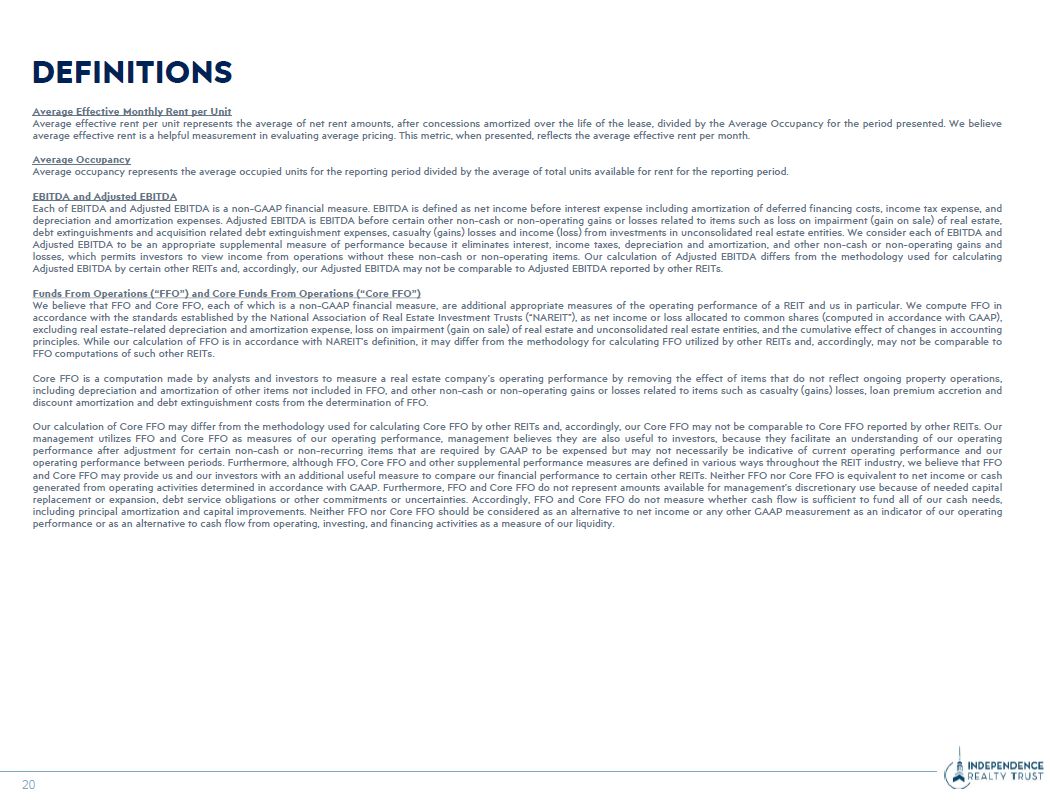
Average Effective Monthly Rent per Unit Average effective rent per unit
represents the average of net rent amounts, after concessions amortized over the life of the lease, divided by the Average Occupancy for the period presented. We believe average effective rent is a helpful measurement in evaluating average
pricing. This metric, when presented, reflects the average effective rent per month. Average Occupancy Average occupancy represents the average occupied units for the reporting period divided by the average of total units available for rent
for the reporting period. EBITDA and Adjusted EBITDA Each of EBITDA and Adjusted EBITDA is a non-GAAP financial measure. EBITDA is defined as net income before interest expense including amortization of deferred financing costs, income tax
expense, and depreciation and amortization expenses. Adjusted EBITDA is EBITDA before certain other non-cash or non-operating gains or losses related to items such as loss on impairment (gain on sale) of real estate, debt extinguishments and
acquisition related debt extinguishment expenses, casualty (gains) losses and income (loss) from investments in unconsolidated real estate entities. We consider each of EBITDA and Adjusted EBITDA to be an appropriate supplemental measure of
performance because it eliminates interest, income taxes, depreciation and amortization, and other non-cash or non-operating gains and losses, which permits investors to view income from operations without these non-cash or non-operating
items. Our calculation of Adjusted EBITDA differs from the methodology used for calculating Adjusted EBITDA by certain other REITs and, accordingly, our Adjusted EBITDA may not be comparable to Adjusted EBITDA reported by other REITs. Funds
From Operations (“FFO”) and Core Funds From Operations (“Core FFO”) We believe that FFO and Core FFO, each of which is a non-GAAP financial measure, are additional appropriate measures of the operating performance of a REIT and us in
particular. We compute FFO in accordance with the standards established by the National Association of Real Estate Investment Trusts (“NAREIT”), as net income or loss allocated to common shares (computed in accordance with GAAP), excluding
real estate-related depreciation and amortization expense, loss on impairment (gain on sale) of real estate and unconsolidated real estate entities, and the cumulative effect of changes in accounting principles. While our calculation of FFO
is in accordance with NAREIT’s definition, it may differ from the methodology for calculating FFO utilized by other REITs and, accordingly, may not be comparable to FFO computations of such other REITs. Core FFO is a computation made by
analysts and investors to measure a real estate company’s operating performance by removing the effect of items that do not reflect ongoing property operations, including depreciation and amortization of other items not included in FFO, and
other non-cash or non-operating gains or losses related to items such as casualty (gains) losses, loan premium accretion and discount amortization and debt extinguishment costs from the determination of FFO. Our calculation of Core FFO may
differ from the methodology used for calculating Core FFO by other REITs and, accordingly, our Core FFO may not be comparable to Core FFO reported by other REITs. Our management utilizes FFO and Core FFO as measures of our operating
performance, management believes they are also useful to investors, because they facilitate an understanding of our operating performance after adjustment for certain non-cash or non-recurring items that are required by GAAP to be expensed
but may not necessarily be indicative of current operating performance and our operating performance between periods. Furthermore, although FFO, Core FFO and other supplemental performance measures are defined in various ways throughout the
REIT industry, we believe that FFO and Core FFO may provide us and our investors with an additional useful measure to compare our financial performance to certain other REITs. Neither FFO nor Core FFO is equivalent to net income or cash
generated from operating activities determined in accordance with GAAP. Furthermore, FFO and Core FFO do not represent amounts available for management’s discretionary use because of needed capital replacement or expansion, debt service
obligations or other commitments or uncertainties. Accordingly, FFO and Core FFO do not measure whether cash flow is sufficient to fund all of our cash needs, including principal amortization and capital improvements. Neither FFO nor Core FFO
should be considered as an alternative to net income or any other GAAP measurement as an indicator of our operating performance or as an alternative to cash flow from operating, investing, and financing activities as a measure of our
liquidity. 20 DEFINITIONS
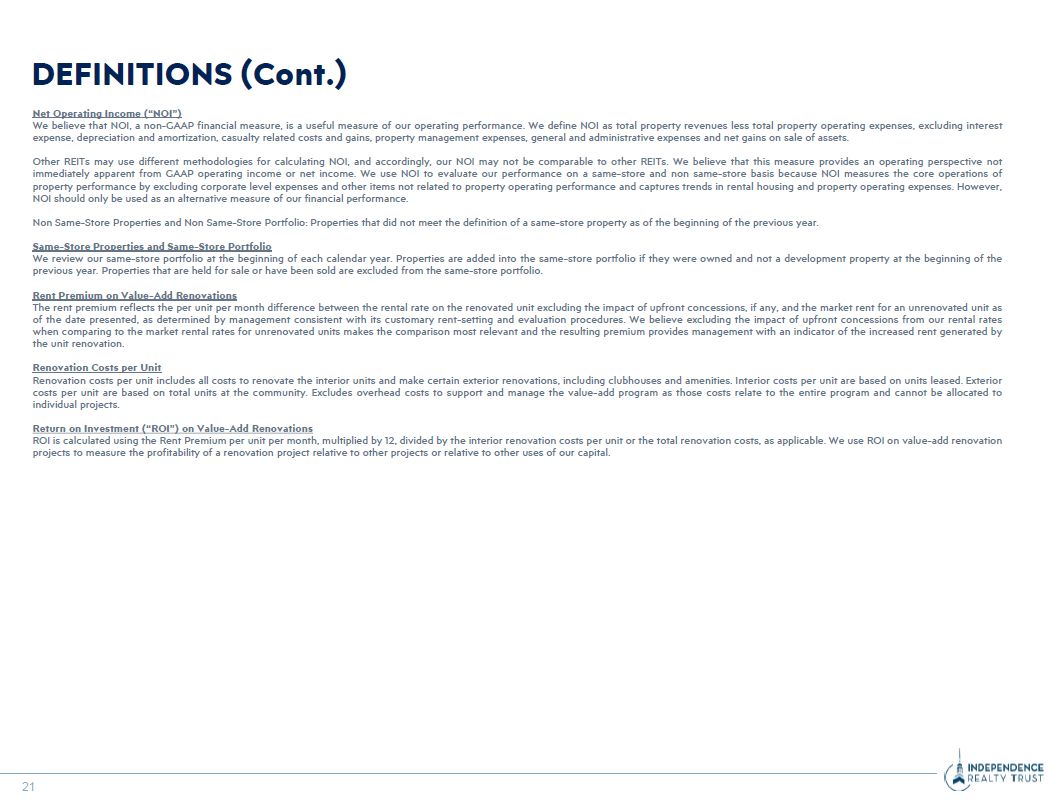
Net Operating Income (“NOI”) We believe that NOI, a non-GAAP financial measure,
is a useful measure of our operating performance. We define NOI as total property revenues less total property operating expenses, excluding interest expense, depreciation and amortization, casualty related costs and gains, property
management expenses, general and administrative expenses and net gains on sale of assets. Other REITs may use different methodologies for calculating NOI, and accordingly, our NOI may not be comparable to other REITs. We believe that this
measure provides an operating perspective not immediately apparent from GAAP operating income or net income. We use NOI to evaluate our performance on a same-store and non same-store basis because NOI measures the core operations of property
performance by excluding corporate level expenses and other items not related to property operating performance and captures trends in rental housing and property operating expenses. However, NOI should only be used as an alternative measure
of our financial performance. Non Same-Store Properties and Non Same-Store Portfolio: Properties that did not meet the definition of a same-store property as of the beginning of the previous year. Same-Store Properties and Same-Store
Portfolio We review our same-store portfolio at the beginning of each calendar year. Properties are added into the same-store portfolio if they were owned and not a development property at the beginning of the previous year. Properties that
are held for sale or have been sold are excluded from the same-store portfolio. Rent Premium on Value-Add Renovations The rent premium reflects the per unit per month difference between the rental rate on the renovated unit excluding the
impact of upfront concessions, if any, and the market rent for an unrenovated unit as of the date presented, as determined by management consistent with its customary rent-setting and evaluation procedures. We believe excluding the impact of
upfront concessions from our rental rates when comparing to the market rental rates for unrenovated units makes the comparison most relevant and the resulting premium provides management with an indicator of the increased rent generated by
the unit renovation. Renovation Costs per Unit Renovation costs per unit includes all costs to renovate the interior units and make certain exterior renovations, including clubhouses and amenities. Interior costs per unit are based on units
leased. Exterior costs per unit are based on total units at the community. Excludes overhead costs to support and manage the value-add program as those costs relate to the entire program and cannot be allocated to individual projects. Return
on Investment (“ROI”) on Value-Add Renovations ROI is calculated using the Rent Premium per unit per month, multiplied by 12, divided by the interior renovation costs per unit or the total renovation costs, as applicable. We use ROI on
value-add renovation projects to measure the profitability of a renovation project relative to other projects or relative to other uses of our capital. 21 DEFINITIONS (Cont.)