What were the Fund costs for the past year?
(based on a hypothetical $10,000 investment)
|
Fund Name
|
Costs of a $10,000 investment
|
Costs paid as a percentage of a $10,000 investment
|
|---|---|---|
|
T-REX 2X Inverse NVIDIA Daily Target ETF
|
$76
|
1.05%
|
Fund Objective
The T-REX 2x Inverse Nvidia Daily Target ETF (“NVDQ” or the “Fund”) seeks daily investment results, before fees and expenses, of -200% of the daily performance of Nvidia common stock ("NVDA").
Fund Performance
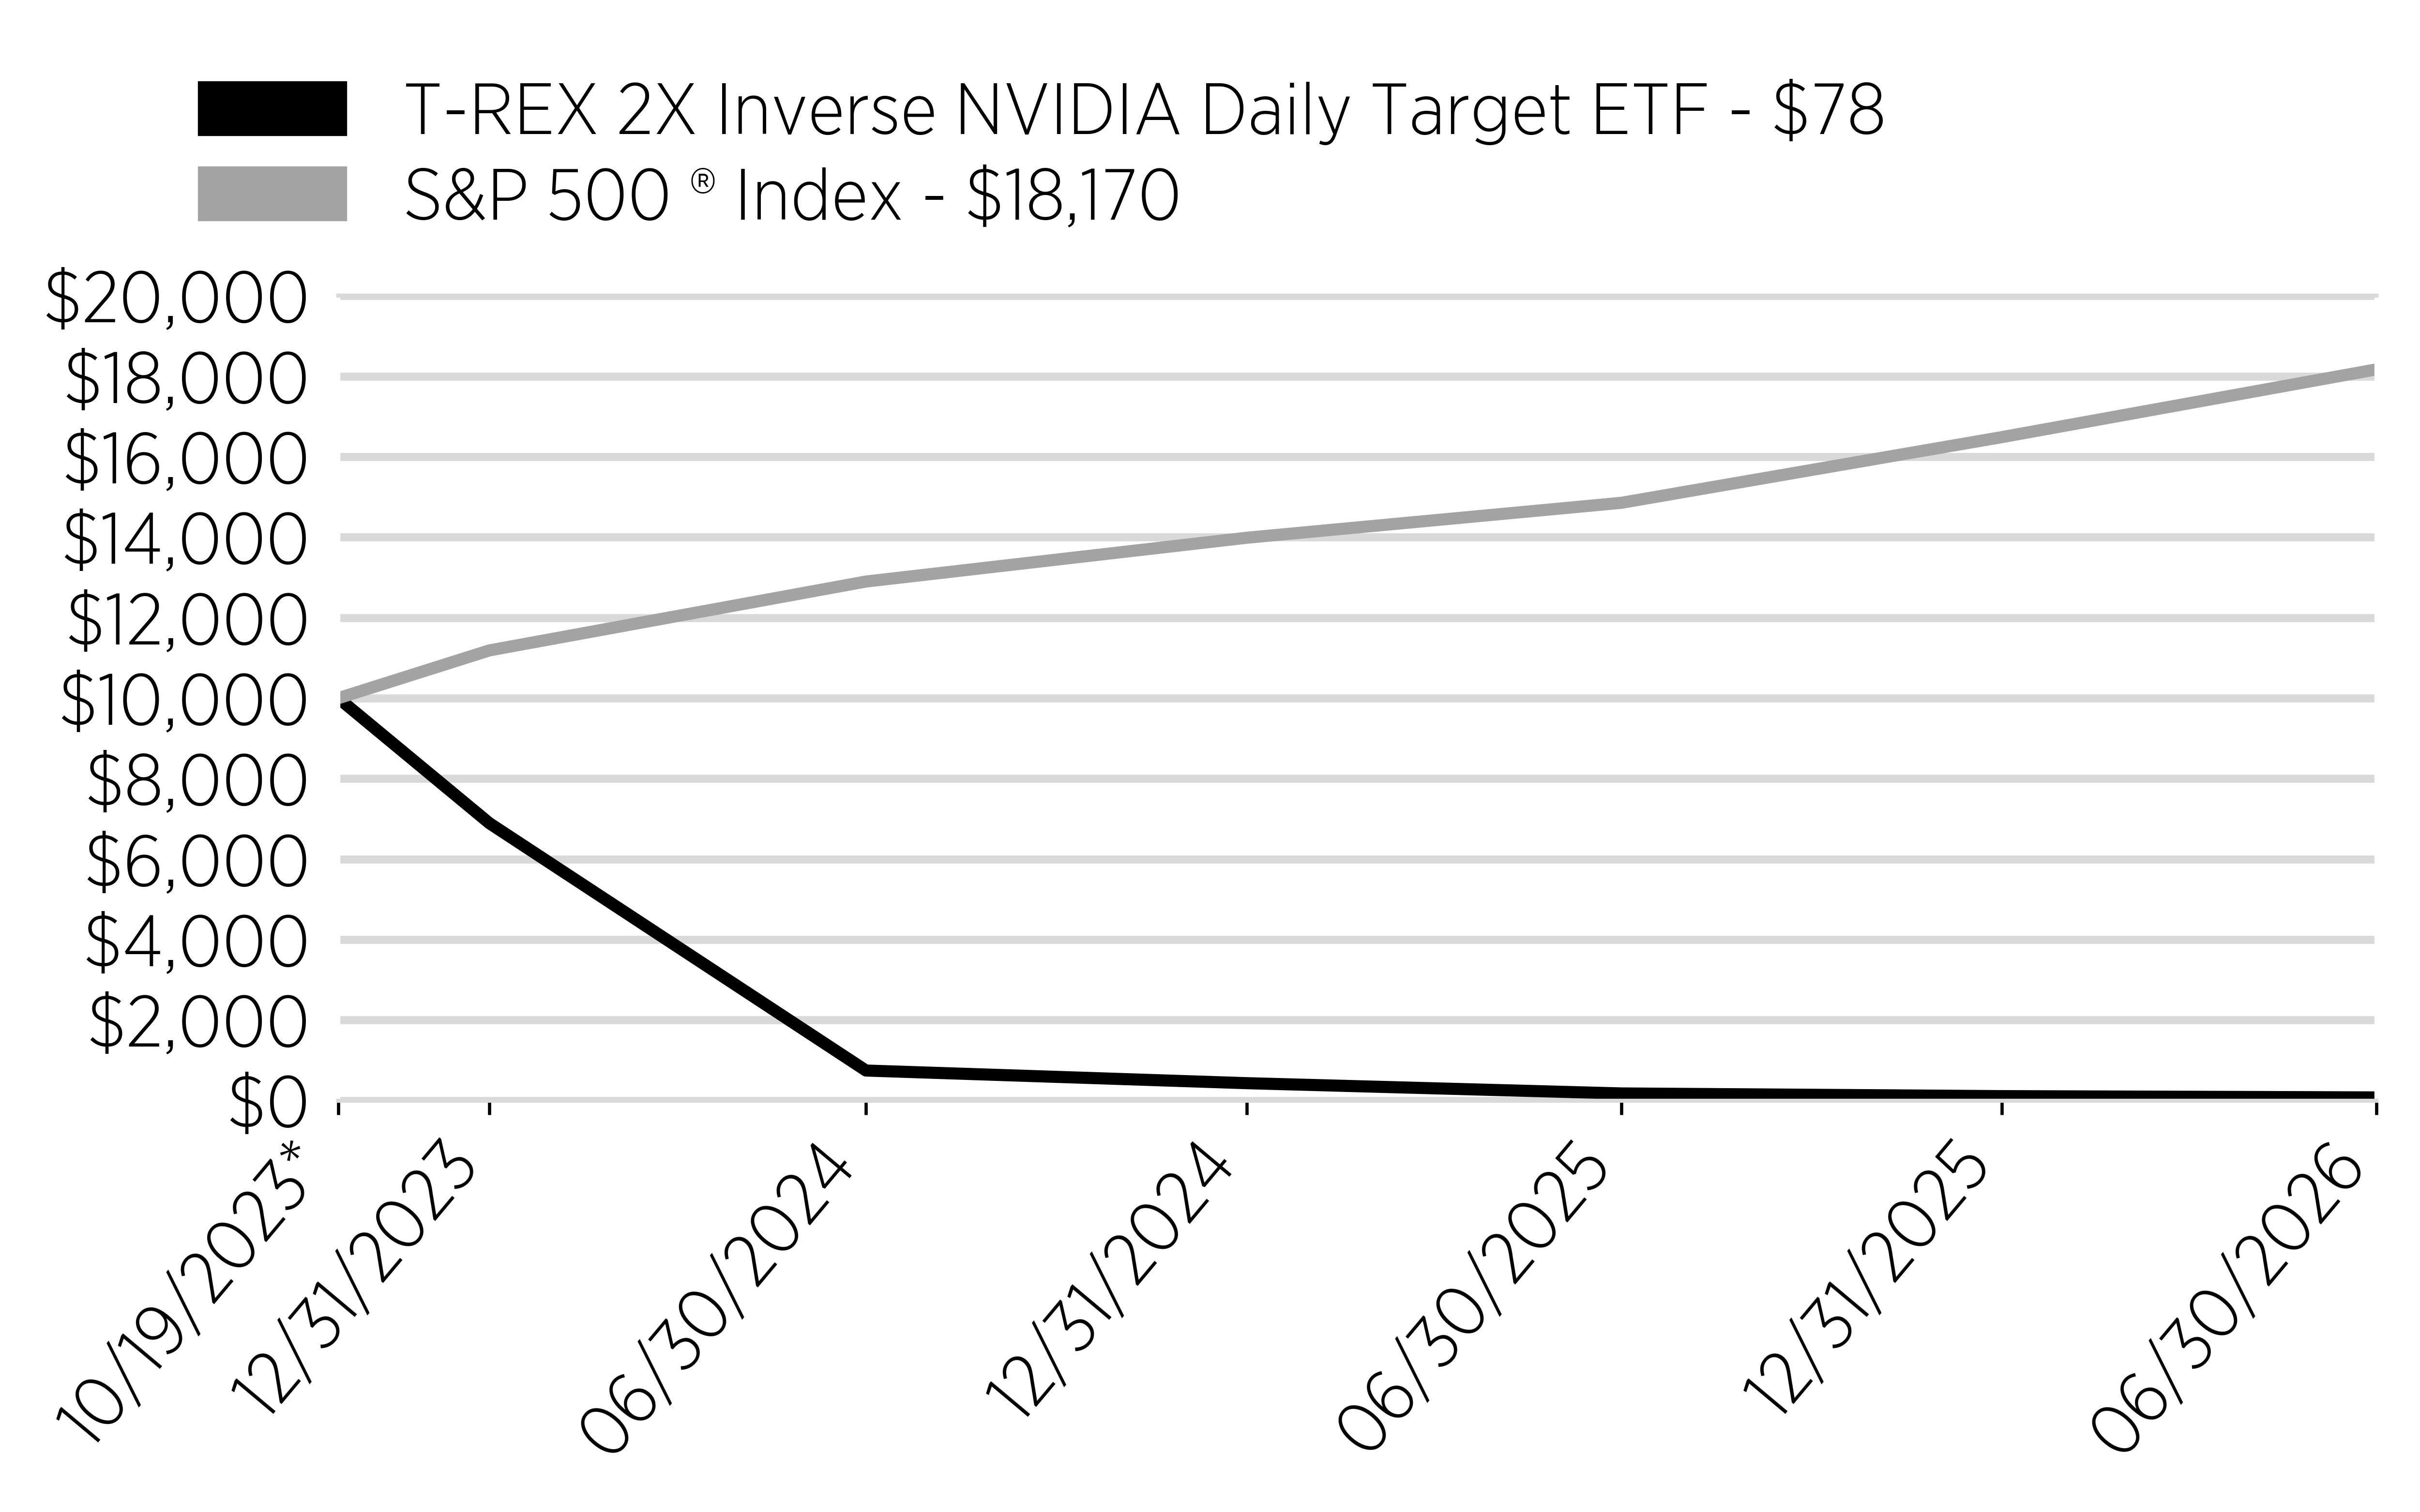
For the fiscal year ended June 30, 2026, NVDQ returned -56.12%, compared to a 26.82% return for NVDA and 22.32% for the S&P 500® Index.
Performance Drivers
As a fund designed to deliver -2x Nvidia's daily return, NVDQ faced a structurally adverse environment throughout the period. The stock's persistent upward trend — driven by continued AI infrastructure demand, a favorable competitive position in accelerated computing, and consistently strong financial results — acted as a sustained headwind.
Cumulative Performance
(based on a hypothetical $10,000 investment)
| * | Inception |
Annual Performance
|
|
1 Year
|
Average Annual Total Return
Since Inception
|
|---|---|---|
|
T-REX 2X Inverse NVIDIA
Daily Target ETF
|
-56.12%
|
-83.50%
|
|
S&P 500 ® Index
|
22.32%
|
24.77%
|
Key Fund Statistics
(as of June 30, 2026 )
|
Fund Net Assets
|
$20,351,048
|
|
Number of Holdings
|
2
|
|
Total Net Advisory Fee
|
$355,887
|
|
Portfolio Turnover Rate
|
0.00%
|
Market Exposure
|
|
|
|
|
|
"Market Exposure" includes the values of total investments (including the contract value of any derivatives) and excludes any short-term investments.
|
Portfolio Composition
|
|
|---|---|
|
Cash
|
|
|
Derivatives
|
|
|
Other Assets, Net of Liabilities
|
Material Changes
Stock Split
On October 14, 2025, the Board of the Trust approved a reverse stock split for the Fund at a reverse split ratio of 1:20. The record date for the stock split was October 27, 2025, and the stock split was effectuated after the close of trading on October 28, 2025. Shares of the Fund began trading on a split-adjusted basis on October 29, 2025.
What were the Fund costs for the past year?
(based on a hypothetical $10,000 investment)
|
Fund Name
|
Costs of a $10,000 investment
|
Costs paid as a percentage of a $10,000 investment
|
|---|---|---|
|
T-REX 2X Inverse Tesla Daily Target ETF
|
$69
|
1.05%
|
Fund Objective
The T-REX 2x Inverse Tesla Daily Target ETF (“TSLZ” or the “Fund”) seeks daily investment results, before fees and expenses, of -200% of the daily performance of Tesla common stock (“TSLA”).
Fund Performance
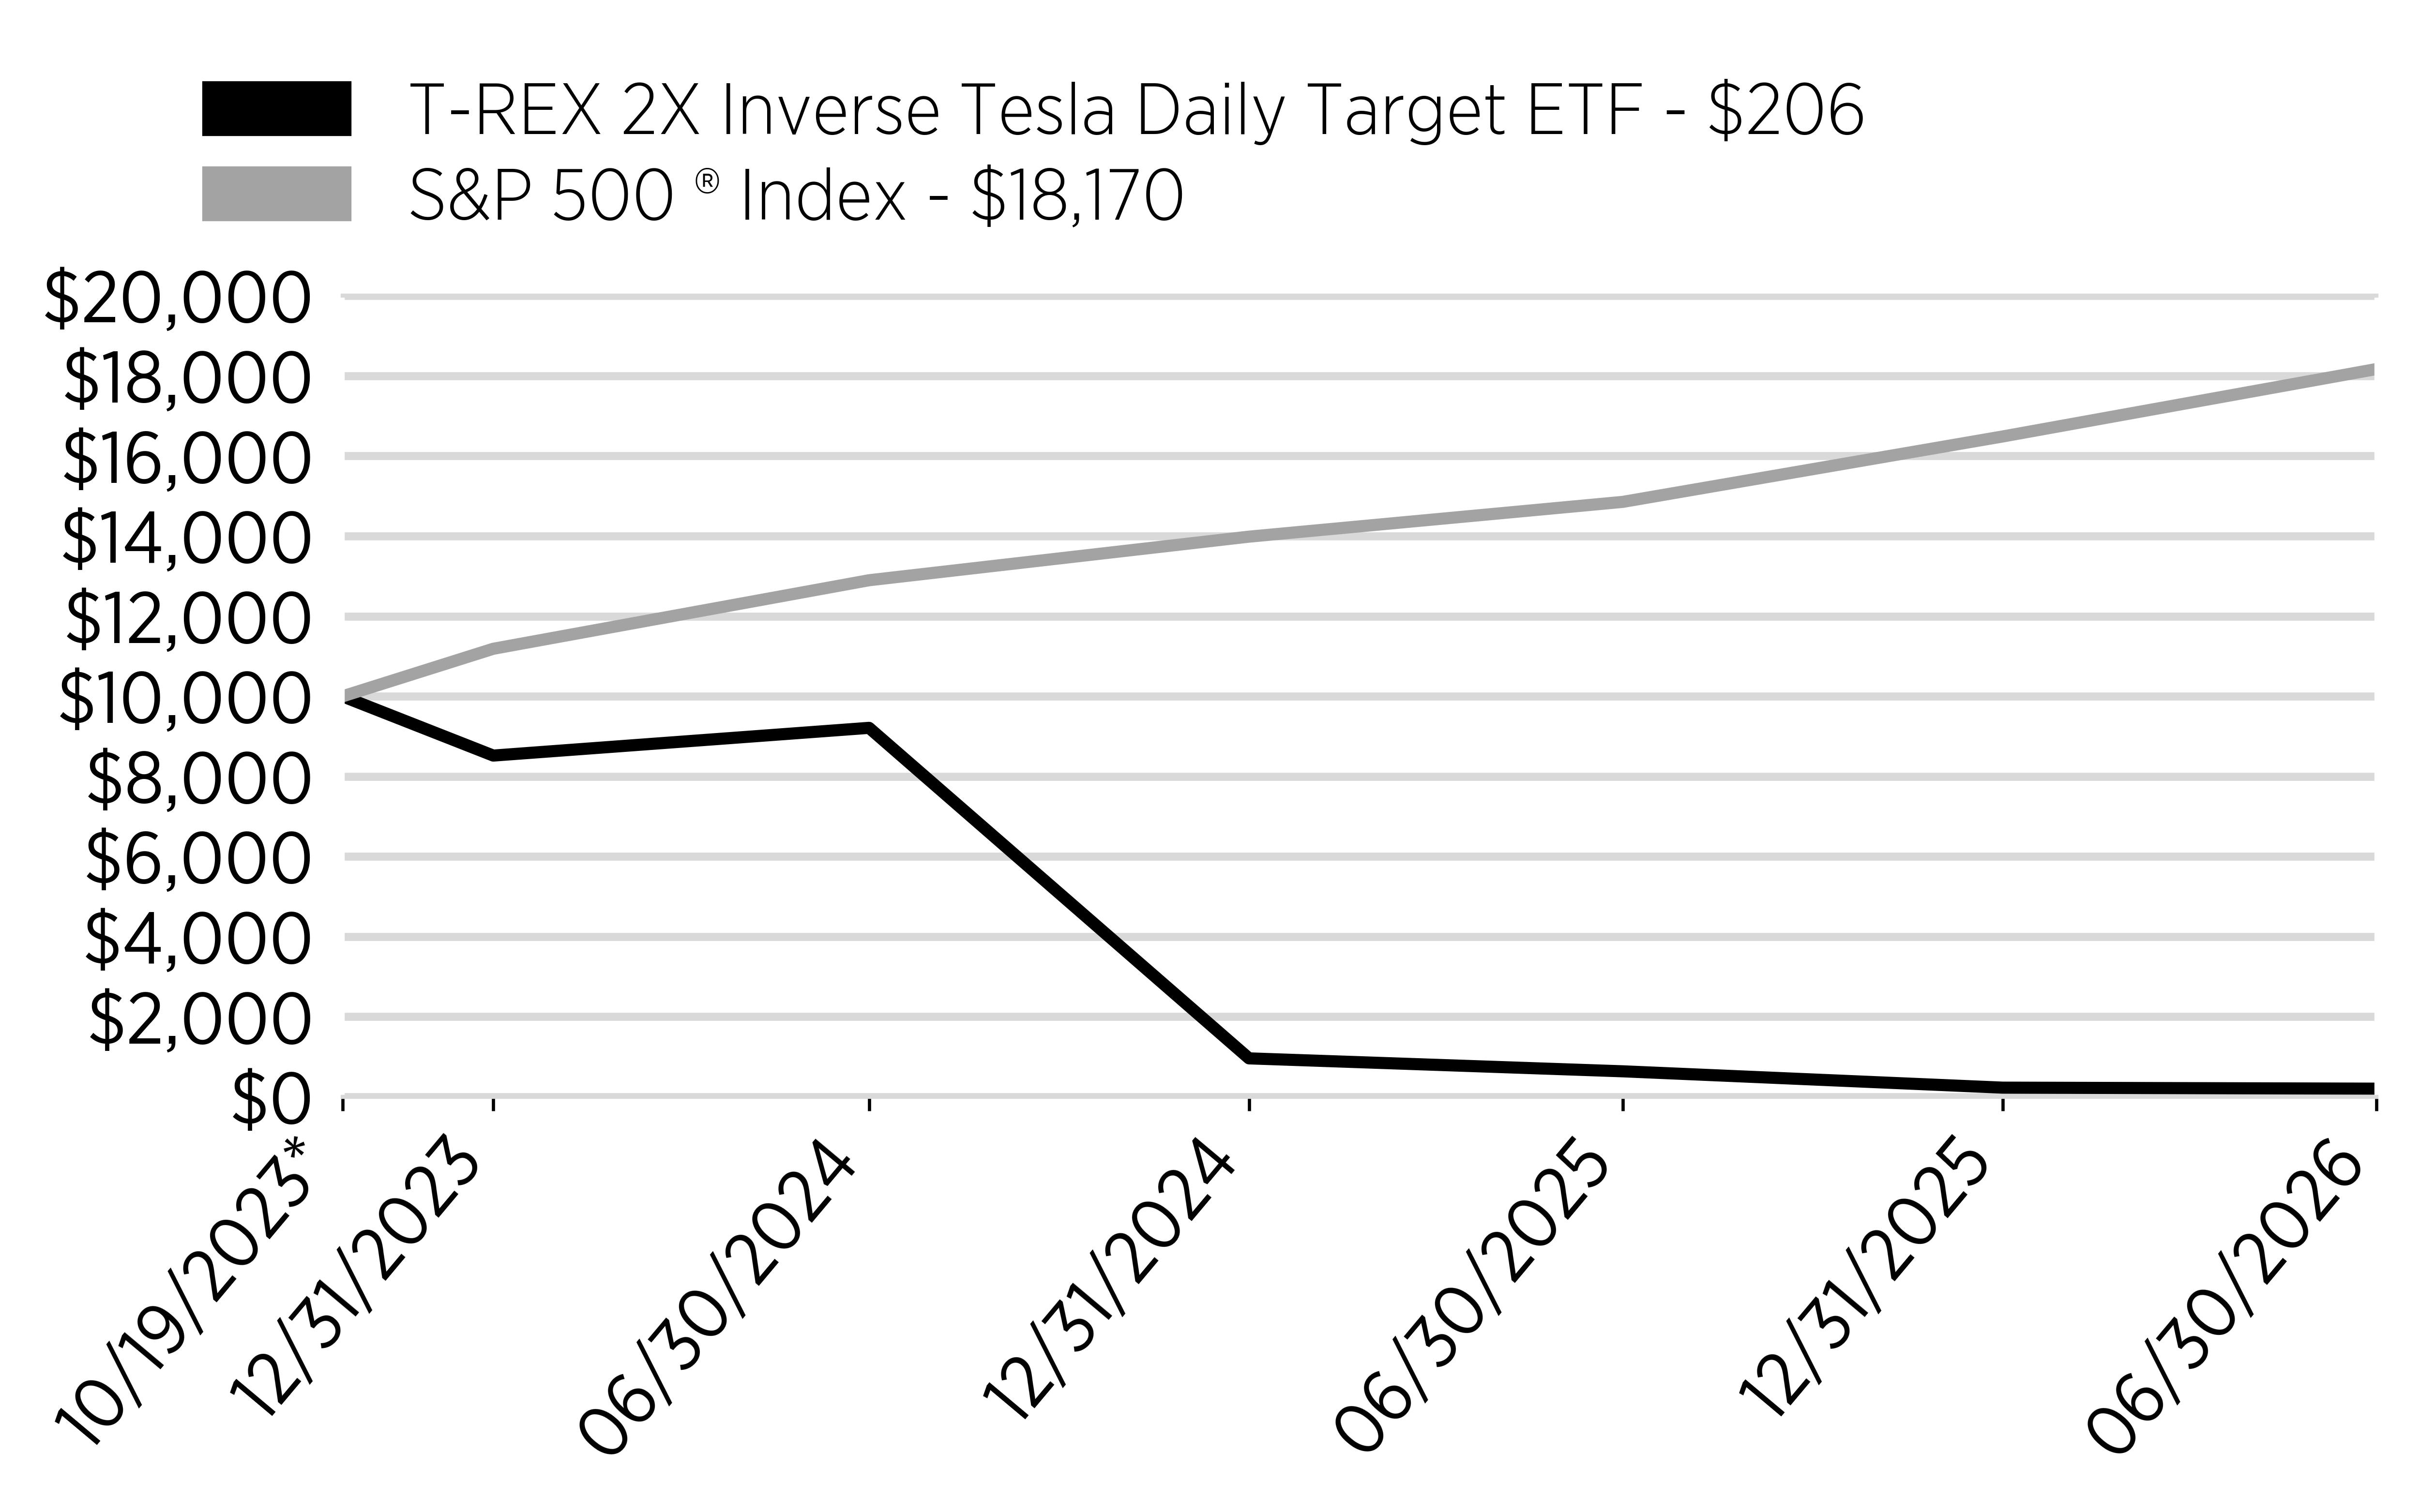
For the fiscal year ended June 30, 2026, TSLZ returned -67.74%, compared to a 32.41% return for TSLA and 22.32% for the S&P 500® Index.
Performance Drivers
TSLZ seeks the inverse of Tesla's daily performance at 2x leverage, and as such was adversely positioned throughout a period in which the stock trended materially higher. Tesla's upward trajectory — supported by autonomous driving milestones, improving delivery volumes, and renewed investor enthusiasm for long-term growth prospects — created persistent directional pressure against the Fund. The daily reset structure compounded this effect: as Tesla appreciated day over day, each successive reset established a smaller NAV base against which subsequent losses were applied, mathematically accelerating the decline. Tesla's elevated intraday and daily volatility — one of the highest among large-capitalization equities — further amplified the volatility drag. The combination of a rising underlying trend and pronounced price volatility produced cumulative losses over the fiscal year that reflect both the Fund's inverse objective and the inherent compounding dynamics of a daily reset structure over extended holding periods.
Cumulative Performance
(based on a hypothetical $10,000 investment)
| * | Inception |
Annual Performance
|
|
1 Year
|
Average Annual Total Return
Since Inception
|
|---|---|---|
|
T-REX 2X Inverse Tesla
Daily Target ETF
|
-67.74%
|
-76.30%
|
|
S&P 500 ® Index
|
22.32%
|
24.77%
|
Key Fund Statistics
(as of June 30, 2026 )
|
Fund Net Assets
|
$31,667,634
|
|
Number of Holdings
|
3
|
|
Total Net Advisory Fee
|
$716,919
|
|
Portfolio Turnover Rate
|
0.00%
|
Market Exposure
|
|
|
|
|
|
"Market Exposure" includes the values of total investments (including the contract value of any derivatives) and excludes any short-term investments.
|
Portfolio Composition
|
|
|---|---|
|
Cash
|
|
|
Derivatives
|
|
|
Other Assets, Net of Liabilities
|
Material Changes
Stock Split
On October 14, 2025, the Board of the Trust approved a reverse stock split for the Fund at a reverse split ratio of 1:20. The record date for the stock split was October 27, 2025, and the stock split was effectuated after the close of trading on October 28, 2025. Shares of the Fund began trading on a split-adjusted basis on October 29, 2025.
What were the Fund costs for the past year?
(based on a hypothetical $10,000 investment)
|
Fund Name
|
Costs of a $10,000 investment
|
Costs paid as a percentage of a $10,000 investment
|
|---|---|---|
|
T-REX 2X Long NVIDIA Daily Target ETF
|
$116
|
1.05%
|
Fund Objective
The T-REX 2x Long Nvidia Daily Target ETF (“NVDX” or the “Fund”) seeks daily investment results, before fees and expenses, of 200% of the daily performance of Nvidia common stock (“NVDA”).
Fund Performance
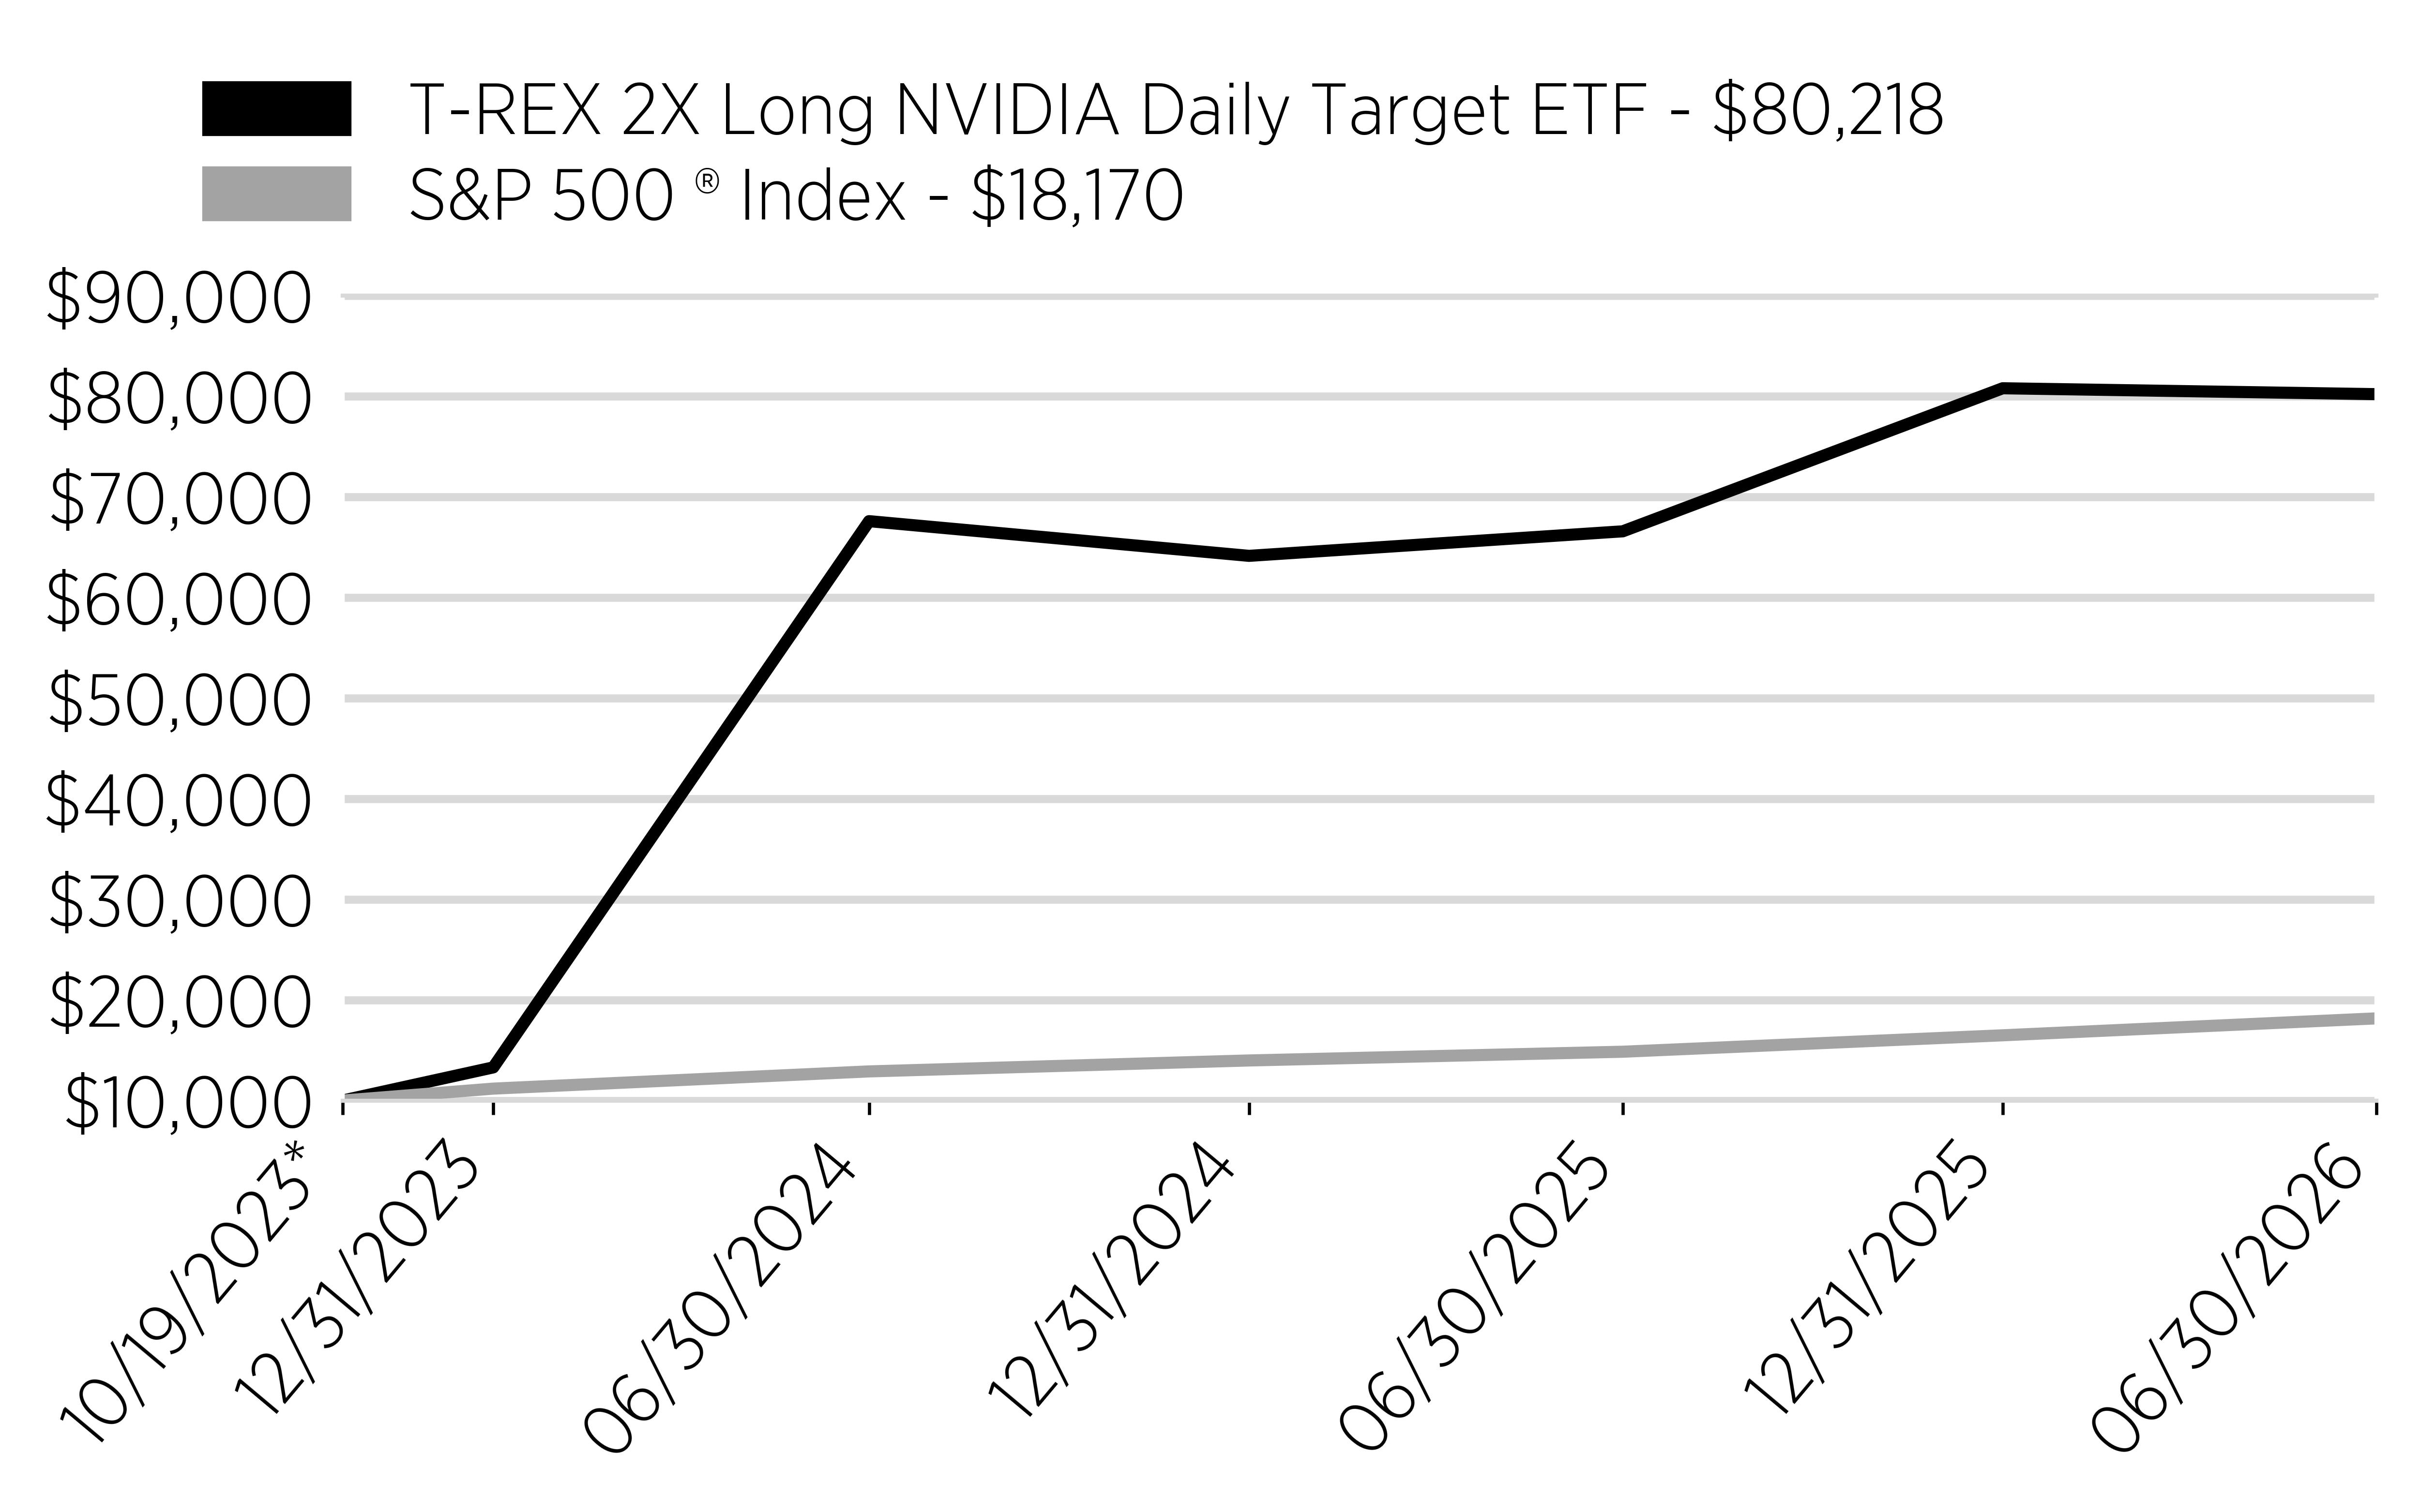
For the fiscal year ended June 30, 2026, NVDX returned 20.48%, compared to a 26.82% return for NVDA and 22.32% for the S&P 500® Index.
Performance Drivers
Despite Nvidia's strong full-year advance — underpinned by relentless demand for AI accelerators, favorable earnings results, and continued hyperscale investment — NVDX's cumulative return was substantially below twice the stock's annual gain. This outcome reflects the mathematical properties of the Fund's daily reset structure. When the underlying stock experiences significant day-to-day price fluctuations — as occurred around Nvidia earnings releases, AI-sector news events, and broader market dislocations — the compounding of daily returns over extended holding periods produces a cumulative result that can be lower than a static 2x leverage ratio would imply. The more volatile the path, the greater this drag can be. Nvidia's high-beta profile amplified the effect throughout the period, resulting in a meaningful gap between the leveraged daily return objective and the fund's realized cumulative return.
Cumulative Performance
(based on a hypothetical $10,000 investment)
| * | Inception |
Annual Performance
|
|
1 Year
|
Average Annual Total Return
Since Inception
|
|---|---|---|
|
T-REX 2X Long NVIDIA
Daily Target ETF
|
20.48%
|
116.43%
|
|
S&P 500 ® Index
|
22.32%
|
24.77%
|
Key Fund Statistics
(as of June 30, 2026 )
|
Fund Net Assets
|
$457,935,684
|
|
Number of Holdings
|
5
|
|
Total Net Advisory Fee
|
$6,117,027
|
|
Portfolio Turnover Rate
|
0.00%
|
Market Exposure
|
|
|
|
|
|
"Market Exposure" includes the values of total investments (including the contract value of any derivatives) and excludes any short-term investments.
|
Portfolio Composition
|
|
|---|---|
|
Cash
|
|
|
Derivatives
|
|
|
Other Assets, Net of Liabilities
|
What were the Fund costs for the past year?
(based on a hypothetical $10,000 investment)
|
Fund Name
|
Costs of a $10,000 investment
|
Costs paid as a percentage of a $10,000 investment
|
|---|---|---|
|
T-REX 2X Long Tesla Daily Target ETF
|
$117
|
1.05%
|
Fund Objective
The T-REX 2x Long Tesla Daily Target ETF (“TSLT” or the “Fund”) seeks daily investment results, before fees and expenses, of 200% of the daily performance of Tesla common stock ("TSLA").
Fund Performance
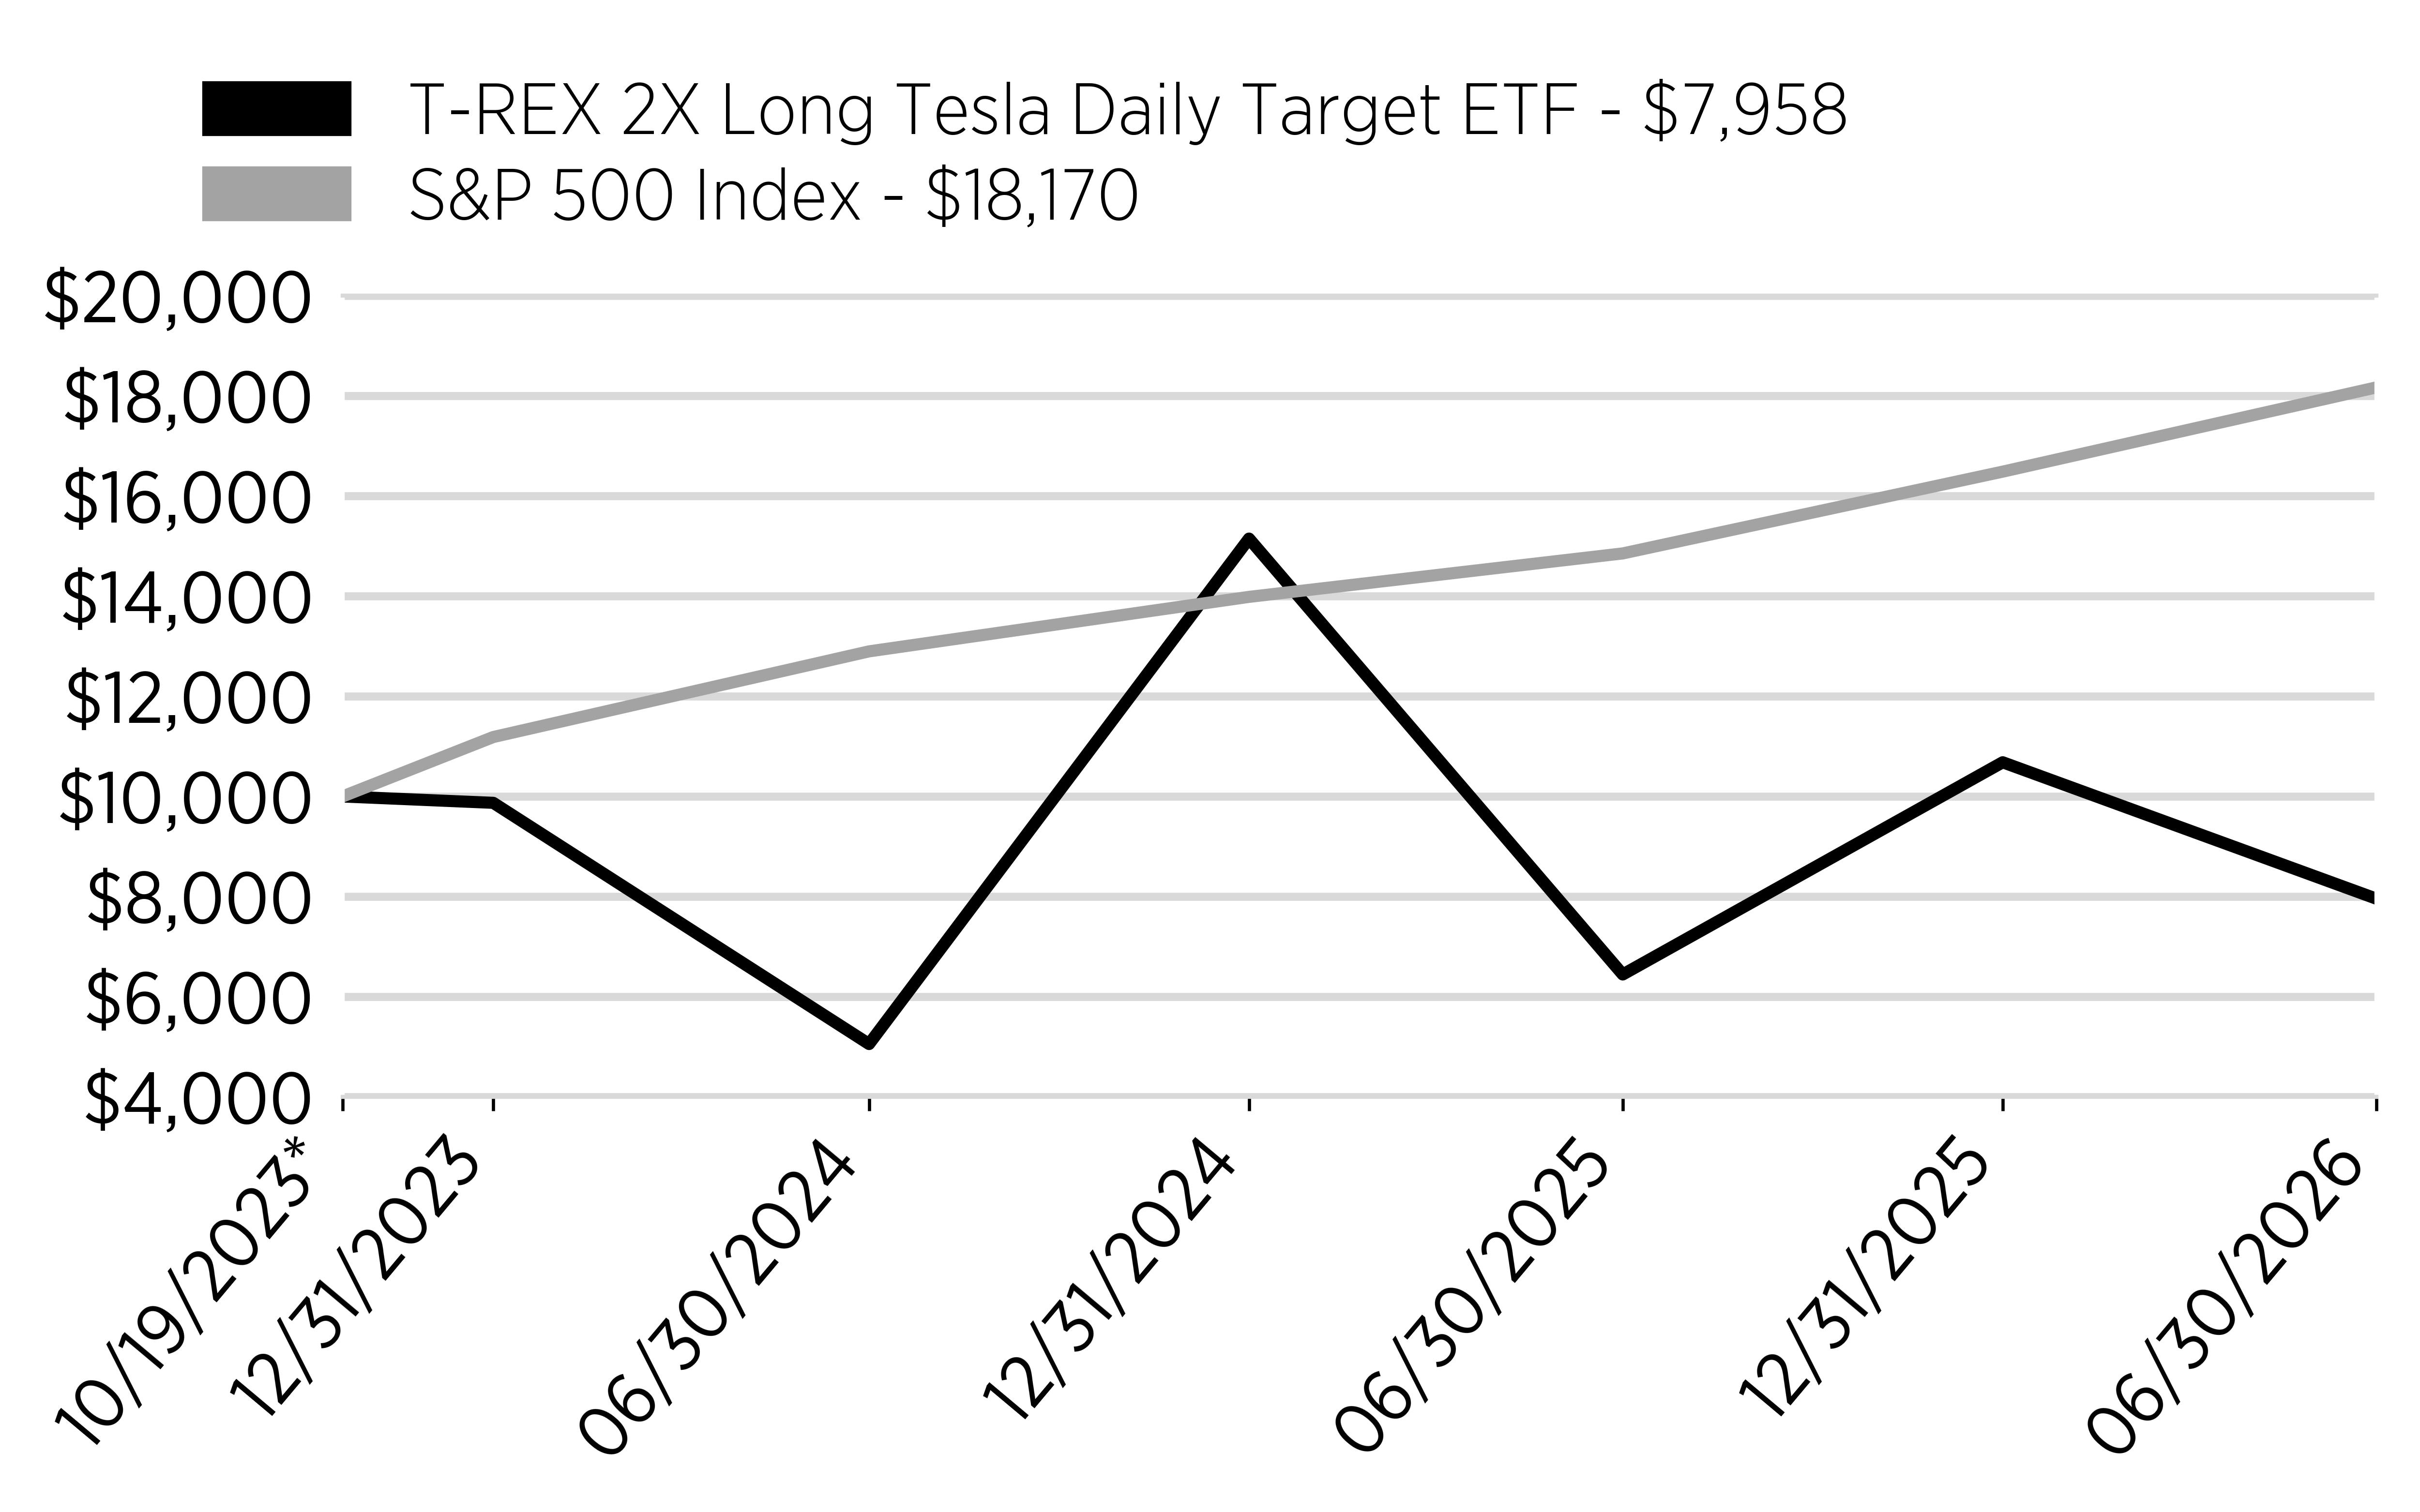
For the fiscal year ended June 30, 2026, TSLT returned 23.48%, compared to a 32.41% return for TSLA and 22.32% for the S&P 500® Index.
Performance Drivers
Tesla delivered a meaningful positive return over the fiscal year as investors responded constructively to the company's progress across multiple growth vectors — including advances in fully autonomous driving, commercial development of the Optimus robotics platform, accelerating energy storage deployments, and improving profitability metrics. However, the stock's characteristically wide intra-period price swings — at times driven by delivery data, regulatory developments, management commentary, and shifting competitive dynamics — reduced the benefit of the Fund's daily leveraged exposure on a cumulative basis. As with all daily reset leveraged funds, periods of sharp two-way volatility can erode the compounding advantage that would otherwise accompany a sustained directional trend, which resulted in a cumulative return that fell meaningfully short of twice Tesla's annual gain.
Cumulative Performance
(based on a hypothetical $10,000 investment)
| * | Inception |
Annual Performance
|
|
1 Year
|
Average Annual Total Return
Since Inception
|
|---|---|---|
|
T-REX 2X Long Tesla
Daily Target ETF
|
23.48%
|
-8.12%
|
|
S&P 500 ® Index
|
22.32%
|
24.77%
|
Key Fund Statistics
(as of June 30, 2026 )
|
Fund Net Assets
|
$253,266,596
|
|
Number of Holdings
|
5
|
|
Total Net Advisory Fee
|
$3,573,584
|
|
Portfolio Turnover Rate
|
102,990%
|
Market Exposure
|
|
|
|
|
|
"Market Exposure" includes the values of total investments (including the contract value of any derivatives) and excludes any short-term investments.
|
Portfolio Composition
|
|
|---|---|
|
Cash
|
|
|
Derivatives
|
|
|
Other Assets, Net of Liabilities
|