LSB Industries, Inc. September 2026 Investor Presentation Exhibit 99.1
Statements in this presentation that are not historical or factual are forward-looking statements within the meaning of Section 27A of the Securities Act of 1933, as amended, and Section 21E of the Securities Exchange Act of 1934, as amended, including the safe harbor provisions of the U.S. Private Securities Litigation Reform Act of 1995. These forward-looking statements, which are subject to known and unknown risks, uncertainties and assumptions about us, include, but are not limited to, statements regarding: our business strategy; anticipated future operating results and operating expenses, cash flows, capital resources and liquidity; management’s estimates of future EBITDA run-rate opportunities and incremental earnings potential; trends, opportunities and risks affecting our business, industry and financial results; our ability to successfully leverage our existing business platform and portfolio of assets to produce low carbon products; the timing for completion of the carbon capture and sequestration (“CCS”) project at our El Dorado facility, including receipt of Class VI permit approval by the U.S. Environmental Protection Agency (“EPA”); the cost and expected benefits of the CCS project, including the expected qualification for and realization of federal tax credits under Internal Revenue Code Section 45Q; our ability to produce and market low-carbon ammonia at premium prices; the impact of trade policy on our business; the availability of raw materials; production volumes at our production facilities; our expectations regarding improvements in plant reliability, onstream rates and downstream product mix optimization; the outlook for nitrogen fertilizer and industrial product markets; and the anticipated cost and timing of our capital projects, including turnarounds and debottlenecking initiatives. Forward-looking statements can generally be identified by words or phrases such as “anticipate,” “believe,” “could,” “estimate,” “expect,” “forecast,” “intend,” “may,” “opportunity,” “plan,” “potential,” “project,” “should,” “target,” “will,” “would,” and similar words or phrases, as well as by discussions of strategy, plans or intentions. These statements are only predictions based on our current expectations and projections about future events. There are important factors that could cause our actual results, level of activity, performance or actual achievements to differ materially from the results, level of activity, performance or anticipated achievements expressed or implied by the forward-looking statements. Significant risks and uncertainties relate to, but are not limited to, business and market disruptions; market conditions and price volatility for our products and feedstocks; global and regional economic downturns that adversely affect the demand for our end-use products; disruptions in production at our manufacturing facilities; increased competitive pressures; our ability to fund the working capital and expansion of our businesses; our substantial existing indebtedness; recruiting and retaining skilled and qualified personnel; our ability to obtain necessary raw materials and purchased components; material increases in cost of raw materials; obtaining and maintaining necessary permits, including the Class VI permit by the EPA; and other financial, economic, competitive, environmental, political, legal and regulatory factors, including tariffs. These and other risk factors are discussed in the Company’s filings with the Securities and Exchange Commission, including but not limited to our most recent Annual Report on Form 10-K and Quarterly Reports on Form 10-Q. This presentation should be read in conjunction with those filings, which are available at www.sec.gov. Moreover, we operate in a very competitive and rapidly changing environment. New risks and uncertainties emerge from time to time, and it is not possible for our management to predict all risks and uncertainties, nor can management assess the impact of all factors on our business or the extent to which any factor, or combination of factors, may cause actual results to differ materially from those contained in any forward-looking statements. Although we believe the expectations reflected in the forward-looking statements are reasonable, we cannot guarantee future results, level of activity, performance or achievements. Neither we nor any other person assumes responsibility for the accuracy or completeness of any of these forward-looking statements. You should not rely upon forward-looking statements as predictions of future events. Unless otherwise required by applicable laws, we undertake no obligation to update or revise any forward-looking statements, whether because of new information or future developments. Non-GAAP Measures: This presentation contains non-GAAP financial measures, including EBITDA and Adjusted EBITDA. Reconciliations of these non-GAAP measures to the most directly comparable GAAP measures are provided in the appendix to this presentation. Estimated future incremental EBITDA amounts presented herein represent management’s estimates and do not represent expected EBITDA contribution in any specific fiscal year; actual results will depend on timing, execution, market conditions and other factors. Forward-Looking Statements
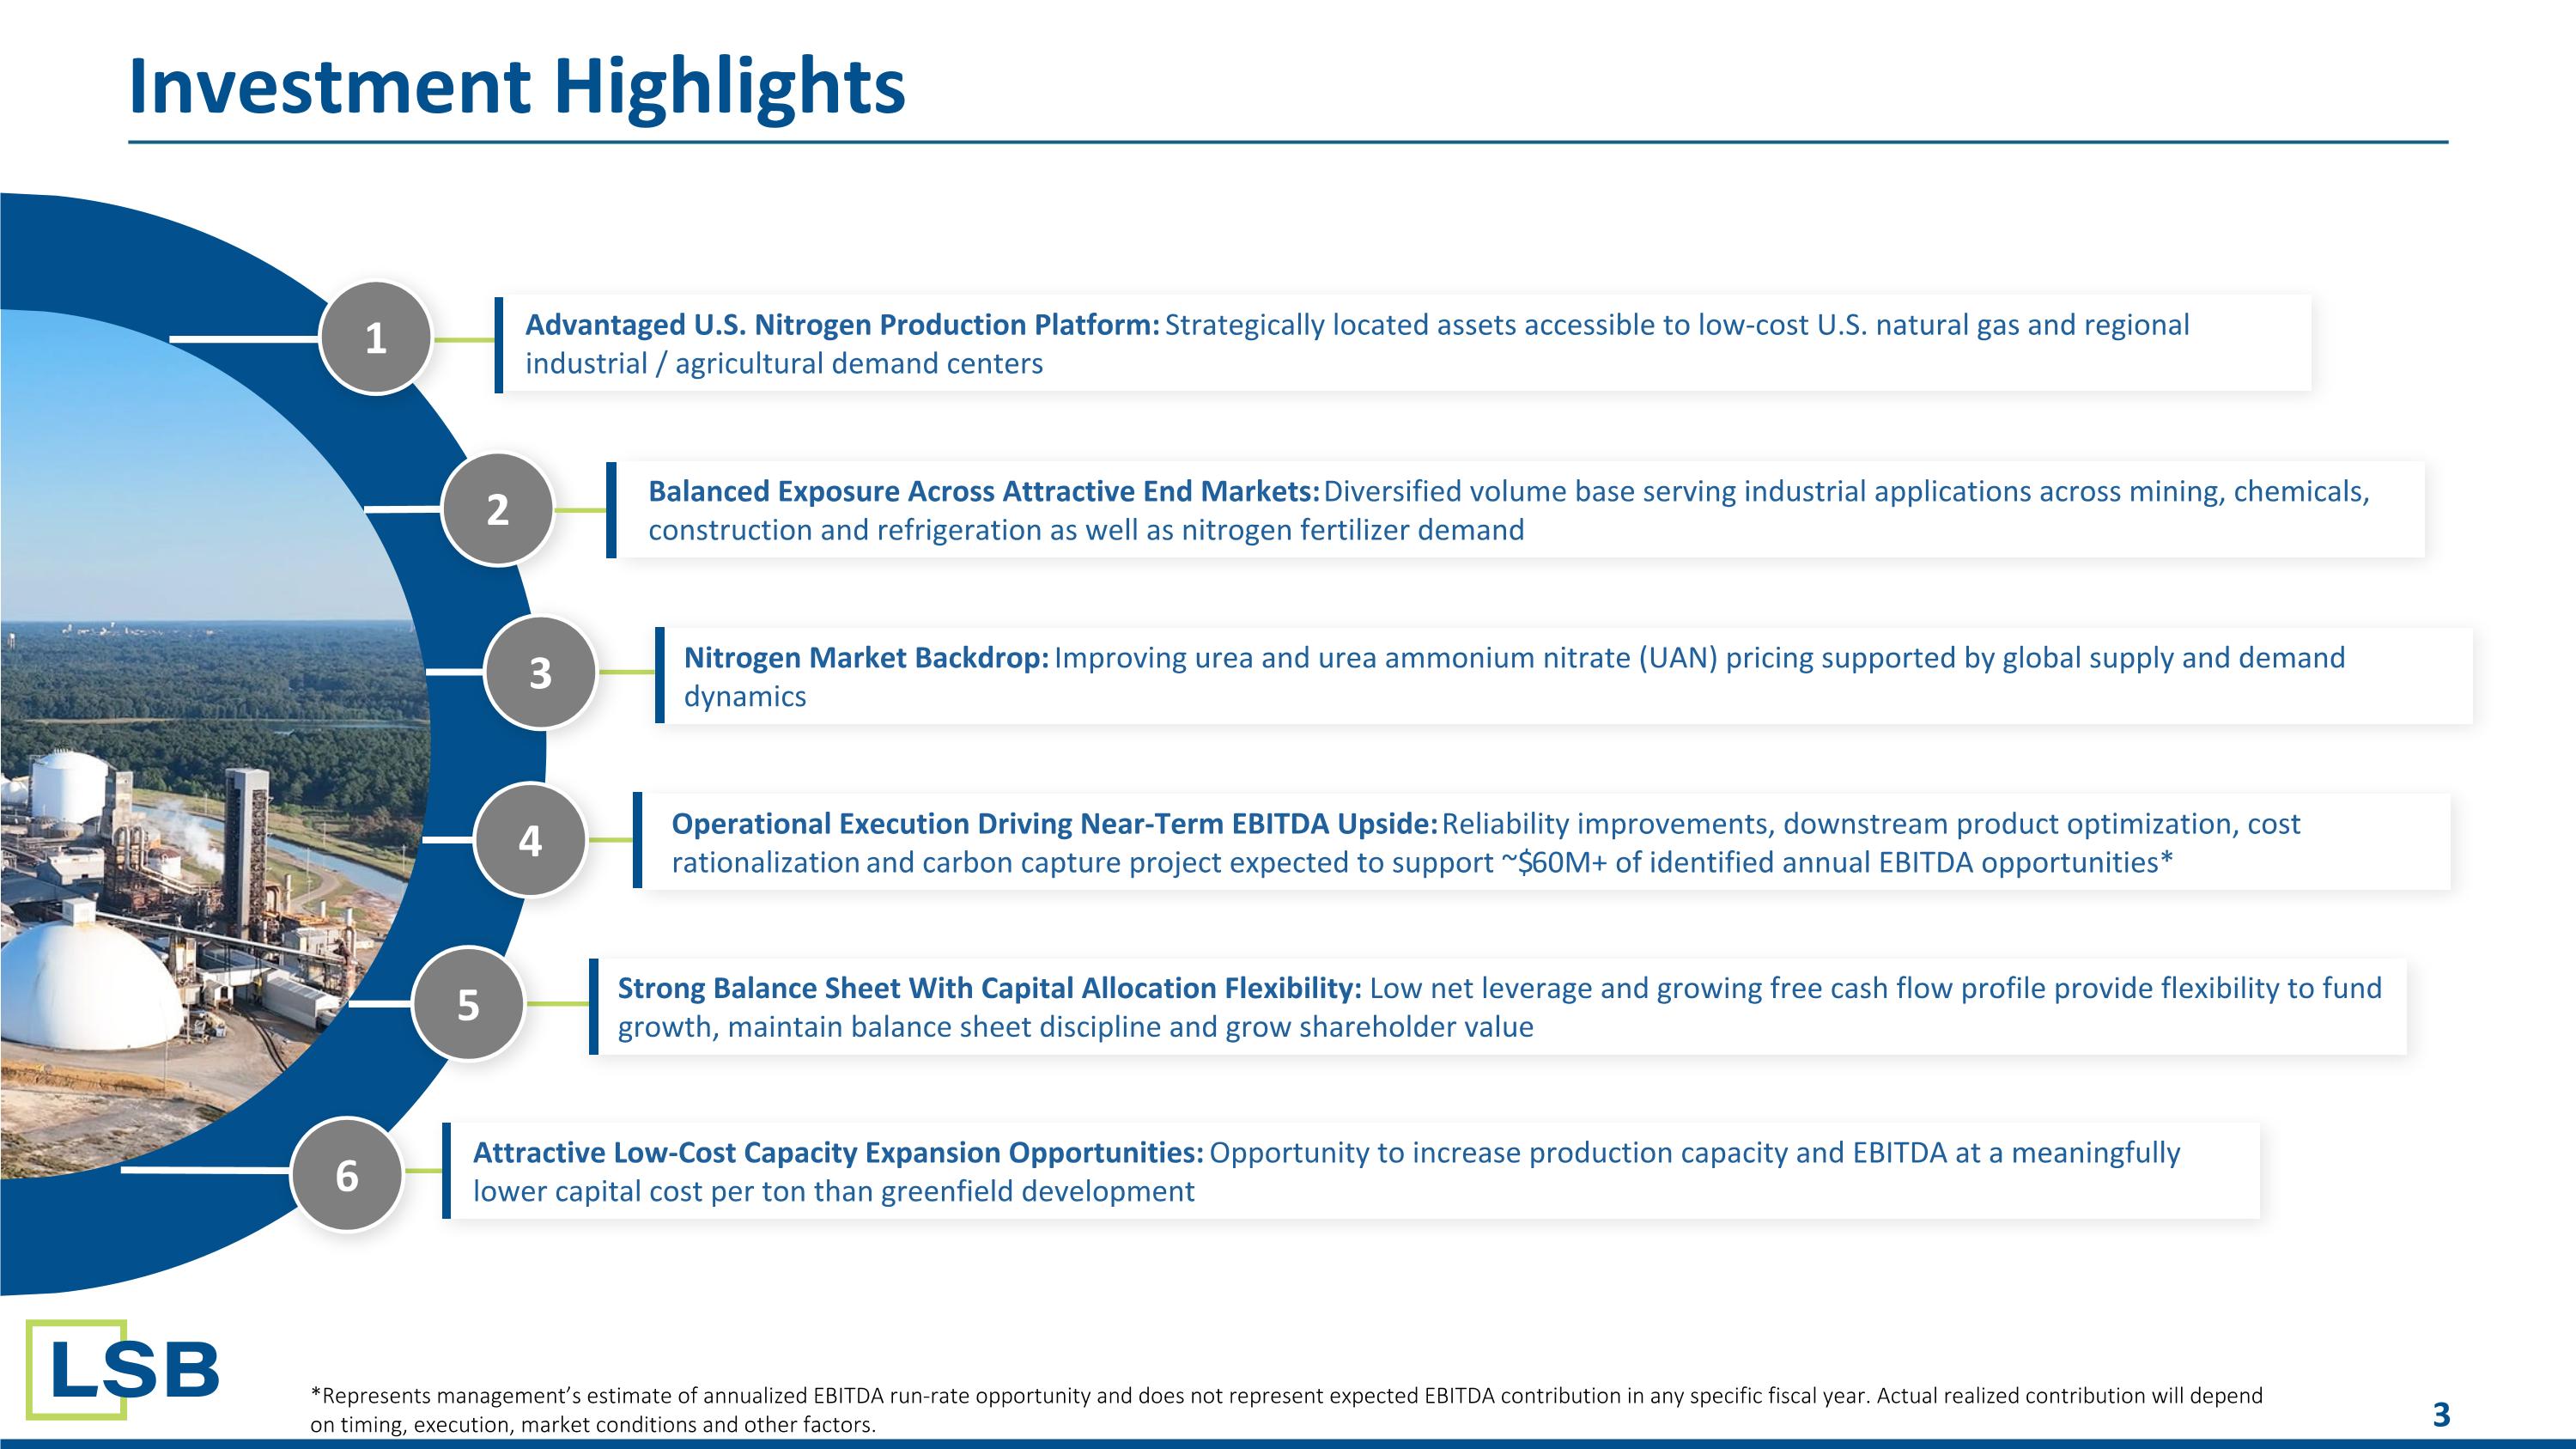
Investment Highlights 2 3 4 5 Advantaged U.S. Nitrogen Production Platform: Strategically located assets accessible to low-cost U.S. natural gas and regional industrial / agricultural demand centers Nitrogen Market Backdrop: Improving urea and urea ammonium nitrate (UAN) pricing supported by global supply and demand dynamics Operational Execution Driving Near-Term EBITDA Upside: Reliability improvements, downstream product optimization, cost rationalization and carbon capture project expected to support ~$60M+ of identified annual EBITDA opportunities* Strong Balance Sheet With Capital Allocation Flexibility: Low net leverage and growing free cash flow profile provide flexibility to fund growth, maintain balance sheet discipline and grow shareholder value 1 Balanced Exposure Across Attractive End Markets: Diversified volume base serving industrial applications across mining, chemicals, construction and refrigeration as well as nitrogen fertilizer demand *Represents management’s estimate of annualized EBITDA run-rate opportunity and does not represent expected EBITDA contribution in any specific fiscal year. Actual realized contribution will depend on timing, execution, market conditions and other factors. 6 Attractive Low-Cost Capacity Expansion Opportunities: Opportunity to increase production capacity and EBITDA at a meaningfully lower capital cost per ton than greenfield development
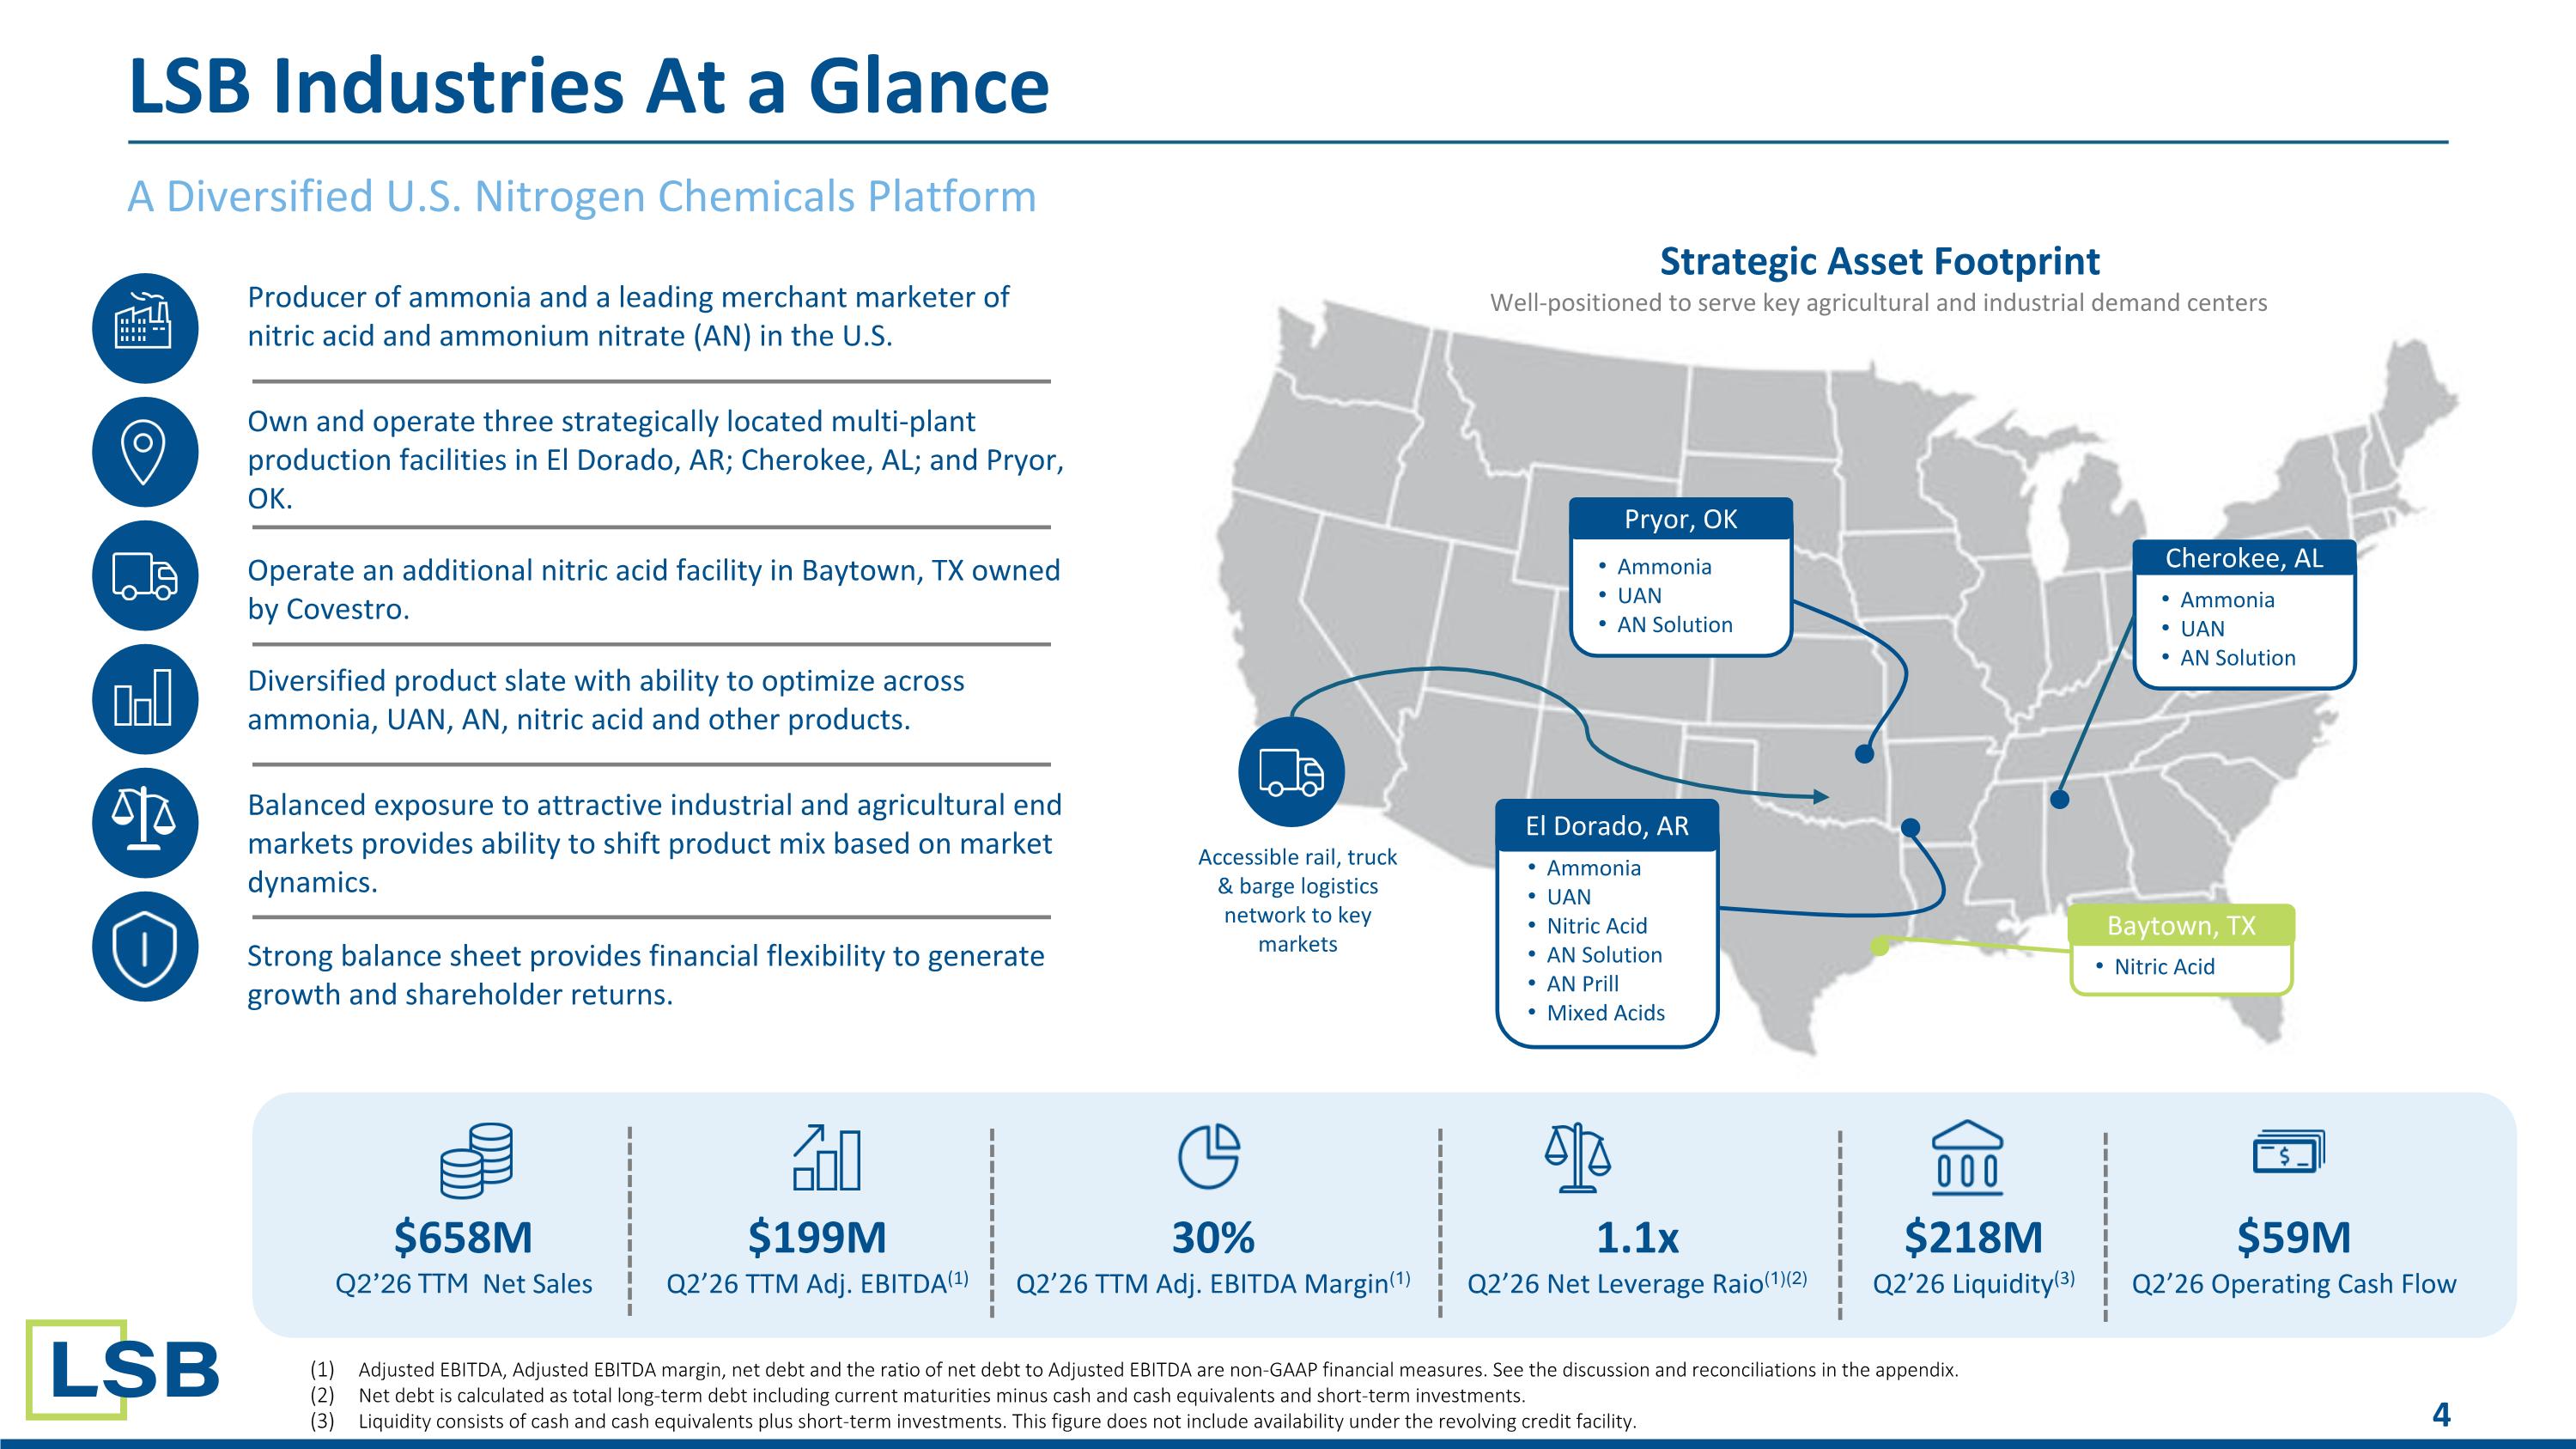
LSB Industries At a Glance A Diversified U.S. Nitrogen Chemicals Platform Producer of ammonia and a leading merchant marketer of nitric acid and ammonium nitrate (AN) in the U.S. Own and operate three strategically located multi-plant production facilities in El Dorado, AR; Cherokee, AL; and Pryor, OK. Operate an additional nitric acid facility in Baytown, TX owned by Covestro. Diversified product slate with ability to optimize across ammonia, UAN, AN, nitric acid and other products. Balanced exposure to attractive industrial and agricultural end markets provides ability to shift product mix based on market dynamics. Strong balance sheet provides financial flexibility to generate growth and shareholder returns. $658M Q2’26 TTM Net Sales $199M Q2’26 TTM Adj. EBITDA(1) 30% Q2’26 TTM Adj. EBITDA Margin(1) 1.1x Q2’26 Net Leverage Raio(1)(2) $218M Q2’26 Liquidity(3) $59M Q2’26 Operating Cash Flow Strategic Asset Footprint Well-positioned to serve key agricultural and industrial demand centers Ammonia UAN Nitric Acid AN Solution AN Prill Mixed Acids El Dorado, AR Ammonia UAN AN Solution Pryor, OK Ammonia UAN AN Solution Cherokee, AL Nitric Acid Baytown, TX Accessible rail, truck & barge logistics network to key markets Adjusted EBITDA, Adjusted EBITDA margin, net debt and the ratio of net debt to Adjusted EBITDA are non-GAAP financial measures. See the discussion and reconciliations in the appendix. Net debt is calculated as total long-term debt including current maturities minus cash and cash equivalents and short-term investments. Liquidity consists of cash and cash equivalents plus short-term investments. This figure does not include availability under the revolving credit facility.
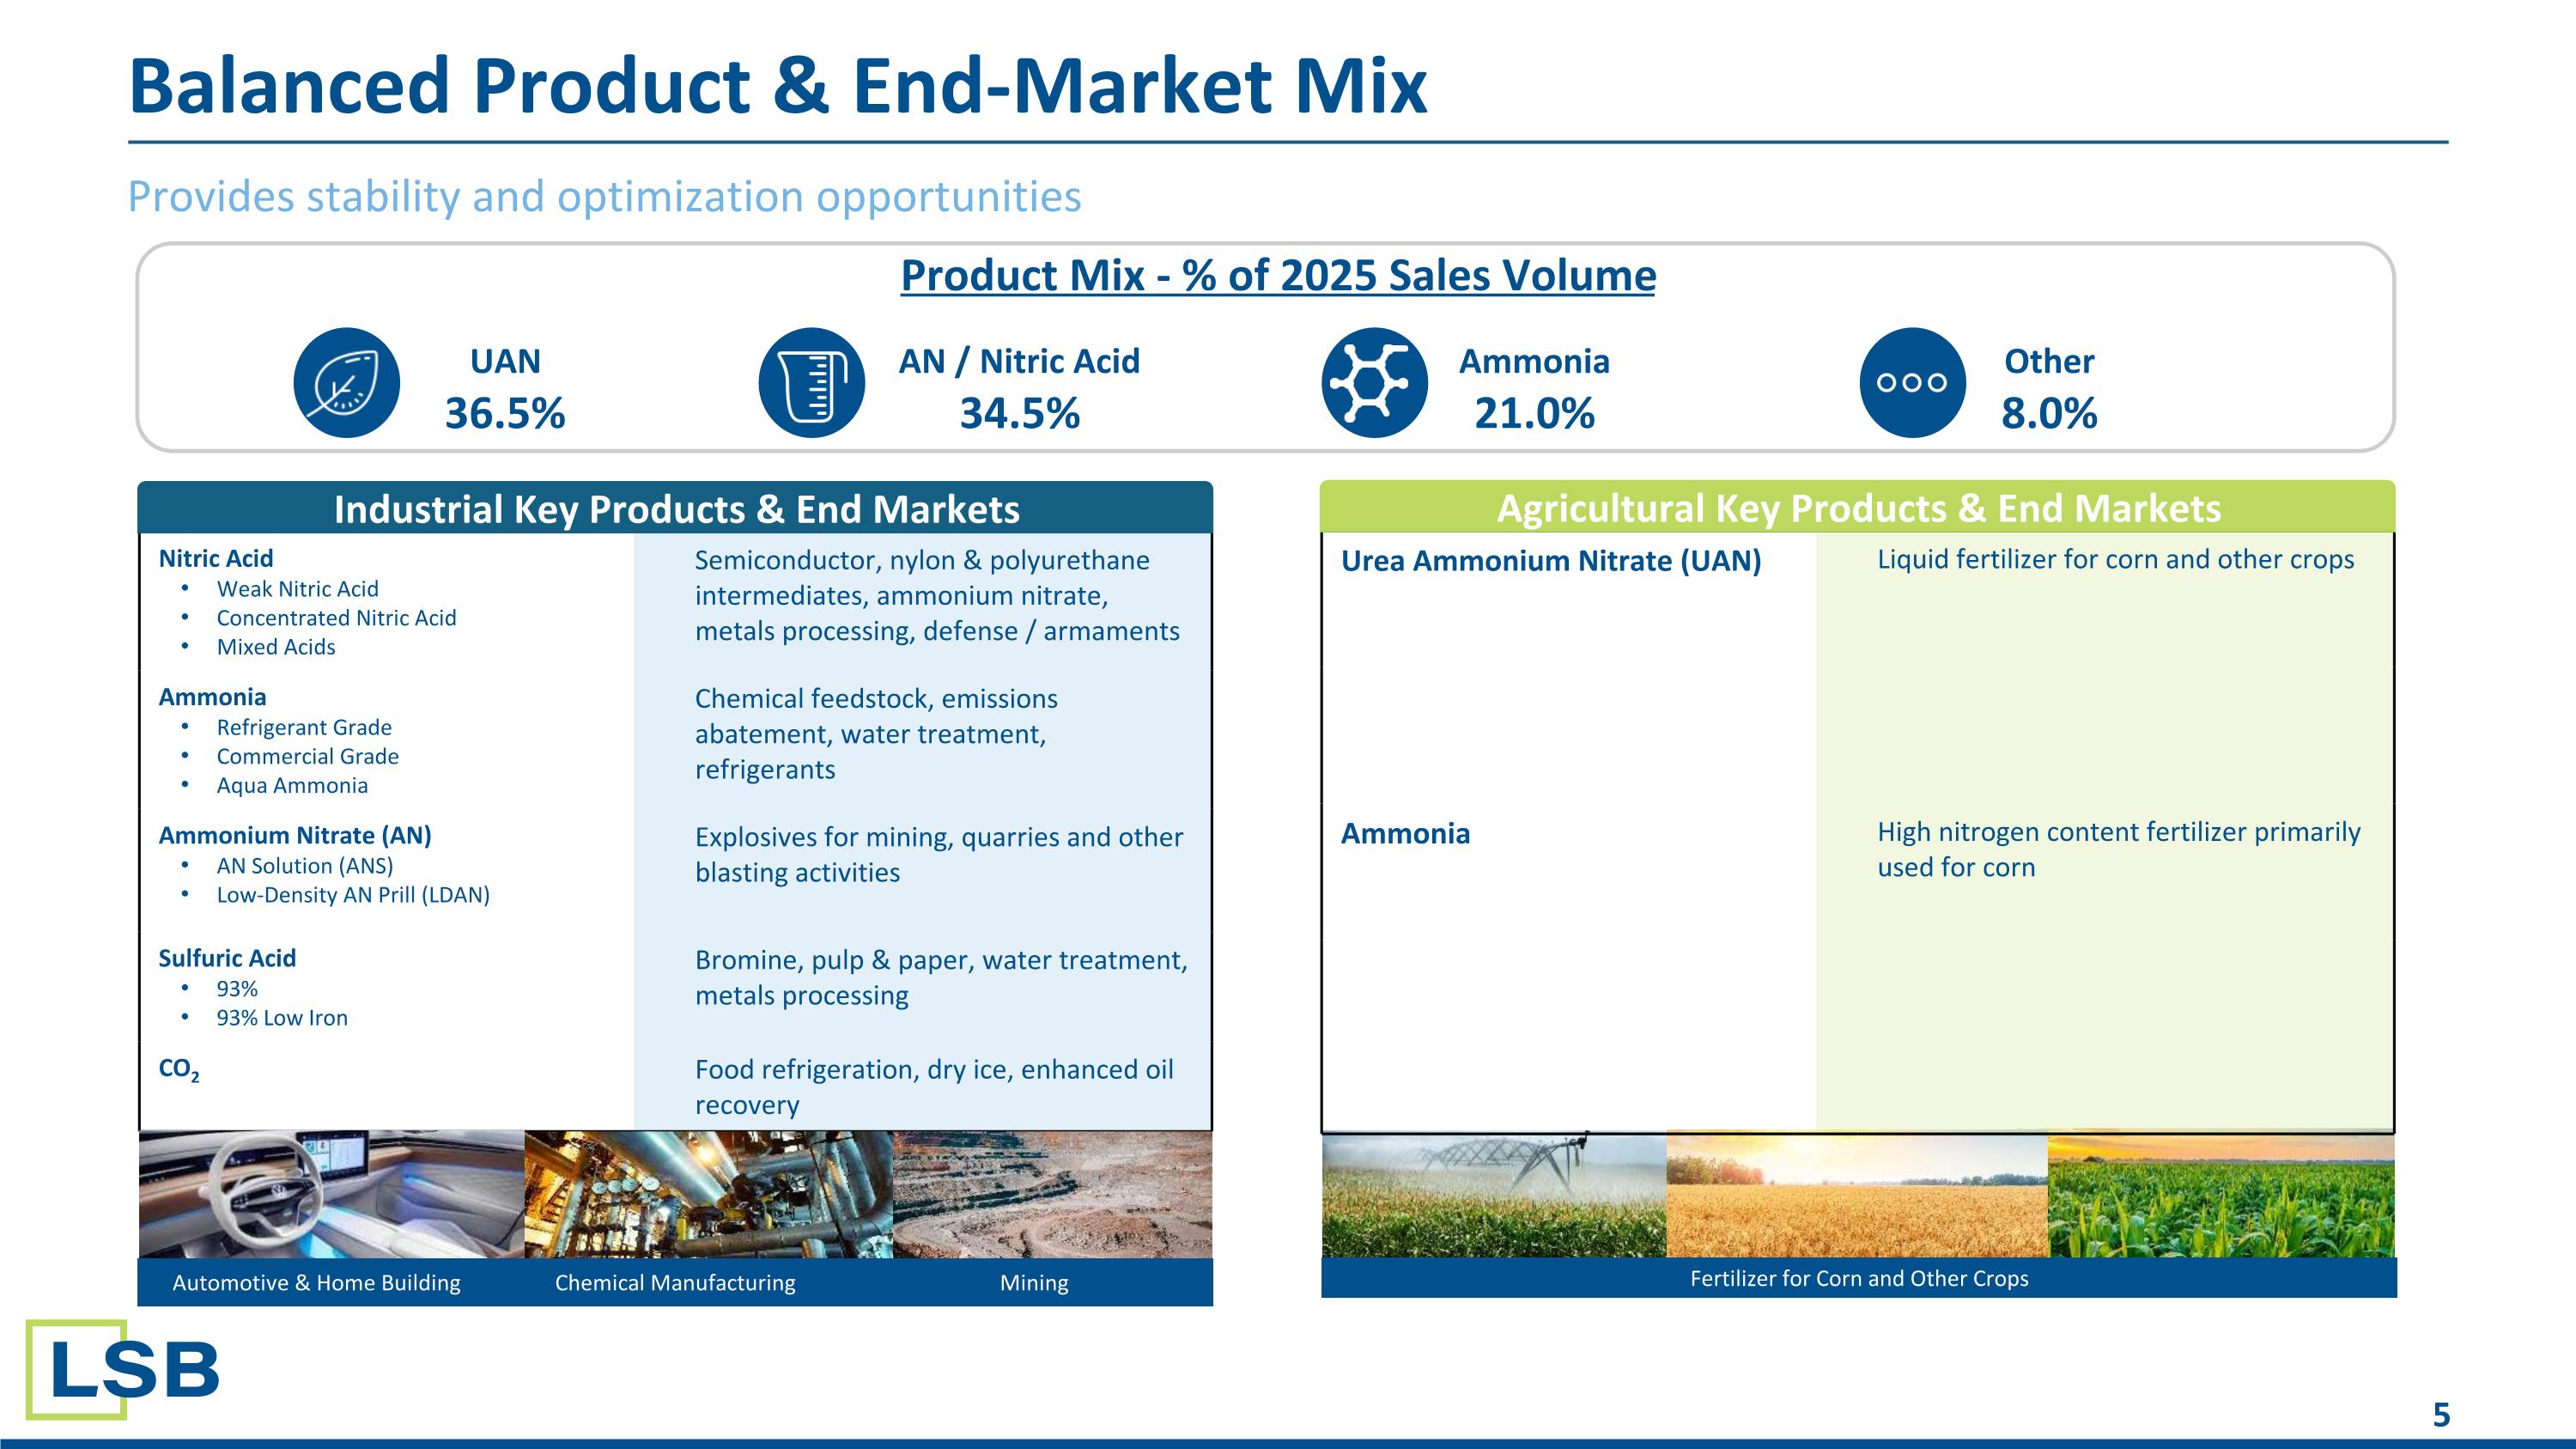
Balanced Product & End-Market Mix Provides stability and optimization opportunities Nitric Acid Weak Nitric Acid Concentrated Nitric Acid Mixed Acids Semiconductor, nylon & polyurethane intermediates, ammonium nitrate, metals processing, defense / armaments Ammonia Refrigerant Grade Commercial Grade Aqua Ammonia Chemical feedstock, emissions abatement, water treatment, refrigerants Ammonium Nitrate (AN) AN Solution (ANS) Low-Density AN Prill (LDAN) Explosives for mining, quarries and other blasting activities Sulfuric Acid 93% 93% Low Iron Bromine, pulp & paper, water treatment, metals processing CO2 Food refrigeration, dry ice, enhanced oil recovery Fertilizer for Corn and Other Crops Industrial Key Products & End Markets Urea Ammonium Nitrate (UAN) Liquid fertilizer for corn and other crops Ammonia High nitrogen content fertilizer primarily used for corn Agricultural Key Products & End Markets Automotive & Home Building Chemical Manufacturing Mining UAN 36.5% AN / Nitric Acid 34.5% Ammonia 21.0% Other 8.0% Product Mix - % of 2025 Sales Volume
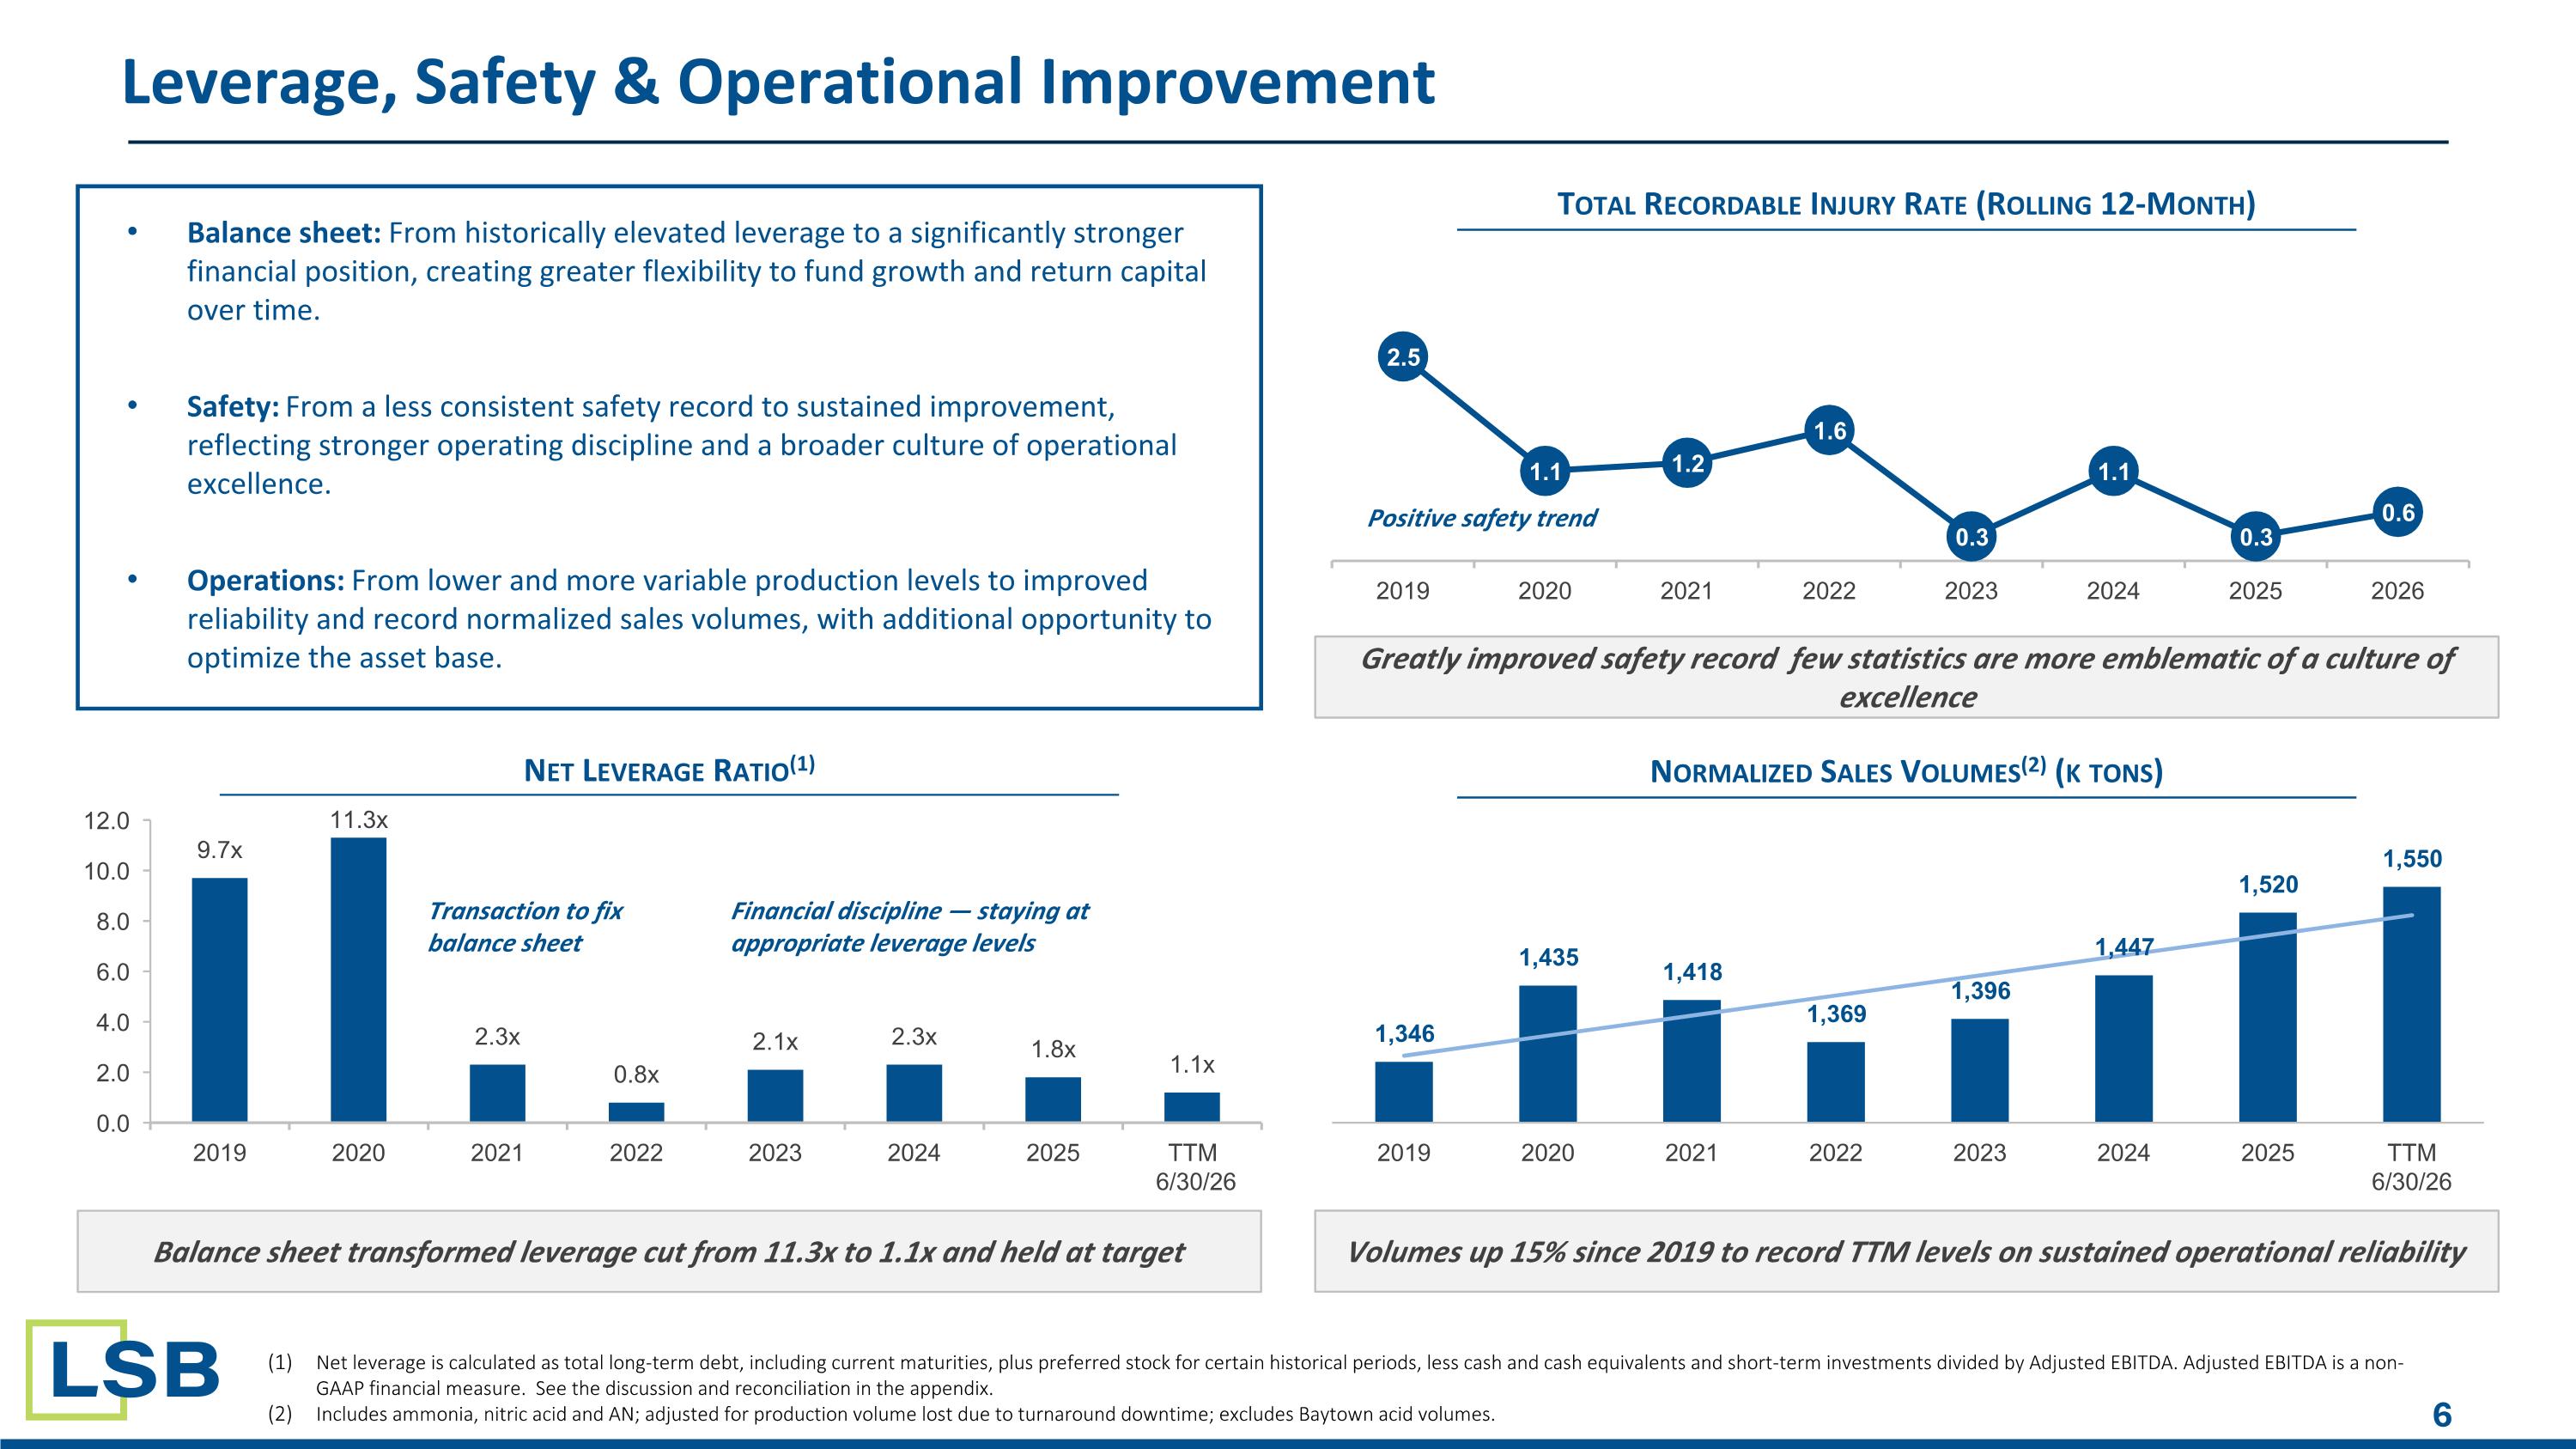
Leverage, Safety & Operational Improvement Net Leverage Ratio(1) Balance sheet transformed leverage cut from 11.3x to 1.1x and held at target Total Recordable Injury Rate (Rolling 12-Month) Greatly improved safety record few statistics are more emblematic of a culture of excellence Normalized Sales Volumes(2) (k tons) Volumes up 15% since 2019 to record TTM levels on sustained operational reliability Transaction to fix
balance sheet Financial discipline — staying at
appropriate leverage levels Positive safety trend Net leverage is calculated as total long-term debt, including current maturities, plus preferred stock for certain historical periods, less cash and cash equivalents and short-term investments divided by Adjusted EBITDA. Adjusted EBITDA is a non-GAAP financial measure. See the discussion and reconciliation in the appendix. Includes ammonia, nitric acid and AN; adjusted for production volume lost due to turnaround downtime; excludes Baytown acid volumes. Balance sheet: From historically elevated leverage to a significantly stronger financial position, creating greater flexibility to fund growth and return capital over time. Safety: From a less consistent safety record to sustained improvement, reflecting stronger operating discipline and a broader culture of operational excellence. Operations: From lower and more variable production levels to improved reliability and record normalized sales volumes, with additional opportunity to optimize the asset base.
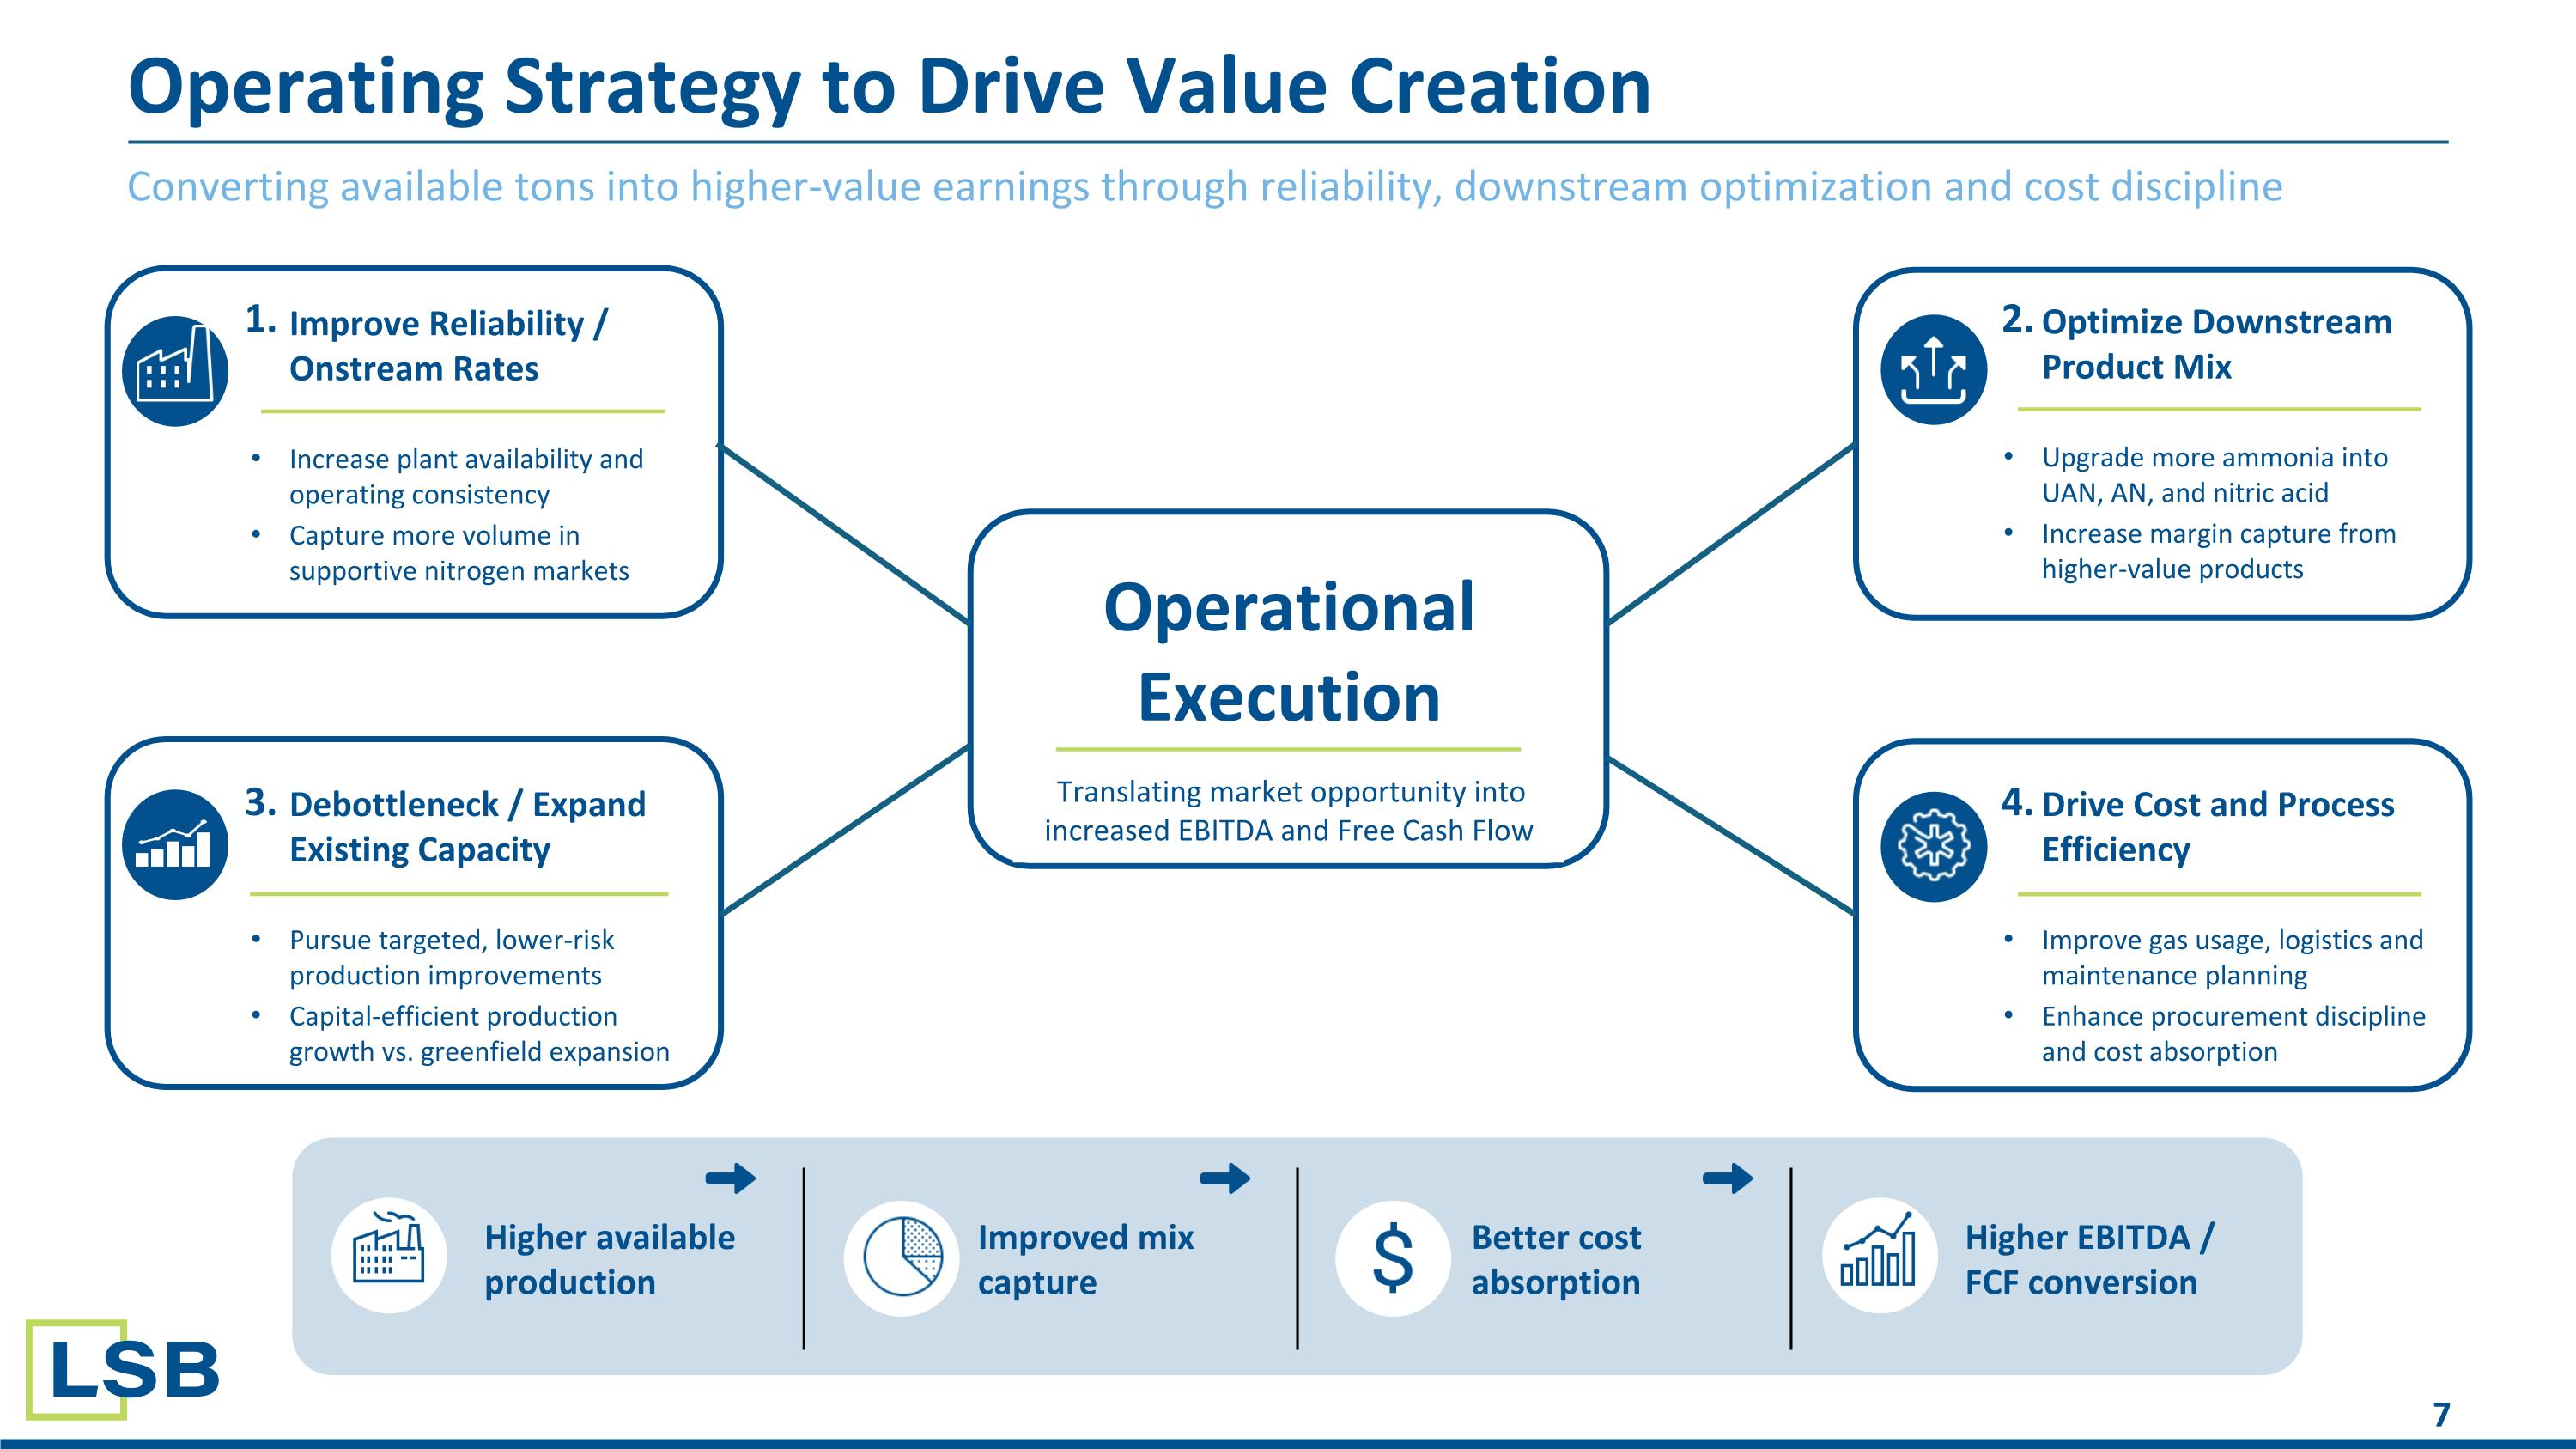
Converting available tons into higher-value earnings through reliability, downstream optimization and cost discipline Operating Strategy to Drive Value Creation Operational Execution Translating market opportunity into increased EBITDA and Free Cash Flow Improve Reliability / Onstream Rates Increase plant availability and operating consistency Capture more volume in supportive nitrogen markets Optimize Downstream Product Mix Upgrade more ammonia into UAN, AN, and nitric acid Increase margin capture from higher-value products Drive Cost and Process Efficiency Improve gas usage, logistics and maintenance planning Enhance procurement discipline and cost absorption Debottleneck / Expand Existing Capacity Pursue targeted, lower-risk production improvements Capital-efficient production growth vs. greenfield expansion 1. 2. 3. 4. Higher available production Improved mix capture Better cost absorption Higher EBITDA / FCF conversion
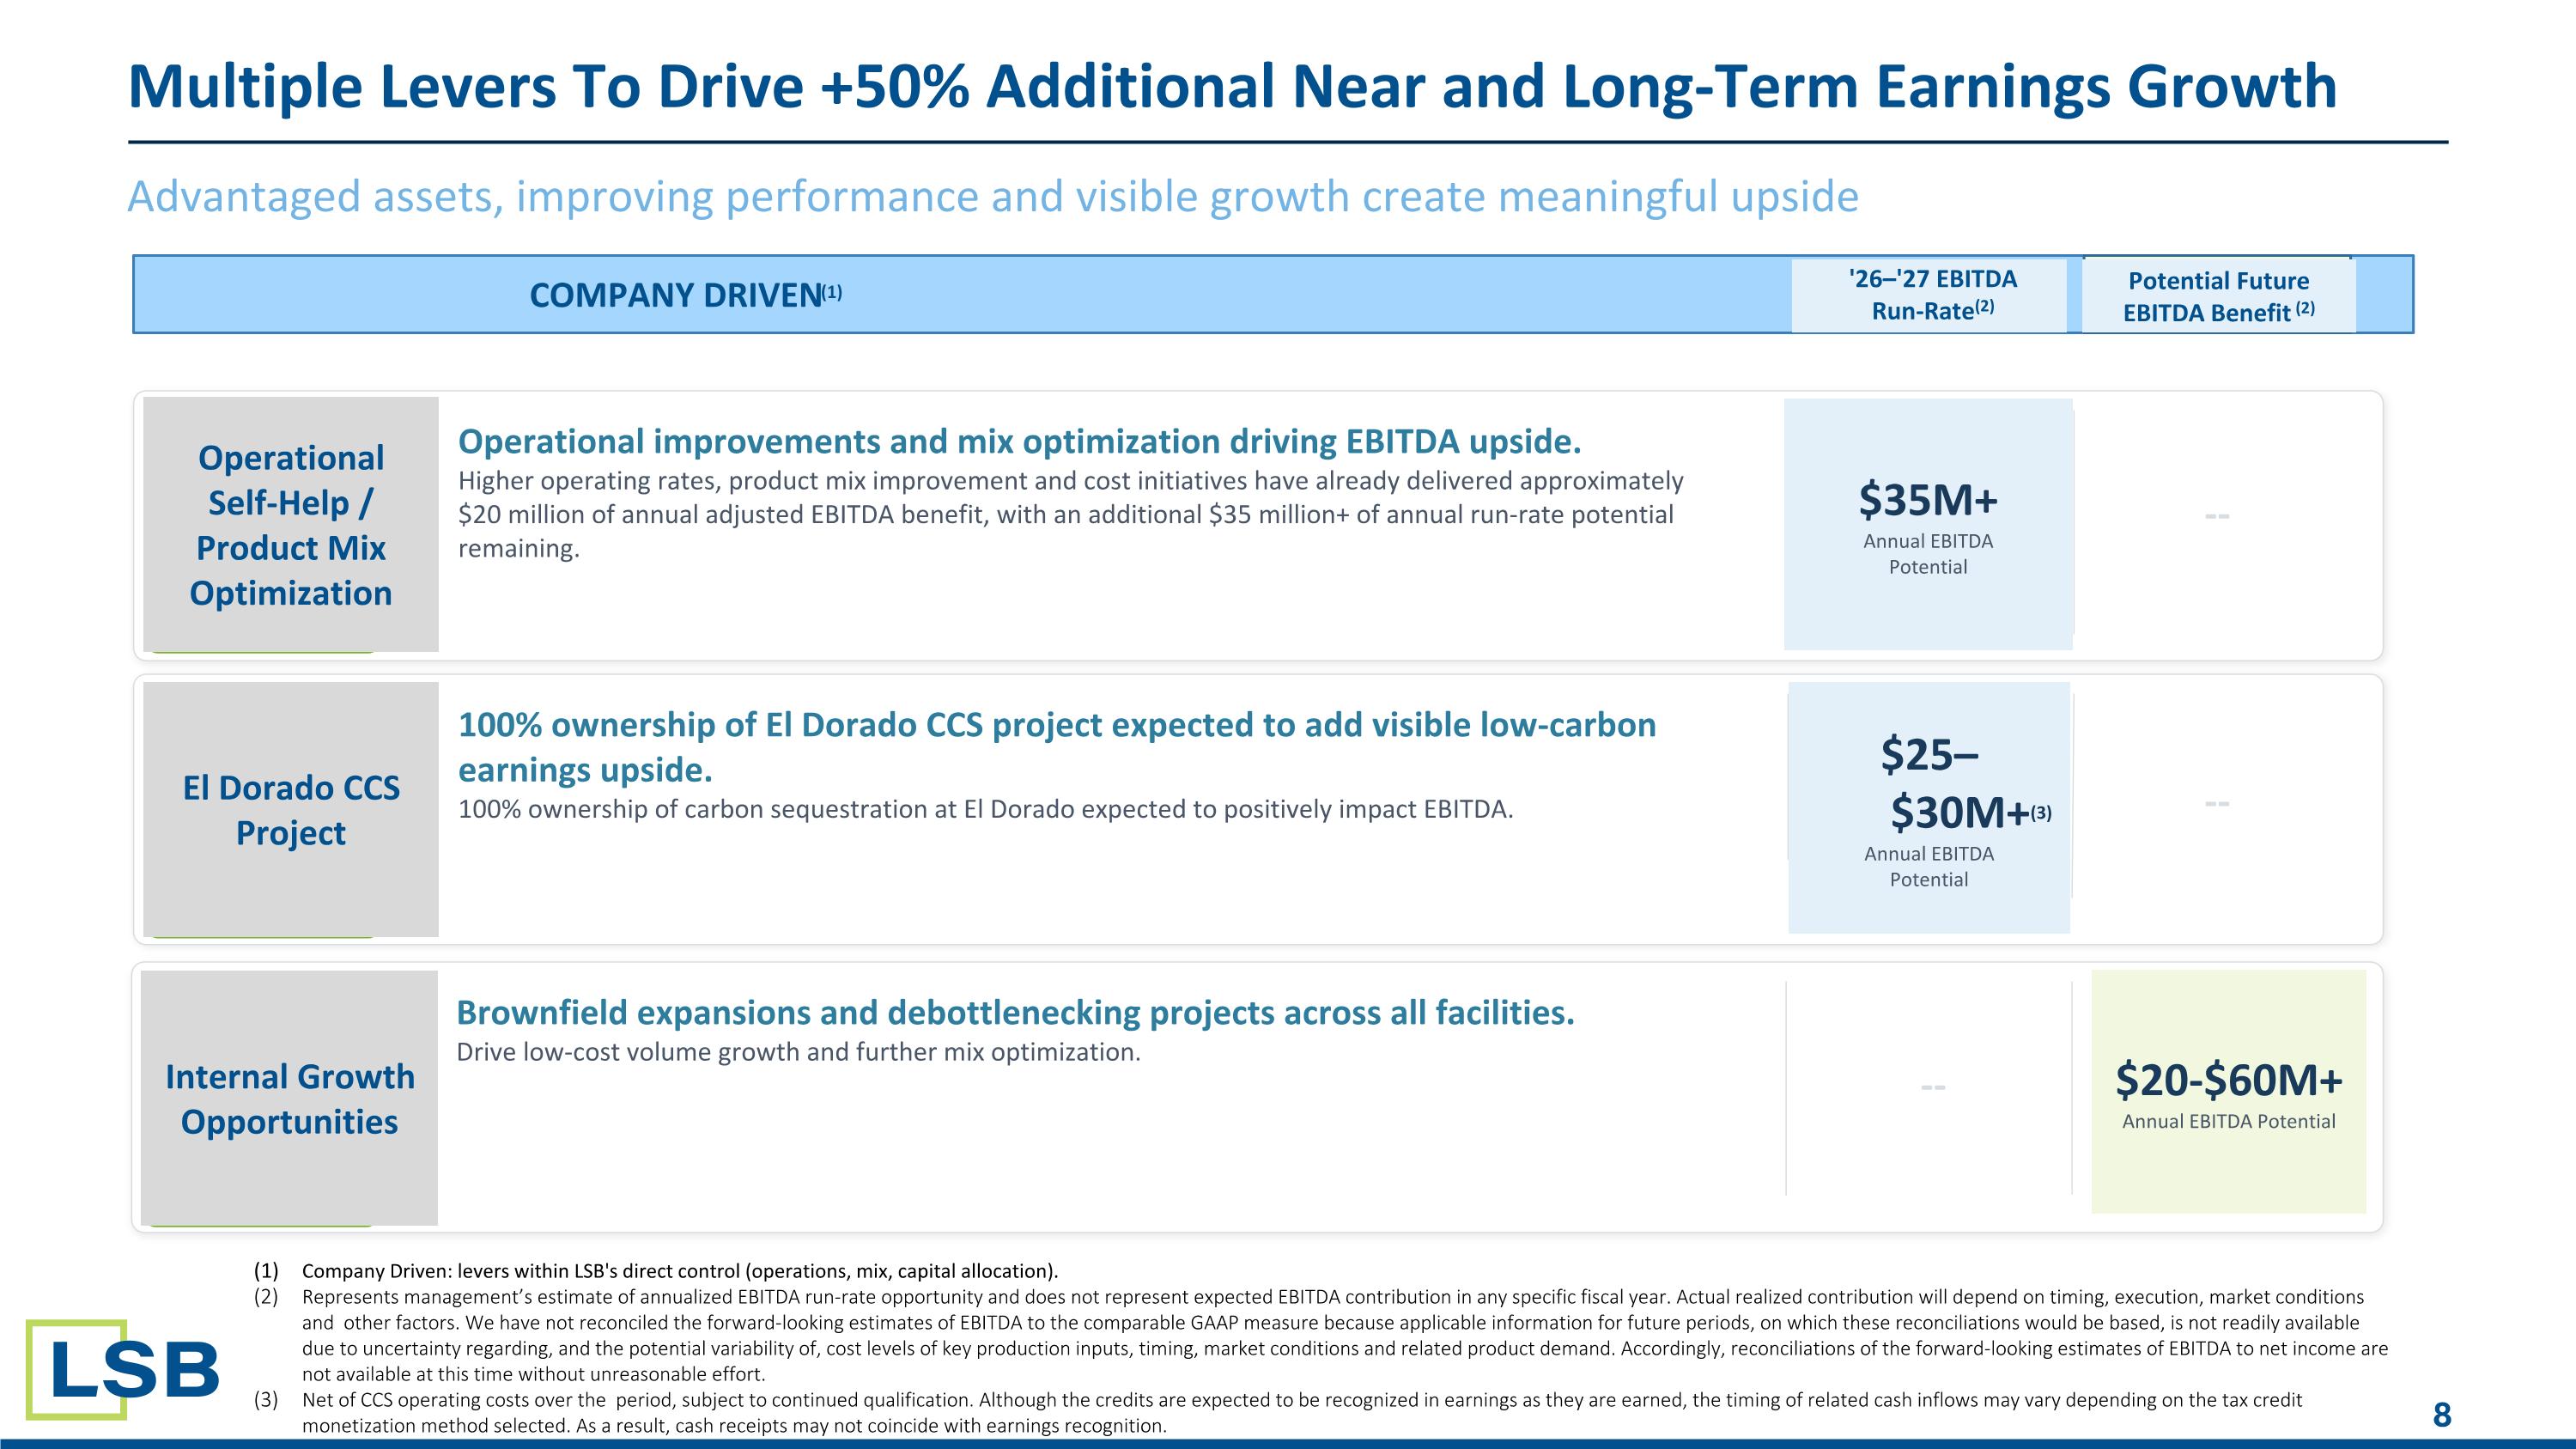
Advantaged assets, improving performance and visible growth create meaningful upside Multiple Levers To Drive +50% Additional Near and Long-Term Earnings Growth COMPANY DRIVEN(1) '26–'27 EBITDA Run-Rate(2) Potential Future EBITDA Benefit (2) Operational Self-Help / Product Mix Optimization Operational improvements and mix optimization driving EBITDA upside. Higher operating rates, product mix improvement and cost initiatives have already delivered approximately $20 million of annual adjusted EBITDA benefit, with an additional $35 million+ of annual run-rate potential remaining. $35M+ Annual EBITDA Potential -- 100% ownership of El Dorado CCS project expected to add visible low-carbon earnings upside.
100% ownership of carbon sequestration at El Dorado expected to positively impact EBITDA. $25–$30M+(3) Annual EBITDA Potential -- Brownfield expansions and debottlenecking projects across all facilities.
Drive low-cost volume growth and further mix optimization. -- $20-$60M+ Annual EBITDA Potential El Dorado CCS Project Internal Growth Opportunities Company Driven: levers within LSB's direct control (operations, mix, capital allocation). Represents management’s estimate of annualized EBITDA run-rate opportunity and does not represent expected EBITDA contribution in any specific fiscal year. Actual realized contribution will depend on timing, execution, market conditions and other factors. We have not reconciled the forward-looking estimates of EBITDA to the comparable GAAP measure because applicable information for future periods, on which these reconciliations would be based, is not readily available due to uncertainty regarding, and the potential variability of, cost levels of key production inputs, timing, market conditions and related product demand. Accordingly, reconciliations of the forward-looking estimates of EBITDA to net income are not available at this time without unreasonable effort. Net of CCS operating costs over the period, subject to continued qualification. Although the credits are expected to be recognized in earnings as they are earned, the timing of related cash inflows may vary depending on the tax credit monetization method selected. As a result, cash receipts may not coincide with earnings recognition.
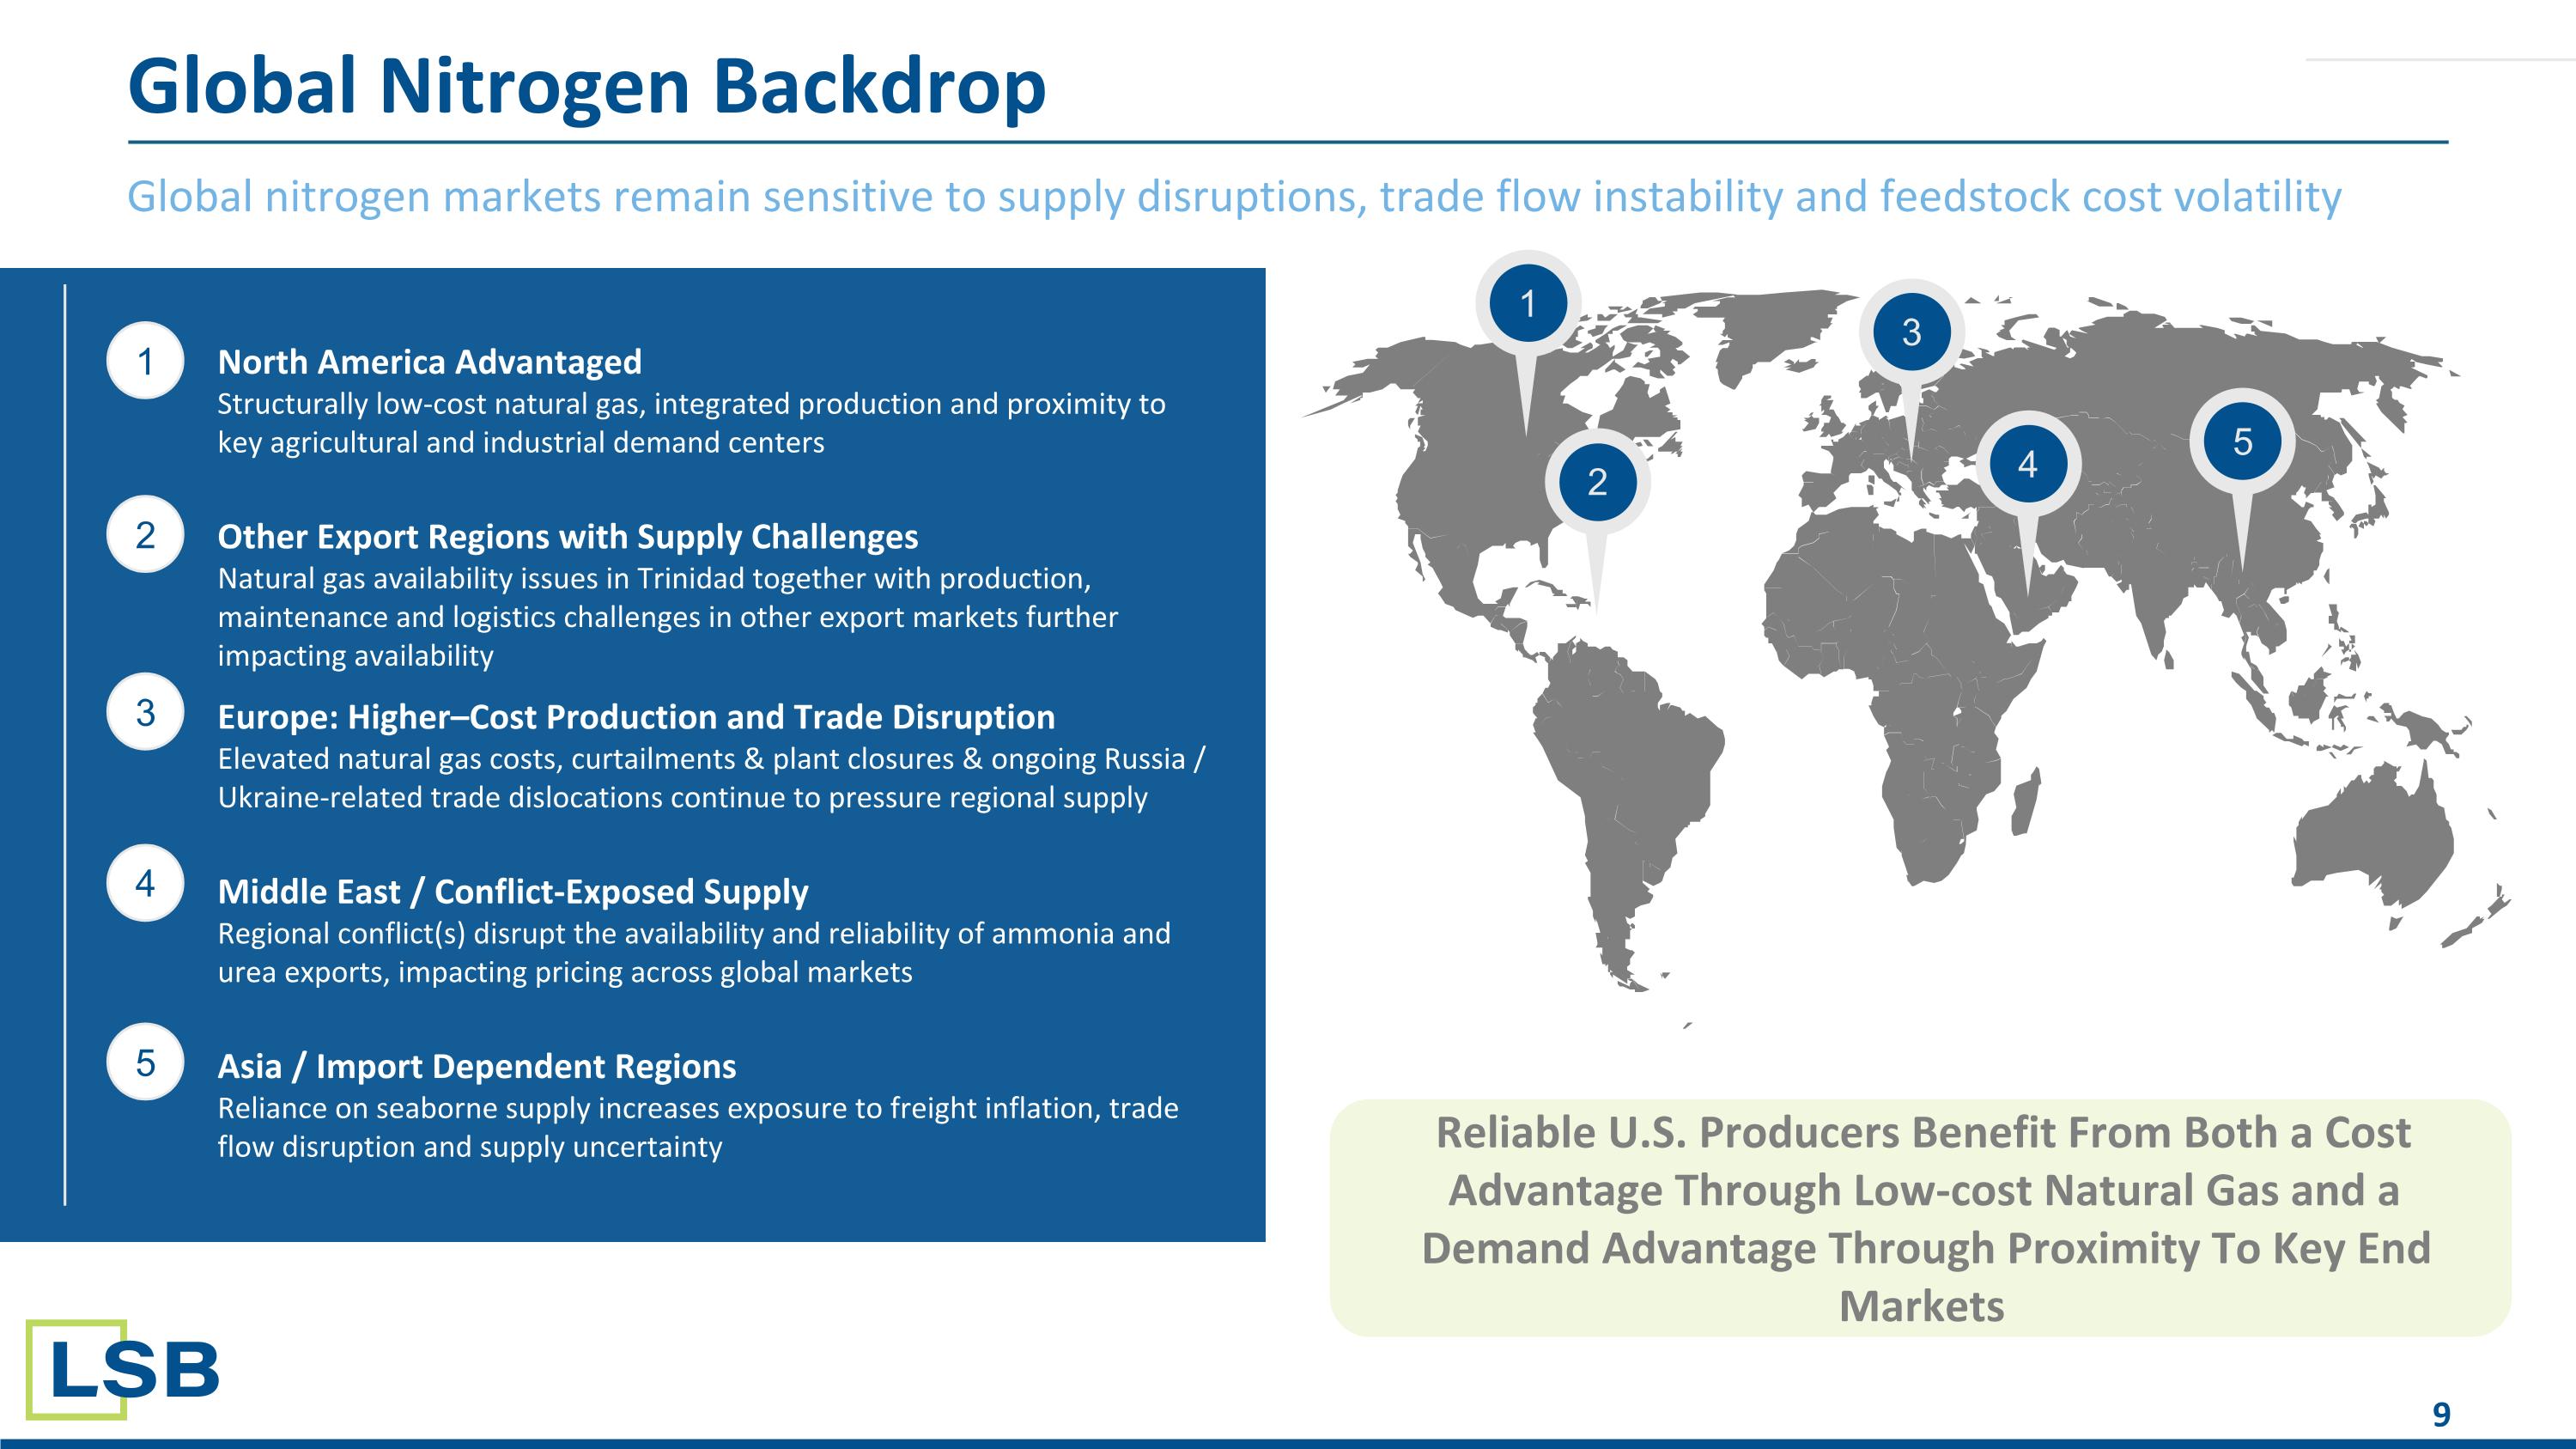
Global nitrogen markets remain sensitive to supply disruptions, trade flow instability and feedstock cost volatility Global Nitrogen Backdrop 1 2 3 4 5 1 3 2 4 5 North America Advantaged Structurally low-cost natural gas, integrated production and proximity to key agricultural and industrial demand centers Other Export Regions with Supply Challenges Natural gas availability issues in Trinidad together with production, maintenance and logistics challenges in other export markets further impacting availability Europe: Higher–Cost Production and Trade Disruption Elevated natural gas costs, curtailments & plant closures & ongoing Russia / Ukraine-related trade dislocations continue to pressure regional supply Middle East / Conflict-Exposed Supply Regional conflict(s) disrupt the availability and reliability of ammonia and urea exports, impacting pricing across global markets Asia / Import Dependent Regions Reliance on seaborne supply increases exposure to freight inflation, trade flow disruption and supply uncertainty Reliable U.S. Producers Benefit From Both a Cost Advantage Through Low-cost Natural Gas and a Demand Advantage Through Proximity To Key End Markets
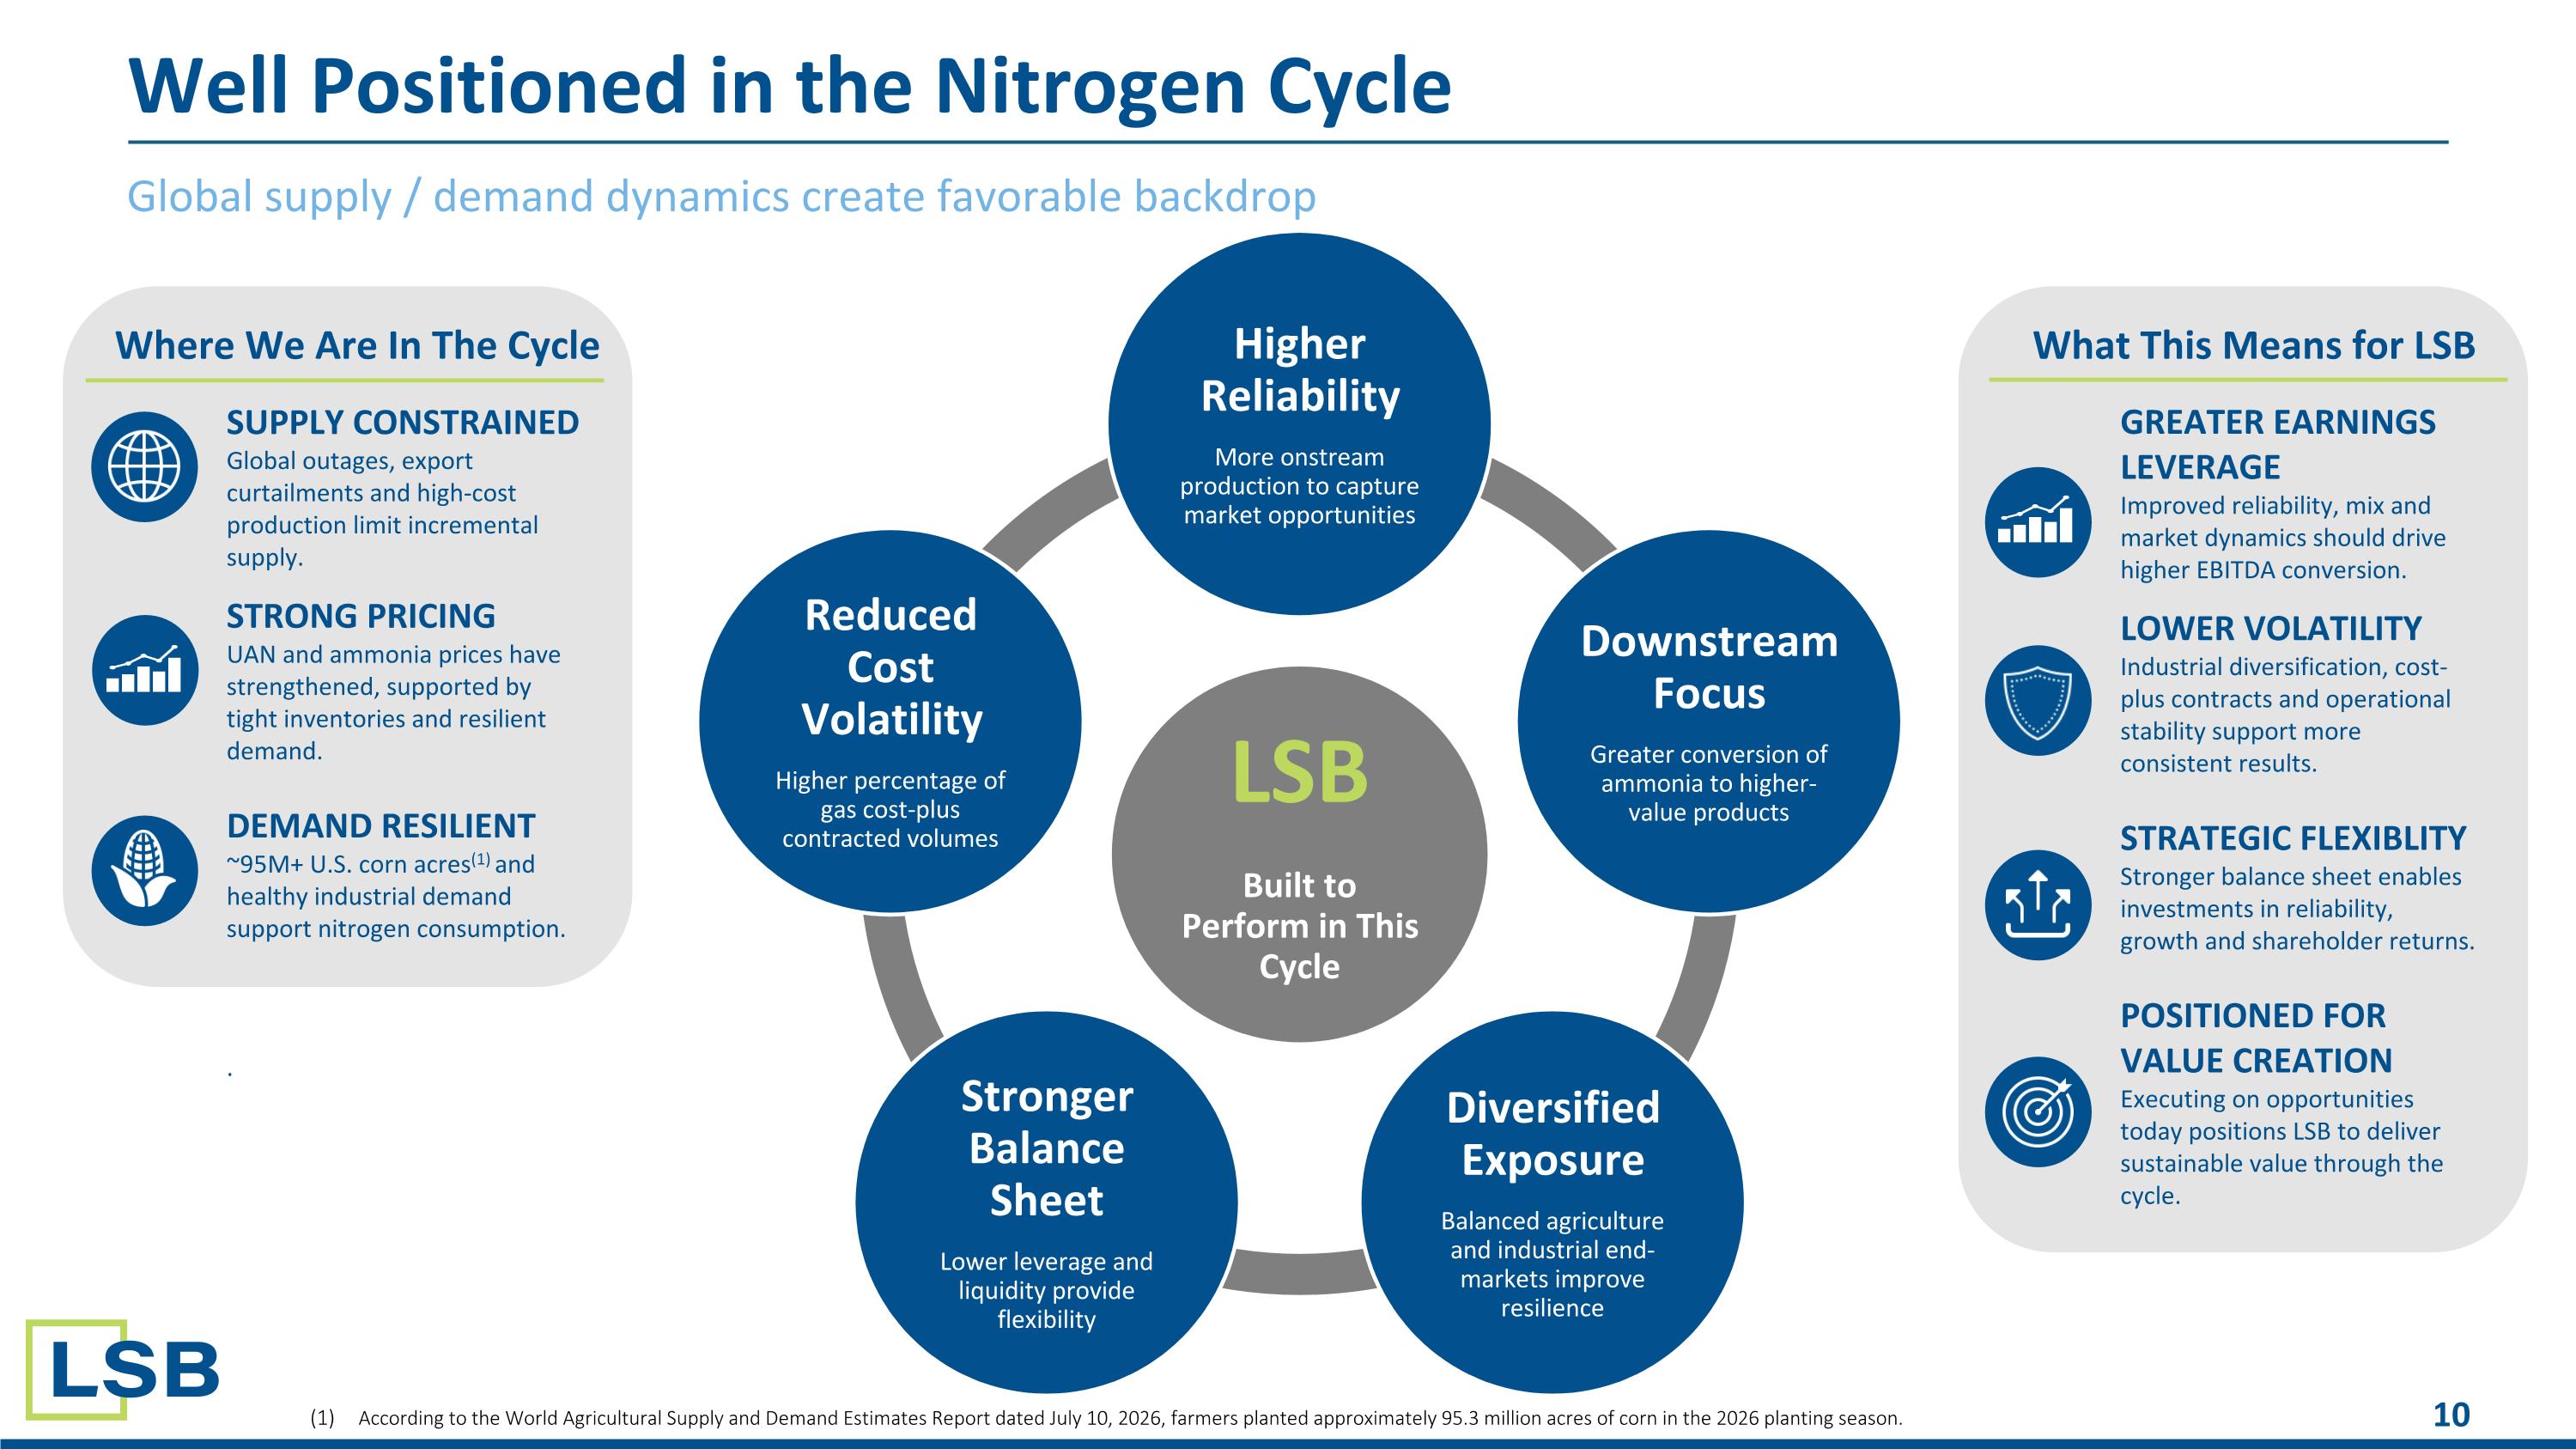
Global supply / demand dynamics create favorable backdrop Well Positioned in the Nitrogen Cycle LSB Built to Perform in This Cycle Higher Reliability More onstream production to capture market opportunities Downstream Focus Greater conversion of ammonia to higher-value products Diversified Exposure Balanced agriculture and industrial end-markets improve resilience Stronger Balance Sheet Lower leverage and liquidity provide flexibility Reduced Cost Volatility Higher percentage of gas cost-plus contracted volumes SUPPLY CONSTRAINED Global outages, export curtailments and high-cost production limit incremental supply. STRONG PRICING UAN and ammonia prices have strengthened, supported by tight inventories and resilient demand. DEMAND RESILIENT ~95M+ U.S. corn acres(1) and healthy industrial demand support nitrogen consumption. . GREATER EARNINGS LEVERAGE Improved reliability, mix and market dynamics should drive higher EBITDA conversion. LOWER VOLATILITY Industrial diversification, cost-plus contracts and operational stability support more consistent results. STRATEGIC FLEXIBLITY Stronger balance sheet enables investments in reliability, growth and shareholder returns. POSITIONED FOR VALUE CREATION Executing on opportunities today positions LSB to deliver sustainable value through the cycle. Where We Are In The Cycle What This Means for LSB According to the World Agricultural Supply and Demand Estimates Report dated July 10, 2026, farmers planted approximately 95.3 million acres of corn in the 2026 planting season.
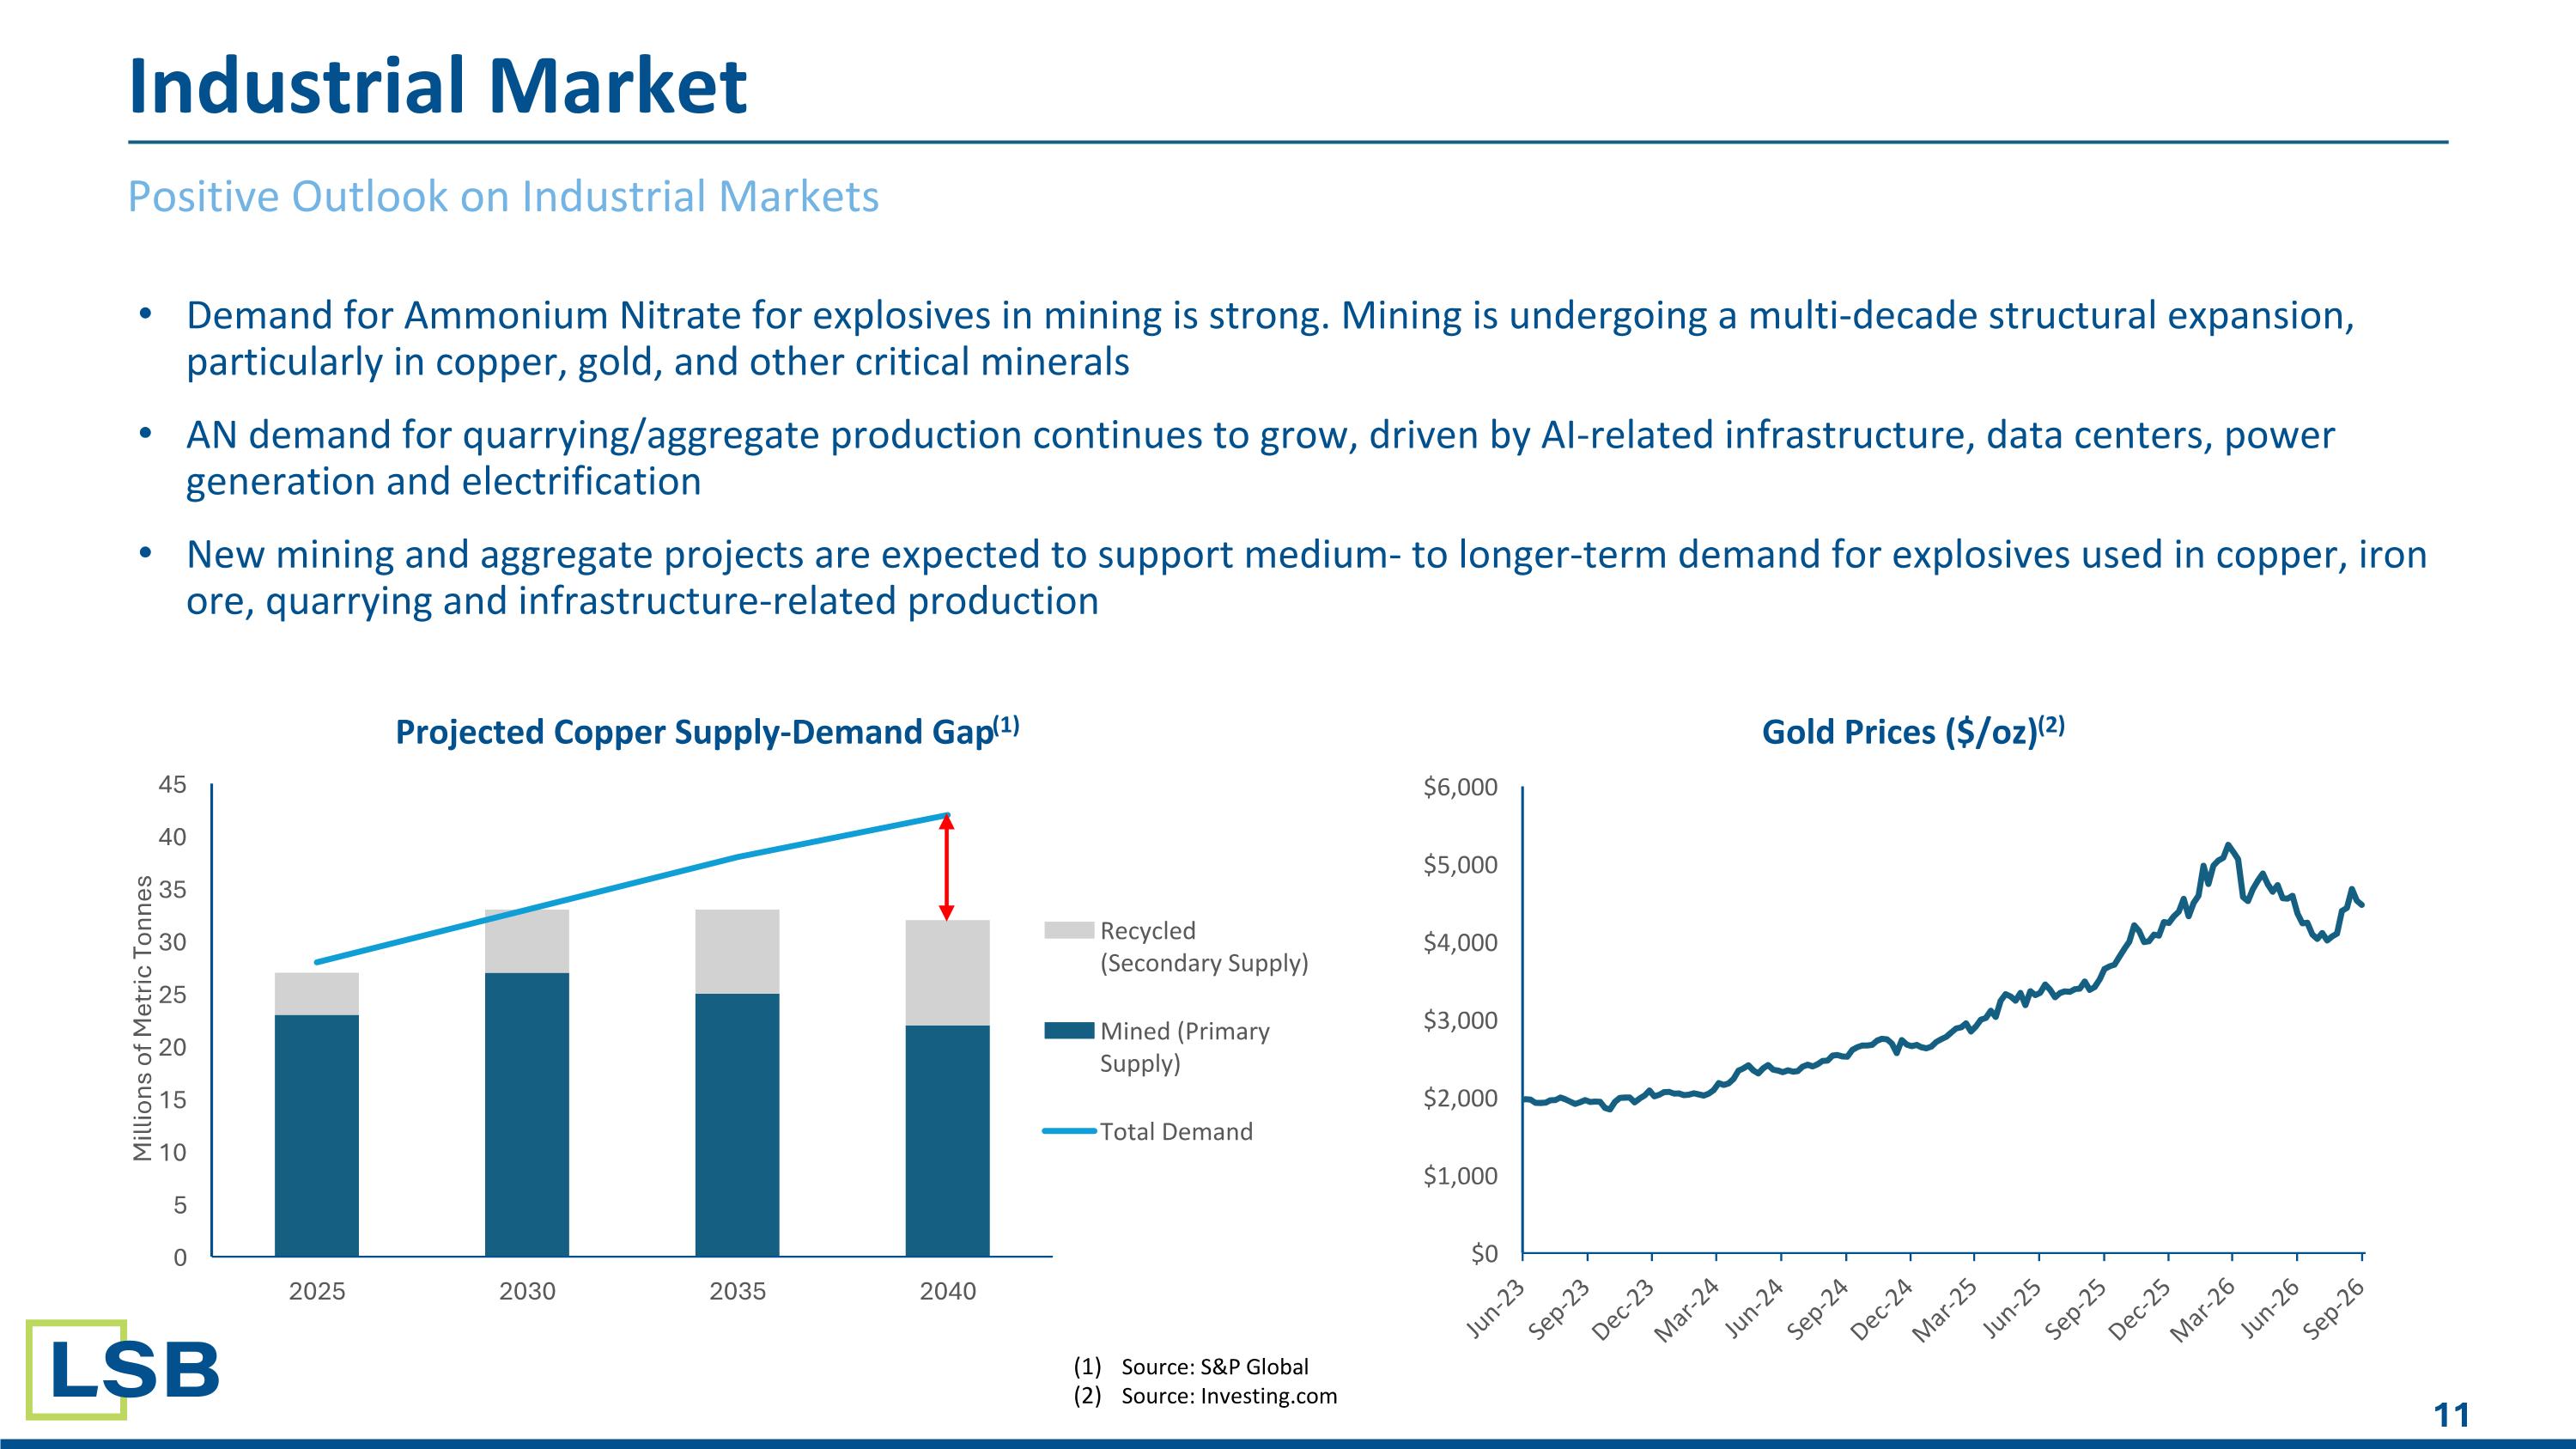
Demand for Ammonium Nitrate for explosives in mining is strong. Mining is undergoing a multi-decade structural expansion, particularly in copper, gold, and other critical minerals AN demand for quarrying/aggregate production continues to grow, driven by AI-related infrastructure, data centers, power generation and electrification New mining and aggregate projects are expected to support medium- to longer-term demand for explosives used in copper, iron ore, quarrying and infrastructure-related production Positive Outlook on Industrial Markets Industrial Market Source: S&P Global Source: Investing.com
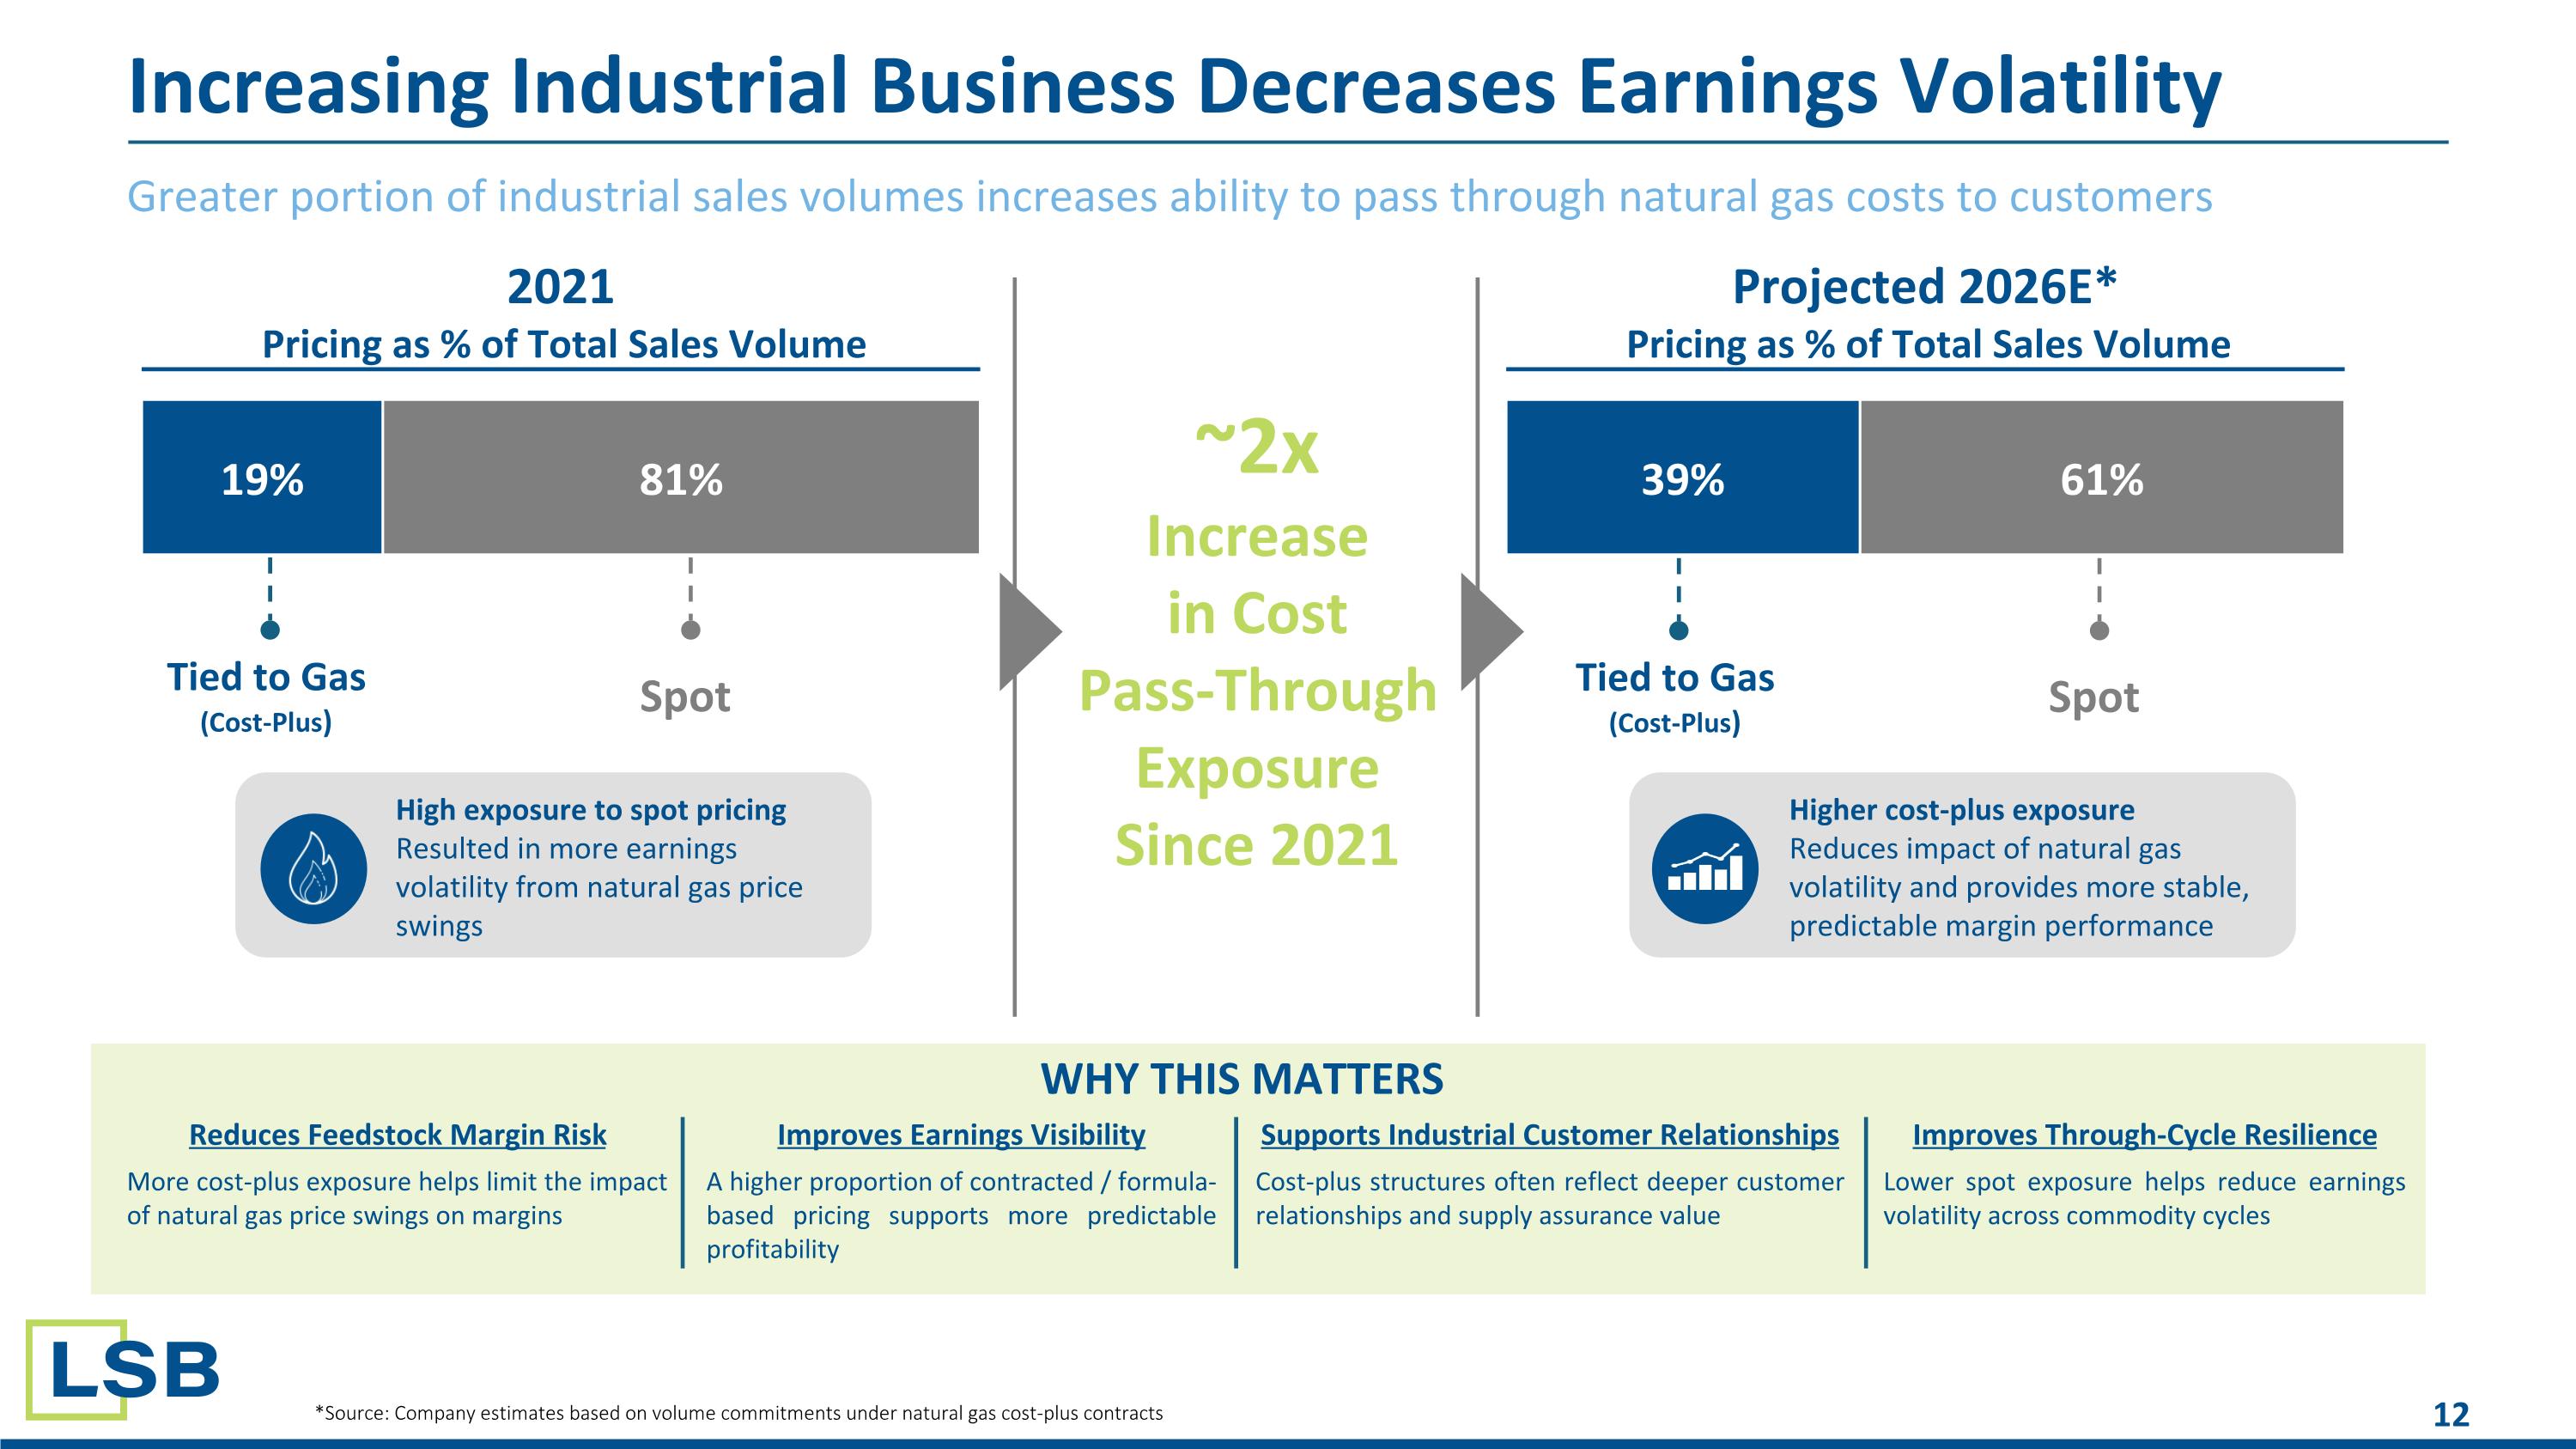
Greater portion of industrial sales volumes increases ability to pass through natural gas costs to customers Increasing Industrial Business Decreases Earnings Volatility 19% 81% 2021 Pricing as % of Total Sales Volume 39% 61% Projected 2026E* Pricing as % of Total Sales Volume Tied to Gas (Cost-Plus) Spot Tied to Gas (Cost-Plus) Spot WHY THIS MATTERS Reduces Feedstock Margin Risk More cost-plus exposure helps limit the impact of natural gas price swings on margins Improves Earnings Visibility A higher proportion of contracted / formula-based pricing supports more predictable profitability Supports Industrial Customer Relationships Cost-plus structures often reflect deeper customer relationships and supply assurance value Improves Through-Cycle Resilience Lower spot exposure helps reduce earnings volatility across commodity cycles ~2x Increase in Cost Pass-Through Exposure Since 2021 High exposure to spot pricing Resulted in more earnings volatility from natural gas price swings Higher cost-plus exposure Reduces impact of natural gas volatility and provides more stable, predictable margin performance *Source: Company estimates based on volume commitments under natural gas cost-plus contracts
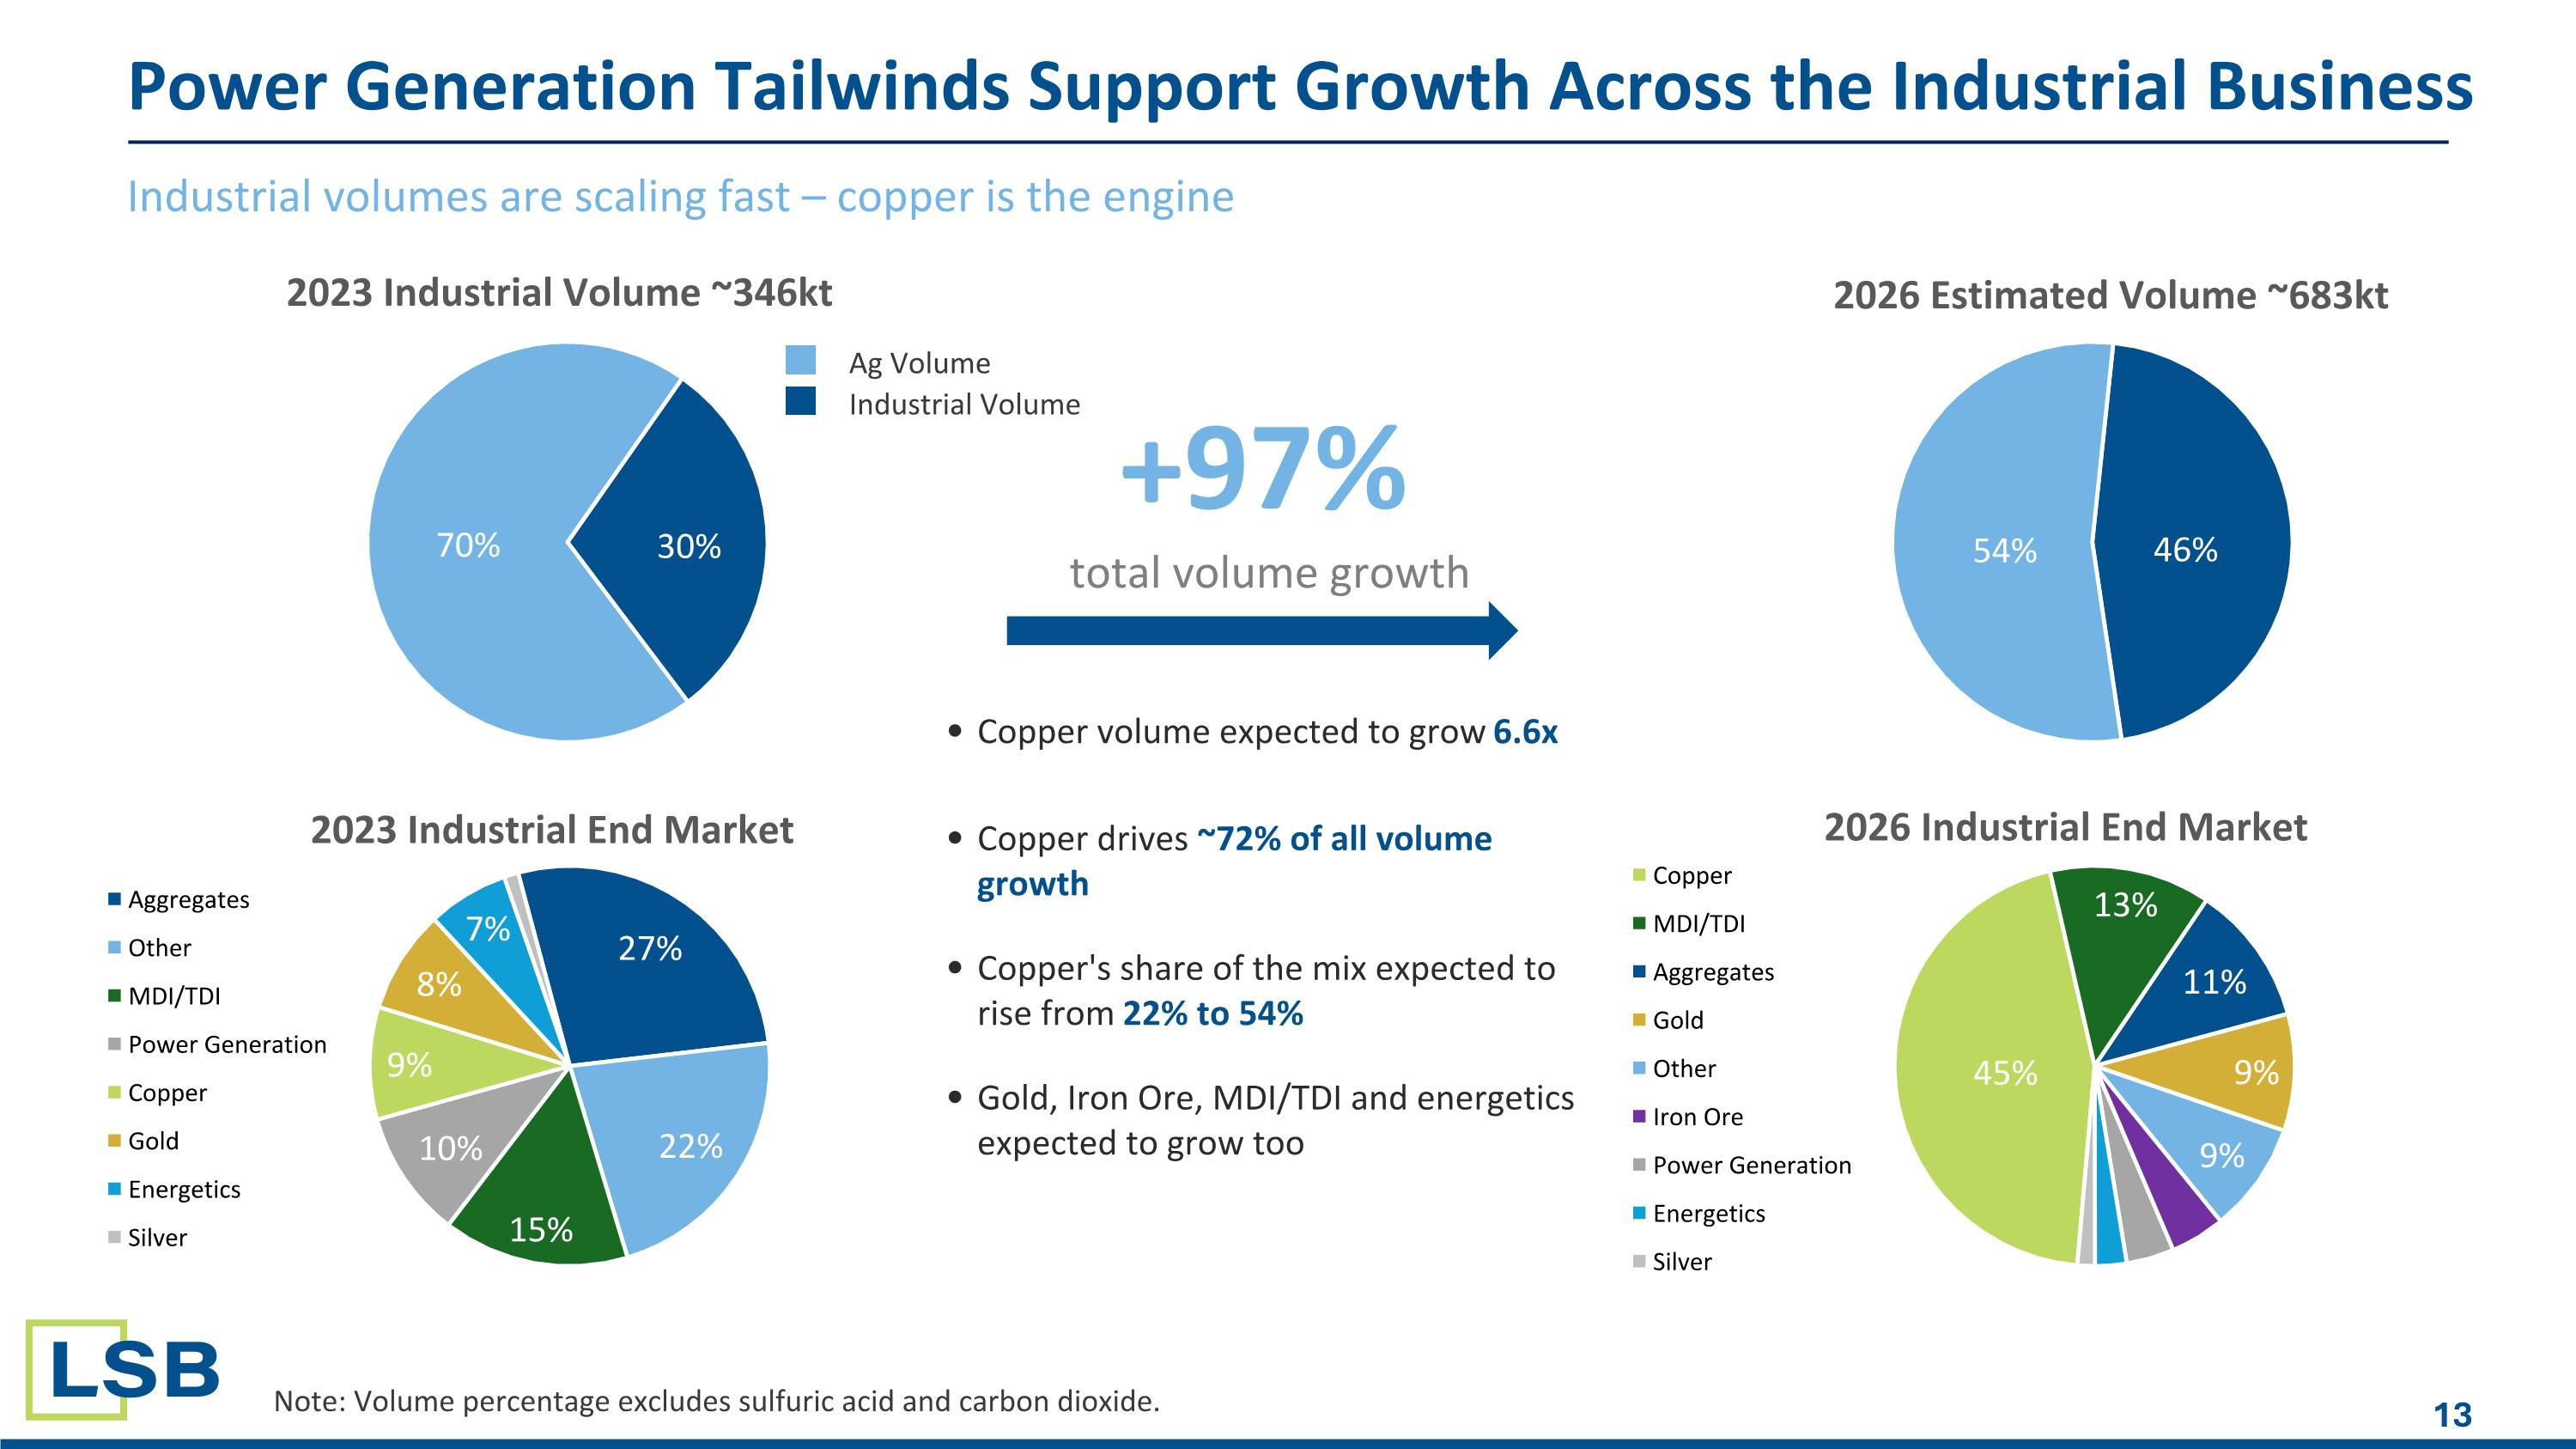
Industrial volumes are scaling fast – copper is the engine Power Generation Tailwinds Support Growth Across the Industrial Business Note: Volume percentage excludes sulfuric acid and carbon dioxide. +97% total volume growth Copper volume expected to grow 6.6x Copper drives ~72% of all volume growth Copper's share of the mix expected to rise from 22% to 54% Gold, Iron Ore, MDI/TDI and energetics expected to grow too Industrial Volume Ag Volume
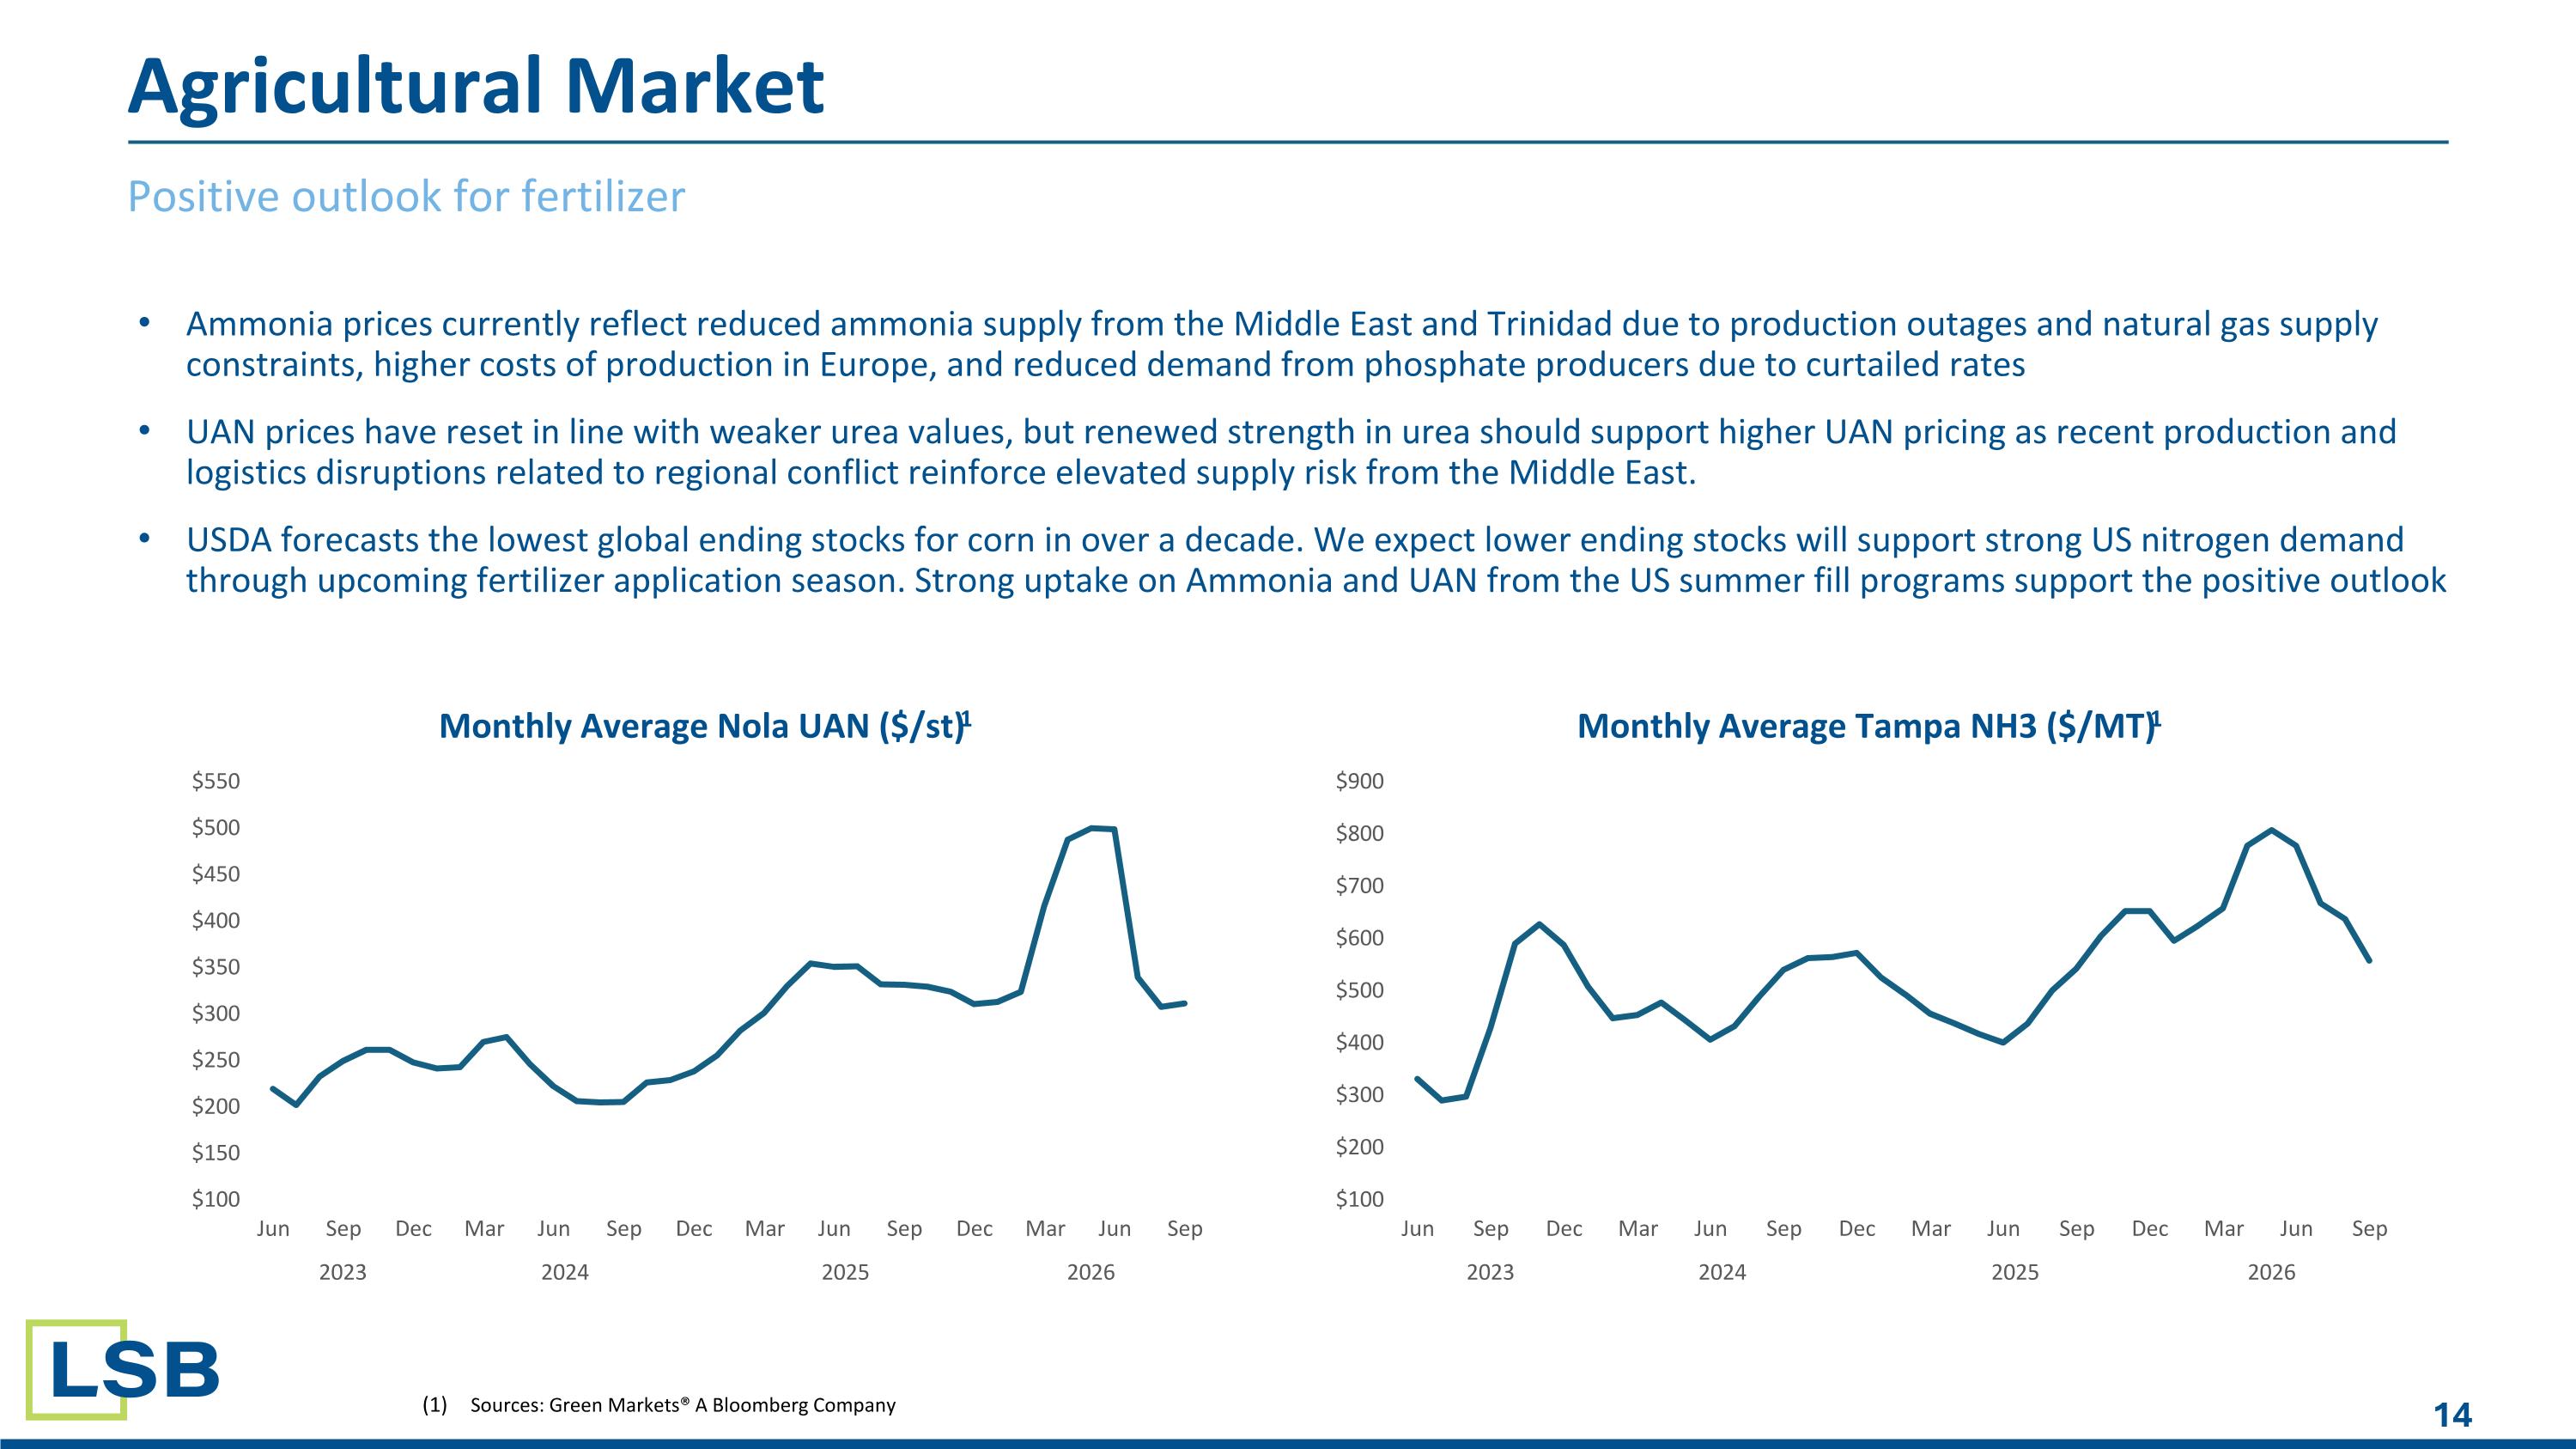
Positive outlook for fertilizer Sources: Green Markets® A Bloomberg Company Agricultural Market Ammonia prices currently reflect reduced ammonia supply from the Middle East and Trinidad due to production outages and natural gas supply constraints, higher costs of production in Europe, and reduced demand from phosphate producers due to curtailed rates UAN prices have reset in line with weaker urea values, but renewed strength in urea should support higher UAN pricing as recent production and logistics disruptions related to regional conflict reinforce elevated supply risk from the Middle East. USDA forecasts the lowest global ending stocks for corn in over a decade. We expect lower ending stocks will support strong US nitrogen demand through upcoming fertilizer application season. Strong uptake on Ammonia and UAN from the US summer fill programs support the positive outlook
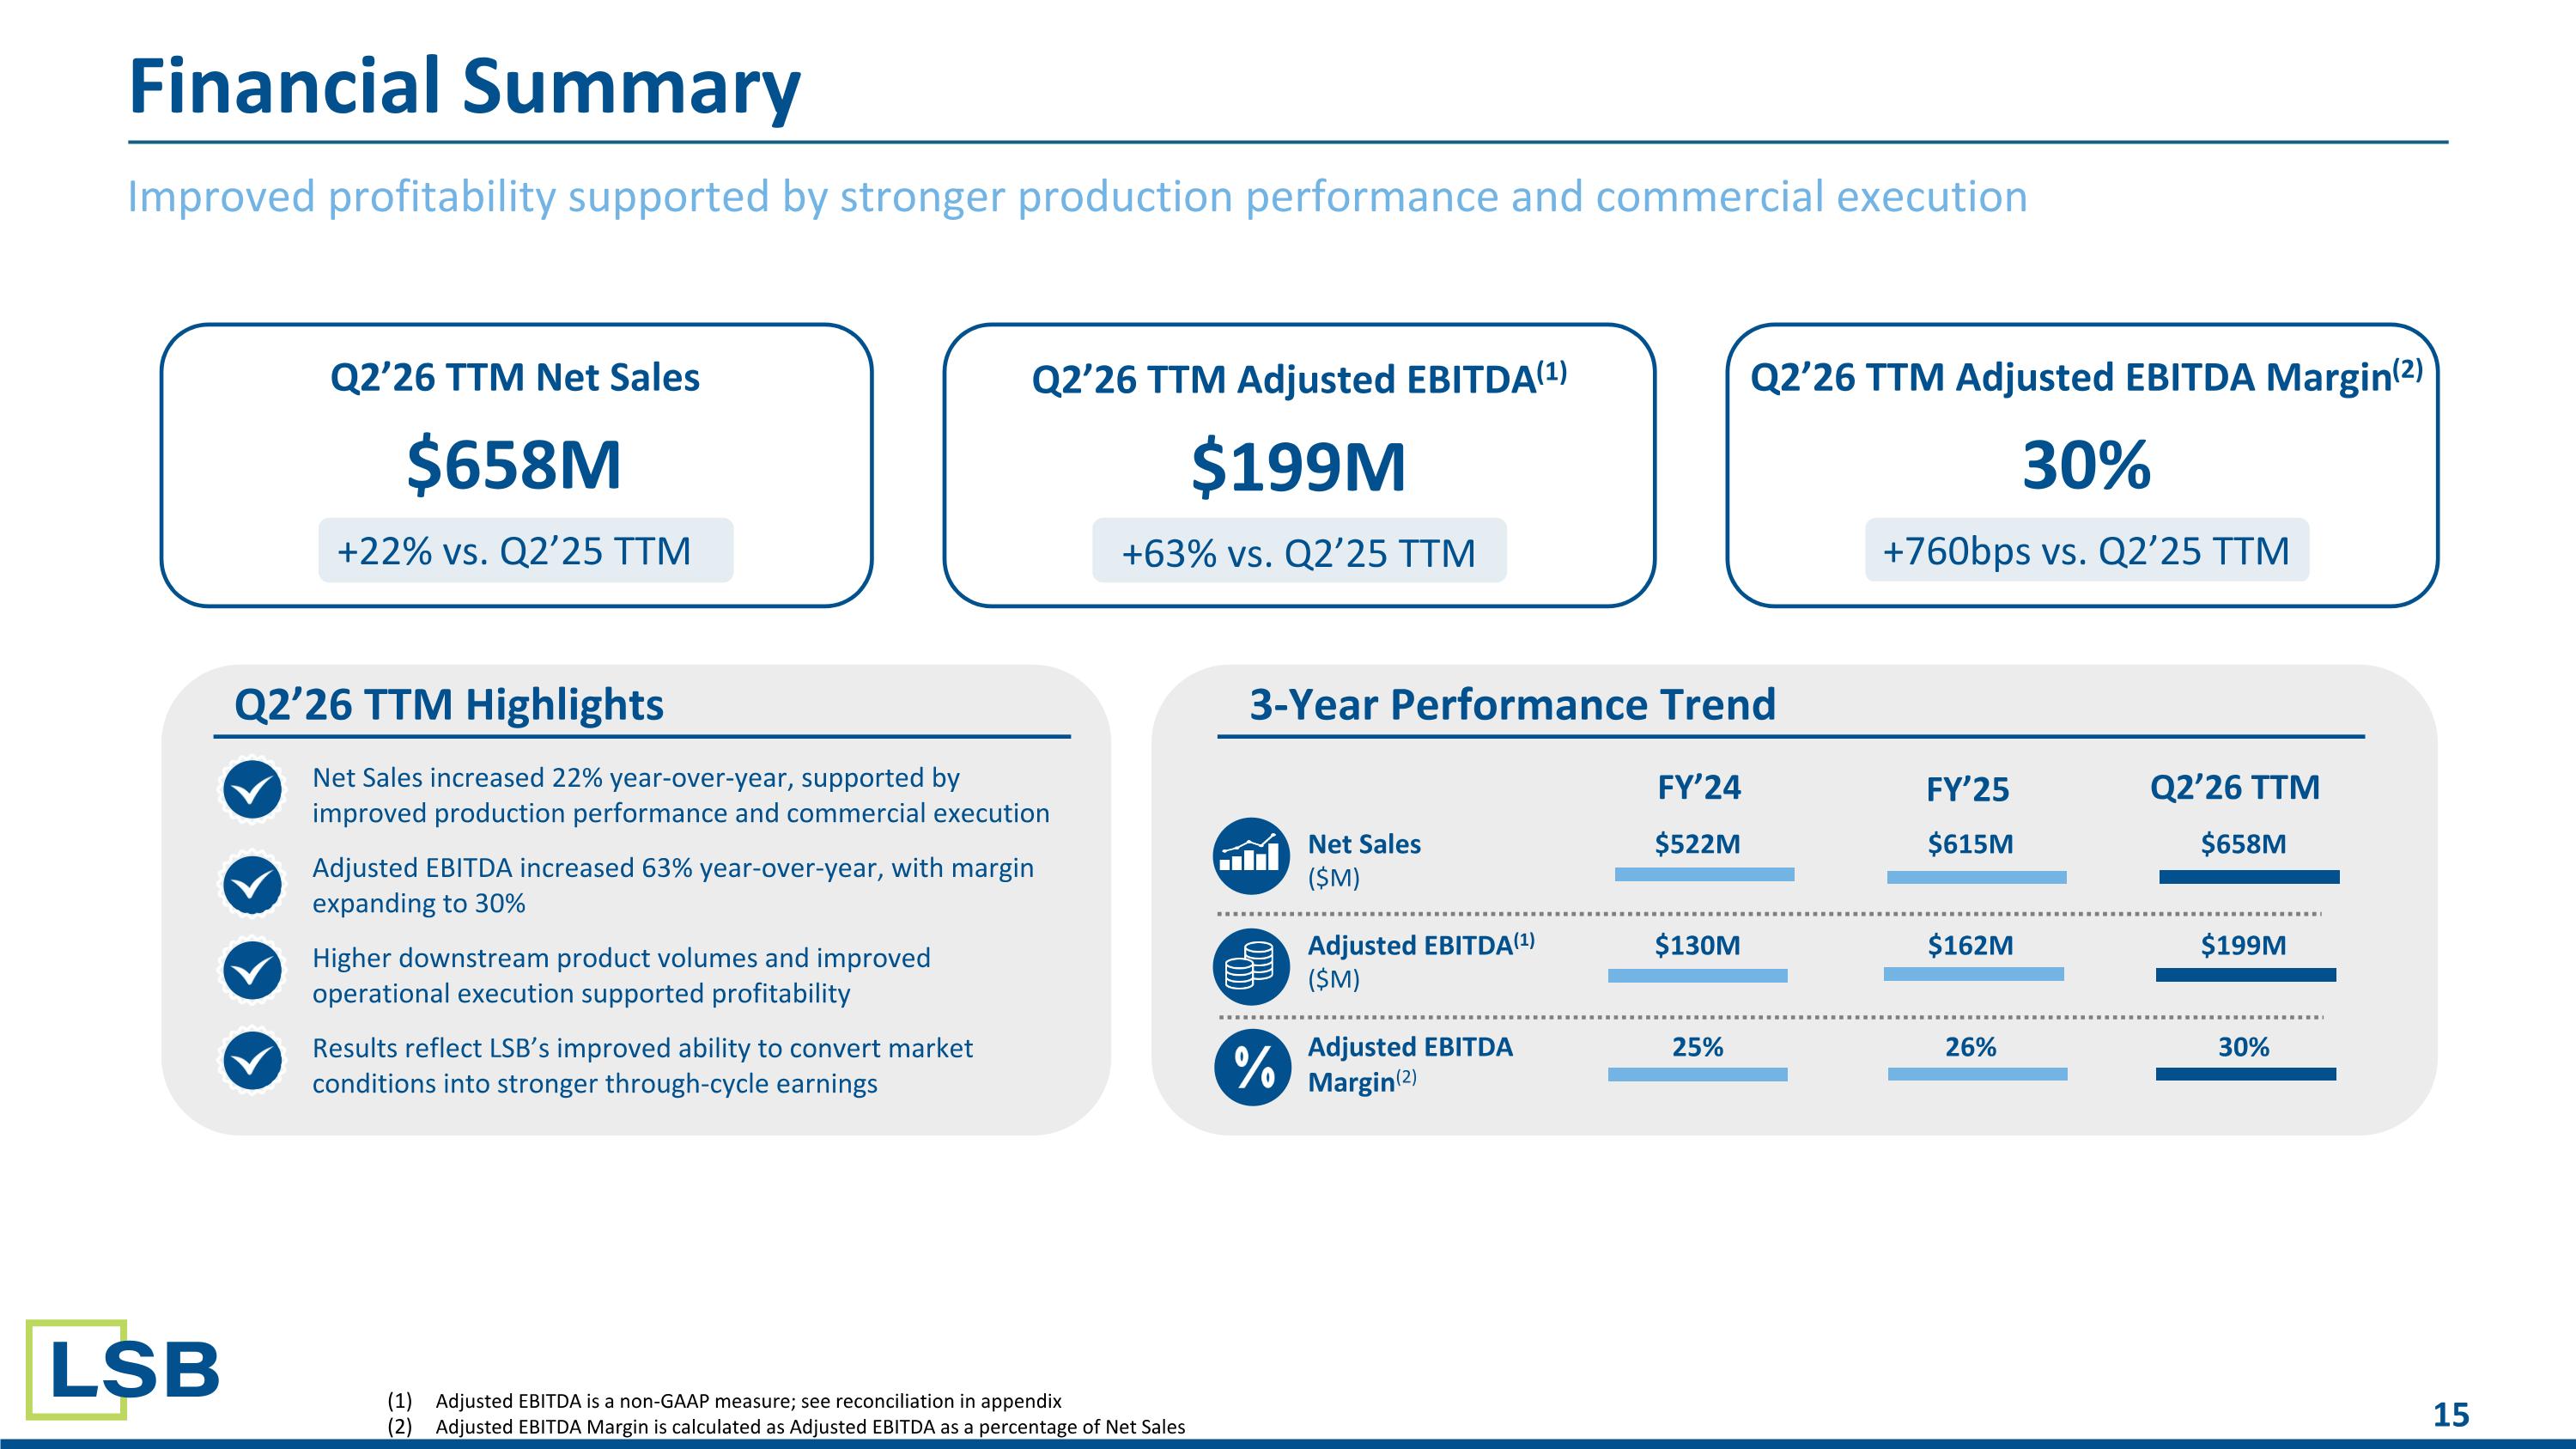
Q2’26 TTM Adjusted EBITDA Margin(2) 30% +760bps vs. Q2’25 TTM Q2’26 TTM Net Sales $658M +22% vs. Q2’25 TTM Improved profitability supported by stronger production performance and commercial execution Financial Summary Q2’26 TTM Adjusted EBITDA(1) $199M +63% vs. Q2’25 TTM Net Sales increased 22% year-over-year, supported by improved production performance and commercial execution Adjusted EBITDA increased 63% year-over-year, with margin expanding to 30% Higher downstream product volumes and improved operational execution supported profitability Results reflect LSB’s improved ability to convert market conditions into stronger through-cycle earnings Q2’26 TTM Highlights 3-Year Performance Trend Net Sales ($M) $522M $615M $658M Adjusted EBITDA(1) ($M) $130M $162M $199M Adjusted EBITDA Margin(2) 25% 26% 30% FY’24 FY’25 Q2’26 TTM Adjusted EBITDA is a non-GAAP measure; see reconciliation in appendix Adjusted EBITDA Margin is calculated as Adjusted EBITDA as a percentage of Net Sales
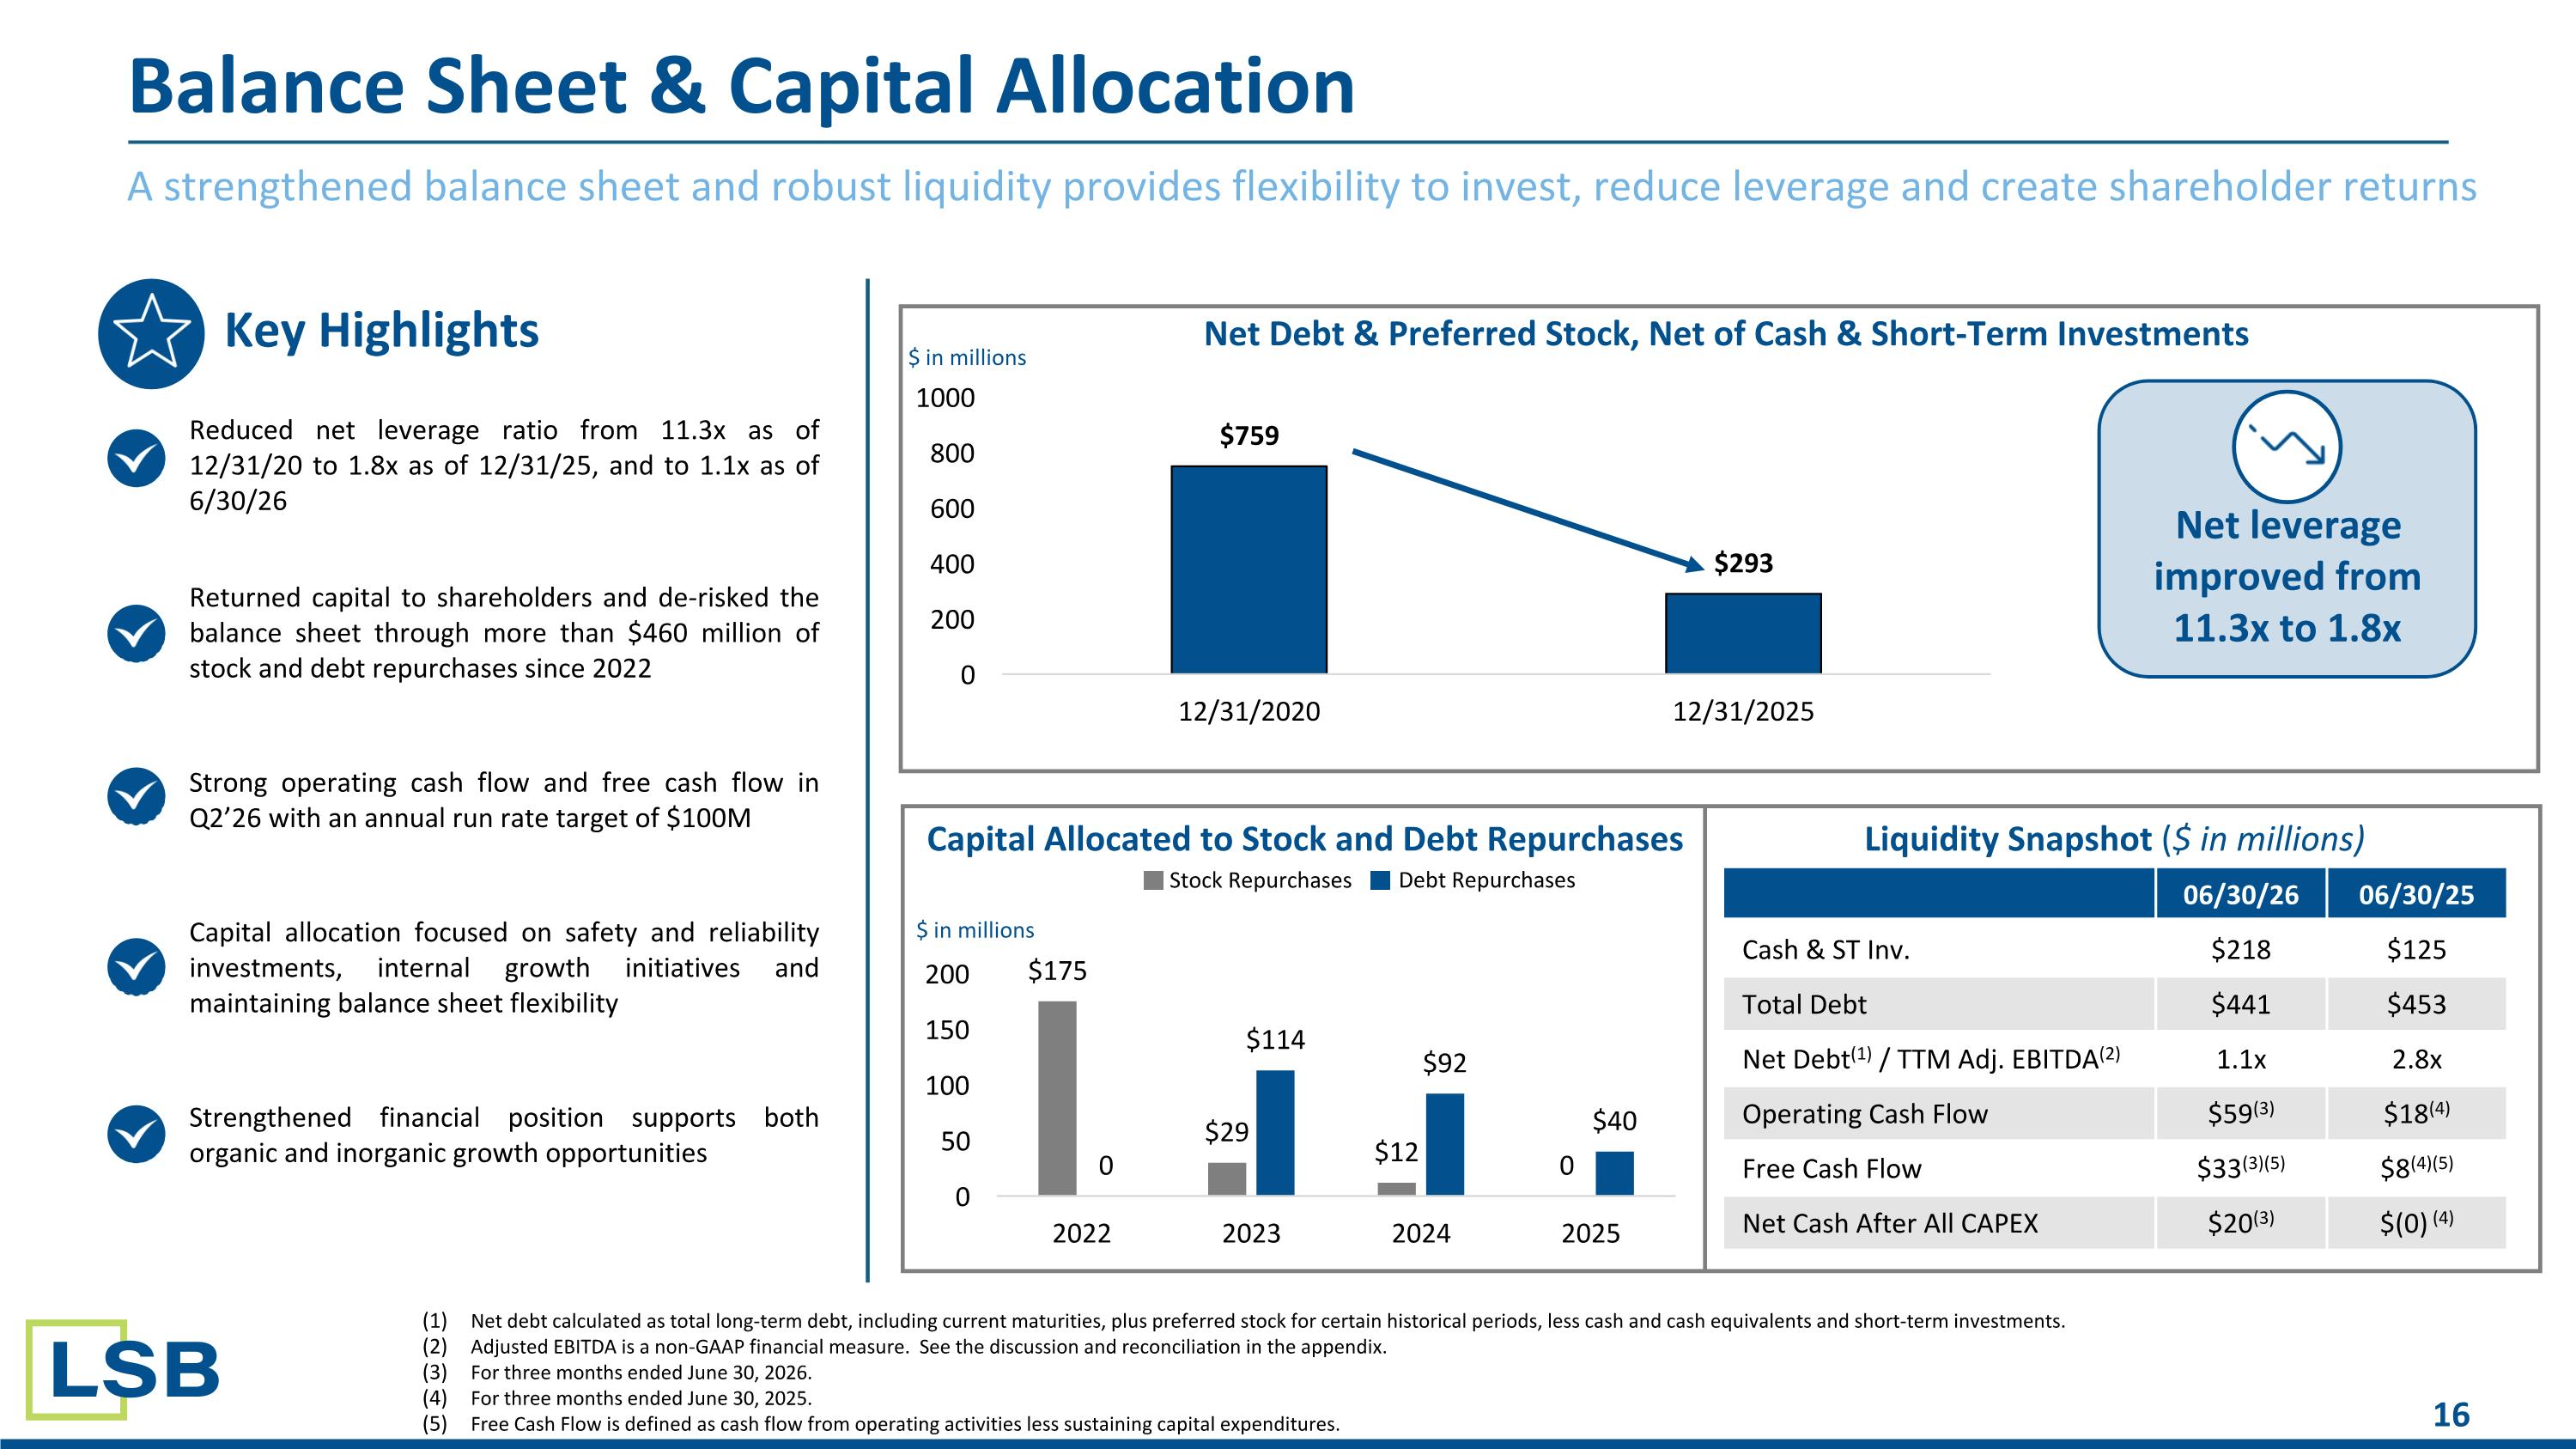
A strengthened balance sheet and robust liquidity provides flexibility to invest, reduce leverage and create shareholder returns Balance Sheet & Capital Allocation Reduced net leverage ratio from 11.3x as of 12/31/20 to 1.8x as of 12/31/25, and to 1.1x as of 6/30/26 Returned capital to shareholders and de-risked the balance sheet through more than $460 million of stock and debt repurchases since 2022 Strong operating cash flow and free cash flow in Q2’26 with an annual run rate target of $100M Capital allocation focused on safety and reliability investments, internal growth initiatives and maintaining balance sheet flexibility Strengthened financial position supports both organic and inorganic growth opportunities 06/30/26 06/30/25 Cash & ST Inv. $218 $125 Total Debt $441 $453 Net Debt(1) / TTM Adj. EBITDA(2) 1.1x 2.8x Operating Cash Flow $59(3) $18(4) Free Cash Flow $33(3)(5) $8(4)(5) Net Cash After All CAPEX $20(3) $(0) (4) Net debt calculated as total long-term debt, including current maturities, plus preferred stock for certain historical periods, less cash and cash equivalents and short-term investments. Adjusted EBITDA is a non-GAAP financial measure. See the discussion and reconciliation in the appendix. For three months ended June 30, 2026. For three months ended June 30, 2025. Free Cash Flow is defined as cash flow from operating activities less sustaining capital expenditures. Key Highlights Capital Allocated to Stock and Debt Repurchases Liquidity Snapshot ($ in millions) Net Debt & Preferred Stock, Net of Cash & Short-Term Investments $ in millions $ in millions Stock Repurchases Debt Repurchases Net leverage improved from 11.3x to 1.8x
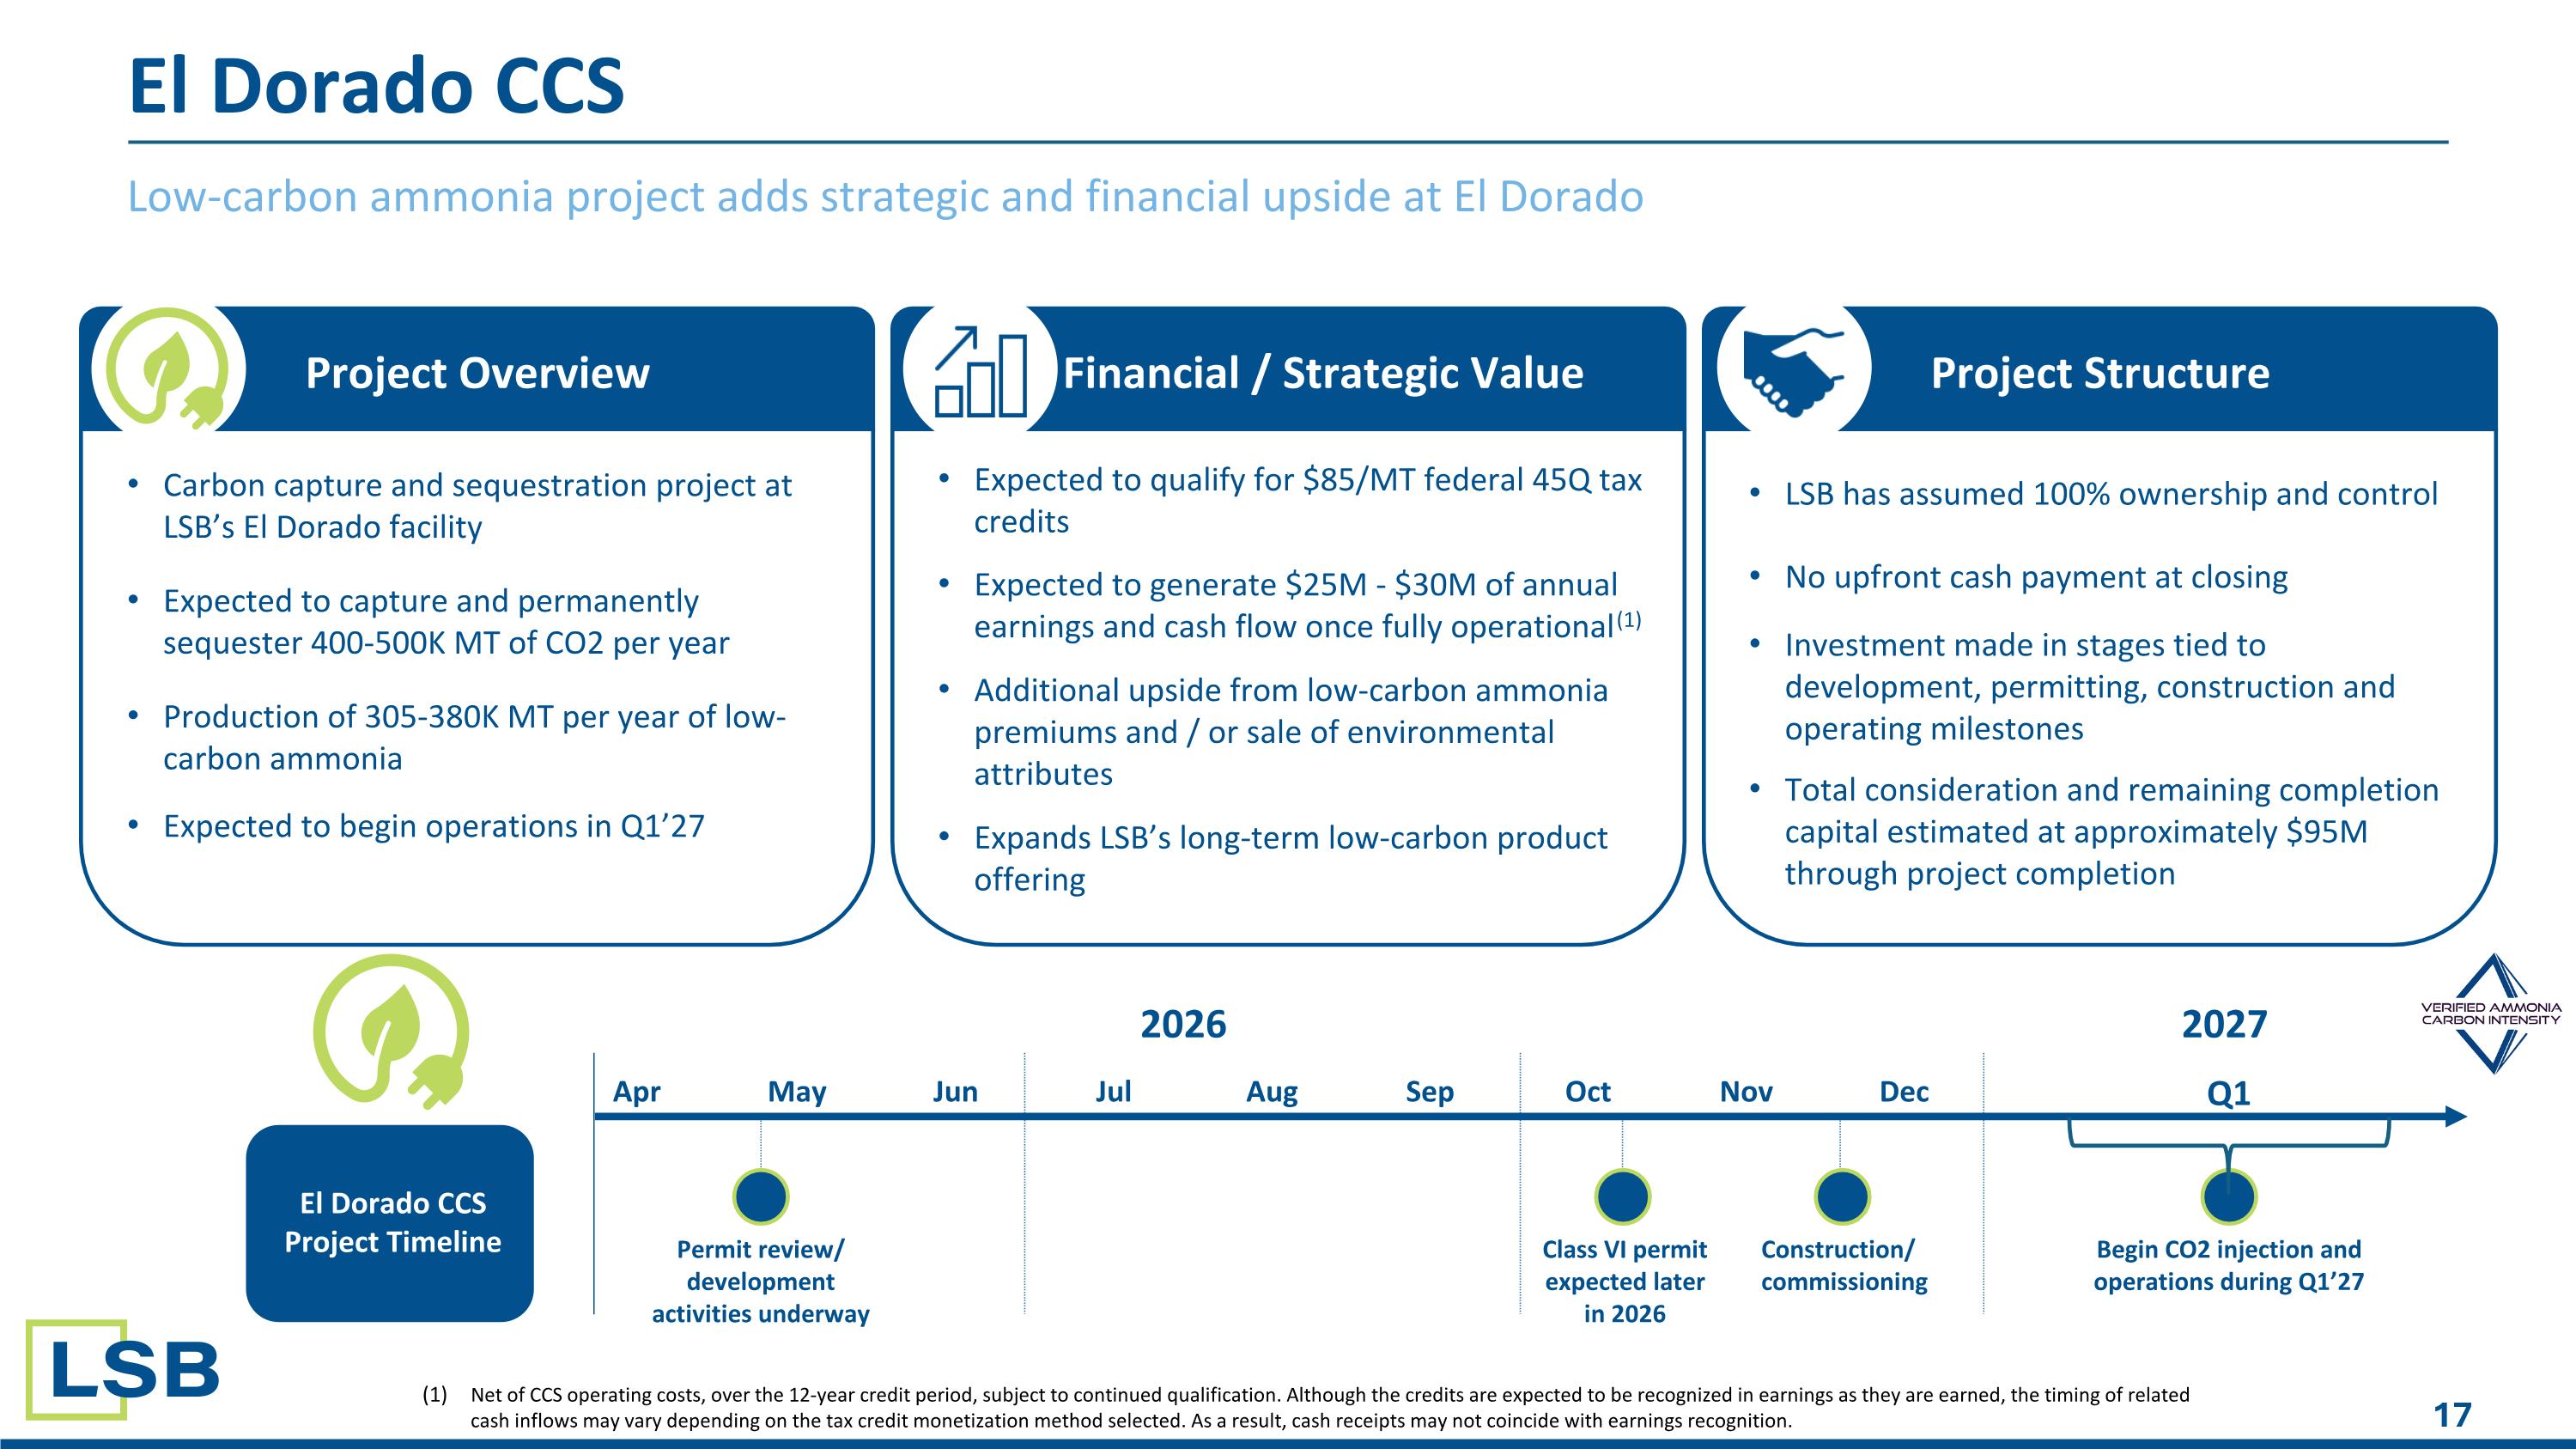
Low-carbon ammonia project adds strategic and financial upside at El Dorado El Dorado CCS Project Overview Financial / Strategic Value Project Structure Carbon capture and sequestration project at LSB’s El Dorado facility Expected to capture and permanently sequester 400-500K MT of CO2 per year Production of 305-380K MT per year of low-carbon ammonia Expected to begin operations in Q1’27 Expected to qualify for $85/MT federal 45Q tax credits Expected to generate $25M - $30M of annual earnings and cash flow once fully operational(1) Additional upside from low-carbon ammonia premiums and / or sale of environmental attributes Expands LSB’s long-term low-carbon product offering LSB has assumed 100% ownership and control No upfront cash payment at closing Investment made in stages tied to development, permitting, construction and operating milestones Total consideration and remaining completion capital estimated at approximately $95M through project completion El Dorado CCS Project Timeline Net of CCS operating costs, over the 12-year credit period, subject to continued qualification. Although the credits are expected to be recognized in earnings as they are earned, the timing of related cash inflows may vary depending on the tax credit monetization method selected. As a result, cash receipts may not coincide with earnings recognition. 2026 Begin CO2 injection and operations during Q1’27 Apr May Jun Jul Aug Sep Oct Nov Dec Q1 2027 Construction/ commissioning Class VI permit expected later in 2026 Permit review/ development activities underway
Appendix

Focused on Driving Shareholder Returns MARK BEHRMAN Chairman & Chief Executive Officer CHERYL MAGUIRE EVP, Chief Financial Officer SCOTT BEMIS EVP, Manufacturing DAMIEN RENWICK EVP, Chief Commercial Officer Experienced Management Team MICHAEL FOSTER EVP, General Counsel & Secretary KRISTY CARVER SVP, Treasurer ASHLEY MCKEE EVP, Chief Human Resources Officer
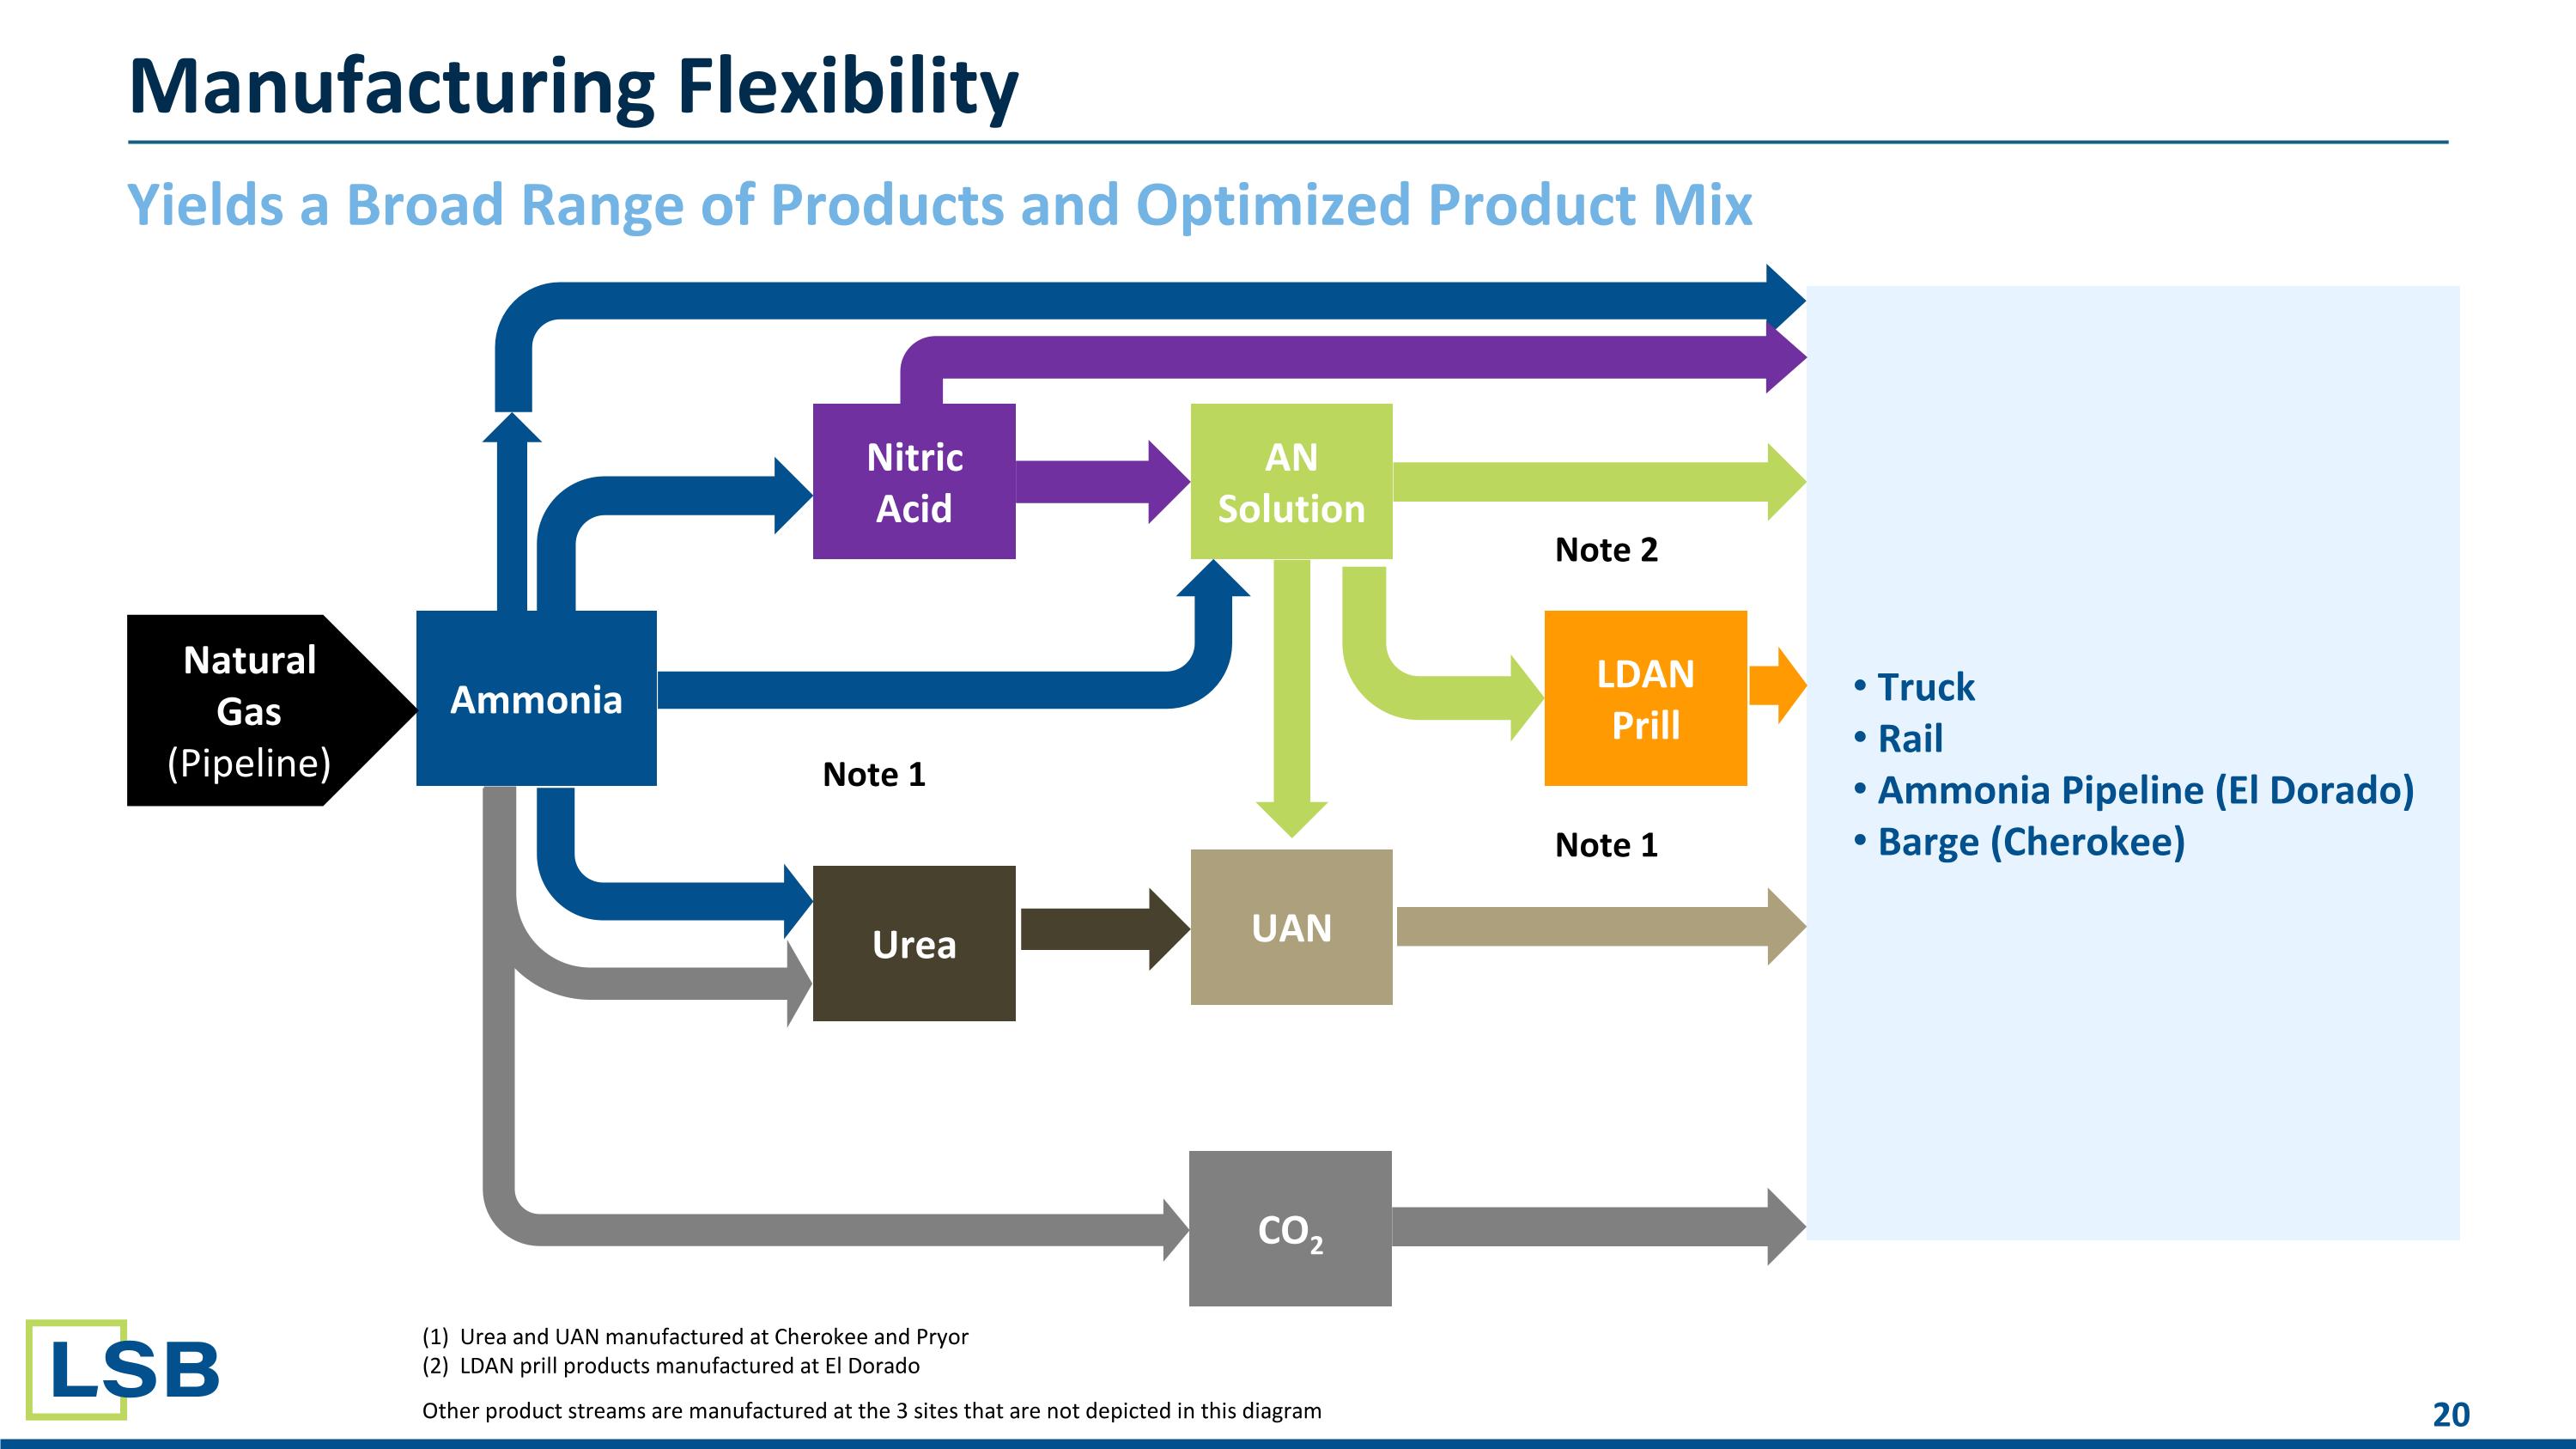
Yields a Broad Range of Products and Optimized Product Mix Manufacturing Flexibility Truck Rail Ammonia Pipeline (El Dorado) Barge (Cherokee) Ammonia Urea Nitric Acid AN Solution UAN LDAN Prill CO2 Note 1 Note 2 Note 1 Natural Gas (Pipeline) (1) Urea and UAN manufactured at Cherokee and Pryor (2) LDAN prill products manufactured at El Dorado Other product streams are manufactured at the 3 sites that are not depicted in this diagram
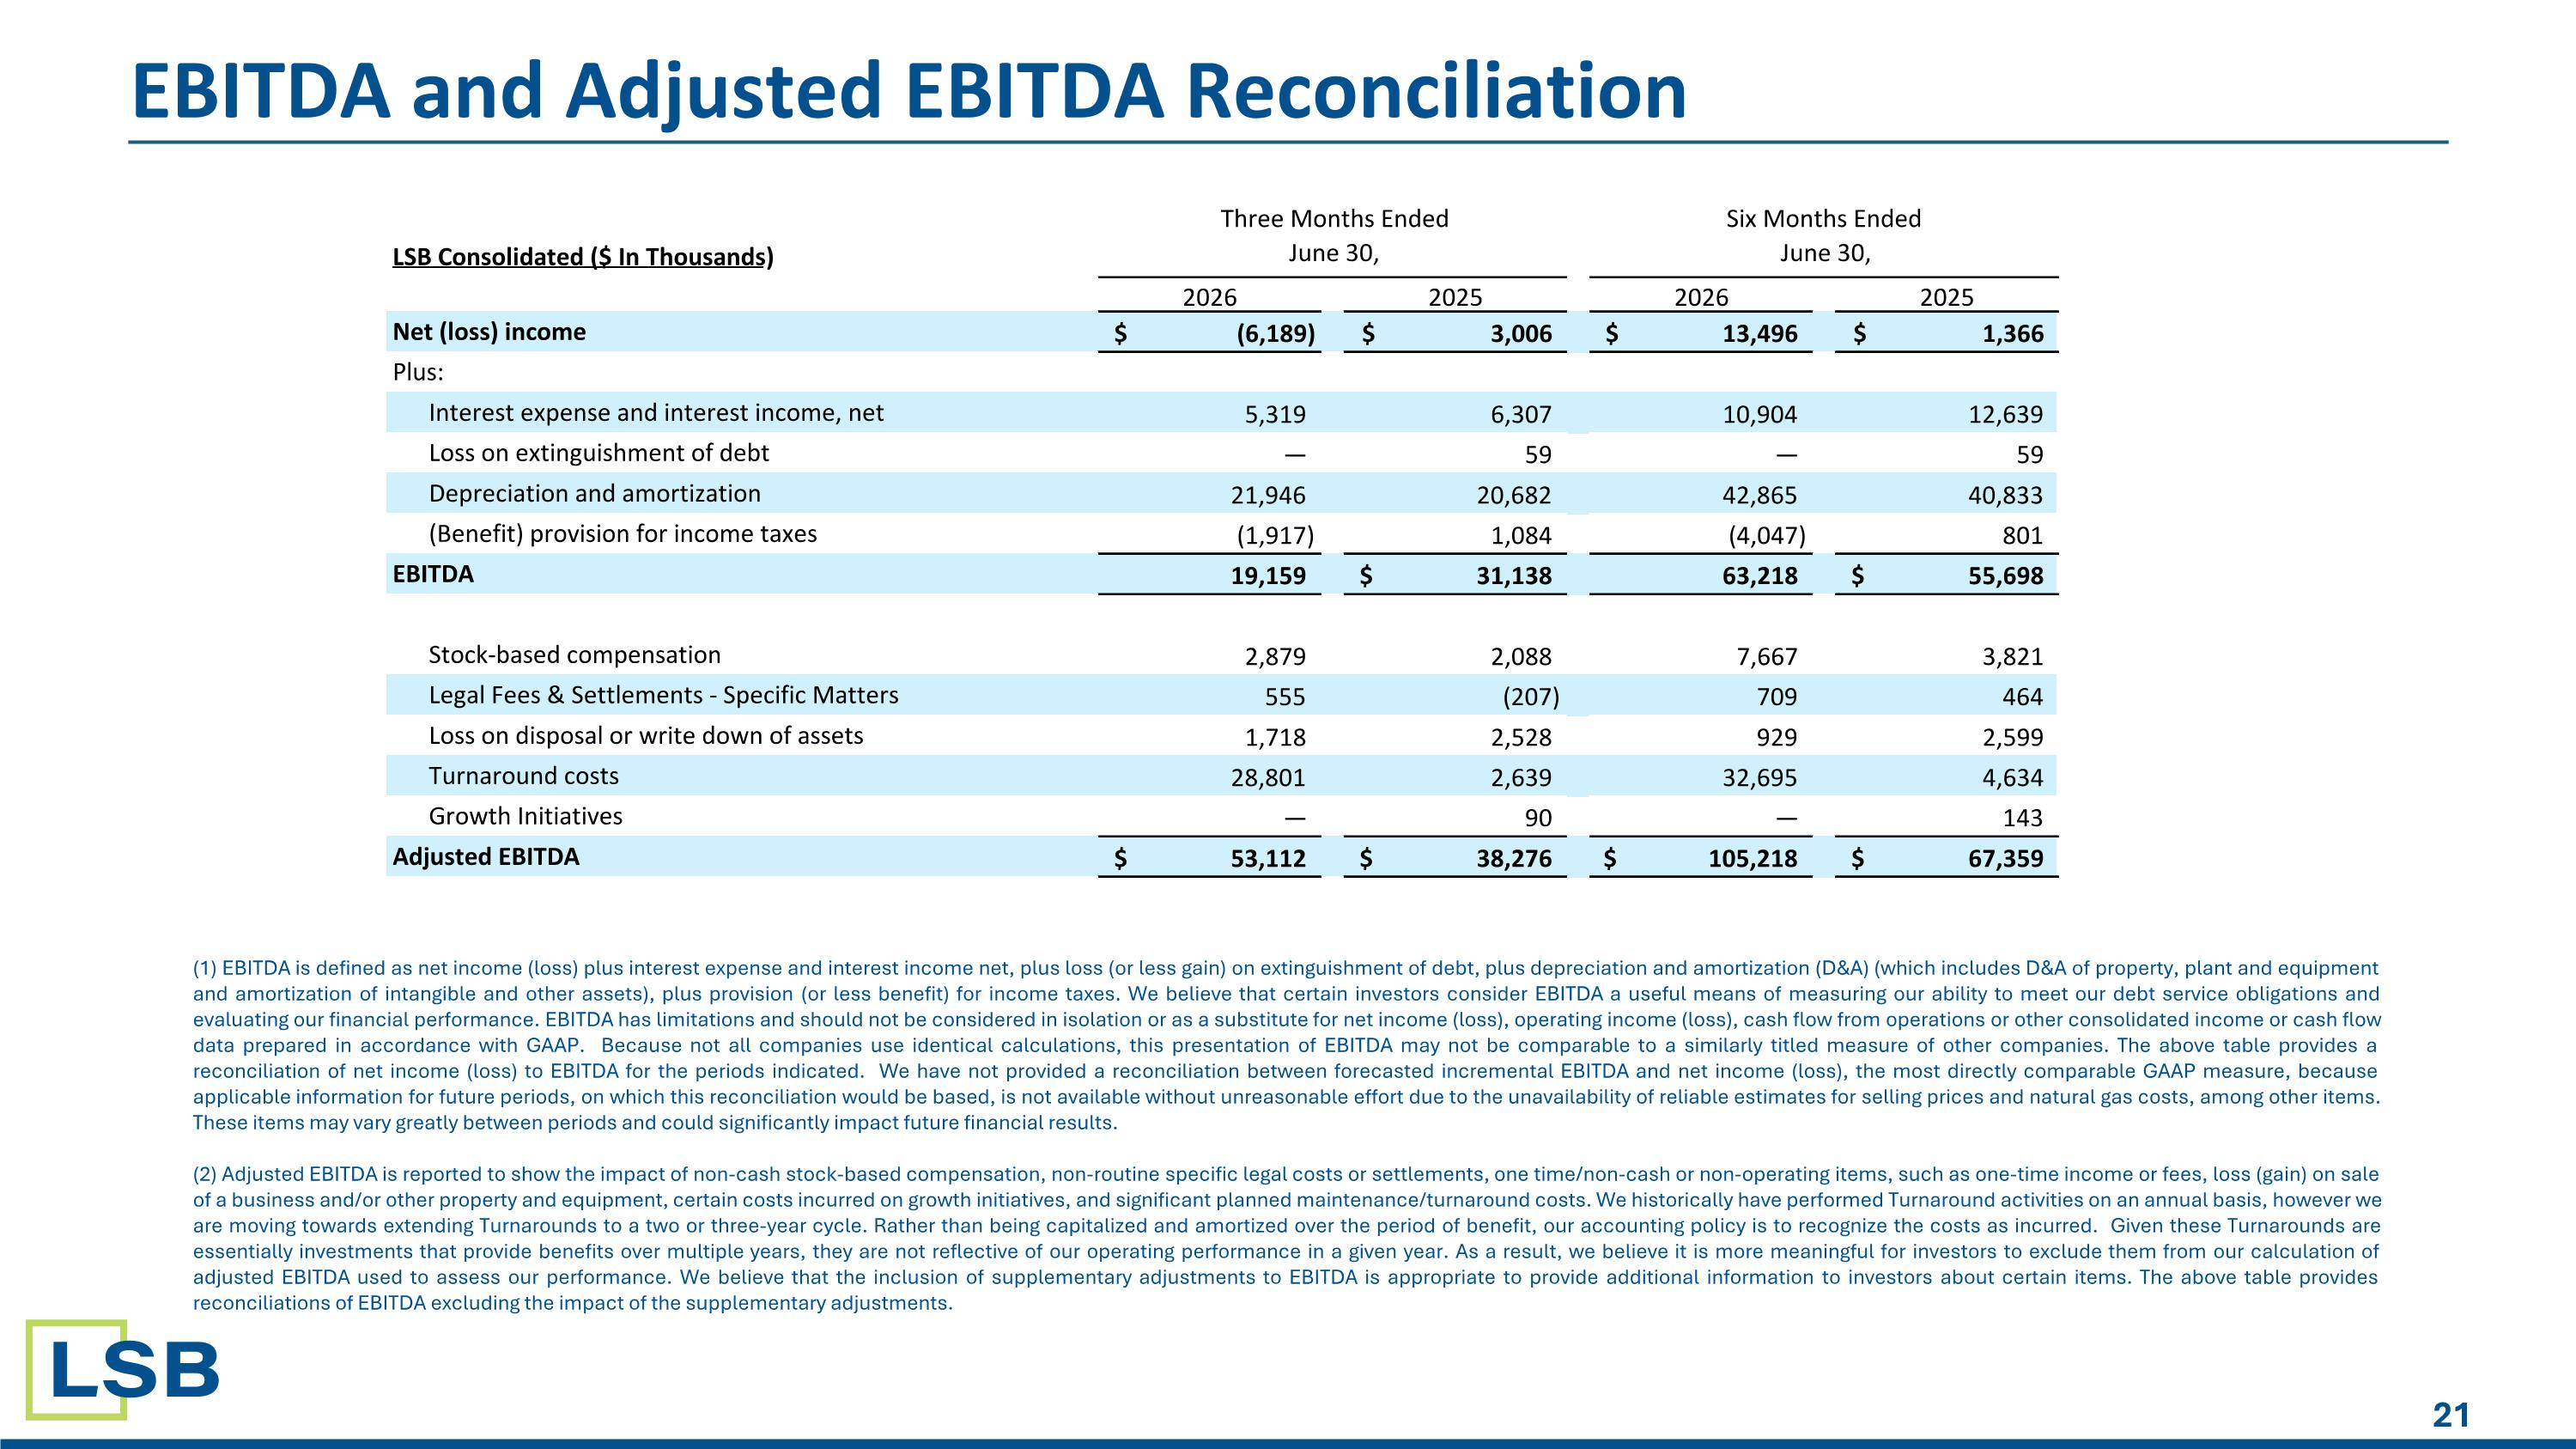
EBITDA and Adjusted EBITDA Reconciliation (1) EBITDA is defined as net income (loss) plus interest expense and interest income net, plus loss (or less gain) on extinguishment of debt, plus depreciation and amortization (D&A) (which includes D&A of property, plant and equipment and amortization of intangible and other assets), plus provision (or less benefit) for income taxes. We believe that certain investors consider EBITDA a useful means of measuring our ability to meet our debt service obligations and evaluating our financial performance. EBITDA has limitations and should not be considered in isolation or as a substitute for net income (loss), operating income (loss), cash flow from operations or other consolidated income or cash flow data prepared in accordance with GAAP. Because not all companies use identical calculations, this presentation of EBITDA may not be comparable to a similarly titled measure of other companies. The above table provides a reconciliation of net income (loss) to EBITDA for the periods indicated. We have not provided a reconciliation between forecasted incremental EBITDA and net income (loss), the most directly comparable GAAP measure, because applicable information for future periods, on which this reconciliation would be based, is not available without unreasonable effort due to the unavailability of reliable estimates for selling prices and natural gas costs, among other items. These items may vary greatly between periods and could significantly impact future financial results. (2) Adjusted EBITDA is reported to show the impact of non-cash stock-based compensation, non-routine specific legal costs or settlements, one time/non-cash or non-operating items, such as one-time income or fees, loss (gain) on sale of a business and/or other property and equipment, certain costs incurred on growth initiatives, and significant planned maintenance/turnaround costs. We historically have performed Turnaround activities on an annual basis, however we are moving towards extending Turnarounds to a two or three-year cycle. Rather than being capitalized and amortized over the period of benefit, our accounting policy is to recognize the costs as incurred. Given these Turnarounds are essentially investments that provide benefits over multiple years, they are not reflective of our operating performance in a given year. As a result, we believe it is more meaningful for investors to exclude them from our calculation of adjusted EBITDA used to assess our performance. We believe that the inclusion of supplementary adjustments to EBITDA is appropriate to provide additional information to investors about certain items. The above table provides reconciliations of EBITDA excluding the impact of the supplementary adjustments. LSB Consolidated ($ In Thousands) 2026 2025 2026 2025 Net (loss) income (6,189) $ 3,006 $ 13,496 $ 1,366 $ Plus: Interest expense and interest income, net 5,319 6,307 10,904 12,639 Loss on extinguishment of debt — 59 — 59 Depreciation and amortization 21,946 20,682 42,865 40,833 (Benefit) provision for income taxes (1,917) 1,084 (4,047) 801 EBITDA 19,159 31,138 $ 63,218 55,698 $ Stock-based compensation 2,879 2,088 7,667 3,821 Legal Fees & Settlements - Specific Matters 555 (207) 709 464 Loss on disposal or write down of assets 1,718 2,528 929 2,599 Turnaround costs 28,801 2,639 32,695 4,634 Growth Initiatives — 90 — 143 Adjusted EBITDA 53,112 $ 38,276 $ 105,218 $ 67,359 $ Three Months Ended June 30, Six Months Ended June 30,
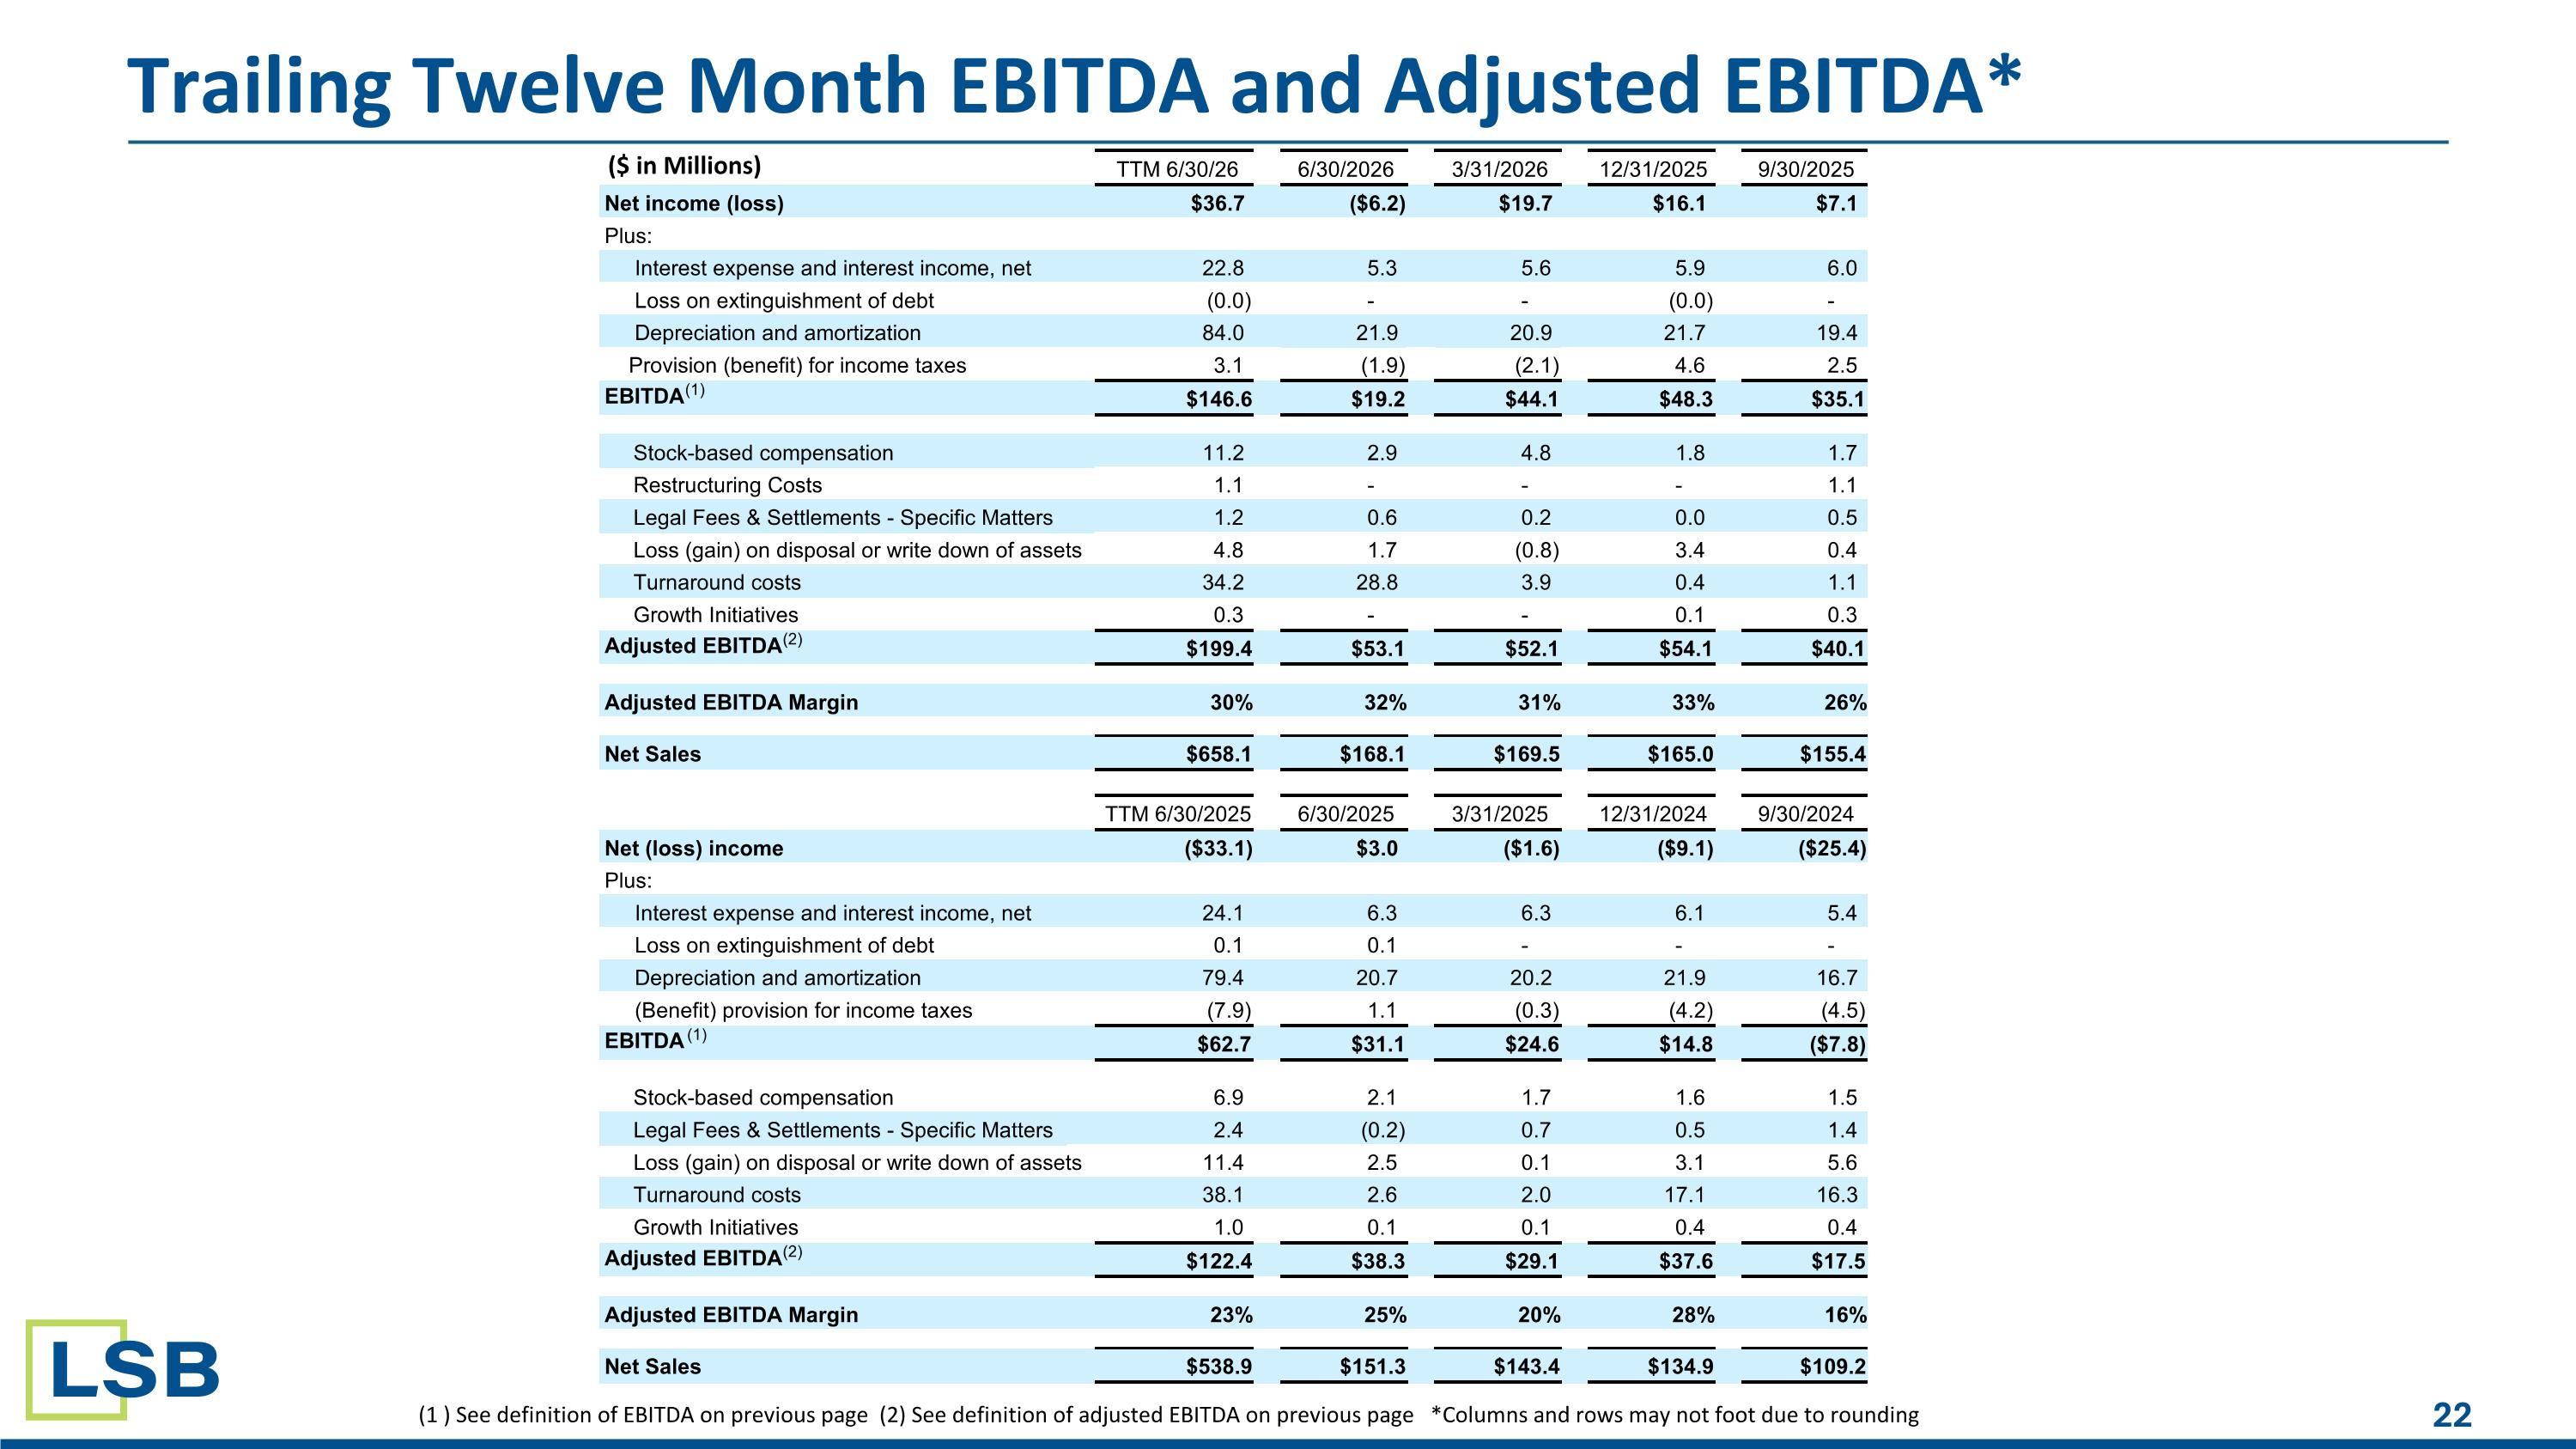
Trailing Twelve Month EBITDA and Adjusted EBITDA* (1 ) See definition of EBITDA on previous page (2) See definition of adjusted EBITDA on previous page *Columns and rows may not foot due to rounding TTM 6/30/26 6/30/2026 3/31/2026 12/31/2025 9/30/2025 Net income (loss) $36.7 ($6.2) $19.7 $16.1 $7.1 Plus: Interest expense and interest income, net 22.8 5.3 5.6 5.9 6.0 Loss on extinguishment of debt (0.0) - - (0.0) - Depreciation and amortization 84.0 21.9 20.9 21.7 19.4 Provision (benefit) for income taxes 3.1 (1.9) (2.1) 4.6 2.5 EBITDA (1) $146.6 $19.2 $44.1 $48.3 $35.1 Stock-based compensation 11.2 2.9 4.8 1.8 1.7 Restructuring Costs 1.1 - - - 1.1 Legal Fees & Settlements - Specific Matters 1.2 0.6 0.2 0.0 0.5 Loss (gain) on disposal or write down of assets 4.8 1.7 (0.8) 3.4 0.4 Turnaround costs 34.2 28.8 3.9 0.4 1.1 Growth Initiatives 0.3 - - 0.1 0.3 Adjusted EBITDA (2) $199.4 $53.1 $52.1 $54.1 $40.1 Adjusted EBITDA Margin 30% 32% 31% 33% 26% Net Sales $658.1 $168.1 $169.5 $165.0 $155.4 TTM 6/30/2025 6/30/2025 3/31/2025 12/31/2024 9/30/2024 Net (loss) income ($33.1) $3.0 ($1.6) ($9.1) ($25.4) Plus: Interest expense and interest income, net 24.1 6.3 6.3 6.1 5.4 Loss on extinguishment of debt 0.1 0.1 - - - Depreciation and amortization 79.4 20.7 20.2 21.9 16.7 (Benefit) provision for income taxes (7.9) 1.1 (0.3) (4.2) (4.5) EBITDA (1) $62.7 $31.1 $24.6 $14.8 ($7.8) Stock-based compensation 6.9 2.1 1.7 1.6 1.5 Legal Fees & Settlements - Specific Matters 2.4 (0.2) 0.7 0.5 1.4 Loss (gain) on disposal or write down of assets 11.4 2.5 0.1 3.1 5.6 Turnaround costs 38.1 2.6 2.0 17.1 16.3 Growth Initiatives 1.0 0.1 0.1 0.4 0.4 Adjusted EBITDA (2) $122.4 $38.3 $29.1 $37.6 $17.5 Adjusted EBITDA Margin 23% 25% 20% 28% 16% Net Sales $538.9 $151.3 $143.4 $134.9 $109.2 ($ in Millions)
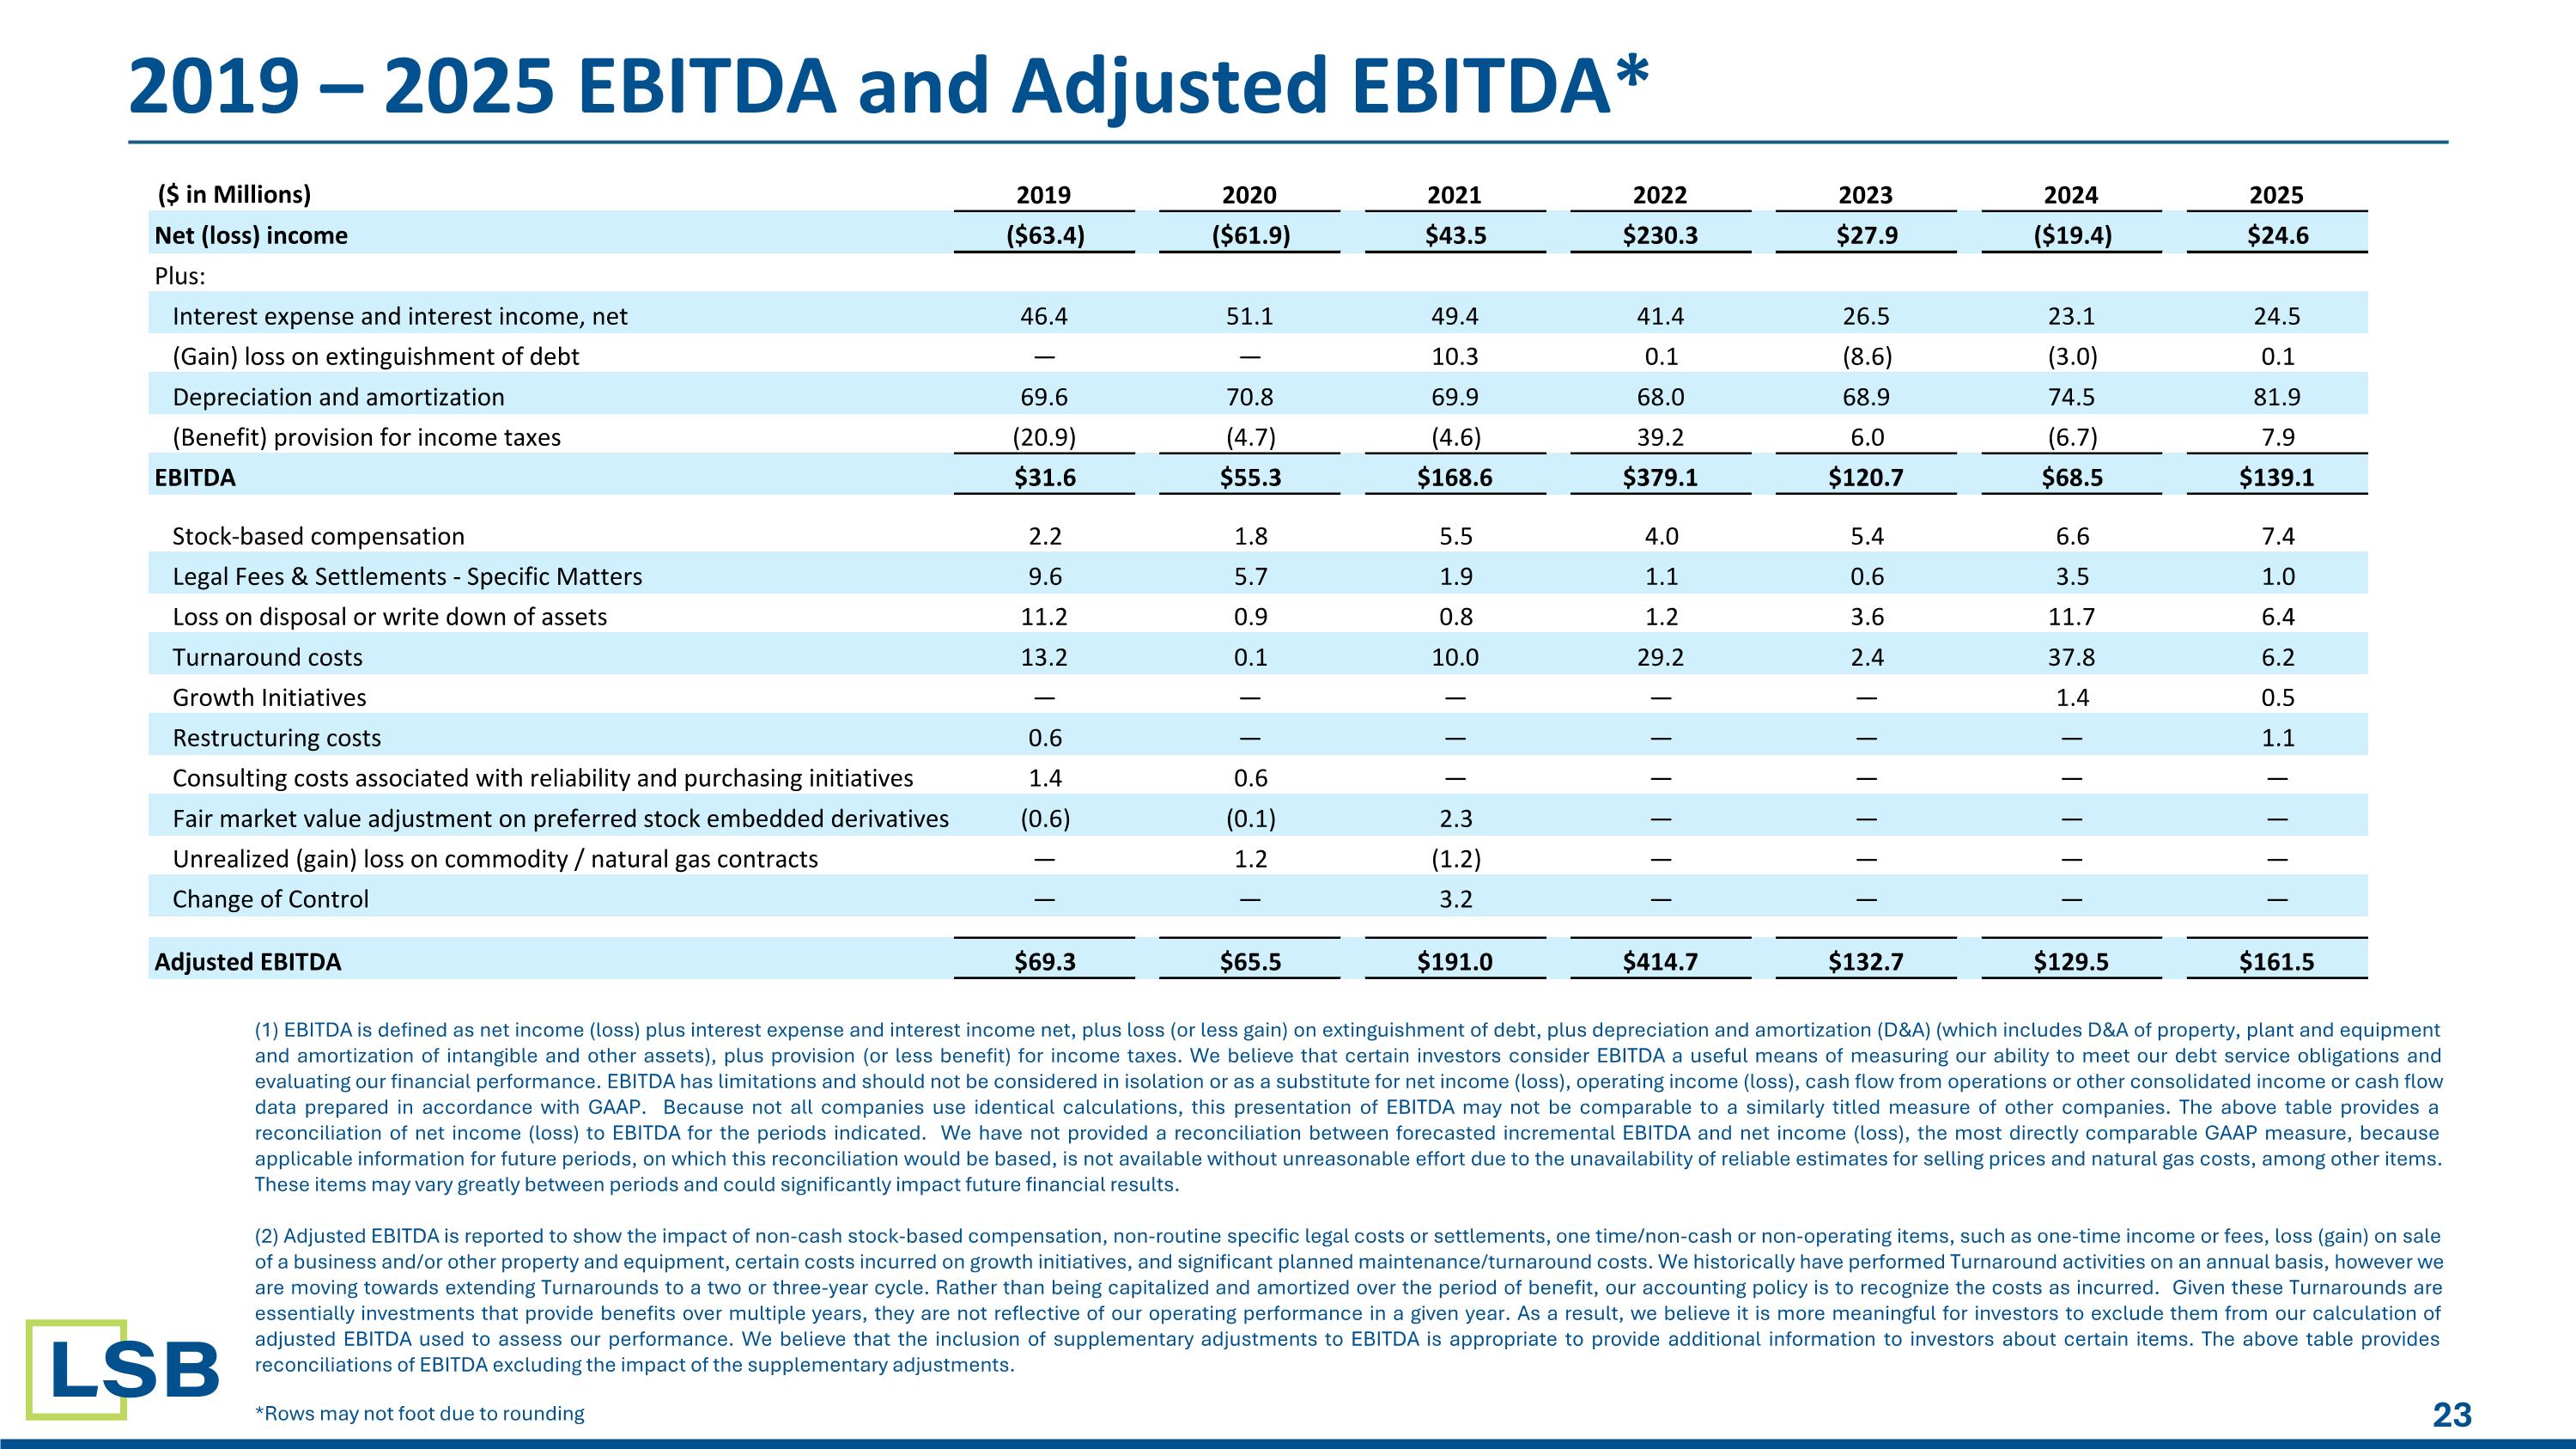
2019 – 2025 EBITDA and Adjusted EBITDA* (1) EBITDA is defined as net income (loss) plus interest expense and interest income net, plus loss (or less gain) on extinguishment of debt, plus depreciation and amortization (D&A) (which includes D&A of property, plant and equipment and amortization of intangible and other assets), plus provision (or less benefit) for income taxes. We believe that certain investors consider EBITDA a useful means of measuring our ability to meet our debt service obligations and evaluating our financial performance. EBITDA has limitations and should not be considered in isolation or as a substitute for net income (loss), operating income (loss), cash flow from operations or other consolidated income or cash flow data prepared in accordance with GAAP. Because not all companies use identical calculations, this presentation of EBITDA may not be comparable to a similarly titled measure of other companies. The above table provides a reconciliation of net income (loss) to EBITDA for the periods indicated. We have not provided a reconciliation between forecasted incremental EBITDA and net income (loss), the most directly comparable GAAP measure, because applicable information for future periods, on which this reconciliation would be based, is not available without unreasonable effort due to the unavailability of reliable estimates for selling prices and natural gas costs, among other items. These items may vary greatly between periods and could significantly impact future financial results. (2) Adjusted EBITDA is reported to show the impact of non-cash stock-based compensation, non-routine specific legal costs or settlements, one time/non-cash or non-operating items, such as one-time income or fees, loss (gain) on sale of a business and/or other property and equipment, certain costs incurred on growth initiatives, and significant planned maintenance/turnaround costs. We historically have performed Turnaround activities on an annual basis, however we are moving towards extending Turnarounds to a two or three-year cycle. Rather than being capitalized and amortized over the period of benefit, our accounting policy is to recognize the costs as incurred. Given these Turnarounds are essentially investments that provide benefits over multiple years, they are not reflective of our operating performance in a given year. As a result, we believe it is more meaningful for investors to exclude them from our calculation of adjusted EBITDA used to assess our performance. We believe that the inclusion of supplementary adjustments to EBITDA is appropriate to provide additional information to investors about certain items. The above table provides reconciliations of EBITDA excluding the impact of the supplementary adjustments. *Rows may not foot due to rounding ($ in Millions) 2019 2020 2021 2022 2023 2024 2025 Net (loss) income ($63.4) ($61.9) $43.5 $230.3 $27.9 ($19.4) $24.6 Plus: Interest expense and interest income, net 46.4 51.1 49.4 41.4 26.5 23.1 24.5 (Gain) loss on extinguishment of debt — — 10.3 0.1 (8.6) (3.0) 0.1 Depreciation and amortization 69.6 70.8 69.9 68.0 68.9 74.5 81.9 (Benefit) provision for income taxes (20.9) (4.7) (4.6) 39.2 6.0 (6.7) 7.9 EBITDA $31.6 $55.3 $168.6 $379.1 $120.7 $68.5 $139.1 Stock-based compensation 2.2 1.8 5.5 4.0 5.4 6.6 7.4 Legal Fees & Settlements - Specific Matters 9.6 5.7 1.9 1.1 0.6 3.5 1.0 Loss on disposal or write down of assets 11.2 0.9 0.8 1.2 3.6 11.7 6.4 Turnaround costs 13.2 0.1 10.0 29.2 2.4 37.8 6.2 Growth Initiatives — — — — — 1.4 0.5 Restructuring costs 0.6 — — — — — 1.1 Consulting costs associated with reliability and purchasing initiatives 1.4 0.6 — — — — — Fair market value adjustment on preferred stock embedded derivatives (0.6) (0.1) 2.3 — — — — Unrealized (gain) loss on commodity / natural gas contracts — 1.2 (1.2) — — — — Change of Control — — 3.2 — — — — Adjusted EBITDA $69.3 $65.5 $191.0 $414.7 $132.7 $129.5 $161.5