Se pt em be r 2 02 6 FOREST SPRINGS – GRASS VALLEY, CA Sun Communities, Inc. (NYSE: SUI) Investor Presentation
Cautionary Statement Regarding Forward-Looking Statements 2 This presentation has been prepared for informational purposes only from information supplied by Sun Communities, Inc., referred to herein as “we,” “our,” “Sun,” and “the Company,” and from third-party sources indicated herein. Such third-party information has not been independently verified. Sun makes no representation or warranty, expressed or implied, as to the accuracy or completeness of such information. This presentation contains various “forward-looking statements” within the meaning of the United States Securities Act of 1933, as amended (the "Securities Act"), and the Securities Exchange Act of 1934, as amended (the "Exchange Act"), and the Company intends that such forward-looking statements will be subject to the safe harbors created thereby. For this purpose, any statements contained in this document that relate to expectations, beliefs, projections, future plans and strategies, trends or prospective events or developments, and similar expressions concerning matters that are not historical facts are deemed to be forward-looking statements. Words such as "forecasts," "intend," "goal," "estimate," "expect," "project," "projections," "plans," "predicts," "potential," "seeks," "anticipates," "should," "could,“ "may," "will," "designed to," "foreseeable future," "believe," "scheduled," "guidance," "target," and similar expressions are intended to identify forward-looking statements, although not all forward-looking statements contain these words. These forward-looking statements reflect the Company's current views with respect to future events and financial performance, but involve known and unknown risks, uncertainties and other factors, both general and specific to the matters discussed in this document, some of which are beyond the Company's control. These risks, uncertainties and other factors may cause the Company's actual results to be materially different from any future results expressed or implied by such forward-looking statements. In addition to the risks disclosed under "Risk Factors" in our 2025 Annual Report, in Item 8.01 of our Current Report on Form 8-K filed May 21, 2026, in the Company’s Quarterly Report on Form 10-Q for the quarter ended June 30, 2026, and in our other filings with the SEC from time to time, including our Quarterly Reports on Form 10-Q, such risks, uncertainties and other factors include, but are not limited to: The ability of the Company to complete the proposed sale of Park Holidays (the “UK Sale”) on a timely basis or at all; Risks that the proposed UK Sale disrupts current plans and operations; The impacts of the announcement or consummation of the proposed UK Sale on business relationships; The anticipated cost related to the proposed UK Sale; The ability for the Company to realize the anticipated benefits of the proposed UK Sale; The Company's liquidity and refinancing demands; The Company's ability to obtain or refinance maturing debt; The Company's ability to maintain compliance with covenants contained in its debt facilities and its unsecured notes; Availability of capital; General volatility of the capital markets and the market price of shares of the Company's capital stock; Increases in interest rates and operating costs, including insurance premiums, real estate taxes, and utilities; Difficulties in the Company's ability to evaluate, finance, complete, and integrate acquisitions, developments, and expansions successfully; Competitive market forces; The ability of purchasers of manufactured homes to obtain financing; The level of repossessions of manufactured homes; The Company's ability to maintain effective internal control over financial reporting and disclosure controls and procedures; Expectations regarding the amount or frequency of impairment losses; Changes in general economic conditions, including inflation, deflation, energy costs, the real estate industry, the effects of tariffs or threats of tariffs, wars or other international conflicts, trade wars, immigration issues, supply chain disruptions, and the markets within which the Company operates; Changes in foreign currency exchange rates, including between the U.S. dollar and each of the British pound sterling, Canadian dollar, and Australian dollar; The Company’s ability to maintain its status as a REIT; Changes in real estate and zoning laws and regulations; The Company's ability to maintain rental rates and occupancy levels; Legislative or regulatory changes, including changes to laws governing the taxation of REITs; Outbreaks of disease and related restrictions on business operations; Risks related to natural disasters such as hurricanes, earthquakes, floods, droughts, and wildfires; and Litigation, judgments or settlements, including costs associated with prosecuting or defending claims and any adverse outcomes. Readers are cautioned not to place undue reliance on these forward-looking statements, which speak only as of the date the statement was made. The Company undertakes no obligation to publicly update or revise any forward-looking statements included in this presentation, whether as a result of new information, future events, changes in the Company’s expectations or otherwise, except as required by law. Although the Company believes that the expectations reflected in the forward-looking statements are reasonable, the Company cannot guarantee future results, levels of activity, performance or achievements. All written and oral forward-looking statements attributable to the Company or persons acting on the Company’s behalf are qualified in their entirety by these cautionary statements. CAUTIONARY STATEMENT REGARDING GUIDANCE This presentation includes certain estimates and assumptions included in the Company’s financial, earnings and operational guidance, as presented in its earnings press release and supplemental operating and financial data dated July 27, 2026. These estimates and assumptions represent a range of possible outcomes and may differ materially from actual results. These estimates include contributions from all acquisitions, dispositions and capital markets activity completed through July 27, 2026. These estimates exclude all other prospective acquisitions, dispositions and capital markets activity. These estimates and assumptions are forward-looking based on the Company’s assessment of economic and market conditions and the Company’s assumptions as of the date guidance was issued and are subject to the other risks outlined above under the caption Cautionary Statement Regarding Forward-Looking Statements.
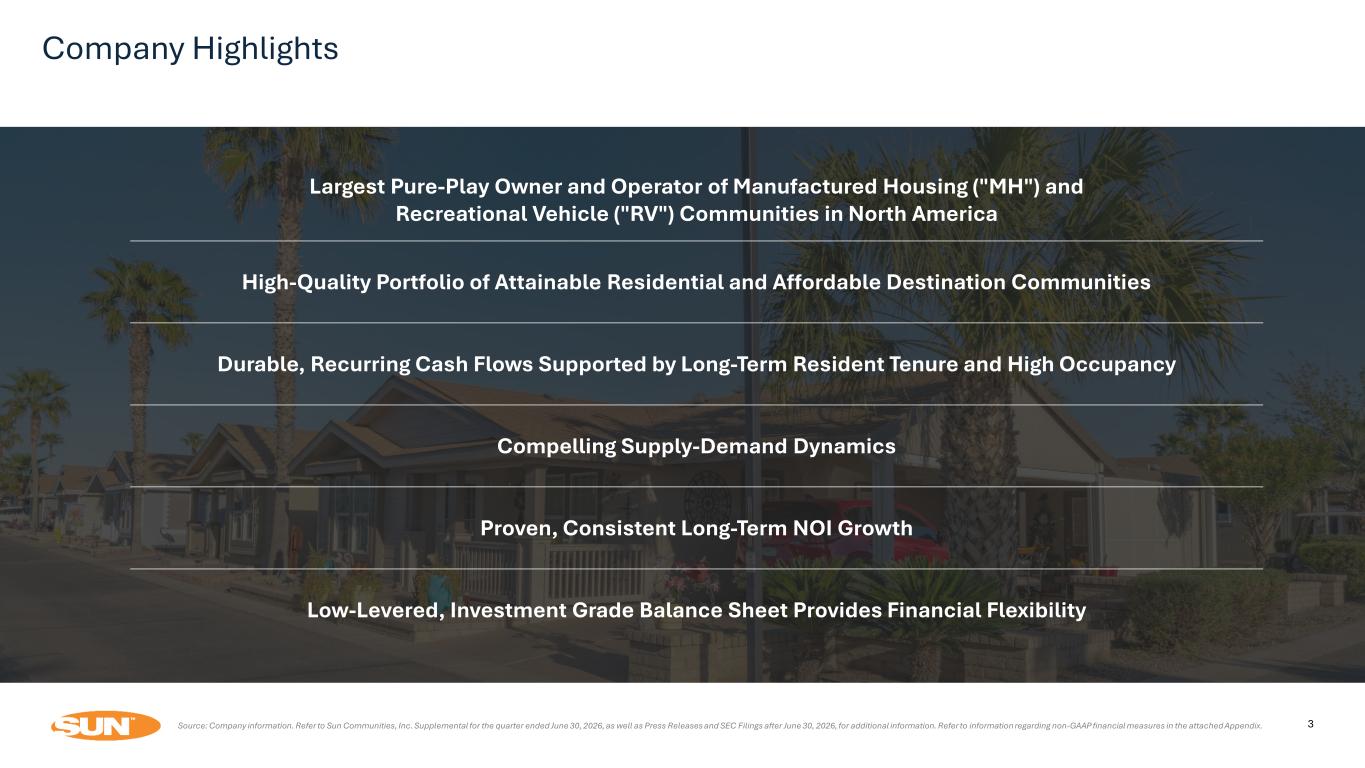
3 Largest Pure-Play Owner and Operator of Manufactured Housing ("MH") and Recreational Vehicle ("RV") Communities in North America High-Quality Portfolio of Attainable Residential and Affordable Destination Communities Durable, Recurring Cash Flows Supported by Long-Term Resident Tenure and High Occupancy Compelling Supply-Demand Dynamics Proven, Consistent Long-Term NOI Growth Low-Levered, Investment Grade Balance Sheet Provides Financial Flexibility Company Highlights Source: Company information. Refer to Sun Communities, Inc. Supplemental for the quarter ended June 30, 2026, as well as Press Releases and SEC Filings after June 30, 2026, for additional information. Refer to information regarding non-GAAP financial measures in the attached Appendix.
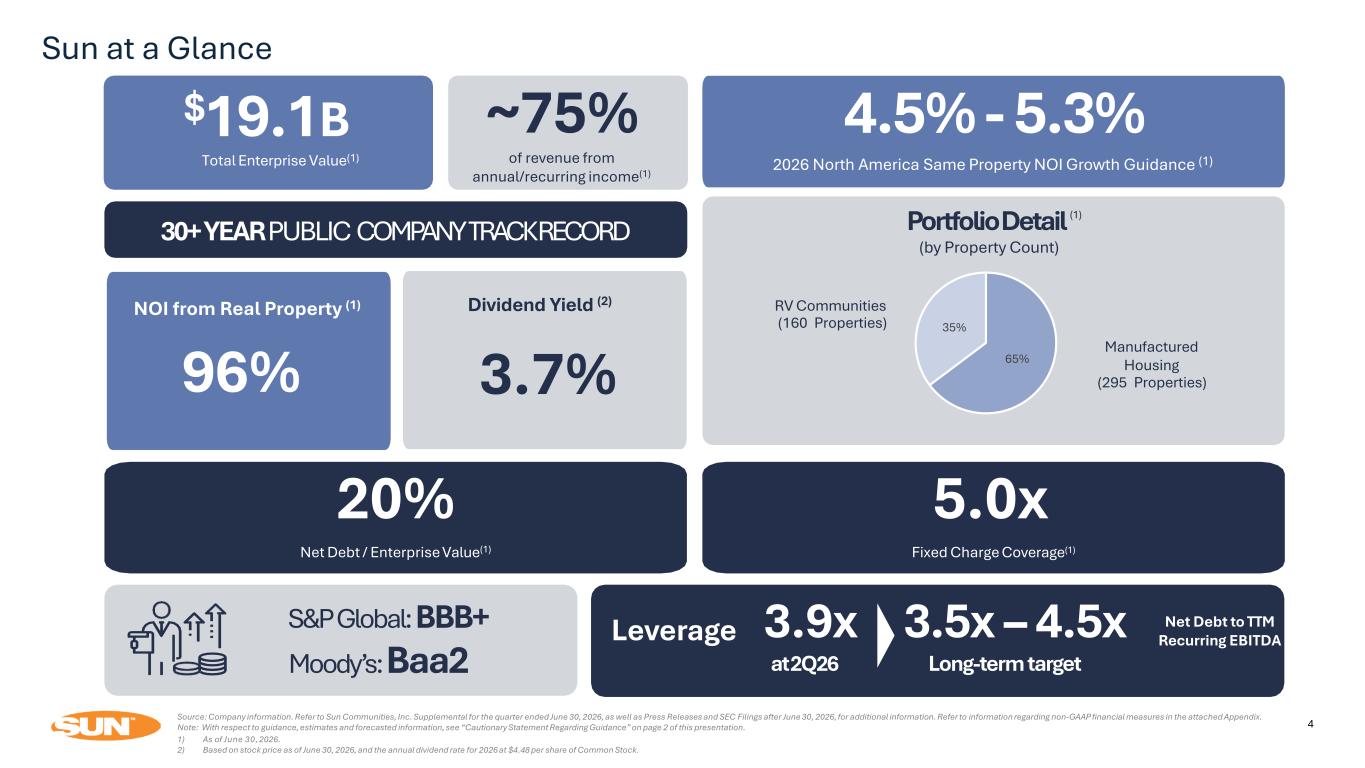
Sun at a Glance 4 Strategic Focus High Quality Earnings Profile Financial Flexibility Manufactured Housing (295 Properties) RV Communities (160 Properties) $19.1B Total Enterprise Value(1) Dividend Yield (2) 30+ YEAR PUBLIC COMPANY TRACK RECORD PortfolioDetail (1) (by Property Count) ~75% Leverage 20% Net Debt / Enterprise Value(1) 5.0x Fixed Charge Coverage(1) Net Debt to TTM Recurring EBITDA 2026 North America Same Property NOI Growth Guidance (1) 4.5% - 5.3% 3.9x at2Q26 3.5x – 4.5x Long-term target S&P Global: BBB+ Moody’s: Baa2 65% 35% Source: Company information. Refer to Sun Communities, Inc. Supplemental for the quarter ended June 30, 2026, as well as Press Releases and SEC Filings after June 30, 2026, for additional information. Refer to information regarding non-GAAP financial measures in the attached Appendix. Note: With respect to guidance, estimates and forecasted information, see “Cautionary Statement Regarding Guidance” on page 2 of this presentation. 1) As of June 30, 2026. 2) Based on stock price as of June 30, 2026, and the annual dividend rate for 2026 at $4.48 per share of Common Stock. 3.7% NOI from Real Property (1) 96% of revenue from annual/recurring income(1)
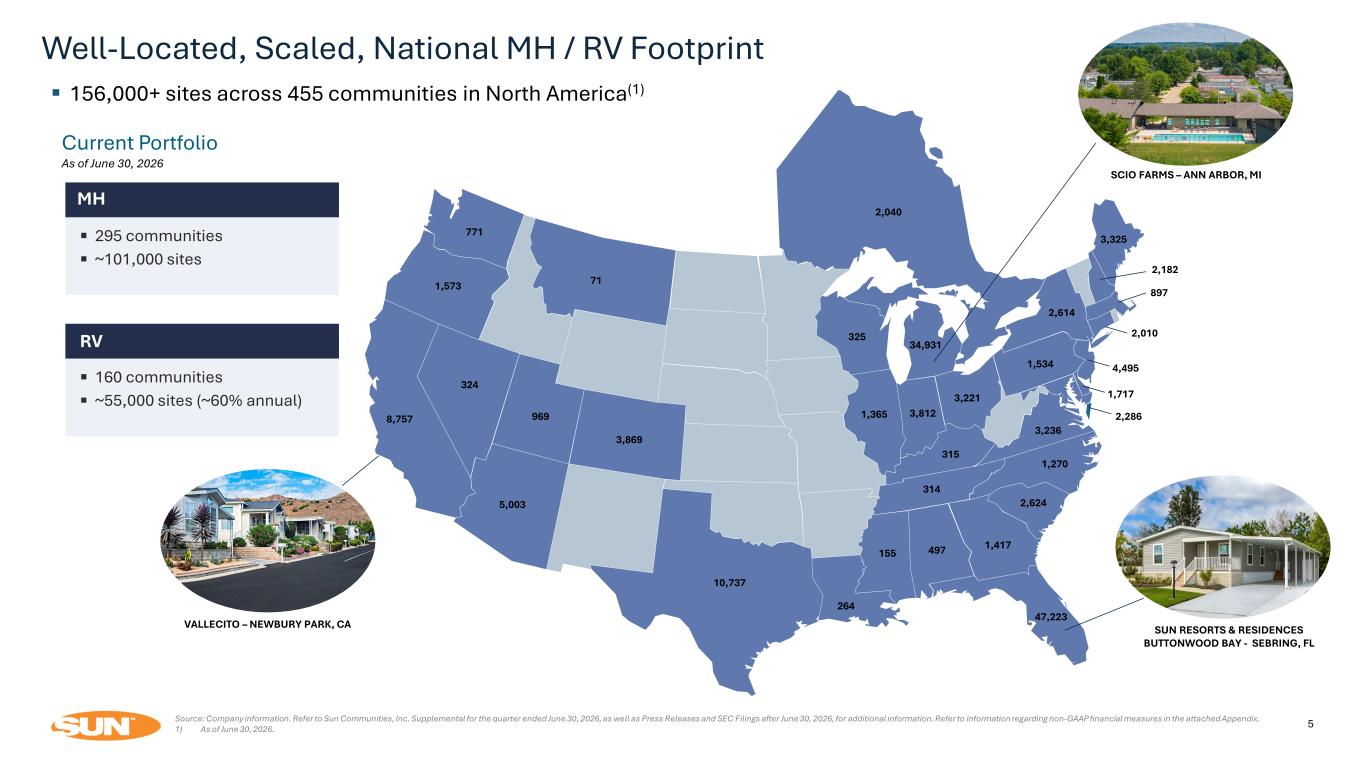
Well-Located, Scaled, National MH / RV Footprint Current Portfolio As of June 30, 2026 156,000+ sites across 455 communities in North America(1) 47,223 34,931 8,757 10,737 2,010 2,040 1,717 5,003 3,869 1,365 2,614 1,270 1,573 771 71 324 969 3,812 325 264 315 155 497 314 3,221 1,534 3,236 1,417 2,624 3,325 897 2,286 SUN RESORTS & RESIDENCES BUTTONWOOD BAY - SEBRING, FL SCIO FARMS – ANN ARBOR, MI VALLECITO – NEWBURY PARK, CA 2,182 4,495 MH 295 communities ~101,000 sites RV 160 communities ~55,000 sites (~60% annual) Source: Company information. Refer to Sun Communities, Inc. Supplemental for the quarter ended June 30, 2026, as well as Press Releases and SEC Filings after June 30, 2026, for additional information. Refer to information regarding non-GAAP financial measures in the attached Appendix. 1) As of June 30, 2026. 5
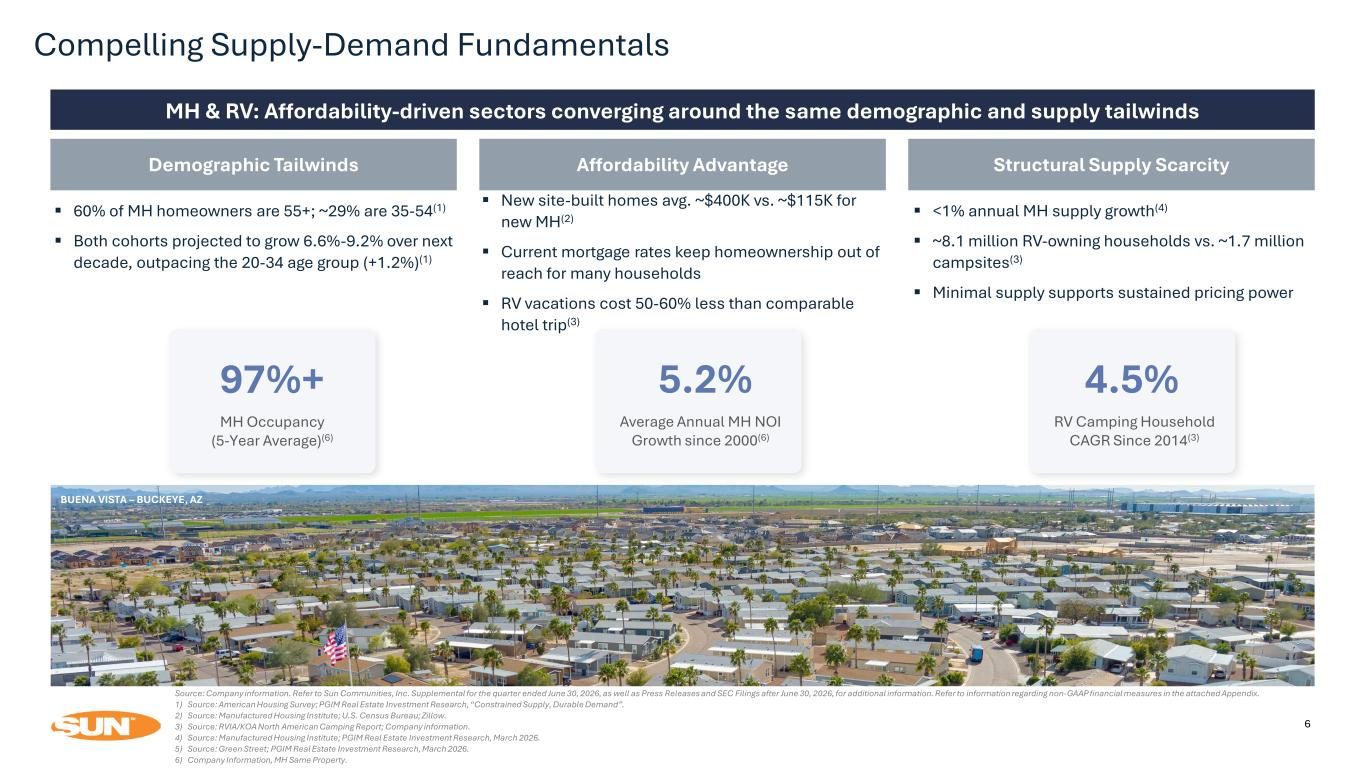
Compelling Supply-Demand Fundamentals 6 MH & RV: Affordability-driven sectors converging around the same demographic and supply tailwinds Demographic Tailwinds 60% of MH homeowners are 55+; ~29% are 35-54(1) Both cohorts projected to grow 6.6%-9.2% over next decade, outpacing the 20-34 age group (+1.2%)(1) Affordability Advantage New site-built homes avg. ~$400K vs. ~$115K for new MH(2) Current mortgage rates keep homeownership out of reach for many households RV vacations cost 50-60% less than comparable hotel trip(3) Structural Supply Scarcity <1% annual MH supply growth(4) ~8.1 million RV-owning households vs. ~1.7 million campsites(3) Minimal supply supports sustained pricing power Source: Company information. Refer to Sun Communities, Inc. Supplemental for the quarter ended June 30, 2026, as well as Press Releases and SEC Filings after June 30, 2026, for additional information. Refer to information regarding non-GAAP financial measures in the attached Appendix. 1) Source: American Housing Survey; PGIM Real Estate Investment Research, “Constrained Supply, Durable Demand”. 2) Source: Manufactured Housing Institute; U.S. Census Bureau; Zillow. 3) Source: RVIA/KOA North American Camping Report; Company information. 4) Source: Manufactured Housing Institute; PGIM Real Estate Investment Research, March 2026. 5) Source: Green Street; PGIM Real Estate Investment Research, March 2026. 6) Company Information, MH Same Property. 97%+ MH Occupancy (5-Year Average)(6) 5.2% Average Annual MH NOI Growth since 2000(6) 4.5% RV Camping Household CAGR Since 2014(3) BUENA VISTA – BUCKEYE, AZ
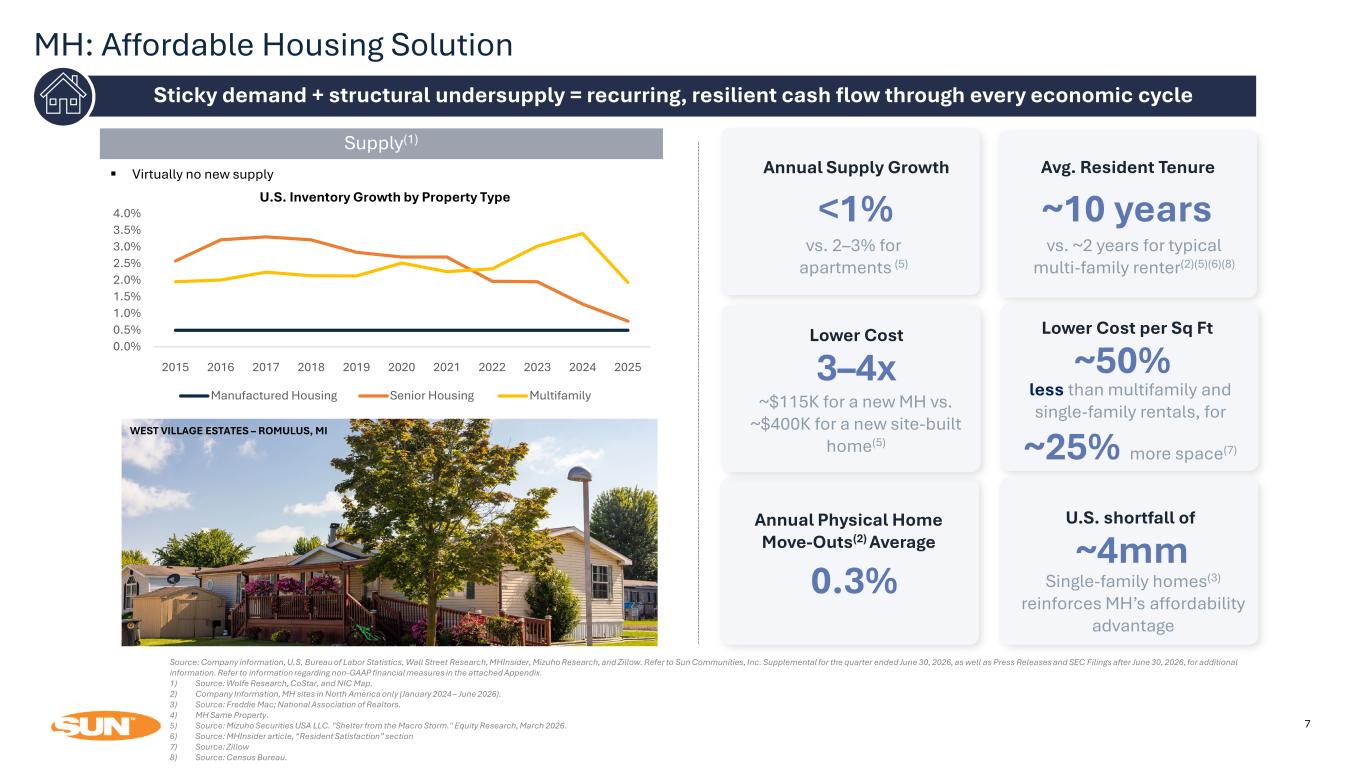
MH: Affordable Housing Solution 7 Sticky demand + structural undersupply = recurring, resilient cash flow through every economic cycle Source: Company information, U.S. Bureau of Labor Statistics, Wall Street Research, MHInsider, Mizuho Research, and Zillow. Refer to Sun Communities, Inc. Supplemental for the quarter ended June 30, 2026, as well as Press Releases and SEC Filings after June 30, 2026, for additional information. Refer to information regarding non-GAAP financial measures in the attached Appendix. 1) Source: Wolfe Research, CoStar, and NIC Map. 2) Company Information, MH sites in North America only (January 2024 – June 2026). 3) Source: Freddie Mac; National Association of Realtors. 4) MH Same Property. 5) Source: Mizuho Securities USA LLC. "Shelter from the Macro Storm." Equity Research, March 2026. 6) Source: MHInsider article, “Resident Satisfaction” section 7) Source: Zillow 8) Source: Census Bureau. Virtually no new supply Supply(1) 0.0% 0.5% 1.0% 1.5% 2.0% 2.5% 3.0% 3.5% 4.0% 2015 2016 2017 2018 2019 2020 2021 2022 2023 2024 2025 Manufactured Housing Senior Housing Multifamily U.S. Inventory Growth by Property Type Avg. Resident Tenure ~10 years vs. ~2 years for typical multi-family renter(2)(5)(6)(8) Annual Supply Growth <1% vs. 2–3% for apartments (5) WEST VILLAGE ESTATES – ROMULUS, MI Lower Cost per Sq Ft ~50% less than multifamily and single-family rentals, for ~25% more space(7) Annual Physical Home Move-Outs(2) Average 0.3% U.S. shortfall of ~4mm Single-family homes(3) reinforces MH’s affordability advantage Lower Cost 3–4x ~$115K for a new MH vs. ~$400K for a new site-built home(5)
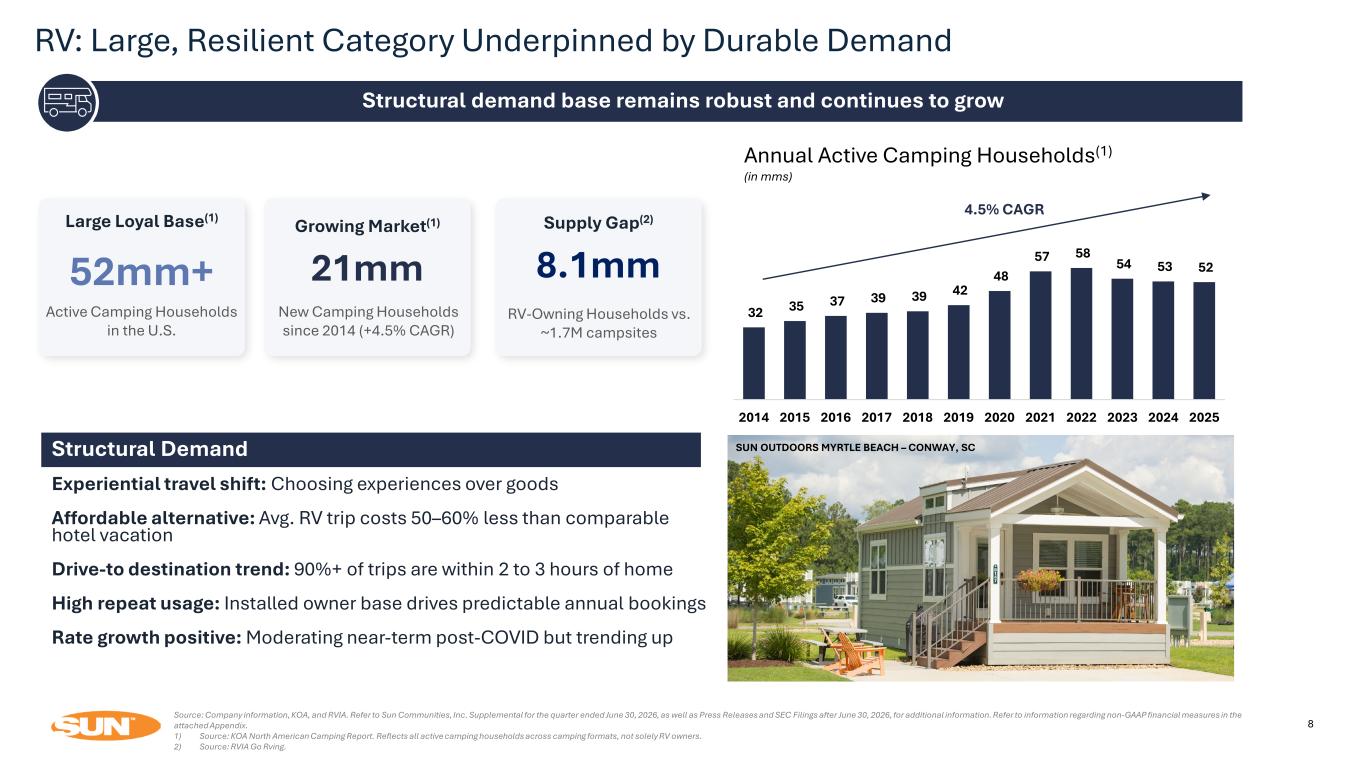
RV: Large, Resilient Category Underpinned by Durable Demand 8 Structural demand base remains robust and continues to grow Source: Company information, KOA, and RVIA. Refer to Sun Communities, Inc. Supplemental for the quarter ended June 30, 2026, as well as Press Releases and SEC Filings after June 30, 2026, for additional information. Refer to information regarding non-GAAP financial measures in the attached Appendix. 1) Source: KOA North American Camping Report. Reflects all active camping households across camping formats, not solely RV owners. 2) Source: RVIA Go Rving. Annual Active Camping Households(1) (in mms) 4.5% CAGR SUN OUTDOORS REHOBOTH BAY – MILLSBORO, DE 32 35 37 39 39 42 48 57 58 54 53 52 2014 2015 2016 2017 2018 2019 2020 2021 2022 2023 2024 2025 52mm+ 8.1mm21mm Supply Gap(2)Growing Market(1)Large Loyal Base(1) Active Camping Households in the U.S. RV-Owning Households vs. ~1.7M campsites New Camping Households since 2014 (+4.5% CAGR) SUN OUTDOORS MYRTLE BEACH – CONWAY, SCStructural Demand Experiential travel shift: Choosing experiences over goods Affordable alternative: Avg. RV trip costs 50–60% less than comparable hotel vacation Drive-to destination trend: 90%+ of trips are within 2 to 3 hours of home High repeat usage: Installed owner base drives predictable annual bookings Rate growth positive: Moderating near-term post-COVID but trending up
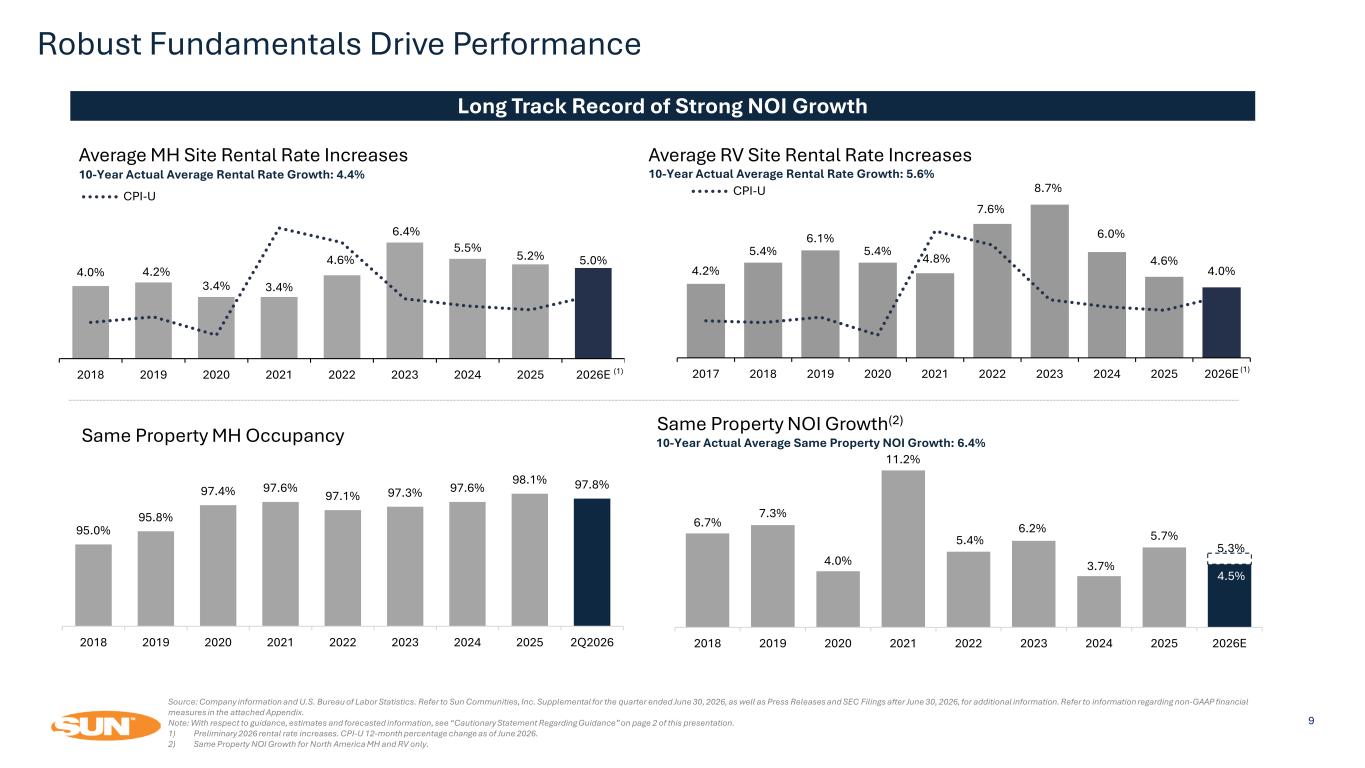
4.2% 5.4% 6.1% 5.4% 4.8% 7.6% 8.7% 6.0% 4.6% 4.0% 2017 2018 2019 2020 2021 2022 2023 2024 2025 2026E CPI-U 6.7% 7.3% 4.0% 11.2% 5.4% 6.2% 3.7% 5.7% 4.5% 2018 2019 2020 2021 2022 2023 2024 2025 2026E Robust Fundamentals Drive Performance 9 Long Track Record of Strong NOI Growth Average MH Site Rental Rate Increases Average RV Site Rental Rate Increases Same Property MH Occupancy Same Property NOI Growth(2) 10-Year Actual Average Same Property NOI Growth: 6.4% 10-Year Actual Average Rental Rate Growth: 4.4% 10-Year Actual Average Rental Rate Growth: 5.6% Source: Company information and U.S. Bureau of Labor Statistics. Refer to Sun Communities, Inc. Supplemental for the quarter ended June 30, 2026, as well as Press Releases and SEC Filings after June 30, 2026, for additional information. Refer to information regarding non-GAAP financial measures in the attached Appendix. Note: With respect to guidance, estimates and forecasted information, see “Cautionary Statement Regarding Guidance” on page 2 of this presentation. 1) Preliminary 2026 rental rate increases. CPI-U 12-month percentage change as of June 2026. 2) Same Property NOI Growth for North America MH and RV only. 5.3% (1) (1) 95.0% 95.8% 97.4% 97.6% 97.1% 97.3% 97.6% 98.1% 97.8% 2018 2019 2020 2021 2022 2023 2024 2025 2Q2026 4.0% 4.2% 3.4% 3.4% 4.6% 6.4% 5.5% 5.2% 5.0% 2018 2019 2020 2021 2022 2023 2024 2025 2026E CPI-U
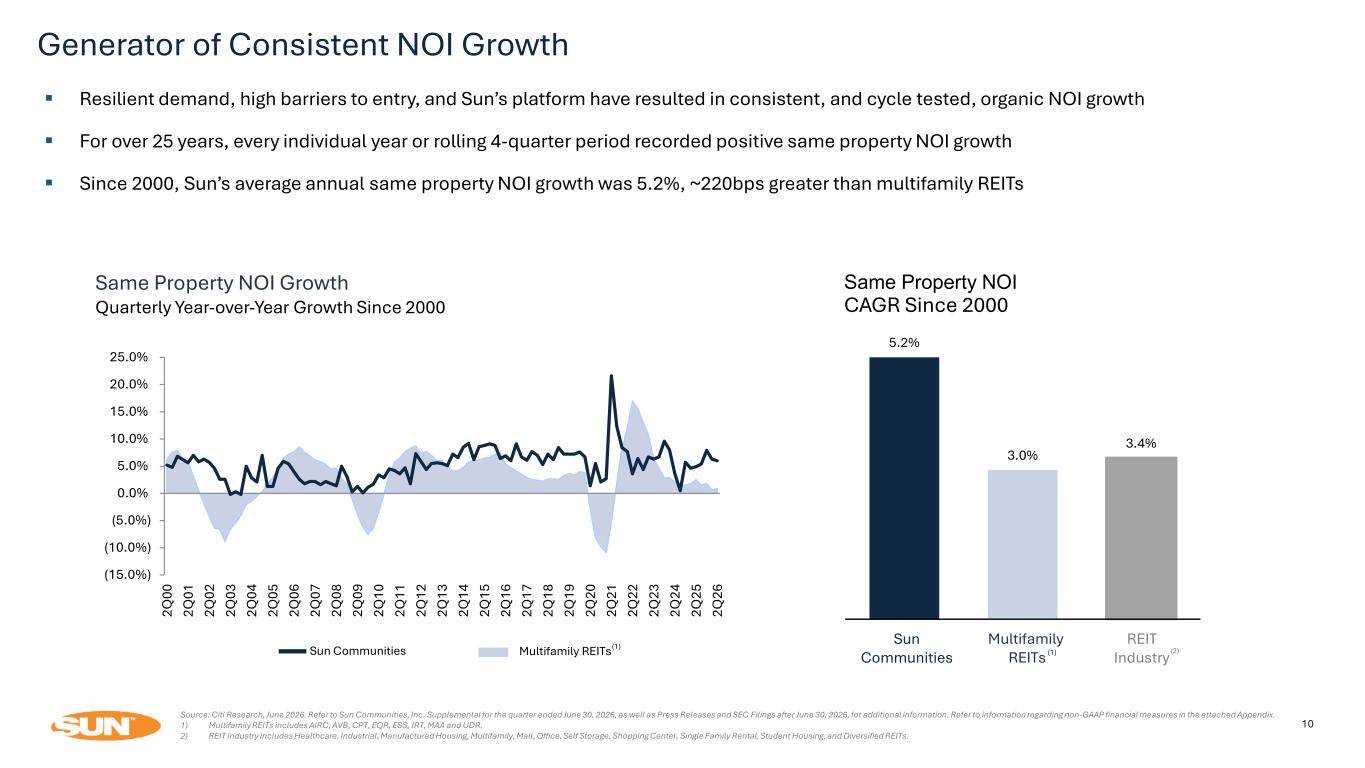
Generator of Consistent NOI Growth 10 Multifamily REITsSun Communities Resilient demand, high barriers to entry, and Sun’s platform have resulted in consistent, and cycle tested, organic NOI growth For over 25 years, every individual year or rolling 4-quarter period recorded positive same property NOI growth Since 2000, Sun’s average annual same property NOI growth was 5.2%, ~220bps greater than multifamily REITs Same Property NOI Growth Quarterly Year-over-Year Growth Since 2000 Source: Citi Research, June 2026. Refer to Sun Communities, Inc. Supplemental for the quarter ended June 30, 2026, as well as Press Releases and SEC Filings after June 30, 2026, for additional information. Refer to information regarding non-GAAP financial measures in the attached Appendix. 1) Multifamily REITs includes AIRC, AVB, CPT, EQR, ESS, IRT, MAA and UDR. 2) REIT Industry includes Healthcare, Industrial, Manufactured Housing, Multifamily, Mall, Office, Self Storage, Shopping Center, Single Family Rental, Student Housing, and Diversified REITs. (1) CAGR Since 2000 Sun Communities Multifamily REITs REIT Industry(1) (2) 5.2% 3.0% 3.4% Same Property NOI (15.0%) (10.0%) (5.0%) 0.0% 5.0% 10.0% 15.0% 20.0% 25.0% 2Q 00 2Q 01 2Q 02 2Q 03 2Q 04 2Q 05 2Q 06 2Q 07 2Q 08 2Q 09 2Q 10 2Q 11 2Q 12 2Q 13 2Q 14 2Q 15 2Q 16 2Q 17 2Q 18 2Q 19 2Q 20 2Q 21 2Q 22 2Q 23 2Q 24 2Q 25 2Q 26
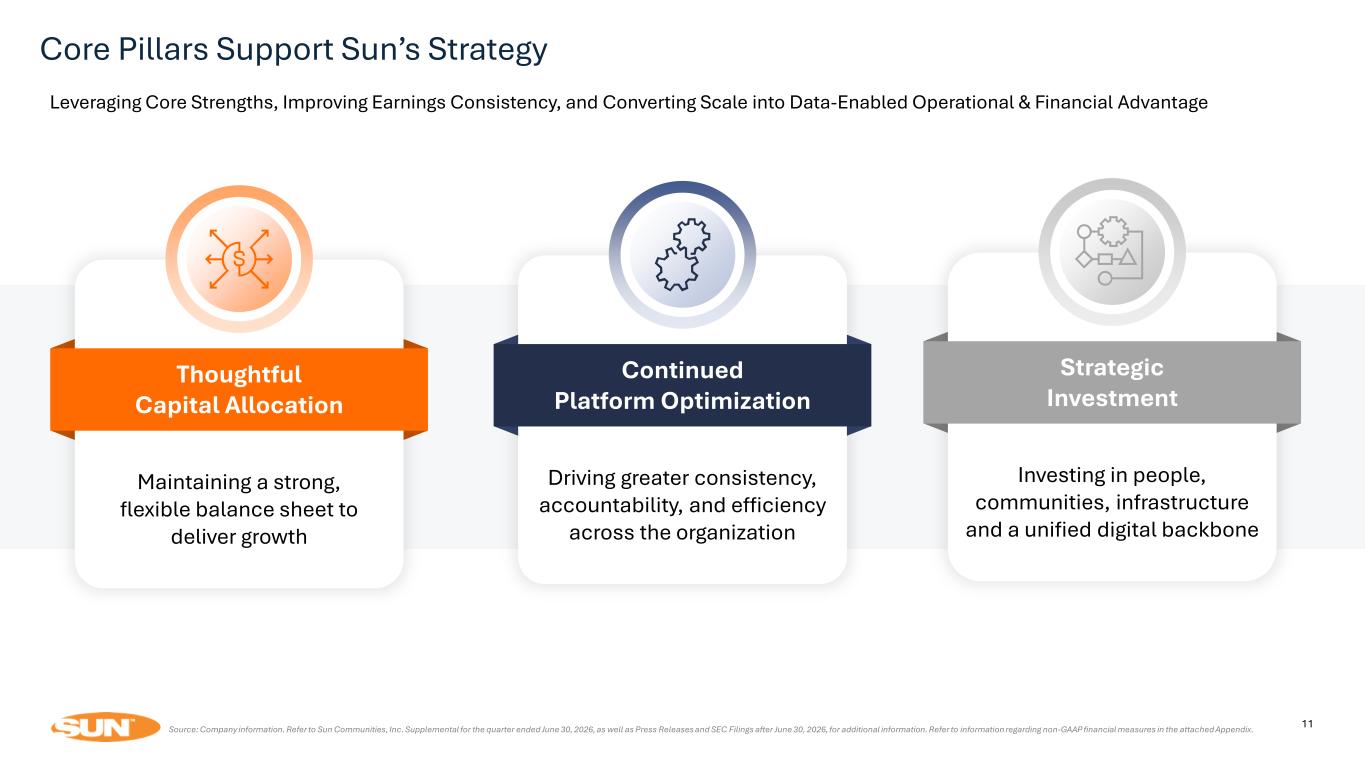
11 11 Strategic Investment Investing in people, communities, infrastructure and a unified digital backbone Continued Platform Optimization Driving greater consistency, accountability, and efficiency across the organization Thoughtful Capital Allocation Maintaining a strong, flexible balance sheet to deliver growth Core Pillars Support Sun’s Strategy Source: Company information. Refer to Sun Communities, Inc. Supplemental for the quarter ended June 30, 2026, as well as Press Releases and SEC Filings after June 30, 2026, for additional information. Refer to information regarding non-GAAP financial measures in the attached Appendix. Leveraging Core Strengths, Improving Earnings Consistency, and Converting Scale into Data-Enabled Operational & Financial Advantage
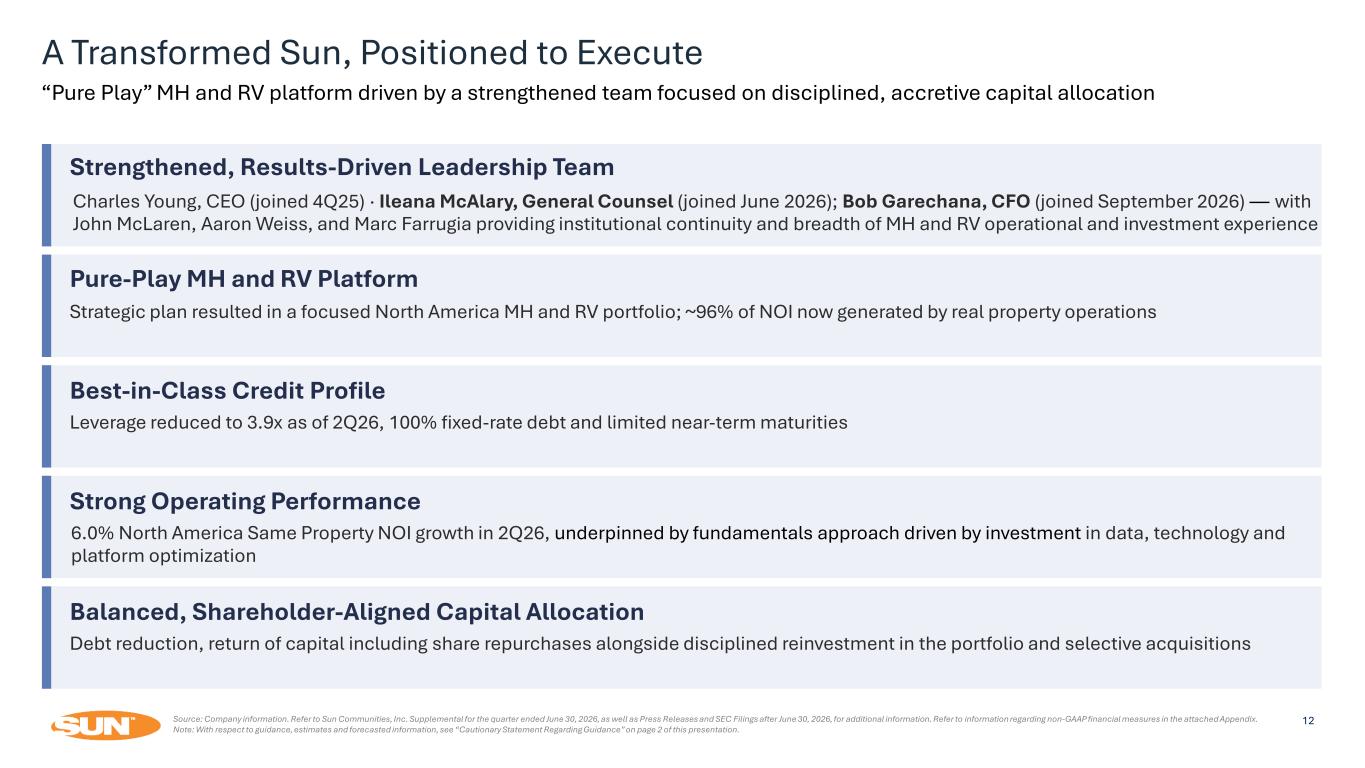
A Transformed Sun, Positioned to Execute Source: Company information. Refer to Sun Communities, Inc. Supplemental for the quarter ended June 30, 2026, as well as Press Releases and SEC Filings after June 30, 2026, for additional information. Refer to information regarding non-GAAP financial measures in the attached Appendix. Note: With respect to guidance, estimates and forecasted information, see “Cautionary Statement Regarding Guidance” on page 2 of this presentation. “Pure Play” MH and RV platform driven by a strengthened team focused on disciplined, accretive capital allocation Strengthened, Results-Driven Leadership Team Charles Young, CEO (joined 4Q25) · Ileana McAlary, General Counsel (joined June 2026); Bob Garechana, CFO (joined September 2026) — with John McLaren, Aaron Weiss, and Marc Farrugia providing institutional continuity and breadth of MH and RV operational and investment experience Pure-Play MH and RV Platform Strategic plan resulted in a focused North America MH and RV portfolio; ~96% of NOI now generated by real property operations Best-in-Class Credit Profile Leverage reduced to 3.9x as of 2Q26, 100% fixed-rate debt and limited near-term maturities Strong Operating Performance 6.0% North America Same Property NOI growth in 2Q26, underpinned by fundamentals approach driven by investment in data, technology and platform optimization Balanced, Shareholder-Aligned Capital Allocation Debt reduction, return of capital including share repurchases alongside disciplined reinvestment in the portfolio and selective acquisitions 12
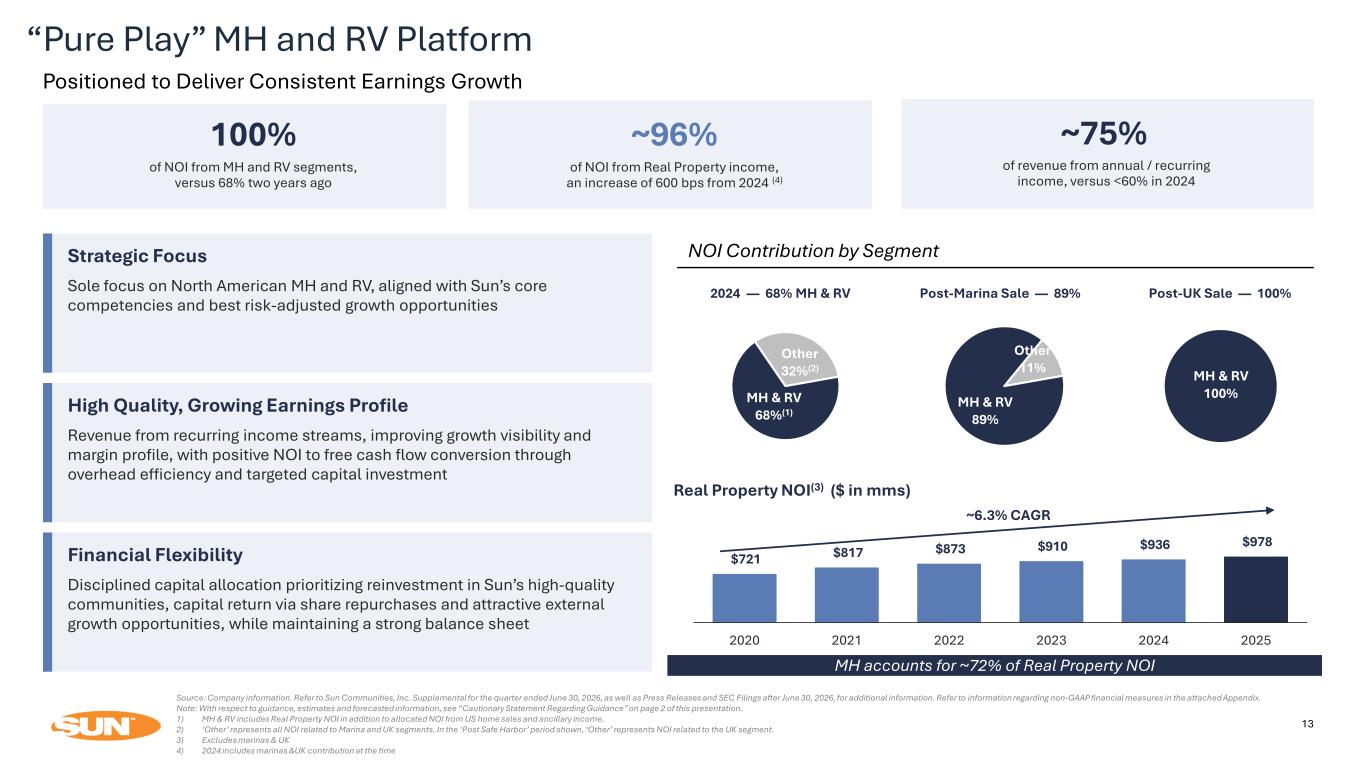
MH & RV 68%(1) Other 32%(2) MH & RV 89% Other 11% 13 2024 — 68% MH & RV Post-Marina Sale — 89% Post-UK Sale — 100% NOI Contribution by Segment MH & RV 100% “Pure Play” MH and RV Platform Positioned to Deliver Consistent Earnings Growth 100% of NOI from MH and RV segments, versus 68% two years ago ~96% of NOI from Real Property income, an increase of 600 bps from 2024 (4) ~75% of revenue from annual / recurring income, versus <60% in 2024 Strategic Focus Sole focus on North American MH and RV, aligned with Sun’s core competencies and best risk-adjusted growth opportunities High Quality, Growing Earnings Profile Revenue from recurring income streams, improving growth visibility and margin profile, with positive NOI to free cash flow conversion through overhead efficiency and targeted capital investment Financial Flexibility Disciplined capital allocation prioritizing reinvestment in Sun’s high-quality communities, capital return via share repurchases and attractive external growth opportunities, while maintaining a strong balance sheet Real Property NOI(3) ($ in mms) $721 $817 $873 $910 $936 $978 2020 2021 2022 2023 2024 2025 ~6.3% CAGR MH accounts for ~72% of Real Property NOI Source: Company information. Refer to Sun Communities, Inc. Supplemental for the quarter ended June 30, 2026, as well as Press Releases and SEC Filings after June 30, 2026, for additional information. Refer to information regarding non-GAAP financial measures in the attached Appendix. Note: With respect to guidance, estimates and forecasted information, see “Cautionary Statement Regarding Guidance” on page 2 of this presentation. 1) MH & RV includes Real Property NOI in addition to allocated NOI from US home sales and ancillary income. 2) ‘Other’ represents all NOI related to Marina and UK segments. In the ‘Post Safe Harbor’ period shown, ‘Other’ represents NOI related to the UK segment. 3) Excludes marinas & UK 4) 2024 includes marinas &UK contribution at the time
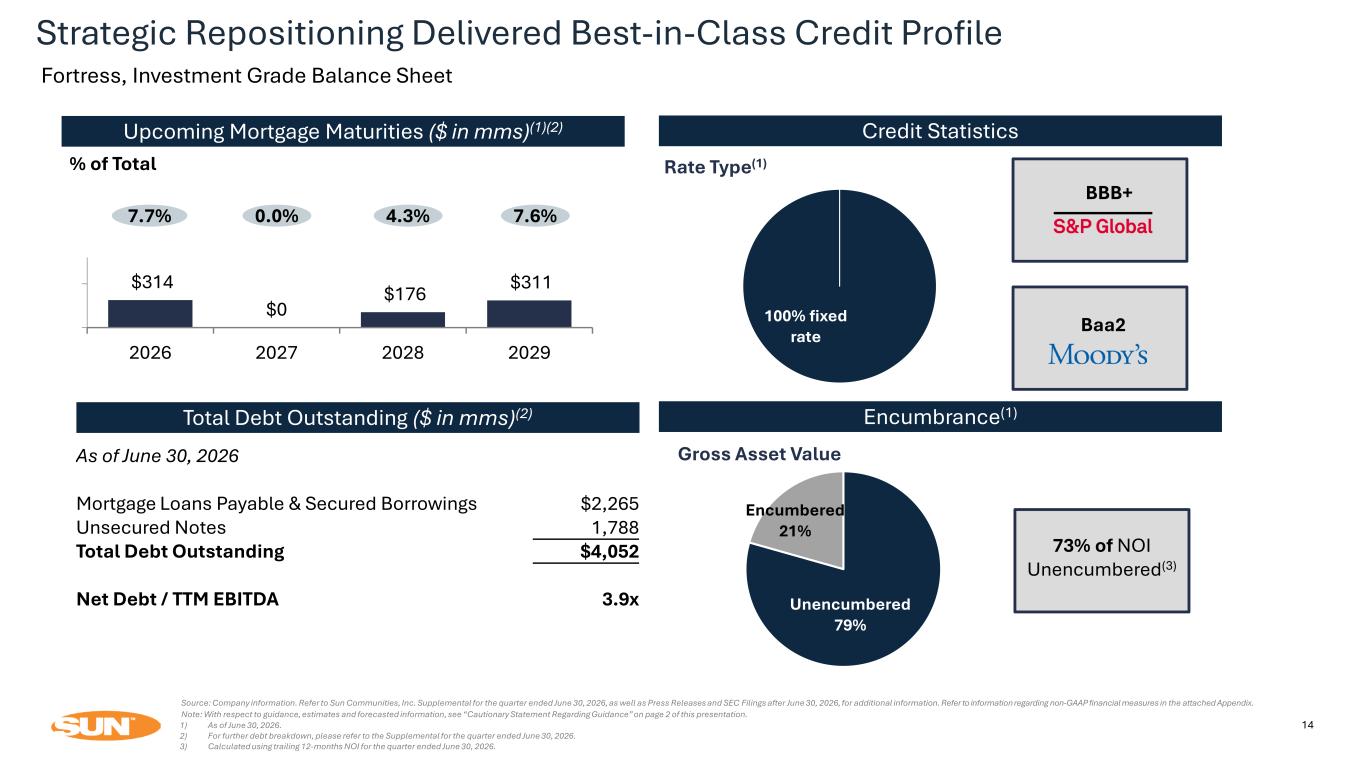
Unencumbered 79% Encumbered 21% 14 100% fixed rate Credit Statistics Rate Type(1) Upcoming Mortgage Maturities ($ in mms)(1)(2) 7.7% 0.0% 4.3% % of Total Encumbrance(1) Gross Asset Value 73% of NOI Unencumbered(3) Total Debt Outstanding ($ in mms)(2) $314 $0 $176 $311 2026 2027 2028 2029 As of June 30, 2026 Mortgage Loans Payable & Secured Borrowings $2,265 Unsecured Notes 1,788 Total Debt Outstanding $4,052 Net Debt / TTM EBITDA 3.9x BBB+ Baa2 7.6% Source: Company information. Refer to Sun Communities, Inc. Supplemental for the quarter ended June 30, 2026, as well as Press Releases and SEC Filings after June 30, 2026, for additional information. Refer to information regarding non-GAAP financial measures in the attached Appendix. Note: With respect to guidance, estimates and forecasted information, see “Cautionary Statement Regarding Guidance” on page 2 of this presentation. 1) As of June 30, 2026. 2) For further debt breakdown, please refer to the Supplemental for the quarter ended June 30, 2026. 3) Calculated using trailing 12-months NOI for the quarter ended June 30, 2026. Strategic Repositioning Delivered Best-in-Class Credit Profile Fortress, Investment Grade Balance Sheet
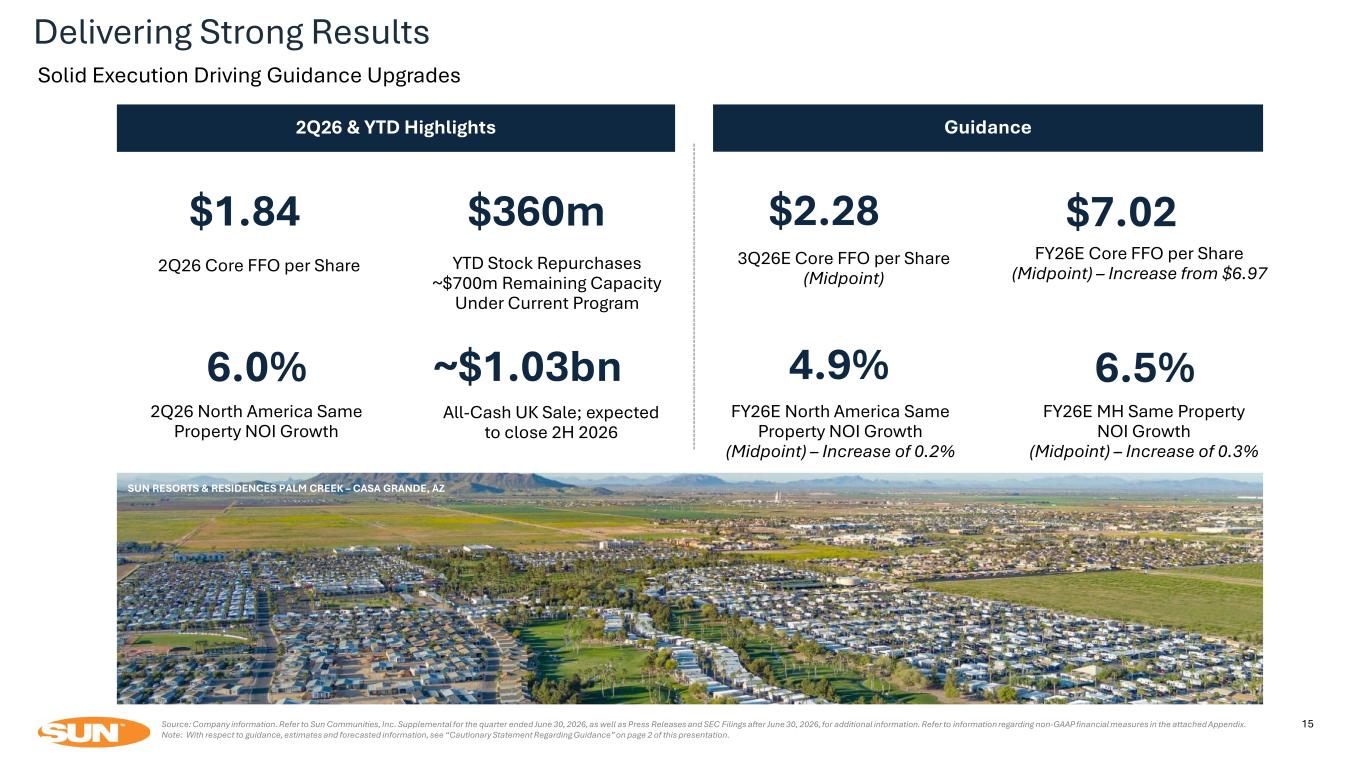
15Source: Company information. Refer to Sun Communities, Inc. Supplemental for the quarter ended June 30, 2026, as well as Press Releases and SEC Filings after June 30, 2026, for additional information. Refer to information regarding non-GAAP financial measures in the attached Appendix. Note: With respect to guidance, estimates and forecasted information, see “Cautionary Statement Regarding Guidance” on page 2 of this presentation. 2Q26 Core FFO per Share $1.84 2Q26 North America Same Property NOI Growth 6.0% 3Q26E Core FFO per Share (Midpoint) $2.28 FY26E Core FFO per Share (Midpoint) – Increase from $6.97 $7.02 2Q26 & YTD Highlights Guidance FY26E North America Same Property NOI Growth (Midpoint) – Increase of 0.2% 4.9% FY26E MH Same Property NOI Growth (Midpoint) – Increase of 0.3% 6.5% SUN RESORTS & RESIDENCES PALM CREEK – CASA GRANDE, AZ $360m YTD Stock Repurchases ~$700m Remaining Capacity Under Current Program All-Cash UK Sale; expected to close 2H 2026 ~$1.03bn Delivering Strong Results Solid Execution Driving Guidance Upgrades
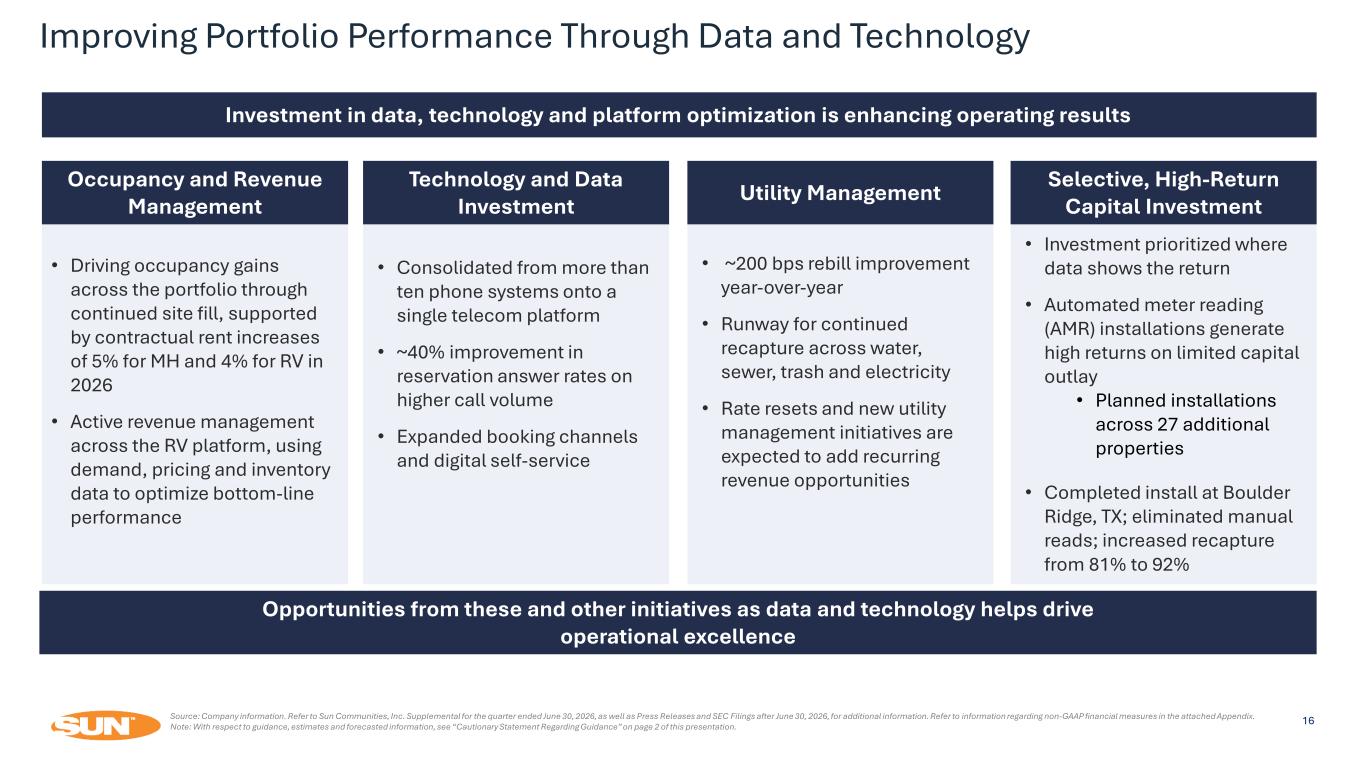
Source: Company information. Refer to Sun Communities, Inc. Supplemental for the quarter ended June 30, 2026, as well as Press Releases and SEC Filings after June 30, 2026, for additional information. Refer to information regarding non-GAAP financial measures in the attached Appendix. Note: With respect to guidance, estimates and forecasted information, see “Cautionary Statement Regarding Guidance” on page 2 of this presentation. Investment in data, technology and platform optimization is enhancing operating results Occupancy and Revenue Management • Driving occupancy gains across the portfolio through continued site fill, supported by contractual rent increases of 5% for MH and 4% for RV in 2026 • Active revenue management across the RV platform, using demand, pricing and inventory data to optimize bottom-line performance Technology and Data Investment • Consolidated from more than ten phone systems onto a single telecom platform • ~40% improvement in reservation answer rates on higher call volume • Expanded booking channels and digital self-service Utility Management • ~200 bps rebill improvement year-over-year • Runway for continued recapture across water, sewer, trash and electricity • Rate resets and new utility management initiatives are expected to add recurring revenue opportunities Selective, High-Return Capital Investment • Investment prioritized where data shows the return • Automated meter reading (AMR) installations generate high returns on limited capital outlay • Planned installations across 27 additional properties • Completed install at Boulder Ridge, TX; eliminated manual reads; increased recapture from 81% to 92% Opportunities from these and other initiatives as data and technology helps drive operational excellence Improving Portfolio Performance Through Data and Technology 16
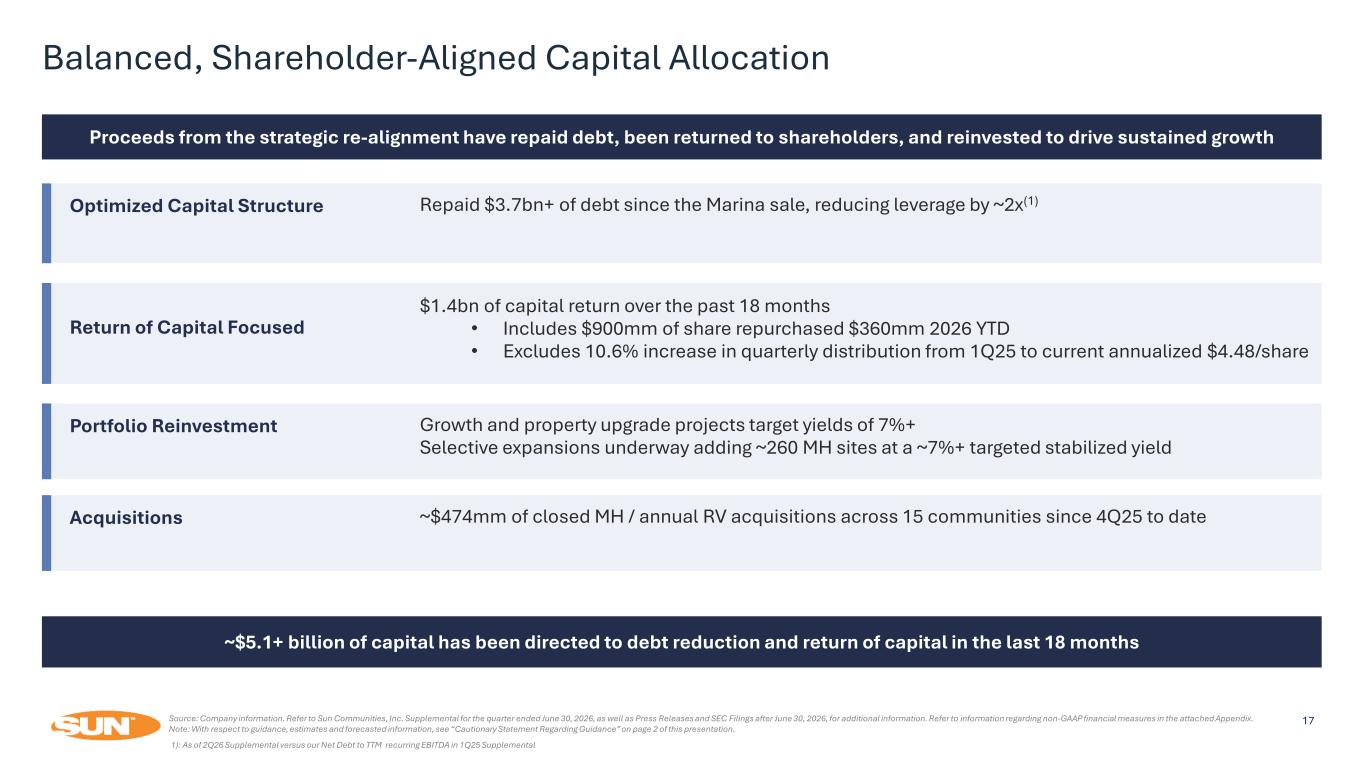
Source: Company information. Refer to Sun Communities, Inc. Supplemental for the quarter ended June 30, 2026, as well as Press Releases and SEC Filings after June 30, 2026, for additional information. Refer to information regarding non-GAAP financial measures in the attached Appendix. Note: With respect to guidance, estimates and forecasted information, see “Cautionary Statement Regarding Guidance” on page 2 of this presentation. Proceeds from the strategic re-alignment have repaid debt, been returned to shareholders, and reinvested to drive sustained growth Optimized Capital Structure Repaid $3.7bn+ of debt since the Marina sale, reducing leverage by ~2x(1) Return of Capital Focused $1.4bn of capital return over the past 18 months • Includes $900mm of share repurchased $360mm 2026 YTD • Excludes 10.6% increase in quarterly distribution from 1Q25 to current annualized $4.48/share Portfolio Reinvestment Growth and property upgrade projects target yields of 7%+ Selective expansions underway adding ~260 MH sites at a ~7%+ targeted stabilized yield Acquisitions ~$474mm of closed MH / annual RV acquisitions across 15 communities since 4Q25 to date ~$5.1+ billion of capital has been directed to debt reduction and return of capital in the last 18 months Balanced, Shareholder-Aligned Capital Allocation 17 1): As of 2Q26 Supplemental versus our Net Debt to TTM recurring EBITDA in 1Q25 Supplemental
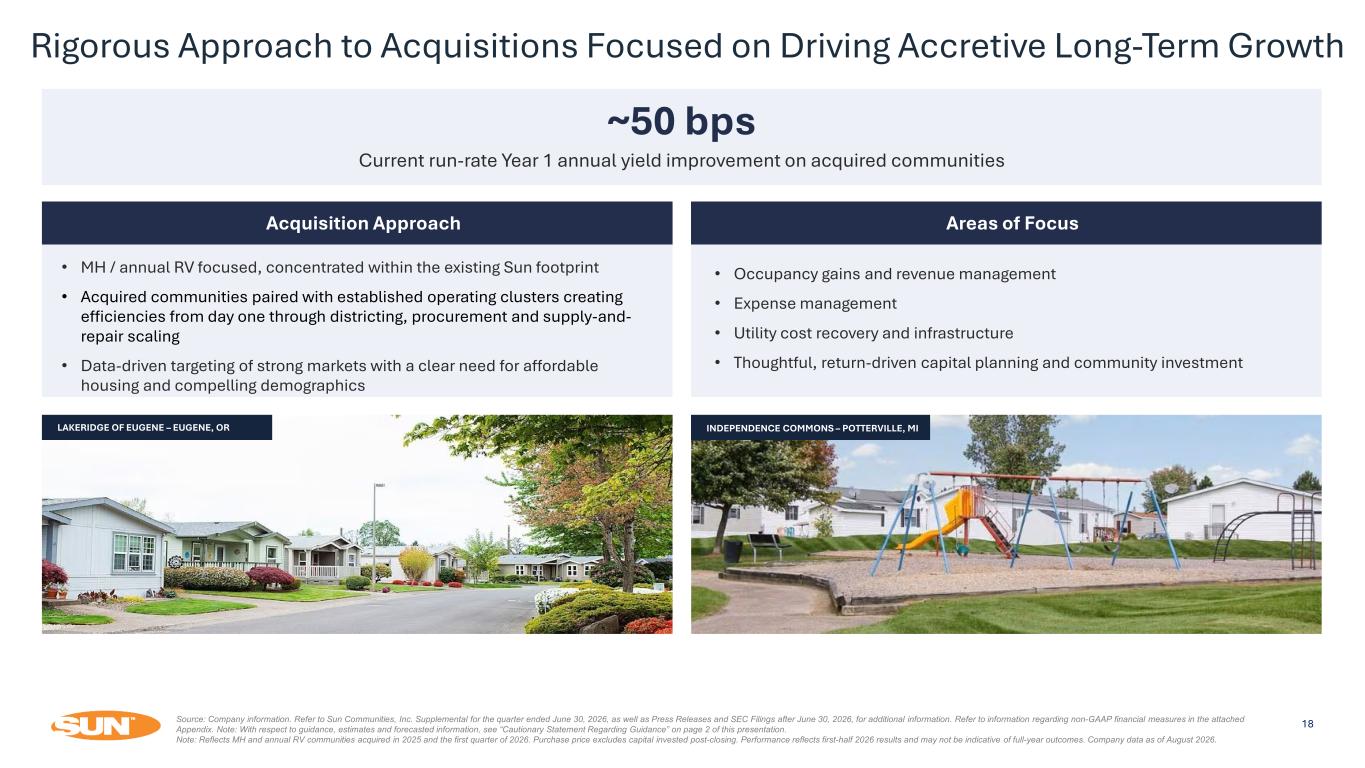
~50 bps Current run-rate Year 1 annual yield improvement on acquired communities Acquisition Approach • MH / annual RV focused, concentrated within the existing Sun footprint • Acquired communities paired with established operating clusters creating efficiencies from day one through districting, procurement and supply-and- repair scaling • Data-driven targeting of strong markets with a clear need for affordable housing and compelling demographics Areas of Focus • Occupancy gains and revenue management • Expense management • Utility cost recovery and infrastructure • Thoughtful, return-driven capital planning and community investment Source: Company information. Refer to Sun Communities, Inc. Supplemental for the quarter ended June 30, 2026, as well as Press Releases and SEC Filings after June 30, 2026, for additional information. Refer to information regarding non-GAAP financial measures in the attached Appendix. Note: With respect to guidance, estimates and forecasted information, see “Cautionary Statement Regarding Guidance” on page 2 of this presentation. Note: Reflects MH and annual RV communities acquired in 2025 and the first quarter of 2026. Purchase price excludes capital invested post-closing. Performance reflects first-half 2026 results and may not be indicative of full-year outcomes. Company data as of August 2026. 18 Rigorous Approach to Acquisitions Focused on Driving Accretive Long-Term Growth LAKERIDGE OF EUGENE – EUGENE, OR INDEPENDENCE COMMONS – POTTERVILLE, MI
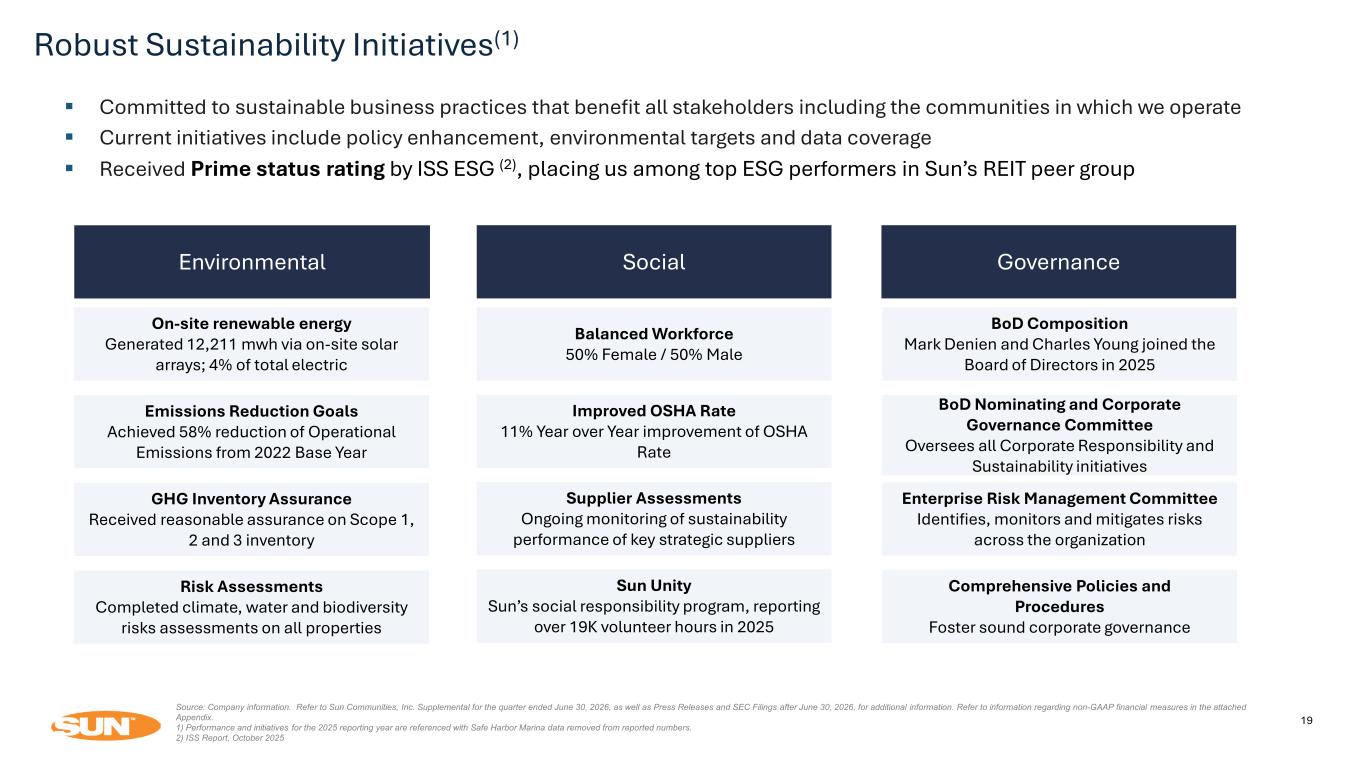
Robust Sustainability Initiatives(1) 19 Environmental Committed to sustainable business practices that benefit all stakeholders including the communities in which we operate Current initiatives include policy enhancement, environmental targets and data coverage Received Prime status rating by ISS ESG (2), placing us among top ESG performers in Sun’s REIT peer group Social Improved OSHA Rate 11% Year over Year improvement of OSHA Rate Balanced Workforce 50% Female / 50% Male Governance BoD Composition Mark Denien and Charles Young joined the Board of Directors in 2025 Enterprise Risk Management Committee Identifies, monitors and mitigates risks across the organization Supplier Assessments Ongoing monitoring of sustainability performance of key strategic suppliers BoD Nominating and Corporate Governance Committee Oversees all Corporate Responsibility and Sustainability initiatives Sun Unity Sun’s social responsibility program, reporting over 19K volunteer hours in 2025 Comprehensive Policies and Procedures Foster sound corporate governance Source: Company information. Refer to Sun Communities, Inc. Supplemental for the quarter ended June 30, 2026, as well as Press Releases and SEC Filings after June 30, 2026, for additional information. Refer to information regarding non-GAAP financial measures in the attached Appendix. 1) Performance and initiatives for the 2025 reporting year are referenced with Safe Harbor Marina data removed from reported numbers. 2) ISS Report, October 2025 On-site renewable energy Generated 12,211 mwh via on-site solar arrays; 4% of total electric Emissions Reduction Goals Achieved 58% reduction of Operational Emissions from 2022 Base Year GHG Inventory Assurance Received reasonable assurance on Scope 1, 2 and 3 inventory Risk Assessments Completed climate, water and biodiversity risks assessments on all properties
Appendix 20SUN OUTDOORS MYRTLE BEACH – MYRTLE BEACH, SC
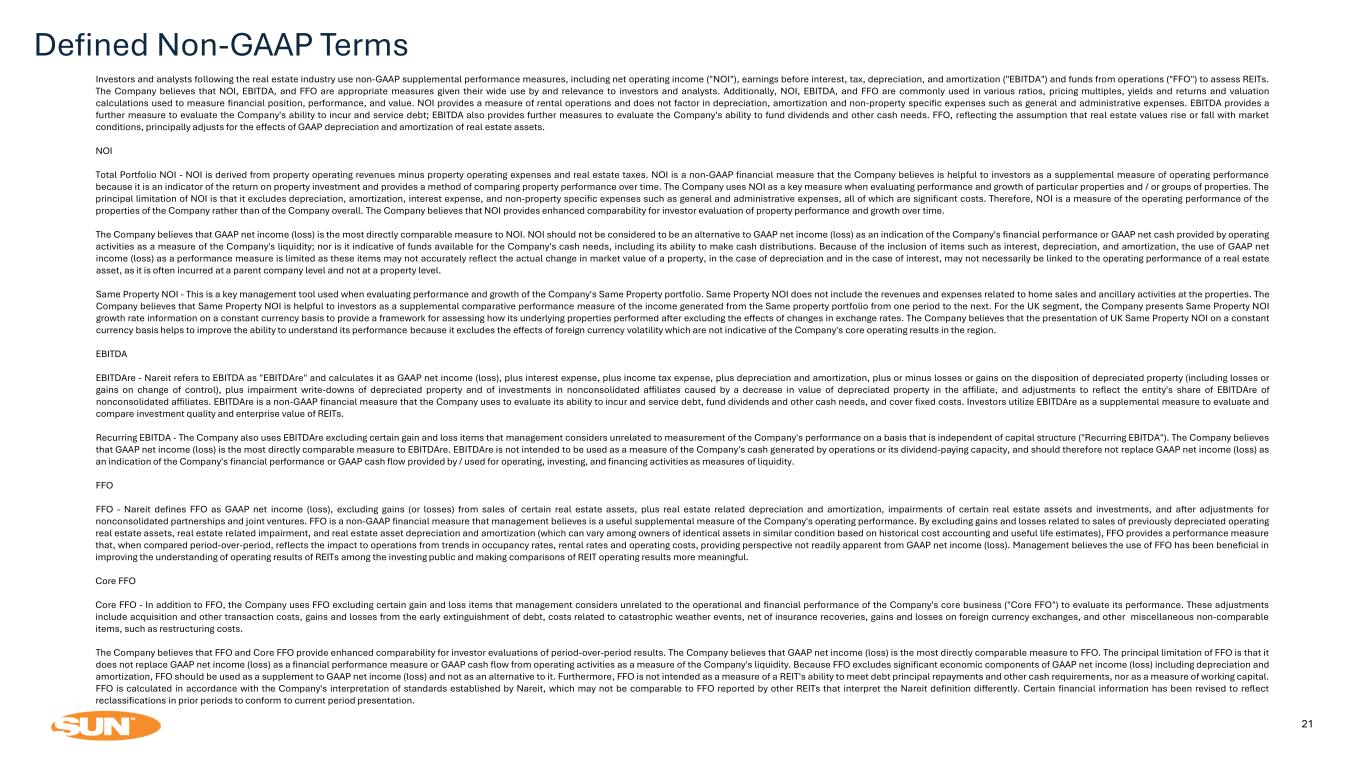
Defined Non-GAAP Terms 21 Investors and analysts following the real estate industry use non-GAAP supplemental performance measures, including net operating income ("NOI"), earnings before interest, tax, depreciation, and amortization ("EBITDA") and funds from operations ("FFO") to assess REITs. The Company believes that NOI, EBITDA, and FFO are appropriate measures given their wide use by and relevance to investors and analysts. Additionally, NOI, EBITDA, and FFO are commonly used in various ratios, pricing multiples, yields and returns and valuation calculations used to measure financial position, performance, and value. NOI provides a measure of rental operations and does not factor in depreciation, amortization and non-property specific expenses such as general and administrative expenses. EBITDA provides a further measure to evaluate the Company's ability to incur and service debt; EBITDA also provides further measures to evaluate the Company's ability to fund dividends and other cash needs. FFO, reflecting the assumption that real estate values rise or fall with market conditions, principally adjusts for the effects of GAAP depreciation and amortization of real estate assets. NOI Total Portfolio NOI - NOI is derived from property operating revenues minus property operating expenses and real estate taxes. NOI is a non-GAAP financial measure that the Company believes is helpful to investors as a supplemental measure of operating performance because it is an indicator of the return on property investment and provides a method of comparing property performance over time. The Company uses NOI as a key measure when evaluating performance and growth of particular properties and / or groups of properties. The principal limitation of NOI is that it excludes depreciation, amortization, interest expense, and non-property specific expenses such as general and administrative expenses, all of which are significant costs. Therefore, NOI is a measure of the operating performance of the properties of the Company rather than of the Company overall. The Company believes that NOI provides enhanced comparability for investor evaluation of property performance and growth over time. The Company believes that GAAP net income (loss) is the most directly comparable measure to NOI. NOI should not be considered to be an alternative to GAAP net income (loss) as an indication of the Company's financial performance or GAAP net cash provided by operating activities as a measure of the Company's liquidity; nor is it indicative of funds available for the Company's cash needs, including its ability to make cash distributions. Because of the inclusion of items such as interest, depreciation, and amortization, the use of GAAP net income (loss) as a performance measure is limited as these items may not accurately reflect the actual change in market value of a property, in the case of depreciation and in the case of interest, may not necessarily be linked to the operating performance of a real estate asset, as it is often incurred at a parent company level and not at a property level. Same Property NOI - This is a key management tool used when evaluating performance and growth of the Company's Same Property portfolio. Same Property NOI does not include the revenues and expenses related to home sales and ancillary activities at the properties. The Company believes that Same Property NOI is helpful to investors as a supplemental comparative performance measure of the income generated from the Same property portfolio from one period to the next. For the UK segment, the Company presents Same Property NOI growth rate information on a constant currency basis to provide a framework for assessing how its underlying properties performed after excluding the effects of changes in exchange rates. The Company believes that the presentation of UK Same Property NOI on a constant currency basis helps to improve the ability to understand its performance because it excludes the effects of foreign currency volatility which are not indicative of the Company's core operating results in the region. EBITDA EBITDAre - Nareit refers to EBITDA as "EBITDAre" and calculates it as GAAP net income (loss), plus interest expense, plus income tax expense, plus depreciation and amortization, plus or minus losses or gains on the disposition of depreciated property (including losses or gains on change of control), plus impairment write-downs of depreciated property and of investments in nonconsolidated affiliates caused by a decrease in value of depreciated property in the affiliate, and adjustments to reflect the entity's share of EBITDAre of nonconsolidated affiliates. EBITDAre is a non-GAAP financial measure that the Company uses to evaluate its ability to incur and service debt, fund dividends and other cash needs, and cover fixed costs. Investors utilize EBITDAre as a supplemental measure to evaluate and compare investment quality and enterprise value of REITs. Recurring EBITDA - The Company also uses EBITDAre excluding certain gain and loss items that management considers unrelated to measurement of the Company's performance on a basis that is independent of capital structure ("Recurring EBITDA"). The Company believes that GAAP net income (loss) is the most directly comparable measure to EBITDAre. EBITDAre is not intended to be used as a measure of the Company's cash generated by operations or its dividend-paying capacity, and should therefore not replace GAAP net income (loss) as an indication of the Company's financial performance or GAAP cash flow provided by / used for operating, investing, and financing activities as measures of liquidity. FFO FFO - Nareit defines FFO as GAAP net income (loss), excluding gains (or losses) from sales of certain real estate assets, plus real estate related depreciation and amortization, impairments of certain real estate assets and investments, and after adjustments for nonconsolidated partnerships and joint ventures. FFO is a non-GAAP financial measure that management believes is a useful supplemental measure of the Company's operating performance. By excluding gains and losses related to sales of previously depreciated operating real estate assets, real estate related impairment, and real estate asset depreciation and amortization (which can vary among owners of identical assets in similar condition based on historical cost accounting and useful life estimates), FFO provides a performance measure that, when compared period-over-period, reflects the impact to operations from trends in occupancy rates, rental rates and operating costs, providing perspective not readily apparent from GAAP net income (loss). Management believes the use of FFO has been beneficial in improving the understanding of operating results of REITs among the investing public and making comparisons of REIT operating results more meaningful. Core FFO Core FFO - In addition to FFO, the Company uses FFO excluding certain gain and loss items that management considers unrelated to the operational and financial performance of the Company's core business ("Core FFO") to evaluate its performance. These adjustments include acquisition and other transaction costs, gains and losses from the early extinguishment of debt, costs related to catastrophic weather events, net of insurance recoveries, gains and losses on foreign currency exchanges, and other miscellaneous non-comparable items, such as restructuring costs. The Company believes that FFO and Core FFO provide enhanced comparability for investor evaluations of period-over-period results. The Company believes that GAAP net income (loss) is the most directly comparable measure to FFO. The principal limitation of FFO is that it does not replace GAAP net income (loss) as a financial performance measure or GAAP cash flow from operating activities as a measure of the Company's liquidity. Because FFO excludes significant economic components of GAAP net income (loss) including depreciation and amortization, FFO should be used as a supplement to GAAP net income (loss) and not as an alternative to it. Furthermore, FFO is not intended as a measure of a REIT's ability to meet debt principal repayments and other cash requirements, nor as a measure of working capital. FFO is calculated in accordance with the Company's interpretation of standards established by Nareit, which may not be comparable to FFO reported by other REITs that interpret the Nareit definition differently. Certain financial information has been revised to reflect reclassifications in prior periods to conform to current period presentation.
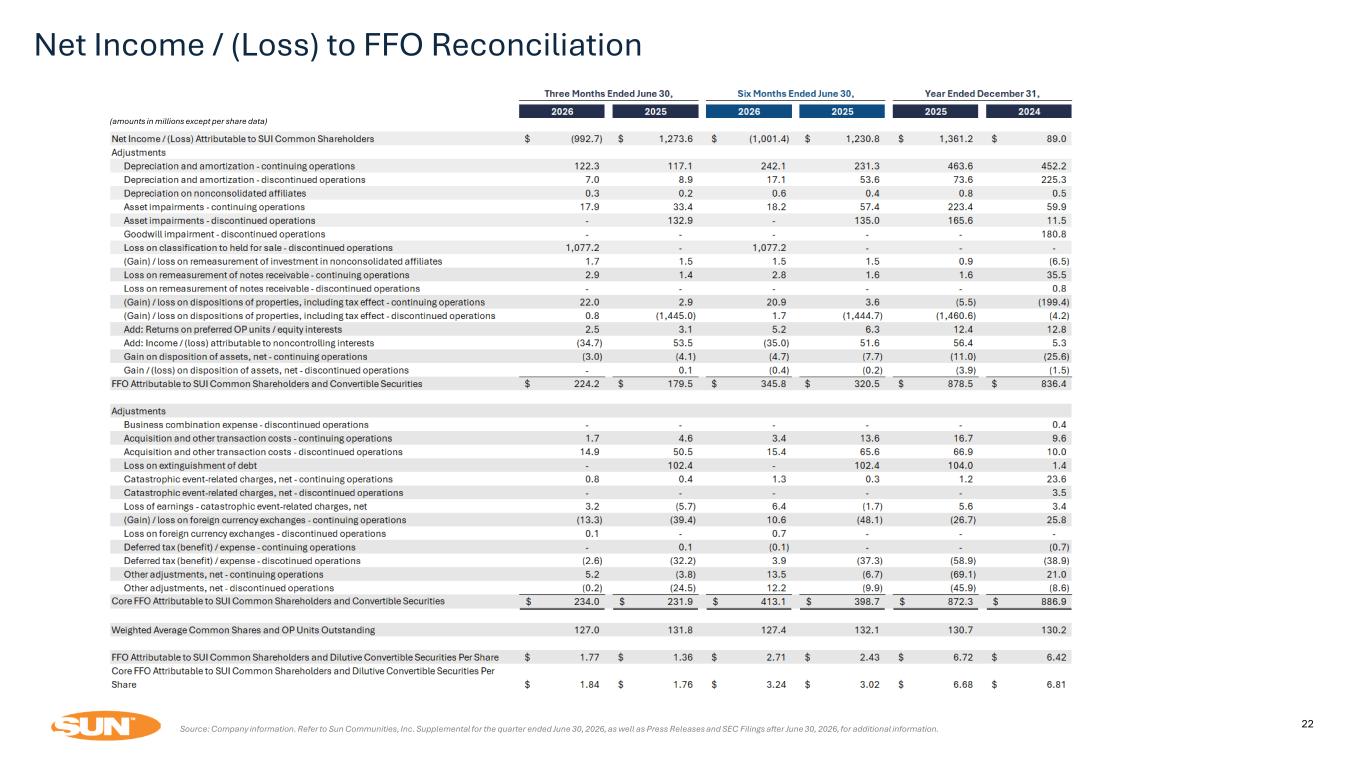
22Source: Company information. Refer to Sun Communities, Inc. Supplemental for the quarter ended June 30, 2026, as well as Press Releases and SEC Filings after June 30, 2026, for additional information. Net Income / (Loss) to FFO Reconciliation (amounts in millions except per share data)
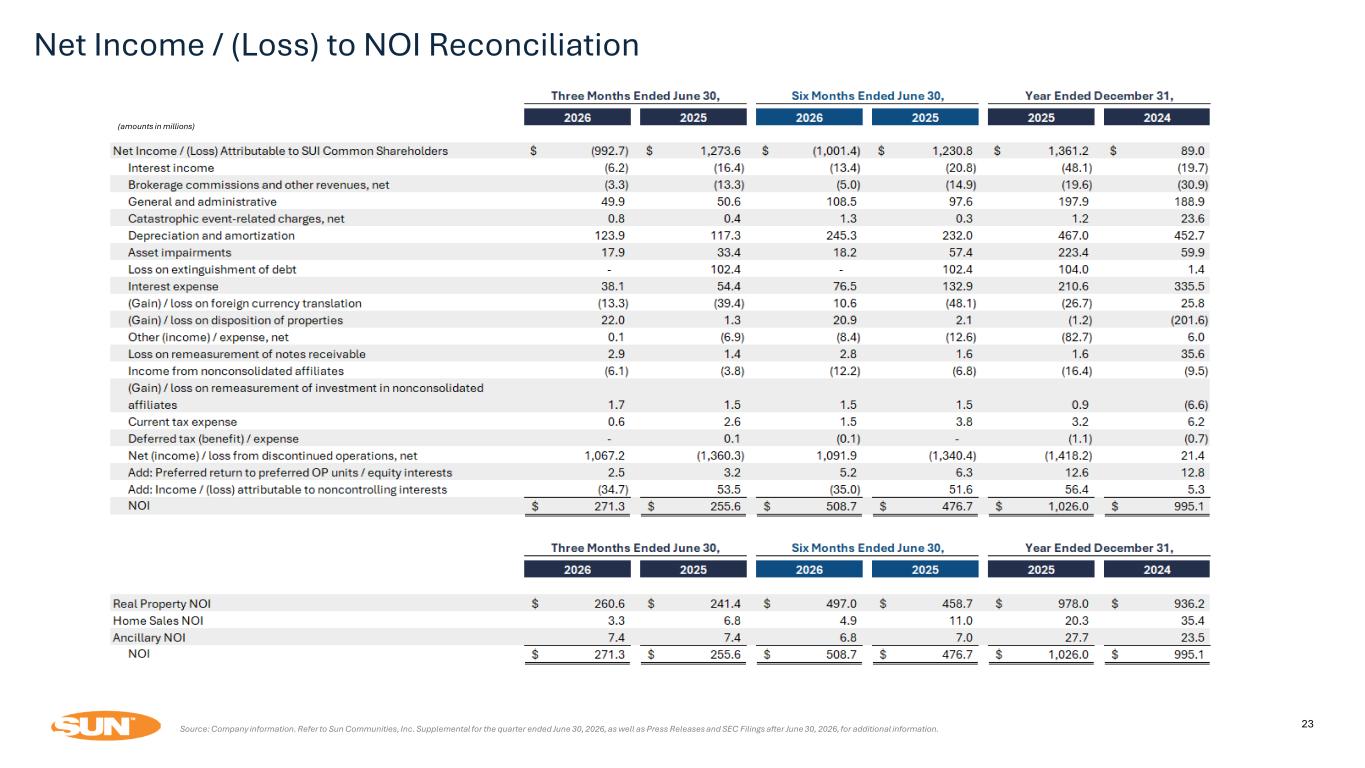
Net Income / (Loss) to NOI Reconciliation 23Source: Company information. Refer to Sun Communities, Inc. Supplemental for the quarter ended June 30, 2026, as well as Press Releases and SEC Filings after June 30, 2026, for additional information. (amounts in millions)
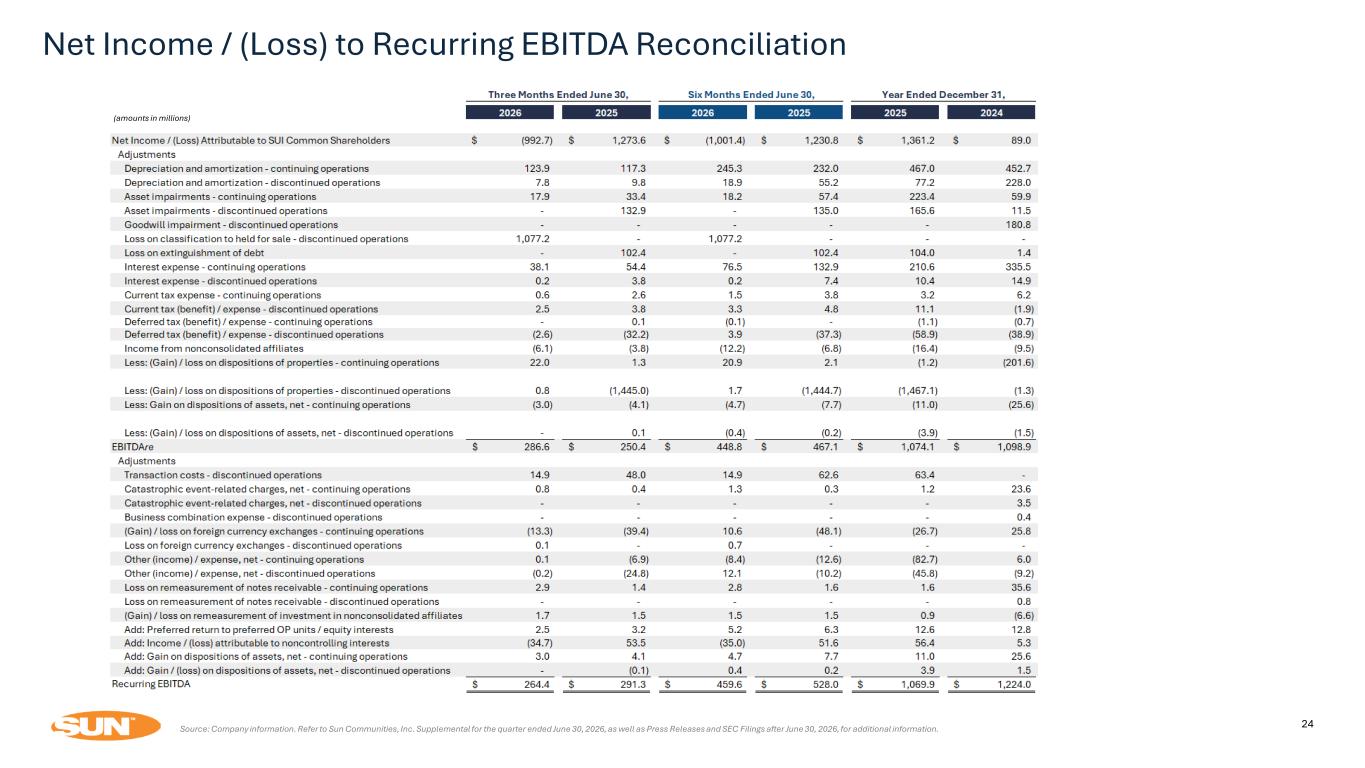
Net Income / (Loss) to Recurring EBITDA Reconciliation 24Source: Company information. Refer to Sun Communities, Inc. Supplemental for the quarter ended June 30, 2026, as well as Press Releases and SEC Filings after June 30, 2026, for additional information. (amounts in millions)
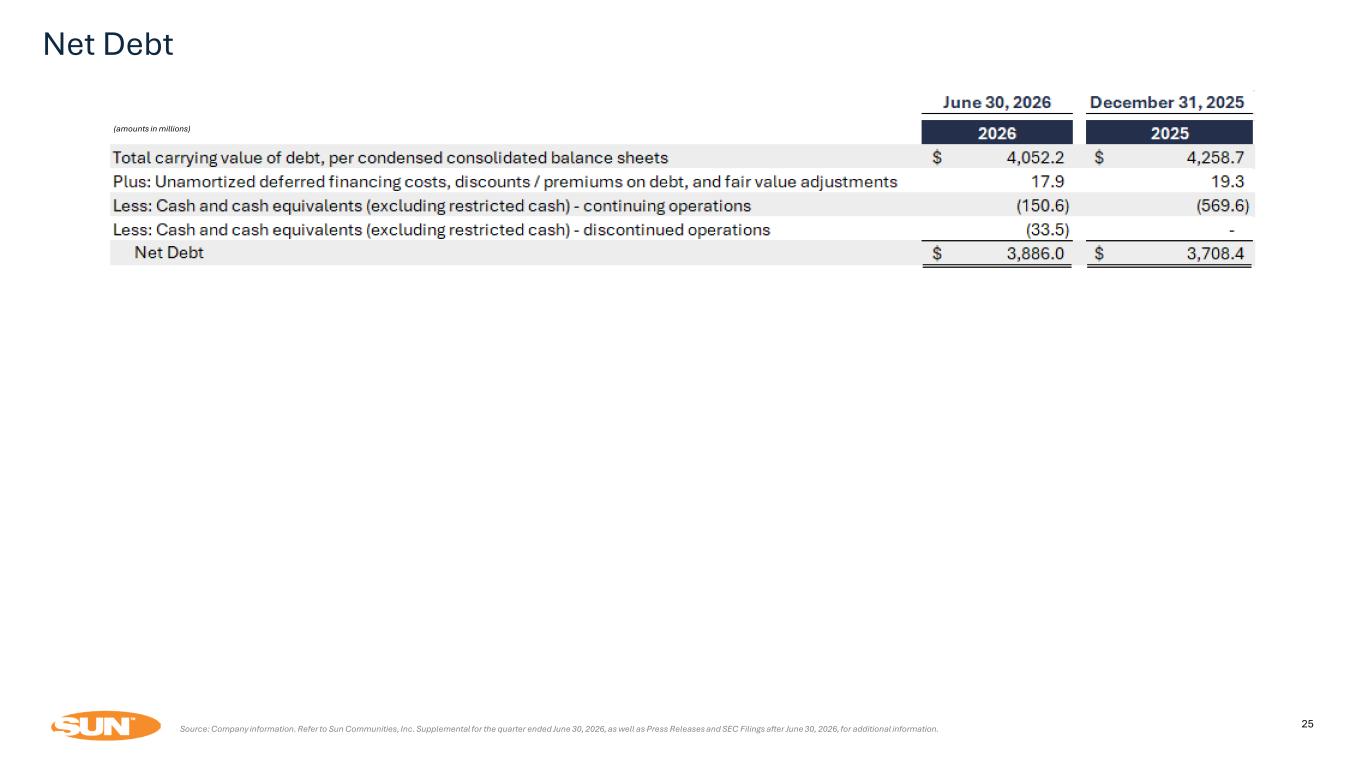
Net Debt 25Source: Company information. Refer to Sun Communities, Inc. Supplemental for the quarter ended June 30, 2026, as well as Press Releases and SEC Filings after June 30, 2026, for additional information. (amounts in millions)