Exhibit 99.11
GOVERNMENT OF ALBERTA

2026-27 First Quarter
Fiscal Update and
Economic Statement

Exhibit 99.11
GOVERNMENT OF ALBERTA
2026-27 First Quarter
Fiscal Update and
Economic Statement
Table of Contents
| 2026-27 First Quarter Fiscal Plan Highlights |
3 | |||
| Revenue Highlights |
4 | |||
| Expense Highlights |
6 | |||
| Assets and Liabilities |
8 | |||
| Cash Adjustments |
10 | |||
| Capital Plan Highlights |
11 | |||
| 2026-27 First Quarter Fiscal Update Tables |
12 | |||
| Reporting Methodology and Legislative Compliance |
16 | |||
| Economic Update |
17 | |||
Note: Amounts presented in tables may not add to totals due to rounding.
Note on restatements and accounting policy changes:
| • | 2026-27 Budget numbers have been restated to reflect the revised government structure under the Government Organization Act (Orders in Council 161/2026, June 2, 2026). |
The 2025-26 year end results have been delayed. Through the 2025-26 fiscal year, Alberta’s government undertook significant restructuring of the health care system requiring more time for the health entities to finalize their results. The government is expecting to release the 2025-26 Annual Report in alignment with the timing of other jurisdictions and will publish updated 2026-27 First Quarter Fiscal Update tables once the year-end results have been finalized.
The Local Government Fiscal Framework Act requires the capital grant funding allocation for 2028-29 to be released by September 30, 2026. As the 2025-26 year-end results are required for this calculation, the LGFFA funding allocation will be released concurrently with the 2025-26 year-end results.
Treasury Board and Finance, Government of Alberta
August 27, 2026
2026–27 First Quarter Fiscal Update and Economic Statement
Additional copies of this report may be obtained by visiting our website at:
www.alberta.ca/budget-documents.aspx
| 2 | 2026–27 First Quarter | Fiscal Update and Economic Statement |
2026-27 First Quarter Fiscal Plan Highlights
The 2026-27 first quarter forecast includes a $2 billion surplus, an improvement of $11.4 billion from the $9.4 billion deficit estimated in Budget 2026, mainly as a result of higher-than-expected non-renewable resource (NRR) revenue. Since war broke out in the Middle East in late February 2026, global energy prices have increased significantly. Ongoing geopolitical instability and related revenue volatility continue to be significant risks to the fiscal outlook.
The 2026-27 revenue forecast is up
$11.7 billion from Budget 2026, due to a $9.7 billion increase in NRR driven by higher oil prices. Total program expense has increased by $0.3 billion from budget due to expense increases offset by dedicated revenue. Other expense increases of $0.5 billion are forecast to be absorbed by the contingency in alignment with the Sustainable Fiscal Planning and Reporting Act.
Total revenue of $86.3 billion is forecast, $11.7 billion higher than estimated in Budget 2026. NRR revenue is up $9.7 billion from budget mainly due to higher crude oil prices and a weaker Canadian dollar. Income tax revenue is up $1 billion from budget, mainly due to higher-than-expected 2025 personal income tax assessments and higher corporate profits. Net income from government business enterprises (GBEs) has increased $0.6 billion from budget mainly due to the improvement in Sturgeon Refinery net income from higher commodity prices.
Total expense of $84.2 billion is forecast, an increase of $0.3 billion from budget. Expense before forecast contingency allocations is $0.8 billion higher. Operating expense is up by $0.6 billion, primarily due to onetime Alberta Energy Rebate payments. Additional expense increases are fully offset by revenue including the federal Aging with Dignity initiative and cost
of selling oil. Capital grant increases of $0.3 billion are mainly from re-profiling of projects from 2025-26. Debt servicing costs have decreased due to lower-than-expected borrowing requirements as a result of the improvement to the Fiscal Plan. Disaster and emergency assistance is forecast at $0.1 billion for wildfire response and tornado damages not covered by insurance.
The Capital Plan in 2026-27 is forecast at $10.7 billion, $0.7 billion more than budget, largely from re-profiling capital projects to the current year from 2025-26. Capital grants have increased by $0.3 billion and capital investment has increased by $0.4 billion.
Taxpayer-supported debt is forecast at $94.8 billion as of March 31, 2027, a decrease of $14.1 billion from Budget 2026, due to an improved overall financial position. Net debt to GDP at year-end is forecast to be 7.7 per cent.
Fiscal Plan Summary
(millions of dollars)
| Fiscal Year | Change
from
Budget |
|||||||||||
| 2026-27 | ||||||||||||
| Budget | Forecast | |||||||||||
| Revenue |
||||||||||||
| Income and other taxes |
30,470 | 31,420 | 950 | |||||||||
| Non-renewable resource revenue |
13,213 | 22,955 | 9,742 | |||||||||
| Transfers from Government of Canada |
13,715 | 14,061 | 346 | |||||||||
| Investment income |
4,358 | 4,446 | 88 | |||||||||
| Other revenue |
12,794 | 13,396 | 603 | |||||||||
| Total revenue |
74,550 | 86,279 | 11,729 | |||||||||
| Expense |
||||||||||||
| Operating expense |
70,398 | 71,034 | 635 | |||||||||
| Capital grants |
3,672 | 3,947 | 275 | |||||||||
| Amortization / loss on disposals / inventory consumption |
4,853 | 4,857 | 3 | |||||||||
| Debt servicing costs |
3,407 | 3,182 | (225 | ) | ||||||||
| Pension provisions |
(408 | ) | (408 | ) | - | |||||||
| Disaster and emergency assistance |
- | 106 | 106 | |||||||||
| Expense before contingency |
81,922 | 82,718 | 796 | |||||||||
| Contingency (forecast un-allocated) |
2,000 | 1,520 | (480 | ) | ||||||||
| Total expense |
83,922 | 84,237 | 315 | |||||||||
| Surplus / (deficit) |
(9,373 | ) | 2,041 | 11,414 | ||||||||
| Capital Plan |
||||||||||||
| Capital grants |
3,672 | 3,947 | 275 | |||||||||
| Capital investment |
6,297 | 6,739 | 442 | |||||||||
| Total capital plan |
9,969 | 10,687 | 717 | |||||||||
| 2026–27 First Quarter | Fiscal Update and Economic Statement | 3 | |
Revenue
(millions of dollars)
| Fiscal Year | Change
from
Budget |
|||||||||||
| 2026-27 | ||||||||||||
| Budget | Forecast | |||||||||||
| Income taxes |
||||||||||||
| Personal income tax |
15,933 | 16,354 | 420 | |||||||||
| Corporate income tax |
7,300 | 7,845 | 545 | |||||||||
| 23,233 | 24,199 | 965 | ||||||||||
| Other taxes |
||||||||||||
| Education property tax |
3,592 | 3,592 | - | |||||||||
| Fuel tax / electric vehicle tax |
1,450 | 1,444 | (6 | ) | ||||||||
| Tobacco / vaping tax |
385 | 375 | (10 | ) | ||||||||
| Insurance tax |
1,060 | 1,063 | 3 | |||||||||
| Cannabis tax |
229 | 229 | - | |||||||||
| Tourism levy |
200 | 200 | - | |||||||||
| Other taxes |
321 | 318 | (3 | ) | ||||||||
| 7,237 | 7,221 | (16 | ) | |||||||||
| Non-renewable resource revenue |
||||||||||||
| Bitumen royalty |
9,688 | 18,024 | 8,336 | |||||||||
| Crude oil royalty |
2,120 | 3,094 | 974 | |||||||||
| Natural gas and by-products royalty |
942 | 1,304 | 361 | |||||||||
| Bonuses and sales of Crown leases |
331 | 390 | 59 | |||||||||
| Rentals and fees / coal royalty |
131 | 143 | 12 | |||||||||
| 13,213 | 22,955 | 9,742 | ||||||||||
| Transfers from Government of Canada |
||||||||||||
| Canada Health Transfer |
7,036 | 7,036 | - | |||||||||
| Canada Social Transfer |
2,198 | 2,198 | - | |||||||||
| Direct transfers to SUCH sector / Alberta Innovates Corporation |
699 | 699 | - | |||||||||
| Infrastructure support |
928 | 1,079 | 151 | |||||||||
| Agriculture support programs |
551 | 561 | 10 | |||||||||
| Labour market agreements |
295 | 295 | - | |||||||||
| Early learning child care agreements |
1,170 | 1,172 | 2 | |||||||||
| Other federal transfers |
837 | 1,020 | 183 | |||||||||
| 13,715 | 14,061 | 346 | ||||||||||
| Investment income |
||||||||||||
| Alberta Heritage Savings Trust Fund |
2,377 | 2,355 | (22 | ) | ||||||||
| Endowment funds |
527 | 582 | 55 | |||||||||
| Income from local authority loans |
515 | 532 | 17 | |||||||||
| Agriculture Financial Services Corporation |
155 | 155 | - | |||||||||
| Other (includes SUCH sector) |
783 | 822 | 39 | |||||||||
| 4,358 | 4,446 | 88 | ||||||||||
| Net Income from government business enterprises |
||||||||||||
| AGLC – Gaming / lottery |
1,577 | 1,577 | - | |||||||||
| AGLC – Liquor and cannabis |
772 | 772 | - | |||||||||
| ATB Financial |
426 | 506 | 81 | |||||||||
| Alberta Petroleum Marketing Commission |
(313 | ) | 184 | 498 | ||||||||
| Other (AiGC / Balancing Pool / CUDGCo / PSIs) |
160 | 168 | 8 | |||||||||
| 2,621 | 3,207 | 586 | ||||||||||
| Premiums, fees and licences |
||||||||||||
| Post-secondary institution tuition fees |
2,162 | 2,162 | - | |||||||||
| Health / school board fees and charges |
1,064 | 1,064 | - | |||||||||
| Motor vehicle licences |
663 | 663 | - | |||||||||
| Crop, hail and livestock insurance premiums |
667 | 667 | - | |||||||||
| Energy industry levies |
453 | 450 | (3 | ) | ||||||||
| Other (includes land titles revenue) |
991 | 1,020 | 29 | |||||||||
| 6,000 | 6,025 | 26 | ||||||||||
| Other |
||||||||||||
| SUCH sector sales, rentals and services |
1,188 | 1,188 | - | |||||||||
| SUCH sector fundraising, donations, gifts and contributions |
1,019 | 1,019 | - | |||||||||
| AIMCo investment management charges |
867 | 843 | (24 | ) | ||||||||
| Fines and penalties |
167 | 167 | - | |||||||||
| Refunds of expense |
179 | 187 | 9 | |||||||||
| Technology Innovation and Emissions Reduction Fund |
166 | 166 | - | |||||||||
| Miscellaneous |
588 | 594 | 6 | |||||||||
| 4,173 | 4,164 | (9 | ) | |||||||||
| Total revenue |
74,550 | 86,279 | 11,729 | |||||||||
| 4 | 2026–27 First Quarter | Fiscal Update and Economic Statement | |
Revenue Highlights
Total Revenue of $86.3 billion is forecast for 2026-27, $11.7 billion higher than estimated in Budget 2026, mainly due to increases in NRR, Alberta Petroleum Marketing Commission’s net income due to improved expected operations at the Sturgeon Refinery, and federal transfers mostly for the Aging with Dignity initiative.
| • | Resource revenue is forecast to be $23 billion in 2026-27, $9.7 billion higher than budget, primarily driven by higher bitumen royalties. |
| • | The West Texas Intermediate oil price is forecast to average US$73.50 per barrel (/bbl) in 2026-27, $13/bbl higher than budget due to ongoing geopolitical events that disrupted global supply and increased market volatility. The light-heavy differential is expected to average US$14.80/ bbl for 2026-27, $1.80/bbl wider than budget. The wider differential is largely due to increased heavy oil volumes delivered to the U.S. Gulf Coast through releases from the U. S. Strategic Petroleum Reserve and higher volumes released from Venezuela. |
| • | The US-Canadian dollar exchange rate is forecast to average 72.1 US¢/Cdn$ for the fiscal year, below the budget of 73 US¢/Cdn$. A lower Canadian dollar results in higher oil prices when they are converted from US to Canadian dollars, contributing to higher government revenue. |
| • | Bitumen royalties of $18 billion are forecast, $8.3 billion higher than budget, mainly due to the stronger WTI prices and slightly lower exchange rates, which is partially offset by a wider light-heavy differential. |
| • | Crude oil royalties are forecast at $3.1 billion, a $1 billion increase from budget, driven by higher WTI prices, higher production and slightly lower exchange rate, partially offset by a wider light-heavy differential. |
| • | Natural gas and by-product royalties are forecast at $1.3 billion, $361 million higher than estimated in budget. This increase reflects higher natural gas liquids (NGLs) prices. The higher NGLs prices are driven primarily by higher crude oil prices as NGLs prices trend with oil prices. |
| • | Personal income tax revenue is forecast at $16.4 billion, an increase of $420 million from budget due to higher-than-expected 2025 tax assessments and an upward revision of personal income. |
| • | Corporate income tax revenue is forecast at $7.8 billion, up $545 million from Budget 2026 driven by stronger corporate profits. |
| • | Other tax revenue is forecast at $7.2 billion, a $16 million decline from budget, mainly due to lower tobacco tax revenue from the continued decline in tobacco consumption. |
| • | Federal transfers of $14.1 billion are forecast, $346 million higher than estimated in budget. The increase mainly reflects $151 million for re-profiling of Federal Aging with Dignity funds from 2025-26, $119 million in federal funding to improve housing supply, $25 million for mental health and addiction-related initiatives and $51 million for the re-profiling of unspent Investing in Canada Infrastructure Program (ICIP) funds from 2025-26. |
| • | Total revenue from other sources is forecast at $17.8 billion, $691 million higher than budget. |
| - | Investment income is up $88 million. Combined returns for the Heritage Fund and the endowment funds are projected higher as a result of current market conditions and long-term capital market assumptions. Other investment income also increased as a result of improved projected cash positions resulting |
| from rising benchmark rates and additional borrowing needs from the City of Calgary. |
| - | Net income from GBEs is forecast to exceed budget by $586 million, mainly due to stronger-than-expected Sturgeon Refinery results. Higher product prices are expected to more than offset increased crude oil costs, resulting in additional revenue. |
| - | Premiums, fees and licences are forecast to be $26 million higher than budget primarily from higher payment in lieu of taxes and the deposit guarantee fee, resulting from strong performance of ATB Financial. |
| - | Other revenue is forecast to be $9 million lower than budget on a net basis, primarily due to a $24 million reduction in Alberta Investment Management Corporation (AIMCo) investment management charges resulting from lower than anticipated use of external fund managers. |
| 2026–27 First Quarter | Fiscal Update and Economic Statement | 5 | |
Operating Expense by Ministry
(millions of dollars)
| Fiscal Year | Change
from
Budget |
|||||||||||
| 2026-27 | ||||||||||||
| Budget | Forecast | |||||||||||
| Advanced Education |
7,110 | 7,110 | - | |||||||||
| Affordability and Utilities |
146 | 146 | - | |||||||||
| Agriculture and Irrigation |
828 | 838 | 10 | |||||||||
| Arts, Culture and Status of Women |
407 | 409 | 2 | |||||||||
| Assisted Living and Social Services |
11,154 | 11,302 | 148 | |||||||||
| Children and Family Services |
1,684 | 1,683 | (1 | ) | ||||||||
| Education and Childcare |
12,865 | 12,865 | - | |||||||||
| Energy and Minerals |
865 | 992 | 127 | |||||||||
| Environment and Protected Areas |
402 | 403 | 1 | |||||||||
| Executive Council |
102 | 107 | 5 | |||||||||
| Forestry and Parks |
380 | 398 | 18 | |||||||||
| Hospital and Surgical Health Services |
13,048 | 13,048 | - | |||||||||
| Indigenous Relations |
259 | 258 | (1 | ) | ||||||||
| Infrastructure |
507 | 507 | - | |||||||||
| Jobs, Economy, Trade and Immigration |
354 | 354 | - | |||||||||
| Justice |
768 | 770 | 2 | |||||||||
| Mental Health and Addiction |
2,230 | 2,213 | (17 | ) | ||||||||
| Municipal Affairs |
273 | 273 | - | |||||||||
| Primary and Preventative Health Services |
11,551 | 11,551 | - | |||||||||
| Public Safety and Emergency Services |
1,458 | 1,459 | 1 | |||||||||
| Service Alberta and Red Tape Reduction |
211 | 211 | - | |||||||||
| Technology and Innovation |
850 | 850 | - | |||||||||
| Tourism and Sport |
166 | 166 | - | |||||||||
| Transportation and Economic Corridors |
565 | 565 | - | |||||||||
| Treasury Board and Finance |
2,003 | 2,341 | 338 | |||||||||
| Legislative Assembly |
213 | 214 | 1 | |||||||||
| Total operating expense |
70,398 | 71,034 | 635 | |||||||||
| 6 | 2026–27 First Quarter | Fiscal Update and Economic Statement | |
Expense Highlights
Total Expense of $84.2 billion is forecast, a $0.3 billion increase from budget, reflecting $315 million in expense offset by dedicated revenue.
| • | Operating expense is forecast at $71 billion, $635 million more than Budget 2026. This increase is primarily due to: |
| - | $357 million increase for the Alberta Energy Rebate for the quarter beginning on July 1, 2026. |
| - | $149 million increase for federally funded Aging with Dignity initiative which supports Alberta’s five-year action plan to enhance seniors’ care, fully offset by revenue. |
| - | $127 million net increase mainly due to higher costs of selling oil driven by increased crude oil volumes, higher tariffs and trucking costs. |
| - | $18 million increase for Mercer International to support the stabilization and optimization of the Mercer Peace River Pulp Mill and Recreational Licence Management System which is fully offset by revenue. |
| - | $16 million increase in motor vehicle accident claims received but not yet settled and in rising average settlement costs. |
| - | $10 million increase to re-profile unspent Sustainable Canadian Agriculture Partnership funding from the prior year, fully offset by federal revenue. |
| - | $6 million increase for re-profiling for the National Action Plan to End Gender Based Violence, the federal Low Carbon Economy Leadership Fund and the Gang Violence Action Fund, fully offset by federal revenue. |
| - | These increases are partially offset by $48 million decrease mostly due to adjusted timelines for compassionate intervention implementation to align with facility enhancements. |
| • | Capital grants of $3.9 billion are forecast, up $275 million from budget, primarily from re-profiling 2025-26 projects into 2026-27, including for affordable housing programs, seniors lodge programs, recovery communities, the Alberta Broadband Strategy and others. |
| • | Debt servicing costs are forecast $225 million lower than budget, due mainly to lower borrowing requirements as a result of the improved surplus. |
| • | Disaster and emergency assistance of $106 million is forecast for wildfires and tornado damage recovery. This includes $104.7 million for wildfire presuppression and response based on wildfire expenses that have been committed and incurred as of July 2026, including replanting previously reforested areas that were affected by wildfires during the 2025 wildfire season and $1.5 million for tornado damage that are not covered by insurance or by the Hazard Assistance and Resilience Program. |
| • | A contingency of $2 billion was included in Budget 2026. Increases in expense not offset by dedicated revenue are included in the preliminary contingency allocation. $0.5 billion in expense increases are forecast as the preliminary allocation from the budgeted contingency. The government continues to monitor its risks and other factors. The $1.5 billion remaining in contingency is available to address impacts as required. |
Budget 2026-27 Contingency
(millions of dollars)
| Budget 2026-27 |
2,000 | |||||||
| Expense increases: |
||||||||
| Emergency / disaster assistance |
106 | |||||||
| Other |
689 | |||||||
| Total expense increases |
796 | |||||||
| Less dedicated revenue / expense |
(315 | ) | ||||||
| Preliminary contingency allocation |
480 | (480 | ) | |||||
| Unallocated contingency |
1,520 |
| 2026–27 First Quarter | Fiscal Update and Economic Statement | 7 | |
Balance Sheet Summary
(millions of dollars)
| At March 31 |
Change from Budget |
|||||||||||
| 2027 | ||||||||||||
| Budget | Forecast | |||||||||||
| Financial assets |
||||||||||||
| Alberta Heritage Savings Trust Fund |
32,082 | 32,082 | - | |||||||||
| Endowment funds: |
||||||||||||
| Alberta Heritage Foundation for Medical Research |
2,838 | 3,087 | 248 | |||||||||
| Alberta Heritage Science and Engineering Research |
1,646 | 1,779 | 132 | |||||||||
| Alberta Heritage Scholarship |
1,843 | 2,005 | 162 | |||||||||
| Alberta Enterprise Corporation |
315 | 315 | - | |||||||||
| General Revenue Fund - surplus cash |
- | - | - | |||||||||
| General Revenue Fund - debt retirement |
- | - | - | |||||||||
| Alberta Fund |
- | - | - | |||||||||
| Self-supporting lending organizations / activities: |
||||||||||||
| Loans to local authorities |
15,932 | 16,842 | 910 | |||||||||
| Agriculture Financial Services Corporation |
4,439 | 5,501 | 1,062 | |||||||||
| Equity in commercial enterprises: ATB / AGLC / APMC / CUDGCo / Bal. Pool / PSIs |
853 | 1,612 | 759 | |||||||||
| Student loans |
5,265 | 5,265 | - | |||||||||
| Technology Innovation and Emissions Reduction Fund |
1,173 | 1,173 | - | |||||||||
| Other financial assets (including SUCH sector / Alberta Innovates Corp.) |
21,783 | 20,738 | (1,044 | ) | ||||||||
| Total financial assets |
88,169 | 90,399 | 2,230 | |||||||||
| Liabilities |
||||||||||||
| Taxpayer-supported debt: |
||||||||||||
| Direct borrowing for the Capital Plan |
61,849 | 57,252 | (4,597 | ) | ||||||||
| Alternative financing (P3s - public-private partnerships - Capital Plan) |
2,525 | 2,441 | (84 | ) | ||||||||
| Debt issued to reduce pre-1992 Teachers’ Pension Plan unfunded liability |
451 | 451 | - | |||||||||
| Direct borrowing for the Fiscal Plan |
44,041 | 34,669 | (9,373 | ) | ||||||||
| Total taxpayer-supported debt |
108,867 | 94,813 | (14,053 | ) | ||||||||
| Self-supporting lending organization / activities debt: |
||||||||||||
| Debt issued to for loans to local authorities |
15,932 | 16,842 | 910 | |||||||||
| Agriculture Financial Services Corporation |
3,907 | 3,697 | (210 | ) | ||||||||
| Total taxpayer and self-supported debt |
128,705 | 115,352 | (13,353 | ) | ||||||||
| Coal phase-out liabilities |
353 | 353 | - | |||||||||
| Pension liabilities |
6,884 | 6,884 | - | |||||||||
| Asset retirement obligations |
2,567 | 2,567 | - | |||||||||
| Other liabilities (including SUCH sector / Alberta Innovates Corp.) |
1,023 | 5,523 | 4,500 | |||||||||
| Total liabilities |
139,532 | 130,678 | (8,854 | ) | ||||||||
| Net financial assets / (debt) |
(51,363 | ) | (40,280 | ) | 11,083 | |||||||
| Capital / other non-financial assets |
66,383 | 66,754 | 371 | |||||||||
| Spent deferred capital contributions |
(4,018 | ) | (4,058 | ) | (40 | ) | ||||||
| Net assets |
11,002 | 22,416 | 11,414 | |||||||||
| Net assets / (liabilities) - statement of operations |
7,460 | 18,874 | 11,414 | |||||||||
| Accumulated remeasurement gains |
3,542 | 3,542 | - | |||||||||
| Change in net assets - statement of operations (before adjustments) |
(9,373 | ) | 2,041 | 11,414 | ||||||||
| Net financial debt / GDP (calendar year, nominal) |
-10.5% | -7.7% | ||||||||||
| 8 | 2026–27 First Quarter | Fiscal Update and Economic Statement | |
Assets and Liabilities
Financial Assets of $90.4 billion are forecast as at March 31, 2027, an increase of $2.2 billion from Budget 2026.
| • | Heritage, endowment funds and the Alberta Enterprise Corporation (AEC) accumulated surpluses are forecast to grow $0.5 billion. Net income of the Alberta Heritage Savings Trust Fund (Heritage Fund) is retained in the fund, while the net assets of the three endowment funds and AEC have increased a net $542 million, mainly due to increased income. |
| • | At March 31, 2027, no surplus cash is forecast to be available for allocation. |
| • | Financial assets from self-supported lending activity and Agriculture Financial Services Corporation (AFSC) are increasing $2 billion, primarily as a result of improved AFSC cash flow. |
| • | Commercial enterprise equity is a net $0.8 million higher than budgeted, due mainly to forecast operating improvements at the Sturgeon Refinery, partially offset by decreased net income mainly from ATB Financial. |
| • | Other financial assets are forecast to be $1 billion less than Budget 2026. These include financial assets of school boards, universities and colleges, and the health authority, student loans, accounts and interest receivable, natural gas royalty deposits, cash associated with future liabilities such as corporate income tax refunds, the cash reserve, and derivative financial instruments. |
Liabilities are forecast at $130.7 billion at March 31, 2027, $8.9 billion less than Budget 2026.
Taxpayer-supported debt is estimated at $94.8 billion, $14.1 billion less than budgeted.
| • | Liabilities for capital projects are down $4.7 billion from budget as a result of improved overall financial position, partially offset by an increase of $84 million in alternative financing principal repayments under public-private partnership (P3) driven by additional funding for school projects under the Schools Now program. |
| • | Borrowing for the Fiscal Plan is now forecast at $34.7 billion, down $9.4 billion from budget as a result of the improvement in the 2026-27 forecast. |
| • | Debt issued to support loans to AFSC and to local authorities is increasing by a net $0.7 billion from budget due to increase in issued loans to the City of Calgary. |
| • | Other liabilities are $4.5 billion higher than budgeted. These include liabilities of the school boards, universities, colleges, health entities (SUCH) sector, coal phase-out liabilities, asset retirement obligations and other liabilities. |
| • | Government obligations for pension plan liabilities have remained unchanged from budget, at $6.9 billion. |
Net financial debt (financial assets less liabilities) as at March 31, 2027, is estimated at $40.3 billion, $11.1 billion lower than budgeted, reflecting the improvement in the forecast for 2026-27. Net debt to GDP is estimated at 7.7 per cent.
Capital and other non-financial assets of $66.8 billion are forecast for March 31, 2027, a $0.4 billion net increase from budget, reflecting capital asset acquisition. Deferred capital contribution liabilities remained largely unchanged at $4.1 billion.
Net Assets - operating of $18.9 billion are forecast as at March 31, 2027, a $11.4 billion increase from budget, reflecting the improved forecast for 2026-27.
Net Assets of $22.4 billion are forecast as at March 31, 2027, consisting of net assets - operating and accumulated remeasurement gains and losses.
| 2026–27 First Quarter | Fiscal Update and Economic Statement | 9 | |
Cash Adjustments
The consolidated financial statements, Fiscal Plan and quarterly forecasts are prepared in accordance with Canadian Public Sector Accounting Standards (PSAS). The consolidated financial reports of the province include the accounts of organizations that meet the criteria of control under PSAS and the accounts of the Offices of the Legislative Assembly and the Offices of the Legislature.
The forecast surplus includes various non-cash items required under these accounting standards. Other cash transactions reported on the balance sheet are not included in the surplus.
In order to determine the cash position of the General Revenue Fund (GRF), various adjustments to the surplus to remove the impact of these non-cash items and to account for balance sheet transactions are required.
There are three main categories of cash adjustments. Details for each category are included below.
Retained income of funds and agencies
Since the government reports on a consolidated basis, the income and expense of funds and agencies is included in revenue and expense that is used to calculate the surplus. These entities retain their cash or fund any shortfalls. Cash is not transferred to or from the GRF for these amounts.
In total, funds and agencies retain $4.4 billion of revenue. Examples of these cash adjustments include:
| • | $2.4 billion in investment income is included in the surplus for the Heritage Fund. The fund retains the income and no cash is transferred to the GRF. As a result, a negative adjustment of $2.4 billion to the surplus is required. |
| • | $506 million in net income is reported as revenue for ATB Financial but no cash is transferred to the GRF. A negative cash adjustment is required. |
In addition to these adjustments, ATB Financial has committed to pay to the government a $100 million dividend annually. This represents cash transferred from ATB Financial to the GRF but is not included in revenue or expense, increasing the cash available.
Other cash adjustments
Other cash adjustments mainly reflect the differences between accrual accounting required by PSAS and cash transactions. In total, $3.3 billion in positive cash adjustments are required. Examples of other cash adjustments include:
| • | $3.3 billion for energy royalties. There is a timing difference between when revenue from oil royalties is reported and when cash is received. Revenue from energy royalties is reported when it is earned in a fiscal year (April 1 to March 31), while the cash is not received until later. A positive adjustment of $3.3 billion is required in 2026-27 as the cash from higher oil prices at the end of 2025-26 is now being received. The volatility in this cash adjustment mirrors the volatility in energy prices. |
| • | A negative adjustment of $189 million is required to account for the difference in how much cash was provided in student loans compared to how much cash was paid back. The cash transactions for student loans and repayments are reported on the balance sheet. They are not included in revenue or expense and are not captured in the surplus. |
Capital Cash Adjustments
Adjustments are also required to the surplus due to the way accounting standards require reporting of capital assets. Cash is needed for capital investment project construction, but accounting standards require reporting the expense for the asset once it is fully constructed through non-cash amortization expense over the asset’s useful life.
| • | A negative $3.3 billion cash adjustment mainly reflects the difference between the $6.2 billion in cash required for capital investment net of a 10 per cent adjustment for the regular re-profiling of cash flows that typically occurs in a fiscal year, and $1.8 billion for amortization included in expense. |
Surplus Cash Allocation
After $4.3 billion in net negative cash adjustments, there is no surplus cash available for allocation in 2026-27. The negative cash amount of $2.3 billion represents new, additional borrowing required in 2026-27. A detailed table of cash adjustments is included on page 15. The government will continue to evaluate its financial position as the fiscal year unfolds.
| Surplus cash available for allocation / debt maturities |
||||
| (billions of dollars)
|
||||
| Surplus cash available for allocation: |
||||
| From 2025-26 results |
- | |||
| Allocation to Heritage Fund |
- | |||
| 2026-27 surplus |
2.0 | |||
| less entity retained income |
(4.4 | ) | ||
| less capital plan requirements |
(3.3 | ) | ||
| add net other cash adjust. |
3.3 | |||
| add ATB Financial dividend |
0.1 | |||
| Total cash available |
(2.3 | ) | ||
| Debt maturities |
||||
| 2026-27 maturities |
11.0 | |||
| 2027-28 maturities |
7.3 | |||
| 2028-29 maturities |
5.0 | |||
| 10 | 2026–27 First Quarter | Fiscal Update and Economic Statement | |
Capital Plan Highlights
The 2026-27 Capital Plan is forecast at $10.7 billion, up $717 million from Budget 2026. This increase includes $275 million in capital grants and $442 million in capital investment. The increase is primarily due to the re-profiling of unspent funds from 2025-26 to align project cash flows with project progress, as well as additional funding to support the ongoing commitment to accelerate schools through the Schools Now program. The $275 million increase in capital grants is primarily due to re-profiling for affordable housing projects jointly funded by the federal government, recovery community projects, and the Alberta Broadband Strategy. The re-profiling aligns funding with project construction schedules and updated cash flows.
The $442 million increase to capital investment includes new funding of $137 million for 45 school projects under the Schools Now program, supporting acceleration of projects that will provide and upgrade more than 39,000 student spaces. Additionally, $26 million in new funding was approved for major modernization upgrades to Calgary’s Olympic Oval, $15 million was added for Mental Health and Addiction facilities, and $7 million was added for rebuilding the Pine Grove Manor in Jasper, a senior citizens facility destroyed during the July 2024 Jasper wildfires.
The remaining $257 million increase to capital investment is driven by re-profiling of unspent funds from 2025-26 on approved projects, primarily related to health initiatives and information technology projects. Of the re-profiling, $80 million in capital
investment vote authority is carried over from 2025-26, including $27 million for Technology and Innovation, $11 million for Agriculture and Irrigation, $7 million for Forestry and Parks, $7 million for Public Safety and Emergency Services, $7 million for Primary and Preventative Health Services, $6 million for Justice, $5 million for Assisted Living and Social Services, and $10 million for other ministries.
The re-profiling reflects revised project cash flows based on project schedules and overall progress made on projects.
The Capital Plan is funded from a variety of sources, including the federal government; donations; school boards, post-secondary institutions, health sector organizations, and other funds and agencies; public-private partnerships; and General Revenue Fund or borrowed cash. More details can be found in the table on page 14.
Capital Plan Summary
(millions of dollars)
| Fiscal Year | Change
from
Budget |
|||||||||||
| 2026-27 | ||||||||||||
| Budget | Forecast | |||||||||||
| Advanced Education |
595 | 622 | 28 | |||||||||
| Affordability and Utilities |
7 | 7 | - | |||||||||
| Agriculture and Irrigation |
104 | 115 | 11 | |||||||||
| Arts, Culture and Status of Women |
39 | 40 | 2 | |||||||||
| Assisted Living and Social Services |
694 | 859 | 165 | |||||||||
| Children and Family Services |
3 | 7 | 4 | |||||||||
| Education and Childcare |
1,636 | 1,644 | 8 | |||||||||
| Energy and Minerals |
37 | 38 | - | |||||||||
| Environment and Protected Areas |
69 | 70 | - | |||||||||
| Forestry and Parks |
147 | 156 | 9 | |||||||||
| Hospital and Surgical Health Services |
446 | 605 | 158 | |||||||||
| Indigenous Relations |
8 | 11 | 3 | |||||||||
| Infrastructure |
1,335 | 1,480 | 146 | |||||||||
| Jobs, Economy, Trade and Immigration |
5 | 6 | 2 | |||||||||
| Justice |
30 | 36 | 6 | |||||||||
| Mental Health and Addiction |
27 | 68 | 41 | |||||||||
| Municipal Affairs |
1,105 | 1,111 | 5 | |||||||||
| Primary and Preventative Health Services |
42 | 65 | 23 | |||||||||
| Public Safety and Emergency Services |
32 | 40 | 7 | |||||||||
| Service Alberta and Red Tape Reduction |
55 | 55 | - | |||||||||
| Technology and Innovation |
352 | 418 | 66 | |||||||||
| Tourism and Sport |
11 | 16 | 5 | |||||||||
| Transportation and Economic Corridors |
3,166 | 3,194 | 28 | |||||||||
| Treasury Board and Finance |
20 | 21 | 1 | |||||||||
| Legislative Assembly |
4 | 4 | - | |||||||||
| Total capital plan |
9,969 | 10,687 | 717 | |||||||||
| 2026–27 First Quarter | Fiscal Update and Economic Statement | 11 | |
2026-27 First Quarter Fiscal Update Tables
Consolidated Fiscal Summary
(millions of dollars)
| Fiscal Year | Change
from
Budget |
|||||||||||
| 2026-27 | ||||||||||||
| Budget | Forecast | |||||||||||
| Total revenue |
74,550 | 86,279 | 11,729 | |||||||||
| Expense |
||||||||||||
| Operating expense |
70,398 | 71,034 | 635 | |||||||||
| Capital grants |
3,672 | 3,947 | 275 | |||||||||
| Amortization / inventory consumption / loss on disposals |
4,853 | 4,857 | 3 | |||||||||
| Taxpayer-supported debt servicing costs |
2,838 | 2,597 | (242 | ) | ||||||||
| Self-supported debt servicing costs |
568 | 585 | 17 | |||||||||
| Pension provisions |
(408 | ) | (408 | ) | - | |||||||
| Disaster and emergency assistance |
- | 106 | 106 | |||||||||
| Expense before contingency |
81,922 | 82,718 | 796 | |||||||||
| Contingency (forecast un-allocated) |
2,000 | 1,520 | (480 | ) | ||||||||
| Total expense |
83,922 | 84,237 | 315 | |||||||||
| Surplus / (deficit) |
(9,373 | ) | 2,041 | 11,414 | ||||||||
| Capital Plan |
||||||||||||
| Capital grants |
3,672 | 3,947 | 275 | |||||||||
| Capital investment |
6,297 | 6,739 | 442 | |||||||||
| Total capital plan |
9,969 | 10,687 | 717 | |||||||||
| Cash Adjustments / Borrowing Requirements |
(at March 31) | |||||||||||
| Cash at start of year / Alberta Fund |
- | - | - | |||||||||
| Alberta Fund allocation - Heritage Fund |
- | - | - | |||||||||
| Surplus / (deficit) |
(9,373 | ) | 2,041 | 11,414 | ||||||||
| Cash adjustments |
||||||||||||
| Retained income of funds and agencies |
(4,069 | ) | (4,443 | ) | (373 | ) | ||||||
| Other cash adjustments |
(32 | ) | 3,306 | 3,338 | ||||||||
| Capital cash adjustments |
(2,931 | ) | (3,256 | ) | (325 | ) | ||||||
| ATB Financial dividend |
100 | 100 | - | |||||||||
| Surplus cash (cash at start of year + surplus +/- net cash adjustments) / Heritage Fund |
(16,304 | ) | (2,251 | ) | 14,053 | |||||||
| Less: Taxpayer-supported debt repayment |
- | - | - | |||||||||
| Less: Allocation to Alberta Fund |
- | - | - | |||||||||
| Direct borrowing required |
16,304 | 2,251 | (14,053 | ) | ||||||||
| Cash at end of year |
- | - | - | |||||||||
| Taxpayer-supported Liabilities / Borrowing |
||||||||||||
| Total taxpayer-supported debt |
108,867 | 94,813 | (14,053 | ) | ||||||||
| 12 | 2026–27 First Quarter | Fiscal Update and Economic Statement | |
Disaster and Emergency Assistance
(millions of dollars)
| Fiscal Year | Change
from
Budget |
|||||||||||
| 2026-27 | ||||||||||||
| Budget | Forecast | |||||||||||
| Forestry and Parks - wildfire presuppression and response & tornado funding |
- | 106 | 106 | |||||||||
| Total disaster and emergency assistance expense |
- | 106 | 106 | |||||||||
| Capital Amortization | ||||||||||||
| (millions of dollars) | Fiscal Year | Change
from
Budget |
||||||||||
| 2026-27 | ||||||||||||
| Budget | Forecast | |||||||||||
| Advanced Education |
556 | 556 | - | |||||||||
| Affordability and Utilities |
2 | 2 | - | |||||||||
| Agriculture and Irrigation |
50 | 50 | - | |||||||||
| Assisted Living and Social Services |
61 | 61 | - | |||||||||
| Education and Childcare |
530 | 530 | - | |||||||||
| Energy and Minerals |
13 | 13 | - | |||||||||
| Environment and Protected Areas |
4 | 4 | - | |||||||||
| Forestry and Parks |
40 | 40 | - | |||||||||
| Hospital and Surgical Health Services |
301 | 301 | - | |||||||||
| Infrastructure |
445 | 445 | - | |||||||||
| Jobs, Economy, Trade and Immigration |
1 | 1 | - | |||||||||
| Justice |
7 | 7 | - | |||||||||
| Mental Health and Addiction |
1 | 1 | - | |||||||||
| Primary and Preventative Health Services |
47 | 47 | - | |||||||||
| Public Safety and Emergency Services |
29 | 29 | - | |||||||||
| Service Alberta and Red Tape Reduction |
8 | 8 | - | |||||||||
| Technology and Innovation |
71 | 71 | - | |||||||||
| Tourism and Sport |
7 | 7 | - | |||||||||
| Transportation and Economic Corridors |
925 | 925 | - | |||||||||
| Treasury Board and Finance |
12 | 12 | - | |||||||||
| Legislative Assembly |
3 | 3 | - | |||||||||
| Total amortization expense |
3,113 | 3,113 | - | |||||||||
| Inventory Consumption | ||||||||||||
| (millions of dollars) | Fiscal Year | Change
from
Budget |
||||||||||
| 2026-27 | ||||||||||||
| Budget | Forecast | |||||||||||
| Advanced Education |
72 | 72 | - | |||||||||
| Assisted Living and Social Services |
33 | 33 | - | |||||||||
| Forestry and Parks |
1 | 1 | - | |||||||||
| Hospital and Surgical Health Services |
1,314 | 1,314 | - | |||||||||
| Infrastructure |
6 | 6 | - | |||||||||
| Mental Health and Addiction |
19 | 19 | - | |||||||||
| Primary and Preventative Health Services |
225 | 225 | - | |||||||||
| Public Safety and Emergency Services |
1 | 1 | - | |||||||||
| Service Alberta and Red Tape Reduction |
1 | 1 | - | |||||||||
| Tourism and Sport |
1 | 1 | - | |||||||||
| Transportation and Economic Corridors |
66 | 70 | 4 | |||||||||
| Total inventory consumption expense |
1,740 | 1,744 | 4 | |||||||||
| 2026–27 First Quarter | Fiscal Update and Economic Statement | 13 | |
Debt Servicing Costs
(millions of dollars)
| Fiscal Year | Change
from
Budget |
|||||||||||
| 2026-27 | ||||||||||||
| Budget | Forecast | |||||||||||
| Taxpayer-supported general debt servicing costs |
||||||||||||
| Education and Childcare – school boards |
9 | 9 | - | |||||||||
| Treasury Board and Finance |
1,170 | 1,065 | (105 | ) | ||||||||
| Total |
1,179 | 1,073 | (105 | ) | ||||||||
| Taxpayer-supported capital plan debt servicing costs |
||||||||||||
| Education and Childcare – Alberta schools alternative procurement P3s |
32 | 32 | - | |||||||||
| Transportation and Economic Corridors– ring road P3s |
108 | 108 | - | |||||||||
| Treasury Board and Finance – direct borrowing |
1,520 | 1,383 | (137 | ) | ||||||||
| Total |
1,660 | 1,523 | (137 | ) | ||||||||
| Total taxpayer-supported debt servicing costs |
2,838 | 2,597 | (242 | ) | ||||||||
| Self-supported debt servicing costs |
||||||||||||
| Treasury Board and Finance – loans to local authorities |
468 | 483 | 14 | |||||||||
| Treasury Board and Finance – Ag. Financial Services Corp. |
100 | 103 | 3 | |||||||||
| Total self-supported debt servicing costs |
568 | 585 | 17 | |||||||||
| Total debt servicing costs |
3,407 | 3,182 | (225 | ) | ||||||||
| Inventory Acquisition |
||||||||||||
| (millions of dollars) |
||||||||||||
| Fiscal Year | Change
from
Budget |
|||||||||||
| 2026-27 | ||||||||||||
| Budget | Forecast | |||||||||||
| Advanced Education |
67 | 67 | - | |||||||||
| Assisted Living and Social Services |
33 | 33 | - | |||||||||
| Forestry and Parks |
1 | 1 | - | |||||||||
| Hospital and Surgical Health Services |
1,314 | 1,314 | - | |||||||||
| Infrastructure |
6 | 6 | - | |||||||||
| Mental Health and Addiction |
19 | 19 | - | |||||||||
| Primary and Preventative Health Services |
227 | 227 | - | |||||||||
| Service Alberta and Red Tape Reduction |
1 | 1 | - | |||||||||
| Tourism and Sport |
1 | 1 | - | |||||||||
| Transportation and Economic Corridors |
66 | 70 | 4 | |||||||||
| Total inventory acquisition |
1,735 | 1,739 | 4 | |||||||||
| Capital Plan Funding Sources |
||||||||||||
| (millions of dollars) |
||||||||||||
| Fiscal Year | Change
from
Budget |
|||||||||||
| 2026-27 | ||||||||||||
| Budget | Forecast | |||||||||||
| Capital Plan, less |
9,969 | 10,687 | 717 | |||||||||
| Non-cash adjustments |
13 | 10 | (2 | ) | ||||||||
| Cash requirement adjustment |
(997 | ) | (1,069 | ) | (72 | ) | ||||||
| Capital Plan funding requirements |
8,985 | 9,628 | 643 | |||||||||
| Source of funding: |
||||||||||||
| Cash received / assets donated / book value of disposals |
915 | 992 | 77 | |||||||||
| Retained income of funds and agencies |
63 | 40 | (22 | ) | ||||||||
| SUCH sector self-financed |
513 | 557 | 44 | |||||||||
| Technology Innovation and Emissions Reduction Fund |
- | - | - | |||||||||
| Alternative financing (P3s – public-private partnerships) |
116 | 116 | - | |||||||||
| General revenue fund cash / direct borrowing |
7,379 | 7,924 | 545 | |||||||||
| Total capital plan funding sources |
8,985 | 9,628 | 643 | |||||||||
| 14 | 2026–27 First Quarter | Fiscal Update and Economic Statement | |
| Cash Adjustments / GRF Cash and Allocation |
||||||||||||
| (millions of dollars) |
||||||||||||
| Fiscal Year | Change
from
Budget |
|||||||||||
| 2026-27 | ||||||||||||
| Budget | Forecast | |||||||||||
| Retained income of funds and agencies |
||||||||||||
| Alberta Heritage Savings Trust Fund |
(2,225 | ) | (2,271 | ) | (46 | ) | ||||||
| ATB Financial |
(426 | ) | (506 | ) | (81 | ) | ||||||
| Agriculture Financial Services Corporation |
(1,192 | ) | (1,062 | ) | 129 | |||||||
| Heritage Foundation for Medical Research Endowment Fund |
(221 | ) | (248 | ) | (28 | ) | ||||||
| Heritage Science and Engineering Research Endowment Fund |
(127 | ) | (132 | ) | (6 | ) | ||||||
| Heritage Scholarship Fund |
(141 | ) | (162 | ) | (21 | ) | ||||||
| Alberta Social Housing Corporation |
(10 | ) | 202 | 212 | ||||||||
| Credit Union Deposit Guarantee Corporation |
(19 | ) | (19 | ) | - | |||||||
| Alberta Petroleum Marketing Commission |
313 | (184 | ) | (498 | ) | |||||||
| Technology Innovation and Emissions Reduction Fund |
(17 | ) | (17 | ) | - | |||||||
| Balancing Pool |
(66 | ) | (70 | ) | (4 | ) | ||||||
| Other |
59 | 27 | (32 | ) | ||||||||
| Total retained income of funds and agencies |
(4,069 | ) | (4,443 | ) | (373 | ) | ||||||
| Other cash adjustments |
||||||||||||
| SUCH sector own-source revenue |
(6,479 | ) | (6,612 | ) | (134 | ) | ||||||
| SUCH sector own-source expense |
7,425 | 7,380 | (45 | ) | ||||||||
| Net deferred capital contribution cash adjustment |
(69 | ) | (20 | ) | 49 | |||||||
| Energy royalties (difference between accrued revenue & cash) |
107 | 3,444 | 3,337 | |||||||||
| Student loans |
(189 | ) | (189 | ) | - | |||||||
| Other cash adjustments |
(414 | ) | (351 | ) | 63 | |||||||
| Disaster assistance revenue / expense |
- | (48 | ) | (48 | ) | |||||||
| Pension provisions (non-cash expense) |
(408 | ) | (408 | ) | - | |||||||
| Inventory acquisition (excluding SUCH sector; non-cash expense) |
(224 | ) | (118 | ) | 107 | |||||||
| Inventory consumption (excluding SUCH sector; non-cash expense) |
219 | 229 | 10 | |||||||||
| Total other cash adjustments |
(32 | ) | 3,306 | 3,338 | ||||||||
| Capital cash adjustments |
||||||||||||
| Capital investment (excluding SUCH sector self-financed) |
(5,784 | ) | (6,183 | ) | (398 | ) | ||||||
| Cash requirement adjustment |
997 | 1,069 | 72 | |||||||||
| Current principal repayments (P3s – public-private partnerships) |
(91 | ) | (84 | ) | 7 | |||||||
| Alternative financing (P3s – public-private partnerships) |
116 | 116 | - | |||||||||
| Amortization (excluding SUCH sector; non-cash expense) |
1,832 | 1,826 | (6 | ) | ||||||||
| Book value of asset disposals (net non-cash expense / revenue) |
- | - | - | |||||||||
| Total capital cash adjustments |
(2,931 | ) | (3,256 | ) | (325 | ) | ||||||
| ATB Financial dividend |
100 | 100 | - | |||||||||
| Total cash adjustments |
(6,932 | ) | (4,292 | ) | 2,639 | |||||||
| 2026–27 First Quarter | Fiscal Update and Economic Statement | 15 | |
Reporting Methodology and Legislative Compliance
Method of Consolidation
The 2026-27 First Quarter Fiscal Update and Economic Statement reports on the same scope, using the same method of consolidation, as presented in Budget 2026. This is also the same scope and consolidation approach used in the Consolidated Financial Statements in the Government of Alberta Annual Report.
The results of all government departments, funds and agencies, except those designated as government business enterprises, are consolidated on a line-by-line basis. Revenue and expense transactions between consolidated entities have been eliminated.
The accounts of provincial agencies designated as government business enterprises are included on the modified equity basis, computed in accordance with International Financial Reporting Standards applicable to those entities.
Basis of Financial Reporting
The consolidated fiscal summary reports revenue (including gains from disposal of tangible capital assets), expense (including amortization, inventory consumption, loss on disposal and write-down of tangible capital assets), and surplus / (deficit).
Revenue and expense are recorded using the accrual basis of accounting. Cash received for goods or services which have not been provided by period end is recorded as unearned revenue.
Transfers received for capital purposes, and donated capital assets, are recorded as “deferred capital contributions” when the cash or asset is received, and recognized in revenue over the related asset’s useful life (in effect matching the asset’s amortization expense).
Expense includes the province’s cash payments towards the unfunded pension liabilities, and the non-cash change in unfunded pension liabilities.
Debt servicing costs include interest payable, and amortization of issue costs and discounts / premiums on debt issues.
Assets and liabilities include recognition of asset retirement obligations and accumulated remeasurement gains and losses.
Compliance with Legislation
The Sustainable Fiscal Planning and Reporting Act (SFPRA) requires a report to be published on the accuracy of the Fiscal Plan for a fiscal year on or before August 31. The SFPRA gives the President of Treasury Board and Minister of Finance discretion over the form of the report.
The 2026-27 First Quarter Fiscal Update and Economic Statement includes comparisons between the Budget 2026 estimates and first quarter forecasts for revenue and expense (including details and categories of each); the surplus / (deficit); cash adjustments and balance; a summary balance sheet; the Capital Plan; and borrowing requirements and sources. An updated Alberta economic outlook, with associated assumptions, is also provided.
The forecast provided in this report is in compliance with the requirements of the SFPRA.
| 16 | 2026–27 First Quarter | Fiscal Update and Economic Statement | |
Fiscal Update and
Economic Statement
2026-27 First Quarter
Economic Update
Overview
The outlook for Alberta’s economy has improved considerably since Budget 2026, primarily as a result of higher commodity prices. The Alberta Activity Index, a measure of provincial economic activity, gained momentum in the second quarter, and year-over-year growth accelerated to 4.3 per cent in May.
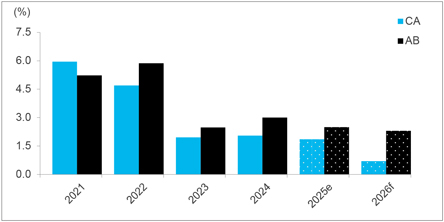
Strong activity in the energy sector this year has been accompanied by a pickup in manufacturing and agriculture exports, while progress on major projects is boosting investment and construction activity. Job gains and consumer spending are exceeding expectations, and the slowdown in population growth and housing construction has been slightly more moderate than anticipated. Alberta’s real gross domestic product (GDP) is now forecast to grow by 2.3 per cent in 2026, an increase of 0.5 percentage points from budget (Chart 1). While slightly slower than 2025, the deceleration is considerably less pronounced than at the national level, with Alberta continuing to significantly outperform other provinces.
Momentum in the economy is expected to carry into 2027. Population growth is expected to strengthen modestly in 2027 after reaching a low in 2026, while major projects continue to support investment and economic activity. Together, these factors are expected to lift real GDP growth to 2.5 per cent in 2027, up from the 2.3 per cent projected at budget.
Higher commodity prices have led to a large upward revision to nominal GDP, which is a broad measure of incomes in the province. It is expected to increase 8.4 per cent in 2026, up from the 1.9 per cent growth forecast in budget. The most notable change is in corporate profits, which are now expected to increase in 2026 after a decline was initially forecast. Government revenues and household incomes have also been revised substantially higher, reflecting the broad-based improvements this year.
While the outlook for Alberta’s economy has improved, it remains highly uncertain. Geopolitical tensions in the Middle East and the risk of further disruptions to global energy markets could prolong inflationary pressures and weigh on growth in major trading partners. At the same time, significant uncertainty surrounding U.S. trade policy and global
economic conditions continues to pose risks to investment and export demand.
Price shock adds to global uncertainty
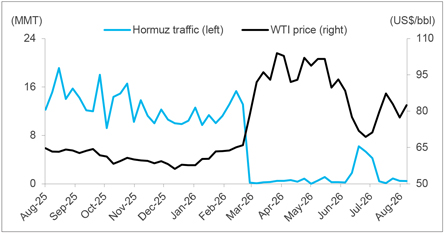
The global economic outlook has shifted since budget, as escalating conflict in the Middle East and disruptions to shipping through the Strait of Hormuz have pushed commodity prices higher and reignited inflationary pressures (Chart 2). Oil prices surged in the second quarter as markets reacted to the supply disruptions, while natural gas prices and several industrial commodity prices also moved higher amid heightened geopolitical uncertainty. This price shock has
compounded existing trade uncertainty and further clouded the global outlook.
The economic consequences of higher energy prices have varied considerably across regions. Many energy-importing economies, including Europe and Japan, face weaker growth prospects as higher energy costs reduce household purchasing power, increase business costs, and weigh on economic activity. Several Middle Eastern countries are also contending with direct disruptions to exports, production, trade, tourism and investment.
In contrast, the U.S. economy continues to show resilience, supported by solid consumer spending, a steady labour market, and ongoing investment
Chart 1: 2026 outlook improves
Forecasted year-over-year growth in selected economic indicators, 2026
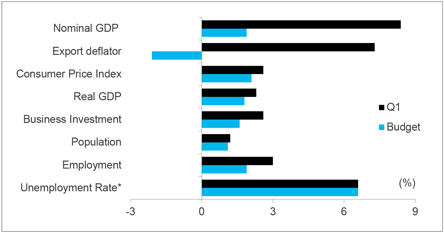
Source: Alberta Treasury Board and Finance, *Unemployment rate is forecasted level
Chart 2: Volatility in oil prices reflects ongoing shipping disruptions
Weekly average WTI prices and cargo volumes through the Strait of Hormuz
Sources: International Monetary Fund, EIA, CME Group, Haver Analytics
| 18 | 2026–27 First Quarter Fiscal Update and Economic Statement | |
| in artificial intelligence (AI)-related industries. China’s outlook remains broadly unchanged, with policy support and investment helping sustain growth, although structural challenges in the property sector continue to weigh on longer-term momentum.
Canada outlook weakens
Canada’s economic outlook has weakened since budget. Growth is expected to slow amid continued labour market softness, slower population growth, muted housing activity, and slower-than-anticipated progress on major projects (Chart 3). Ongoing uncertainty surrounding tariffs and trade negotiations with the U.S. continue to weigh on business investment and economic activity, limiting the pace of economic expansion. |
The weaker growth outlook is expected to limit upward pressure on interest rates. The Bank of Canada is anticipated to keep its policy rate unchanged through 2026 before implementing a small increase in 2027, reflecting modest growth in the Canadian economy. The Canadian dollar is expected to remain relatively weak through the remainder of the year, as softer domestic conditions and a slower pace of interest rate hikes offset support from higher commodity prices. It is forecast to average 72.1 cents per U.S. dollar in 2026-27.
Oil prices higher in the near term
Oil markets have experienced significant volatility in 2026, with prices responding |
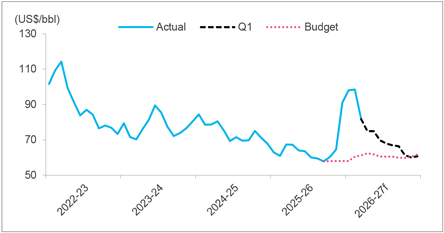
sharply to developments in the Middle East and evolving global supply expectations. West Texas Intermediate (WTI) rose above US$90 per barrel (/bbl) during the first quarter as the conflict escalated and disruptions to shipments through the Strait of Hormuz intensified. Prices have since moderated (Chart 4), briefly falling below US$70/ bbl in July as tensions eased and crude shipments partially recovered before moving above $US80/bbl more recently. Prices are expected to settle lower as the impacts of the conflict on crude flows through the Strait of Hormuz fade and global supply adjusts. The WTI oil price forecast has been revised up to US$73.50/ bbl for 2026-27, US$13.00/bbl higher than Budget 2026. | ||
|
Chart 3: Growth expectations diverge between Canada and Alberta Historical and forecasted annual real GDP growth
Sources: Bank of Canada (BoC), Alberta Treasury Board and Finance; e=expected, f=forecast BoC forecasts are from the July 2026 Monetary Policy Report.
Chart 4: Higher oil prices expected to be temporary Historical and forecast prices of West Texas Intermediate (WTI)
Sources: Reuters, Alberta Treasury Board and Finance; f=forecast |
Alberta’s manufacturing boosted by stronger prices
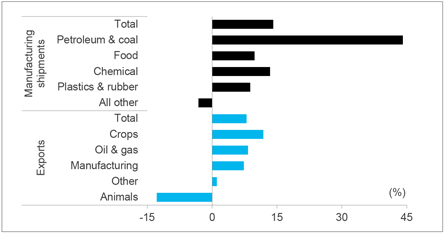
Alberta’s manufacturing sector has strengthened and fully recovered from the weakness in 2025. Higher commodity prices and resilient global demand have supported a surge in manufacturing shipments. Factory sales were up 11 per cent year-to-date through May, driven by petroleum products, petrochemicals, and plastics (Chart 5). Stronger commodity prices have led to an upward revision in manufacturing export prices, which are now forecast to increase 4.0 per cent in 2026. While new U.S. tariffs create additional uncertainty, key Alberta exports remain exempt, limiting the impact on the province. Overall, real manufacturing exports are expected to rebound by 2.4 per cent in 2026, stronger than the 1.8 per cent increase forecast at budget, before strengthening further in 2027.
Trade relief lifts Alberta grains sector
Alberta’s agriculture and food exports are receiving a boost this year, supported by easing trade restrictions, a weaker Canadian dollar, and strong global demand. The sector posted solid growth in the first half of 2026, with export values up 5.6 per cent year-to-date through June. Gains were recorded in both U.S. and non-U.S. markets, particularly China and Mexico, led by large increases in export volumes of canola, barley, and pulse crops.
The improvement in crop exports reflects strong global demand and favourable trade developments that have supported | |||
| 2026–27 First Quarter Fiscal Update and Economic Statement | 19 | |
higher volumes and prices. Reduced Chinese duties on Canadian canola products, record domestic crushing capacity, higher U.S. renewable fuel requirements, and stronger biodiesel demand have all strengthened canola markets. As a result, grain and oilseed exports are expected to increase by 8 per cent in 2026 before moderating in 2027, as yields return closer to average levels, partly due to wet weather challenges in parts of northern Alberta.
The conditions and outlook are less favourable for livestock exports, despite strong market fundamentals. Herd rebuilding efforts continue to limit shipments, with live cattle export volumes down 32.2 per cent in the first five months of the year. Although lower cattle supplies will constrain export volumes in the near term, strong U.S. demand, historically low American inventories, and restrictions on Mexican livestock imports are expected to keep cattle prices elevated. Tight supplies are expected to support export values through 2027 even as volumes remain subdued.
Differential widens
Higher global oil prices continue to support Alberta’s energy sector, although the discount between WTI and Western Canadian Select (WCS) has widened since budget. The WTI-WCS differential increased from approximately US$13/ bbl in January to more than US$15/bbl in June. The wider differential primarily reflects increased competition from
Venezuelan crude and additional heavy oil supply resulting from releases from the U.S. Strategic Petroleum Reserve. While expanded export capacity through the Trans Mountain Expansion (TMX) has reduced the risk of severe transportation bottlenecks and a sharp widening of the differential, higher transportation costs and ongoing dynamics in heavy crude markets are expected to keep the discount wider than previously anticipated. As a result, the WTI-WCS differential is forecast to average US$14.80/bbl in 2026-27, US$1.80/bbl higher than assumed in budget.
Energy sector picks up
Producers are responding to robust global demand and favourable pricing conditions by increasing drilling and production. Oil drilling activity in the province surged in the second quarter, with the number of active rigs up 24 per cent year-over-year in July and nine per cent higher year-to-date. A dry start to the spring and limited wildfire disruptions supported activity, particularly in northeastern Alberta. Oil production also reached seasonal record highs as some planned spring maintenance was deferred to the fall, contributing to a 3.0 per cent increase in year-to-date production.
Investment in the oil and gas extraction sector is forecast to increase by approximately 4.4 per cent ($1.4 billion) in 2026, accelerating from last year’s pace, before strengthening further to 5.0 per cent in 2027. Conventional oil
Chart 5: Higher commodity prices lift export values and manufacturing shipments
Year-to-date percentage change in selected exports and manufacturing shipments by industry, June 2026
Sources: Statistics Canada, Innovation, Science and Economic Development Canada, Haver Analytics
and gas investment is expected to lead growth in 2026, rising 4.5 per cent as shorter production cycles allow operators to respond more quickly to higher oil prices. Oil sands investment is also projected to increase by 4.2 per cent. While oil sands projects are generally less sensitive to short-term price movements, stronger prices have encouraged producers to maximize output and adjust maintenance activities.
Higher production and inventory drawdowns boosted crude oil removals from the province, which were up 2.2 per cent year-to-date through June. Strong export volumes following the Middle East conflict delayed the rebuilding of inventories, leaving them slightly lower than a year earlier in June. Production and related activity are expected to remain elevated through 2027 as inventories are replenished ahead of planned transportation expansions. The Express Pipeline expansion, Enbridge Mainline optimization initiatives, and the TMX drag-reducing agent project are expected to increase export capacity by approximately 270,000 barrels per day over the next two years.
Activity in the natural gas sector has been more subdued, as persistently low North American natural gas prices have led some producers to scale back investment plans. Despite this near-term weakness, the outlook remains positive, with production supported by the start-up of LNG Canada Phase 1 and sustained demand from oil sands operations. Continued development of LNG facilities on Canada’s west coast, which are cost-competitive with U.S. projects due to lower transportation costs to Asian markets, is expected to provide additional momentum for the sector.
Investment stronger than expected
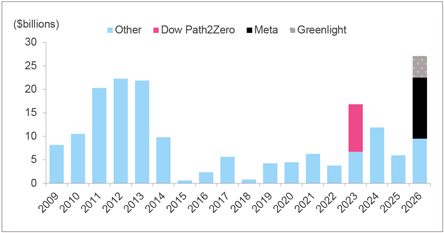
Investment growth is increasingly being driven by major projects outside the resource sector, reflecting stronger-than-expected activity and several major projects moving into construction. Overall, non-residential investment is forecast to expand 7.7 per cent this year, up from the 6.0 per cent projected at budget. The upward revision largely reflects the Meta data centre and Greenlight Electricity Centre, while additional data centre proposals and renewable energy developments continue to support the outlook (Chart 6).
| 20 | 2026–27 First Quarter Fiscal Update and Economic Statement | |
| These developments are helping sustain strong engineering construction activity, a key source of strength for the provincial economy. While machinery and equipment investment remains below the elevated levels recorded during last year’s pre-tariff buying surge, it is expected to strengthen this year, reversing the weakness of the past three years. Growth is being driven by investments in data centres, electricity generation, and the adoption of AI technologies.
Building construction activity has remained robust as major projects continue to advance. Commercial and industrial investment is rising this year, supported by projects such as distribution centres and the Calgary arena. Industrial construction has also benefited from major public infrastructure projects, including ongoing Light Rail Transit (LRT) developments. As a result, commercial and industrial non-residential building investment is up 12 per cent year-to-date.
Outflows of NPRs not as large as expected
The slowdown in Alberta’s population growth resulting from the federal government’s 2025-2027 Immigration Levels Plan has been less severe than initially anticipated. Alberta’s population reached 5.06 million as of April 1, 2026, up 47,000 people, or 0.9 per cent, from a year earlier. While this was the slowest annual growth rate since 2022, it remained positive. Migration from other provinces continued to provide |
support. Net interprovincial migration added 6,006 people in the first quarter, marking the fifteenth consecutive quarter that Alberta led the country in net interprovincial migration gains. Natural increase also remained positive, adding 3,568 people as births exceeded deaths. These outweighed net international migration, which turned negative for the first time since the COVID-19 travel restrictions, due to net outflows of non-permanent residents (NPRs). The province’s NPR population declined by more than 35,000 over the past year, with large declines occurring among work and study permit holders.
Alberta’s population is now forecast to grow 1.2 per cent in the 2026 census year, slightly above the budget forecast of 1.1 per cent, but less than half of the 2.5 per cent increase recorded in 2025. Growth is expected to strengthen modestly to 1.4 per cent in 2027 as NPR outflows ease and gains from interprovincial migration and permanent immigration remain steady.
Residential investment cools with growing inventory
The significant increase in housing supply over the past few years has reshaped Alberta’s housing market. Nearly 15,000 single-family homes were completed in Calgary and Edmonton in 2025, the highest level since the 2006-07 housing boom. The surge in completions has led to a growing inventory of completed but unsold single-family homes, which reached a record 2,628 units in March. |
Rising inventories of newly completed homes have weighed on resale activity, renovations, and overall residential investment.
Spending on renovations to single-family detached homes has seen the largest decline, with 2026 levels falling below the lows reached during the April 2020 COVID-19 shutdowns. While some of the weakness reflects post-pandemic normalization following the renovation boom of 2021 to 2023, growing competition from newly completed housing is also a factor. The increase in inventory has provided households with an alternative to renovating existing properties and contributed to weaker renovation activity.
Builders have also moderated the pace of construction. Although housing starts are expected to reach 42,000 units in 2026, higher than forecast at budget, they are down 19 per cent from last year’s pace. New home construction investment is expected to remain subdued, reflecting both this slowdown and the shift toward smaller multi-family units, which require less investment per unit than single-family detached homes. However, strong multi-family construction activity and the large-scale projects initiated in 2025 will provide some support.
The growing stock of newly constructed homes has also softened Alberta’s resale housing market. Sales have eased from the elevated levels recorded in 2024 and 2025 across most regions as market conditions have become more balanced. While increased housing supply has reduced pressures in the resale market, lower transaction volumes are weighing on residential investment. As a result, residential investment is now forecast to increase by a modest one per cent in 2026 before strengthening in 2027.
Health sector driving employment gains
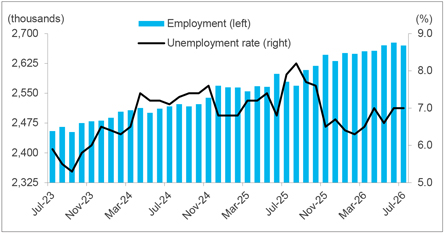
Alberta’s labour market has continued to strengthen this year despite limited support from the goods-producing sector. Employment increased by 39,300 in the first seven months of the year (Chart 7), with gains led by the service sector. Health care and social assistance, along with wholesale and retail trade, accounted for much of the increase. Employment growth in the goods-producing sector was more modest, with most industries showing little net change through the | ||
| Chart 6: Growing momentum in major projects Value of projects over $100 million by year of final investment decision
Sources: Alberta Major Projects, Alberta Treasury Board and Finance | ||||
| 2026–27 First Quarter Fiscal Update and Economic Statement | 21 | |
first half of the year. However, there are signs of improvement, including a recent notable pickup in construction and rising payroll employment in the energy sector. Employment is forecast to grow by 3.0 per cent in 2026, up from 2.8 per cent in 2025, before moderating to 2.2 per cent in 2027 as hiring in the service sector catches up to population growth and gradually eases. Strong job gains are expected to reduce Alberta’s unemployment rate from 7.2 per cent in 2025 to 6.6 per cent in 2026 and 5.9 per cent in 2027, while supporting steady growth in wages and labour income.
Energy prices lift inflation
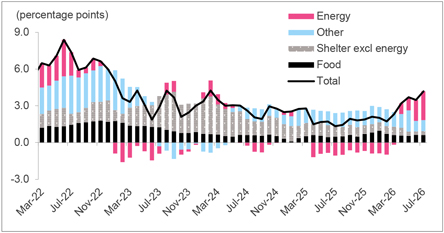
Inflation has risen above budget expectations, largely due to higher energy prices stemming from Middle East-related supply disruptions. Inflation accelerated from 1.8 per cent in February, before the conflict intensified, to as high as 4.2 per cent in July. The increase largely reflects a dramatic turnaround in gasoline prices, which shifted from being a significant drag on inflation in February, following the removal of the federal consumer carbon tax, to a major source of inflationary pressure by May (Chart
8). Food inflation has remained elevated, while rising home and auto insurance premiums continue to contribute to overall price pressures.
As a result, the Consumer Price Index is up 2.9 per cent year-to-date through July, compared with 2.0 per cent in 2025. While these price pressures are expected to moderate over time, consumer inflation is now forecast to average 2.6 per cent in 2026, 0.5 percentage points higher than budget, before easing in 2027 as energy market disruptions subside.
Consumers continue spending
Consumer spending has been stronger than expected in 2026. Retail sales have shown exceptional strength so far this year, rising 7.2 per cent year-to-date through June, while core retail sales rose 5.0 per cent. Although part of this growth reflects higher prices, solid gains in employment and positive consumer confidence suggest that households remain willing and able to spend. Consumer confidence has remained above last year’s level, supported by a resilient labour market, strong wage growth and improving household finances.
Chart 7: Labour market momentum continues in 2026
Seasonally adjusted employment and unemployment rate in Alberta
| Sources: | Statistics Canada and Haver Analytics |
Chart 8: Higher energy prices push up inflation
Contributions to Alberta’s headline consumer inflation
Sources: Statistics Canada, Alberta Treasury Board and Finance calculations
* Energy includes gasoline, natural gas and electricity
| Given the strong performance to date and improving economic conditions, real consumer spending is now expected to grow 2.1 per cent in 2026, with per-capita consumption also improving. However, momentum is expected to remain uneven. Higher energy prices could erode purchasing power, and households are likely to remain cautious. |
| 22 | 2026–27 First Quarter Fiscal Update and Economic Statement | |
Key Energy and Economic Assumptions
| 2026-27 | 2026-27 Fiscal Year | |||||||||||
| Fiscal Year Assumptions |
3 Month Actual | Budget | 1st Quarter | |||||||||
| Prices |
||||||||||||
| Crude Oil Price |
||||||||||||
| WTI (US$/bbl) |
93.00 | 60.50 | 73.50 | |||||||||
| Light-Heavy Differential (US$/bbl) |
14.60 | 13.00 | 14.80 | |||||||||
| WCS @ Hardisty (Cdn$/bbl) |
108.10 | 65.30 | 81.30 | |||||||||
| Natural Gas Price |
||||||||||||
| Alberta Reference Price (Cdn$/GJ) |
1.27 | 3.00 | 2.00 | |||||||||
| Production |
||||||||||||
| Conventional Crude Oil (000s barrels/day) |
561 | 544 | 553 | |||||||||
| Raw Bitumen (000s barrels/day) |
3,461 | 3,691 | 3,674 | |||||||||
| Natural Gas (billions of cubic feet) |
1,111 | 4,440 | 4,578 | |||||||||
| Interest rates |
||||||||||||
| 3-month Canada Treasury Bills (per cent) |
2.30 | 2.10 | 2.20 | |||||||||
| 10-year Canada Bonds (per cent) |
3.50 | 3.20 | 3.40 | |||||||||
| Exchange Rate (US¢/Cdn$) |
72.3 | 73.0 | 72.1 | |||||||||
| 2026 Calendar Year | 2027 Calendar Year | |||||||||||||||
| Calendar Year Assumptions |
Budget | 1st Quarter | Budget | 1st Quarter | ||||||||||||
| Gross Domestic Product |
||||||||||||||||
| Nominal (millions of dollars) |
490,264 | 523,021 | 519,822 | 531,220 | ||||||||||||
| per cent change |
1.9 | 8.4 | 6.0 | 1.6 | ||||||||||||
| Real (millions of 2017 dollars) |
382,742 | 385,510 | 391,379 | 395,253 | ||||||||||||
| per cent change |
1.8 | 2.3 | 2.3 | 2.5 | ||||||||||||
| Other Indicators |
||||||||||||||||
| Employment (thousands) |
2,639 | 2,668 | 2,691 | 2,728 | ||||||||||||
| per cent change |
1.9 | 3.0 | 2.0 | 2.2 | ||||||||||||
| Unemployment Rate (per cent) |
6.6 | 6.6 | 6.0 | 5.9 | ||||||||||||
| Average Weekly Earnings |
2.7 | 2.6 | 2.8 | 2.8 | ||||||||||||
| (per cent change) |
||||||||||||||||
| Primary Household Income |
4.1 | 4.8 | 4.1 | 4.6 | ||||||||||||
| (per cent change) |
||||||||||||||||
| Net Corporate Operating Surplus |
-3.0 | 4.5 | 6.0 | 2.0 | ||||||||||||
| (per cent change) |
||||||||||||||||
| Housing Starts (thousands of units) |
40.0 | 42.0 | 35.0 | 35.0 | ||||||||||||
| Alberta Consumer Price Index |
2.1 | 2.6 | 2.1 | 2.1 | ||||||||||||
| (per cent change) |
||||||||||||||||
| Population (July 1st, thousands) |
5,084 | 5,091 | 5,140 | 5,163 | ||||||||||||
| per cent change |
1.1 | 1.2 | 1.1 | 1.4 | ||||||||||||
| * | Alberta Treasury Board and Finance estimate |
| 2026–27 First Quarter Fiscal Update and Economic Statement | 23 | |